Global Reservoir and Dam (GRanD) database Technical documentation Version 1.1 March 2011 Bernhard Lehner 1 , Catherine Reidy Liermann 2 , Carmen Revenga 3 , Charles Vörösmarty 4 , Balazs Fekete 4 , Philippe Crouzet 5 , Petra Döll 6 , Marcel Endejan 7 , Karen Frenken 8 , Jun Magome 9 , Christer Nilsson 10 , James C. Robertson 3 , Raimund Rödel 11 , Nikolai Sindorf 12 , Dominik Wisser 13 1 Department of Geography, McGill University, Montreal, QC, Canada – [email protected]2 University of Washington, Seattle, WA, USA 3 The Nature Conservancy, Arlington, VA, USA 4 The CUNY Environmental Cross-Roads Initiative, City University of New York, NY, USA 5 European Environment Agency, Copenhagen, Denmark 6 University of Frankfurt, Germany 7 Global Water System Project, Bonn, Germany 8 Food and Agriculture Organization of the United Nations, Rome, Italy 9 University of Yamanashi, Japan 10 Department of Ecology and Environmental Science, Umeå University, Sweden 11 University of Greifswald, Germany 12 Conservation Science Program, World Wildlife Fund, Washington, DC, USA 13 University of New Hampshire, Durham, NH, USA
Transcript
Global Reservoir and Dam (GRanD) database
Technical documentation
Version 1.1
March 2011
Bernhard Lehner1, Catherine Reidy Liermann2, Carmen Revenga3, Charles Vörösmarty4,
Balazs Fekete4, Philippe Crouzet5, Petra Döll6, Marcel Endejan7, Karen Frenken8,
Jun Magome9, Christer Nilsson10, James C. Robertson3, Raimund Rödel11,
Nikolai Sindorf12, Dominik Wisser13
1 Department of Geography, McGill University, Montreal, QC, Canada – [email protected] 2 University of Washington, Seattle, WA, USA 3 The Nature Conservancy, Arlington, VA, USA 4 The CUNY Environmental Cross-Roads Initiative, City University of New York, NY, USA 5 European Environment Agency, Copenhagen, Denmark 6 University of Frankfurt, Germany 7 Global Water System Project, Bonn, Germany 8 Food and Agriculture Organization of the United Nations, Rome, Italy 9 University of Yamanashi, Japan 10 Department of Ecology and Environmental Science, Umeå University, Sweden 11 University of Greifswald, Germany 12 Conservation Science Program, World Wildlife Fund, Washington, DC, USA 13 University of New Hampshire, Durham, NH, USA
GRanD database – Technical documentation – Version 1.1
2
1. Overview and background
Despite established recognition of the many critical environmental and social tradeoffs associated with dams and reservoirs, global data sets describing their characteristics and geographical distribution have been largely incomplete. The most comprehensive global dam database, the World Register of Dams, is compiled by the International Commission on Large Dams (ICOLD) and currently lists more than 33,000 records of large dams and their attributes (ICOLD 1998-2009). However, this inventory is not georeferenced, limiting its utility for many applications. Several researchers and organizations have thus created their own global and regional spatial data sets of dams and reservoirs (see Table 1), mostly by identifying the largest of them on paper maps and compiling attribute information from various sources including national archives and the Internet. These databases vary widely in their number of records, the quality of attribute data, and their spatial resolution, ranging from coarse coordinates to lumped national or regional assignments.
To address these inconsistencies, data gaps and shortcomings, the Global Water System Project (GWSP), a joint project of the Earth System Science Partnership (ESSP), initiated an international effort to collate the existing dam and reservoir data sets with the aim of providing a single, geographically explicit and reliable database for the scientific community: the Global Reservoir and Dam (GRanD) database.
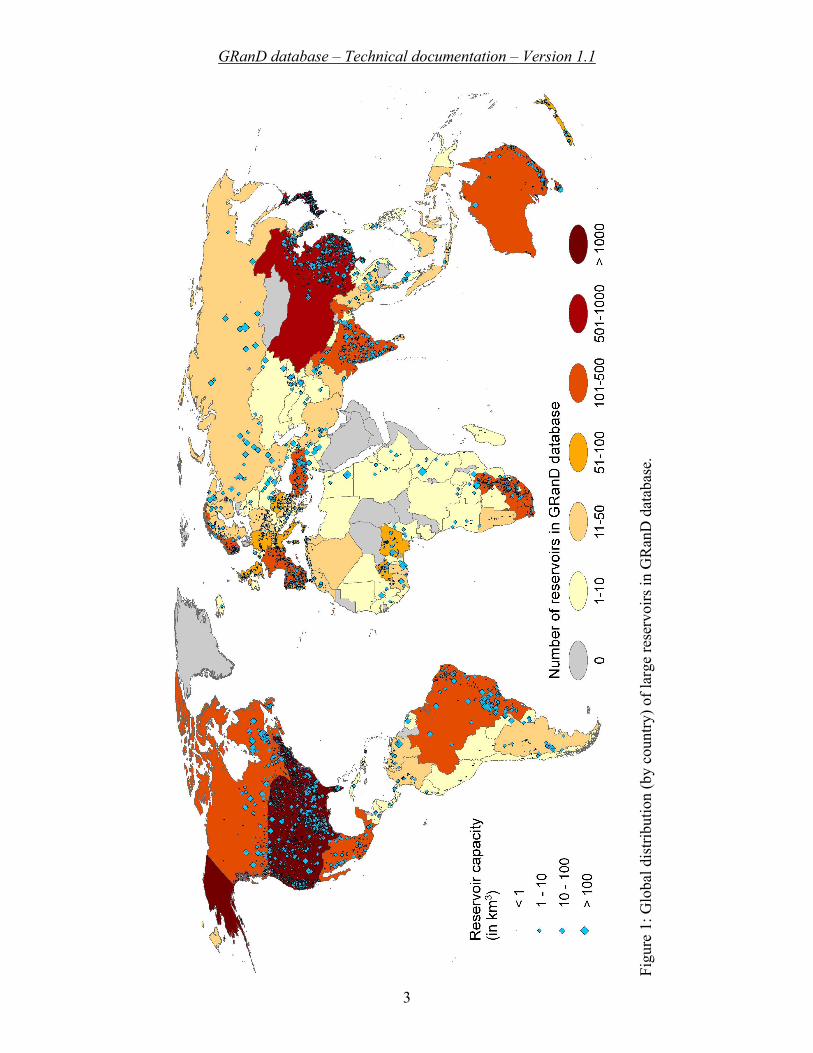
The development of GRanD primarily aimed at compiling the available reservoir and dam information; correcting it through extensive cross-validation, error checking, and identification of duplicate records, attribute conflicts, or mismatches; and completing missing information from new sources or statistical approaches. The dams were geospatially referenced and assigned to polygons depicting reservoir outlines at high spatial resolution. While the main focus was to include all reservoirs with a storage capacity of more than 0.1 km3, many smaller reservoirs were added if data were available. The current version 1.1 of GRanD contains 6,862 records of reservoirs and their associated dams (Figure 1), with a cumulative storage capacity of 6,197 km3.
The development of the GRanD database has been coordinated by the Global Water System Project, Bonn, Germany, and has been executed in partnership and collaboration between members of the following institutes and organizations: Department of Geography, McGill University, Montreal, QC, Canada; The CUNY Environmental Cross-Roads Initiative, City University of New York, NY, USA; University of New Hampshire, Durham, NH, USA; University of Washington, Seattle, WA, USA; The Nature Conservancy, Arlington, VA, USA; Conservation Science Program, World Wildlife Fund, Washington, DC, USA; European Environment Agency, Copenhagen, Denmark; Food and Agriculture Organization of the United Nations, Rome, Italy; University of Yamanashi, Japan; University of Greifswald, Germany; University of Frankfurt, Germany; and Department of Ecology and Environmental Science, Umeå University, Sweden.
The GRanD database is freely available for non-commercial use. For data download and additional information please visit
http://www.gwsp.org/85.html (Digital Water Atlas at GWSP) or
http://sedac.ciesin.columbia.edu/pfs/grand.html (SEDAC at CIESIN).
GRanD database – Technical documentation – Version 1.1
3
Figu
re 1
: Glo
bal d
istri
butio
n (b
y co
untry
) of l
arge
rese
rvoi
rs in
GR
anD
dat
abas
e.
GRanD database – Technical documentation – Version 1.1
4
2. Database development
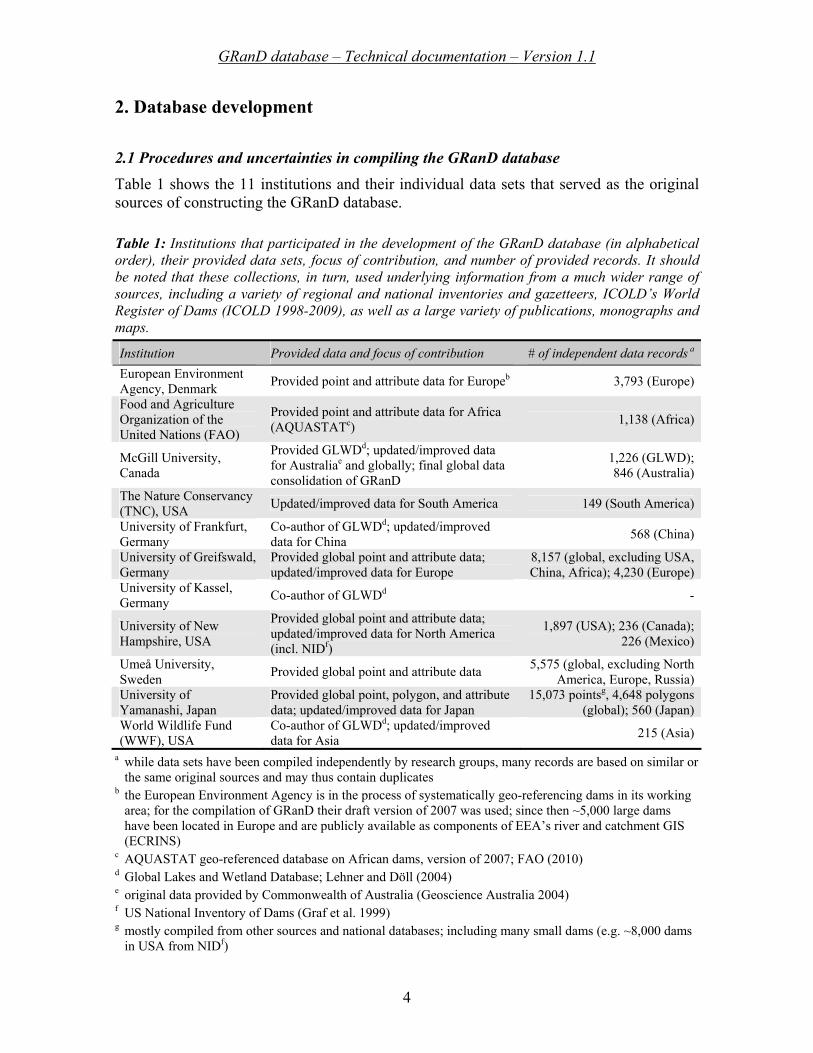
2.1 Procedures and uncertainties in compiling the GRanD database Table 1 shows the 11 institutions and their individual data sets that served as the original sources of constructing the GRanD database. Table 1: Institutions that participated in the development of the GRanD database (in alphabetical order), their provided data sets, focus of contribution, and number of provided records. It should be noted that these collections, in turn, used underlying information from a much wider range of sources, including a variety of regional and national inventories and gazetteers, ICOLD’s World Register of Dams (ICOLD 1998-2009), as well as a large variety of publications, monographs and maps.
Institution Provided data and focus of contribution # of independent data records a European Environment Agency, Denmark Provided point and attribute data for Europeb 3,793 (Europe)
Food and Agriculture Organization of the United Nations (FAO)
Provided point and attribute data for Africa (AQUASTATc) 1,138 (Africa)
McGill University, Canada
Provided GLWDd; updated/improved data for Australiae and globally; final global data consolidation of GRanD
1,226 (GLWD); 846 (Australia)
The Nature Conservancy (TNC), USA Updated/improved data for South America 149 (South America)
University of Frankfurt, Germany
Co-author of GLWDd; updated/improved data for China 568 (China)
University of Greifswald, Germany
Provided global point and attribute data; updated/improved data for Europe
8,157 (global, excluding USA, China, Africa); 4,230 (Europe)
University of Kassel, Germany Co-author of GLWDd -
University of New Hampshire, USA
Provided global point and attribute data; updated/improved data for North America (incl. NIDf)
1,897 (USA); 236 (Canada); 226 (Mexico)
Umeå University, Sweden Provided global point and attribute data 5,575 (global, excluding North
America, Europe, Russia) University of Yamanashi, Japan
Provided global point, polygon, and attribute data; updated/improved data for Japan
Co-author of GLWDd; updated/improved data for Asia 215 (Asia)
a while data sets have been compiled independently by research groups, many records are based on similar or the same original sources and may thus contain duplicates
b the European Environment Agency is in the process of systematically geo-referencing dams in its working area; for the compilation of GRanD their draft version of 2007 was used; since then ~5,000 large dams have been located in Europe and are publicly available as components of EEA’s river and catchment GIS (ECRINS)
c AQUASTAT geo-referenced database on African dams, version of 2007; FAO (2010) d Global Lakes and Wetland Database; Lehner and Döll (2004) e original data provided by Commonwealth of Australia (Geoscience Australia 2004) f US National Inventory of Dams (Graf et al. 1999) g mostly compiled from other sources and national databases; including many small dams (e.g. ~8,000 dams
in USA from NIDf)
GRanD database – Technical documentation – Version 1.1
5
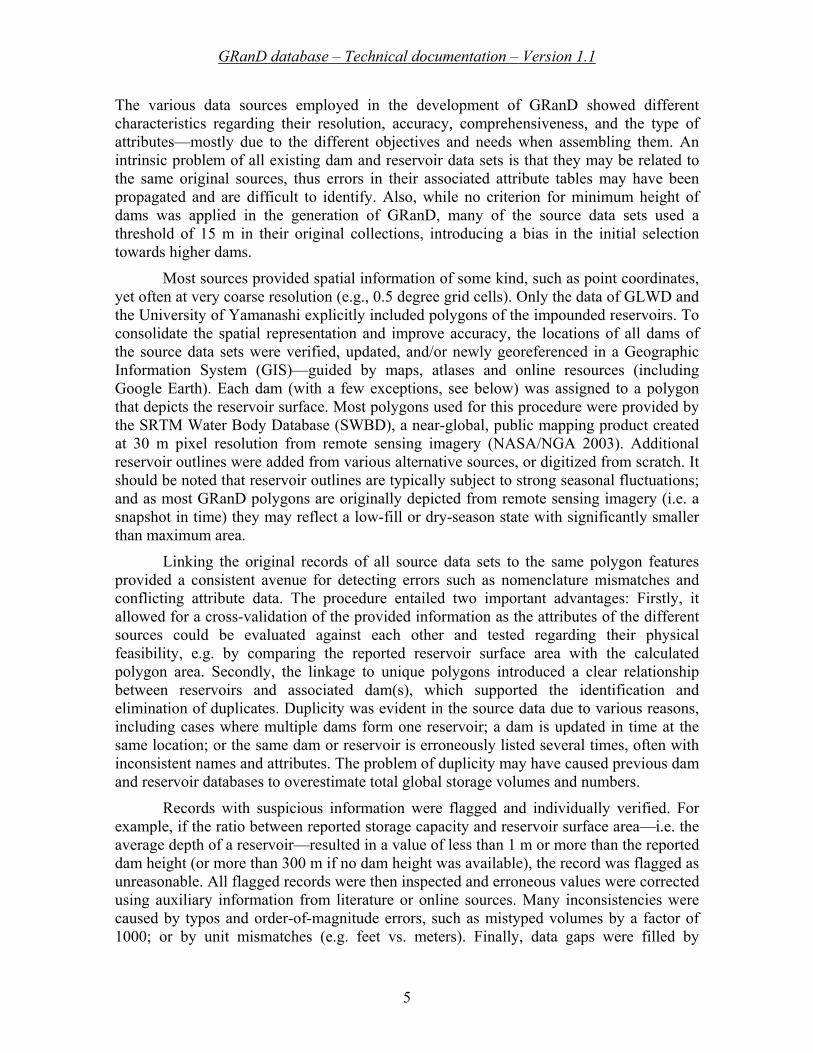
The various data sources employed in the development of GRanD showed different characteristics regarding their resolution, accuracy, comprehensiveness, and the type of attributes—mostly due to the different objectives and needs when assembling them. An intrinsic problem of all existing dam and reservoir data sets is that they may be related to the same original sources, thus errors in their associated attribute tables may have been propagated and are difficult to identify. Also, while no criterion for minimum height of dams was applied in the generation of GRanD, many of the source data sets used a threshold of 15 m in their original collections, introducing a bias in the initial selection towards higher dams.
Most sources provided spatial information of some kind, such as point coordinates, yet often at very coarse resolution (e.g., 0.5 degree grid cells). Only the data of GLWD and the University of Yamanashi explicitly included polygons of the impounded reservoirs. To consolidate the spatial representation and improve accuracy, the locations of all dams of the source data sets were verified, updated, and/or newly georeferenced in a Geographic Information System (GIS)—guided by maps, atlases and online resources (including Google Earth). Each dam (with a few exceptions, see below) was assigned to a polygon that depicts the reservoir surface. Most polygons used for this procedure were provided by the SRTM Water Body Database (SWBD), a near-global, public mapping product created at 30 m pixel resolution from remote sensing imagery (NASA/NGA 2003). Additional reservoir outlines were added from various alternative sources, or digitized from scratch. It should be noted that reservoir outlines are typically subject to strong seasonal fluctuations; and as most GRanD polygons are originally depicted from remote sensing imagery (i.e. a snapshot in time) they may reflect a low-fill or dry-season state with significantly smaller than maximum area.
Linking the original records of all source data sets to the same polygon features provided a consistent avenue for detecting errors such as nomenclature mismatches and conflicting attribute data. The procedure entailed two important advantages: Firstly, it allowed for a cross-validation of the provided information as the attributes of the different sources could be evaluated against each other and tested regarding their physical feasibility, e.g. by comparing the reported reservoir surface area with the calculated polygon area. Secondly, the linkage to unique polygons introduced a clear relationship between reservoirs and associated dam(s), which supported the identification and elimination of duplicates. Duplicity was evident in the source data due to various reasons, including cases where multiple dams form one reservoir; a dam is updated in time at the same location; or the same dam or reservoir is erroneously listed several times, often with inconsistent names and attributes. The problem of duplicity may have caused previous dam and reservoir databases to overestimate total global storage volumes and numbers.
Records with suspicious information were flagged and individually verified. For example, if the ratio between reported storage capacity and reservoir surface area—i.e. the average depth of a reservoir—resulted in a value of less than 1 m or more than the reported dam height (or more than 300 m if no dam height was available), the record was flagged as unreasonable. All flagged records were then inspected and erroneous values were corrected using auxiliary information from literature or online sources. Many inconsistencies were caused by typos and order-of-magnitude errors, such as mistyped volumes by a factor of 1000; or by unit mismatches (e.g. feet vs. meters). Finally, data gaps were filled by
GRanD database – Technical documentation – Version 1.1
6
comparing and merging attributes from different databases, by consulting and adding independent sources of information, or by applying statistical approaches (see section 2.2 below). If inconsistencies, uncertainties, or data gaps remained, the ‘Quality’ index of the record was lowered accordingly (see attribute list in section 3.2).
Not all data sources provide a clear distinction on whether their attribute data refer strictly to a physical ‘dam’ or to the impounded ‘reservoir’ behind it, or both. For example, original data on ‘volume’ may refer to either a dam wall (i.e. concrete or other building material per se) or the reservoir’s storage capacity. Also, in many cases the dam name is different from the reservoir name, such as Lake Mead, the largest reservoir of the US, being impounded by the Hoover Dam. Another uncertainty is caused by the lack of one-to-one relationships between dams and reservoirs: some dams, such as those of run-of-the-river hydropower stations, may not form reservoirs; some impoundments may have multiple dams (e.g. main and saddle dams); and some reservoirs have no dams at all, such as water stored in natural or artificial depressions. These ambiguities compound the importance of knowing to which object data refer. To ensure maximum clarity, GRanD explicitly distinguishes between dam (point) and reservoir (polygon) information.
Each record in GRanD—as identified by a unique ID—typically represents a combined ‘reservoir-and-dam object’ and is defined by both a polygon and a point location (see also section 3.1 on data formats). The point represents the location of the ‘main’ dam; if there are multiple dams forming a single reservoir, these are defined in the attribute table of that same record. Objects can also be defined by a point only; this may indicate a missing polygon, or an independent dam without a reservoir, such as a run-of-the-river hydropower station. In order to identify a reservoir’s ‘main’ dam, SWBD polygons were combined with HydroSHEDS, a near-global digital river network (Lehner et al. 2008). Using HydroSHEDS at a grid resolution of 15 arc-seconds (~500 m), the main dam—or equivalently the reservoir outlet—was defined as the pixel with the highest flow accumulation within each polygon.
The linkage of GRanD with the multiple information layers of the HydroSHEDS database also allowed for the derivation of additional attributes, in particular elevation, catchment area, and long-term average discharge. Elevation values were derived from the digital elevation model (DEM) of HydroSHEDS at the point location of each dam. The discharge values provided by HydroSHEDS are based on runoff estimates from the global water balance model WaterGAP (Alcamo et al. 2003; Döll et al. 2003) for the time series 1961-1990. Visual inspections showed very good spatial correspondence between GRanD and HydroSHEDS. This is mostly due to the circumstance that both SWBD (i.e. the main source of GRanD polygons) and HydroSHEDS are generated from the same baseline data, namely the digital elevation model of the Shuttle Radar Topography Mission (SRTM; Farr and Kobrik 2000).
While the main focus in the development of GRanD was to include all reservoirs with a storage capacity of more than 0.1 km3, many smaller reservoirs were added if data were available. In instances where natural lakes are regulated by dams, such as Africa’s Lake Victoria, only the added storage volume was considered. Finally, some dams were included due to their importance, such as India’s Farakka Barrage which diverts water from the Ganges River, even if they don’t create a traditional reservoir.
GRanD database – Technical documentation – Version 1.1
7
2.2 Estimating missing reservoir volumes In the course of constructing GRanD, two equations were derived and applied in order to complete missing reservoir volumes:
V = 0.678 (A·h)0.9229 (Eq. 1)
V = 30.684 A0.9578 (Eq. 2)
where V = reservoir volume in 106 m3; A = reservoir area in km2; and h = dam height in m. Equation 1 was used to estimate missing reservoir volumes if both area and dam height were available (R2 = 0.92); Equation 2 was used if only the reservoir area was available (R2 = 0.80). Both equations were determined by a statistical regression analysis of 5,824 reservoirs of the GRanD database which were selected based on the completeness and reliability of their data. For this selection, the following records were excluded from the total of 6,862 GRanD records:
• records without polygon • records without reported dam height • records without reported capacity • records flagged as “planned”, “under construction”, or “destroyed” • records with “poor” or “unreliable” data quality • records flagged as lake control dams
Note that Equations 1 and 2 are derived by relating reported capacities to measured polygon areas. As the polygons in many cases depict a status below full capacity, the equations may not be appropriate to estimate capacities from maximum reported areas.
3. Data specifications
3.1 File and data formats
GRanD consists of two separate GIS layers:
• ‘GRanD_dams_v1_1’ is a point layer containing all dams and their attribute information
• ‘GRanD_reservoirs_v1_1’ is a polygon layer containing all corresponding reservoir outlines and their areas
Each dam point lies within its corresponding reservoir polygon, thus the features and attributes of both layers can be spatially joined based on their location. Additionally, both attribute tables carry the same unique identification number (column ‘Grand_id’) which enables a spreadsheet join. Version 1.1 of GranD contains 6,862 dam points and 6,824 reservoir polygons (38 dams do not have an associated reservoir, incl. some diversion barrages and planned dams).
Both the point and polygon layer are provided in ESRI shapefile format. Each shapefile consists of five core files (.dbf, .sbn, .sbx, .shp, .shx). Basic metadata information is provided in an accompanying file in XML format (.shp.xml). Projection information is provided in an ASCII text file (.prj); both shapefiles are in geographic (latitude/longitude) projection, referenced to datum WGS84.
GRanD database – Technical documentation – Version 1.1
8
NOTE: Users without GIS software or without the option to interpret shapefiles can import the file ‘GRanD_dams_v1_1.dbf’ in most spreadsheet programs. This file contains all GRanD attribute information, and the dam locations can be plotted using the coordinates.
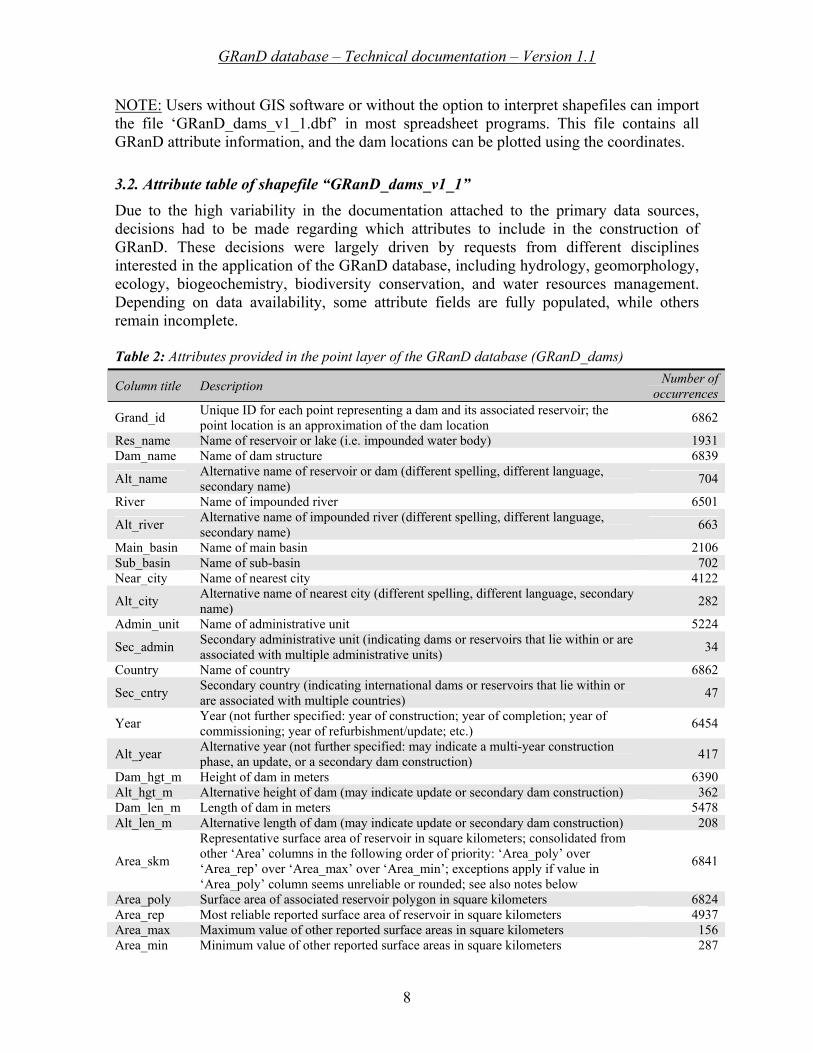
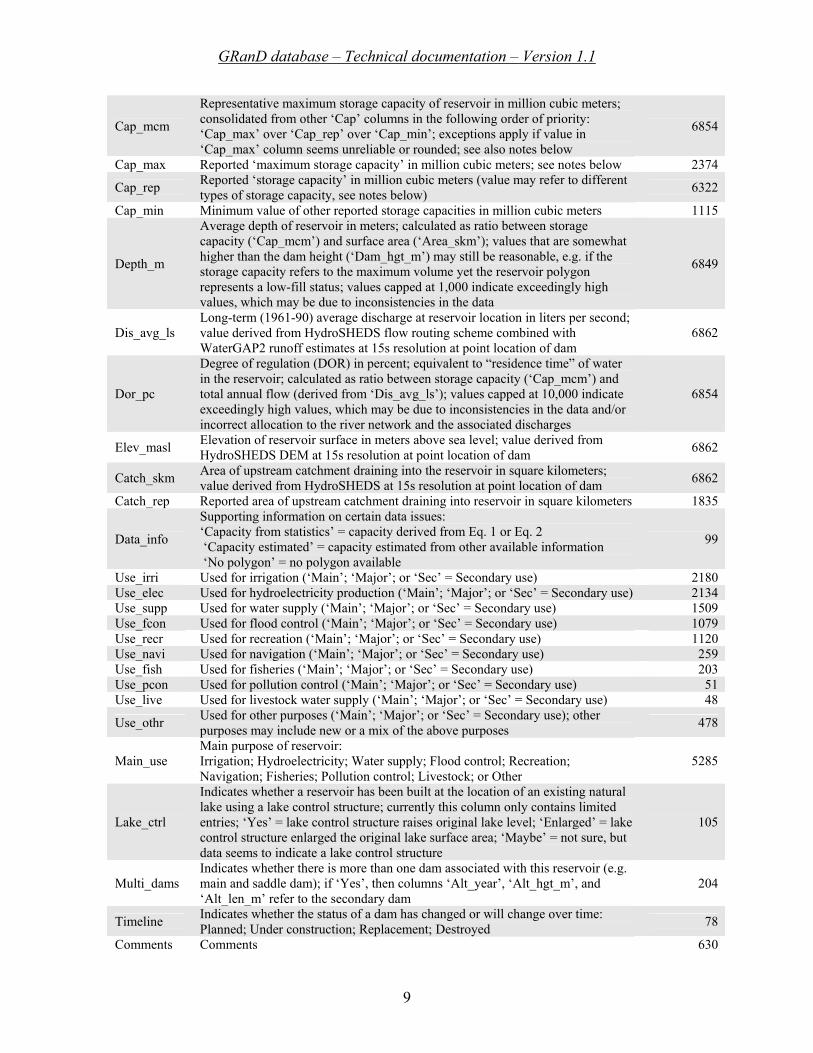
3.2. Attribute table of shapefile “GRanD_dams_v1_1” Due to the high variability in the documentation attached to the primary data sources, decisions had to be made regarding which attributes to include in the construction of GRanD. These decisions were largely driven by requests from different disciplines interested in the application of the GRanD database, including hydrology, geomorphology, ecology, biogeochemistry, biodiversity conservation, and water resources management. Depending on data availability, some attribute fields are fully populated, while others remain incomplete. Table 2: Attributes provided in the point layer of the GRanD database (GRanD_dams)
Column title Description Number of occurrences
Grand_id Unique ID for each point representing a dam and its associated reservoir; the point location is an approximation of the dam location 6862
Res_name Name of reservoir or lake (i.e. impounded water body) 1931 Dam_name Name of dam structure 6839
Alt_name Alternative name of reservoir or dam (different spelling, different language, secondary name) 704
River Name of impounded river 6501
Alt_river Alternative name of impounded river (different spelling, different language, secondary name) 663
Main_basin Name of main basin 2106 Sub_basin Name of sub-basin 702 Near_city Name of nearest city 4122
Alt_city Alternative name of nearest city (different spelling, different language, secondary name) 282
Admin_unit Name of administrative unit 5224
Sec_admin Secondary administrative unit (indicating dams or reservoirs that lie within or are associated with multiple administrative units) 34
Country Name of country 6862
Sec_cntry Secondary country (indicating international dams or reservoirs that lie within or are associated with multiple countries) 47
Year Year (not further specified: year of construction; year of completion; year of commissioning; year of refurbishment/update; etc.) 6454
Alt_year Alternative year (not further specified: may indicate a multi-year construction phase, an update, or a secondary dam construction) 417
Dam_hgt_m Height of dam in meters 6390 Alt_hgt_m Alternative height of dam (may indicate update or secondary dam construction) 362 Dam_len_m Length of dam in meters 5478 Alt_len_m Alternative length of dam (may indicate update or secondary dam construction) 208
Area_skm
Representative surface area of reservoir in square kilometers; consolidated from other ‘Area’ columns in the following order of priority: ‘Area_poly’ over ‘Area_rep’ over ‘Area_max’ over ‘Area_min’; exceptions apply if value in ‘Area_poly’ column seems unreliable or rounded; see also notes below
6841
Area_poly Surface area of associated reservoir polygon in square kilometers 6824 Area_rep Most reliable reported surface area of reservoir in square kilometers 4937 Area_max Maximum value of other reported surface areas in square kilometers 156 Area_min Minimum value of other reported surface areas in square kilometers 287
GRanD database – Technical documentation – Version 1.1
9
Cap_mcm
Representative maximum storage capacity of reservoir in million cubic meters; consolidated from other ‘Cap’ columns in the following order of priority: ‘Cap_max’ over ‘Cap_rep’ over ‘Cap_min’; exceptions apply if value in ‘Cap_max’ column seems unreliable or rounded; see also notes below
6854
Cap_max Reported ‘maximum storage capacity’ in million cubic meters; see notes below 2374
Cap_rep Reported ‘storage capacity’ in million cubic meters (value may refer to different types of storage capacity, see notes below) 6322
Cap_min Minimum value of other reported storage capacities in million cubic meters 1115
Depth_m
Average depth of reservoir in meters; calculated as ratio between storage capacity (‘Cap_mcm’) and surface area (‘Area_skm’); values that are somewhat higher than the dam height (‘Dam_hgt_m’) may still be reasonable, e.g. if the storage capacity refers to the maximum volume yet the reservoir polygon represents a low-fill status; values capped at 1,000 indicate exceedingly high values, which may be due to inconsistencies in the data
6849
Dis_avg_ls Long-term (1961-90) average discharge at reservoir location in liters per second; value derived from HydroSHEDS flow routing scheme combined with WaterGAP2 runoff estimates at 15s resolution at point location of dam
6862
Dor_pc
Degree of regulation (DOR) in percent; equivalent to “residence time” of water in the reservoir; calculated as ratio between storage capacity (‘Cap_mcm’) and total annual flow (derived from ‘Dis_avg_ls’); values capped at 10,000 indicate exceedingly high values, which may be due to inconsistencies in the data and/or incorrect allocation to the river network and the associated discharges
6854
Elev_masl Elevation of reservoir surface in meters above sea level; value derived from HydroSHEDS DEM at 15s resolution at point location of dam 6862
Catch_skm Area of upstream catchment draining into the reservoir in square kilometers; value derived from HydroSHEDS at 15s resolution at point location of dam 6862
Catch_rep Reported area of upstream catchment draining into reservoir in square kilometers 1835
Data_info
Supporting information on certain data issues: ‘Capacity from statistics’ = capacity derived from Eq. 1 or Eq. 2 ‘Capacity estimated’ = capacity estimated from other available information ‘No polygon’ = no polygon available
99
Use_irri Used for irrigation (‘Main’; ‘Major’; or ‘Sec’ = Secondary use) 2180 Use_elec Used for hydroelectricity production (‘Main’; ‘Major’; or ‘Sec’ = Secondary use) 2134 Use_supp Used for water supply (‘Main’; ‘Major’; or ‘Sec’ = Secondary use) 1509 Use_fcon Used for flood control (‘Main’; ‘Major’; or ‘Sec’ = Secondary use) 1079 Use_recr Used for recreation (‘Main’; ‘Major’; or ‘Sec’ = Secondary use) 1120 Use_navi Used for navigation (‘Main’; ‘Major’; or ‘Sec’ = Secondary use) 259 Use_fish Used for fisheries (‘Main’; ‘Major’; or ‘Sec’ = Secondary use) 203 Use_pcon Used for pollution control (‘Main’; ‘Major’; or ‘Sec’ = Secondary use) 51 Use_live Used for livestock water supply (‘Main’; ‘Major’; or ‘Sec’ = Secondary use) 48
Use_othr Used for other purposes (‘Main’; ‘Major’; or ‘Sec’ = Secondary use); other purposes may include new or a mix of the above purposes 478
Main_use Main purpose of reservoir: Irrigation; Hydroelectricity; Water supply; Flood control; Recreation; Navigation; Fisheries; Pollution control; Livestock; or Other
5285
Lake_ctrl
Indicates whether a reservoir has been built at the location of an existing natural lake using a lake control structure; currently this column only contains limited entries; ‘Yes’ = lake control structure raises original lake level; ‘Enlarged’ = lake control structure enlarged the original lake surface area; ‘Maybe’ = not sure, but data seems to indicate a lake control structure
105
Multi_dams Indicates whether there is more than one dam associated with this reservoir (e.g. main and saddle dam); if ‘Yes’, then columns ‘Alt_year’, ‘Alt_hgt_m’, and ‘Alt_len_m’ refer to the secondary dam
204
Timeline Indicates whether the status of a dam has changed or will change over time: Planned; Under construction; Replacement; Destroyed 78
Comments Comments 630
GRanD database – Technical documentation – Version 1.1
10
Url URL of related website 1595
Quality
Quality index: 1: Verified (location and data have been verified) 2: Good (location and data seem o.k. but have not all been verified) 3: Fair (some data discrepancies; missing data; or uncertainties) 4: Poor (significant data discrepancies of various kinds that indicate errors) 5: Unreliable (severe data discrepancies without reasonable explanation)
6862
Editor Final data editor: ‘McGill’ = McGill University; ‘UNH’ = University of New Hampshire 6862
Long_dd Longitude of point location of dam in decimal degrees 6862 Lat_dd Latitude of point location of dam in decimal degrees 6862 Notes:
• The columns ‘Area_skm’ and ‘Cap_mcm’ have been created to provide a “most representative” estimate of reservoir surface area and maximum capacity. The values were derived from other columns following the rules as indicated in Table 2. It should be noted, however, that the source values may not correctly refer to “maximum”, “normal”, or “minimum” conditions as this distinction was often not available in the original sources (see also next note).
• In most original data sources, no distinction was made between “maximum capacity”, “gross capacity”, “normal capacity”, “live capacity”, or “minimum capacity”; or the distinction was not reliable. If an explicit, reliable distinction was available, the values were entered as ‘Cap_max’ (for maximum or gross capacity), ‘Cap_rep’ (for normal capacity) and ‘Cap_min’ (for live or minimum capacity). If no distinction was available and only one value was provided, it was entered as ‘Cap_rep’. If no distinction was available and two values were provided, the most reasonable one was entered as ‘Cap_rep’, and the other one as ‘Cap_max’ or ‘Cap_min’ according to its size. If no distinction was available and more than two values were provided, they were sorted into ‘Cap_max’, ‘Cap_rep’, and ‘Cap_min’ according to their size. For all records of the Unites States, ‘Cap_max’ explicitly refers to “maximum capacity” and ‘Cap_rep’ explicitly refers to “normal capacity”.
• Regarding the use/purpose of a reservoir: ‘Main’ refers to the primary purpose; ‘Major’ refers to a primary/important purpose, yet not the main one (note that the distinction between ‘Main’ and ‘Major’ may be arbitrary in some cases); ‘Sec’ refers to a secondary purpose.
• Missing numerical records are flagged with value “-99” 3.3 Attribute table of shapefile “GRanD_reservoirs_v1_1” Table 3: Attributes provided in the polygon layer of the GRanD database (GRanD_reservoirs)
Column title Description Number of occurrences
Grand_id Unique ID for each polygon representing a reservoir; corresponds to ‘Grand_id’ of point table 6824
Area_skm Surface area of polygon in square kilometers 6824
Poly_src
Original source of reservoir polygon: ‘SWBD’ = SRTM Water Body Database (NASA/NGA 2003) ‘GLWD’ = Global Lakes and Wetlands Database (Lehner and Döll 2004) ‘McGill’ = polygon modified or digitized from scratch by McGill University ‘UY’ = polygon provided by University of Yamanashi
6824
GRanD database – Technical documentation – Version 1.1
11
4. Acknowledgement, citation, disclaimer, and restrictions
4.1 Acknowledgement The authors would like to thank the International Project Office of the Global Water System Project for coordinating and facilitating the development of GRanD through several international workshops, and the German Federal Ministry of Education and Research (BMBF) for their financial support.
4.2 Copyright and required attribution The following copyright statement must be displayed with, attached to or embodied (in a reasonable manner) in the documentation or metadata of products that are utilizing GRanD materials:
4.3 Citation We kindly ask users to cite GRanD in any published material produced using this data. Scientific references should be made as follows:
Lehner, B., Reidy Liermann, C., Revenga, C., Vörösmarty, C., Fekete, B., Crouzet, P., Döll, P., Endejan, M., Frenken, K., Magome, J., Nilsson, C., Robertson, J., Rödel, R., Sindorf, N., Wisser, D. (in press): High resolution mapping of the world’s reservoirs and dams for sustainable river flow management. Frontiers in Ecology and the Environment.
Please note that this manuscript is currently in press; we expect publication within 2011 and will update the reference as soon as it is available.
If possible, please also provide online links to one of the GRanD websites at http://www.gwsp.org/85.html (Digital Water Atlas at GWSP), or http://sedac.ciesin.columbia.edu/pfs/grand.html (SEDAC at CIESIN).
4.4 Disclaimer of warranty The GRanD database and any related materials contained therein are provided “as is,” without warranty of any kind, either express or implied, including, but not limited to, the implied warranties of merchantability, fitness for a particular purpose, noninterference, system integration, or noninfringement. The entire risk of use of the data shall be with the user. The user expressly acknowledges that the data may contain some nonconformities, defects, or errors. The authors do not warrant that the data will meet the user's needs or expectations, that the use of the data will be uninterrupted, or that all nonconformities, defects, or errors can or will be corrected. The authors are not inviting reliance on these data, and the user should always verify actual data.
GRanD database – Technical documentation – Version 1.1
12
4.5 Limitation of liability In no event shall the authors be liable for costs of procurement of substitute goods or services, lost profits, lost sales or business expenditures, investments, or commitments in connection with any business, loss of any goodwill, or for any direct, indirect, special, incidental, exemplary, or consequential damages arising out of the use of the GRanD database and any related materials, however caused, on any theory of liability, and whether or not the authors have been advised of the possibility of such damage. These limitations shall apply notwithstanding any failure of essential purpose of any exclusive remedy.
4.6 Redistribution restrictions Users shall not reproduce, convert, (re)publish, (re)distribute, (re)broadcast, (re)transmit, sell, rent, lease, sublicense, lend, assign, time-share, or transfer, in whole or in part, or provide unlicensed third parties access to the data and related materials without explicit written permission from the authors. Any modification of the original data by users must be noted. The authors of GRanD may request reprints of publications and copies of derived materials. Application of GRanD is not permitted for commercial purposes unless a license agreement is reached with the authors.
5. References Alcamo J, Döll P, Henrichs T, et al. 2003. Development and testing of the WaterGAP 2 global
model of water use and availability. Hydrological Sciences Journal 48: 317–337.
Döll P, Kaspar F, and Lehner B. 2003. A global hydrological model for deriving water availability indicators: model tuning and validation. Journal of Hydrology 270: 105–134.
FAO (Food and Agriculture Organization of the United Nations). 2010. AQUASTAT Geo-referenced database on African dams. Available online at www.fao.org/nr/water/aquastat/damsafrica/index.stm.
Farr TG and Kobrick M. 2000. Shuttle Radar Topography Mission produces a wealth of data. Eos 81: 583–585.
Geoscience Australia. 2004. Dams and water storages 1990. Australian Government, Commonwealth of Australia. Available online at www.ga.gov.au.
Graf WL. 1999. Dam nation: a geographic census of American dams and their large-scale hydrologic impacts. Water Resources Research 35: 1305–1311.
ICOLD (International Commission on Large Dams). 1998–2009. World Register of Dams. Version updates 1998-2009. Paris: ICOLD. Available online at www.icold-cigb.net.
Lehner B and Döll P. 2004. Development and validation of a global database of lakes, reservoirs and wetlands. Journal of Hydrology 296: 1–22.
Lehner B, Verdin K, and Jarvis A. 2008. New global hydrography derived from spaceborne elevation data. Eos 89: 93–94.
NASA/NGA. 2003. SRTM Water Body Data Product Specific Guidance, Version 2.0. Available at http://dds.cr.usgs.gov/srtm/version2_1/SWBD/SWBD_Documentation/