71
Global Road Safety and Road Safety in India
| Date post: | 18-Feb-2018 |
| Category: |
Documents |
| Upload: | duongquynh |
| View: | 218 times |
| Download: | 0 times |
Global Road Safety and Road Safety in India
PRESENTATION OUTLINE
Global Road Safety Scenario
Road Safety Scenario- India
Characteristics of Accidents in India
Measures to reduce the accidents - Globally
Measures to reduce the accidents -India
Conclusions

WORLD ROAD SAFETY SCENARIO

WORLD ROAD SAFETY SCENARIO

WORLD ROAD SAFETY SCENARIO
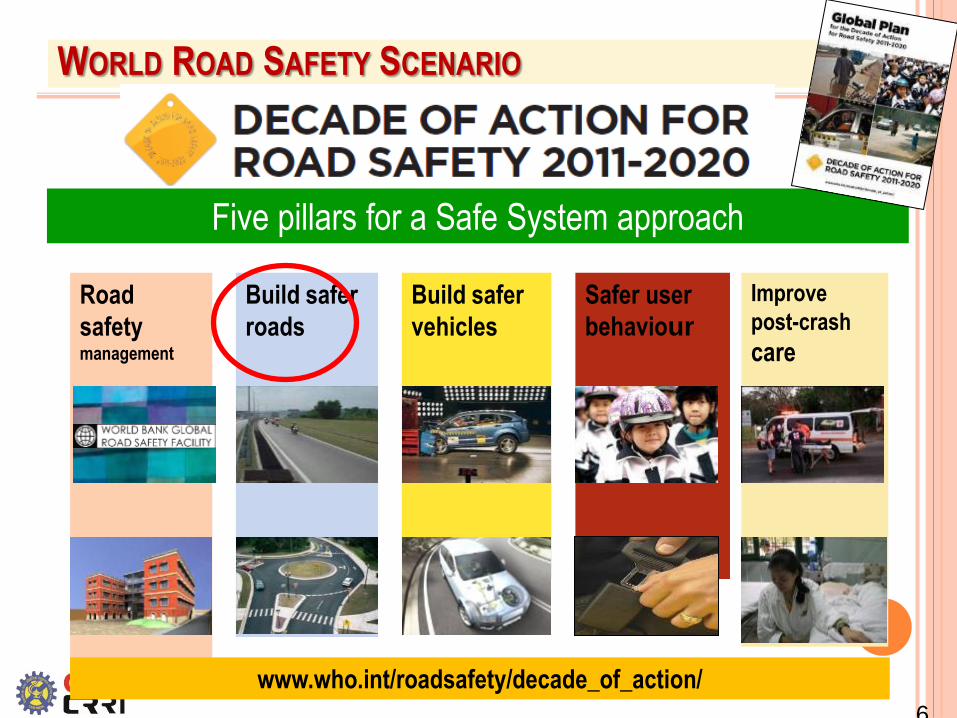
UN GA resolution 54/255 in 2010 called for a Decade of Action for Road Safety (2011 -2020).
I call on Member States, International Agencies, Civil Society organizations,
Business and Community leaders to ensure that the Decade leads to real
improvements. As a Step in this direction , governments should release their
national plans for the Decade when it is launched globally on 11th May 2011 –
Mr.Ban Ki-moom , UN Secretaray General António Guterres of Portugal
WORLD ROAD SAFETY SCENARIO
6
Five pillars for a Safe System approach
Road
safety management
Safer user
behaviour
Build safer
roads
Build safer
vehicles
Improve
post-crash
care
www.who.int/roadsafety/decade_of_action/

WORLD ROAD SAFETY SCENARIO - ROAD TRAFFIC DEATHS (2007-2013)
The plateau in road
traffic deaths, set
against a 4%
increase in global
population and
16% increase in
motorization,
suggests that road
safety efforts over
the past 3 years
have saved lives.
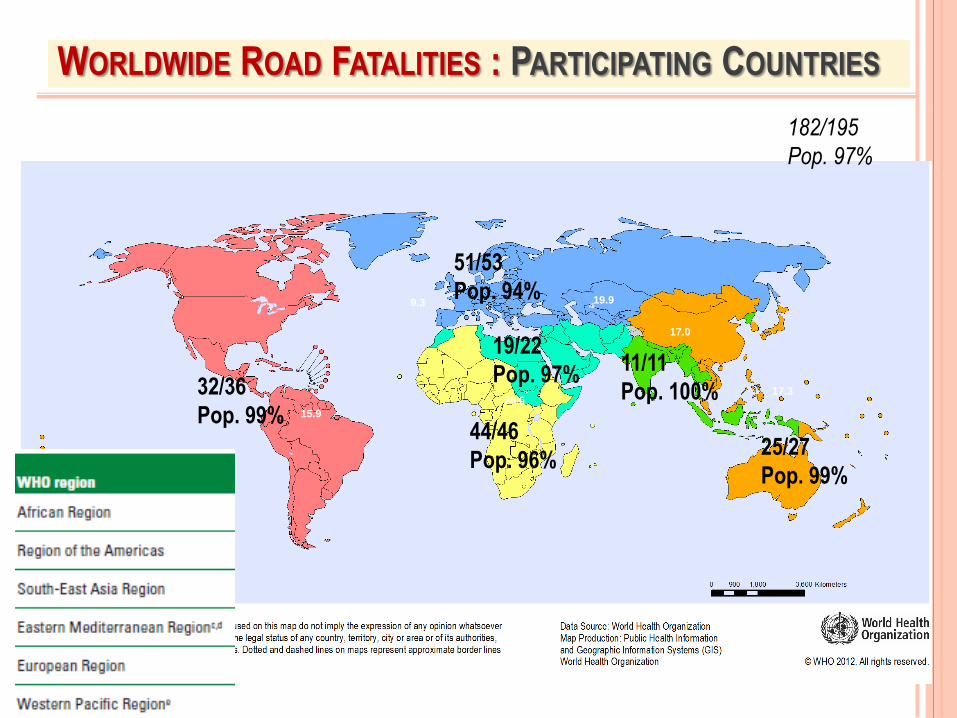
WORLDWIDE ROAD FATALITIES : PARTICIPATING COUNTRIES
15.9
9.3
17.0
17.3 26.6
19.9
44/46
Pop. 96%
32/36
Pop. 99%
11/11
Pop. 100%
19/22
Pop. 97%
51/53
Pop. 94%
25/27
Pop. 99%
182/195
Pop. 97%

WORLDWIDE ROAD FATALITIES
Road traffic deaths accounted for 23% of all injury deaths worldwide
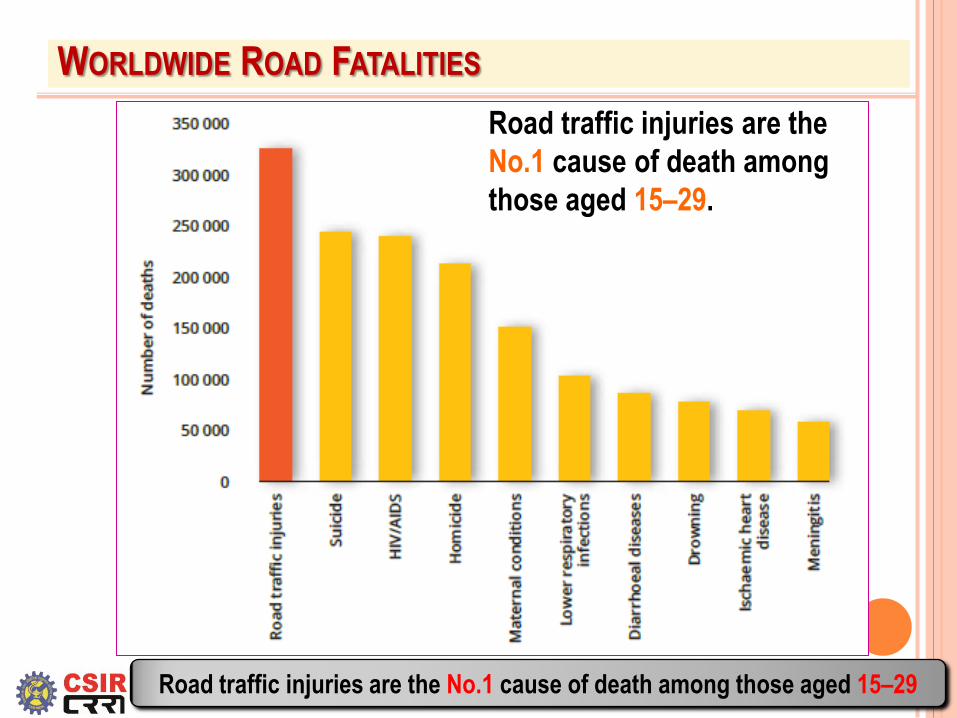
WORLDWIDE ROAD FATALITIES
Road traffic injuries are the No.1 cause of death among those aged 15–29
Road traffic injuries are the
No.1 cause of death among
those aged 15–29.
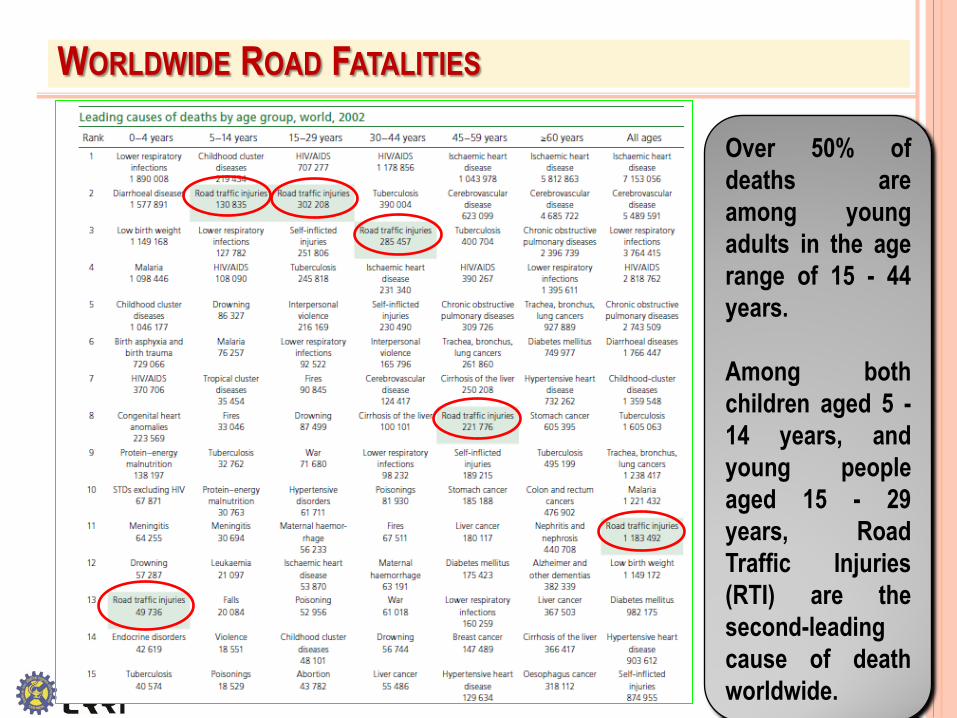
WORLDWIDE ROAD FATALITIES
2010
Over 50% of
deaths are
among young
adults in the age
range of 15 - 44
years.
Among both
children aged 5 -
14 years, and
young people
aged 15 - 29
years, Road
Traffic Injuries
(RTI) are the
second-leading
cause of death
worldwide.
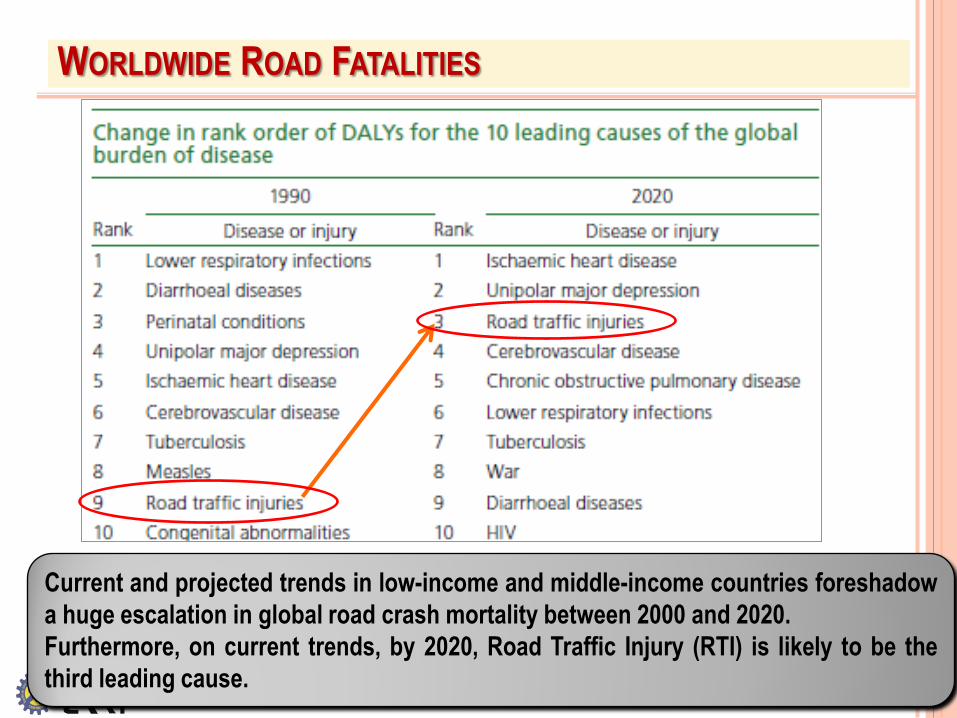
WORLDWIDE ROAD FATALITIES
Current and projected trends in low-income and middle-income countries foreshadow
a huge escalation in global road crash mortality between 2000 and 2020.
Furthermore, on current trends, by 2020, Road Traffic Injury (RTI) is likely to be the
third leading cause.
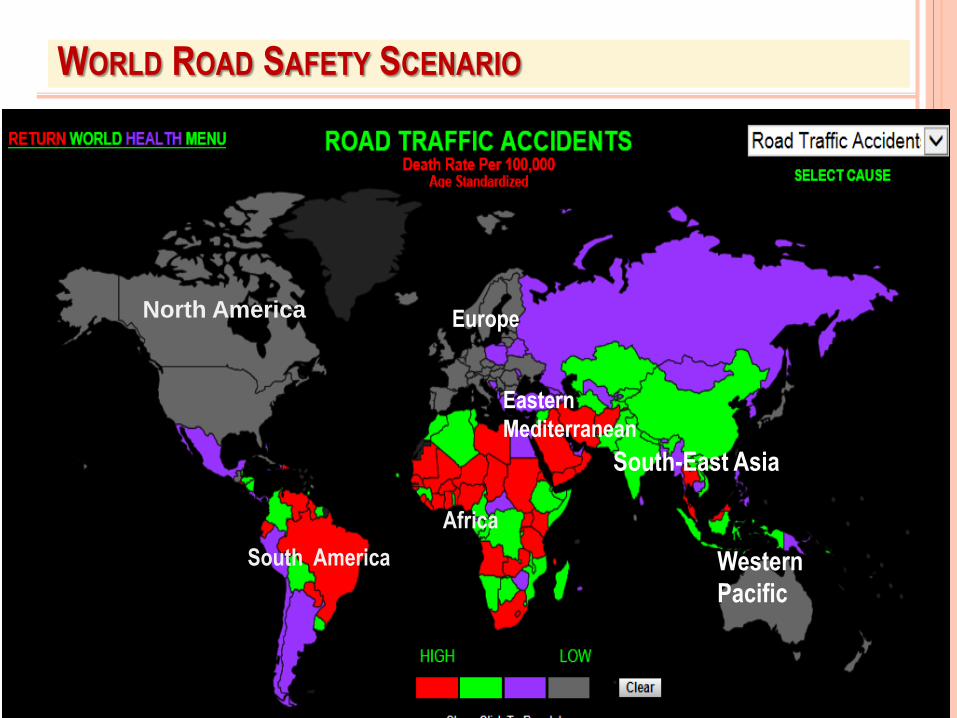
WORLD ROAD SAFETY SCENARIO
Europe North America
South America
Africa
Eastern
Mediterranean
Western
Pacific
South-East Asia
WORLDWIDE ROAD FATALITIES : CURRENT STATUS
The high-income countries in Europe have the lowest road traffic fatality rate (11.0 per 100 000 population) followed by
those of the WHO Western Pacific Region (12.0 per 100 000 population). In general, the regional averages for low-
income and middle-income are much higher than corresponding rates for high-income countries.
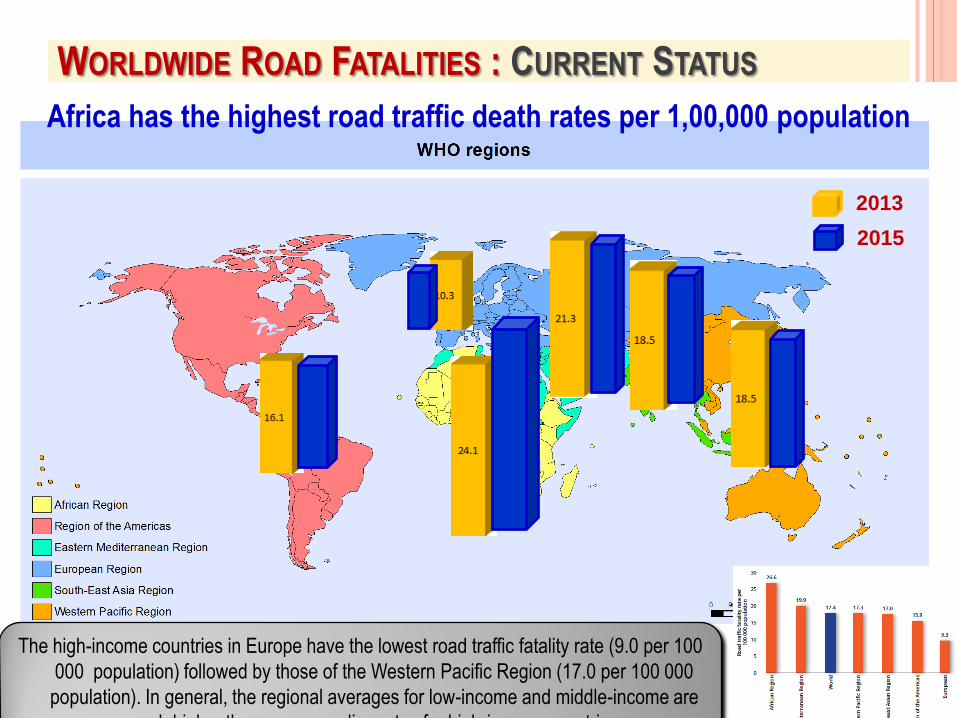
Africa has the highest road traffic death rates per 1,00,000 population
15.9
9.3
17.0
17.3 26.6
19.9
2013
2015
The high-income countries in Europe have the lowest road traffic fatality rate (9.0 per 100
000 population) followed by those of the Western Pacific Region (17.0 per 100 000
population). In general, the regional averages for low-income and middle-income are
much higher than corresponding rates for high-income countries.
WORLDWIDE ROAD FATALITIES : CURRENT STATUS
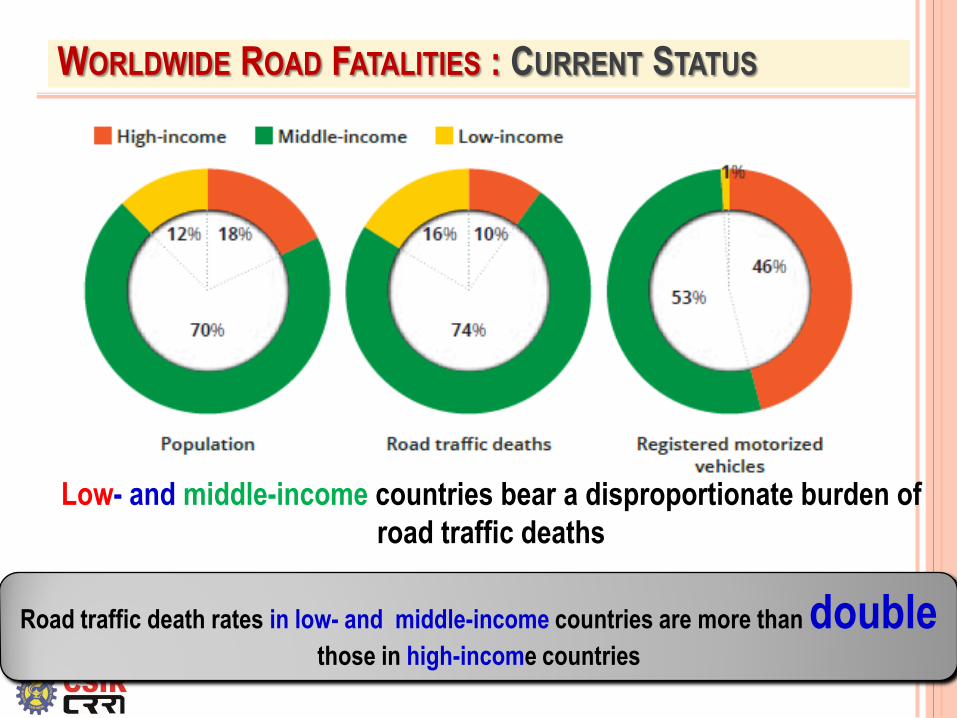
Road traffic death rates in low- and middle-income countries are more than double
those in high-income countries
Low- and middle-income countries bear a disproportionate burden of
road traffic deaths
WORLDWIDE ROAD FATALITIES : CURRENT STATUS
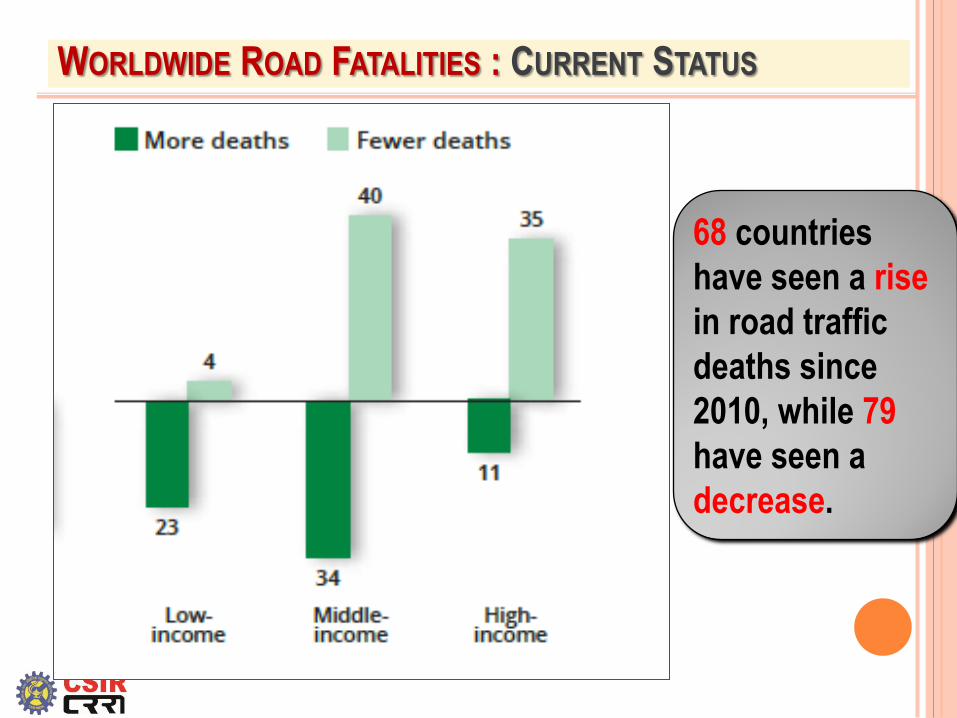
68 countries
have seen a rise
in road traffic
deaths since
2010, while 79
have seen a
decrease.
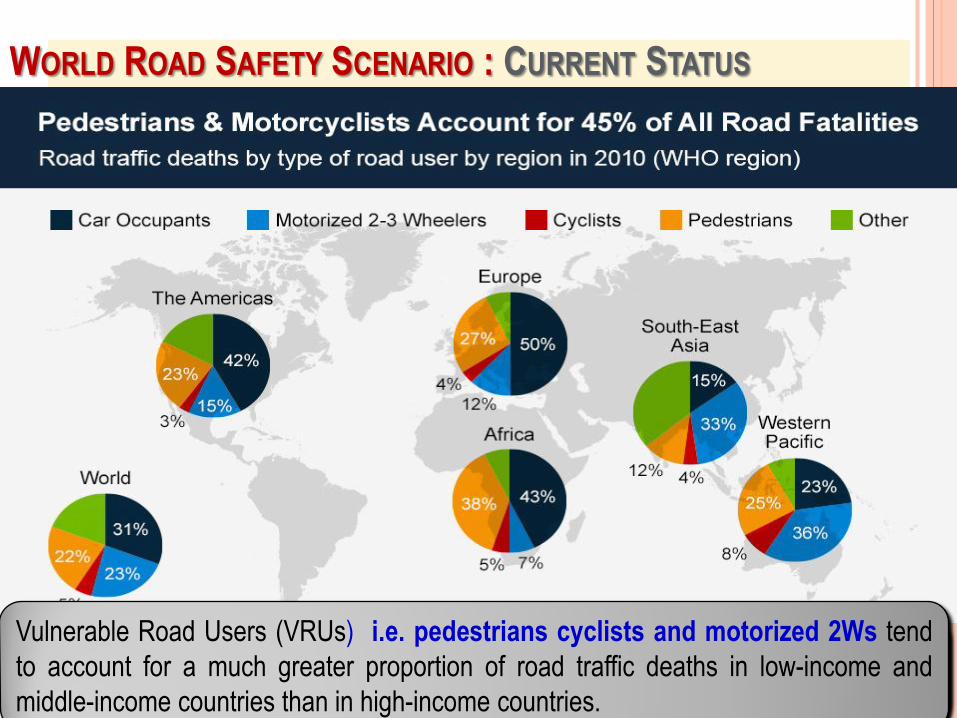
HALF OF ALL DEATHS ARE AMONG VULNERABLE ROAD USERS
WORLD ROAD SAFETY SCENARIO : CURRENT STATUS
In the Region of the Americas, the proportion of motorcycle deaths rose
from 15% to 20% of the total road traffic deaths between 2010 and 2013.
Vulnerable Road Users (VRUs) i.e. pedestrians cyclists and motorized 2Ws tend
to account for a much greater proportion of road traffic deaths in low-income and
middle-income countries than in high-income countries.
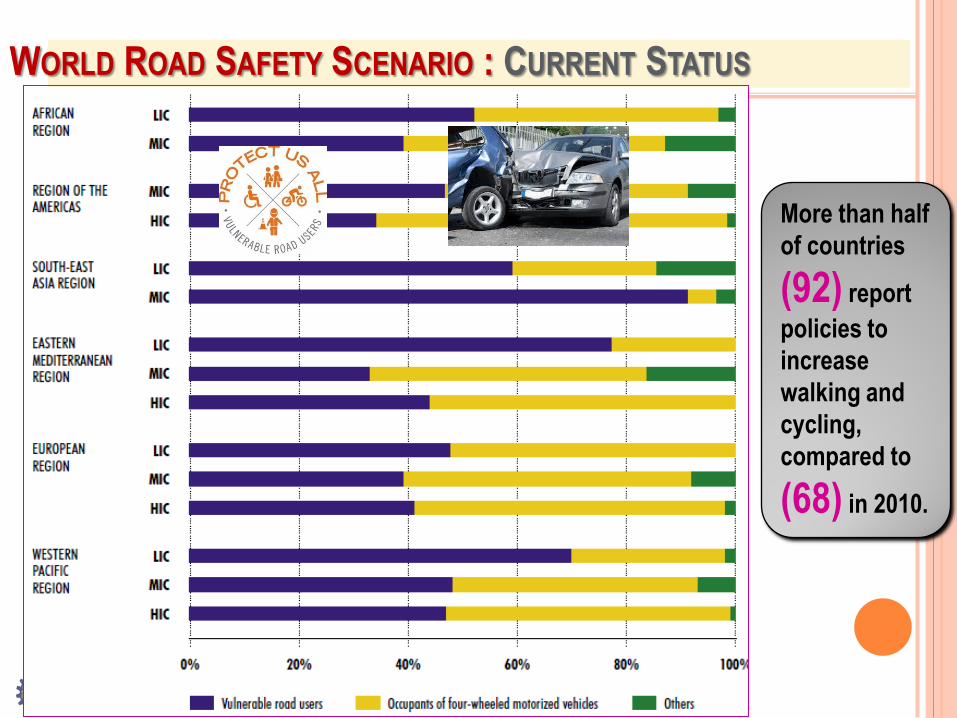
WORLD ROAD SAFETY SCENARIO : CURRENT STATUS
More than half
of countries
(92) report
policies to
increase
walking and
cycling,
compared to
(68) in 2010.

35 COUNTRIES PASSED NEW LAWS BUT ONLY 7% OF THE
WORLD'S POPULATION IS COVERED FOR ALL 5 RISK FACTORS
WORLD ROAD SAFETY SCENARIO: LEGISLATION & ROAD USER
BEHAVIOUR

WORLD ROAD SAFETY SCENARIO: LEGISLATION & ROAD USER
BEHAVIOUR
In the last three years 17countries representing 409 million
People have amended their laws on one or more key risk factors for road
traffic injuries to bring them into line with best practice.
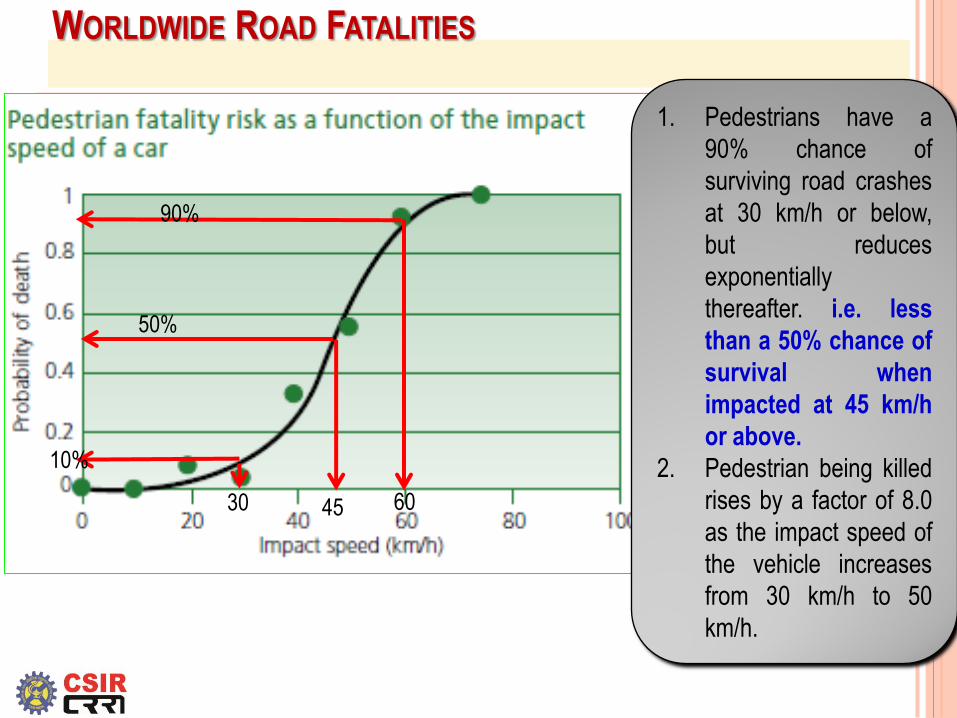
WORLDWIDE ROAD FATALITIES
1. Pedestrians have a
90% chance of
surviving road crashes
at 30 km/h or below,
but reduces
exponentially
thereafter. i.e. less
than a 50% chance of
survival when
impacted at 45 km/h
or above.
2. Pedestrian being killed
rises by a factor of 8.0
as the impact speed of
the vehicle increases
from 30 km/h to 50
km/h.
30 45 60
10%
50%
90%
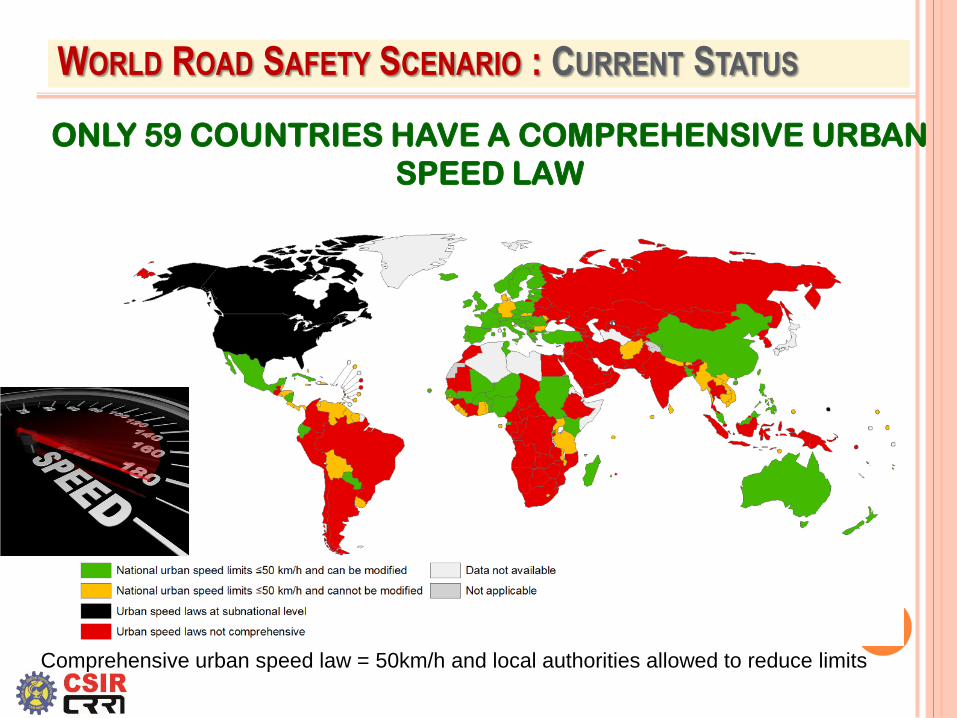
ONLY 59 COUNTRIES HAVE A COMPREHENSIVE URBAN
SPEED LAW
Comprehensive urban speed law = 50km/h and local authorities allowed to reduce limits
WORLD ROAD SAFETY SCENARIO : CURRENT STATUS
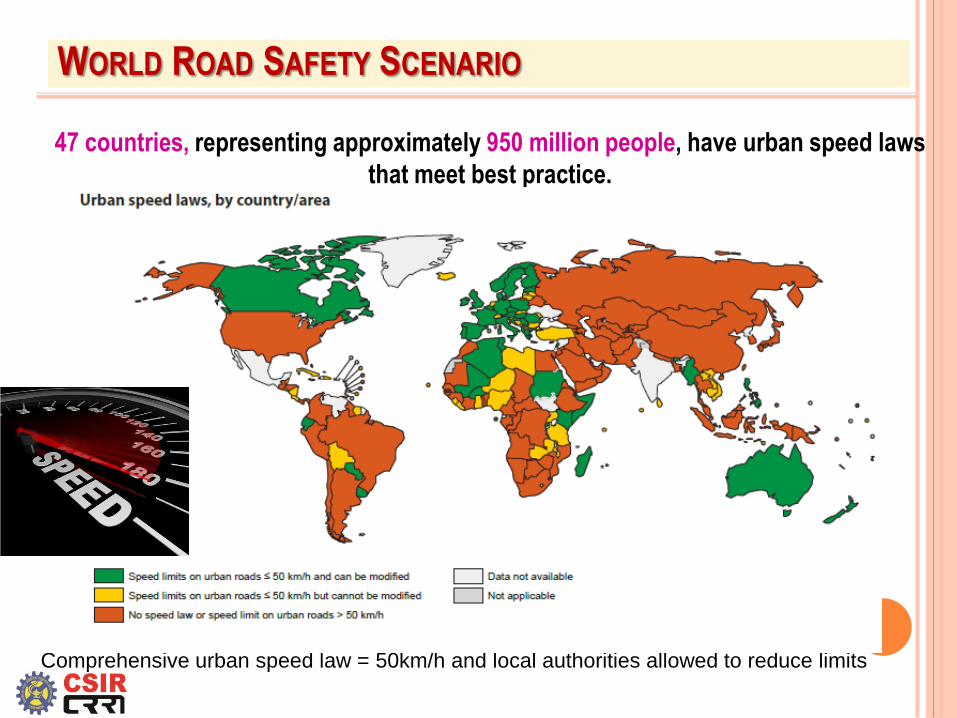
47 countries, representing approximately 950 million people, have urban speed laws
that meet best practice.
Comprehensive urban speed law = 50km/h and local authorities allowed to reduce limits
WORLD ROAD SAFETY SCENARIO
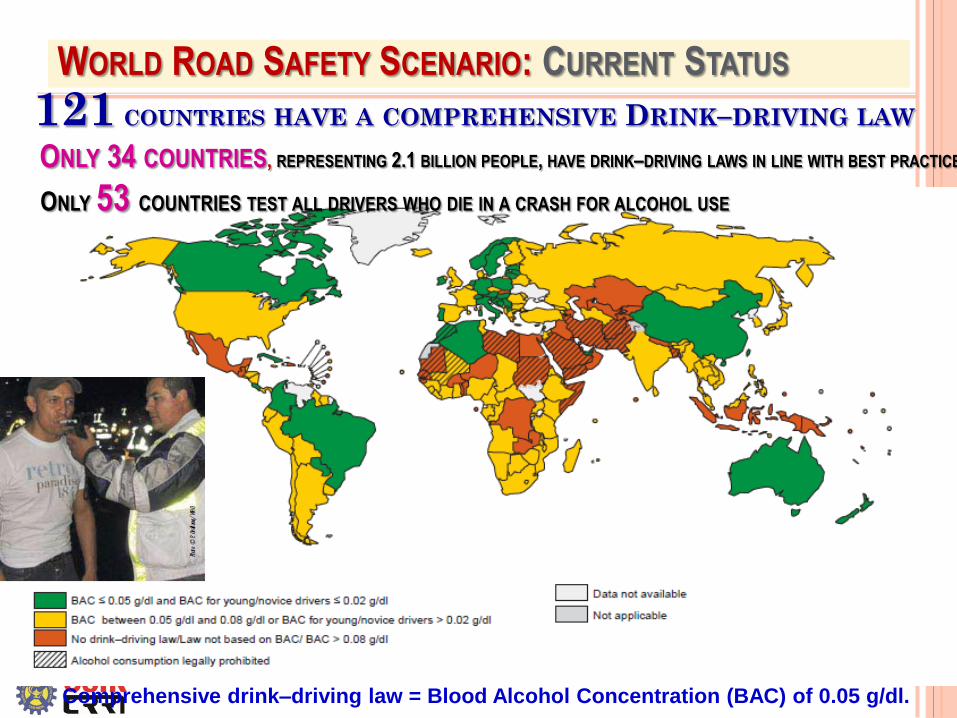
Comprehensive drink–driving law = Blood Alcohol Concentration (BAC) of 0.05 g/dl.
WORLD ROAD SAFETY SCENARIO: CURRENT STATUS
121 COUNTRIES HAVE A COMPREHENSIVE DRINK–DRIVING LAW
ONLY 34 COUNTRIES, REPRESENTING 2.1 BILLION PEOPLE, HAVE DRINK–DRIVING LAWS IN LINE WITH BEST PRACTICE.
ONLY 53 COUNTRIES TEST ALL DRIVERS WHO DIE IN A CRASH FOR ALCOHOL USE
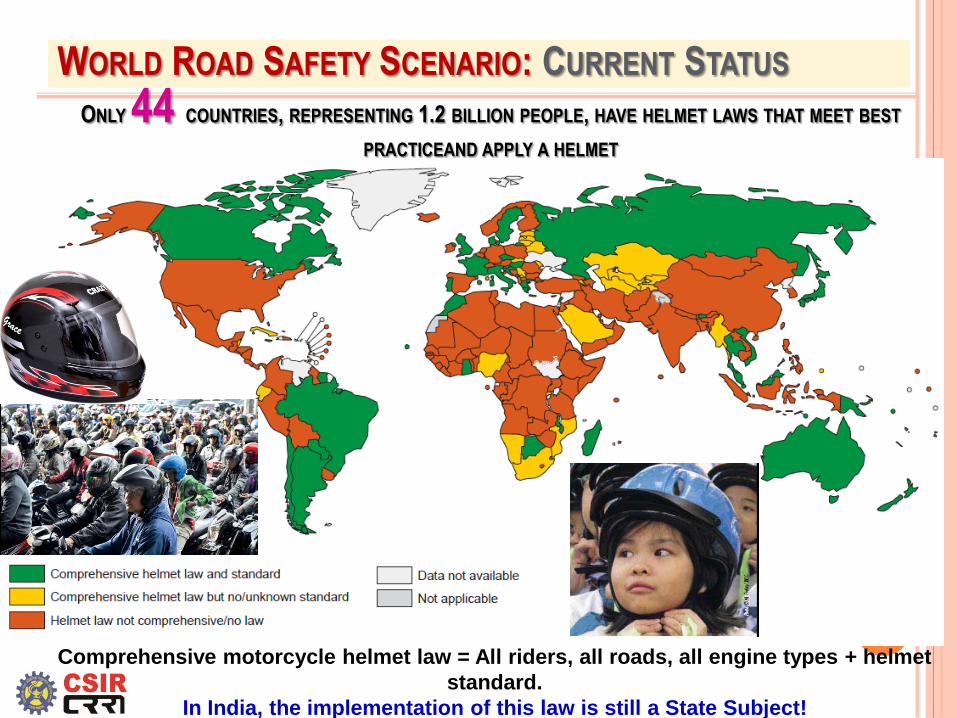
ONLY 44 COUNTRIES, REPRESENTING 1.2 BILLION PEOPLE, HAVE HELMET LAWS THAT MEET BEST
PRACTICEAND APPLY A HELMET
STANDARD.
Comprehensive motorcycle helmet law = All riders, all roads, all engine types + helmet
standard.
In India, the implementation of this law is still a State Subject!
WORLD ROAD SAFETY SCENARIO: CURRENT STATUS

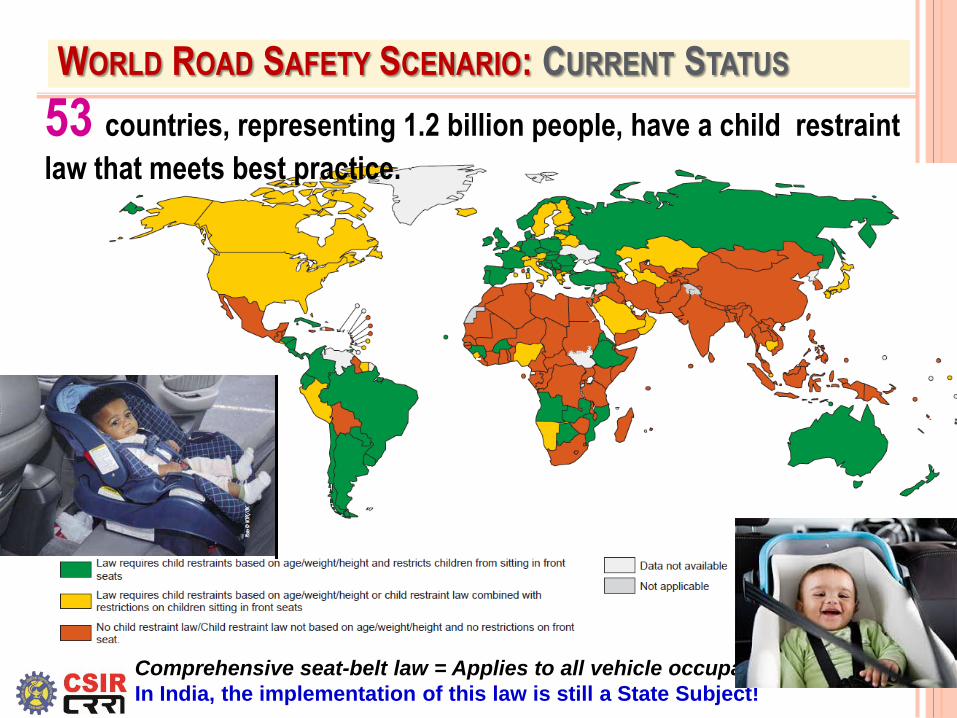
Comprehensive seat-belt law = Applies to all vehicle occupants.
In India, the implementation of this law is still a State Subject!
WORLD ROAD SAFETY SCENARIO: CURRENT STATUS
105 countries, representing 4.8 billion people, have seat-belt laws that cover both
front and rear-seat occupants.
Comprehensive seat-belt law = Applies to all vehicle occupants.
In India, the implementation of this law is still a State Subject!
WORLD ROAD SAFETY SCENARIO: CURRENT STATUS
53 countries, representing 1.2 billion people, have a child restraint
law that meets best practice.
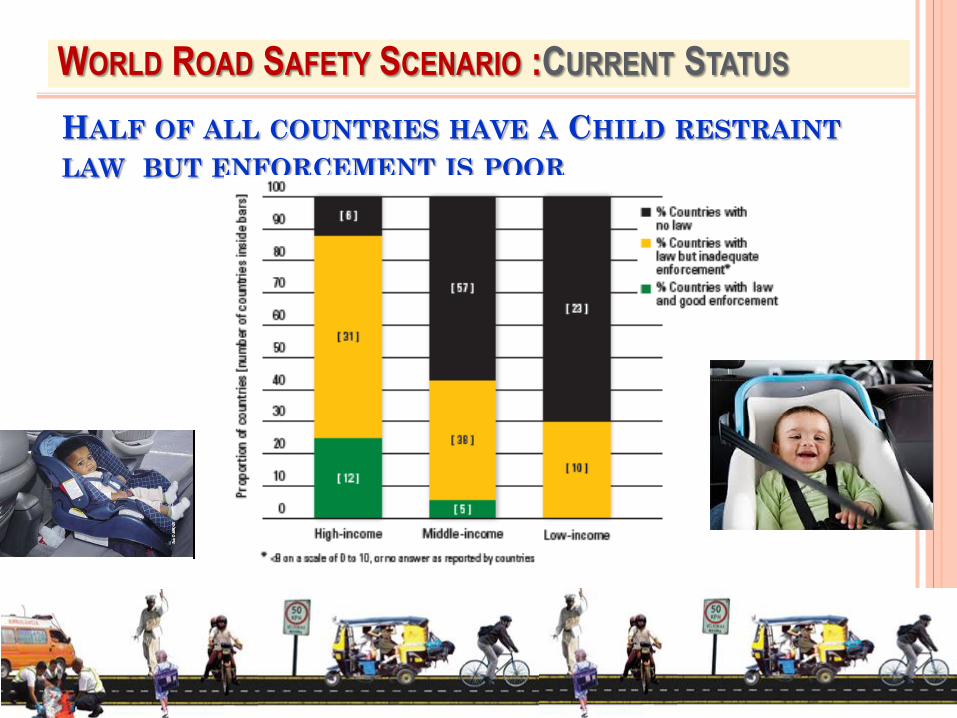
HALF OF ALL COUNTRIES HAVE A CHILD RESTRAINT
LAW BUT ENFORCEMENT IS POOR
WORLD ROAD SAFETY SCENARIO :CURRENT STATUS
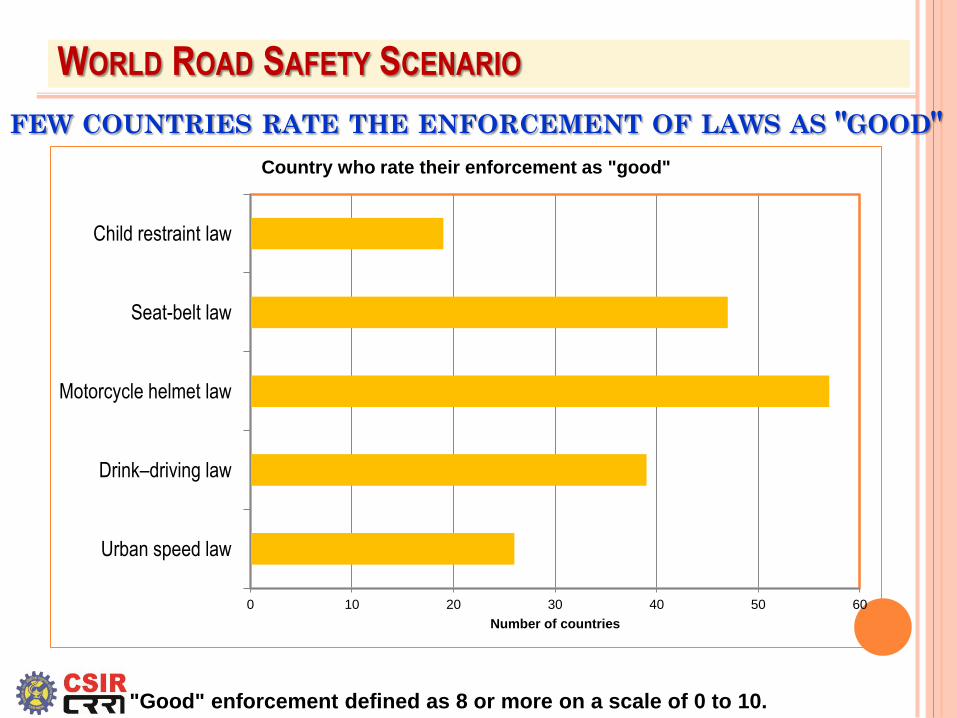
FEW COUNTRIES RATE THE ENFORCEMENT OF LAWS AS "GOOD"
0 10 20 30 40 50 60
Urban speed law
Drink–driving law
Motorcycle helmet law
Seat-belt law
Child restraint law
Number of countries
Country who rate their enforcement as "good"
"Good" enforcement defined as 8 or more on a scale of 0 to 10.
WORLD ROAD SAFETY SCENARIO
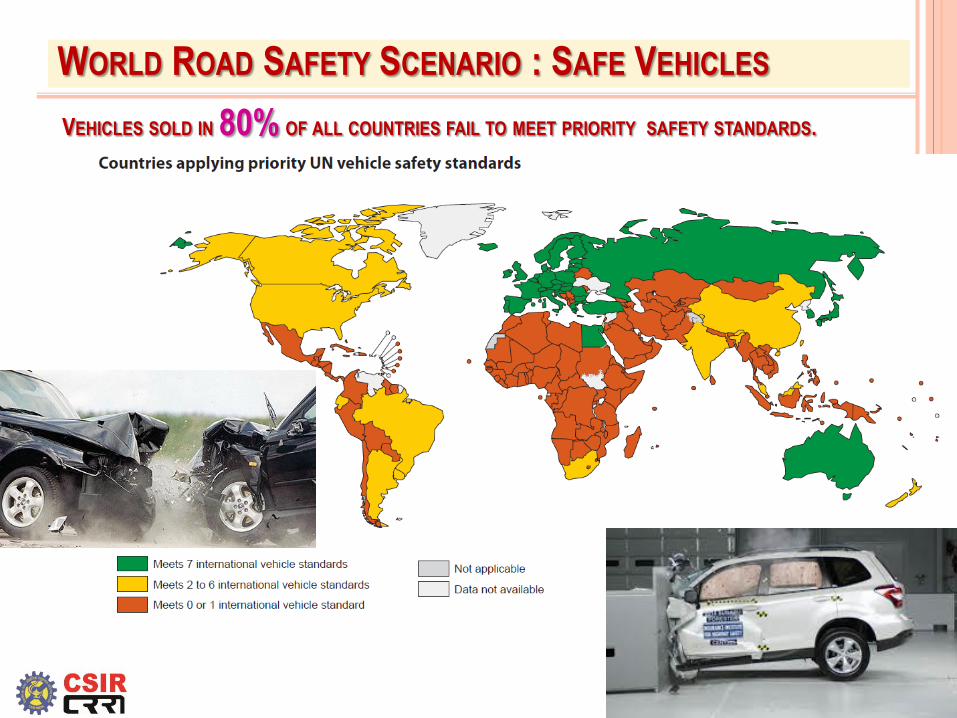
VEHICLES SOLD IN 80% OF ALL COUNTRIES FAIL TO MEET PRIORITY SAFETY STANDARDS.
WORLD ROAD SAFETY SCENARIO : SAFE VEHICLES
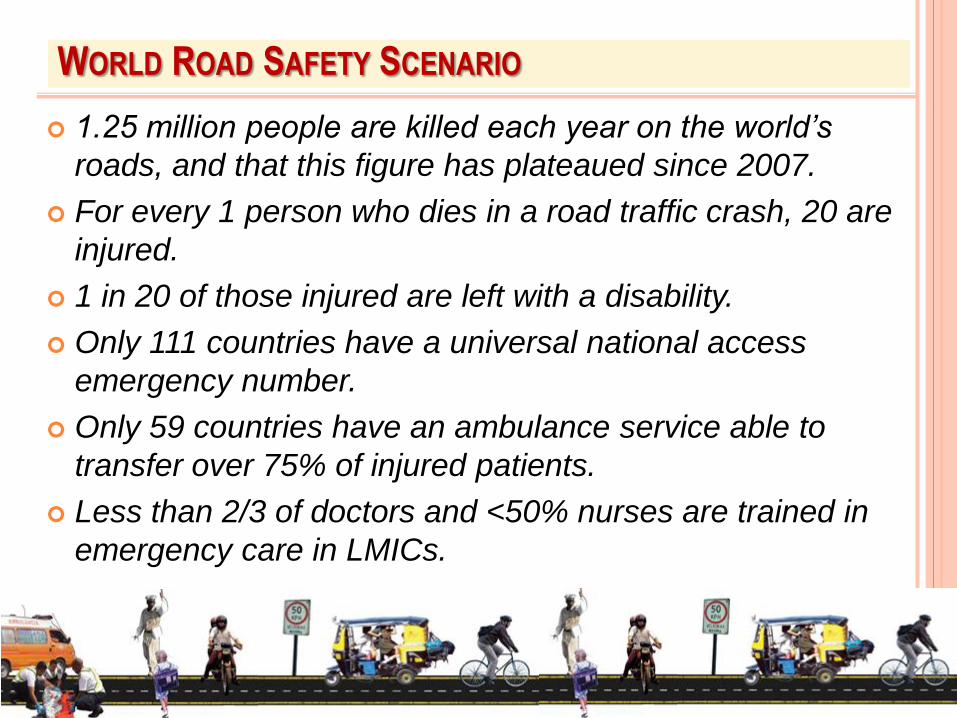
WORLD ROAD SAFETY SCENARIO
1.25 million people are killed each year on the world’s
roads, and that this figure has plateaued since 2007.
For every 1 person who dies in a road traffic crash, 20 are
injured.
1 in 20 of those injured are left with a disability.
Only 111 countries have a universal national access
emergency number.
Only 59 countries have an ambulance service able to
transfer over 75% of injured patients.
Less than 2/3 of doctors and <50% nurses are trained in
emergency care in LMICs.

WORLDWIDE ROAD FATALITIES

WORLDWIDE ROAD FATALITIES PER 100 000 POPULATION
0 10 20 30
Philippines (2009)
Niger
USA
Germany
Japan
Denmark
China
Australia
France
Canada
Italy
Indonesia
Jordan
Korea, (2009)
India
Qatar
Kuwait
United States of America
Russian Federation
Malaysia
South Africa (2009) No.of.Persons Killed per 100,000 population (2010)
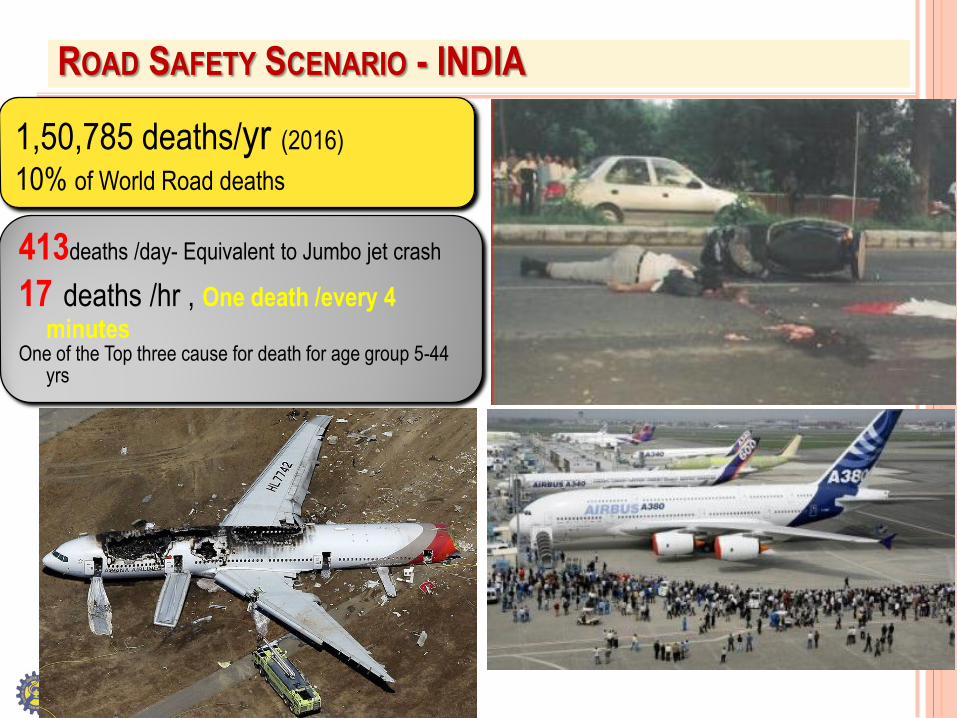
ROAD SAFETY SCENARIO - INDIA
1,50,785 deaths/yr (2016)
10% of World Road deaths
413deaths /day- Equivalent to Jumbo jet crash
17 deaths /hr , One death /every 4
minutes One of the Top three cause for death for age group 5-44
yrs

ROAD SAFETY SCENARIO - INDIA
2016 MoRTH Data
2015 2016
Accidents 5,01,423 4,80,652
Fatal Accidents 1,31,726 1,36,071
Persons Killed 1,46,133 1,50,785
Persons Injured 5,00,279 4,94,624
0
20
40
60
80
100
120
2008 2009 2010 2011 2012 2013 2014 2015
Ro
ad
accid
en
t d
ea
ths p
er 1
00 a
ccid
en
ts
Year
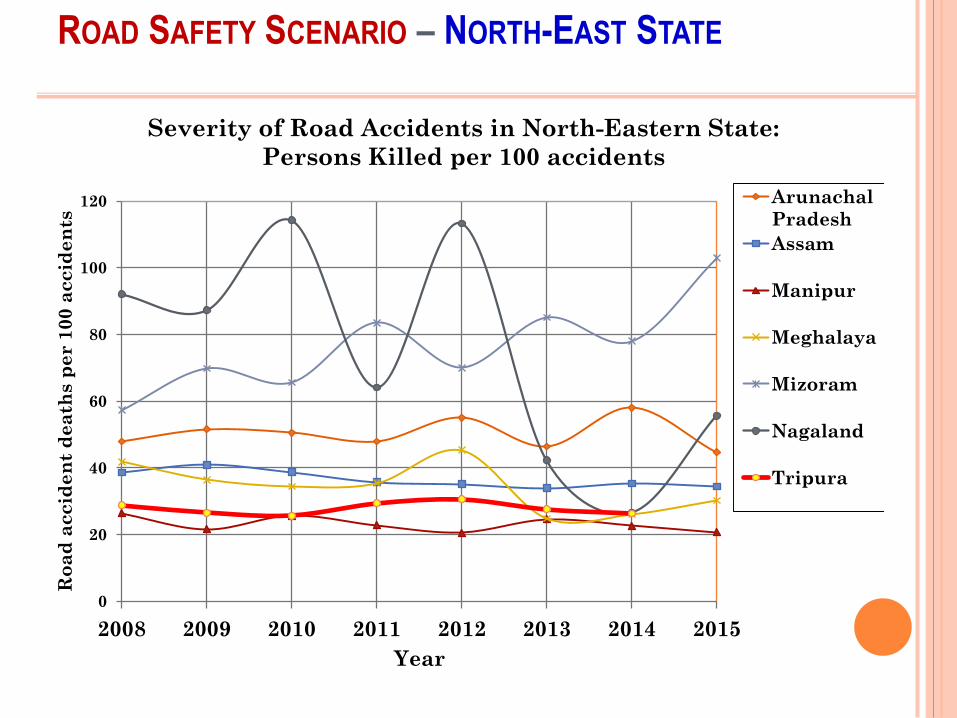
Severity of Road Accidents in North-Eastern State:
Persons Killed per 100 accidents
Arunachal
Pradesh
Assam
Manipur
Meghalaya
Mizoram
Nagaland
Tripura
ROAD SAFETY SCENARIO – NORTH-EAST STATE
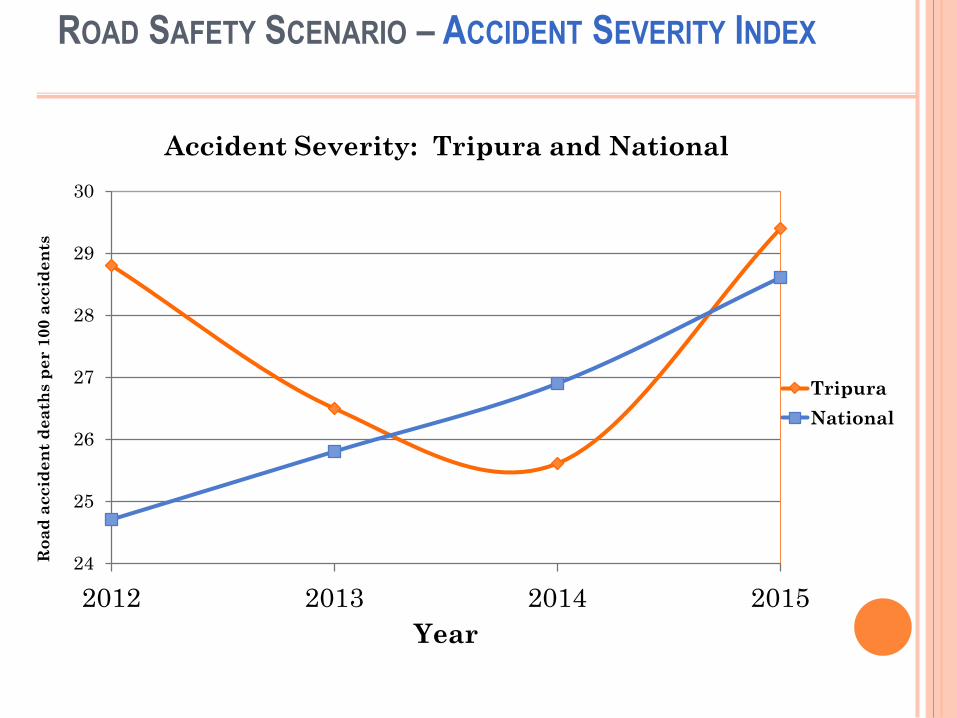
24
25
26
27
28
29
30
2012 2013 2014 2015
Ro
ad
accid
en
t d
ea
ths p
er 1
00 a
ccid
en
ts
Year
Accident Severity: Tripura and National
Tripura
National
ROAD SAFETY SCENARIO – ACCIDENT SEVERITY INDEX

-5000 5000 15000 25000 35000 45000 55000 65000 75000
Tamil Nadu
Maharashtra
Madhya Pradesh
Karanataka
Kerala
Uttar Pradesh
Andhra Pradesh
Rajasthan
Gujarat
Telangana
Chhattisgarh
West Bengal
Haryana
Orissa
Bihar
Delhi
Assam
Punjab
Jammu & Khasmir
Jharkhand
Goa
Himachal Pradesh
Puducherry
Uttarakhand
Manipur
Tripura
Meghalaya
Chandigarh
Arunachal Pradesh
A & N Islands
Sikkim
Daman & Diu
Mizoram
D & N Haveli
Nagaland
Lakshadweep
Total Number of Accidents
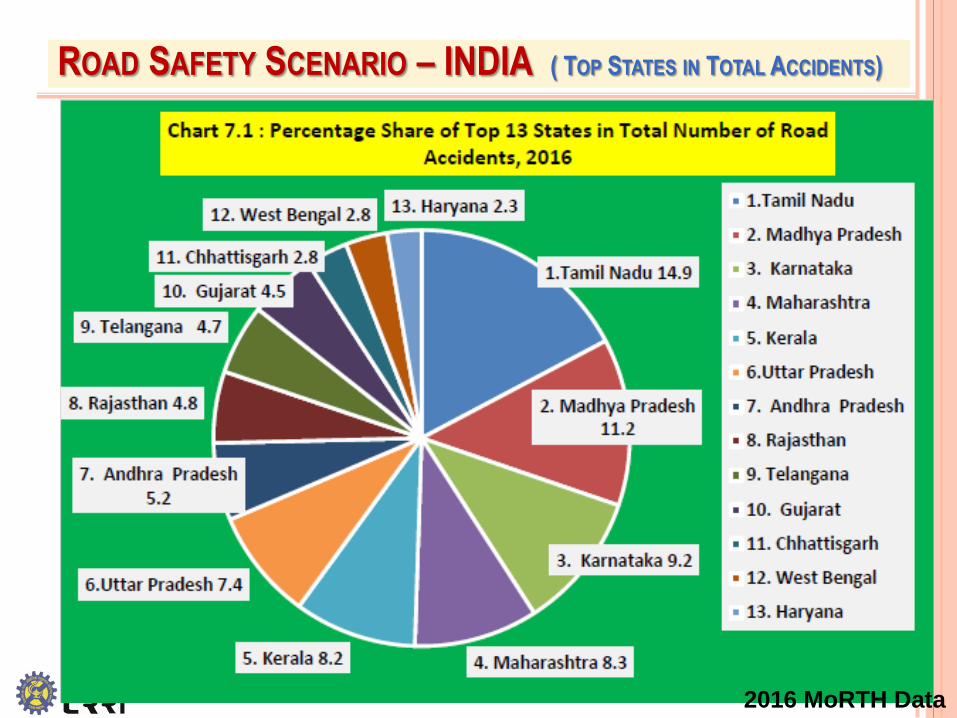
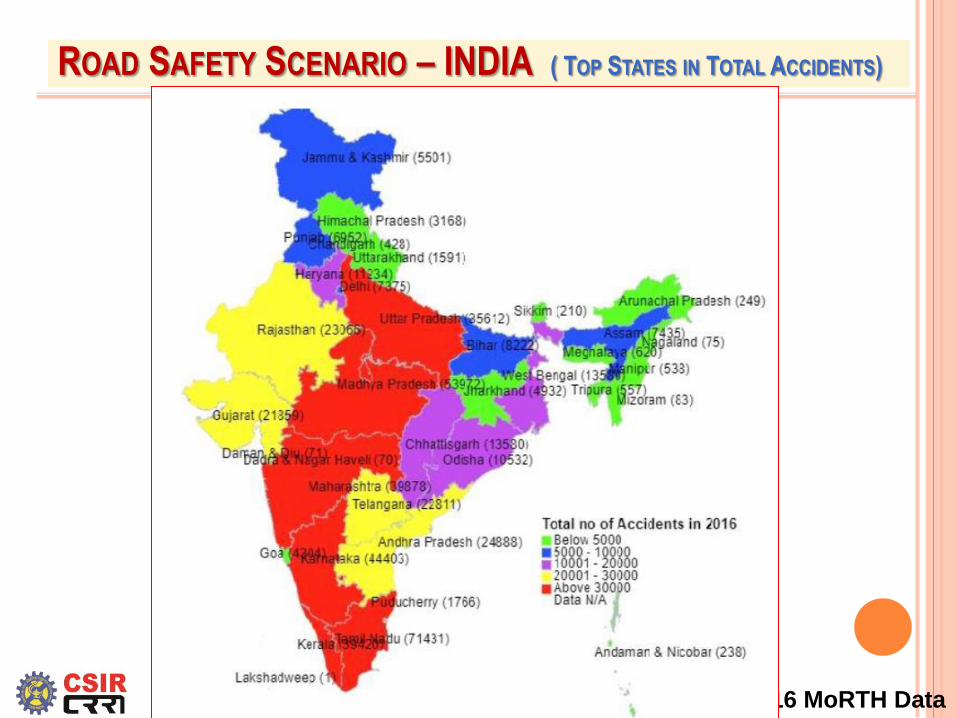
ROAD SAFETY SCENARIO – INDIA ( TOP STATES IN TOTAL ACCIDENTS)
Accidents > 10,000
Top 14 states - 89%
Accidents :500 - 10,000
11 states - 10%
Accidets < 500
14 states / Uts <1%
14th
2016 MoRTH Data
2.19%

-5000 5000 15000 25000 35000 45000 55000 65000 75000
Tamil Nadu
Maharashtra
Madhya Pradesh
Karanataka
Kerala
Uttar Pradesh
Andhra Pradesh
Rajasthan
Gujarat
Telangana
Chhattisgarh
West Bengal
Haryana
Orissa
Bihar
Delhi
Assam
Punjab
Jammu & Khasmir
Jharkhand
Goa
Himachal Pradesh
Puducherry
Uttarakhand
Manipur
Tripura
Meghalaya
Chandigarh
Arunachal Pradesh
A & N Islands
Sikkim
Daman & Diu
Mizoram
D & N Haveli
Nagaland
Lakshadweep
Total Number of Accidents
ROAD SAFETY SCENARIO – INDIA ( TOP STATES IN TOTAL ACCIDENTS)
Accidents > 10,000
Top 14 states - 89%
Accidents :500 - 10,000
11 states - 10%
Accidents < 500
14 states / Uts <1%
14th
2015
2016
2016 MoRTH Data

-5000 5000 15000 25000 35000 45000 55000 65000 75000
Tamil Nadu
Maharashtra
Madhya Pradesh
Karanataka
Kerala
Uttar Pradesh
Andhra Pradesh
Rajasthan
Gujarat
Telangana
Chhattisgarh
West Bengal
Haryana
Orissa
Bihar
Delhi
Assam
Punjab
Jammu & Khasmir
Jharkhand
Goa
Himachal Pradesh
Puducherry
Uttarakhand
Manipur
Tripura
Meghalaya
Chandigarh
Arunachal Pradesh
A & N Islands
Sikkim
Daman & Diu
Mizoram
D & N Haveli
Nagaland
Lakshadweep
Total Number of Accidents
ROAD SAFETY SCENARIO – INDIA ( TOP STATES IN TOTAL ACCIDENTS)
Accidents > 10,000
Top 14 states - 89%
Accidents :500 - 10,000
11 states - 10%
14th
2015
2016
2016 MoRTH Data
ROAD SAFETY SCENARIO – INDIA ( TOP STATES IN TOTAL ACCIDENTS)
2016 MoRTH Data
ROAD SAFETY SCENARIO – INDIA ( TOP STATES IN TOTAL ACCIDENTS)
2016 MoRTH Data
0 2000 4000 6000 8000 10000 12000 14000 16000 18000 20000
Uttar Pradesh
Tamil Nadu
Maharashtra
Karanataka
Rajasthan
Madhya Pradesh
Andhra Pradesh
Gujarat
Telangana
West Bengal
Bihar
Punjab
Haryana
Orissa
Kerala
Chhattisgarh
Jharkhand
Assam
Delhi
Himachal Pradesh
Jammu & Khasmir
Uttarakhand
Goa
Puducherry
Meghalaya
Tripura
Manipur
Chandigarh
Arunachal Pradesh
Mizoram
Sikkim
D & N Haveli
Daman & Diu
Nagaland
A & N Islands
Lakshadweep
Total Number of Persons Killed
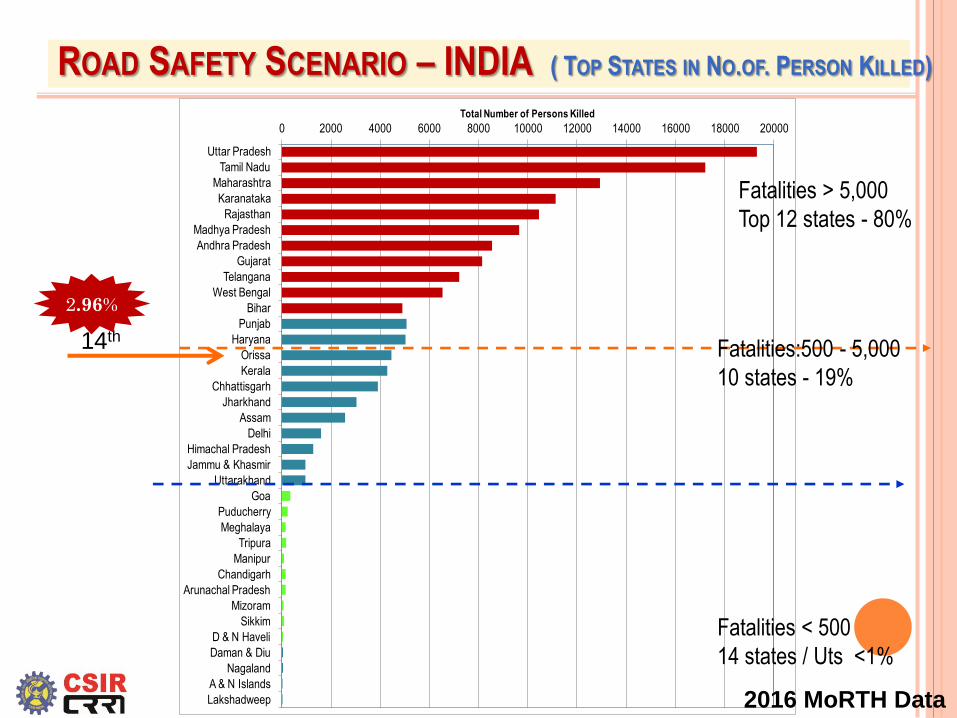
ROAD SAFETY SCENARIO – INDIA ( TOP STATES IN NO.OF. PERSON KILLED)
Fatalities > 5,000
Top 12 states - 80%
Fatalities:500 - 5,000
10 states - 19%
Fatalities < 500
14 states / Uts <1%
14th
2016 MoRTH Data
2.96%
0 2000 4000 6000 8000 10000 12000 14000 16000 18000 20000
Uttar Pradesh
Tamil Nadu
Maharashtra
Karanataka
Rajasthan
Madhya Pradesh
Andhra Pradesh
Gujarat
Telangana
West Bengal
Bihar
Punjab
Haryana
Orissa
Kerala
Chhattisgarh
Jharkhand
Assam
Delhi
Himachal Pradesh
Jammu & Khasmir
Uttarakhand
Goa
Puducherry
Meghalaya
Tripura
Manipur
Chandigarh
Arunachal Pradesh
Mizoram
Sikkim
D & N Haveli
Daman & Diu
Nagaland
A & N Islands
Lakshadweep
Total Number of Persons Killed
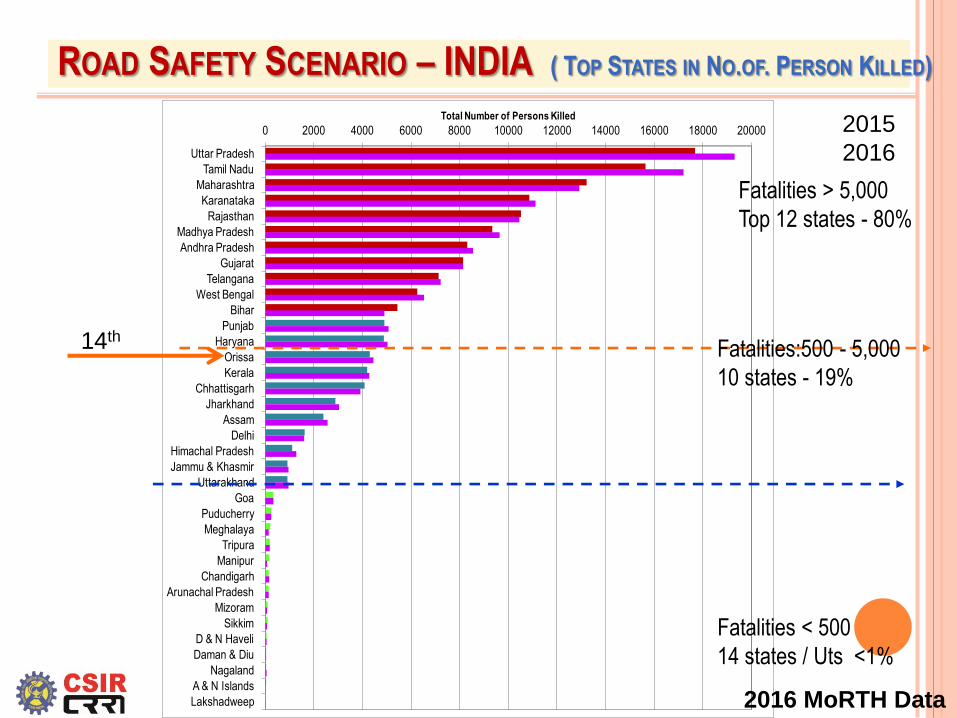
ROAD SAFETY SCENARIO – INDIA ( TOP STATES IN NO.OF. PERSON KILLED)
Fatalities > 5,000
Top 12 states - 80%
Fatalities:500 - 5,000
10 states - 19%
Fatalities < 500
14 states / Uts <1%
14th
2016 MoRTH Data
2015
2016

ROAD SAFETY SCENARIO – INDIA ( TOP STATES IN NO.OF. PERSON KILLED)
2016 MoRTH Data

ROAD SAFETY SCENARIO – INDIA ( TOP STATES IN NO.OF. PERSON INJURED)

ROAD SAFETY SCENARIO – INDIA ( % OF VEHICLES REGISTERED VS % ACCIDENTS)
Andhra Pradesh7%
Assam1%Bihar
2%Chhattisgarh2%
Delhi4%
Gujarat9%
Haryana4%
Himachal Pradesh1%Jammu & Khasmir1%Jharkhand
2%
Karanataka7%
Kerala4%
Madhya Pradesh4%
Maharashtra12%
Orissa2%
Punjab4%
Rajasthan6%
Tamil Nadu11%
Telangana4%
Uttarakhand1%
Uttar Pradesh9%
West Bengal3%
All Uts3%
Andhra Pradesh5% Assam
1% Bihar2%
Chhattisgarh3%
Delhi2%
Gujarat5%
Haryana2%
Himachal Pradesh1%Jammu & Khasmir1%Jharkhand1%
Karanataka9%
Kerala8%
Madhya Pradesh11%
Maharashtra13%
Orissa2%
Punjab1%
Rajasthan5%
Tamil Nadu14%
Telangana4%
Uttarakhand0%
Uttar Pradesh6%
West Bengal3%
All Uts2%
% of Vehicle Registered Vs % Accidents
% of Accidents
% of Vehicles
Registered
% Share
Vehicles
Registered
% Share of
Accidents
A & N Islands 0.0 0.1
Arunachal Pradesh 0.1 0.1
Chandigarh 0.6 0.1
D & N Haveli 0.1 0.0
Daman & Diu 0.1 0.0
Goa 0.5 0.9
Lakshadweep 0.0 0.0
Manipur 0.2 0.1
Meghalaya 0.1 0.1
Mizoram 0.1 0.0
Nagaland 0.2 0.0
Puducherry 0.4 0.3
Sikkim 0.0 0.0
Tripura 0.1 0.1
2.5 1.8
5
1
2
3
3
4
4
1
2 3
6 6
6 6
4
3
5
6
6
6

Andhra Pradesh4% Assam
3%
Bihar9%
Chhattisgarh2%
Delhi1%
Gujarat5%
Haryana2%
Himachal Pradesh1%Jammu & Khasmir1%
Jharkhand3%
Karanataka5%
Kerala3%
Madhya Pradesh6%
Maharashtra9%
Orissa3%
Punjab2%
Rajasthan6%
Tamil Nadu6%
Telangana3%
Uttarakhand1%
Uttar Pradesh16%
West Bengal8%
All Uts2%
Andhra Pradesh5% Assam
1% Bihar2%
Chhattisgarh3%
Delhi2%
Gujarat5%
Haryana2%
Himachal Pradesh1%Jammu & Khasmir1%Jharkhand1%
Karanataka9%
Kerala8%
Madhya Pradesh11%
Maharashtra13%
Orissa2%
Punjab1%
Rajasthan5%
Tamil Nadu14%
Telangana4%
Uttarakhand0%
Uttar Pradesh6%
West Bengal3%
All Uts2%
% of Population Vs % Accidents
ROAD SAFETY SCENARIO – INDIA ( % OF POPULATION VS % ACCIDENTS)
% of Accidents
% of Population
% Share of
Population
% Share of
Accidents
A & N Islands 0.0 0.1
Arunachal Pradesh 0.1 0.1
Chandigarh 0.1 0.1
D & N Haveli 0.0 0.0
Daman & Diu 0.0 0.0
Goa 0.1 0.9
Lakshadweep 0.0 0.0
Manipur 0.2 0.1
Meghalaya 0.2 0.1
Mizoram 0.1 0.0
Nagaland 0.2 0.0
Puducherry 0.1 0.3
Sikkim 0.1 0.0
Tripura 0.3 0.1
1.6 1.8

Andhra Pradesh7%
Assam1% Bihar
2%Chhattisgarh
2%
Delhi4%
Gujarat9%
Haryana4%
Himachal Pradesh1%Jammu & Khasmir
1%Jharkhand
2%
Karanataka7%
Kerala4%
Madhya Pradesh4%Maharashtra
12%
Orissa2%
Punjab4%
Rajasthan6%
Tamil Nadu11%
Telangana4%
Uttarakhand1%
Uttar Pradesh9%
West Bengal3%
All Uts3%
Andhra Pradesh4% Assam
3%
Bihar9%
Chhattisgarh2%
Delhi1%
Gujarat5%
Haryana2%
Himachal Pradesh1%Jammu & Khasmir1%
Jharkhand3%
Karanataka5%
Kerala3%
Madhya Pradesh6%
Maharashtra9%
Orissa3%
Punjab2%
Rajasthan6%
Tamil Nadu6%
Telangana3%
Uttarakhand1%
Uttar Pradesh16%
West Bengal8%
All Uts2%
Andhra Pradesh5%
Assam1% Bihar
2%
Chhattisgarh3%
Delhi2%
Gujarat5%
Haryana2%
Himachal Pradesh1%
Jammu & Khasmir1%
Jharkhand1%
Karanataka9%
Kerala8%
Madhya Pradesh11%
Maharashtra13%
Orissa2%
Punjab1%
Rajasthan5%
Tamil Nadu14%
Telangana4%
Uttarakhand0%
Uttar Pradesh6%
West Bengal3%
All Uts2%
% of Population Vs % of Vehicle Registered Vs % Accidents
ROAD SAFETY SCENARIO – INDIA ( % OF VEHICLES REGISTERED VS % POPULATION VS % ACCIDENTS)
% of Accidents
% of Vehicles Reg.
% of Population
% Share
Vehicles
Registered
% Share of
Population
% Share of
Accidents
A & N Islands 0.0 0.0 0.1
Arunachal Pradesh 0.1 0.1 0.1
Chandigarh 0.6 0.1 0.1
D & N Haveli 0.1 0.0 0.0
Daman & Diu 0.1 0.0 0.0
Goa 0.5 0.1 0.9
Lakshadweep 0.0 0.0 0.0
Manipur 0.2 0.2 0.1
Meghalaya 0.1 0.2 0.1
Mizoram 0.1 0.1 0.0
Nagaland 0.2 0.2 0.0
Puducherry 0.4 0.1 0.3
Sikkim 0.0 0.1 0.0
Tripura 0.1 0.3 0.1
2.5 1.6 1.8
0 2000 4000 6000 8000 10000 12000 14000 16000 18000 20000
Uttar Pradesh
Tamil Nadu
Maharashtra
Karanataka
Rajasthan
Madhya Pradesh
Andhra Pradesh
Gujarat
Telangana
West Bengal
Bihar
Punjab
Haryana
Orissa
Kerala
Chhattisgarh
Jharkhand
Assam
Delhi
Himachal Pradesh
Jammu & Khasmir
Uttarakhand
Goa
Puducherry
Meghalaya
Tripura
Manipur
Chandigarh
Arunachal Pradesh
Mizoram
Sikkim
D & N Haveli
Daman & Diu
Nagaland
A & N Islands
Lakshadweep
Total Number of Persons Killed
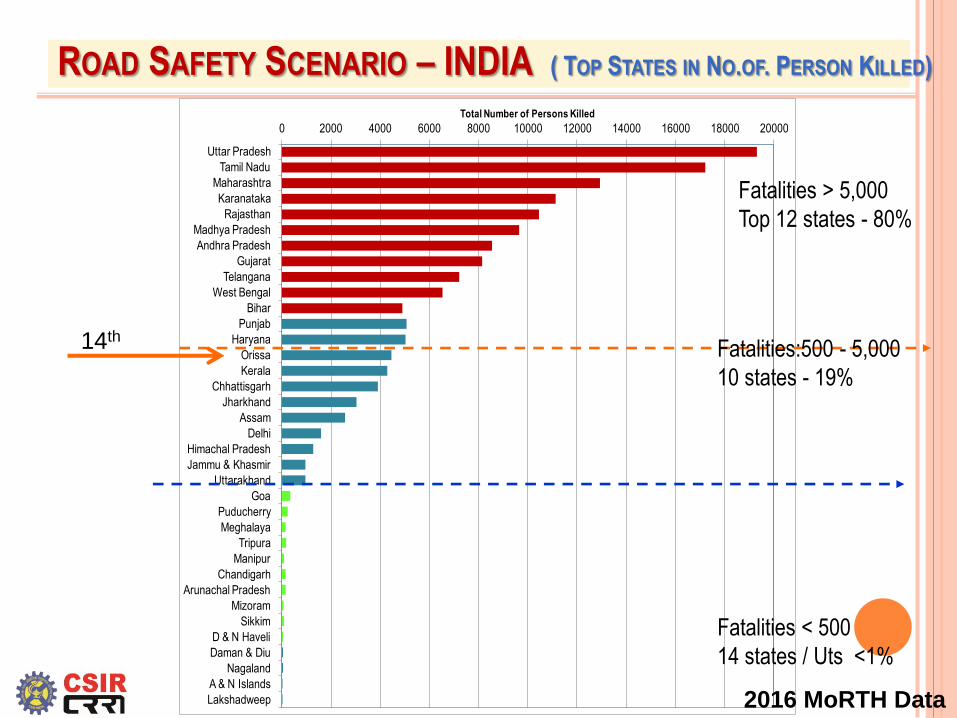
ROAD SAFETY SCENARIO – INDIA ( TOP STATES IN NO.OF. PERSON KILLED)
Fatalities > 5,000
Top 12 states - 80%
Fatalities:500 - 5,000
10 states - 19%
Fatalities < 500
14 states / Uts <1%
14th
2016 MoRTH Data
0 2000 4000 6000 8000 10000 12000 14000 16000 18000
Uttar Pradesh
Tamil Nadu
Maharashtra
Karanataka
Rajasthan
Madhya Pradesh
Andhra Pradesh
Gujarat
Telangana
West Bengal
Bihar
Punjab
Haryana
Orissa
Kerala
Chhattisgarh
Jharkhand
Assam
Delhi
Himachal Pradesh
Jammu & Khasmir
Uttarakhand
Goa
Puducherry
Meghalaya
Tripura
Manipur
Chandigarh
Arunachal Pradesh
Mizoram
Sikkim
D & N Haveli
Daman & Diu
Nagaland
A & N Islands
Lakshadweep
Total Number of Persons Killed
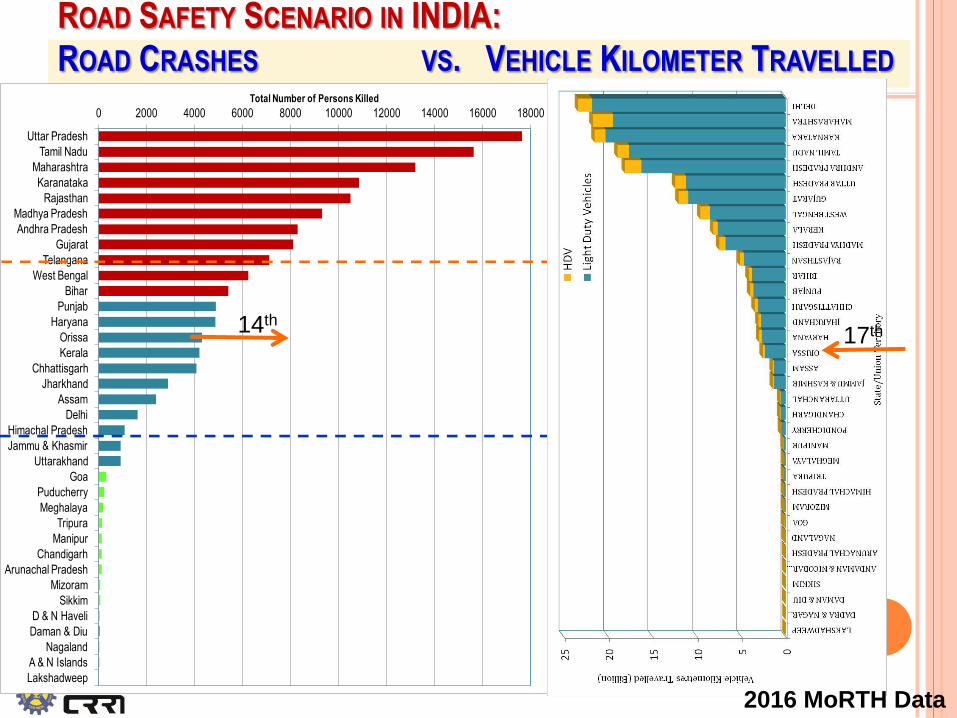
ROAD SAFETY SCENARIO IN INDIA:
ROAD CRASHES VS. VEHICLE KILOMETER TRAVELLED
14th 17th
2016 MoRTH Data

0
200
400
600
800
1000
1200
1400
1600
1800
2000
DelhiChennai
BengaluruPatna
HyderabadMumbaiKanpur
LucknowAllahabad
AgraKolkataIndorePune
RaipurVizaqJaipur
GhaziabadVijaywada
MallapuramLudhiana
MeerutJabalpur
NagpurJodhpur
CoimbatoreKollamBhopal
GwaliorAhmedabad
Dhanbad'Varanasi
SuratFaridabad
AsansolThiruvanthapuram
VadodaraKhozikode
AurangabadJamshedpur
KochiMaduraiThissur
TiruchirapalliChnadigarh
RajkotNashik
KotaAmritsarSrinagarKannur
Fatal Accidents
Persons K
illed
ROAD SAFETY SCENARIO - INDIA IN MILLION PLUS CITIES
ROAD CRASHES VS. VEHICLE KILOMETER TRAVELLED
0246810
12
14
16
18
0
10
20
30
40
50
60
70
80
90
Population (Million)
Vehicle Kilometres Travelled (Million
Cit
y
He
av
y D
uty
Ve
hic
les
VK
T (
La
kh
s)
Lig
ht
Du
ty V
eh
icle
s V
KT
(L
ak
hs)
Po
pu
lati
on
(M
illi
on
)
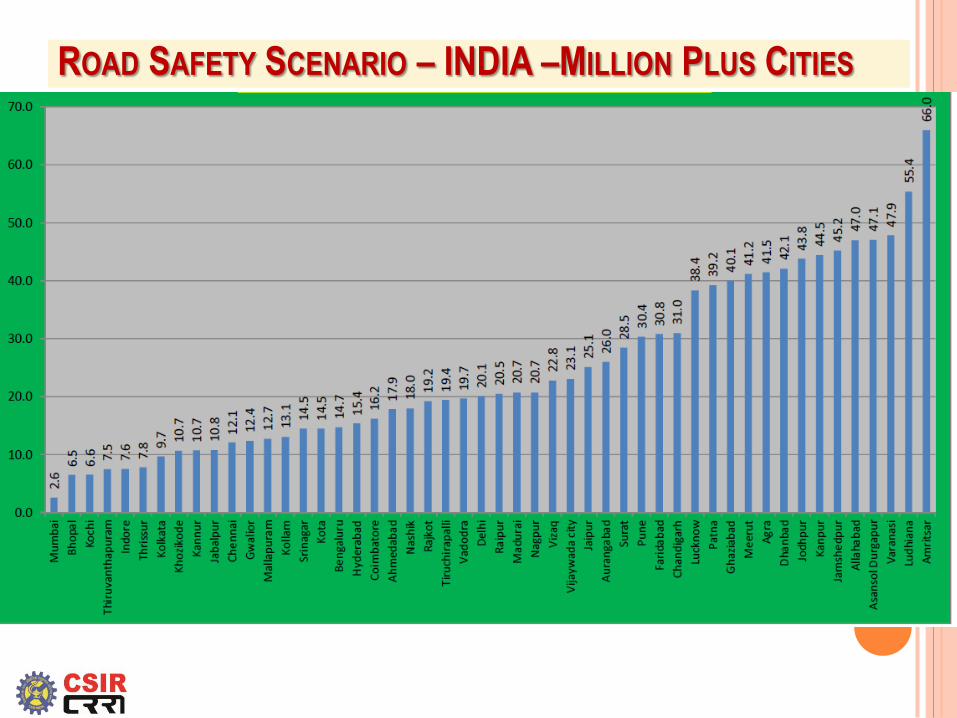
ROAD SAFETY SCENARIO – INDIA –MILLION PLUS CITIES

ROAD SAFETY SCENARIO – INDIA –TOP 5 MILLION PLUS CITIES

ROAD SAFETY SCENARIO – INDIA –TOP MILLION PLUS CITIES
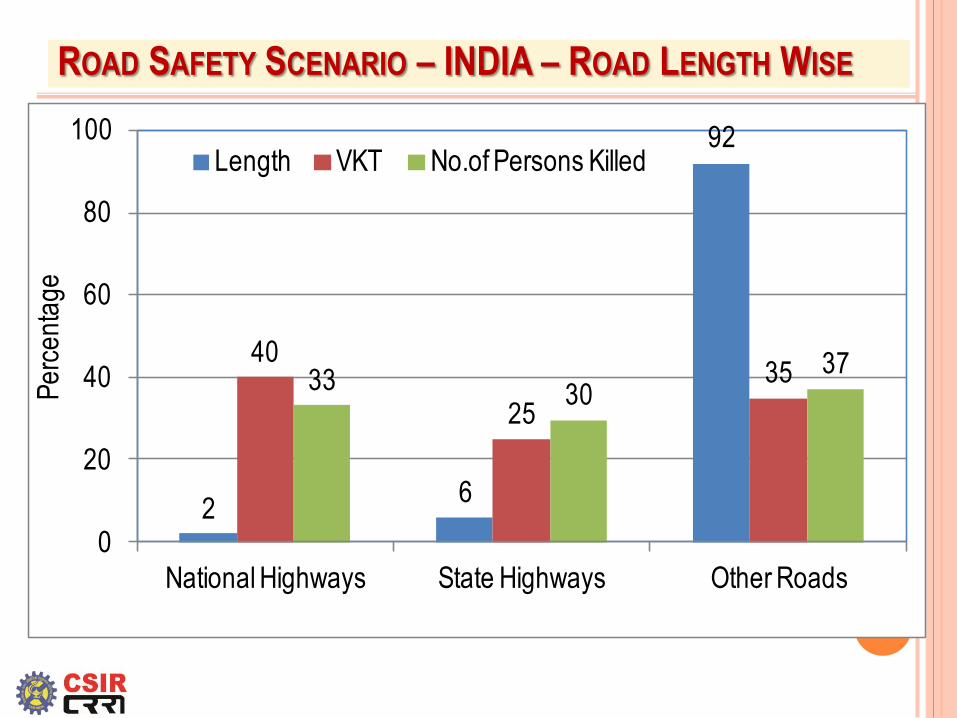
ROAD SAFETY SCENARIO – INDIA – ROAD LENGTH WISE
26
92
40
25
353330
37
0
20
40
60
80
100
National Highways State Highways Other Roads
Pe
rce
nta
ge
Length VKT No.of Persons Killed

ROAD SAFETY SCENARIO – INDIA – ROAD LENGTH WISE
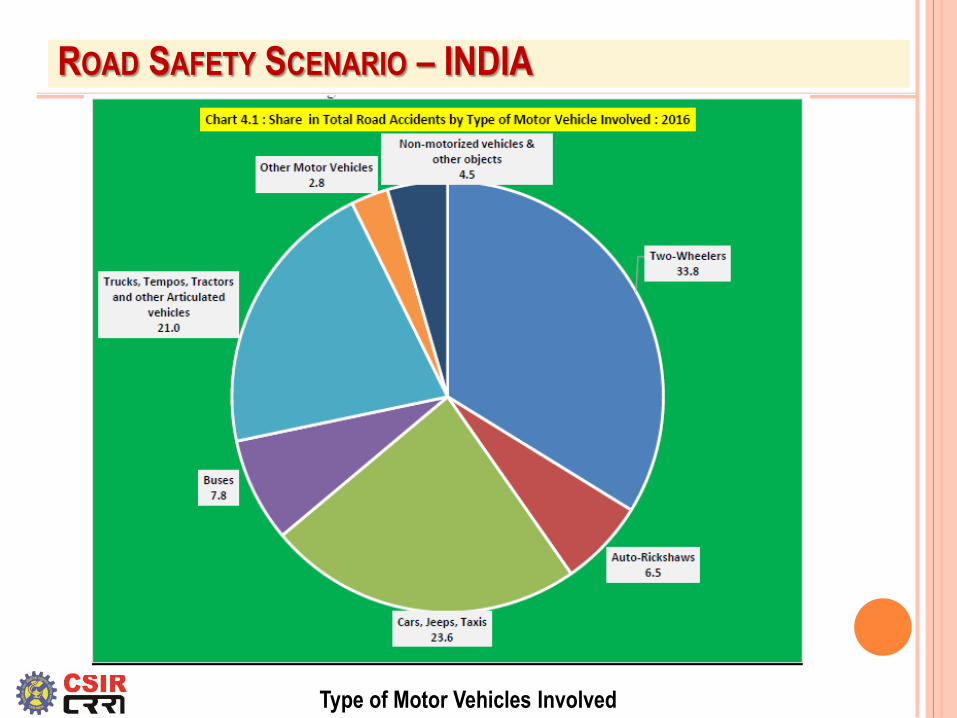
ROAD SAFETY SCENARIO – INDIA
Type of Motor Vehicles Involved
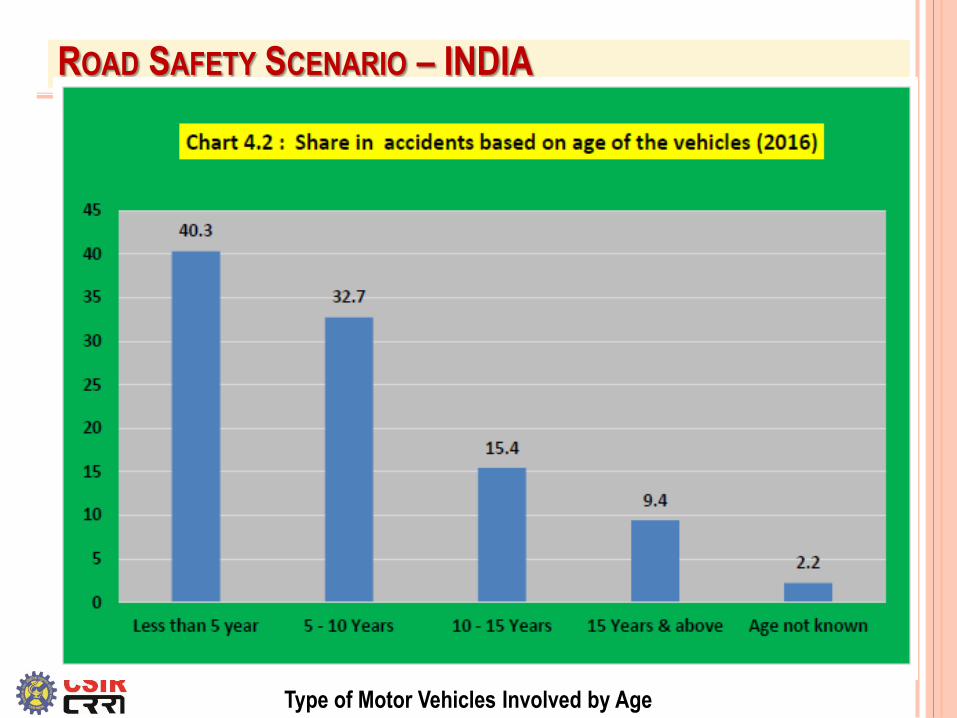
ROAD SAFETY SCENARIO – INDIA
Type of Motor Vehicles Involved by Age
ROAD SAFETY SCENARIO – INDIA
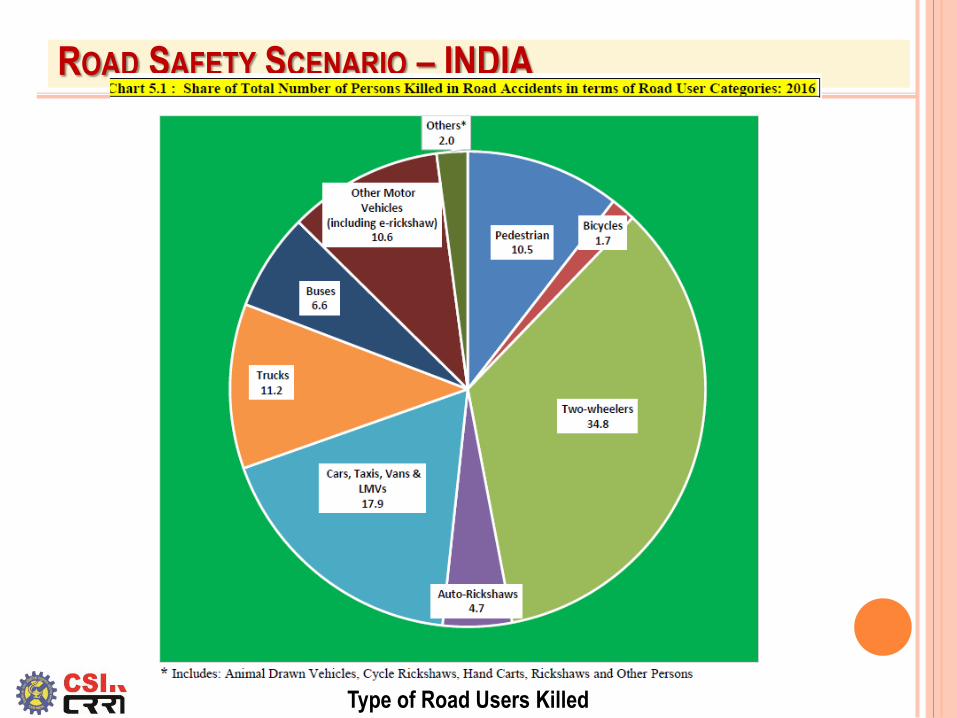
Type of Road Users Killed
ROAD SAFETY SCENARIO – INDIA
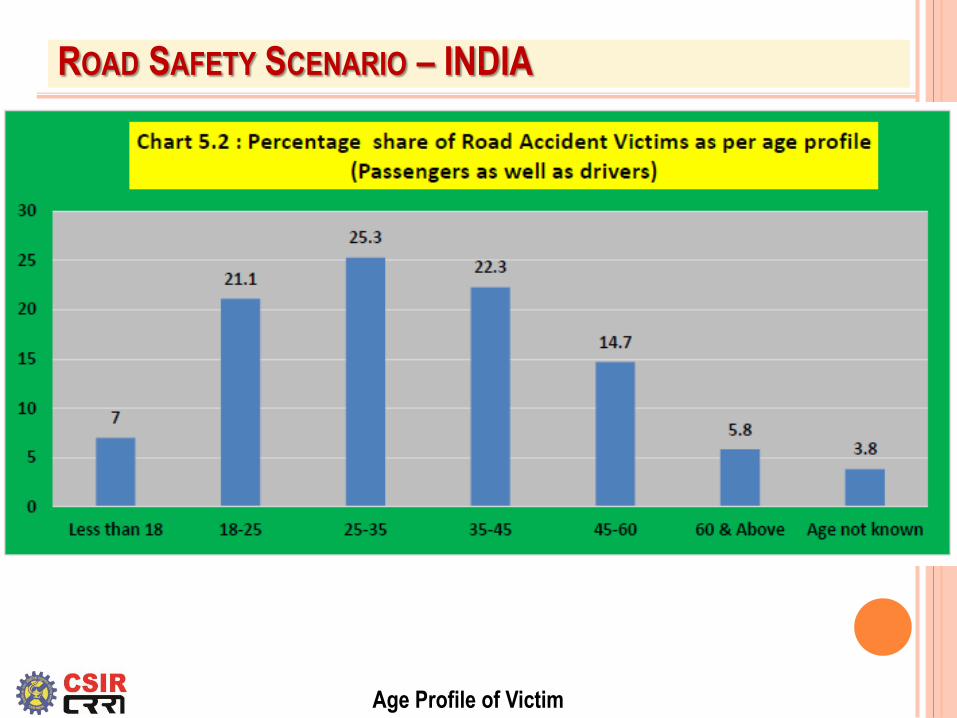
Age Profile of Victim
ROAD SAFETY SCENARIO – INDIA
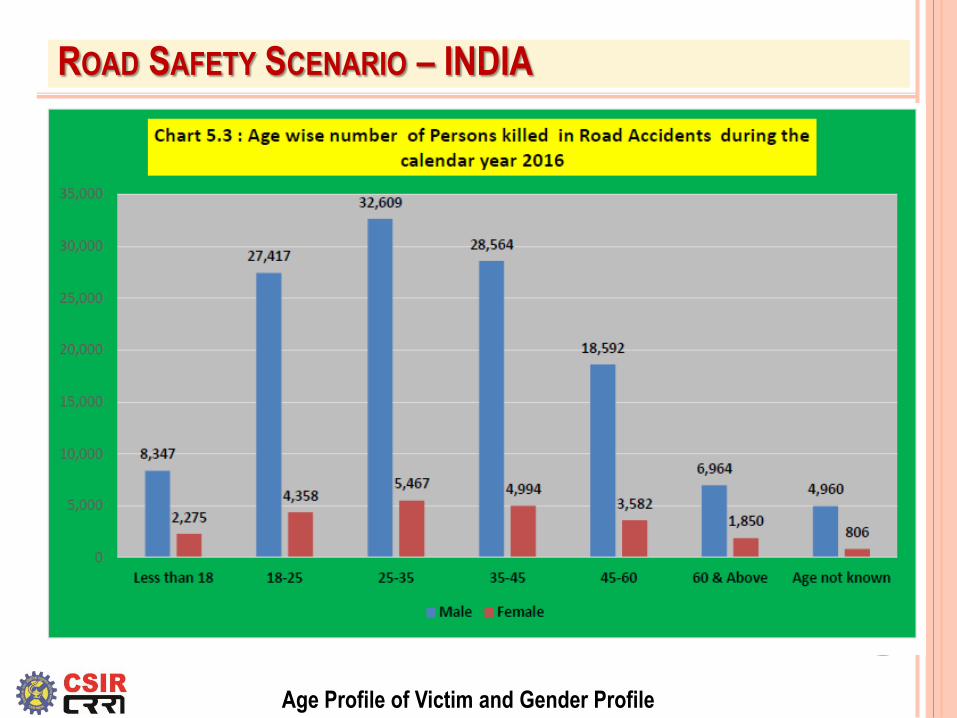
Age Profile of Victim and Gender Profile
ROAD SAFETY SCENARIO – INDIA
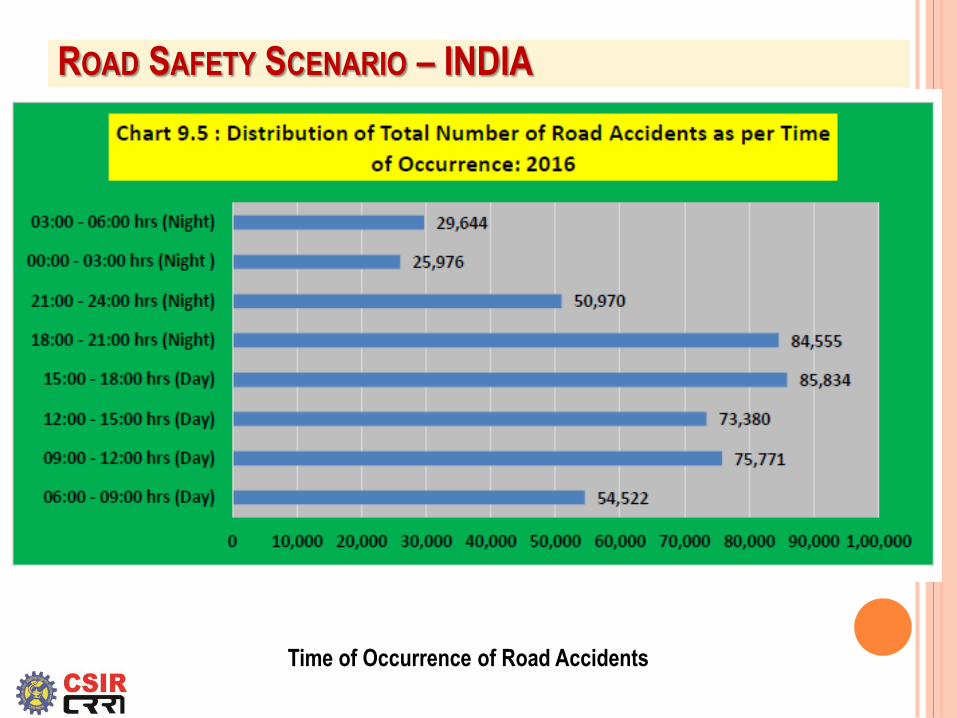
ROAD SAFETY SCENARIO – INDIA
Time of Occurrence of Road Accidents
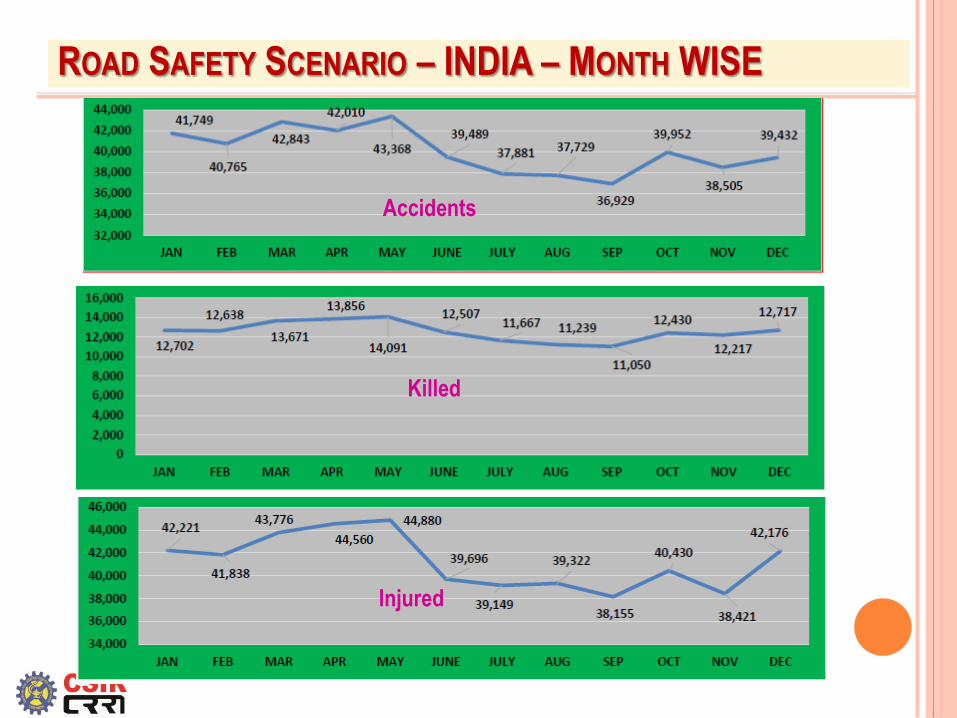
ROAD SAFETY SCENARIO – INDIA – MONTH WISE
Accidents
Killed
Injured
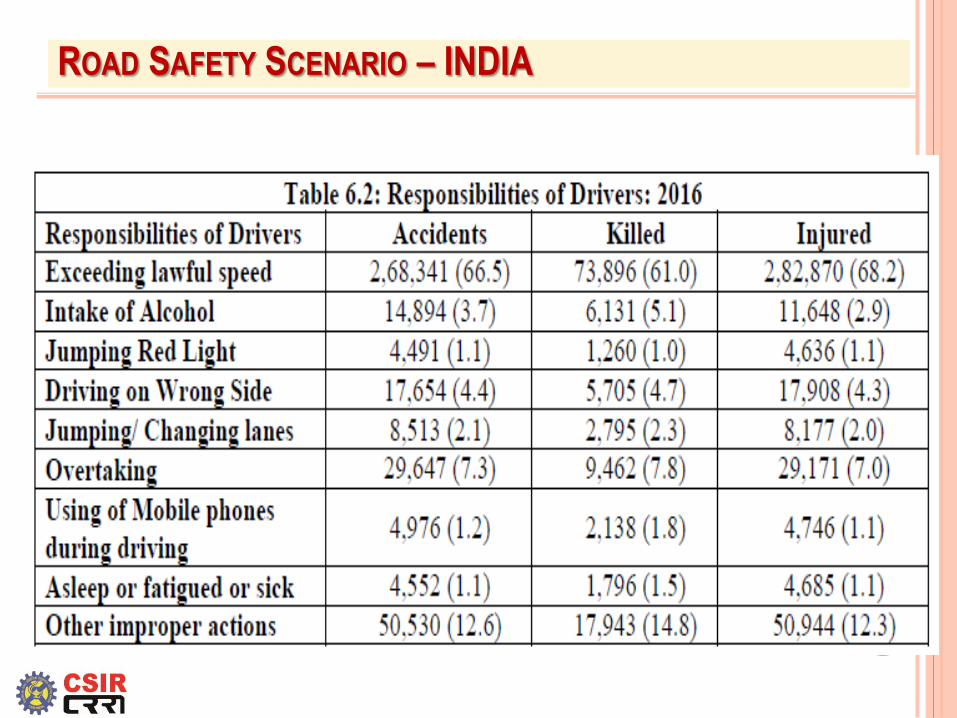
ROAD SAFETY SCENARIO – INDIA
Cause of Road Accidents
ROAD SAFETY SCENARIO -
Odisha ranked the 14th highest in the total number of road
accidents (10,532) in the country in 2016, with a share of 2.19
per cent. The number of road accidents in Odisha slightly
decreased from 11,825 in 2015 to 10,532 in2016.
Odisha ranked the 14th highest in the number of persons killed
in the country in 2016 accounting about 2.96% (42.4 Accident
Severity Index).
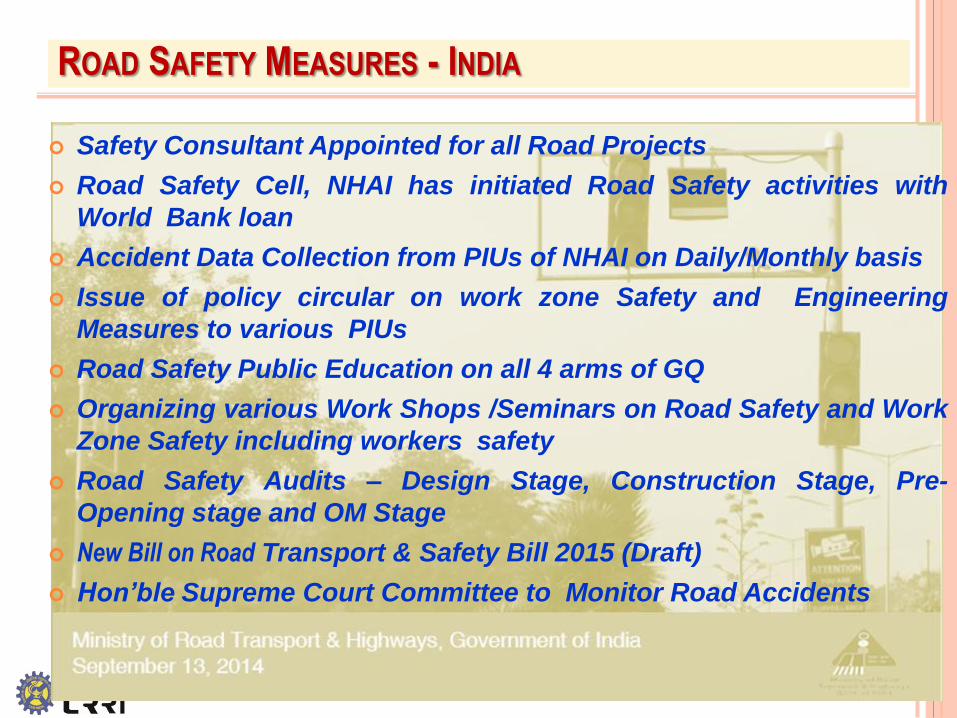
ROAD SAFETY MEASURES - INDIA
Safety Consultant Appointed for all Road Projects
Road Safety Cell, NHAI has initiated Road Safety activities with
World Bank loan
Accident Data Collection from PIUs of NHAI on Daily/Monthly basis
Issue of policy circular on work zone Safety and Engineering
Measures to various PIUs
Road Safety Public Education on all 4 arms of GQ
Organizing various Work Shops /Seminars on Road Safety and Work
Zone Safety including workers safety
Road Safety Audits – Design Stage, Construction Stage, Pre-
Opening stage and OM Stage
New Bill on Road Transport & Safety Bill 2015 (Draft)
Hon’ble Supreme Court Committee to Monitor Road Accidents
CONCLUSIONS
The pace of legislative change is too slow: increase
adoption of comprehensive laws.
Enforcement of strong road safety laws is essential for
success and should be coupled with public awareness.
Reducing road traffic deaths requires more consideration of
the needs of pedestrians, cyclists & motorcyclists.
Also need to make infrastructure safer, implement crash
testing standards, as well as improve post-crash care and road
safety databases.
CONCLUSIONS
Safety hazards as result of short falls in the compatibility of Road -
Vehicle –Road User Systems-
The Vehicle safety is improved recently with the advancement of Vehicle
Technology
Improvement in Road User skill and behavior can be achieved through
driver training and public education and enforcement campaigns.
Engineering safety of Roads can be enhanced through Roads Safety
Audits
Road Safety Action Plan- Conduct more problematic roads Road
Safety Audit, get acquit some engineers further to train some other
Engineers


