21
WP/13/264 Global Spillovers into Domestic Bond Markets in Emerging Market Economies Laura Jaramillo and Anke Weber

WP/13/264
Global Spillovers into Domestic Bond Markets
in Emerging Market Economies
Laura Jaramillo and Anke Weber

© 2013 International Monetary Fund WP/13/264
IMF Working Paper
Fiscal Affairs Department
Global Spillovers into Domestic Bond Markets in Emerging Market Economies*
Prepared by Laura Jaramillo and Anke Weber
Authorized for distribution by Julio Escolano
December 2013
Abstract
While fiscal conditions remain healthier than in advanced economies, emerging economies continue
to be exposed to negative spillovers if global conditions were to become less favorable. This paper
finds that domestic bond yields in emerging economies are heavily influenced by two international
factors: global risk appetite and global liquidity. Using a novel approach, the analysis goes on to show
that the vulnerability of emerging economies to these factors is not uniform but rather depends on
country specific characteristics, namely fiscal fundamentals, financial sector openness and the
external current account balance.
JEL Classification Numbers: E44, E62, G15, H63, O16.
Keywords: Bond Markets, Emerging Market Economies, Fiscal Deficit, Public Debt, Global
Spillovers
Author’s E-Mail Address:[email protected]; [email protected]
* We thank Carlo Cottarelli, Phil Gerson, Martine Guerguil and Andrea Schaechter for helpful comments and
discussions. We are grateful for comments by, Nina Budina, Carlos Caceres, Salvatore Dell’Erba, Anna Ivanova,
Manmohan Kumar, Tigran Poghosyan, Dominique Raelison, Daniel Rodriguez and Yan Sun. We would like to
thank the Economist Intelligence Unit and in particular Michael Schaeffer for providing data on market
expectations of fiscal variables, inflation and growth. Petra Dacheva and Raquel Gomez-Sirera provided excellent
research assistance. All remaining errors are our own.
This Working Paper should not be reported as representing the views of the IMF.
The views expressed in this Working Paper are those of the author(s) and do not necessarily
represent those of the IMF or IMF policy. Working Papers describe research in progress by
the author(s) and are published to elicit comments and to further debate.

2
Content page
Abstract ......................................................................................................................................1
I. Introduction ............................................................................................................................3
II. Literature Review ..................................................................................................................4
III. Recent Developments in Domestic Sovereign Bond Markets .............................................5
IV. Data and Methodology ........................................................................................................7 A. Data Sources .............................................................................................................7 B. Methodology .............................................................................................................8
V. Results and Policy Implications ..........................................................................................10
VI. Summary and Conclusions ................................................................................................14
Appendix ..................................................................................................................................15
References ................................................................................................................................18
Tables
1. Principal Component ...........................................................................................................11 2. Correlations with Common Factors .....................................................................................12 3. Determinants of 10-year Domestic Bond Yields in Emerging Economies .........................12
Figures
1. Primary Balance and Debt Stablizing Primary Balance, 2012 ..............................................3 2. Sovereign Domestic Bond Yields ..........................................................................................7 3. Sovereign Domestic Bond Yields and Global Risk Aversion ...............................................7
4. Sovereign Domestic Bond Yields and Global Liquidity .......................................................7 5. Sovereign Domestic Bond Yields by Region ........................................................................7
6. Emerging Economies: Global Factors, Fiscal Indicators, Financial Openness, and
External Current Account Deficit ................................................................................14
3
I. INTRODUCTION
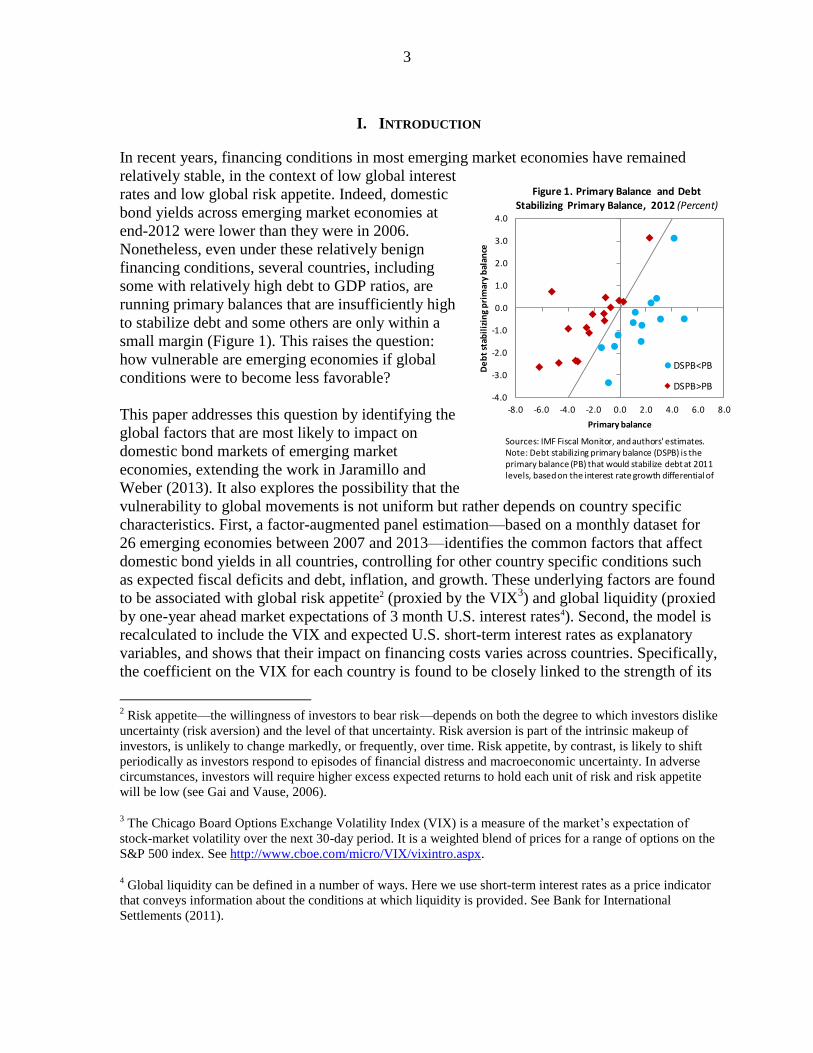
In recent years, financing conditions in most emerging market economies have remained
relatively stable, in the context of low global interest
rates and low global risk appetite. Indeed, domestic
bond yields across emerging market economies at
end-2012 were lower than they were in 2006.
Nonetheless, even under these relatively benign
financing conditions, several countries, including
some with relatively high debt to GDP ratios, are
running primary balances that are insufficiently high
to stabilize debt and some others are only within a
small margin (Figure 1). This raises the question:
how vulnerable are emerging economies if global
conditions were to become less favorable?
This paper addresses this question by identifying the
global factors that are most likely to impact on
domestic bond markets of emerging market
economies, extending the work in Jaramillo and
Weber (2013). It also explores the possibility that the
vulnerability to global movements is not uniform but rather depends on country specific
characteristics. First, a factor-augmented panel estimation—based on a monthly dataset for
26 emerging economies between 2007 and 2013—identifies the common factors that affect
domestic bond yields in all countries, controlling for other country specific conditions such
as expected fiscal deficits and debt, inflation, and growth. These underlying factors are found
to be associated with global risk appetite2 (proxied by the VIX3) and global liquidity (proxied
by one-year ahead market expectations of 3 month U.S. interest rates4). Second, the model is
recalculated to include the VIX and expected U.S. short-term interest rates as explanatory
variables, and shows that their impact on financing costs varies across countries. Specifically,
the coefficient on the VIX for each country is found to be closely linked to the strength of its
2 Risk appetite—the willingness of investors to bear risk—depends on both the degree to which investors dislike
uncertainty (risk aversion) and the level of that uncertainty. Risk aversion is part of the intrinsic makeup of
investors, is unlikely to change markedly, or frequently, over time. Risk appetite, by contrast, is likely to shift
periodically as investors respond to episodes of financial distress and macroeconomic uncertainty. In adverse
circumstances, investors will require higher excess expected returns to hold each unit of risk and risk appetite
will be low (see Gai and Vause, 2006).
3 The Chicago Board Options Exchange Volatility Index (VIX) is a measure of the market’s expectation of
stock-market volatility over the next 30-day period. It is a weighted blend of prices for a range of options on the
S&P 500 index. See http://www.cboe.com/micro/VIX/vixintro.aspx.
4 Global liquidity can be defined in a number of ways. Here we use short-term interest rates as a price indicator
that conveys information about the conditions at which liquidity is provided. See Bank for International
Settlements (2011).
-4.0
-3.0
-2.0
-1.0
0.0
1.0
2.0
3.0
4.0
-8.0 -6.0 -4.0 -2.0 0.0 2.0 4.0 6.0 8.0
De
bt
stab
iliz
ing
pri
mar
y b
alan
ce
Primary balance
Figure 1. Primary Balance and Debt Stabilizing Primary Balance, 2012 (Percent)
DSPB<PB
DSPB>PB
Sources: IMF Fiscal Monitor, and authors' estimates.Note: Debt stabilizing primary balance (DSPB) is the primary balance (PB) that would stabilize debt at 2011 levels, based on the interest rate growth differential of
4
fiscal position and financial sector openness, as countries with weaker fiscal fundamentals
and greater nonresident participation in their local bond markets would consequently be more
susceptible if global markets suddenly retreat to safe-havens. Meanwhile the global liquidity
coefficient for each country is found to be closely linked to its external current account
balance, as countries with greater public and private sector reliance on external financing
would be faced with a sudden shortfall in available resources if global liquidity conditions
tightened. To the best of our knowledge, this paper is the first one to apply a factor-
augmented panel estimation in this particular context, estimating emerging economy country
specific responses to global shocks.
The remainder of this paper is structured as follows. Section II reviews the existing literature
on the determinants of domestic bond yields in emerging markets. Section III discusses
recent developments in domestic sovereign bond markets. Section IV provides background
on the estimation methodology while Section V provides details on data and estimation
results. Section VI presents the main conclusions and policy implications.
II. LITERATURE REVIEW
In contrast to widespread studies on sovereign foreing currency spreads, few papers have
focused on emerging market domestic sovereign bonds, notwithstanding their growing
relevance as a source of government financing.56
Peiris (2010) conducts a panel analysis of
10 emerging market economies and finds that both domestic macro and global factors have a
significant influence on long-term local currency government bond yields in emerging
market economies, namely the fiscal balance, changes in policy interest rates, inflationary
expectations, and foreign participation in domestic bond markets. Baldacci and Kumar
(2010) estimate a panel of 31 advanced and emerging economies over the period 1980-2007
and find that higher deficits and public debt lead to a significant increase in long-term
interest rates, with the precise magnitude dependent on initial fiscal, institutional and other
structural conditions, as well as spillovers from global financial markets. Miyajima and
others (2012) show that domestic factors, including expectations of the short-term interest
rates and the fiscal balance, have tended to dictate the dynamics of the emerging market local
currency government yield.
Meanwhile, the effect of global factors on financing costs in emerging economies has
hitherto typically been analyzed within the context of the literature on the determinants of
sovereign foreign currency spreads. McGuire and Schrijvers (2003) find that global risk
5 Studies using sovereign foreign currency spreads are more widespread. Many empirical studies have focused
on the impact of domestic factors, including indicators of external vulnerability like external debt, debt service
or current account (Edwards, 1984; Cantor and Packer, 1996); fiscal variables, like fiscal debt and deficits
(Cantor and Packer, 1996; Rowland and Torres, 2004; Vargas, Gonzalez and Lozano, 2012) or their
composition (Akitoby and Stratmann, 2008); and other macroeconomic variables like inflation, the terms of
trade and the real exchange rate (Min, 1998).
6 See Mihaljek and others (2002), Bank for International Settlements (2007) and Burger and others (2010) for a
discussion of the development of domestic sovereign debt markets in emerging market economies.

5
appetite is a significant factor driving spreads, while Eichengreen and Mody (2000) and
Bellas and others (2010) show that changes in market sentiment affect spreads. Gonzales-
Rosada and Levy-Yeyati (2008) find that in addition to global risk appetite, global liquidity
plays a central role. Hartelius and others (2008) and Dailami and others (2008) provide
similar results when looking at U.S. interest rates. Longstaff and others (2011) look at CDS
spreads in 26 advanced and developing countries and find that the majority of sovereign
credit risk can be linked U.S. stock market returns and the VIX index. Pan and Singleton
(2008) also document a similar strong relation between CDS spreads and the VIX index for
Turkey, Korea and Mexico. For domestic bond yields, Baldacci and Kumar (2010) find that
in periods of financial distress—defined as periods of high levels of the VIX index, high
inflationary pressures, and more adverse global liquidity conditions—fiscal deterioration has
a larger impact on bond yields. Jaramillo and Weber (2013) show that, when global risk
appetite is low, domestic bond yields are mostly influenced by inflation and real GDP growth
expectations, suggesting that, in tranquil times, markets focus more prominently on risk
stemming from sensitivity to macroeconomic shocks. However, when global risk appetite is
high, creditors’ concern with default risk takes center stage and expectations regarding fiscal
deficits and government debt play a significant role in determining domestic bond yields.
The paper more closely related to our work but focusing on advanced rather than emerging
economies is Dell’Erba and Sola (2011). Dell’Erba and Sola (2011) estimate the effect of
fiscal policy on long-term interest rates for a panel of 17 OECD countries. They investigate
the determinants of long-term bond yields within a factor augmented panel to control for the
presence of unobserved common factors. They find that two global factors (the global
monetary and fiscal policy stances) explain more than 60 percent of the variance in long-term
interest rates. Moreover, they go on to show that large economies and economies
characterized by low financial integration and current account deficits are less prone to the
propagation of those common shocks.7
III. RECENT DEVELOPMENTS IN DOMESTIC SOVEREIGN BOND MARKETS
In recent years, sovereign domestic bond yields remained relatively stable for the median
emerging economy. Though domestic sovereign bond yields increased in the aftermath of the
Lehman collapse, by 2011 bond yields had fallen below their 2006 levels (Figure 2).
However, this masks considerable volatility for a number of countries. Figure 2 also shows
the distribution of bond yields across emerging economies. The financial crisis brought a
considerable amount of differentiation across countries, with interest rates jumping to double
digits in some cases. While this differentiation has since narrowed, the distance between
countries did not return to its pre-crisis margin, suggesting greater market discrimination
across emerging market countries.
7 Sgherri and Zoli (2009), McGuire and Schrijvers (2003), and Longstaff (2011) have used common factor
analysis to explain sovereign spread movements in advanced and emerging market economies.

6
Part of this greater
differentiation appears
to be linked to global
factors, in particular
international investors’
appetite for risk and
expectations about
global liquidity. In
recent years, the
standard deviation
across domestic bond
yields in emerging
economies has
increased with upward
movements in global
risk appetite, as proxied
by the VIX (Figure 3).8
Similarly, global liquidity, proxied by one-year ahead market expectations of 3 month U.S.
interest rates, also appears to be playing a role (Figure 4). Although in some cases
nonresident holdings of government debt are relatively small (for example China and India),
private investors from emerging market economies are increasingly putting their funds in
overseas assets (Karolyi and others, 2013), therefore global liquidity and risk appetite would
affect residents’ decisions to invest abroad to the extent that they impact their risk-return
tradeoff.
Furthermore, sovereign
bond yields have not
behaved uniformily
across different
regions, as shown in
Figure 5. European
emerging market
economies showed
much larger changes in
sovereign bond yields
since the onset of the
global financial crisis
compared to other
emerging market
economies. In
constrast, bond yields
8 The VIX has been traditionally used in the literature as measure of global risk appetite. See for example
McGuire and Schrijvers (2003) , IMF (2004), Gonzales-Rozada and Levy-Yeyati (2008), Hartelius and others
(2008), Bellas and others (2010), Baldacci and Kumar (2010), and Longstaff and others (2011).
0
10
20
30
40
50
60
70
0
1
2
3
4
5
6
Mar-07 Mar-08 Mar-09 Mar-10 Mar-11 Mar-12 Mar-13
Figure 3. Sovereign Domestic Bond Yields and Global Risk Appetite
10-year domestic bond yield, standard deviation across sample (percent, left axis)
VIX index (right axis)
-2
-1
0
1
2
3
4
5
6
7
8
0
1
2
3
4
5
6
7
Mar-07 Mar-08 Mar-09 Mar-10 Mar-11 Mar-12 Mar-13
Figure 4. Sovereign Domestic Bond Yields and Global Liquidity
10-year domestic bond yield, standard deviation across sample (percent, left axis)
Expectations of 3 month U.S. interest rates
Sources: Bloomberg L.P., Haver Analytics, International Financial Statistics, and authors' calculations.
Sources: Bloomberg L.P., Consensus Forecast, Haver Analytics, International Financial Statistics, and authors' calculations.
1/ Market expectations of one-year ahead real GDP growth in large advanced economies.
2
4
6
8
10
12
14
16
18
Mar-07 Mar-08 Mar-09 Mar-10 Mar-11 Mar-12 Mar-13
Figure 2. Sovereign Domestic Bond Yields (Percent)
Median
Sources: Bloomberg, Haver Analytics, International Finance Statistics, and authors' calculations.Note: Yellow shading represents 10-90th percentile
of the distribution of domestic bond yields in emerging market economies.
0
50
100
150
200
250
300
Mar-07 Mar-08 Mar-09 Mar-10 Mar-11 Mar-12 Mar-13
Figure 5. Sovereign Domestic Bond Yields by Region (Index, Jan 2006=100)
Emerging Europe
Latin America
Emerging Asia
Sources: Bloomberg, Haver Analytics, International Finance Statistics, and authors' calculations.Note: Lines represent the median across countries in
each region.
0
10
20
30
40
50
60
70
0
1
2
3
4
5
6
Mar-07 Mar-08 Mar-09 Mar-10 Mar-11 Mar-12 Mar-13
Figure 3. Sovereign Domestic Bond Yields and Global Risk Appetite
10-year domestic bond yield, standard deviation across sample (percent, left axis)
VIX index (right axis)
-2
-1
0
1
2
3
4
5
6
7
8
0
1
2
3
4
5
6
7
Mar-07 Mar-08 Mar-09 Mar-10 Mar-11 Mar-12 Mar-13
Figure 4. Sovereign Domestic Bond Yields and Global Liquidity
10-year domestic bond yield, standard deviation across sample (percent, left axis)
Expectations of 3 month U.S. interest rates
Sources: Bloomberg L.P., Haver Analytics, International Financial Statistics, and authors' calculations.
Sources: Bloomberg L.P., Consensus Forecast, Haver Analytics, International Financial Statistics, and authors' calculations.
1/ Market expectations of one-year ahead real GDP growth in large advanced economies.
2
4
6
8
10
12
14
16
18
Mar-07 Mar-08 Mar-09 Mar-10 Mar-11 Mar-12 Mar-13
Figure 2. Sovereign Domestic Bond Yields (Percent)
Median
Sources: Bloomberg, Haver Analytics, International Finance Statistics, and authors' calculations.Note: Yellow shading represents 10-90th percentile
of the distribution of domestic bond yields in emerging market economies.
0
50
100
150
200
250
300
Mar-07 Mar-08 Mar-09 Mar-10 Mar-11 Mar-12 Mar-13
Figure 5. Sovereign Domestic Bond Yields by Region (Index, Jan 2006=100)
Emerging Europe
Latin America
Emerging Asia
Sources: Bloomberg, Haver Analytics, International Finance Statistics, and authors' calculations.Note: Lines represent the median across countries in
each region.

7
for emerging markets in Asia remained relatively more stable over the same period. This
suggests that particular characteristics of these economies may have increased or decreased
their vulnerability to external shocks.
IV. DATA AND METHODOLOGY
A. Data Sources
We construct a panel dataset of monthly observations for 26 emerging economies between
January 2005 and July 2013. This dataset was originally developed by Jaramillo and Weber
(2013). The novelty is that this dataset contains one-year ahead market expectations for
annual inflation, real GDP growth, the fiscal balance to GDP ratio, and public debt to GDP
ratio, whose source is the Economic Intelligence Unit (EIU). The forecasts provided by the
EIU are produced by in-house analysts who employ spreadsheet-based models, using a
framework that is carefully customized for each individual economy and structured to ensure
internal consistency. Forecasts are provided for the current year as well as one to five years
ahead, and are updated once a month.9
The dataset also includes long-term (typically 10-year) domestic bond yields, the domestic
Treasury bill rate and money market rates obtained from Bloomberg, Haver, and
International Financial Statistics. To capture global liquidity conditions, the one-year ahead
market expectations of 3-month U.S. interest rates is included, obtained from Consensus
Forecast. The VIX is used as a proxy for global risk appetite, obtained from Bloomberg.
Additional market expectations of growth, inflation, and budget deficits, obtained from
Consensus Economics, were used when performing the robustness checks, though the fiscal
data are only available for a small group of countries. The Appendix provides more details on
data sources by country.
The criterion that determined the inclusion of countries in the panel was data availability of
long-term domestic bond yields and the one-year ahead expectations of public debt to GDP.
Data on long-term domestic bond yields are only available over a long enough time span for
a selected number of emerging economies. We decided only to include countries for which at
least data for 12 months without gaps on long-term domestic bond-yields were available.
This was the case for 26 emerging market economies. As shown in the Appendix, the data
coverage for the countries in our sample differs. For some of those countries, data on these
variables since 2005 are available. For others, observations only start in 2008 or 2009. For a
number of countries, several sources for long-term bond yields were available. In these cases,
we checked consistency of data across these different sources. Data on the one-year ahead
expectations of public debt to GDP from EIU are only available from March 2007.
9 For example, in January 2005, the EIU would provide a forecast for annual inflation in 2006. This would then
be updated in February 2005, March 2005 and each consecutive month until December 2005. All twelve
monthly forecasts made in 2005 for annual inflation in 2006 will be included in our estimations as measuring
the expected inflation in t+1.

8
B. Methodology
We follow Dell’Erba and Sola (2011) and Giannone and Lenza (2008) in their approaches
and estimate a factor augmented panel that allows for heterogeneous effects of common
factors across countries. The factor-augmented panel estimation—based on a monthly dataset
for 26 emerging economies between March 2007 and July 2013—first identifies the common
factors that affect domestic bond yields in all countries, controlling for other country specific
conditions such as expected fiscal deficits and debt to GDP ratios, inflation, and real GDP
growth. Second, we analyze which variables are associated with those common factors.
Third, the model is recalculated to include those variables that are closely associated with the
common factors as explanatory variables, and allows their impact on domestic bond yields to
vary across countries. This section will first outline the basic model that has traditionally
been use to investigate domestic bond yields and then specify how it is extended to a factor
augmented panel.
The standard econometric specification
The standard methodology used for advanced economies (see for example, Reinhart and
Sack, 2000), estimates the following fixed effects panel data model:
(1)
where denotes nominal yields on the long term domestic bond yields for country i
( ) and is a vector of explanatory variables, which includes
macroeconomic and fiscal variables for ( ).
Some heterogeneity between countries is allowed by introducing time-invariant country
characteristics in the form of fixed effects ( . There are many institutional peculiarities in
domestic bond markets that are country specific. For example, financial markets in emerging
economies are still developing in many cases, which could affect the overall liquidity of the
bond market (e.g. market size, turnover). Also, financial repression has been experienced in
the past in some countries, helping to keep interest rates low. It is expected that fixed effects
would control for these institutional issues, in particular given the relatively short and recent
time frame discussed in the paper and the gradual process that is typically involved in
institutional change.
In choosing which explanatory variables to use in the estimation of equation (1), we follow
the literature on domestic bond yields in advanced economies that has typically included
fiscal variables (public debt and the fiscal deficit to GDP) as well as real GDP growth and
inflation as explanatory variables. Following Laubach (2009), and in order to avoid potential
endogeneity issues, we use market expectations of the fiscal variables, real GDP growth and
inflation.10 We also include a measure of the short-term nominal interest rate to control for
10
We follow the recent literature (e.g. Laubach, 2009) and include expectations of both the fiscal deficit and
public debt. It should be noted that due to stock flow adjustments there can be significant differences between
the change in the public debt and the fiscal deficit. Stock flow adjustments, which arise for different reasons
(continued…)

9
the effects of monetary policy on the term structure.
Estimating a Factor-Augmented Panel
One potential shortcoming of the above specification is that it is likely that in open and
integrated economies, and are influenced by the same common shocks such as business
cycle fluctuations. This would give rise to so-called cross sectional dependence, which
implies that the error terms are correlated across countries since the units of observations are
simultaneously affected by common but unobserved factors. Such cross-sectional
dependence leads to inefficient estimates and the literature has identified several methods to
correct for it (Pesaran, 2004, 2006). These include using so-called common correlated effects
estimators (Pesaran, 2006) or a factor augmented panel, which extracts principal comments
from observable variables and then explicitly includes those global factors into the
regressions (Giannone and Lenza, 2008). In this paper, we decided to use the latter
methodology since this allows us to focus on the underlying global factors and match them to
actual variables, whose impact on different emerging economies can then be investigated.
Following Dell’Erba and Sola (2011), we can impose the following factor structure:
(2)
Equation (2) specifies that the observable variables, and are a combination of k
unobservable global factors and an idiosyncratic component, which is unaffected by global
shocks.
Ideally, we would like to estimate equation (1) with the idiosyncratic components only:
(3)
However, since the common shocks are unobserved, this implies that the idiosyncratic
components are also not directly observable. Using (2) we can rewrite equation (3) in terms
of observable quantities and global factors:
(4)
Equation (4) now takes explicitly account the common factors and if they can be consistently
estimated, then (4) can be estimated by standard panel techniques (Dell’Erba and Sola,
2011). In order to obtain consistent estimates of the unobservable factors, a principal
components technique is used following Giannone and Lenza (2008) and Dell’Erba and
including valuation effects, have been found to be the largest source of major debt increases in emerging
economies over the past three decades (Weber, 2012).

10
Sola (2011).
The principal components analysis (PCA) involves collecting all dependent and independent
variables for each country in a matrix, P, which will then have the dimension T*(N(m+1))
where N denotes the number of countries included in the estimation, T denotes the number of
time series observations, and m the number of explanatory variables, which include the fiscal
variables. The PCA extracts the eigenvectors of this matrix obtained from the eigenvalue-
eigenvector decomposition of the covariance matrix of P. The eigenvectors are linear
combinations of the columns of P and if the common factors are pervasive whereas
idiosyncratic shocks are not, they are consistent estimates of the set of common factors (for
more details on this see Dell’Erba and Sola, 2011). Given the dimensions of P, there are
N(m+1) eigenvectors. We will not use all of them in our estimations, but keep as many
common factors as are needed to ensure that we can explain at least 60 percent of the panel
variance. This ensures that we choose those factors which explain most of the correlations
among our data.
We can then rewrite (4) as follows:
(5)
Where q denotes the number of factors that are included to ensure that at least 60 percent of
the panel variance is explained by the common factors. While this specification allows for
heterogeneous effects of common factors cross countries, it assumes that the coefficient is
the same for all countries, in order to ensure consistency with previous studies and also limit
the number of coefficients that have to be estimated.
Our estimation strategy in this paper is to match those common factors that explain most of
the panel variance to actual variables, include those in the specification outlined in equation
(5) instead of the common factors and then to analyze whether the effects of those global
shocks on long-term interest rates are the same across emerging economies. This is followed
by a correlation analysis of which domestic factors could explain possible differences across
countries.
V. RESULTS AND POLICY IMPLICATIONS
The principal components analysis suggests that movements in sovereign bond yields in
emerging market economies are driven largely by two underlying common factors
(Table 1).11 The first two eigenvectors explain 66 percent of the panel variance. A scree plot
of eigenvalues suggests either 2 or 4 factors due to the way the slope levels off twice
(Figure 6).12 We choose to retain two factors in order to balance parsimony (a model with
11
The principal components analysis is performed using STATA. STATA uses an orthogonal rotation method
as the default option.

11
few factors) with plausibility (explaining most of the variability in the variables). The reason
for not including more factors is that we want to limit the number of coefficients that have to
be estimated.
Figure 6. Screen plot of Eigenvalues after the Principal Components Analysis
Table 1. Principal Components
1st 2nd ` 4th 5th
Marginal 0.44 0.22 0.14 0.05 0.03 Cumulative 0.44 0.66 0.80 0.86 0.89
Note: The table reports the marginal and cumulative proportions of the explained variance by the first 5 principal
components.
In order to find an economically meaningful interpretation of the two common factors, the
paper analyzes the simple correlation between each common factor and variables that reflect
global trends, with particular focus on series that capture developments in the global
economy and changes in the willingness of investors to incur risk. While it is impossible to
identify precisely what the common factors represent, this exercise proves useful in
determining which global trends tend to be the most important. The expected 3-month
interest rates in the U.S., the Federal funds rate, and expected 10-year U.S. bond yield, are
used as measures of global liquidity. The VIX, the BBB corporate spread, and the high-yield
spread are used as measures of investor risk tolerance. Table 2 shows that the common
factors are significantly correlated with several of these variables. This result is driven both
by the high correlation between many of these variables themselves and by the fact that the
common factor, by construction, represents a mixture of all common forces driving emerging
market sovereign yields. Overall, the analysis indicates clear correlation between the first
common factor and global liquidity (as measured by market expectations of 3 month US
interest rates), and also a strong correlation between the second common factor and the VIX.
12
The Kaiser criterion, which drops all factors with an eigenvalue of less than one, would have resulted in 8
common factors. However, we do not follow this criterion here since it tends to overextract factors (Bandalos
and others, 2008). Indeed, there is a consensus in the literature that it is one of the least accurate methods for
selecting the number of factors to retain (Velicer and Jackson, 1990).
0
10
20
30
40
50
1 2 3 4 5 6 7 8 9 10
Eige
nva
lue

12
To note, global liquidity and global risk appetite are also likely to be interrelated through
different leads and lags. Short-term interest rates could react to movements in equity prices
reflecting the expected endogenous response of monetary policy to the impact of stock price
movements on aggregate demand (Rigobon and Sack, 2003). Similarly, a change in short-
term interest rates could impact the VIX through changes in the aggregate balance sheet of
the financial intermediaries (Shin and Adrian, 2010).
Table 2. Correlations with Common Factors
Common factor 1
Common factor 2
Measures of global liquidity
Expected U.S. 3 month interest rate 0.78 -0.31
Federal funds rate 0.74 -0.31
Expected U.S 10-year bond yield 0.51 -0.37
Measures of global risk appetite
VIX -0.06 0.84
BBB corporate spread -0.02 0.84
High-yield spread -0.18 0.83
Sources: Bloomberg L.P., Haver Analytics, Consensus Forecasts and authors' estimates.
The model is then estimated first without the common factors as in column 1 and then
including the VIX and the expected U.S. short-term interest rate as additional explanatory
variables in column 2 (as in equation 5). The results are shown in Table 3:
Table 3. Determinants of 10-year Domestic Bond Yields
in Emerging Economies
[1] [2]
Expected gross debt t+1 (percent of GDP) 0.05 *** 0.04 ***
(0.01) (0.01)
Expected overall balance t+1 (percent of GDP) -0.27 *** -0.38 ***
(0.03) (0.03)
Expected inflation rate t+1 (percent) 0.01
0.07 **
(0.02) (0.03)
Expected real GDP growth rate t+1 (percent) 0.00
0.02 (0.03) (0.03)
Domestic Treasury bill rate (percent) 0.71 *** 0.71 ***
(0.02) (0.02)
Constant 0.05
0.10
(0.3)
(0.37)
Number of observations 1066 1066
R2 0.75 0.77
Number of countries Factors
24 No
24 Yes
Note: Robust standard errors in parentheses.
*** p<0.01, ** p<0.05, * p<0.1.

13
The results show that fiscal variables are important determinants of bond yields. The
coefficients on the expected debt and fiscal balance are in line with previous studies. An
increase in the expected fiscal deficit of 1 percent of GDP pushes up nominal bond yields by
about 27 to 38 basis points, depending on the specification used. This is of a similar
magnitude as in Miyajima and others (2012). It is also within the range of findings of the
literature on advanced economies (where the estimated impact of a change of one percent of
GDP in the fiscal deficit on interest rates ranges from 10 to 60 basis points (Laubach, 2009)).
An increase in the one-year-ahead expected gross public debt-to-GDP ratio of 1 percentage
point increases nominal yields by 4-5 basis points, in line with Baldacci and Kumar (2010)
and in the upper range of estimates found in previous studies for advanced economies (where
the estimated impact of a change of one percent of GDP in the debt ratio on interest rates
ranges from 1 to 8 basis points (Haugh and others, 2009). While growth and inflation take a
backseat in the first specification, once we include the factors and therefore correct for cross-
sectional dependence, which could lead to inefficient estimates, inflation becomes
significant. Higher inflation is found to increase bond yields, in line with the previous
literature (Baldacci and Kumar, 2010). Domestic growth is still not a significant determinant
of bond yields in the second specification.
The second specification also produces estimates of the impact of the VIX and the expected
U.S. short-term interest rate on financing costs for each of the countries included in the
estimation. Coefficients vary significantly across countries. For illustrative purposes, we
grouped countries into three regions: Latin America, Europe and Asia and investigated how
these coefficients are linked with country specific conditions such as financial openness
(measured by the Chinn and Ito (2006) index, which is now available for 2011), the strength
of countries fiscal position (measured by the fiscal stress index developed by Baldacci and
others, 2011) and external current account positions. Figure 7 plots the median coefficient by
region against the median value of different country conditions that could be relevant in the
transmission of global shocks on domestic bond yields.
Figure 7 illustrates that the coefficient on the VIX for each country is found to be closely
linked to the strength of its fiscal position (as measured by the fiscal stress index) and
financial sector openness. This suggests that countries with weaker fiscal fundamentals
(including debt, deficits, and gross financing needs) and greater nonresident participation in
their local bond markets would consequently be more susceptible to an increase in domestic
bond yields if a sudden increase in global risk appetite triggered a retreat of investors to safe-
havens. Meanwhile the global liquidity coefficient for each country is found to be closely
linked to its external current account deficit to GDP, as countries with greater public and
private sector reliance on external financing would be faced with a sudden shortfall in
available resources if global liquidity conditions tightened. These findings are in line with
those of IMF (2013), in the context of emerging market economies’ resilience to capital
inflow fluctuations. This study shows that the more resilient emerging market economies
have more countercyclical fiscal policy (which would imply a stronger initial fiscal position)
and more stable current accounts, although capital account openness is not found to be
meaningful.

14
Figure 7. Emerging Economies: Global Factors, Fiscal Indicators, Financial Openness, and External Current Account Deficit
Source: Baldacci and others (2011), Chinn and Ito (2006), Bloomberg L.P., Consensus Forecast, World Economic Outlook, and authors’ estimates. Note: Bars represent median across countries in each region. 1
Fiscal stress index as measures by Baldacci and others (2011), standardized. Higher values indicate greater fiscal risk. 2 Financial openness index as measured by Chinn and Ito for 2011, standardized. A higher value indicates
greater capital account openness.
VI. SUMMARY AND CONCLUSIONS
The present paper extends Jaramillo and Weber (2013) to shed further light on the
determinants of domestic bond yields in emerging markets, and the vulnerability of these
economies to global shocks. This paper finds that domestic bond yields in emerging
economies are heavily influenced by two international factors: global risk appetite and global
liquidity. Using a novel approach, the analysis goes on to show that the vulnerability of
emerging economies to these factors is not uniform but rather depends on country specific
characteristics, namely fiscal fundamentals, financial sector openness and the external current
account balance.
These findings suggest that financing conditions in emerging economies could deteriorate
rapidly if global conditions weaken. Risks are especially high for financially more open
countries with weak fiscal positions and sizeable current account deficits. These results
underscore that countries should maintain a strong fiscal position to reduce their vulnerability
to global shocks. In some countries, a stronger fiscal balance would also help reduce external
deficits, which in turn would also improve their resilience to shifts in external conditions. For
financially more open countries, key instruments to reduce vulnerability to external shocks
include stronger regulatory oversight and macroprudential policies.
-3
-2
-1
0
1
2
3
-0.4
-0.2
0.0
0.2
0.4
LAC Europe Asia
VIX coefficient (left axis)
Fiscal stress index 1/
Financial openness index 2/
-4
-2
0
2
4
6
-0.4
-0.2
0.0
0.2
0.4
0.6
LAC Europe Asia
Global liquidity coefficient (left axis)
External current account deficit to GDP

15
APPENDIX
A. Data Sources and Differences in Coverage by Country
Table A.1. Overview of Data Sources
Description Sample Frequency Source
Long-term (typically 10-year) nominal domestic bond yield (in percent)
Varies by country, see below
Monthly Bloomberg, Haver, International Financial Statistics (IFS)
Interest Rate on Treasury Bills (in percent)
Varies by country, see below
Monthly Bloomberg, Haver, IFS
Money Market Rate (in percent)
2005M1-2013M07
Monthly IFS, Datastream (Hungary, Vietnam)
Forecasts of inflation (one year ahead) (in percent)
2005M1-2013M07 Monthly Economist Intelligence Unit (EIU)
Forecasts of real GDP growth rate (in percent)
2005M12013M07 Monthly EIU
Forecasts of public debt (in percent of GDP)
2007M3-2013M07 (for most countries)
Monthly EIU
Forecasts of fiscal balance (in percent of GDP)
2005M1-2013M07 (for most countries)
Monthly EIU
Expected U.S. 3-month interest rate
2005M1-2013M07 Monthly EIU
Expected U.S. 10 year nominal bond yield
2005M1-2013M07 Monthly EIU
VIX 2005M1-2013M07 Monthly Bloomberg
Forecasts of inflation (one year ahead) (in percent)
2005M1-2013M07 Monthly Consensus Economics
Forecasts of real GDP growth rate (in percent)
2005M1-2013M07 Monthly Consensus Economics
Forecasts of overall fiscal deficit (in percent of GDP)
2007M1-2013M07 (for most countries)
Monthly Consensus Economics

16
Table A.2 Data Sources for Domestic Long Term Bond Yields
Country Descriptor Start Date*
Gaps ** Source
Brazil 10 year 2007M1 yes Bloomberg
Bulgaria 10 year 2005M1 no Haver
Chile 10 year 2005M1 yes Haver
China 10 year 2006M4 no Bloomberg
Colombia 10 year 2009M12 no Bloomberg
Estonia 10 year 2005M1 no IFS
Hungary 10 year 2005M1 no Bloomberg
India 10 year 2005M1 no Bloomberg
Indonesia 10 year 2005M1 no Bloomberg
Latvia 10 year 2005M1 no IFS
Lithuania 10 year 2005M1 no IFS
Malaysia 10 year 2005M7 no Bloomberg
Mexico 10 year 2005M9 yes Bloomberg
Pakistan 10 year 2005M1 no Bloomberg
Peru 10 year 2007M12 no Bloomberg
Philippines 10 year 2005M1 no Bloomberg
Poland 10 year 2005M1 no Bloomberg
Romania 10 year 2005M4 no IFS
Russia 10 year 2005M3 no Haver
South Africa
10 year 2005M1 no Bloomberg
Sri Lanka 10 year 2008M5 no Bloomberg
Thailand 10 year 2005M1 no Bloomberg
Turkey 10 year 2010M1 no Bloomberg
Ukraine 8 year 2008M7 yes Bloomberg
Venezuela 10 year 2005M1 yes IFS
Vietnam 10 year 2006M7 no Bloomberg
*This is the start date in our dataset not the beginning of data availability ** This indicates that there are gaps in the data between the start date and July 2013.

17
Table A.3 Treasury Bill Rates
Country Start Date* Gaps ** Source
Brazil 2005M1 no IFS
Bulgaria 2005M1 yes IFS
Chile 2005M1 yes Haver
China No observations
Colombia 2005M1 no Bloomberg
Estonia No observations
Hungary 2005M1 no Bloomberg
India 2005M1 no Bloomberg
Indonesia 2005M1 yes Bloomberg
Latvia 2005M1 yes IFS
Lithuania 2005M1 yes IFS
Malaysia 2005M6 no Bloomberg
Mexico 2005M1 no Bloomberg
Pakistan 2005M1 no Bloomberg
Peru 2007M12 yes Bloomberg
Philippines 2005M1 no Bloomberg
Poland 2005M1 no Bloomberg
Romania 2005M1 yes IFS
Russia No observations
South Africa 2005M1 no Haver
Sri Lanka 2005M1 no IFS
Thailand 2005M1 no Bloomberg
Turkey 2007M7 yes Bloomberg
Ukraine 2010M3 no Bloomberg
Venezuela No observations
Vietnam 2006M7 no Bloomberg
*This is the start date in our dataset not the beginning of data availability ** This indicates that there are gaps in the data between the start and July 2013.

18
REFERENCES
Akitobi, B. and T. Stratmann, 2008, “Fiscal Policy and Financial Markets,” The Economic
Journal, Vol. 118, pp. 1971–85.
Baldacci E. and M. Kumar, 2010, “Fiscal Deficits, Public Debt, and Sovereign Bond Yields,”
IMF Working Paper 10/184 (Washington: International Monetary Fund).
Baldacci, E., I. Petrova, N. Belhocine, G. Dobrescu, and S. Mazraani, 2011, “Assessing
Fiscal Stress,” IMF Working Paper No. 11/100.
Bandalos, D.L. and M.R. Boehm-Kaufman, 2008, “Four Common Misconceptions in
Exploratory Factor Analysis”, in Lance, Charles E.; Vandenberg, Robert J. Statistical
and Methodological Myths and Urban Legends: Doctrine, Verity and Fable in the
Organizational and Social Sciences. Taylor & Francis. pp. 61–87.
Bank for International Settlements, 2007, “Financial Stability and Local Currency Bond
Markets,” Committee on the Global Financial System Papers No. 28, June.
Bank for International Settlements, 2011, “Global liquidity – Concept, Measurement and
Policy Implications”, CGFS Papers No 45, November.
Bellas, D., M. Papaioannou, and I. Petrova, 2010, “Determinants of Emerging Market
Sovereign Bond Spreads: Fundamentals Vs. Financial Stress,” IMF Working Paper
No. 10/281 (Washington: International Monetary Fund).
Burger, J., F. E. Warnock, and V. Cacdac Warnock, 2010, “Emerging Local Currency Bond
Markets,” NBER Working Paper No. 16249.
Cantor, R. and F. Packer, 1996, “Determinants and Impact of Sovereign Credit Ratings”,
FRBNY Economic Policy Review, October.
Chinn, M. D. and H. Ito, 2006,"What Matters for Financial Development? Capital Controls,
Institutions, and Interactions," Journal of Development Economics, Volume 81, Issue
1(October), pp. 163-192 .
Dailami, M., P. R. Masson, and J.J. Padou, 2008, “Global Monetary Conditions Versus
Country-Specific Factors in the Determination of Emerging Market Debt,” Journal of
International Money and Finance, Vol. 27, pp. 1325–36.
Dell’Erba, S. and S. Sola, 2011, “Fiscal Policy, Interest Rates and Risk Premia in Open
Economy”, Graduate Institute of International and Development Studies Working
Paper 05/2013 (Geneva: The Graduate Institute).
Edwards, S., 1984, “LDC's Foreign Borrowing and Default Risk: An Empirical Investigation
1976—80,” NBER Working Paper No. 1172.

19
Eichengreen, B. and A. Mody, 2000, “What Explains Changing Spreads on Emerging Market
Debt?”, in Capital Flows and the Emerging Economies: Theory, Evidence, and
Controversies, edited by S. Edwards, University of Chicago Press.
Gai, P. and N. Vause, 2006, “Measuring Investors’ Risk Appetite,” International Journal of
Central Banking, Vol. 2 No. 1, (March).
Giannone, D. and M. Lenza, 2008, “The Feldstein-Horioka Fact,” ECB Working Paper
Series, WP 873 (Frankfurt: European Central Bank).
Gonzalez-Rozada, M. and E. Levy-Yeyati, 2008, “Global Factors And Emerging Market
Spreads,” The Economic Journal, Vol. 118 (November), pp. 1917–1936.
Hartelius, K., K. Kashiwase, and L. Kodres (2008), “Emerging Market Spread
Compression:Is it Real or is it Liquidity?”, IMF Working Paper No. 08/10
(Washington: International Monetary Fund).
Haugh, D., P. Ollivaud, and D. Turner, 2009, “What Drives Sovereign Risk Premiums? An
Analysis of Recent Evidence from the Euro Area,” OECD Economics Department
Working Papers No. 718.
International Monetary Fund, 2004, Global Financial Stability Report: Market Developments
and Issues, April, (Washington).
International Monetary Fund, 2013, “The Yin and Yang of Capital Flow Management:
Balancing Capital Inflows with Capital Outflows”, World Economic Outlook:
Transitions and Tensions, October (Washington: International Monetary Fund).
Jaramillo, L. and A. Weber, 2013, “Bond Yields in Emerging Economies: It Matters What
State You Are In,” Emerging Markets Review, Vol. 17, pp. 169-185.
Karolyi, G. A., D.T. Ng, and E. S. Prasad, 2013, “The Coming Wave,” HKIMR Working
Paper No. 08/2013.
Laubach T., 2009, “New Evidence on the Interest Rate Effects of Budget Deficits and Debt,”
Journal of the European Economic Association, Vol. 7, No. 4, pp. 858–885.
Longstaff, F., J. Pan, L. H. Pedersen, and K. J. Singleton, 2011, “How Sovereign is
Sovereign Credit Risk?” American Economic Journal: Macroeconomics, 3, pp. 75-
103.
McGuire, P. and M. Schrijvers, 2003, “Common Factors in Emerging Market Spreads,” BIS
Quarterly Review, (December), (Basel: Bank for International Settlements).
Min, H.G., 1998, “Determinants of Emerging Market Bond Spread: Do Economic
Fundamentals Matter?” World Bank Policy Research Working Paper No. 1899

20
(Washington: The World Bank).
Mihaljek, D., M. Scatigna, and A. Villar, 2002, “Recent Trends in bond Markets - The
Development of Bond Markets in Emerging Economies”, BIS Papers Chapters 11, 1-
12 (Basel: Bank for International Settlements).
Miyajima, K., M.S. Mohanty, and T. Chan, 2012, “Emerging Market Local Currency Bonds:
Diversification and Stability,” BIS Working Papers, No. 391.
Pan, J., and K.J. Singleton, 2008, “Default and Recovery Implicit in the Term Structure of
Sovereign CDS Spreads,” Journal of Finance, 63(5), pp. 2345–84.
Peiris, S.J., 2010, “Foreign Participation in Emerging Markets’ Local Currency Bond
Markets,” IMF Working Paper 10/88 (Washington: International Monetary Fund).
Pesaran, M. H., 2004, “General Diagnostic Tests for Cross Section Dependence in Panels,”
Cambridge Working Papers in Economics No. 0435 (Cambridge: Cambridge
University).
———, 2006, “Estimation and Inference in Large Heterogeneous Panels With A Multifactor
Error Structure,” Econometrica, Vol. 74, No. 4, pp. 967-1012.
Rigobon, R., and B. Sack, 2003, “Measuring the Response of Monetary Policy to the Stock
Market,” Quarterly Journal of Economics, 118, 639-669.
Rowland, P. and J. L. Torres, 2004, “Determinants of Spread and Creditworthiness for
Emerging Market Sovereign Debt: A Panel Data Study,” Borradores de Economia
295, Banco de la Republica de Colombia.
Shin, H.S., and T. Adrian, 2010, “Liquidity and Leverage,” Journal of Financial
Intermediation, 19, no. 3, pp. 418-37
Sgherri, S. and E. Zoli, 2009, “Euro Area Sovereign Risk During the Crisis,” IMF Working
Paper No. 09/222 (Washington: International Monetary Fund)
Vargas, H., A. Gonzalez, and I. Lozano, 2012, “Macroeconomic Effects of Structural Fiscal
Policy Changes in Colombia,” BIS Papers No. 67.
Velicer, W. F., and D. N. Jackson, 1990, “Component Analysis Versus Common Factor-
Analysis – Some Further Observations,” Multivariate Behavioral Research, 25(1),
pp. 97-114.
Weber, A., 2012, “Stock-Flow Adjustments and Fiscal Transparency: A Cross-Country
Comparison,” IMF Working Paper 12/39 (Washington: International Monetary
Fund).


