94
WHO Global Status Report on Alcohol 2004 Global Status Report on Alcohol 2004 World Health Organization Department of Mental Health and Substance Abuse Geneva 2004
WHO Global Status Report on Alcohol 2004
Global Status Report
on Alcohol 2004
World Health Organization
Department of Mental Health and Substance Abuse Geneva
2004

WHO Global Status Report on Alcohol 2004
WHO Library Cataloguing-in-Publication Data World Health Organization. Global status report on alcohol 2004. 1 v. + 1 CD-ROM. CD-ROM contains country profiles. 1.Alcohol drinking - epidemiology 2.Alcohol-related disorders - epidemiology 3.Cost of illness 4.Public policy 5.Review literature I.Title.
ISBN 92 4 156272 2 (NLM classification: WM 274)
© World Health Organization 2004
All rights reserved. Publications of the World Health Organization can be obtained from Marketing and Dissemination, World Health Organization, 20 Avenue Appia, 1211 Geneva 27, Switzerland (tel: +41 22 791 2476; fax: +41 22 791 4857; email: [email protected]). Requests for permission to reproduce or translate WHO publications – whether for sale or for noncommercial distribution – should be addressed to Publications, at the above address (fax: +41 22 791 4806; email: [email protected]).
The designations employed and the presentation of the material in this publication do not imply the expression of any opinion whatsoever on the part of the World Health Organization concerning the legal status of any country, territory, city or area or of its authorities, or concerning the delimitation of its frontiers or boundaries. Dotted lines on maps represent approximate border lines for which there may not yet be full agreement. The mention of specific companies or of certain manufacturers’ products does not imply that they are endorsed or recommended by the World Health Organization in preference to others of a similar nature that are not mentioned. Errors and omissions excepted, the names of proprietary products are distinguished by initial capital letters.
The World Health Organization does not warrant that the information contained in this publication is complete and correct and shall not be liable for any damages incurred as a result of its use. Printed in Singapore.
WHO Global Status Report on Alcohol 2004
Foreword This volume is the culmination of three years of dedicated collaborative work of the WHO Department of Mental Health and Substance Abuse and a WHO Collaborating Centre, the Swiss Institute for the Prevention of Alcohol and Drug Problems in Lausanne, Switzerland. It is an overview of the available data on alcohol consumption and drinking patterns worldwide.
WHO has been actively involved in documenting the global, regional and national dimensions of alcohol consumption since the start of the Global Alcohol Database in 1996. Out of the earlier work came the Global Status Report on Alcohol (1999), the Global Status Report on Alcohol and Young People (2001) and the recently published Global Status Report: Alcohol Policy (2004). This publication follows the same tradition of the first Global Status Report five years ago, but it represents a complete update of the information. It gives valuable new perspectives on the recent status of health and social consequences of alcohol use and levels and patterns of alcohol consumption worldwide.
A clear focus of this publication has been on developing countries, those long-neglected areas where alcohol problems are likely to increase at an alarming rate in the future. It tries through objective analysis to provide in a comprehensive and readily accessible way all the accumulated scientific information and knowledge on issues pertinent to alcohol consumption at global, regional and national levels.
However, it is clear that many gaps remain to be filled for a comprehensive picture of the global situation with alcohol use and its health consequences. For example, for many countries the data is very limited, and the alcohol per capita consumption estimates are clearly of varying quality. I hope that recognition of the limitations of available data will encourage WHO Member States and international organizations to work closely with WHO in improving data collection and reporting.
I sincerely recommend this as a reference source for a wide audience of policy-makers, teachers, students, scientists and all those interested in alcohol issues.
Catherine Le Galès-Camus
Assistant Director-General Noncommunicable Diseases and Mental Health
WHO Global Status Report on Alcohol 2004
Acknowledgements The World Health Organization (WHO) gratefully acknowledges the assistance of focal points in the WHO Member States who provided data and information for the country profiles and also feedback to our earlier drafts.
WHO also wishes to acknowledge the generous financial support of the Swiss Federal Office of Public Health, which made this report possible.
This document was prepared by Nina Rehn who was responsible for the overall management of the project that was initiated under the direction and supervision of Maristela Monteiro and completed under the direction and supervision of Vladimir Poznyak of the WHO Management of Substance Abuse team who also provided invaluable input. Kelvin Chuan Heng Khow, Management of Substance Abuse, WHO, is the principal author of the country profiles. Technical assistance in statistical analysis, production of graphs, graphic design and layout was provided by Momcilo Orlovic of the Management of Substance Abuse team in WHO. The global overviews were a collaborative effort of Gerhard Gmel, Swiss Institute for the Prevention of Alcohol and Drug Problems, Kelvin Chuan Heng Khow and Nina Rehn, Management of Substance Abuse. Laurent Emery and Matthias Wicki at the Swiss Institute for the Prevention of Alcohol and Drug Problems assisted with different sections of the profiles and the project as a whole. Thanks are also due to Isidore Obot of the Management of Substance Abuse team, Maria Elena Medina-Mora, Instituto Nacional de Psiquiatría Ramón de la Fuente, Mexico, Moira Plant, University of the West of England, Bristol, United Kingdom, and Robin Room, Centre for Social Research on Alcohol and Drugs, Stockholm, who provided useful comments on the draft of the document. Heidemarie Vaucher, Elisabeth Grisel and Edith Bacher, Swiss Institute for the Prevention of Alcohol and Drug Problems, and Mylène Schreiber and Tess Narciso, Management of Substance Abuse, WHO, all provided much needed secretarial and editorial assistance.
The project leading to this report was implemented under the overall guidance and supervision of Benedetto Saraceno, Director of the WHO Department of Mental Health and Substance Abuse.
WHO Global Status Report on Alcohol 2004
Contents Part I Introduction 1 Data sources and methods 3
Global overviews Alcohol consumption and beverage preferences 9 Unrecorded alcohol consumption 15 Traditional or local alcoholic beverages 18 Drinking patterns 22
Consequences of alcohol use Health effects and global burden of disease 35 Social problems associated with alcohol use 59 Economic and social costs of alcohol use 65 Conclusion 67
References 68 Part II Country profiles (on CD-ROM)
WHO African Region WHO Region of the Americas WHO South-East Asia Region WHO European Region WHO Eastern Mediterranean Region
WHO Western Pacific Region

WHO Global Status Report on Alcohol 2004
WHO Global Status Report on Alcohol 2004
1
Introduction The World Health Organization (WHO) estimates that there are about 2 billion people worldwide who consume alcoholic beverages and 76.3 million with diagnosable alcohol use disorders. From a public health perspective, the global burden related to alcohol consumption, both in terms of morbidity and mortality, is considerable in most parts of the world. Alcohol consumption has health and social consequences via intoxication (drunkenness), alcohol dependence, and other biochemical effects of alcohol. In addition to chronic diseases that may affect drinkers after many years of heavy use, alcohol contributes to traumatic outcomes that kill or disable at a relatively young age, resulting in the loss of many years of life due to death or disability. There is increasing evidence that besides volume of alcohol, the pattern of the drinking is relevant for the health outcomes. Overall there is a causal relationship between alcohol consumption and more than 60 types of disease and injury. Alcohol is estimated to cause about 20–30% of oesophageal cancer, liver cancer, cirrhosis of the liver, homicide, epileptic seizures, and motor vehicle accidents worldwide (WHO, 2002).
Alcohol causes 1.8 million deaths (3.2% of total) and a loss of 58.3 million (4% of total) of Disability-Adjusted Life Years (DALY) (WHO, 2002). Unintentional injuries alone account for about one third of the 1.8 million deaths, while neuro-psychiatric conditions account for close to 40% of the 58.3 million DALYs. The burden is not equally distributed among the countries. Alcohol consumption is the leading risk factor for disease burden in low mortality developing countries and the third largest risk factor in developed countries. In Europe alone, alcohol consumption was responsible for over 55 000 deaths among young people aged 15–29 years in 1999 (Rehm & Eschmann, 2002).
Given alcohol’s significance in world health, WHO has, since 1996, been developing a database, the Global Alcohol Database, to provide a standardized reference source of information for global epidemiological surveillance of alcohol use and its related problems. The database is the world’s largest single source that documents global patterns of alcohol use, health consequences and national policy responses, by country. This monitoring system and database enables WHO to disseminate data and information on trends in alcohol consumption, drinking patterns and alcohol-related mortality, including details of policy responses in countries. The aim of the project is to provide up-to-date and comparative data regarding the status of alcohol consumption and alcohol problems.
WHO has been undertaking a major exercise in passive epidemiological surveillance, gathering published and unpublished data and information about key aspects of the alcohol situation in WHO Member States. Given that this was a pioneering effort to document a highly diverse and complex issue, the findings clearly reveal the shortcomings of global alcohol epidemiology. The data presented in this report can be found in the Global Alcohol Database and most of it is also available on the web site of the database (WHO, 2004a). Two earlier reports that were published by WHO using data from this database were the first Global Status Report on Alcohol (WHO, 1999) and the Global Status Report: Alcohol and Young People (2001a).
This new edition provides an update on the global picture of the status of alcohol as a factor in world health and contains data that is not found in the earlier edition. The Global Status Report on Alcohol 2004 seeks to document what is known about alcohol consumption and drinking patterns among various population groups as well as alcohol’s impact on health worldwide. This information will hopefully spur further research and action to prevent and
WHO Global Status Report on Alcohol 2004
2
reduce alcohol-related injury and disease globally. For this new edition, more emphasis has been placed on the need to enhance the comparability of data by setting clear and comprehensive priorities in terms of data collection. As far as possible, there has been an effort to obtain the same indicators for the majority of countries. Unlike the earlier edition, the current report does not present data on alcohol trade and production, and alcohol policy. Alcohol policy is the topic of a separate report, the Global Status Report: Alcohol Policy (WHO, 2004c), which analyses alcohol policies in 118 WHO Member States. That data is based on focal point replies to a questionnaire. For further details please refer to the report, which is also available online at http://www.who.int/substance_abuse.
The report consists of two sections. The first section presents an overview and comparative analyses of the alcohol situation on a regional and global basis using indicators such as per capita alcohol consumption and drinking patterns. There is also a discussion on the health and social consequences of alcohol use.
The second section of the report consists of a CD-ROM which presents individual country profiles for 189 Member States for which sufficient data were available, bringing together information on each of these indicators: trends in adult per capita consumption as well as prevalence/drinking patterns data, information regarding traditional and/or locally produced alcoholic beverages, unrecorded alcohol consumption, health and social problems, including morbidity and mortality from alcohol-related causes and the social and economic costs of alcohol abuse.
The Global Status Report on Alcohol 2004 stands as a picture of much of the state of knowledge and state of world health related to alcohol. The evidence it gives will hopefully stimulate further efforts to document alcohol use, problems and policies in WHO Member States.
WHO Global Status Report on Alcohol 2004
3
Data sources and methods
General
The country profiles, presented in Part II of the report (in CD-ROM), attempt to give an overview of the current situation regarding alcohol in 189 WHO Member States. This was achieved on the basis of a select number of indicators chosen by a group of experts for which as much data as possible was collected. The indicators were: adult per capita consumption, drinking patterns (abstainers, high risk drinking and heavy episodic drinking, both for the general population and for young people separately), rates of alcohol dependence, traditional or local alcoholic beverages, unrecorded alcohol consumption, alcohol-related mortality (four chronic and four acute consequences), alcohol-related morbidity, health and social problems (including social and economic costs), and finally some country background information. Based on the different data searches, first drafts of the country profiles were prepared. These drafts were then sent to the countries requesting for changes or additions. Only a small number of countries returned comments or suggestions. The overview section is based mainly on the data from the existing profiles and summarizes some of the main features on a global level. In the preparation every attempt was made to include accurate and up-to-date information available as at April 2004. All the sources used are referenced under each country separately.
In the following sections the indicators mentioned above are explained in more detail.
Recorded adult (15+) per capita (APC) alcohol consumption
WHO often uses adult (people 15 years and older) per capita to measure alcohol consumption, instead of the also widely used per capita for the whole population. This is to balance the fact that population distributions in developing countries are quite different from developed countries, i.e. they have a much larger proportion of children and young people. Using per capita would mean that countries with many young people will underestimate the consumption among adults, if it is assumed that most young people below 15 do not consume significant quantities of alcohol.
Where available, the graph of the adult per capita consumption is shown as time series from 1961 until 2001 for all beverages, and for beer, wine and spirits separately, in litres of pure alcohol per adult per year in that particular country. The data is for recorded alcohol, i.e. unrecorded alcohol is not included, such as alcohol from cross-border shopping, smuggling, homemade (legal or not), and tourist consumption. For some countries estimates of the unrecorded alcohol is presented in a separate section.
The APC estimates are based on either FAO (Food and Agriculture Organization of the United Nations) or WDT (World Drink Trends) data, except for a few countries in Europe where the data comes directly from governments. Where both FAO and WDT data exist, a choice has been made in favour of the more accurate and reliable data. In the European Region WDT is used for 25 countries, FAO for 19 and government data for four countries. Outside Europe the overlap between FAO and WDT concerns 24 countries, from which 17 use FAO data and 7 WDT. The rest of the countries of the world use FAO, as no other source could be found. When using WDT data the per capita is recalculated into adult per capita consumption. The FAO data consists of estimates of production and trade in metric tonnes for
WHO Global Status Report on Alcohol 2004
4
the following beverages: wine, vermouth, must of grape, fermented beverages, spirits, sorghum beer, millet beer, maize beer, barley beer, wheat fermented and rice fermented. All the beverages are converted into pure alcohol and then combined into the categories of beer, wine and spirits so that all beers make up the beer category, and all other beverages, besides spirits, belong to the wine category. FAO collects the data from the countries through a questionnaire to the Ministries of Agriculture and Trade once a year. It should be noted that a change took place in method of calculation for the group of wine, which does not influence the total alcohol consumption but which for some countries will show a sudden increase in wine consumption from 1996.
The data is clearly only as reliable as the original data from the sources used. For some countries large and sudden changes from one year to another can be seen, which unless there is a major natural or man-made disaster or conflict is in reality rare. For more precise data on the adult per capita please refer to the webpage of the Global Alcohol Database (WHO, 2004b), where the actual numbers are presented for each year and each country.
Drinking patterns
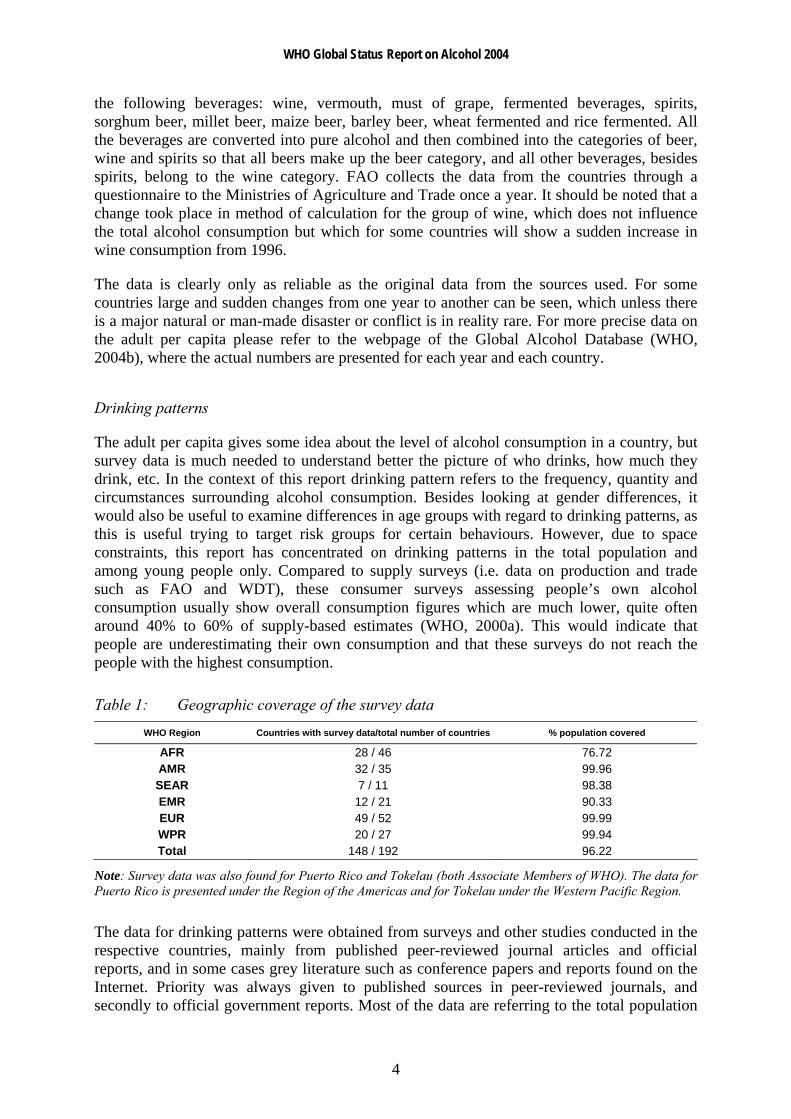
The adult per capita gives some idea about the level of alcohol consumption in a country, but survey data is much needed to understand better the picture of who drinks, how much they drink, etc. In the context of this report drinking pattern refers to the frequency, quantity and circumstances surrounding alcohol consumption. Besides looking at gender differences, it would also be useful to examine differences in age groups with regard to drinking patterns, as this is useful trying to target risk groups for certain behaviours. However, due to space constraints, this report has concentrated on drinking patterns in the total population and among young people only. Compared to supply surveys (i.e. data on production and trade such as FAO and WDT), these consumer surveys assessing people’s own alcohol consumption usually show overall consumption figures which are much lower, quite often around 40% to 60% of supply-based estimates (WHO, 2000a). This would indicate that people are underestimating their own consumption and that these surveys do not reach the people with the highest consumption.
Table 1: Geographic coverage of the survey data WHO Region Countries with survey data/total number of countries % population covered
AFR 28 / 46 76.72 AMR 32 / 35 99.96 SEAR 7 / 11 98.38 EMR 12 / 21 90.33 EUR 49 / 52 99.99 WPR 20 / 27 99.94 Total 148 / 192 96.22
Note: Survey data was also found for Puerto Rico and Tokelau (both Associate Members of WHO). The data for Puerto Rico is presented under the Region of the Americas and for Tokelau under the Western Pacific Region.
The data for drinking patterns were obtained from surveys and other studies conducted in the respective countries, mainly from published peer-reviewed journal articles and official reports, and in some cases grey literature such as conference papers and reports found on the Internet. Priority was always given to published sources in peer-reviewed journals, and secondly to official government reports. Most of the data are referring to the total population

WHO Global Status Report on Alcohol 2004
5
(unless otherwise specified), with data for males and females shown separately whenever available. Besides youths, which has been the main subgroup used in the report, sometimes data for other subgroups are also presented. This may include the incarcerated population, people attending health care facilities or treatment, occupational categories, demographic subgroups defined by race or ethnicity, religious subgroups, or subgroups defined by income or geographical place of residence. Within the drinking patterns section four indicators were chosen for the country profiles.
Rates of abstainers in the population, i.e. people who have not consumed any alcohol in the last 12 months (if other definition of abstainer it has been separately noted).
Problem drinkers, heavy drinkers or high risk drinkers, as defined in the corresponding source, people drinking regularly at a level where there is a high risk of chronic or acute consequences.
Heavy episodic or binge drinkers, as defined in the corresponding source, people drinking occasionally at a level where there is a high risk of intoxication and acute consequences.
Rates of alcohol dependence, either in the general population or some sub-population using some internationally validated instruments such as AUDIT and CAGE, and diagnostic criteria such as those found in the ICD-10 or DSM-IV.
If available, data were also presented for young people for all the categories above stemming from surveys conducted in schools or universities.
The data are presented as two graphs where possible: one showing the overall rate as percentages and the other showing data by gender. Please note that the graphs representing data by gender are merely for graphical purposes and are not to proportion. An example for Bangladesh (lifetime abstainers) is shown below:
Figure 1: Lifetime abstainers in Bangladesh
Total 94%
Mal
e 87
.4%
Fem
ale
99.7
%
1Ustun TB et al. The World Health Surveys. In: Murray CJL, Evans DB, eds. Health Systems Performance Assessment: Debates, Methods and Empiricism. Geneva, World Health Organization, 2003.
For example, the total lifetime abstainers in Bangladesh as measured by the 2003 World Health Survey is estimated to be 94% of the total population. The second graph shows the male to female proportion from the overall, e.g. 87.4% of male Bangladeshis are abstainers, and likewise, 99.7% of female Bangladeshis are abstainers (Ustun et al., 2003). Next to the graphs is a text box containing information about the kind of survey used, sample size and age group of the population sampled, the definition of the drinking pattern measured, and a
Data from the 2003 World Health Survey. Total sample size n = 5508; males n = 2567 and females n = 2941. Sample population aged 18 years and above.1 Note: These are preliminary, early-release, unpublished data from the World Health Survey made available exclusively for this report. Some estimates may change in the final analyses of the World Health Survey.

WHO Global Status Report on Alcohol 2004
6
reference to the original source. When no national data were found, regional surveys or surveys of certain cities have been used, in which case this is clearly mentioned.
Traditional alcoholic beverages
This section gives examples of different local or traditional alcoholic beverages, with short descriptions of their alcohol by volume content, process of production, etc. Many of these beverages would not show up in the recorded APC figures used in the beginning of the profiles because they are locally produced in the villages, homes, etc. They are often outside the western beer, wine and spirits categories, and also outside the control of the local governments. The source of data is almost exclusively grey literature on the Internet, i.e. sources which often could not be corroborated by other independent sources. This is because there exists very little published materials about these kinds of beverages and is a fact which should be taken into account when considering the reliability of the data.
Unrecorded alcohol consumption
This section gives an estimate of the amount of alcohol which is unrecorded in a country, i.e. does not show up in the official APC data. Much of the unrecorded alcohol consists of the traditionally brewed beverages described above, but there is also unrecorded alcohol derived from means such as cross border trade and smuggling. However, only a few countries have estimates on unrecorded alcohol consumption. This is because very little published material exists about these kinds of beverages, which should be taken into account when considering the reliability of the data.
Alcohol-related mortality
The data for alcohol-related mortality are shown in two graphs, one for chronic and one for acute consequences, with time series since 1961 for each cause of death where available. It should be noted that chronic diseases are measured on two axes. The data clearly shows gaps in coverage, both in terms of the number of countries where no data exists and of the scarcity of data for some specific causes. The mortality rates are from the WHO mortality database where countries report their mortality each year using the (International Statistical Classification of Diseases and Related Health Problems (ICD) coding system. Those crude numbers of deaths have been converted into age standardized death rates per 1000 population for each country using the WHO standard population. Data is only shown if there is a time series of at least five years. One should be cautious about making any comparisons because reliability of these figures depends on the registration of deaths at the national level. Furthermore, death registration coverage and cross-national differences in coding practices, particularly in the use of codes for ill-defined and unknown causes, must be taken into account to validly compare mortality rates for specific causes across countries. Additionally, where coverage is less than 100%, the cause of death distribution for the uncovered population may differ from that of the covered population.
In total, eight causes of death were included here (ICD-10 codes used shown in Table 2): four causes which were assigned as showing consequences related to high level, long time chronic drinking (liver cirrhosis and liver disease; lip, oral cavity and pharynx cancers; alcohol dependence and ischaemic heart disease was added to this group, although depending on the drinking pattern, alcohol can have a protective effect for some subgroups of populations in

WHO Global Status Report on Alcohol 2004
7
some, mainly developed countries). The other four causes show more acute consequences related to intoxication, i.e. motor vehicle traffic accidents, homicide and unintentional or intentional injury, falls, and poisonings.
Table 2: ICD codes used for causes where alcohol is one of the underlying risk factors Cause of death ICD-9 4-digit ICD-9 3-digit ICD-10 4-digit ICD-10 3-digit
Mouth and oropharynx cancers
140-149 140-149 C00-C14 C00-C14
Alcohol use disorders 291, 303, 305.0
291, 303 F10 F10
Ischaemic heart disease 410-414 410-414 I20-I25 I20-I25
Cirrhosis of the liver
571 571 K70, K74 K70, K74
Road traffic accidents E810-819, E826-829, E929.0
E810-819, E826-829
* V01-V04, V06, V09-V80, V87, V89, V99
Poisonings E850-869 E850-869 X40-X49 X40-X49
Falls
E880-888 E880-888 W00-W19 W00-W19
Intentional injuries E950-978, 990-999
E950-978, 990-999
X60-Y09, Y35-Y36, Y870, Y871
X60-Y09, Y35-Y36, Y87
*V01.1-V01.9, V02.1-V02.9, V03.1-V03.9, V04.1-V04.9, V06.1-V06.9, V09.2, V09.3, V10.4-V10.9, V11.4-V11.9, V112.3-V12.9, V13.3-V13.9, V14.3-V14.9, V15.4-V15.9, V16.4-V16.9, V17.4-V17.9. V18.4-V18.9, V19.4-V19.6, V20.3-V20.9, V21.3-V21.9, V22.3-V22.9, V23.3-V23.9, V24.3-V24.9, V25.3-V25.9, V26.3-V26.9, V27.3-V27.9, V28.3-V28.9, V29.4-V29.9, V30.4-V30.9, V31.4-V31.9, V32.4-V32.9, V33.4-V33.9, V34.4-V34.9, V35.4-V35.9, V36.4-V36.9, V37.4-V37.9, V38.4-V38.9, V39.4-V39.9, V40.4-V40.9, V41.4-V41.9, V42.4-V42.9, V43.4-V43.9, V44.4-V44.9, V45.4-V45.9, V46.4-V46.9, V47.4-V47.9, V48.4-V48.9, V49.4-V49.9, V50.4-V50.9, V51.4-V51.9, V52.4-V52.9, V53.4-V53.9, V54.4-V54.9, V55.4-V55.9, V56.4-V56.9, V57.4-V57.9, V58.4-V58.9, V59.4-V59.9, V60.4-V60.9, V61.4-V61.9, V62.4-V62.9, V63.4-V63.9, V64.4-V64.9, V65.4-V65.9, V66.4-V66.9, V67.4-V67.9, V68.4-V68.9, V69.4-V69.9, V70.4-V70.9, V71.4-V71.9, V72.4-V72.9, V73.4-V73.9, V74.4-V74.9, V75.4-V75.9, V76.4-V76.9, V77.4-V77.9, V78.4-V78.9, V79.4-V79.9, V80.3-V80.5, V81.1, V82.1, V83.0-V83.3, V84.0-V84.3, V85.0-V85.3, V86.0-V86.3, V87.0-V87.8, V89.2, V89.9, V99, Y850.
Morbidity, health and social problems from alcohol use
This section is not a comprehensive overview of all the health and social problems related to alcohol consumption, which are numerous. Rather it is a brief insight into some of the consequences alcohol causes for particular societies. The section presents in a qualitative manner some results from national studies on different issues such as traffic accidents, suicide, violence, work absenteeism, and public drunkenness. The briefs are based primarily on published scientific literature and reports from governments or national agencies.

WHO Global Status Report on Alcohol 2004
8
Social and economic costs
This is a subsection to the above which deals with studies or published data on the economic and social costs of alcohol to societies. The section does not include description of the methodology used in estimating the costs; for that one has to refer to the original source. Due to the large methodological differences studies cannot be directly compared with each other.
Country background information
Country background information indicators were chosen to be of specific relevance for assessing the alcohol use and related problems in countries and was added in order to give some general picture about the different countries, i.e. population and age structure, level of urbanization, life expectancy, infant mortality rate and Gross National Income (GNI) per capita. The sources of data used were the WHO, the United Nations and the World Bank. Because of the influence of the Islamic religion on alcohol consumption, data on the approximate proportion of the Muslim population in a particular country was included in the background data field when the figure was estimated to be 50% or more.
References
At the end of each country profile is a list of the references used. Most weight has been given to peer-reviewed journal articles and other published sources, which were primarily located through PUBMED, ETOH, or Lilacs (database which indexes the Latin American medical literature). Some data was obtained from websites or non-published sources, in which case caution is needed when interpreting the data.
WHO Global Status Report on Alcohol 2004
9
Global overviews
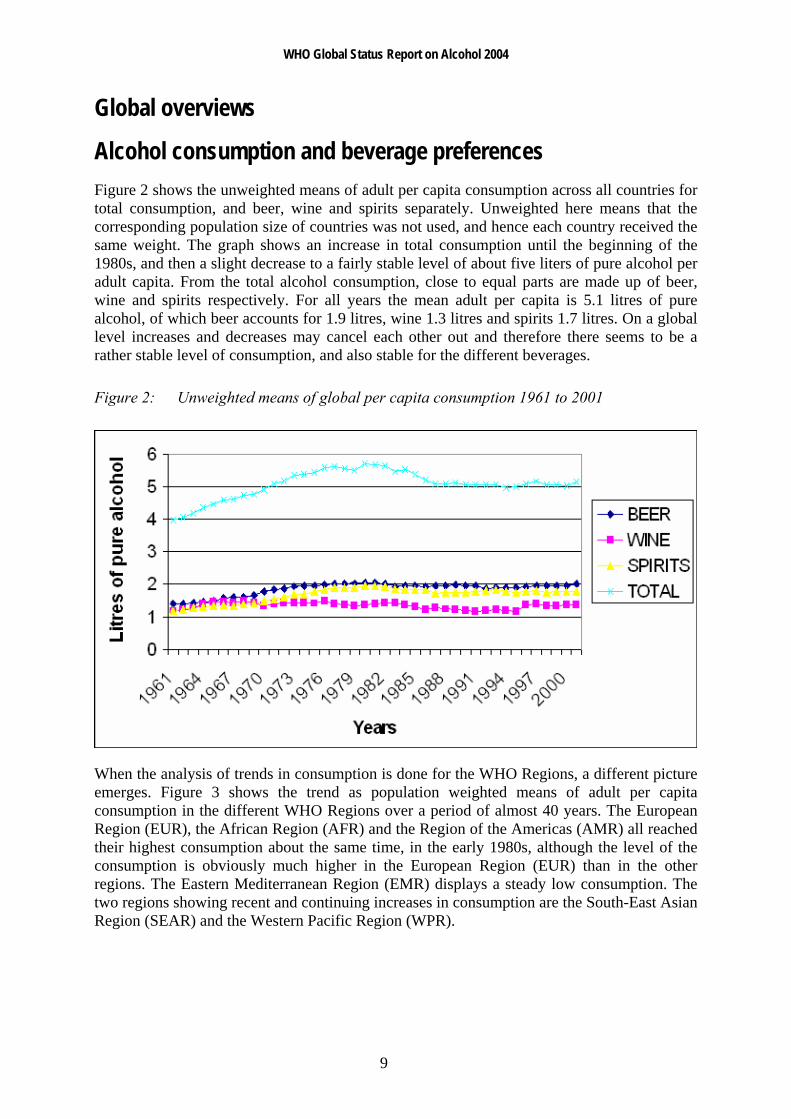
Alcohol consumption and beverage preferences Figure 2 shows the unweighted means of adult per capita consumption across all countries for total consumption, and beer, wine and spirits separately. Unweighted here means that the corresponding population size of countries was not used, and hence each country received the same weight. The graph shows an increase in total consumption until the beginning of the 1980s, and then a slight decrease to a fairly stable level of about five liters of pure alcohol per adult capita. From the total alcohol consumption, close to equal parts are made up of beer, wine and spirits respectively. For all years the mean adult per capita is 5.1 litres of pure alcohol, of which beer accounts for 1.9 litres, wine 1.3 litres and spirits 1.7 litres. On a global level increases and decreases may cancel each other out and therefore there seems to be a rather stable level of consumption, and also stable for the different beverages.
Figure 2: Unweighted means of global per capita consumption 1961 to 2001
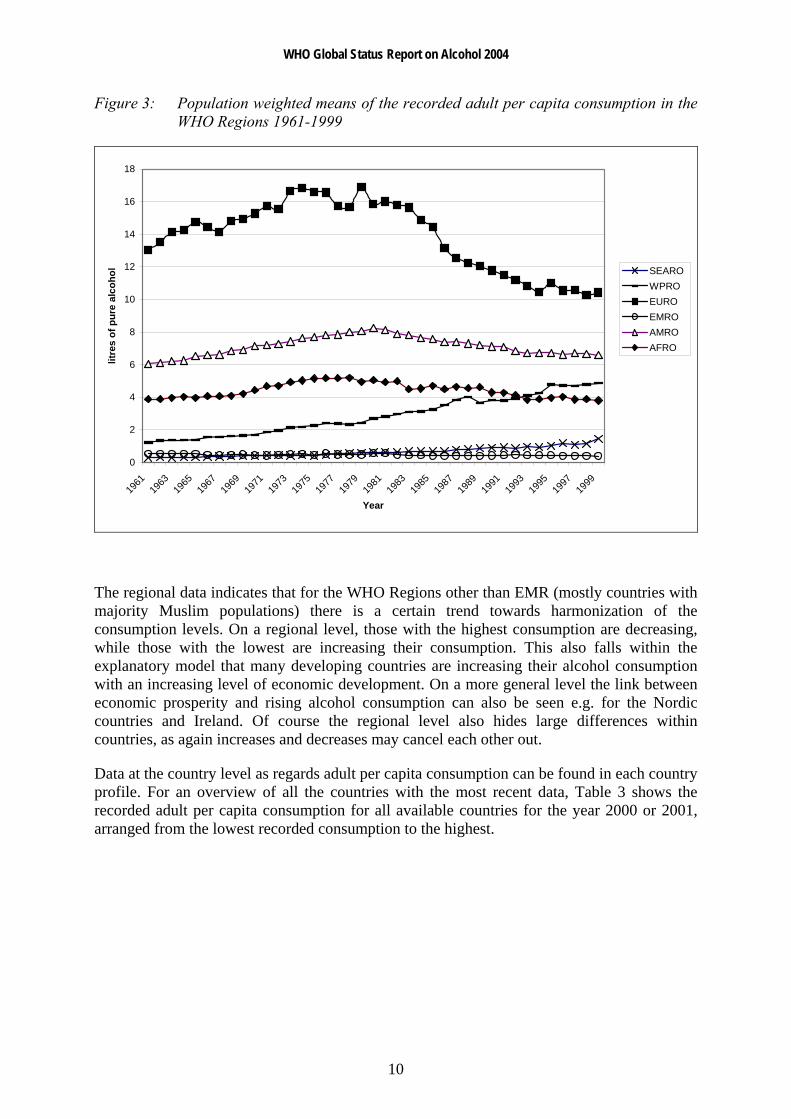
When the analysis of trends in consumption is done for the WHO Regions, a different picture emerges. Figure 3 shows the trend as population weighted means of adult per capita consumption in the different WHO Regions over a period of almost 40 years. The European Region (EUR), the African Region (AFR) and the Region of the Americas (AMR) all reached their highest consumption about the same time, in the early 1980s, although the level of the consumption is obviously much higher in the European Region (EUR) than in the other regions. The Eastern Mediterranean Region (EMR) displays a steady low consumption. The two regions showing recent and continuing increases in consumption are the South-East Asian Region (SEAR) and the Western Pacific Region (WPR).
WHO Global Status Report on Alcohol 2004
10
Figure 3: Population weighted means of the recorded adult per capita consumption in the WHO Regions 1961-1999
0
2
4
6
8
10
12
14
16
18
1961
1963
1965
1967
1969
1971
1973
1975
1977
1979
1981
1983
1985
1987
1989
1991
1993
1995
1997
1999
Year
litre
s of
pur
e al
coho
l SEARO WPRO EURO EMRO AMRO AFRO
The regional data indicates that for the WHO Regions other than EMR (mostly countries with majority Muslim populations) there is a certain trend towards harmonization of the consumption levels. On a regional level, those with the highest consumption are decreasing, while those with the lowest are increasing their consumption. This also falls within the explanatory model that many developing countries are increasing their alcohol consumption with an increasing level of economic development. On a more general level the link between economic prosperity and rising alcohol consumption can also be seen e.g. for the Nordic countries and Ireland. Of course the regional level also hides large differences within countries, as again increases and decreases may cancel each other out.
Data at the country level as regards adult per capita consumption can be found in each country profile. For an overview of all the countries with the most recent data, Table 3 shows the recorded adult per capita consumption for all available countries for the year 2000 or 2001, arranged from the lowest recorded consumption to the highest.

WHO Global Status Report on Alcohol 2004
11
Table 3: Total recorded alcohol per capita consumption (15+), in litres of pure alcohol
Country Total Country Total Country Total Country Total
Iran 0.00 Brunei Darussalam 0.49 Kiribati 1.66 Jamaica 3.37 Kuwait 0.00 Bhutan 0.57 Mozambique 1.67 Bolivia 3.43 Libyan Arab Jamahiriya (the) 0.00 Syrian Arab Republic (the) 0.62 Fiji 1.69 El Salvador 3.45 Saudi Arabia 0.00 Micronesia (Federated States of) 0.64 Côte d'Ivoire 1.71 Seychelles 3.61 Somalia 0.00 Tunisia 0.65 Maldives 1.72 Cuba 3.65 Bangladesh 0.00 Turkmenistan 0.77 Kenya 1.74 Cameroon 3.66 Mauritania 0.01 India 0.82 Lesotho 1.83 Cape Verde 3.72 Pakistan 0.02 Solomon Islands 0.86 Mongolia 1.96 Philippines (the) 3.75 Algeria 0.03 Equatorial Guinea 0.90 Israel 1.99 Ukraine 4.04 Nepal 0.08 Ethiopia 0.91 Ecuador 1.99 The form. Yugoslav Rep. of Mac. 4.12 Comoros 0.08 Togo 0.95 Dem. Republic of the Congo 2.01 Lebanon 4.13 Yemen 0.08 Papua New Guinea 1.01 Gambia (the) 2.27 Antigua and Barbuda 4.24 Indonesia 0.10 Malaysia 1.06 Honduras 2.28 Burkina Faso 4.38 Egypt 0.10 Djibouti 1.08 Congo 2.36 China 4.45 Niger (the) 0.11 Vanuatu 1.11 Namibia 2.39 Belize 4.50 Jordan 0.11 Benin 1.22 Georgia 2.41 Guam 4.50 Guinea 0.14 Armenia 1.23 Albania 2.51 Mexico 4.62 Sri Lanka 0.18 Oman 1.32 Nicaragua 2.53 Peru 4.68 Iraq 0.20 Viet Nam 1.35 Bahrain 2.63 Zimbabwe 5.08 Chad 0.23 Madagascar 1.38 Singapore 2.73 United Republic of Tanzania 5.29 Sudan (the) 0.27 Samoa 1.42 United Arab Emirates (the) 2.75 Brazil 5.32 Cambodia 0.36 Malawi 1.44 Guinea-Bissau 2.76 Botswana 5.38 Myanmar 0.36 Turkey 1.48 Kazakhstan 2.89 Costa Rica 5.45 Morocco 0.41 Uzbekistan 1.52 Angola 2.91 Kyrgyzstan 5.50 Tajikistan 0.41 Eritrea 1.54 Zambia 3.02 Dem. People's Republic of Korea 5.68 Qatar 0.44 Ghana 1.54 Liberia 3.12 Iceland 5.74 Senegal 0.48 Guatemala 1.64 Mauritius 3.16 Norway 5.81 Mali 0.49 Central African Republic (the) 1.66 Trinidad and Tobago 3.22 Suriname 5.82

WHO Global Status Report on Alcohol 2004
12
Country Total Country Total Country Total
Guyana 5.84 Gabon 7.97 Hungary 11.92 Colombia 5.92 Belarus 8.12 Denmark 11.93 Chile 6.02 Canada 8.26 Spain 12.25 Panama 6.04 Thailand 8.47 Lithuania 12.32 Sao Tome and Principe 6.07 United States of America (the) 8.51 Slovakia 12.41 Dominican Republic (the) 6.11 Argentina 8.55 Portugal 12.49 Haiti 6.51 Bosnia and Herzegovina 8.62 Austria 12.58 Slovenia 6.55 Poland 8.68 Croatia 12.66 Saint Vincent and Grenadines 6.58 Venezuela 8.78 Germany 12.89 Sierra Leone 6.64 Italy 9.14 Bermuda 12.92 Paraguay 6.66 Australia 9.19 Reunion 13.39 Cyprus 6.67 Dominica 9.19 France 13.54 Barbados 6.70 Bahamas (the) 9.21 Republic of Moldova (the) 13.88 Lao People's Democratic Republic (the) 6.72 Greece 9.30 Ireland 14.45 Malta 6.74 Latvia 9.31 Czech Republic (the) 16.21 Rwanda 6.80 Burundi 9.33 Luxembourg 17.54 Sweden 6.86 Swaziland 9.51 Uganda 19.47 Azerbaijan 6.94 Netherlands (the) 9.74 Uruguay 6.96 New Zealand 9.79 Bulgaria 7.13 Estonia 9.85 Japan 7.38 Netherlands Antilles 9.94 Grenada 7.39 Nigeria 10.04 Saint Kitts and Nevis 7.62 Belgium 10.06 Romania 7.63 United Kingdom (the) 10.39 French Polynesia 7.68 Finland 10.43 Republic of Korea (the) 7.71 Saint Lucia 10.45 South Africa 7.81 Russian Federation (the) 10.58 New Caledonia 7.83 Switzerland 11.53
Sources: FAO (Food and Agriculture Organization of the United Nations), World Drink Trends 2003
Note: Several African countries (Burundi, Nigeria, Swaziland and Uganda) appear in the list in the top 30 positions of adult per capita consumption. This is because the calculations were based on FAO data which included fermented beverages and estimates of beer produced locally from sorghum, millet and other agricultural products.
WHO Global Status Report on Alcohol 2004
13
Beverage preferences
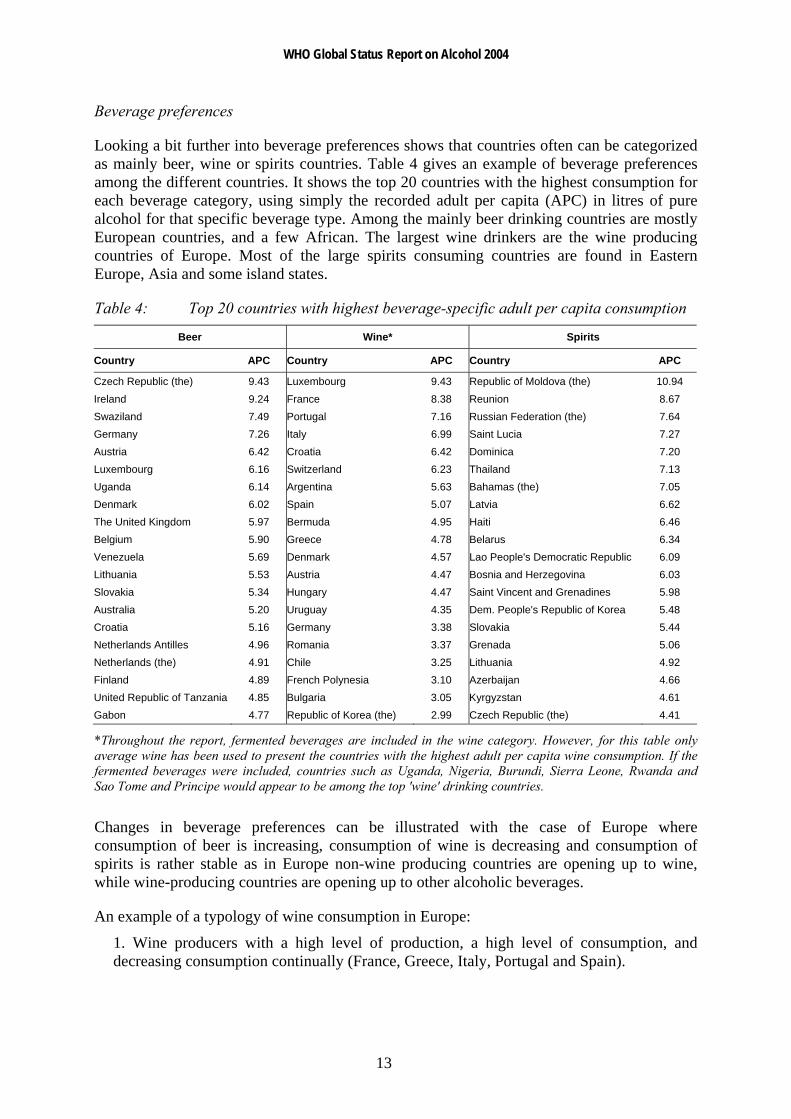
Looking a bit further into beverage preferences shows that countries often can be categorized as mainly beer, wine or spirits countries. Table 4 gives an example of beverage preferences among the different countries. It shows the top 20 countries with the highest consumption for each beverage category, using simply the recorded adult per capita (APC) in litres of pure alcohol for that specific beverage type. Among the mainly beer drinking countries are mostly European countries, and a few African. The largest wine drinkers are the wine producing countries of Europe. Most of the large spirits consuming countries are found in Eastern Europe, Asia and some island states.
Table 4: Top 20 countries with highest beverage-specific adult per capita consumption
Beer Wine* Spirits
Country APC Country APC Country APC
Czech Republic (the) 9.43 Luxembourg 9.43 Republic of Moldova (the) 10.94 Ireland 9.24 France 8.38 Reunion 8.67 Swaziland 7.49 Portugal 7.16 Russian Federation (the) 7.64 Germany 7.26 Italy 6.99 Saint Lucia 7.27 Austria 6.42 Croatia 6.42 Dominica 7.20 Luxembourg 6.16 Switzerland 6.23 Thailand 7.13 Uganda 6.14 Argentina 5.63 Bahamas (the) 7.05 Denmark 6.02 Spain 5.07 Latvia 6.62 The United Kingdom 5.97 Bermuda 4.95 Haiti 6.46 Belgium 5.90 Greece 4.78 Belarus 6.34 Venezuela 5.69 Denmark 4.57 Lao People's Democratic Republic 6.09 Lithuania 5.53 Austria 4.47 Bosnia and Herzegovina 6.03 Slovakia 5.34 Hungary 4.47 Saint Vincent and Grenadines 5.98 Australia 5.20 Uruguay 4.35 Dem. People's Republic of Korea 5.48 Croatia 5.16 Germany 3.38 Slovakia 5.44 Netherlands Antilles 4.96 Romania 3.37 Grenada 5.06 Netherlands (the) 4.91 Chile 3.25 Lithuania 4.92 Finland 4.89 French Polynesia 3.10 Azerbaijan 4.66 United Republic of Tanzania 4.85 Bulgaria 3.05 Kyrgyzstan 4.61 Gabon 4.77 Republic of Korea (the) 2.99 Czech Republic (the) 4.41
*Throughout the report, fermented beverages are included in the wine category. However, for this table only average wine has been used to present the countries with the highest adult per capita wine consumption. If the fermented beverages were included, countries such as Uganda, Nigeria, Burundi, Sierra Leone, Rwanda and Sao Tome and Principe would appear to be among the top 'wine' drinking countries.
Changes in beverage preferences can be illustrated with the case of Europe where consumption of beer is increasing, consumption of wine is decreasing and consumption of spirits is rather stable as in Europe non-wine producing countries are opening up to wine, while wine-producing countries are opening up to other alcoholic beverages.
An example of a typology of wine consumption in Europe:
1. Wine producers with a high level of production, a high level of consumption, and decreasing consumption continually (France, Greece, Italy, Portugal and Spain).
WHO Global Status Report on Alcohol 2004
14
2. Wine producers with a medium level of production, a moderate level of consumption, and stable or slightly increasing consumption (Austria, the Czech Republic, Germany, and Switzerland).
3. Nonproducers, which have experienced a strong increase in wine consumption (Nordic countries, the Netherlands, the United Kingdom, Ireland and Belgium).
It should be noted that there are many different beverages outside the usual beer, wine and spirits categories, which are included in the per capita consumption figures. Alcohol can be produced from a wide range of agricultural products, such as grapes, barley, wheat, grains, fruit, and potatoes. On a country-wide basis dramatic increases or decreases in alcohol consumption are rare, with the exception of consumption associated with large natural disasters or conflicts. Where such changes appear in the data, they are more likely to reflect a change in the methods or that there has been a shift from legal alcohol production to illegal and unrecorded (or vice-versa). The report focuses on the three main beverage categories, although wherever possible data has been included on the more localized beverages, which were mostly included in the category of ‘wine and fermented beverages’. Another example is the category of alcopops, which in most places are diluted spirits beverages and thus are usually included in the spirits category in the statistics.
WHO Global Status Report on Alcohol 2004
15
Unrecorded alcohol consumption Total alcohol consumption is either derived from official records on consumption or representative population surveys on consumption. As mentioned in the data sources and methods section official statistics on alcohol consumption, sales or trade are usually only based on the recorded figures. In many countries there is alcohol available which lies outside of the recorded sphere. This is often called unrecorded alcohol. This alcohol mainly stems from the following sources:
home production, in many countries licit for wine and beer, while illicit for spirits;
travellers' imports and cross-border shopping;
smuggling, either organized criminal activity or travellers importing amounts which exceed the legal allowance;
surrogate alcohol intended for industrial, technical or medical purposes;
tourist consumption i.e. alcoholic beverages consumed during visits to other countries;
beverages with alcohol content below the legal definition of alcohol.
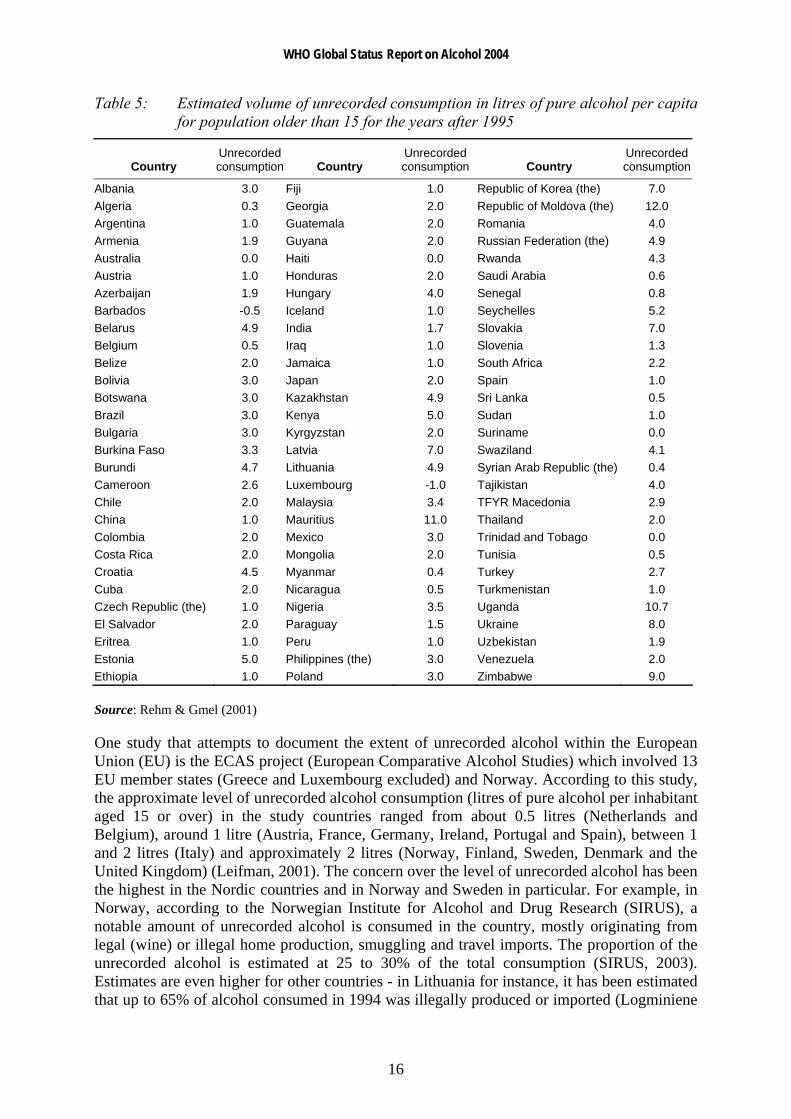
Relatively few countries have conducted studies on estimating the level of unrecorded alcohol consumption, thus, for the majority of countries, no official estimate of unrecorded alcohol could be found. Recently, a group of alcohol experts have attempted to estimate the level of unrecorded alcohol consumption in a number of countries (Rehm & Gmel, 2001). These estimates were derived from a variety of sources, including the first Global Status Report on Alcohol, specialized surveys that asked about unrecorded alcohol in particular countries, and through focal point reports or replies to questionnaires sent to individual countries. Table 5 shows estimates of unrecorded alcohol for a select number of countries (for complete table see Rehm & Gmel, 2001).
Some countries have an estimated unrecorded alcohol consumption level of zero or even negative. For instance, in the case of Luxembourg (-1.0 litres per adult capita), it is estimated that visitors or tourists account for a sizable portion of the alcohol consumed which could explain why the overall consumption level for the actual Luxembourg population may have been over-recorded. At the other end can be found countries where most of the alcohol is unrecorded, e.g. in East Africa where over 90% of alcohol consumed according to some estimates is unrecorded. Countries in Africa with a relatively high level of estimated unrecorded alcohol include Burundi (4.7 litres), Kenya (5.0 litres), Rwanda (4.3 litres), Seychelles (5.2 litres), Swaziland (4.1 litres), Uganda (10.7 litres) and Zimbabwe (9.0 litres). Also, certain countries in Eastern Europe and some of the former Soviet Union republics have a sizeable estimated unrecorded alcohol consumption e.g. Belarus (4.9 litres), Croatia (4.5 litres), Estonia (5.0 litres), Kazakhstan (4.9 litres), Latvia (7.0 litres), Republic of Moldova (12.0 litres), Russian Federation (4.9 litres), Slovakia (7.0 litres), and Ukraine (8.0 litres). Other countries with very high estimated unrecorded alcohol consumption include Mauritius (11.0 litres) and the Republic of Korea (7.0 litres). On a regional basis, unrecorded alcohol consumption is estimated to be at least two thirds of all alcohol consumption in the Indian subcontinent, about half of consumption in Africa, and about one third in Eastern Europe and Latin America (Rehm et al., 2003b).
WHO Global Status Report on Alcohol 2004
16
Table 5: Estimated volume of unrecorded consumption in litres of pure alcohol per capita for population older than 15 for the years after 1995
Country Unrecorded consumption Country
Unrecorded consumption Country
Unrecorded consumption
Albania 3.0 Fiji 1.0 Republic of Korea (the) 7.0 Algeria 0.3 Georgia 2.0 Republic of Moldova (the) 12.0 Argentina 1.0 Guatemala 2.0 Romania 4.0 Armenia 1.9 Guyana 2.0 Russian Federation (the) 4.9 Australia 0.0 Haiti 0.0 Rwanda 4.3 Austria 1.0 Honduras 2.0 Saudi Arabia 0.6 Azerbaijan 1.9 Hungary 4.0 Senegal 0.8 Barbados -0.5 Iceland 1.0 Seychelles 5.2 Belarus 4.9 India 1.7 Slovakia 7.0 Belgium 0.5 Iraq 1.0 Slovenia 1.3 Belize 2.0 Jamaica 1.0 South Africa 2.2 Bolivia 3.0 Japan 2.0 Spain 1.0 Botswana 3.0 Kazakhstan 4.9 Sri Lanka 0.5 Brazil 3.0 Kenya 5.0 Sudan 1.0 Bulgaria 3.0 Kyrgyzstan 2.0 Suriname 0.0 Burkina Faso 3.3 Latvia 7.0 Swaziland 4.1 Burundi 4.7 Lithuania 4.9 Syrian Arab Republic (the) 0.4 Cameroon 2.6 Luxembourg -1.0 Tajikistan 4.0 Chile 2.0 Malaysia 3.4 TFYR Macedonia 2.9 China 1.0 Mauritius 11.0 Thailand 2.0 Colombia 2.0 Mexico 3.0 Trinidad and Tobago 0.0 Costa Rica 2.0 Mongolia 2.0 Tunisia 0.5 Croatia 4.5 Myanmar 0.4 Turkey 2.7 Cuba 2.0 Nicaragua 0.5 Turkmenistan 1.0 Czech Republic (the) 1.0 Nigeria 3.5 Uganda 10.7 El Salvador 2.0 Paraguay 1.5 Ukraine 8.0 Eritrea 1.0 Peru 1.0 Uzbekistan 1.9 Estonia 5.0 Philippines (the) 3.0 Venezuela 2.0 Ethiopia 1.0 Poland 3.0 Zimbabwe 9.0
Source: Rehm & Gmel (2001)
One study that attempts to document the extent of unrecorded alcohol within the European Union (EU) is the ECAS project (European Comparative Alcohol Studies) which involved 13 EU member states (Greece and Luxembourg excluded) and Norway. According to this study, the approximate level of unrecorded alcohol consumption (litres of pure alcohol per inhabitant aged 15 or over) in the study countries ranged from about 0.5 litres (Netherlands and Belgium), around 1 litre (Austria, France, Germany, Ireland, Portugal and Spain), between 1 and 2 litres (Italy) and approximately 2 litres (Norway, Finland, Sweden, Denmark and the United Kingdom) (Leifman, 2001). The concern over the level of unrecorded alcohol has been the highest in the Nordic countries and in Norway and Sweden in particular. For example, in Norway, according to the Norwegian Institute for Alcohol and Drug Research (SIRUS), a notable amount of unrecorded alcohol is consumed in the country, mostly originating from legal (wine) or illegal home production, smuggling and travel imports. The proportion of the unrecorded alcohol is estimated at 25 to 30% of the total consumption (SIRUS, 2003). Estimates are even higher for other countries - in Lithuania for instance, it has been estimated that up to 65% of alcohol consumed in 1994 was illegally produced or imported (Logminiene
WHO Global Status Report on Alcohol 2004
17
et al., 2004). According to the 1999 Lithuanian Human Development Report published by the United Nations Development Program, consumption of alcohol is higher among the rural population. Traditions of drinking heavily became stronger when home brew alcohol became more widespread and accessible. The rural population in Lithuania remains the principal market for illegal alcohol (Subata, 1999).
In most cases, adult per capita (APC) alcohol consumption is useful for looking at population level trends in alcohol consumption, but they do not include unrecorded alcohol consumption, which in some countries is actually the majority of the alcohol available. In Nepal, for instance, unlicensed home-brewing accounts for a major part of alcohol production. In fact, the Liquor Control Act of Nepal allows for the production of homemade forms of alcohol for domestic use, although much homemade alcohol is produced for the market. Such activity takes place mostly in rural settings but also occurs in urban areas. The poor are quite often dependent on home-brewing for their livelihood (Jhingan et al., 2003). Variations may also exist within a country. In China for example, a 2001 survey of community residents in five areas of China found that 7.1% of respondents reported having consumed unrecorded alcoholic beverages in the three months prior to the interview (most frequently rice wine and paddy wine); the amount of unrecorded alcoholic beverage (in pure alcohol terms) accounted for 14.9% of overall alcohol consumption in the five areas studied. The amount of unrecorded alcohol consumption varied, e.g., in Shandong Province, 24.1% of respondents had consumed unrecorded alcoholic beverages in the past three months and the proportion of these beverages was 29.9% of the overall alcohol consumption (Hao et al., 2004). In most cases for APC, the national or local level data is more reliable than international data. When thinking about the impact on the overall level of alcohol consumption of issues like smuggling, tourism, overseas consumption, stockpiling, duty-free purchases, home- or informally produced alcohol, it is recommended that questions about sources of unrecorded alcohol should be added to national or regional drinking surveys.
The official sales statistics in a country do not, for various reasons, represent the actual consumption of alcoholic beverages among the inhabitants. Part of the unrecorded alcohol stems from consumption of alcohol when inhabitants are abroad and also from tax-free purchases. The first one is to a large extent included in the official statistics, but not in the country where the consumer lives. A European study looking at potential corrections for consumption abroad and tax-free purchases found that among the 15 countries of the study, the correction in the official sales was between +11.4% and -1.5%; on an aggregated level this corresponds to 2–3% of the official sales in the area (Trolldal, 2001).
It is not only for reasons of statistical accuracy that improved knowledge of unrecorded alcohol is needed. More important is the fact that variations in unrecorded alcohol consumption, both between and within countries over time, may indicate differences and changes in per capita consumption and in drinking patterns not otherwise revealed by changes in recorded consumption. Documentation of unrecorded alcohol is therefore of importance in alcohol policy studies, and especially in studying the links between alcohol policy, alcohol consumption and alcohol-related problems (Leifman, 2001).
WHO Global Status Report on Alcohol 2004
18
Traditional or local alcoholic beverages In many countries there are beverages which either fall outside of the usual beer, wine and spirits categories or which are traditionally produced at the local level, for example in villages and in homes. This kind of production seems especially common in many African countries, where a wide variety of different beverages can be found. Many of these are produced by fermentation of seeds, grains, fruit, vegetables or from palm trees, which is a rather simple procedure. Through fermentation the alcohol content does not rise very high and often the beverages have a very short shelf life before they are spoilt. Distillation is a more complex procedure requiring more equipment and time, but then the result is both more potent and has a longer shelf life date.
Even with the limited data available about prices, it seems that there is ground for the expectation that at least some home or locally made beverages are cheaper than mass or factory produced “branded” beverages. In some cases the price difference is quite significant. This means that it is mostly the poorer segments of the society which consume these local beverages, except in the case of some culturally important beverages which might have ceremonial value. In Nigeria for example, the alcoholic beverage called burukutu is popular in rural areas and in poor urban neighbourhoods because it is more affordable than commercially produced beer (Obot, 2000). Likewise, in the United Republic of Tanzania, domestically produced “homemade” or “informal-sector” drinks continue to dominate the market and local drinking habits (Green, 1999). In the case of Seychelles, although home brew is consumed only by a minority of the population (mainly of low socioeconomic status), home brew drinkers consumed particularly high amounts of alcohol derived from these homemade beverages. The much lower cost per alcohol unit of home brews compared to beer or spirits is likely to be an important factor to maintain home brew drinking in segments of the population (Bovet, 2001). Furthermore, in some countries (e.g. Namibia), the production of home-brewed beverages is the dominant channel for alcohol availability. Control was practically non-existent and cheap home-brewed beer found an easy market among the low-income or no-income consumers. Production of home-brewed beverages is closely connected to food production in both the urban and rural areas. The producers are a heterogenous group, but many of them are women, particularly widows or divorced older women. Especially for older women it is largely a question of improving their economic livelihoods (Mustonen, Beukes & Du Preez, 2001).
These traditional forms of alcohol are usually poorly monitored for quality and strength, and in most countries it is possible to find examples of health consequences related to harmful impurities and adulterants. Extreme cases might even result in death as was the case in Kenya in November 2000 where 140 people reportedly died, many went blind and hundreds were hospitalized after consuming an illegally brewed and poisonous liquor called kumi kumi in the poor neighbourhoods of Mukuru Kwa Njenga and Mukuru Kaiyaba. Made from sorghum, maize or millet, the alcoholic drink is common among Kenyans living in the country's low-income urban and rural areas who can ill-afford conventional legal beer. Kumi kumi contains methanol and other dangerous additives such as car battery acid and formalin (Mureithi, 2002). In Zimbabwe, it has been noted that in addition to home-brewed beer, alcohol industry representatives and government officials agree that there is a strong enough market for kachasu, a name given to home-distilled products with 10% to 70% alcohol content, to warrant it as a major problem. Occasional newspaper reports of alcohol poisonings from kachasu point not only to the high alcohol content, but also the continued use of lethal additives to speed drinkers to their desired high (Riley & Marshall, 1999). Similar cases have
WHO Global Status Report on Alcohol 2004
19
also been reported in Bangladesh, India and Somalia (see country profiles for details). When viewed from a public health and welfare perspective, it is important for the state to gain effective control and oversight over informal alcohol production and distribution. Licensing and inspection of production, whether it be a matter of cottage, of small factory or of full-scale industrial production, is an important means of eliminating adulterants (Rehm et al., 2003b).
Although more expensive, there is indication that industrially produced beverages, particularly lager-style beer, are gaining popularity in many developing countries, due perhaps to issues of prestige attached to international brands and increasing marketing efforts by multinational alcohol beverage companies (Babor et al., 2003).
It would seem that there may be health benefits from replacing cottage-produced with industrially-produced alcohol in terms of the purity of the product. However, these benefits should also be empirically verified, since they can easily be overstated (Room et al., 2002). On the other hand, it could be speculated that traditionally produced alcoholic beverages may potentially carry the benefits of having a lower alcohol content, providing local employment opportunities and preserving values of the local culture (which may or may not promote lower levels of alcohol consumption).
The following case examples present some information regarding local and traditional alcoholic beverages in selected countries. As mentioned earlier, there exists a wide range of beverages - what is interesting to note here is the social context in which these beverages are produced and consumed in different parts of the world.
Case example 1: India Country liquor is a distilled alcoholic beverage made from locally available cheap raw material such as sugar-cane, rice, palm, coconut and cheap grains, with an alcohol content between 25% and 45%. Common varieties of country liquor are arrack (from paddy or wheat), desi sharab and tari. Illicit liquor is mostly produced clandestinely in small production units with raw materials similar to that used for country liquor. With no legal quality control checks on them, alcohol concentration of illicit liquor varies (up to 56%). Adulteration is quite frequent, industrial methylated spirit being a common adulterant, which occasionally causes incidents like mass poisoning with consumers losing their lives or suffering irreversible damage to the eyes. Cheaper than licensed country liquor, illicit liquor is popular among the poorer sections of the population. In many parts of India, illicit production of liquor and its marketing is a cottage industry with each village having one or two units operating illegally. Source: Mohan et al. (2001)
Case example 2: Venezuela Corn liquor is consumed by an indigenous tribe in Venezuela. Several times each year, especially during the corn harvest season, the trunk of a large tree would be hollowed out and filled with corn mash by an individual specially chosen by the community. The corn mash would be allowed to ferment to create an alcoholic beverage with a high enough alcohol content to cause intoxication after consumption of only two glasses or gourdfuls. When the corn liquor is ready, a village festival would be held in which all adults would drink to the point of falling down. Men would typically bring their bows and arrows and fight to settle grudges. Festivals would end after two or three days, when the corn liquor ran out. There were rarely individuals who consumed alcoholic beverages at times other than festival celebrations. Source: Seale et al. (2002)

WHO Global Status Report on Alcohol 2004
20
Case example 3: Malaysia In the East Malaysian states of Sabah and Sarawak on the island of Borneo, indigenous people traditionally drink a homemade rice wine called tuak or tapai in conjunction with harvest celebrations and social or communal gatherings. This rice wine is reportedly very potent. At such important functions, especially the harvest festival, which is of much significance for these agrarian folk, almost all are required to drink. Refusal by guests to partake of these drinks is a breach of etiquette. Such drinking is an integral part of the culture of these tribes. Source: Arokiasamy (1995)
Case example 4: Uganda Tonto is a traditional brew produced from juice obtained from special varieties of bananas. The common local banana varieties used in making tonto are kisubi, ndizi, musa, kivuru, kabula and mbidde. Another common name used for the brew in central Uganda is mwenge bigere. It is mostly consumed in central and western Uganda, where banana growing is a major agricultural activity, and in urban areas all around the country at social gatherings and in bars. In various parts of the country, it is a source of income for many families. The production of tonto is as follows: Green bananas are ripened for 3–5 days in a covered, previously warmed, pit lined with banana leaves to ensure uniform temperature. The juice is extracted from the ripe banana by squeezing, by a group of men using their feet after mixing with spear grass. The juice is then filtered through grass held in a calabash funnel and diluted with water in known ratios. Roasted and ground sorghum is added to the diluted banana juice in a canoe-shaped wood container. The fermentation broth is then covered with banana leaves and split banana stems in a warmed pit and incubated for 2–4 days. The alcohol content in tonto ranges between 6 and 11% v/v and is consumed from small gourds using straws. Source: Mwesigye & Okurut (1995)
Case example 5: Botswana Bojalwa (sorghum beer) and khadi are both home-brewed beer-like drinks that vary greatly in terms of taste, consistency and alcohol content depending on availability of ingredients and methods of fermentation. Indeed khadi could almost be described as a ‘designer alcohol’ often brewed to the consumer’s needs and tastes. It is made from a base or ‘mash’ that can consist of a combination of any of the following ingredients: wild berries, wild pumpkins, wild roots, oranges, sorghum and maize. Yeast, black tobacco or other unspecified substances are sometimes added to this base to give it ‘strength’, and there have been rumours around Ghanzi of car battery acid also being added. Source: Molamu & Macdonald (1996)
Case example 6: Ethiopia Talla is an Ethiopian home-brewed beer which differs from the others in some respects. First it is brewed with barley or wheat, hops, or spices. Secondly, it has a smoky flavour due to the addition of bread darkened by baking and use of a fermentation vessel which has been smoked by inversion over smoldering wood. Talla is not processed under government regulations hence the alcohol content varies but is usually around 2% to 4%. Filtered tella has a higher alcohol content ranging from 5% to 6%. Source: Selinus (2004)

WHO Global Status Report on Alcohol 2004
21
Case example 7: Egypt Bouza (traditional beer) is a fermented alcoholic beverage produced from wheat in Egypt, and has been known by the Egyptians since the days of the Pharaohs. It is a thick, pasty yellow beverage and produces a sensation of heat when consumed. Like other opaque beers, bouza has a very short shelf life and is expected to be consumed within a day. It has an alcoholic content of between 3.8% and 4.2%. Source: Haard (1999)
Case example 8: Ghana Pito (local brew made from millet) is widely consumed in Ghana. The brewing of pito is traditionally associated with the people in the northern part of the country, but migration has led to its production throughout the country. The industry is mostly controlled by women between the ages of 18 and 67 years old. Pito is golden yellow to dark brown in colour with taste varying from slightly sweet to very sour. It contains lactic acid, sugars, amino acids, 2% to 3% alcohol and some vitamins and proteins. There are four types of pito in Ghana – nandom, kokmba, togo and dagarti. The peculiar characteristics of each lies in the differences in their wort extraction and fermentation methods. Source: Akyeampong (1995); Sefa-Dedeh (1999)
Case example 9: Kenya Muratina is an alcoholic drink made from sugar-cane and muratina fruit in Kenya. The fruit is cut in half, sun-dried and boiled in water. The water is removed and the fruit sun-dried again. The fruit is added to a small amount of sugar-cane juice and incubated in a warm place. The fruit is removed from the juice after 24 hours and sun-dried. The fruit is now added to a barrel of sugar-cane juice which is allowed to ferment for between one and four days. The final product has a sour alcoholic taste. Source: The Schumacher Centre for Technology & Development (2004)
Case example 10: United Republic of Tanzania A study that collected and analysed 15 homemade but commercially available alcoholic beverages in Dar es Salaam found that ethanol concentrations of the brewed samples ranged from 2.2 to 8.5% w/v whilst the two distilled samples contained 24.2% and 29.3% ethanol w/v. Aflatoxin B1 was found in nine brewed beverages, suggesting the use of contaminated grains or fruit for their production. The amount of zinc in four samples was double the World Health Organization recommended maximum for drinking water (5 mg/litre). One brewed beverage contained toxic amounts of manganese (12.8 mg/litre). Both distilled spirits were rich in fusel alcohols and one was fortified by caffeine. The results suggested that impurities and contaminants possibly associated with severe health risks, including carcinogens, are often found in traditional alcoholic beverages. Continuous daily drinking of these beverages is certain to increase health risks. Source: Nikander et al. (1991)

WHO Global Status Report on Alcohol 2004
22
Drinking patterns The consumption of alcoholic beverages can be studied from a number of viewpoints, ranging from the viewpoint of an economist to that of a cultural anthropologist. When viewed from a public health perspective, alcoholic beverages can potentially be an agent of illness and mortality. Depending on the consumption pattern, use of alcoholic beverages can elevate the drinker’s risk of health problems (traffic and other accidents, chronic illness such as cirrhosis and cancer, and mental disorders such as alcohol dependence) as well as social problems (inability to cope with work, family and other roles, and harm to those in the drinker's surrounding environment). Against this burden, there is some evidence that small amounts of alcohol may play a protective role in heart disease (Midanik & Room, 1992; Corrao et al., 2000).
The distribution of drinking patterns in the population at large is of interest from all these perspectives, although different perspectives tend to emphasize different aspects of drinking. A public health analysis should take into account environmental factors, because they put drinking in its socioeconomic context and can provide important information on potential means of harm reduction. However, a public health analysis should also take into account the amount of alcohol consumed, because the alcohol content of beverages is a key risk factor for its various adverse consequences – as a biochemical agent in the development of chronic health problems, as an intoxicant involved in accidents and other acute problems, and as a dependence-causing substance in chronic problems (Midanik & Room, 1992).
Alcohol consumption in the population can be measured in two main ways: by analysing production and distribution statistics for alcoholic beverages as market commodities and by asking samples of the population questions about their drinking behaviour (Midanik & Room, 1992).
Survey data offer important advantages. In the first place, it is one way to measure, however imperfectly, the alcohol consumption, which is not recorded in official statistics – which in many countries constitutes the greater share of total alcohol consumption. Second, survey data can give a picture of the social location of drinking in a society, and also allows a direct focus on charting the distribution and correlates in the population of the patterns of drinking most likely to be associated with harm – intoxication episodes, and long-term heavy drinking. Third, a survey offers a way to measure directly alcohol-related problems, which do not show up in police or health statistics: problems in family life, for instance, or in work performance. Fourth, analyses of survey data can explore directly the relationship between patterns and contexts of drinking and the occurrence of social and health problems. Fifth, when surveys are repeated over time, they can be used to monitor the situation in the society and to evaluate policy initiatives (WHO, 2001b).
However, the most important advantage of survey data over consumption statistics is that each respondent’s patterns are recorded separately. A person’s drinking pattern can thus be related to other personal characteristics and behaviours. Drinking patterns can be surveyed for all kinds of population subgroups, whereas consumption statistics can be broken down only geographically.
A further advantage of survey data is that they allow a detailed examination of different facets of drinking behaviour. Many drinkers have quite complex patterns of drinking. Consider an example of a week’s drinking by a relatively heavy-drinking respondent (adapted from Midanik & Room, 1992):

WHO Global Status Report on Alcohol 2004
23
one drink after work on Monday with a work client
two drinks with family dinner on Monday, Tuesday and Thursday
no drinks on Wednesday
eight drinks at a party on Friday night
two drinks on a Saturday afternoon while relaxing in the backyard
four drinks out at dinner with friends on Saturday evening
no drinks on Sunday
The respondent’s pattern can be summarized in a number of ways. In terms of volume of drinking, here the respondent drinks, on average, three drinks a day. In terms of frequency of drinking, the respondent drinks nearly every day – 5 days out of 7. But neither of these summaries provides a sense of variability in the drinking pattern – that the respondent drinks relatively moderate amounts on most days, but sometimes drinks much larger amounts. This aspect of drinking can be covered by a measure of dispersion (like the standard deviation), or with a summary of how often the respondent drinks more than a certain amount. For example, this respondent probably falls into the category of heavy episodic drinking – consuming five or more drinks on one occasion at least once a week (Midanik & Room, 1992).
The aspect of drinking pattern that should be emphasized during data collection and analysis depends in part on the purpose of the research. When viewed as a risk factor for many long-term physical consequences of drinking – such as cirrhosis of the liver – the overall volume of drinking is probably the most important aspect. But as a risk factor for accidents or social disruptions, it is the individual episodes of heavy drinking that are of interest, in combination with the drinking context. The greatest immediate risk associated with the above sample respondent’s drinking week, for instance, would probably be if he or she attempted to drive home on Friday or Saturday night. For studies attuned to such consequences, the average number of drinks per day is less important than the frequency of drinking large amounts of alcohol. Someone who drinks one drink at lunch and two with dinner every day, for example, would be at less risk for problems associated with intoxication than the sample respondent, although the overall volume of drinking would be the same (Midanik & Room, 1992).
The modern tradition of survey research on drinking patterns and problems in the general population is a rather recent development. Some countries (mainly developed ones) have established in about the last 30 years or so a tradition of repeated surveys, allowing trends and developments to be monitored in the whole society and in subgroups of the population. Survey research on drinking patterns and problems in developing societies is much less common (although some exceptions such as in Costa Rica, India and Mexico can be found). Such surveys have contributed important information on the demography of drinking – where different patterns on drinking (or abstention) are distributed by subgroups of the population formed by differentiations such as gender, age, socioeconomic status and region of residence. They might have become a way of gathering information on alcohol consumption not recorded in official statistics. As a society builds up a tradition of such surveys, they also become tools for monitoring trends in different social groups, and sometimes for evaluating the effects of policy interventions in the society. They thus become an important tool for alcohol policymaking in a public health perspective (WHO, 2001b).

WHO Global Status Report on Alcohol 2004
24
This report looked at rates of alcohol abstainers, some measure of heavy and hazardous drinking, high risk drinking or problem drinking, heavy episodic drinking or binge drinking and alcohol dependence.
Who are the abstainers?
As can be seen in Table 6, the rates of abstainers vary considerably across countries. The proportion of last year abstainers among the total adult population reported across countries ranged from a low of 2.5% in Luxembourg to a high of 99.5% in Egypt. In relation to lifetime abstainers (have never tried alcohol) among the total adult population, the rates range from 9.4% in Latvia to 98.4% in the Comoros (see country profiles for more information). Care must be taken when interpreting this table as the cut-off age for different countries varies (from 12 years and above to 18 years and above). Given the role of alcohol in different societies, these differences may be quite easily explained. The one consistency that appears to transcend cultures is the difference in abstention rates between males and females. A higher proportion of women abstain from alcohol than men. A second common finding is the role of religion in shaping drinking habits. For instance, countries with Islam as the official religion almost always have higher rates of abstinence. However, in each case, one must keep in mind that patterns of abstinence, like drinking patterns, may vary within specific subpopulations and across different regions of a particular country. This is especially true for multicultural and multiethnic societies, in which different groups may represent quite diverse traditions with respect to alcohol.
Table 6: Rate of last year abstainers among the adult population
Country Year Total (%) Male (%) Female (%)
Albania 1995 24.0 12.0 36.0 Algeria 1995 89.0 80.0 98.0 Argentinaa 2003 16.2 7.5 23.2 Armenia 1995 24.0 12.0 36.0 Australia 2001 17.5 14.1 20.8 Austria 1993 11.0 5.8 16.1 Azerbaijan 1995 24.0 12.0 36.0 Barbados 1995 49.5 29.0 70.0 Belarus 1995 3.0 2.0 4.0 Belgium 2001 18.9 11.5 25.8 Belize 1995 34.0 24.0 44.0 Benina,b 1998 N.A. 16.8 14.3 Bolivia 1995 34.5 24.0 45.0 Botswana 1995 53.5 37.0 70.0 Brazila 2001–2002 51.5 40.0 60.5 Bulgaria 1997 N.A. 32.1 65.1 Cambodia 1995 85.0 74.0 96 Canadab 1998–1999 22.1 17.8 26.1 Chile 2002 25.3 22.0 28.6 Chinaa 2000–2001 48.6 27.5 73.1 Colombia 2000–2001 15.1 4.9 20.7 Costa Rica 1995 60.0 45.0 75.0 Cuba 1995 49.5 29.0 70.0 Cyprus 1995 8.0 1.0 15.0 Czech Republic (the) 2002 14.6 9.1 20.0

WHO Global Status Report on Alcohol 2004
25
Country Year Total (%) Male (%) Female (%)
Denmarkb 1997–1998 3.0 2.0 4.0 Egypt 2000–2001 99.5 99.0 100.0 El Salvador 1995 23.5 9.0 38.0 Fijib 1993 88.7 78.8 97.9 Finland 2000 7.4 7.1 7.7 France 1999 6.7 4.3 8.9 Georgia 2000–2001 22.9 8.7 33.5 Germany 2000 5.1 4.3 5.9 Greece 1995 8.0 1.0 15.0 Guatemala 1995 53.5 45.0 62.0 Guyana 1995 30.0 20.0 40.0 Haiti 1995 60.0 58.0 62.0 Honduras 1995 23.5 9.0 38.0 Hungary 2001 17.5 9.2 25.5 Iceland 2003 11.8 11.4 12.2 Indiaa 2000–2001 79.1 67.1 89.3 Indonesia 2000–2001 94.8 89.8 98.9 Iraq 1995 89.0 80.0 98.0 Irelandc 2002 22.0 17.0 26.0 Israel 2001 35.5 25.7 45.4 Italy 2000 25.0 36.4 12.8 Jamaica 2001 57.6 43.8 69.4 Japan 2001 13.5 7.4 19.7 Jordan 1995 86.0 74.0 98.0 Kenya 1995 55.0 45.0 65.0 Kiribatib 1981 73.1 51.4 92.9 Kyrgyzstan 1995 70.0 60.0 80.0 Lebanon 2000–2001 77.4 67.4 86.7 Lesothoa,b N.A. 74.0 47.0 81.0 Lithuania 1999 20.0 10.0 28.0 Luxembourg 1995 2.5 1.0 4.0 Malaysia 1995 49.5 35.0 64.0 Marshall Islands (the) N.A. 66.3 80.6 95.5 Mexico 1998 41.6 22.4 55.0 Micronesia (Federated States of) N.A. 67.6 45.1 90.9 Mongolia 1995 41.5 20.0 63.0 Myanmar 1995 69.5 45.0 94.0 Namibia 1998 N.A. 39.0 53.0 Netherlands (the) 2001 15.8 9.4 21.8 New Zealandb 2000 15.0 12.0 17.0 Nicaragua 1995 23.5 9.0 38.0 Nigeriaa 2000–2001 75.6 51.3 89.6 Norway 1999 6.0 5.8 6.2 Pakistan 1995 94.5 90.0 99.0 Palau 1990–1991 N.A. 23.1 64.2 Papua New Guinea 1995 54.5 22.0 87.0 Paraguay 1995 28.0 18.0 38.0 Peru 2002 24.9 20.2 29.0 Philippines (the) 1995 40.0 10.0 70.0 Poland 1995 19.0 12.0 26.0 Portugal 1995 15.5 7.0 24.0

WHO Global Status Report on Alcohol 2004
26
Country Year Total (%) Male (%) Female (%)
Republic of Korea (the)b 2001 27.1 12.4 38.9 Republic of Moldova (the) 1995 13.5 9.0 18.0 Romania 1995 38.0 23.0 53.0 Russian Federation (the) 1996 23.1 9.0 35.0 Saudi Arabia 1995 97.0 95.0 99.0 Seychelles 1995 27.5 10.0 45.0 Singapore 2000–2001 74.5 66.6 82.3 Slovakia 2000–2001 7.7 3.6 10.4 Slovenia 1995 24.0 12.0 36.0 South Africa 1995 69.0 55.0 83.0 Spaina 2003 37.7 26.9 48.7 Sri Lanka 2002 67.6 41.4 92.9 Suriname 1995 42.5 30.0 55.0 Sweden 2002 11.3 8.0 14.7 Switzerland 2002 22.5 14.2 30.4 Syrian Arab Republic (the) 2000–2001 95.7 92.4 98.8 Tajikistan 1995 70.0 60.0 80.0 Thailandb 2001 67.4 44.1 90.2 TFYR Macedoniad 1995 24.0 12.0 36.0 Tokelaue 1976 N.A. 50.0 92.0 Trinidad and Tobago 1995 49.5 29.0 70.0 Tunisia 1995 82.5 70.0 95.0 Turkey 2000–2001 80.4 77.5 82.5 Turkmenistan 1995 45.0 35.0 55.0 Ugandaa 2003 54.3 48.2 60.3 The United Kingdom 2000 12.0 9.0 14.0 United States of America (the) 2002 33.9 29.3 38.2 Uzbekistan 1995 70.0 60.0 80.0 Venezuela 1995 42.5 30.0 55.0 a Regional survey b No definition of abstainers given. c Last month abstainers d The former Yugoslav Republic of Macedonia e Current abstainers Note: Please refer to individual country profiles for details of references/sources used.
Who are the heavy drinkers?
Heavy drinking is a pattern of drinking that exceeds some standard of moderate drinking or –more equivocally – social drinking. Heavy drinking is often defined in terms of exceeding a certain daily volume (e.g. three drinks a day) or quantity per occasion (e.g. five drinks on an occasion, at least once a week), or daily drinking. Such persistent patterns of drinking may incur acute or chronic health and social consequences on the drinker in question. Table 7 presents some data for selected countries with data on heavy drinkers. Note that this table is not comparable as different surveys have varying definitions of heavy drinking and samples cover different age ranges. However, the majority of the data below are for the adult population of 18 years and above.
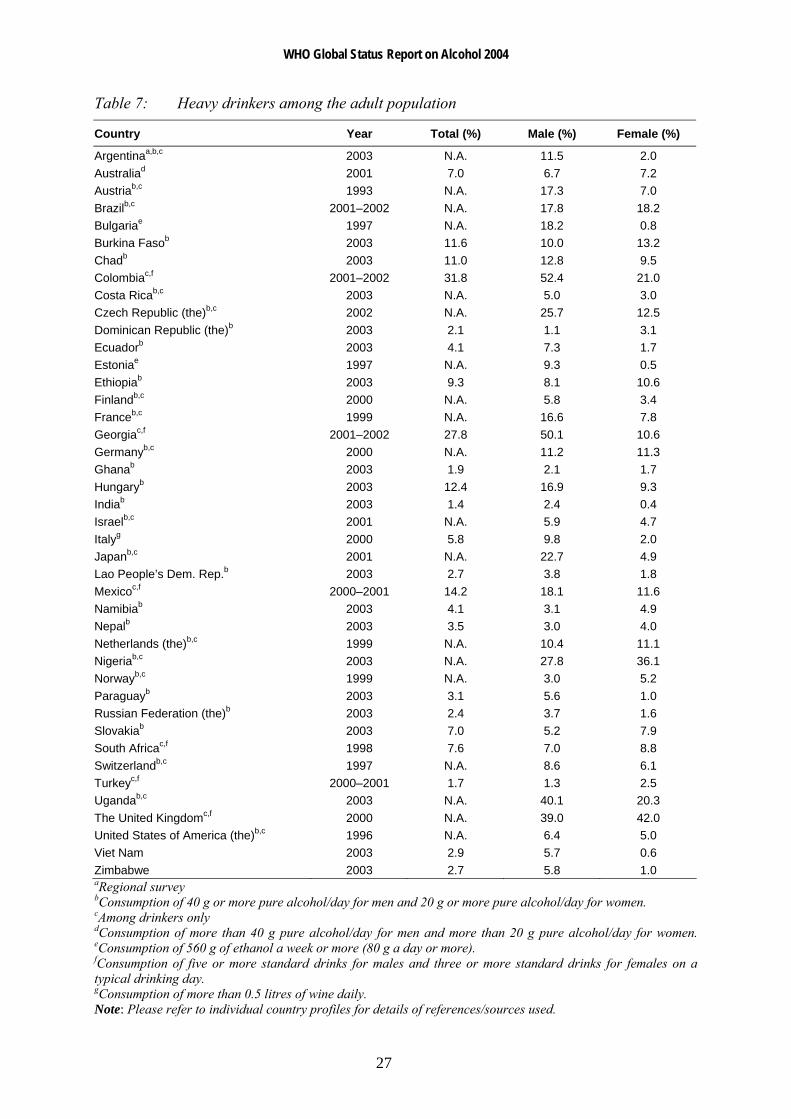
WHO Global Status Report on Alcohol 2004
27
Table 7: Heavy drinkers among the adult population
Country Year Total (%) Male (%) Female (%)
Argentinaa,b,c 2003 N.A. 11.5 2.0 Australiad 2001 7.0 6.7 7.2 Austriab,c 1993 N.A. 17.3 7.0 Brazilb,c 2001–2002 N.A. 17.8 18.2 Bulgariae 1997 N.A. 18.2 0.8 Burkina Fasob 2003 11.6 10.0 13.2 Chadb 2003 11.0 12.8 9.5 Colombiac,f 2001–2002 31.8 52.4 21.0 Costa Ricab,c 2003 N.A. 5.0 3.0 Czech Republic (the)b,c 2002 N.A. 25.7 12.5 Dominican Republic (the)b 2003 2.1 1.1 3.1 Ecuadorb 2003 4.1 7.3 1.7 Estoniae 1997 N.A. 9.3 0.5 Ethiopiab 2003 9.3 8.1 10.6 Finlandb,c 2000 N.A. 5.8 3.4 Franceb,c 1999 N.A. 16.6 7.8 Georgiac,f 2001–2002 27.8 50.1 10.6 Germanyb,c 2000 N.A. 11.2 11.3 Ghanab 2003 1.9 2.1 1.7 Hungaryb 2003 12.4 16.9 9.3 Indiab 2003 1.4 2.4 0.4 Israelb,c 2001 N.A. 5.9 4.7 Italyg 2000 5.8 9.8 2.0 Japanb,c 2001 N.A. 22.7 4.9 Lao People’s Dem. Rep.b 2003 2.7 3.8 1.8 Mexicoc,f 2000–2001 14.2 18.1 11.6 Namibiab 2003 4.1 3.1 4.9 Nepalb 2003 3.5 3.0 4.0 Netherlands (the)b,c 1999 N.A. 10.4 11.1 Nigeriab,c 2003 N.A. 27.8 36.1 Norwayb,c 1999 N.A. 3.0 5.2 Paraguayb 2003 3.1 5.6 1.0 Russian Federation (the)b 2003 2.4 3.7 1.6 Slovakiab 2003 7.0 5.2 7.9 South Africac,f 1998 7.6 7.0 8.8 Switzerlandb,c 1997 N.A. 8.6 6.1 Turkeyc,f 2000–2001 1.7 1.3 2.5 Ugandab,c 2003 N.A. 40.1 20.3 The United Kingdomc,f 2000 N.A. 39.0 42.0 United States of America (the)b,c 1996 N.A. 6.4 5.0 Viet Nam 2003 2.9 5.7 0.6 Zimbabwe 2003 2.7 5.8 1.0 aRegional survey bConsumption of 40 g or more pure alcohol/day for men and 20 g or more pure alcohol/day for women. cAmong drinkers only dConsumption of more than 40 g pure alcohol/day for men and more than 20 g pure alcohol/day for women. eConsumption of 560 g of ethanol a week or more (80 g a day or more). fConsumption of five or more standard drinks for males and three or more standard drinks for females on a typical drinking day. gConsumption of more than 0.5 litres of wine daily. Note: Please refer to individual country profiles for details of references/sources used.
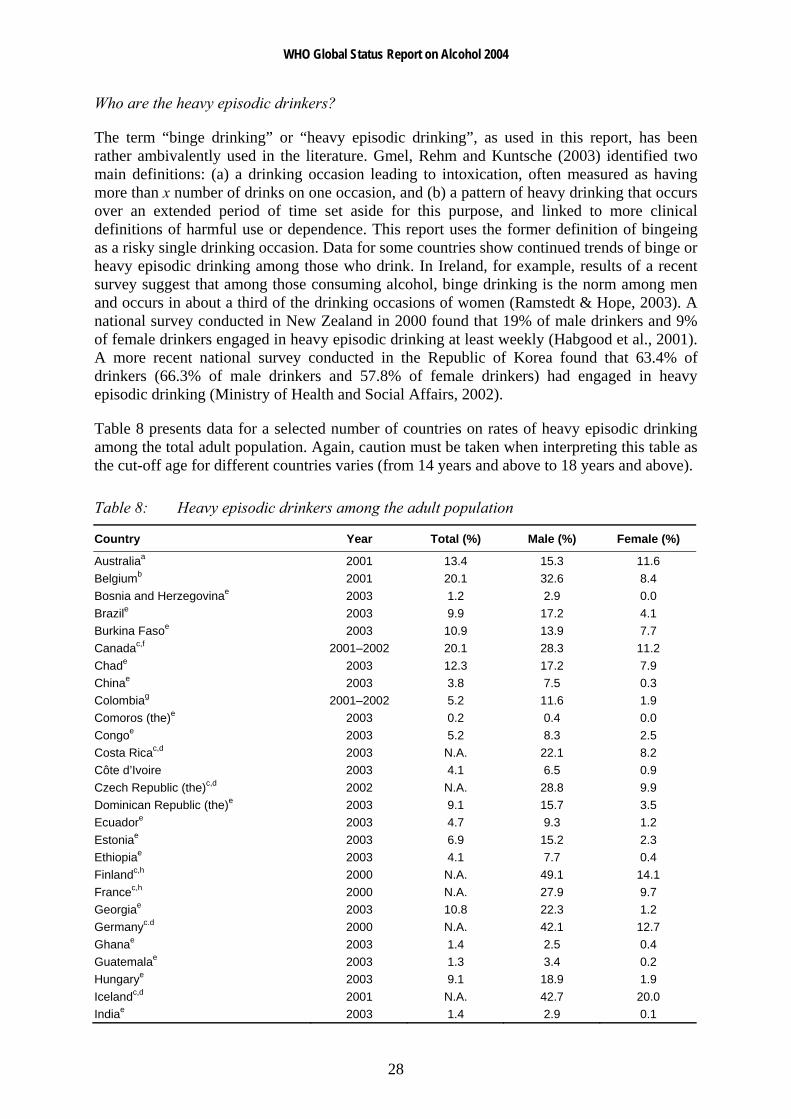
WHO Global Status Report on Alcohol 2004
28
Who are the heavy episodic drinkers?
The term “binge drinking” or “heavy episodic drinking”, as used in this report, has been rather ambivalently used in the literature. Gmel, Rehm and Kuntsche (2003) identified two main definitions: (a) a drinking occasion leading to intoxication, often measured as having more than x number of drinks on one occasion, and (b) a pattern of heavy drinking that occurs over an extended period of time set aside for this purpose, and linked to more clinical definitions of harmful use or dependence. This report uses the former definition of bingeing as a risky single drinking occasion. Data for some countries show continued trends of binge or heavy episodic drinking among those who drink. In Ireland, for example, results of a recent survey suggest that among those consuming alcohol, binge drinking is the norm among men and occurs in about a third of the drinking occasions of women (Ramstedt & Hope, 2003). A national survey conducted in New Zealand in 2000 found that 19% of male drinkers and 9% of female drinkers engaged in heavy episodic drinking at least weekly (Habgood et al., 2001). A more recent national survey conducted in the Republic of Korea found that 63.4% of drinkers (66.3% of male drinkers and 57.8% of female drinkers) had engaged in heavy episodic drinking (Ministry of Health and Social Affairs, 2002).
Table 8 presents data for a selected number of countries on rates of heavy episodic drinking among the total adult population. Again, caution must be taken when interpreting this table as the cut-off age for different countries varies (from 14 years and above to 18 years and above).
Table 8: Heavy episodic drinkers among the adult population
Country Year Total (%) Male (%) Female (%)
Australiaa 2001 13.4 15.3 11.6 Belgiumb 2001 20.1 32.6 8.4 Bosnia and Herzegovinae 2003 1.2 2.9 0.0 Brazile 2003 9.9 17.2 4.1 Burkina Fasoe 2003 10.9 13.9 7.7 Canadac,f 2001–2002 20.1 28.3 11.2 Chade 2003 12.3 17.2 7.9 Chinae 2003 3.8 7.5 0.3 Colombiag 2001–2002 5.2 11.6 1.9 Comoros (the)e 2003 0.2 0.4 0.0 Congoe 2003 5.2 8.3 2.5 Costa Ricac,d 2003 N.A. 22.1 8.2 Côte d’Ivoire 2003 4.1 6.5 0.9 Czech Republic (the)c,d 2002 N.A. 28.8 9.9 Dominican Republic (the)e 2003 9.1 15.7 3.5 Ecuadore 2003 4.7 9.3 1.2 Estoniae 2003 6.9 15.2 2.3 Ethiopiae 2003 4.1 7.7 0.4 Finlandc,h 2000 N.A. 49.1 14.1 Francec,h 2000 N.A. 27.9 9.7 Georgiae 2003 10.8 22.3 1.2 Germanyc.d 2000 N.A. 42.1 12.7 Ghanae 2003 1.4 2.5 0.4 Guatemalae 2003 1.3 3.4 0.2 Hungarye 2003 9.1 18.9 1.9 Icelandc,d 2001 N.A. 42.7 20.0 Indiae 2003 1.4 2.9 0.1
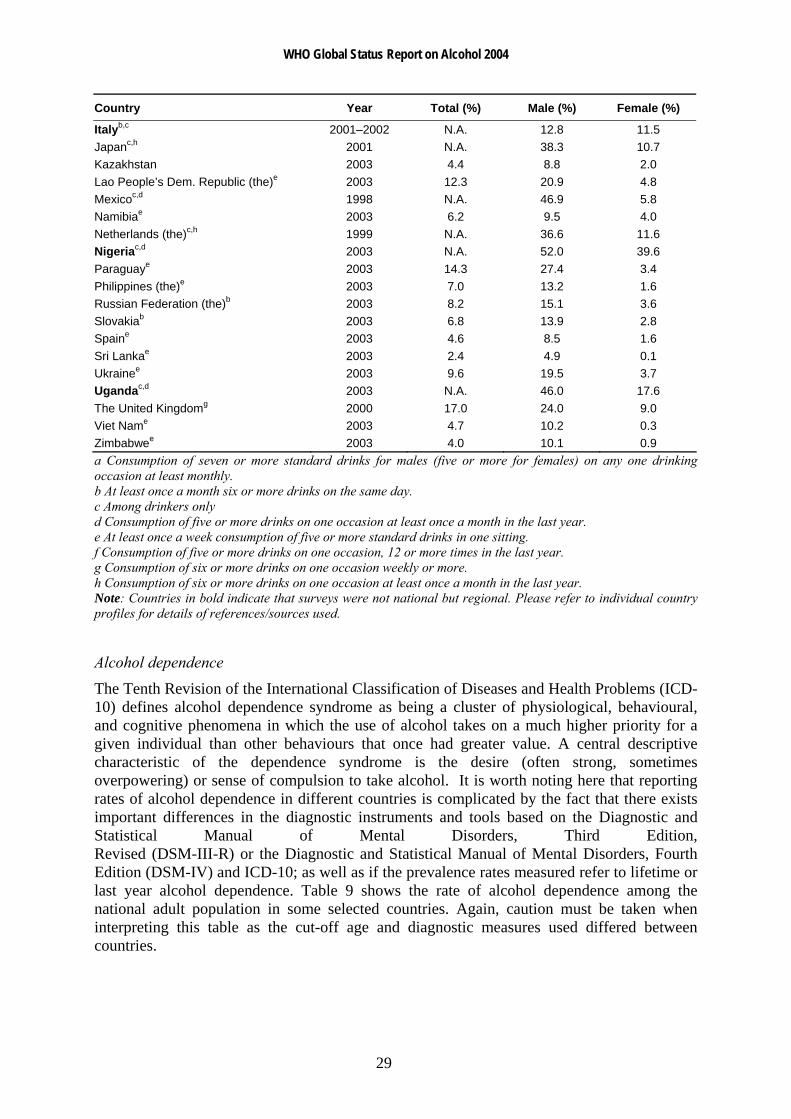
WHO Global Status Report on Alcohol 2004
29
Country Year Total (%) Male (%) Female (%)
Italyb,c 2001–2002 N.A. 12.8 11.5 Japanc,h 2001 N.A. 38.3 10.7 Kazakhstan 2003 4.4 8.8 2.0 Lao People’s Dem. Republic (the)e 2003 12.3 20.9 4.8 Mexicoc,d 1998 N.A. 46.9 5.8 Namibiae 2003 6.2 9.5 4.0 Netherlands (the)c,h 1999 N.A. 36.6 11.6 Nigeriac,d 2003 N.A. 52.0 39.6 Paraguaye 2003 14.3 27.4 3.4 Philippines (the)e 2003 7.0 13.2 1.6 Russian Federation (the)b 2003 8.2 15.1 3.6 Slovakiab 2003 6.8 13.9 2.8 Spaine 2003 4.6 8.5 1.6 Sri Lankae 2003 2.4 4.9 0.1 Ukrainee 2003 9.6 19.5 3.7 Ugandac,d 2003 N.A. 46.0 17.6 The United Kingdomg 2000 17.0 24.0 9.0 Viet Name 2003 4.7 10.2 0.3 Zimbabwee 2003 4.0 10.1 0.9 a Consumption of seven or more standard drinks for males (five or more for females) on any one drinking occasion at least monthly. b At least once a month six or more drinks on the same day. c Among drinkers only d Consumption of five or more drinks on one occasion at least once a month in the last year. e At least once a week consumption of five or more standard drinks in one sitting. f Consumption of five or more drinks on one occasion, 12 or more times in the last year. g Consumption of six or more drinks on one occasion weekly or more. h Consumption of six or more drinks on one occasion at least once a month in the last year. Note: Countries in bold indicate that surveys were not national but regional. Please refer to individual country profiles for details of references/sources used.
Alcohol dependence
The Tenth Revision of the International Classification of Diseases and Health Problems (ICD-10) defines alcohol dependence syndrome as being a cluster of physiological, behavioural, and cognitive phenomena in which the use of alcohol takes on a much higher priority for a given individual than other behaviours that once had greater value. A central descriptive characteristic of the dependence syndrome is the desire (often strong, sometimes overpowering) or sense of compulsion to take alcohol. It is worth noting here that reporting rates of alcohol dependence in different countries is complicated by the fact that there exists important differences in the diagnostic instruments and tools based on the Diagnostic and Statistical Manual of Mental Disorders, Third Edition, Revised (DSM-III-R) or the Diagnostic and Statistical Manual of Mental Disorders, Fourth Edition (DSM-IV) and ICD-10; as well as if the prevalence rates measured refer to lifetime or last year alcohol dependence. Table 9 shows the rate of alcohol dependence among the national adult population in some selected countries. Again, caution must be taken when interpreting this table as the cut-off age and diagnostic measures used differed between countries.
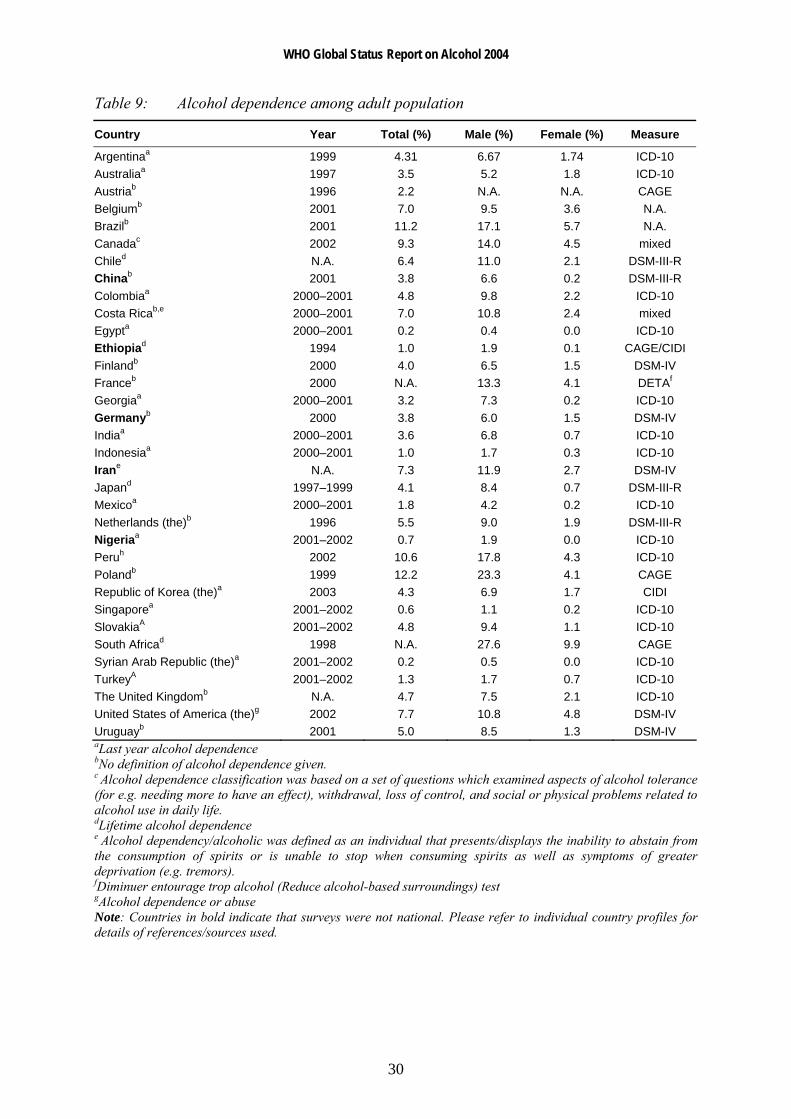
WHO Global Status Report on Alcohol 2004
30
Table 9: Alcohol dependence among adult population
Country Year Total (%) Male (%) Female (%) Measure
Argentinaa 1999 4.31 6.67 1.74 ICD-10 Australiaa 1997 3.5 5.2 1.8 ICD-10 Austriab 1996 2.2 N.A. N.A. CAGE Belgiumb 2001 7.0 9.5 3.6 N.A. Brazilb 2001 11.2 17.1 5.7 N.A. Canadac 2002 9.3 14.0 4.5 mixed Chiled N.A. 6.4 11.0 2.1 DSM-III-R Chinab 2001 3.8 6.6 0.2 DSM-III-R Colombiaa 2000–2001 4.8 9.8 2.2 ICD-10 Costa Ricab,e 2000–2001 7.0 10.8 2.4 mixed Egypta 2000–2001 0.2 0.4 0.0 ICD-10 Ethiopiad 1994 1.0 1.9 0.1 CAGE/CIDI Finlandb 2000 4.0 6.5 1.5 DSM-IV Franceb 2000 N.A. 13.3 4.1 DETAf
Georgiaa 2000–2001 3.2 7.3 0.2 ICD-10 Germanyb 2000 3.8 6.0 1.5 DSM-IV Indiaa 2000–2001 3.6 6.8 0.7 ICD-10 Indonesiaa 2000–2001 1.0 1.7 0.3 ICD-10 Irane N.A. 7.3 11.9 2.7 DSM-IV Japand 1997–1999 4.1 8.4 0.7 DSM-III-R Mexicoa 2000–2001 1.8 4.2 0.2 ICD-10 Netherlands (the)b 1996 5.5 9.0 1.9 DSM-III-R Nigeriaa 2001–2002 0.7 1.9 0.0 ICD-10 Peruh 2002 10.6 17.8 4.3 ICD-10 Polandb 1999 12.2 23.3 4.1 CAGE Republic of Korea (the)a 2003 4.3 6.9 1.7 CIDI Singaporea 2001–2002 0.6 1.1 0.2 ICD-10 SlovakiaA 2001–2002 4.8 9.4 1.1 ICD-10 South Africad 1998 N.A. 27.6 9.9 CAGE Syrian Arab Republic (the)a 2001–2002 0.2 0.5 0.0 ICD-10 TurkeyA 2001–2002 1.3 1.7 0.7 ICD-10 The United Kingdomb N.A. 4.7 7.5 2.1 ICD-10 United States of America (the)g 2002 7.7 10.8 4.8 DSM-IV Uruguayb 2001 5.0 8.5 1.3 DSM-IV aLast year alcohol dependence bNo definition of alcohol dependence given. c Alcohol dependence classification was based on a set of questions which examined aspects of alcohol tolerance (for e.g. needing more to have an effect), withdrawal, loss of control, and social or physical problems related to alcohol use in daily life. dLifetime alcohol dependence e Alcohol dependency/alcoholic was defined as an individual that presents/displays the inability to abstain from the consumption of spirits or is unable to stop when consuming spirits as well as symptoms of greater deprivation (e.g. tremors). fDiminuer entourage trop alcohol (Reduce alcohol-based surroundings) test gAlcohol dependence or abuse Note: Countries in bold indicate that surveys were not national. Please refer to individual country profiles for details of references/sources used.

WHO Global Status Report on Alcohol 2004
31
Youth drinking
With the large exception of Europe and North America, there is little uniformity in the means and scales used to monitor alcohol consumption among young people. Although it is more common for countries to survey their young populations regarding alcohol use than to conduct national population surveys, the range of ages being surveyed and of definitions of categories of consumption used render cross-national comparisons difficult in most regions.
In Europe, two large-scale international studies have been carried out in an attempt to collect comparable data on alcohol use among young people. The European School Survey Project on Alcohol and other Drugs (ESPAD) was conducted for the first time in 1995 and subsequently in 1999 and 2003. This study examined drinking (also smoking and illicit drug use) among representative samples of 15–16-year-old school students in Europe. The second ESPAD study carried out in 1999 involved more than 90 000 students from a total of 30 countries. This is probably the largest international study of the social and behavioural aspects of alcohol epidemiology ever attempted (Plant & Miller, 2001). The Health Behaviour in School Children (HBSC) study, established in 1982, is conducted by an international network of research teams in collaboration with the WHO Regional Office for Europe. It aims to gain new insight into and to increase understanding of young people’s health, well-being, health behaviour and social context. There have since been several rounds of the HSBC surveys being conducted every four years involving young people aged 11 to 15 years. The most recent surveys were in 2001/2002 whereby 35 countries and regions participated (WHO, 2004d).
Other examples of large-scale studies on youth and alcohol include the Monitoring the Future Survey (MTF) – an annual survey among 8th, 10th, and 12th graders in the United States, the Youth Risk Behavior Survey conducted among students in grades 9 to 12 in the United States, and the Harvard School of Public Health College Alcohol Study, and the recently initiated Health Behaviour and Lifestyle of Pacific Youth (HBLPY) survey conducted in the Federated States of Micronesia, Tonga and Vanuatu. Such initiatives should be strongly encouraged as a means to obtain reliable, useful and comparable data on monitoring alcohol consumption among youths.
In line with this, WHO has launched the Global school-based student health survey (GSHS) – an international collaborative surveillance project designed to help countries measure and assess the behavioural risk factors and protective factors in ten key areas (alcohol use being one of them) among young people aged 13 to 15. The GSHS is a relatively low-cost school-based survey which uses a self-administered questionnaire to obtain data on young people's health behaviour and protective factors related to the leading causes of morbidity and mortality among children and adults worldwide. Among the countries participating in this study are the Bahamas, Botswana, Chile, China, Guatemala, Guyana, Jordan, Kenya, Mozambique, the Philippines, Swaziland, Trinidad and Tobago, Uganda, Venezuela, Zambia and Zimbabwe (to access more information on the GSHS, please see WHO, 2004b).
There is widespread agreement that the health and well-being of many young people today are seriously being threatened by the use of alcohol. Worries have arisen as emerging trends in consumption are starting to permeate youth culture, showing increasing signs of transcending national boundaries. There appears to be an international pattern towards a more hedonistic attitude to drinking, consciously using alcohol for its pleasurable psychological effects. Associated with this is a trend of increased drinking to intoxication. Increased binge drinking and intoxication in young people – the pattern of consumption associated with Northern
WHO Global Status Report on Alcohol 2004
32
Europe – is now reported even in countries such as France and Spain in which drunkenness was traditionally alien to the drinking culture and in which the overall level of alcohol consumption is declining fairly steeply. In the Mediterranean countries, changes in drinking styles are associated with changes in beverage preferences, beer replacing wine as the main beverage of choice for young people. There are anecdotal reports that this change of beverage preference is linked to the increasing spread and popularity of Anglo-Irish style pubs across Europe (Global Alcohol Policy Alliance, 2001).
Internationally, therefore, an important current feature of young people’s drinking is the importance of the ‘buzz’. Many young people now drink in order to get drunk. Drunkenness is widely tolerated, indeed positively approved. Drinking to get drunk does seem to be the pattern favoured by a substantial and growing minority of young people and to have a disproportionate cultural importance (Global Alcohol Policy Alliance, 2001). Studies have shown a high prevalence of drunkenness as well as the trend towards more drunkenness – especially that involving the use of spirits – among youths in many countries (Schmid, 2003). A comparative study conducted in six European Union (EU) countries found that in all countries but one (Italy), the young people show a higher frequency of intoxication than their elders (Leifman, Österberg & Ramstedt, 2002). Another issue of concern is the emergence of alcoholic carbonated drinks (or more commonly known as alcopops) in the market today. Given their marketing, cartoon-style labeling and sweet taste, many of these drinks are targeted at young people (McKibben, 1996, cited in McKeganey, 1998) and concerns are raised as to whether alcopops act as a bridge to other, stronger alcohol products and/or reduce the age at which young people begin to start consuming alcohol.
Table 10 shows data for selected countries on the rate of heavy episodic drinking among youths (below 20 years old) and Table 11 shows data for selected countries on the rate of heavy episodic drinking among young adults (aged 18–24 years old). Again, care has to be taken when interpreting the data as different age group samples and definitions of heavy episodic drinking are used in the various studies.

WHO Global Status Report on Alcohol 2004
33
Table 10: Heavy episodic drinkers among youths Country Year Total (%) Male (%) Female (%) Age group
Australiaa 2001 10.7 9.6 11.8 14–19 Bulgariab 1999 11.0 15.0 6.0 15–16 Canadac 2000–2001 15.3 26.3 5.2 15–19 Chinad 2000–2001 1.3 2.5 0.0 15–19 Colombiac 2000–2001 7.8 14.5 4.1 15–19 Cyprusb 1999 12.0 18.0 6.0 15–16 Denmarke 2002 N.A. 62.0 54.0 11–15 Finlandb 1999 18.0 21.0 15.0 15–16 Franceb 1999 12.0 16.0 7.0 15–16 Georgiad 2000–2001 2.7 4.4 1.3 15–19 Greeceb 1999 9.0 13.0 5.0 15–16 Hungaryf 2003 27.5 39.2 22.2 15–16 Icelandb 1999 17.0 18.0 15.0 15–16 Irelandb 1999 31.0 32.0 32.0 15–16 Indiad 2000–2001 0.5 1.2 0.0 15–19 Indonesiad 2000–2001 1.1 1.1 1.1 15–19 Lithuaniab 1999 9.0 12.0 18.0 15–16 Maltab 1999 22.0 25.0 23.0 15–16 Mexicod 2000–2001 2.5 0.8 1.5 15–19 Nigeriad 2000–2001 1.2 1.0 1.3 15–19 Norwayb 2003 15.0 17.0 14.0 15–16 Polandb 1999 31.0 41.0 23.0 15–16 Swedenb 1999 17.0 22.0 13.0 15–16 Syrian Arab Republic (the)d 2000–2001 0.4 0.0 0.2 15–19 Turkeyd 2000–2001 1.4 0.5 1.1 15–19 The United Kingdomb 1999 30.0 33.0 27.0 15–16 United States of America (the)f 2002 10.7 11.4 9.9 12–17 aConsumption of seven or more standard drinks on any one drinking occasion for males and five or more standard drinks on any one drinking occasion for females (at least weekly). b Consumption of five or more drinks in a row three times or more in the last 30 days. c Consumption of five or more drinks on one occasion, twelve or more times in the last year (among drinkers only). d At least once a week consumption of six or more standard drinks in one sitting. e Consumption of five or more standard drinks in one day at least once in the last month. f Consumption of five or more drinks on one occasion at least once in the past month. Note: Countries in bold indicate that surveys were not national. Please refer to individual country profiles for details of references/sources used.

WHO Global Status Report on Alcohol 2004
34
Table 11: Heavy episodic drinkers among young adults aged 18–24 years old Country Year Total (%) Male (%) Female (%)
Bosnia and Herzegovinaa 2003 0.8 1.8 0.0 Brazila 2003 15.3 26.3 5.2 Burkina Fasoa 2003 6.4 8.4 5.1 Chada 2003 9.3 13.7 5.6 Chinab 2000–2001 2.1 3.9 0.3 Colombiab 2000–2001 7.8 14.5 4.1 Comorosa 2003 0.3 0.6 0.0 Congo (the)a 2003 3.9 6.4 2.2 Côte d’Ivoirea 2003 3.9 6.9 0.3 Croatiaa 2003 4.6 9.6 0.0 Czech Republic (the) 2003 20.1 32.7 9.0 Dominican Republica 2003 12.0 17.9 7.4 Ecuadora 2003 5.1 11.2 0.5 Estoniaa 2003 6.0 10.4 3.5 Ethiopiaa 2003 2.0 4.2 0.2 Georgiaa 2003 10.1 19.6 2.1 Ghanaa 2003 0.6 1.0 0.3 Guatemalaa 2003 1.7 4.8 0.0 Hungarya 2003 12.2 20.8 3.5 Indiab 2000–2001 0.7 1.6 0.0 Indonesiab 2000–2001 0.8 1.3 0.3 Kazakhstana 2003 3.1 6.8 1.1 Lao People’s Democratic Republic (the)a 2003 11.5 19.2 5.3 Latviaa 2003 14.4 27.3 4.3 Lebanonb 2000–2001 0.2 0.4 0.0 Malawia 2003 1.9 4.5 0.2 Malaysiaa 2003 0.2 0.5 0.0 Malia 2003 0.3 0.6 0.0 Mauritiusa 2003 2.8 5.2 0.0 Mexicoa 2003 3.1 6.3 0.8 Moroccoa 2003 0.6 1.2 0.2 Namibiaa 2003 5.4 10.6 2.0 Nepala 2003 0.6 1.3 0.2 Nigeriab 2000–2001 1.0 1.7 0.6 Paraguaya 2003 16.1 29.2 4.4 Philippines (the)a 2003 7.3 13.6 0.9 Russian Federation (the)a 2003 5.7 6.9 4.6 Slovakiaa 2003 17.8 28.4 9.0 Spaina 2003 8.6 15.1 3.2 Sri Lankaa 2003 0.8 1.5 0.0 Tunisiaa 2003 3.3 6.3 0.0 Turkeya 2003 0.8 2.1 0.0 Ukrainea 2003 8.5 13.4 4.9 Uruguaya 2003 8.4 13.5 2.8 Viet Nama 2003 3.7 8.1 0.0 Zimbabwea 2003 2.8 6.6 0.3 aAt least once a week consumption of five or more standard drinks in one sitting. bAt least once a week consumption of six or more drinks in one sitting. Note: Countries in bold indicate that surveys were not national. Please refer to individual country profiles for details of references/sources used.
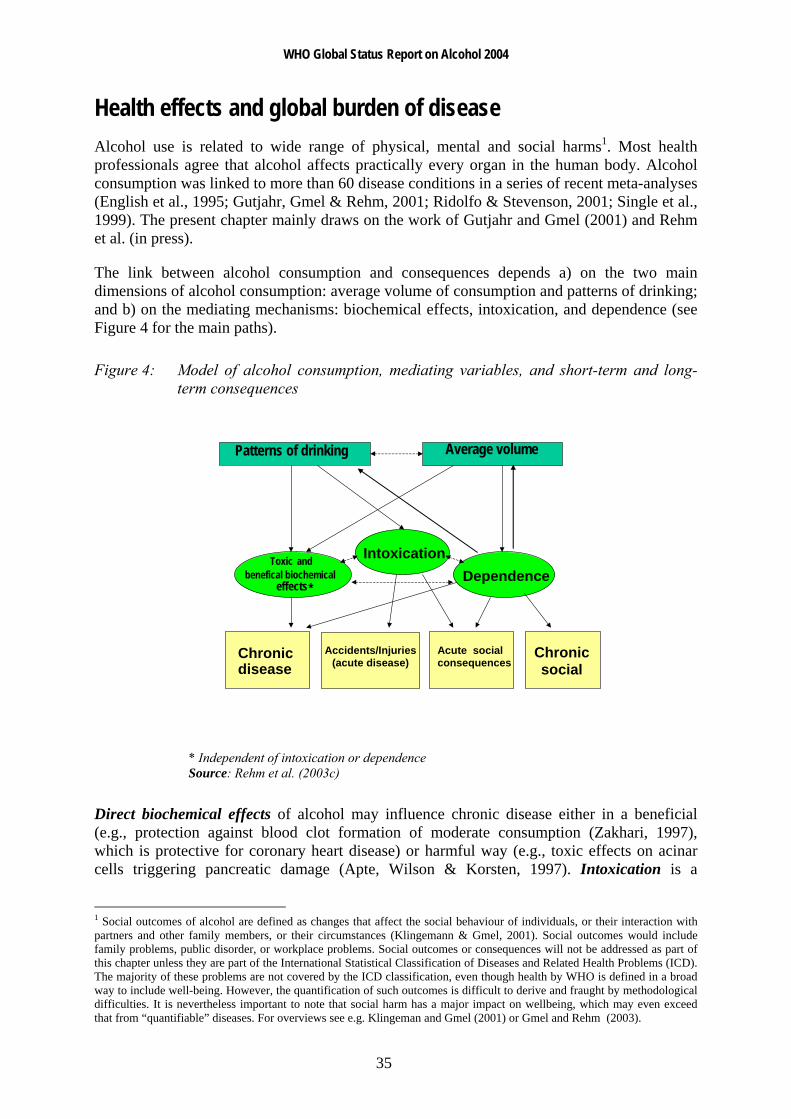
WHO Global Status Report on Alcohol 2004
35
Health effects and global burden of disease Alcohol use is related to wide range of physical, mental and social harms1. Most health professionals agree that alcohol affects practically every organ in the human body. Alcohol consumption was linked to more than 60 disease conditions in a series of recent meta-analyses (English et al., 1995; Gutjahr, Gmel & Rehm, 2001; Ridolfo & Stevenson, 2001; Single et al., 1999). The present chapter mainly draws on the work of Gutjahr and Gmel (2001) and Rehm et al. (in press).
The link between alcohol consumption and consequences depends a) on the two main dimensions of alcohol consumption: average volume of consumption and patterns of drinking; and b) on the mediating mechanisms: biochemical effects, intoxication, and dependence (see Figure 4 for the main paths).
Figure 4: Model of alcohol consumption, mediating variables, and short-term and long-term consequences
* Independent of intoxication or dependence Source: Rehm et al. (2003c)
Direct biochemical effects of alcohol may influence chronic disease either in a beneficial (e.g., protection against blood clot formation of moderate consumption (Zakhari, 1997), which is protective for coronary heart disease) or harmful way (e.g., toxic effects on acinar cells triggering pancreatic damage (Apte, Wilson & Korsten, 1997). Intoxication is a
1 Social outcomes of alcohol are defined as changes that affect the social behaviour of individuals, or their interaction with partners and other family members, or their circumstances (Klingemann & Gmel, 2001). Social outcomes would include family problems, public disorder, or workplace problems. Social outcomes or consequences will not be addressed as part of this chapter unless they are part of the International Statistical Classification of Diseases and Related Health Problems (ICD). The majority of these problems are not covered by the ICD classification, even though health by WHO is defined in a broad way to include well-being. However, the quantification of such outcomes is difficult to derive and fraught by methodological difficulties. It is nevertheless important to note that social harm has a major impact on wellbeing, which may even exceed that from “quantifiable” diseases. For overviews see e.g. Klingeman and Gmel (2001) or Gmel and Rehm (2003).
Chronic disease
Accidents/Injuries
(acute disease)
Acute social consequences
Chronic social
IntoxicationToxic and benefical biochemical
effects * Dependence
Patterns of drinking Average volume
WHO Global Status Report on Alcohol 2004
36
powerful mediator mainly for acute outcomes, such as accidents, or intentional injuries or deaths, domestic conflict and violence (Klingemann & Gmel, 2001; Gmel & Rehm, 2003). Alcohol dependence is a powerful mechanism sustaining alcohol consumption and thus impacting on both chronic and acute consequences of alcohol (see Drummond, 1990), though it is also a consequence of drinking itself.
Total consumption or average volume of consumption has been historically the usual measure of exposure linking alcohol to disease (Bruun et al., 1975). Average volume of consumption as a risk factor is mainly linked to long-term consequences (WHO, 2000a). Acute effects of alcohol related to injury and death are much better predicted by patterns of drinking (Rehm et al., 1996; Bondy, 1996; Puddey et al., 1999), although there is also an association with volume of drinking. For example, the same overall average volume of alcohol can be consumed in small quantities regularly with meals (e.g. two drinks a day with meals) or in large quantities on few occasions (e.g. two bottles of wine on a single occasion every Friday). In other words, the impact of an average volume of consumption on mortality or morbidity is partly moderated by the way alcohol is consumed by the individual, which in turn is influenced by the social context (Room & Mäkelä, 2000). It should be noted that patterns of drinking have not only been linked to acute health outcomes such as injuries (Greenfield, 2001; Rossow, Pernanen & Rehm, 2001), but also to chronic diseases such as coronary heart disease (CHD) and especially sudden cardiac death (Britton & McKee, 2000; Chadwick & Goode, 1998; Puddey et al., 1999; Trevisan et al., 2001a; Trevisan et al., 2001b).
Thus, the variation of disease burden due to alcohol consumption across countries depends at least on two factors. First, it depends on the overall amount consumed in a country for which an indicator is per capita consumption. Per capita consumption of course is also influenced by the percentages of drinkers (or abstainers) in a country. Second, it depends on the way alcohol is consumed, e.g. regularly in moderate amounts with meals versus irregular in heavy drinking occasions often outside meals. Similarly, the distribution of alcohol related burden across diseases may vary widely across countries. At the risk of oversimplifying, chronic alcohol-related diseases predominantly depend on volume of drinking and should thus have a bigger share of the total burden in countries in which total per capita consumption is high, but the prevailing drinking pattern is a regular drinking pattern, whereas the share of acute consequences on the total burden should be higher in countries, where alcohol is commonly used more infrequently but often in high amounts when alcohol consumption takes place.
“Alcohol relatedness” varies across diseases. This is commonly expressed in alcohol attributable fractions (AAF). Some diseases or consequences are fully attributable to alcohol (e.g. the alcohol dependence syndrome), other consequences have a high alcohol attribution such as liver cirrhosis, for some consequences there are many other factors which may cause a disease, among which alcohol often plays one role, and thus the alcohol attributable part may be low. Low, however does not mean negligible. If 10% of all cases may be attributable to alcohol, for some highly prevalent diseases (e.g. breast cancer for women) the alcohol-related share may clearly outnumber diseases that are fully attributable to alcohol, but commonly rare. There are different ways to determine AAFs of diseases (for details see English et al., 1995). One is the indirect way, where relative risk estimates derived from meta-analyses are combined with country-specific disease prevalences to yield country-specific AAFs. The second is to use directly estimated AAFs, e.g. the percentage of traffic accidents where an involved person was tested positive for a blood alcohol concentration (BAC) exceeding a certain amount (e.g. 0.5 per mille). For most chronic diseases the indirect method is used. Behind this calculation stands the assumption that the mechanism for the development of a disease depend mainly on the consumed amount of alcohol and is therefore cross-culturally

WHO Global Status Report on Alcohol 2004
37
stable. Therefore, Relative Risks (RR) can be derived by meta-analytical pooling of epidemiologic studies across different countries and regions all over the world. Differences in AAFs across countries then depend mainly on the prevalence of consumption distribution, e.g. the prevalence of chronic heavy drinking.
For most acute diseases, however, AAFs should be derived directly, because they depend on the way alcohol is consumed, e.g. a drinking pattern of frequent drinking to intoxication. An example for consequences for which the AAF are commonly directly derived are road accidents for which an alcohol attributable fraction is based on whether the accident-responsible driver tested positive for alcohol and to what degree (e.g. at blood alcohol concentration BAC >0.05%).
Harmful effects of alcohol consumption excluding depression and coronary heart disease
Wholly alcohol-attributable diseases
A number of diseases are by definition fully attributable to alcohol (AAF = 1 or 100%). These are listed in Table 12
Table 12: Disease conditions which are by definition alcohol-related (attributable fraction of 1)
ICD-9 Disease
291 Alcoholic psychoses 303 Alcohol-dependence syndrome 305.0 Alcohol abuse 357.5 Alcoholic polyneuropathy 425.5 Alcoholic cardiomyopathy 535.3 Alcoholic gastritis 571.0–571.3 Alcoholic liver cirrhosis 790.3 Excess blood alcohol 980.0, 980.1 Ethanol and methanol toxicity Source: Rehm et al. (2003c)
Diseases with a contributory role
Cancer Oropharyngeal, oesophageal and liver cancers: Alcohol has consistently been related to the risk of cancer of the mouth (lip, tongue), pharynx, larynx, hypopharynx, oesophagus and liver (Corrao et al., 1999; English et al., 1995; Gurr, 1996; Single et al., 1999; US Department of Health and Human Services, 2000; WHO, 2000a). The relationship between average volume of alcohol consumption and cancer is usually characterized as almost monotonically increasing relative risks with increasing volume of drinking (Bagnardi et al., 2001).
Female breast cancer: Much research has been conducted over the last decade on breast cancer. Prior to 1995, it has most often been concluded that evidence of a causal relationship with alcohol was insufficient (English et al., 1995; Rosenberg, Metzger & Palmer, 1993;
WHO Global Status Report on Alcohol 2004
38
Schatzkin & Longnecker, 1994). However, recent studies and reviews have shown that not only hazardous or harmful drinking, but also even moderate alcohol consumption, can cause female breast cancer (Single et al., 1999). A meta-analysis by Smith-Warner et al. (1998) found a clear linear relationship over the whole continuum of consumption. Other original studies supported this finding (Bowlin et al., 1997; Corrao et al., 1999; Nasca et al., 1994; Royo-Bordonada et al., 1997; Swanson et al., 1997; van den Brandt, Goldbohm & van 't Veer, 1995; Wingo et al., 1997).
Cancers of the stomach, pancreas, colon, rectum, prostate, salivary glands, ovarium, endometrium, bladder: Many recent research projects have investigated whether these cancers are alcohol-related. Overall, evidence for a causal relationship between alcohol and cancer of the stomach, pancreas, colon, rectum, if any was found, was weak and inconclusive (Bode & Bode, 1997; Boutron et al., 1995; De Stefani et al., 1998; Gapstur, Potter & Folsom, 1994; Harnack et al., 1997; Ji et al., 1996 ; Longnecker & Enger, 1996; Lundberg & Passik, 1997; Piette, Barnett & Moos, 1998; Sarles, Bernard & Johnson, 1996; Seitz, Poschl & Simanowski, 1998; Seitz et al., 1998; Soler et al., 1998). A recent meta-analysis assessing the link between alcohol and various types of cancer showed that statistically significant increases in risk existed for cancers of the stomach, colon, rectum and ovaries (Bagnardi et al., 2001).
On prostate cancer, again most studies did not report observing an increased risk (Breslow & Weed, 1998; Ellison et al., 1998; Hiatt et al., 1994; Tavani et al., 1994), whereas two cohort studies (Ajani et al., 1998; Putnam et al., 1998) and one case–control study (Hayes et al., 1996) reported a small increased risk in men who consume even moderate amounts of alcohol.
It has been hypothesized that alcohol might constitute a risk factor for cancer of the major salivary glands (Horn-Ross, Ljung & Morrow, 1997; Muscat & Wynder, 1998), ovarium, endometrium (Bradley et al., 1998; Longnecker & Enger, 1996; Newcomb, Trentham-Dietz & Storer, 1997; Parazzini et al., 1995), and the bladder (Bruemmer et al., 1997; Donato et al., 1997; Longnecker & Enger, 1996; Yu et al., 1997). For each of these sites, results were either scarce or heterogeneous, or the effects, if any were found, not statistically significant. In sum, evidence for a causal relationship between alcohol and cancers of these sites so far has not produced consistent results, especially with regard to physiological pathways.
Overall, the risk relationship between alcohol and alcohol-related cancers can be characterized by an almost linear dose–response relationship between volume of drinking and the relative risk of outcome. Although there have been speculations about the impact of patterns of drinking, especially for breast cancer (Kohlmeier & Mendez, 1997), the current state of knowledge does not suggest that patterns of drinking play an important role in the etiology of cancer.2
Cardiovascular disease There is increasing research in the past decades about the role of alcohol as both a risk and protective factor for cardiovascular disease. Coronary heart disease and the protective role of alcohol has been the focus of most research and will be discussed in a separate point below. Most studies suggest that low-level consumption equally offers some protection against ischaemic stroke.
2 Part of this lack of an influence on patterns of cancer risk may be due to methodological reasons. Most epidemiological studies only measure volume of consumption and only model monotonically increasing trends and thus could not detect any influence of patterns of drinking even it were present.
WHO Global Status Report on Alcohol 2004
39
In contrast, hypertension and other cardiovascular disorders such as cardiac arrhythmias or heart failure are adversely affected by alcohol (see Friedman, 1998; Klatsky, 1995; Puddey et al., 1999; Rosenqvist, 1998; US Department of Health and Human Services, 1997; Wood et al., 1998). There are some indications that hypertension may be related to the pattern of heavy drinking occasions (Murray et al., 2002; Puddey et al., 1999; Wannamethee & Shaper, 1991).
For haemorrhagic stroke, the weight of evidence suggests an increase in risk for males even at low levels of consumption (Berger et al., 1999; Jackson, 1994; Sacco et al., 1999; You et al., 1997). For females the most recent meta-analyses of Ridolfo and Stevenson (2001) suggested a protective effect for drinking below 40 g pure ethanol per day, but an 8-fold increased risk for drinking above these limits. Patterns of drinking not only play a role in any protective effects of alcohol on CHD, drinking patterns are also relevant to risks of stroke (Hillbom, Juvela & Karttunen, 1998) and for sudden cardiovascular death or cardiovascular death in general (Kauhanen et al., 1997a; Kauhanen et al., 1997b; Kozarevic et al., 1982; Poikolainen, 1983; Wannamethee & Shaper, 1992) with heavy drinking occasions and intoxication resulting in increased risk.
Liver cirrhosis Alcohol has been estimated as the leading cause of liver cirrhosis in established market economies (Corrao et al., 1997; Corrao et al., 1998; English et al., 1995). There is some debate whether alcohol’s contributory role should be restricted to alcoholic liver cirrhosis alone or be extended to unspecified liver cirrhosis. Several authors contend that, empirically, it is extremely difficult to separate alcoholic from unspecified liver cirrhosis, and that the term “unspecified liver cirrhosis” is applied when no specific etiological factor is reported or identified (English et al., 1995). Research in the United States and in Central and South American countries indicated that an appreciable proportion of cirrhosis deaths without mention of alcohol was in fact attributable to alcohol (Haberman & Weinbaum, 1990; Puffer & Griffith, 1967; Room, 1972).
On the other hand, applying RRs of liver cirrhosis derived in established market economies to other countries can be extremely misleading. In many countries (e.g. China or India), liver cirrhosis is mainly caused by other factors such as viral infections. The corresponding AAFs have been shown to vary between less than 10% (China) and 90 % (Finland) (WHO, 2000a).
The relationship between alcohol consumption and liver cirrhosis seems to be mainly dependent on volume of drinking and independent of patterns of drinking (Lelbach, 1975; Lelbach, 1976). However, some research also indicates a potential effect of occasions of heavy drinking (Rhodés, Salaspuro & Sorensen, 1993).
Effects of prenatal alcohol exposure Alcohol consumption during pregnancy is related to various risks to the fetus, which include gross congenital anomalies and Fetal Alcohol Spectrum Disorders (FASD), which include conditions such as fetal alcohol syndrome (Alvear, Andreani & Cortes, 1998; Church et al., 1997; Faden, Graubard & Dufour, 1997; Habbick et al., 1997; Larkby & Day, 1997; Larroque & Kaminski, 1996; Mattson et al., 1997; Passaro & Little, 1997; Passaro et al., 1996; Polygenis et al., 1998; Roebuck, Mattson & Riley, 1998; Shu et al., 1995; Windham et al., 1995). FASD ranges from individual anomalies at one end and serious neurobiological dysfunctions, including mental retardation, on the other (Connor & Streissguth, 1996). The prenatal teratogenic effects of alcohol also include lethal consequences. They comprise spontaneous abortion, low birth weight, fetal damage, prematurity, and intrauterine growth retardation (Abel, 1997; Bradley et al., 1998; Windham et al., 1997).

WHO Global Status Report on Alcohol 2004
40
Mental conditions The co-morbidity of alcohol dependence with other mental conditions is high, both in clinical and in general population samples (e.g. Grant & Harford, 1995; Merikangas et al., 1998). The crucial question in this respect is about causation. Sufficient evidence for a causal role of alcohol consumption at this point of research appears to exist mainly for depression. Since this relationship is controversial it will be discussed below in a separate section.
Other chronic conditions Other risks of alcohol consumption currently discussed in the literature include epilepsy (see e.g. Jallon et al., 1998; Leone et al., 1997; Martín et al., 1995), acute and chronic pancreatitis (Ammann, Heitz & Klöppel, 1996; Skinazi, Lévy & Bernades, 1995; Damström Thakker, 1998; Robles-Diaz & Gorelick, 1997) and psoriasis (English et al., 1995).
Beneficial health effects of alcohol consumption excluding CHD
Ischaemic stroke Cerebrovascular disease (stroke) consists of several subtypes, the most common subtypes being ischaemic stroke and haemorrhagic stroke, which are affected differently by alcohol. For ischaemic stroke, the predominant type of stroke, the weight of evidence including biological mechanisms, suggests effects similar to those for CHD, namely that low to moderate consumption may offer some protection (Beilin, Puddey & Burke, 1996; Hillbom, 1998; Keil et al., 1997; Kitamura et al., 1998; Knuiman & Vu, 1996; Sacco et al., 1999; Thun et al., 1997; Yuan et al., 1997; Wannamethee & Shaper, 1996). Alcohol consumption has detrimental effects on haemorrhagic stroke.
Other beneficial health effects of alcohol consumption
Alcohol may offer some protection against diabetes and cholelithiasis (gallstones) (English et al., 1995; see also Ashley et al., 2000, for a recent overview on beneficial effects of alcohol). Findings from a cohort of more than 40 000 male health professionals showed that moderate alcohol consumption may decrease the risk of diabetes, perhaps through the effects of alcohol on insulin sensitivity (Rimm et al., 1995). The protective effect was further substantiated, mainly in studies in established market economies (Perry et al., 1995; Ajani et al., 1999), however there may be differential effects on men and women, and even detrimental effects at higher levels of intake (Wei et al., 2000; Kao et al., 1998). Plausible biological mechanisms were seen to exist in mediating effects of moderate alcohol intake on glucose tolerance and insulin resistance (Facchini, Chen & Reaven, 1994; Kiechl et al., 1996; Lazarus, Sparrow & Weiss, 1997; Flanagan et al., 2000).
With regard to cholelithiasis (gallstones) there is some evidence that alcohol may offer some protection against gallstones (English et al., 1995; Holman et al., 1996). These findings have been substantiated by recent large-scale cohort and case-control studies, which reported an inverse relationship (Attili et al., 1998; Caroli-Bosc et al., 1998; Chen et al., 1999; Leitzmann et al., 1998).
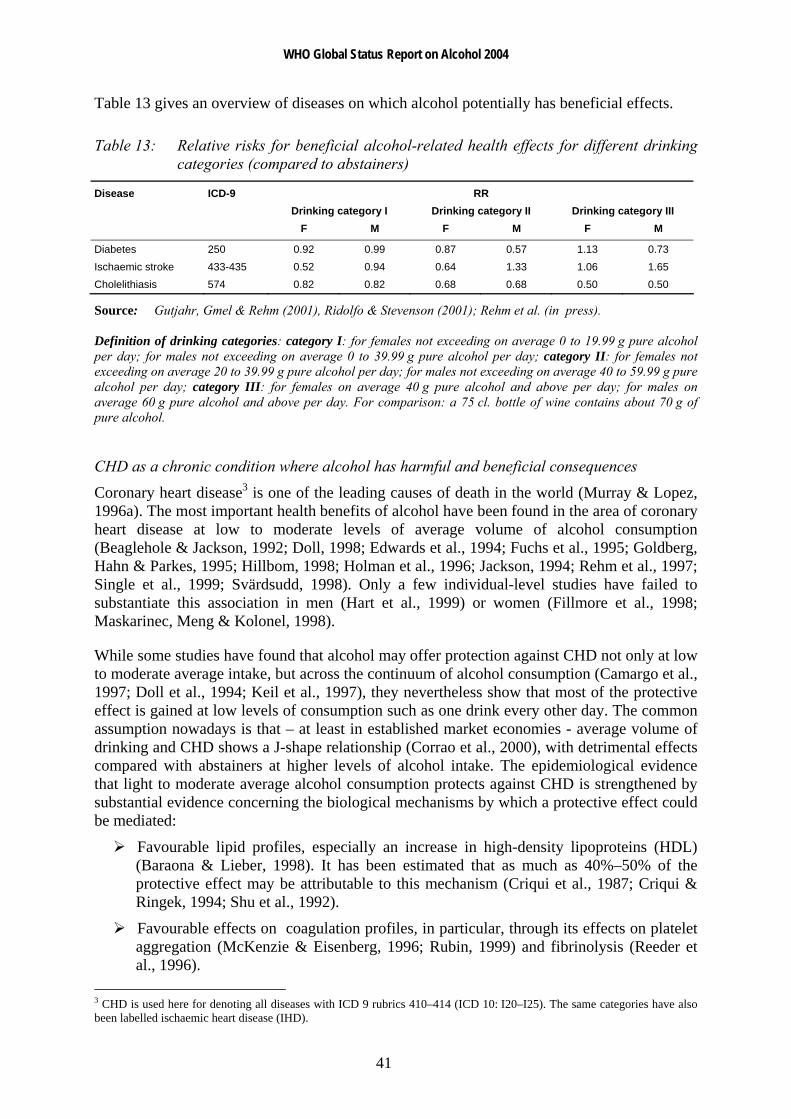
WHO Global Status Report on Alcohol 2004
41
Table 13 gives an overview of diseases on which alcohol potentially has beneficial effects.
Table 13: Relative risks for beneficial alcohol-related health effects for different drinking categories (compared to abstainers)
Disease ICD-9 RR Drinking category I Drinking category II Drinking category III F M F M F M
Diabetes 250 0.92 0.99 0.87 0.57 1.13 0.73 Ischaemic stroke 433-435 0.52 0.94 0.64 1.33 1.06 1.65 Cholelithiasis 574 0.82 0.82 0.68 0.68 0.50 0.50
Source: Gutjahr, Gmel & Rehm (2001), Ridolfo & Stevenson (2001); Rehm et al. (in press). Definition of drinking categories: category I: for females not exceeding on average 0 to 19.99 g pure alcohol per day; for males not exceeding on average 0 to 39.99 g pure alcohol per day; category II: for females not exceeding on average 20 to 39.99 g pure alcohol per day; for males not exceeding on average 40 to 59.99 g pure alcohol per day; category III: for females on average 40 g pure alcohol and above per day; for males on average 60 g pure alcohol and above per day. For comparison: a 75 cl. bottle of wine contains about 70 g of pure alcohol.
CHD as a chronic condition where alcohol has harmful and beneficial consequences
Coronary heart disease3 is one of the leading causes of death in the world (Murray & Lopez, 1996a). The most important health benefits of alcohol have been found in the area of coronary heart disease at low to moderate levels of average volume of alcohol consumption (Beaglehole & Jackson, 1992; Doll, 1998; Edwards et al., 1994; Fuchs et al., 1995; Goldberg, Hahn & Parkes, 1995; Hillbom, 1998; Holman et al., 1996; Jackson, 1994; Rehm et al., 1997; Single et al., 1999; Svärdsudd, 1998). Only a few individual-level studies have failed to substantiate this association in men (Hart et al., 1999) or women (Fillmore et al., 1998; Maskarinec, Meng & Kolonel, 1998).
While some studies have found that alcohol may offer protection against CHD not only at low to moderate average intake, but across the continuum of alcohol consumption (Camargo et al., 1997; Doll et al., 1994; Keil et al., 1997), they nevertheless show that most of the protective effect is gained at low levels of consumption such as one drink every other day. The common assumption nowadays is that – at least in established market economies - average volume of drinking and CHD shows a J-shape relationship (Corrao et al., 2000), with detrimental effects compared with abstainers at higher levels of alcohol intake. The epidemiological evidence that light to moderate average alcohol consumption protects against CHD is strengthened by substantial evidence concerning the biological mechanisms by which a protective effect could be mediated:
Favourable lipid profiles, especially an increase in high-density lipoproteins (HDL) (Baraona & Lieber, 1998). It has been estimated that as much as 40%–50% of the protective effect may be attributable to this mechanism (Criqui et al., 1987; Criqui & Ringek, 1994; Shu et al., 1992).
Favourable effects on coagulation profiles, in particular, through its effects on platelet aggregation (McKenzie & Eisenberg, 1996; Rubin, 1999) and fibrinolysis (Reeder et al., 1996).
3 CHD is used here for denoting all diseases with ICD 9 rubrics 410–414 (ICD 10: I20–I25). The same categories have also been labelled ischaemic heart disease (IHD).
WHO Global Status Report on Alcohol 2004
42
Favourable effects on insulin resistance (Kiechl et al., 1996; Lazarus, Sparrow & Weiss, 1997; Rankin, 1994).
Favourable effects on hormonal profiles, in particular, its estrogen effects (Svärdsudd, 1998).
Alcohol metabolite acetate has been postulated to protect against CHD by promoting vasodilation (US Department of Health and Human Services, 1997).
Alcohol may affect inflammation (Imhof et al., 2001; Jacques et al., 2001; Morrow & Ridker, 2000; Ridker, 2001).
Finally, it is possible that some of the protective effects are mediated through the anti-oxidative constituents of alcohol beverages, especially wine (Reinke & McKay, 1996). However, most of the protective effect appears to be linked to ethanol, per se. In sum, the relationship between average volume of drinking and CHD seems to be J-shaped. Light to moderate drinking is associated with a lower CHD risk than abstaining or heavy drinking. However, the studies on average volume of consumption and CHD are heterogeneous, indicating that factors other than the ones included in the study co-determine the relationship. One of the main factors is pattern of drinking (i.e. the way in which the same average amount of alcohol is consumed). In this respect two patterns deserve mentioning: irregular heavy drinking occasions and drinking with meals.
As regards heavy drinking occasions, several studies showed that for the same volume consumed (i.e. adjusting for volume in multiple regression models) heavy drinking occasions (e.g. eight drinks in one sitting) have detrimental effects on CHD (McElduff & Dobson, 1997; Murray et al., 2002; Trevisan et al., 2001a).
In addition to the effect on CHD, there appears to be a relationship between irregular heavy drinking occasions and other forms of cardiovascular death, especially sudden cardiac death (Kauhanen et al., 1997b; Wannamethee & Shaper, 1992; Wood et al., 1998). This is consistent with the physiological mechanisms of increased clotting and reducing the threshold for ventricular fibrillation after heavy drinking occasions, which have been reviewed by McKee and Britton (1998). Specifically, heavy drinking occasions have been shown to increase low-density lipoproteins, which in turn have been linked to negative cardiovascular outcomes. Contrary to low or moderate steady drinking, heavy irregular drinking occasions are not associated with an increase of high-density lipoproteins, which themselves have been linked to favourable cardiovascular outcomes. In addition, irregular drinking is associated with increased risk of thrombosis, occurring after cessation of drinking (Renaud & Ruf, 1996). Finally, irregular heavy drinking seems to predispose to histological changes in the myocardium and conducting system, as well as to a reduction in the threshold for ventricular fibrillation. In sum, irregular heavy drinking occasions are mainly associated with physiological mechanisms increasing the risk of sudden cardiac death and other cardiovascular outcomes, in contrast to the physiological mechanisms triggered by steady low to moderate consumption and linked to favourable cardiac outcomes.
With respect to drinking with meals, Trevisan and colleagues (2001a; 2001b) reported more protective effects of alcohol consumption when it was predominately consumed with meals compared to alcohol consumption outside meals.
The potential mechanisms linking consumption of alcoholic beverages with meals to a lower CHD risk, remain to be fully clarified. Mechanisms may be the reduced postprandial blood pressure (Foppa et al., 1999), positive effects on fibrinolysis (Hendriks et al., 1994) and lipids

WHO Global Status Report on Alcohol 2004
43
(Veenstra et al., 1990), and an increased alcohol elimination rate or a reduced alcohol absorption rate with food in the gastrointestinal tract (Gentry, 2000; Ramchandani, Kwo & Li, 2001). Several studies - mainly conducted at the aggregate level - showed that cultural drinking patterns are related to differential effects of volume on CHD mortality and morbidity. Most of them were either related to drastic changes in alcohol consumption and CHD mortality connected with the anti-alcohol campaign of the last years of the Soviet Union (Shkolnikov & Nemtsov, 1997; Bobak & Marmot, 1999; Britton & McKee, 2000; Leon et al., 1997; McKee, Shkolnikov & Leon, 2001; Notzon et al., 1998; Shkolnikov, McKee & Leon, 2001). Another indirect line of research on the effect of heavy drinking on CHD shows that countries with a tradition of heavier or binge-drinking occasions on weekends show proportionately high CHD or cardiovascular disease morality on or immediately after the weekend [Germany: CHD, (Willich et al., 1994); Moscow, Russian Federation: cardiovascular disease events, (Chenet et al., 1998); Lithuania: CHD events, (Chenet et al., 2001); Scotland: CHD events (cf. Evans et al., 2000)]. Finally, in the Global Burden of Disease (GBD) 2000 study, the moderating effect of drinking patterns on CHD could be demonstrated (Gmel, Rehm & Frick, 2003; Rehm et al., in press).
Depression
Alcohol is implicated in a variety of mental disorders which are not alcohol-specific. However, before the GBD 2000 study no major overview on alcohol-attributable burden of disease has included these conditions (English et al., 1995; Gutjahr, Gmel & Rehm, 2001; Rehm & Gmel, 2001; Ridolfo & Stevenson, 2001; Single et al., 1999). While the causality of the relation is hard to define, sufficient evidence now exists to assume alcohol’s causal role in depression, a common mental disorder.
In the general population, alcohol dependence and major depression co-occur over-proportionally, on both a 12-month and a lifetime basis (Kessler et al., 1996; Kessler et al., 1997; Lynskey, 1998). Among alcohol consumers in the general population, higher volume of consumption is associated with more symptoms of depression (Graham & Schmidt, 1999; Mehrabian, 2001; Rodgers et al., 2000). Among patients in treatment for alcohol abuse and dependence, the prevalence of major depression is higher than in the general population (Lynskey, 1998; Schuckit et al., 1997). Higher prevalence of alcohol use disorders has been documented for patients in treatment for depression (Alpert et al., 1999; Blixen, McDougall & Suen, 1997).
This suggests that alcohol use disorders are linked to depressive symptoms, and that alcohol dependence and depressive disorders co-occur to a larger degree than expected by chance. However, it is not clear in the individual case whether the depression caused alcohol problems, whether the alcohol consumption or alcohol problems caused depression, or whether both could be attributed to a third cause (Vaillant, 1993). The pathway from depression to harmful alcohol use and alcohol dependence has long been discussed under the heading of self-medication (i.e. the use of alcohol to alleviate depressive symptoms). In addition, a shared third cause could be certain neurobiological mechanisms (see Markou, Kosten & Koob, 1998) or genetic predisposition. To be a causal factor, one condition is that alcohol use disorders must precede depression, i.e. only that fraction of depression can logically be caused by alcohol dependence where the onset of dependence preceded the onset of depression. Such fractions can be found in many countries (see data of the International Consortium in Psychiatric Epidemiology (ICPE), Merikangas et al., 1998). Commonly, proportions of depressive disorders, which are preceded by alcohol dependence, were higher
WHO Global Status Report on Alcohol 2004
44
for males than for females. This corresponds to the higher prevalence rates of alcohol dependence in men. In fact, the proportion of depressive disorders and alcohol dependence rates correlate to about 0.80 (Rehm et al., in press; Rehm & Eschmann, 2002). Besides strength of association (commonly two-fold to three-fold increase in risk of depressive disorders have been found, e.g. Schuckit, 1996; Swendsen et al., 1998; Hilarski & Wodarki, 2001), reversibility (remission during abstinence) is a key indicator for causal effect of alcohol dependence on depressive disorders. There is sufficient evidence that abstinence substantially removes depressive symptoms in alcohol dependent persons within a short time frame (Brown & Schuckit, 1988; Dackis et al., 1986; Davidson, 1995; Gibson & Becker, 1973; Penick et al., 1988; Pettinati, Sugerman & Maurer, 1982; Willenbring, 1986).
The evidence indicates that a clear and consistent association exists between alcohol dependence and depressive disorders and that chance, confounding variables and other bias can be ruled out with reasonable confidence as factors in this association.
Summary on diseases related mainly to chronic alcohol consumption
Table 14 gives an overview of relative risks of major chronic diseases related to alcohol consumption.

WHO Global Status Report on Alcohol 2004
45
Table 14: Relative risk for major chronic disease categories by sex and average drinking category
F M Disease ICD-9
4digit ICD-10 4digit Drinking
cat.I Drinking
cat.II Drinking
cat.III Drinking
cat.I Drinking
cat.II Drinking
cat.III
Conditions arising during the perinatal period
760–779 minus 771.3 P00-P96
Low birth weight 764–765 P05-P07 1.00 1.40 1.40 1.00 1.40 1.40 Malignant neoplasms 140–208 C00-C97 Mouth and oropharynx cancers 140–149 C00-C14 1.45 1.85 5.39 1.45 1.85 5.39 Oesophagus cancer 150 C15 1.80 2.38 4.36 1.80 2.38 4.36 Liver cancer 155 C22 1.45 3.03 3.60 1.45 3.03 3.6 Breast cancer* 1.14 1.41 1.59 n.a. n.a. n.a. Under 45 years of age* 1.15 1.41 1.46 n.a. n.a. n.a. 45 years and over*
174 C50 1.14 1.38 1.62 n.a. n.a. n.a.
Other neoplasms 210–239 D00-D48 1.10 1.30 1.70 1.10 1.30 1.70 Diabetes mellitus 250 E10-E14 0.92 0.87 1.13 1.00 0.57 0.73
Neuro-psychiatric conditions 290–319, 324–359
F01-F99, G06-G98
Unipolar major depression 300.4 F32-F33 AAF were directly assessed using dependence rates, but varied widely across regions and sex. For details see Rehm et al. (in press).
Epilepsy 345 G40-G41 1.34 7.22 7.52 1.23 7.52 6.83
Alcohol-use disorders 291, 303, 305.0 F10 AAF
100% AAF
100% AAF
100% AAF
100% AAF
100% AAF
100%
Cardiovascular diseases 390–459 I00-I99 Hypertensive disease 401–405 I10-I13 1.40 2.00 2.00 1.40 2.00 4.10
0.82 0.83 1.12 0.82 0.83 1.00
Coronary heart disease 410–414 I20-I25 AAFs need modelling of drinking patterns and thus widely vary across regions and sex. For details see Rehm et al. (in press).
Cerebrovascular disease 430–438 I60-I69 Ischaemic stroke* 433-435 0.52 0.64 1.06 0.94 1.33 1.65 Haemorrhagic stroke* 430-432 0.59 0.65 7.98 1.27 2.19 2.38 Digestive diseases 530–579 K20-K92 Cirrhosis of the liver 571 K70, K74 1.30 9.50 13.00 1.30 9.50 13.00
Sources: Gutjahr & Gmel (2001), Ridolfo & Stevenson (2001); if indicated by *; the category III estimates for CHD were based on Corrao et al. (2000) and Rehm et al. (in press). Definition of drinking categories: category I: for females not exceeding on average 0 to 19.99 g pure alcohol per day; for males not exceeding on average 0 to 39.99 g pure alcohol per day; category II: for females not exceeding on average 20 to 39.99 g pure alcohol per day; for males not exceeding on average 40 to 59.99 g pure alcohol per day; category III: for females on average 40 g pure alcohol and above per day; for males on average 60 g pure alcohol and above per day. For comparison: a 75 cl. bottle of wine contains about 70 g of pure alcohol.
WHO Global Status Report on Alcohol 2004
46
Acute adverse health consequences: accidental injury and poisoning, suicide, interpersonal violence and assaults
Alcohol use has been associated with increased risk of injury in a wide variety of settings including road traffic accident (vehicles, bicycles, pedestrians), falls, fires, injuries related to sports and recreational activities, self-inflicted injuries or injuries resulting from interpersonal violence (Cherpitel, 1992; Freedland, McMicken & D'Onofrio, 1993; Hingson & Howland, 1987; Hingson & Howland, 1993; Hurst, Harte & Firth, 1994; Martin, 1992; Martin & Bachman, 1997; US Department of Health and Human Services, 1997; US Department of Health and Human Services, 2000). There is also some evidence that the presence of alcohol in the body at the time of injury may be associated with greater severity of injury and less positive outcomes (Fuller, 1995; Li et al., 1997).
Unintentional injuries
Alcohol consumption produces effects that are often perceived as positive, as evidenced by the widespread popularity of drinking. But it also leads to actions that result in unintentional injury and death. This section highlights research findings on causality of alcohol involvement and findings relevant to establishing dose–response relationships and drinking patterns. It focuses on traffic injuries, as most of the research has been conducted in this area, and traffic accidents are the most important component of unintentional injuries (Rehm et al., 2003a).
Studies relating average volume of drinking to risk of injury have found the risk of injury to be positively related to increasing average intake levels of alcohol, with the risk increasing at relatively low volumes of intake (Cherpitel et al., 1995). Several patterns of drinking have been related to injury risk. Frequent heavy drinking and frequent subjective drunkenness are both associated with injury, particularly injury resulting from violence (Cherpitel, 1996). Often, the greatest risk was found in individuals who consume relatively large amounts on some occasions, and whose highest amounts are markedly greater than their average amount per occasion (Gruenewald & Nephew, 1994; Gruenewald, Mitchell & Treno, 1996; Gruenewald, Treno & Mitchell, 1996; Treno, Gruenewald & Ponicki, 1997; Treno & Holder, 1997). This was also confirmed in a statistically adequate re-analysis of the Grand Rapids study, that indicates that though all levels of BAC are associated with an increased risk of crashes, relative to a BAC of zero, the risk slope was accelerated for less frequent drinkers (Hurst, Harte & Firth, 1994).
There are clear biological mechanisms why alcohol is related to injury. Moderate doses of alcohol have been demonstrated in controlled experimental studies to have cognitive and psychomotor effects that are relevant to the risk of injury, such as reaction time, cognitive processing, coordination and vigilance (Eckhardt et al., 1998; Krüger et al., 1993; Moskowitz & Robinson, 1988; US Department of Health and Human Services, 1997). The comprehensive recent review by Eckardt and colleagues (1998) concluded that the threshold dose for negative effects on psychomotor tasks is generally found at around 40 to 50 mg% (equivalent to 0.04%–0.05%).
In summary, the evidence indicates that the amount consumed per occasion, and more specifically blood alcohol content, is the critical feature in determining risk of injury. Table 15 gives the attributable fractions for alcohol for different kinds of injuries in four recent reviews. The reviews based their estimates on meta-analyses or other summaries of the
WHO Global Status Report on Alcohol 2004
47
relations found in published studies. It should be recognized that, while there are many such studies, they are mostly from a relatively small range of countries, mostly from established market economies. Hence, such estimates cannot necessarily be projected to other countries with different patterns of drinking and different average volumes of drinking.
Intentional injuries
Alcohol is strongly associated with violent crime (Graham & West, 2001), although this association varies considerably across settings (Murdoch, Pihl & Ross, 1990; Room & Rossow (2001), Rossow, Pernanen & Rehm, 2001). Studies on violence have repeatedly shown that alcohol consumption precedes violent events, and that the amount of drinking is related to severity of subsequent violence. Based on meta-analyses of experimental studies there appears to be a small effect size of about 0.22 (Bushman, 1997) in the overall relationship between alcohol consumption and aggression. However, experimental research was not able to attribute effects on aggression to pharmacological effects only. Specific expectations of consumers as regards the effects of alcohol must accompany alcohol consumption to result in aggression (Gmel & Rehm, 2003). The general conclusion is that expectations form part of the “psycho-pharmacological” effects of alcohol (Bushman, 1997; Graham et al., 1998), and should not be separated in attempting to understand the effects of alcohol.
There are a number of different effects of alcohol contributing to increased likelihood of aggressive behaviour. Alcohol may have an effect on the serotonin (5HT) and GABA brain receptors that may reduce fear and anxiety about social, physical or legal consequences of one’s actions. Alcohol also affects cognitive functioning (Peterson et al., 1990), leading to impaired problem solving in conflict situations (Sayette, Wilson & Elias, 1993) and overly emotional responses or emotional ability (Pihl, Peterson & Lau, 1993). Other behavioural and attitudinal effects of alcohol related to aggression have been identified, although at this point not necessarily linked to particular pharmacological effects on the brain. These include a narrow and tenacious focus on the present (Graham, West & Wells, 2000; Washburne, 1956), also described as “alcohol myopia” (Steele & Josephs, 1990), and increased concerns with demonstrating personal power, at least for men (Graham, West & Wells, 2000; McClelland et al., 1972; Tomsen, 1997).
Estimating the proportion of alcohol induced intentional injuries is problematic and needs assessment from different sources, such as time-series analyses, natural experiments, case–control studies, emergency-room studies, general population surveys, and experimental designs (Pernanen, 2001). For details of a potential approach, using volume of drinking and drinking patterns in a cross-cultural approach see Rehm et al. (in press).
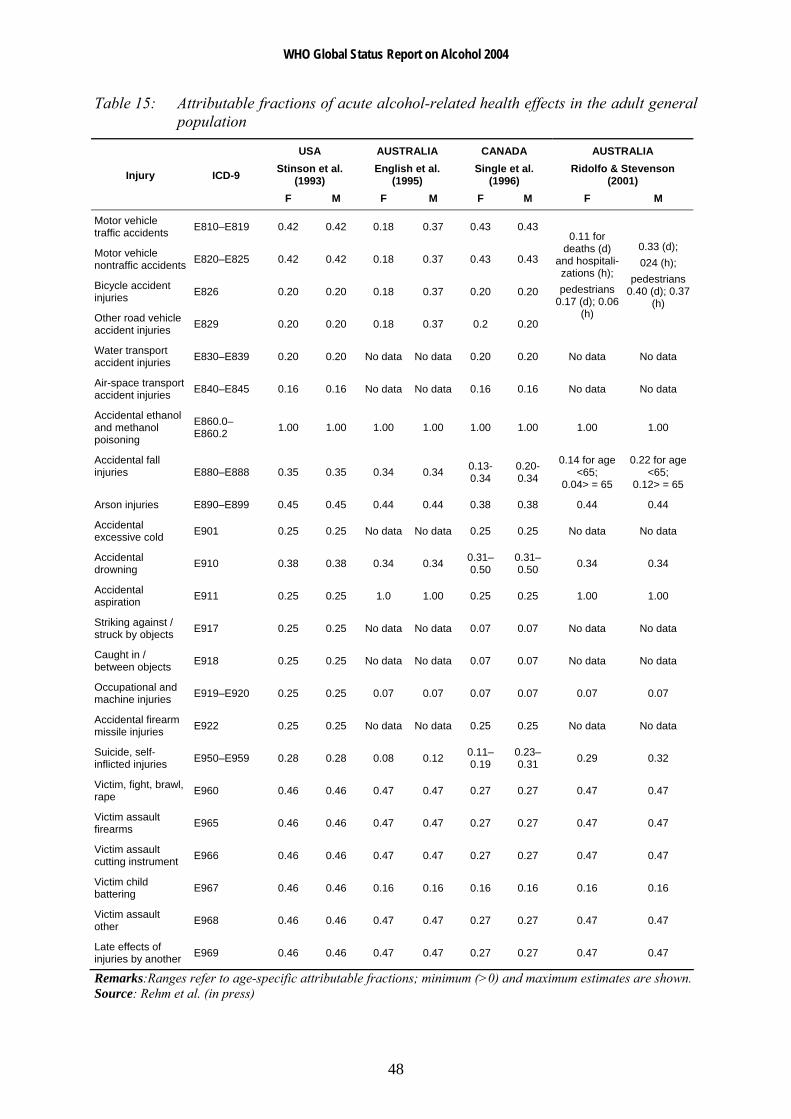
WHO Global Status Report on Alcohol 2004
48
Table 15: Attributable fractions of acute alcohol-related health effects in the adult general population
USA Stinson et al.
(1993)
AUSTRALIA English et al.
(1995)
CANADA Single et al.
(1996)
AUSTRALIA Ridolfo & Stevenson
(2001) Injury ICD-9
F M F M F M F M
Motor vehicle traffic accidents E810–E819 0.42 0.42 0.18 0.37 0.43 0.43
Motor vehicle nontraffic accidents E820–E825 0.42 0.42 0.18 0.37 0.43 0.43
Bicycle accident injuries E826 0.20 0.20 0.18 0.37 0.20 0.20
Other road vehicle accident injuries E829 0.20 0.20 0.18 0.37 0.2 0.20
0.11 for deaths (d)
and hospitali-zations (h); pedestrians
0.17 (d); 0.06 (h)
0.33 (d); 024 (h);
pedestrians 0.40 (d); 0.37
(h)
Water transport accident injuries E830–E839 0.20 0.20 No data No data 0.20 0.20 No data No data
Air-space transport accident injuries E840–E845 0.16 0.16 No data No data 0.16 0.16 No data No data
Accidental ethanol and methanol poisoning
E860.0–E860.2 1.00 1.00 1.00 1.00 1.00 1.00 1.00 1.00
Accidental fall injuries E880–E888 0.35 0.35 0.34 0.34 0.13-
0.34 0.20-0.34
0.14 for age <65;
0.04> = 65
0.22 for age <65;
0.12> = 65
Arson injuries E890–E899 0.45 0.45 0.44 0.44 0.38 0.38 0.44 0.44
Accidental excessive cold E901 0.25 0.25 No data No data 0.25 0.25 No data No data
Accidental drowning E910 0.38 0.38 0.34 0.34 0.31–
0.50 0.31–0.50 0.34 0.34
Accidental aspiration E911 0.25 0.25 1.0 1.00 0.25 0.25 1.00 1.00
Striking against / struck by objects E917 0.25 0.25 No data No data 0.07 0.07 No data No data
Caught in / between objects E918 0.25 0.25 No data No data 0.07 0.07 No data No data
Occupational and machine injuries E919–E920 0.25 0.25 0.07 0.07 0.07 0.07 0.07 0.07
Accidental firearm missile injuries E922 0.25 0.25 No data No data 0.25 0.25 No data No data
Suicide, self-inflicted injuries E950–E959 0.28 0.28 0.08 0.12 0.11–
0.19 0.23–0.31 0.29 0.32
Victim, fight, brawl, rape E960 0.46 0.46 0.47 0.47 0.27 0.27 0.47 0.47
Victim assault firearms E965 0.46 0.46 0.47 0.47 0.27 0.27 0.47 0.47
Victim assault cutting instrument E966 0.46 0.46 0.47 0.47 0.27 0.27 0.47 0.47
Victim child battering E967 0.46 0.46 0.16 0.16 0.16 0.16 0.16 0.16
Victim assault other E968 0.46 0.46 0.47 0.47 0.27 0.27 0.47 0.47
Late effects of injuries by another E969 0.46 0.46 0.47 0.47 0.27 0.27 0.47 0.47
Remarks:Ranges refer to age-specific attributable fractions; minimum (>0) and maximum estimates are shown. Source: Rehm et al. (in press)
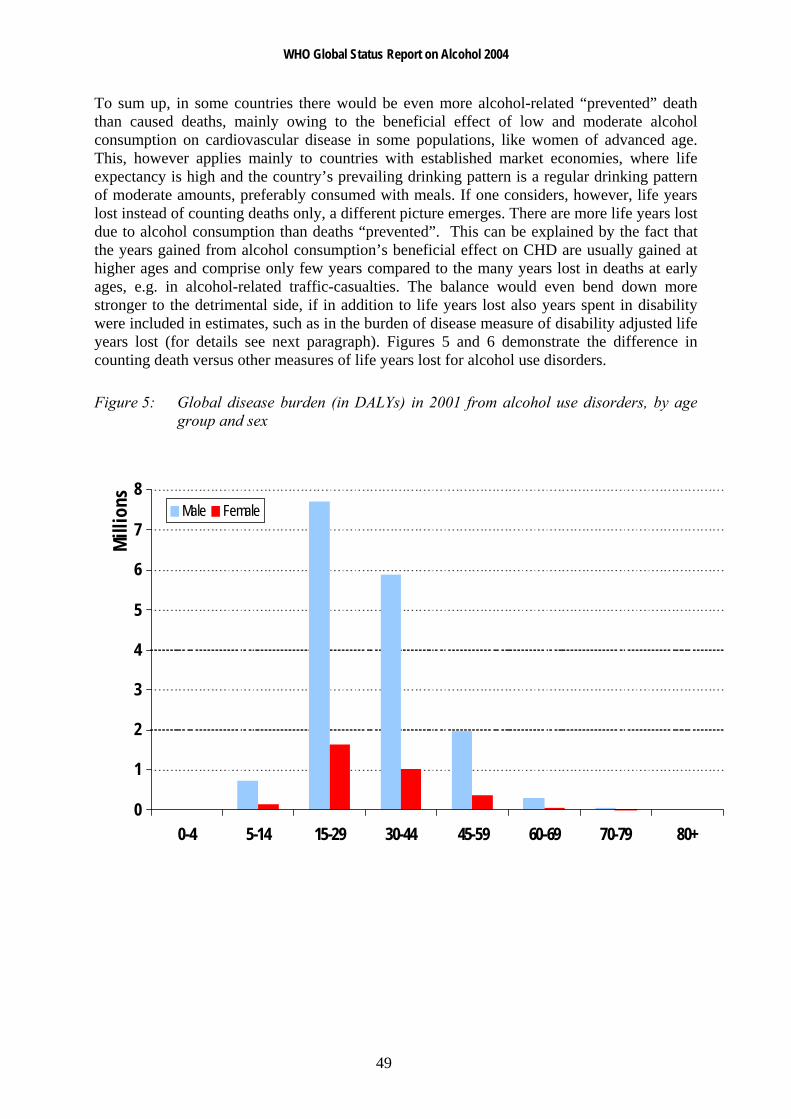
WHO Global Status Report on Alcohol 2004
49
To sum up, in some countries there would be even more alcohol-related “prevented” death than caused deaths, mainly owing to the beneficial effect of low and moderate alcohol consumption on cardiovascular disease in some populations, like women of advanced age. This, however applies mainly to countries with established market economies, where life expectancy is high and the country’s prevailing drinking pattern is a regular drinking pattern of moderate amounts, preferably consumed with meals. If one considers, however, life years lost instead of counting deaths only, a different picture emerges. There are more life years lost due to alcohol consumption than deaths “prevented”. This can be explained by the fact that the years gained from alcohol consumption’s beneficial effect on CHD are usually gained at higher ages and comprise only few years compared to the many years lost in deaths at early ages, e.g. in alcohol-related traffic-casualties. The balance would even bend down more stronger to the detrimental side, if in addition to life years lost also years spent in disability were included in estimates, such as in the burden of disease measure of disability adjusted life years lost (for details see next paragraph). Figures 5 and 6 demonstrate the difference in counting death versus other measures of life years lost for alcohol use disorders.
Figure 5: Global disease burden (in DALYs) in 2001 from alcohol use disorders, by age group and sex
0
1
2
3
4
5
6
7
8
0-4 5-14 15-29 30-44 45-59 60-69 70-79 80+
Mill
ions Male Female
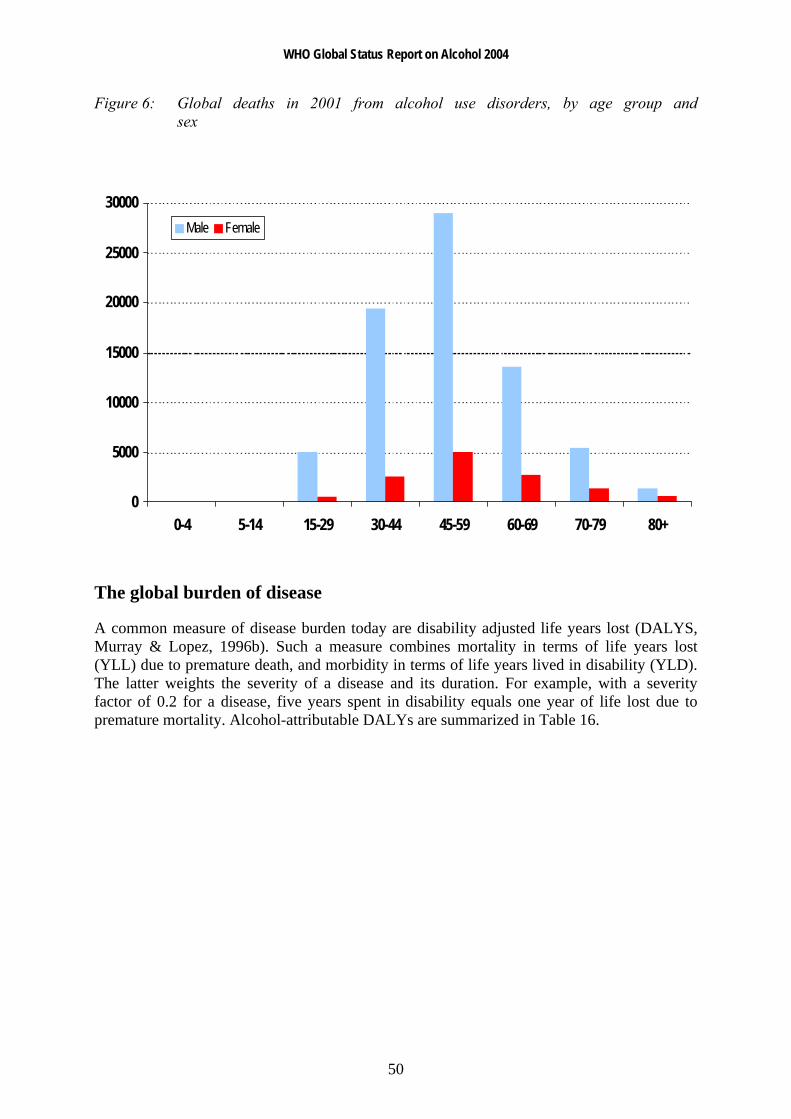
WHO Global Status Report on Alcohol 2004
50
Figure 6: Global deaths in 2001 from alcohol use disorders, by age group and sex
0
5000
10000
15000
20000
25000
30000
0-4 5-14 15-29 30-44 45-59 60-69 70-79 80+
Male Female
The global burden of disease
A common measure of disease burden today are disability adjusted life years lost (DALYS, Murray & Lopez, 1996b). Such a measure combines mortality in terms of life years lost (YLL) due to premature death, and morbidity in terms of life years lived in disability (YLD). The latter weights the severity of a disease and its duration. For example, with a severity factor of 0.2 for a disease, five years spent in disability equals one year of life lost due to premature mortality. Alcohol-attributable DALYs are summarized in Table 16.

WHO Global Status Report on Alcohol 2004
51
Table 16: Global burden of disease in 2000 attributable to alcohol according to major disease categories (DALYs in 000s)
Disease or Injury Female Male Total % of all alcohol-attributable DALYs
Conditions arising during the perinatal period 55 68 123 0%
Malignant neoplasm 1021 3180 4201 7%
Neuro-psychiatric conditions 3814 18 090 21 904 38%
Cardiovascular diseases -428 4411 3983 7%
Other noncommunicable diseases (diabetes, liver cirrhosis) 860 3695 4555 8%
Unintentional injuries 2487 14 008 16 495 28%
Intentional injuries 1117 5945 7062 12%
Alcohol-related disease burden all causes (DALYs) 8926 49 397 58 323 100%
All DALYs 693 911 761 562 1 455 473
% of all DALYs that can be attributable to alcohol 1.3% 6.5% 4.0%
In comparison: estimate for 1990: 3.5%
Source: Rehm et al. (2003d)
What are the most striking differences between regions? Clearly alcohol-related burden is most detrimental in the developed world. Here 9.2% of all the disease burden is attributable to alcohol, only exceeded by the burden attributable to tobacco and blood pressure (see Table 17 and WHO, 2002). Here also the ratio of males to females is lowest. However, as Table 17 indicates, alcohol also places a toll on health in the developing world with relatively low mortality patterns. Here the disease burden attributable to alcohol is the highest of all 26 risk factors examined in the CRA of the GBD 2000 study (Ezzati et al., 2002). In the developing world with high mortality patterns like Africa and parts of South-East Asia, alcohol is not yet one of the major risk factors. Here, the most important risk factors are being underweight, unsafe sex, unsafe water sanitation and hygiene and other environmental factors. However, if seems to be predictable that alcohol–attributable burden will increase in these regions as well with economic development (Rehm et al., in press).
Table 17: Burden of disease in 2000 attributable to tobacco, alcohol and drugs by developing status and sex
High mortality developing Low mortality developing Developed
(AFR-D, AFR-E, AMR-D, EMR-D, SEAR-D)
(AMR-B, EMR-B, SEAR-B, WPR-B)
(AMR-A, EUR-A, EUR-B,EUR-C, WPR-A)
Male Female Total Male Female Total Male Female Total
Total DALYs (000s) 420 711 412 052 832 763 223 181 185 316 408 497 117 670 96 543 214 213
Smoking and oral tobacco (%) 3.4 0.6 2.0 6.2 1.3 4.0 17.1 6.2 12.2
Alcohol (%) 2.6 0.5 1.6 9.8 2.0 6.2 14.0 3.3 9.2
Illicit drugs (%) 0.8 0.2 0.5 1.2 0.3 0.8 2.3 1.2 1.8
Source: Rehm et al. (in press).
WHO Global Status Report on Alcohol 2004
52
As stated above, the impact of alcohol consumption on diseases and the distribution of alcohol-related diseases should vary according to two factors: the volume and the drinking pattern.
Table 18 gives an overview of differences in alcohol consumption across WHO regions. The regional subgroupings have been defined by WHO (2000b) on the basis of high, medium or low levels of adult and of infant mortality. 'A' stands for very low child and very low adult mortality, 'B' stands for low child and low adult mortality, 'C' for low child and high adult mortality, 'D' for high child and high adult mortality, and 'E' for very high child and very high adult mortality (WHO, 2000b). From this it can be seen that in the developed low mortality countries (EUR-A, AMR-A, WPR-A) alcohol consumption of drinkers is usually high but alcohol is commonly consumed in a less detrimental way (e.g. regularly with meals; for details as regards the average drinking pattern, see Rehm et al., in press), and thus one would expect a larger share of chronic diseases including alcohol abuse and dependence, and a lower share of acute consequences such as injury. In developing countries with low mortality (AMR-B, EMR-B, SEAR-B, WPR-B) volume of drinking is high but drinking patterns are more detrimental. Thus, there should be a larger share of acute consequences. The same is true for high mortality developing countries (AFR-D, AFR-E, AMR-D, EMR-D, SEAR-D), for which however volume of drinking is usually low and thus the total alcohol-related burden should also be lower compared to the developing countries with low mortality. The greatest burden from alcohol consumption should be expected in the EUR-B and EUR-C regions where both volume of drinking is high and alcohol is consumed mostly in a detrimental pattern, and thus there should again be a high share of acute consequences again.
As Table 19 shows, empirically the aforementioned predictions could be confirmed, with the highest alcohol-related burden in the former socialist countries and the lowest burden in regions with low volume of drinking. Burden from acute consequences are highest in those regions, where regular drinking is rare, but alcohol is often consumed in large amounts when drinking takes place.
Table 20 shows the average attributable alcohol fractions (AAF) which were derived from calculations described in Babor, Rehm and Room (in press), for the categories of disorders for which alcohol was considered to be causal. The average AAFs are shown for men and women separately and together, for the world as a whole and for the three categories of high-mortality developing countries, low-mortality developing countries, and developed countries. Looking at the table, there are obvious gender differences to be found, with males having higher AAFs than females globally and in all regions. Also, the AAFs for developed countries are considerably higher than those of developing countries.
Table 21 gives an overview of standardized death rates for the chronic and acute diseases used in the current report (data shown is for most recent year available). It should be noted that these are not purely alcohol-related deaths. Traffic injuries, for example, also depend on the development of the transport system in a country, traffic or car densities, or road safety issues. Similarly, liver cirrhosis in many countries do not have a high alcohol involvement, but are related to poor sanitary conditions (poor drinking water quality causing high levels of hepatitis infections and liver diseases). Also, the numbers here do not imply that alcohol is responsible for all deaths from say cirrhosis of the liver or mouth and oropharynx cancer - with the exception of alcohol use disorders, the standardized mortality rates shown here are derived from the total number of deaths from the eight causes chosen irrespective of whether alcohol was a direct or indirect contributor to the deaths.

WHO Global Status Report on Alcohol 2004
53
Table 18: Characteristics of adult alcohol consumption in different regions of the world 2000 (population weighted averages)
WHO Region (Definition see below) Beverage type mostly consumed Total
consumption1
% unrecorded
of total2 % heavy drinkers3
% drinkers among males
% drinkers among females
Consumption per drinker4
Average drinking pattern5
Africa D (e.g. Nigeria, Algeria) Mainly other fermented beverages 4.9 53 5.3 47 27 13.3 2.5
Africa E (e.g. Ethiopia, South Africa) Mainly other fermented beverages and beer 7.1 46 10.3 55 30 16.6 3.1
Americas A (Canada, Cuba, the United States)
> 50% of consumption is beer, about 25% spirits 9.3 11 11.2 73 58 14.3 2.0
Americas B (e.g. Brazil, Mexico) Beer, followed by spirits 9.0 30 9.1 75 53 14.1 3.1
Americas D (e.g. Bolivia, Peru) Spirits, followed by beer 5.1 34 2.7 74 60 7.6 3.1
Eastern Mediterranean B (e.g. the Islamic Republic of Iran, Saudi Arabia) Spirits and beer, but scarce data 1.3 34 1.5 18 4 11.0 2.0
Eastern Mediterranean D (e.g. Afghanistan, Pakistan) Spirits and beer, but scarce data 0.6 56 0.1 17 1 6.0 2.4
Europe A (e.g. Germany, France, the United Kingdom) Wine and beer 12.9 10 15.7 90 81 15.1 1.3
Europe B (e.g. Bulgaria, Poland, Turkey) Spirits 8.3 41 8.8 72 52 13.4 2.9
Europe C (e.g. the Russian Federation, Ukraine) Spirits 13.9 38 18.6 89 81 16.5 3.6
South-East Asia B (e.g. Indonesia, Thailand) Spirits 3.1 27 1.2 35 9 13.7 2.5
South-East Asia D (e.g. Bangladesh, India) Spirits 2.0 79 0.9 26 4 12.9 3.0
Western Pacific A (e.g. Australia, Japan) Beer and spirits 8.5 20 4.2 87 77 10.4 1.2
Western Pacific B (e.g. China, the Philippines, Viet Nam) Spirits 5.0 26 4.1 84 30 8.8 2.2
1 Estimated total alcohol consumption per resident aged 15 and older in litres of absolute alcohol (recorded and unrecorded) 2 Percentage of total adult per capita consumption (= column 3) which is estimated to be unrecorded 3 Estimated % rate of heavy drinking (males ≥ 40 g and females ≥ 20 g) among those aged 15+ 4 Estimated total alcohol consumption (in litres of absolute alcohol) per adult drinker 5 Estimated average pattern of drinking (1-4 with 4 being the most detrimental pattern i.e. based on many heavy drinking occasions, drinking outside meals, high level of fiesta drinking and drinking in public places, etc. and 1 being the least detrimental pattern i.e. least heavy drinking occasions, drinking with meals, no fiesta drinking, elast drinking in public places, etc. ) Source: Rehm et al. (2003b)
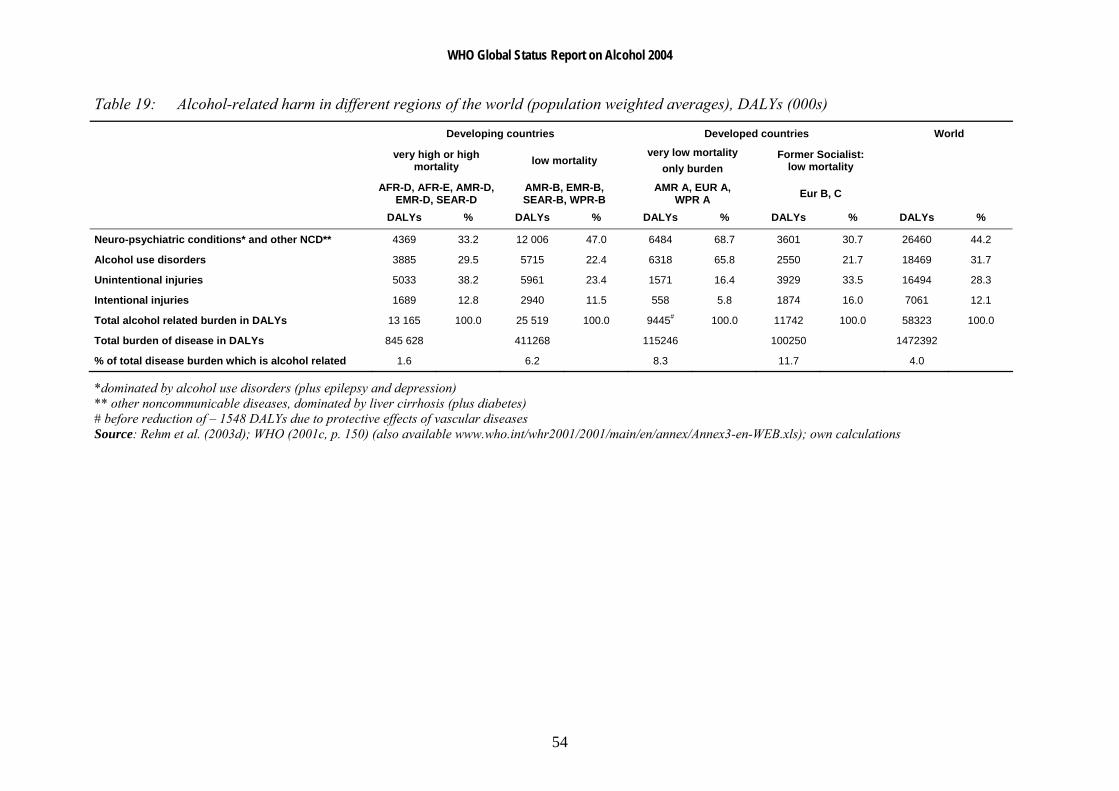
WHO Global Status Report on Alcohol 2004
54
Table 19: Alcohol-related harm in different regions of the world (population weighted averages), DALYs (000s)
Developing countries Developed countries World
very high or high mortality low mortality
very low mortality only burden
Former Socialist: low mortality
AFR-D, AFR-E, AMR-D,EMR-D, SEAR-D
AMR-B, EMR-B, SEAR-B, WPR-B
AMR A, EUR A, WPR A Eur B, C
DALYs % DALYs % DALYs % DALYs % DALYs %
Neuro-psychiatric conditions* and other NCD** 4369 33.2 12 006 47.0 6484 68.7 3601 30.7 26460 44.2
Alcohol use disorders 3885 29.5 5715 22.4 6318 65.8 2550 21.7 18469 31.7
Unintentional injuries 5033 38.2 5961 23.4 1571 16.4 3929 33.5 16494 28.3
Intentional injuries 1689 12.8 2940 11.5 558 5.8 1874 16.0 7061 12.1
Total alcohol related burden in DALYs 13 165 100.0 25 519 100.0 9445# 100.0 11742 100.0 58323 100.0
Total burden of disease in DALYs 845 628 411268 115246 100250 1472392
% of total disease burden which is alcohol related 1.6 6.2 8.3 11.7 4.0
*dominated by alcohol use disorders (plus epilepsy and depression) ** other noncommunicable diseases, dominated by liver cirrhosis (plus diabetes) # before reduction of – 1548 DALYs due to protective effects of vascular diseases Source: Rehm et al. (2003d); WHO (2001c, p. 150) (also available www.who.int/whr2001/2001/main/en/annex/Annex3-en-WEB.xls); own calculations

WHO Global Status Report on Alcohol 2004
55
Table 20: Selected population alcohol-attributable fractions, by disease category, sex and level of development (% DALYs for each cause) in 2000
High mortality developing
Low mortality developing Developed
World (AFR-D, AFR-E, AMR-D,
EMR-D, SEAR-D) (AMR-B, EMR-B, SEAR-
B, WPR-B) (AMR-A, EUR-A, EUR-B,
EUR-C, WPR-A) GBD disease categories
Males Females Both Males Females Males Females Males Females Mouth and oropharynx cancers 22 9 19 11 4 28 10 41 28 Oesophagus cancer 37 15 29 17 6 42 16 46 36 Liver cancer 30 13 25 23 10 32 11 36 28 Other neoplasms 6 3 4 2 1 5 2 11 8 Unipolar depressive disorders 3 1 2 2 0 3 0 7 2 Epilepsy 23 12 18 14 7 27 13 45 36 Alcohol use disorders 100 100 100 100 100 100 100 100 100 Ischaemic heart disease 4 -1 2 7 0 5 0 2 -3 Haemorrhagic stroke 18 1 10 7 2 21 2 26 0 Ischaemic stroke 3 -6 -1 1 0 3 0 5 -16 Cirrhosis of the Liver 39 18 32 19 7 45 13 63 49 Motor vehicle accidents 25 8 20 19 5 25 8 45 18 Drownings 12 6 10 8 4 10 6 43 25 Falls 9 3 7 5 1 8 3 21 8 Poisonings 23 9 18 7 3 11 7 43 26 Other unintentional injuries 15 5 11 10 4 15 6 32 16 Self-inflicted injuries 15 5 11 8 2 10 5 27 12 Homicide 26 16 24 18 12 28 16 41 32 Other Intentional injuries 13 7 12 7 3 20 11 32 19
Source: Babor, Rehm & Room (in press)
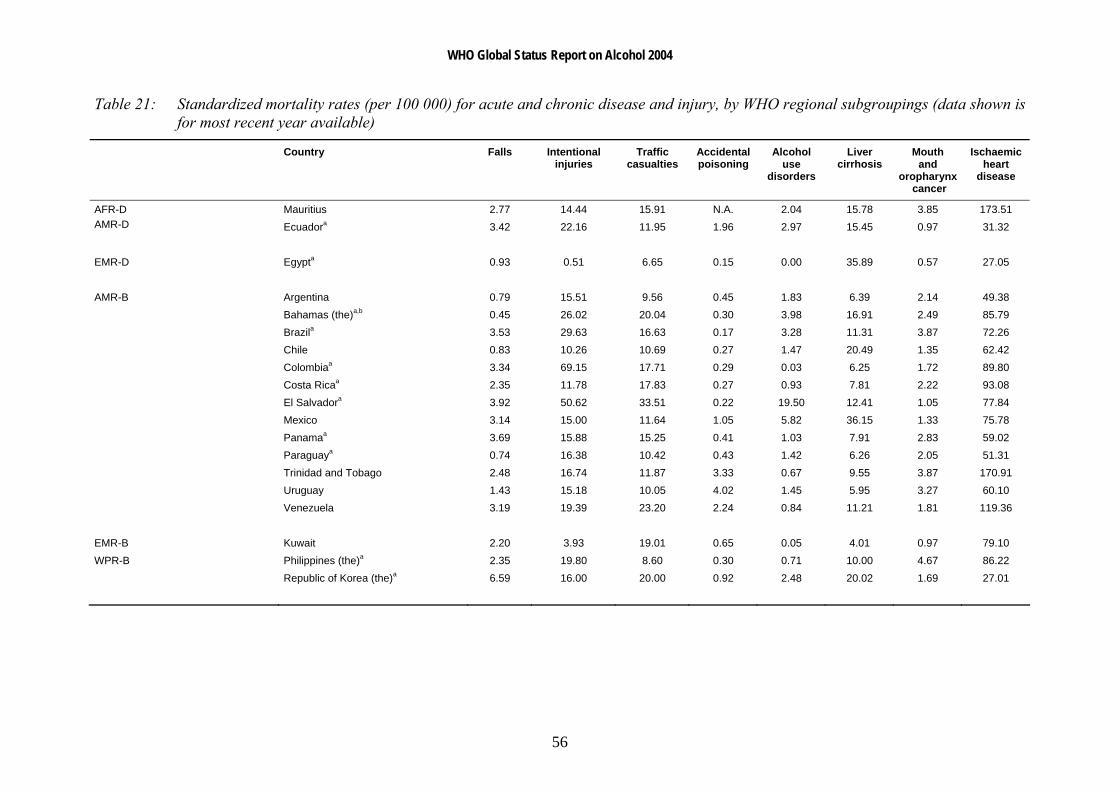
WHO Global Status Report on Alcohol 2004
56
Table 21: Standardized mortality rates (per 100 000) for acute and chronic disease and injury, by WHO regional subgroupings (data shown is for most recent year available)
Country Falls Intentional injuries
Traffic casualties
Accidentalpoisoning
Alcohol use
disorders
Liver cirrhosis
Mouth and
oropharynx cancer
Ischaemic heart
disease
Mauritius 2.77 14.44 15.91 N.A. 2.04 15.78 3.85 173.51 AFR-D AMR-D Ecuadora 3.42 22.16 11.95 1.96 2.97 15.45 0.97 31.32 EMR-D Egypta 0.93 0.51 6.65 0.15 0.00 35.89 0.57 27.05 AMR-B Argentina 0.79 15.51 9.56 0.45 1.83 6.39 2.14 49.38 Bahamas (the)a,b 0.45 26.02 20.04 0.30 3.98 16.91 2.49 85.79 Brazila 3.53 29.63 16.63 0.17 3.28 11.31 3.87 72.26 Chile 0.83 10.26 10.69 0.27 1.47 20.49 1.35 62.42 Colombiaa 3.34 69.15 17.71 0.29 0.03 6.25 1.72 89.80 Costa Ricaa 2.35 11.78 17.83 0.27 0.93 7.81 2.22 93.08 El Salvadora 3.92 50.62 33.51 0.22 19.50 12.41 1.05 77.84 Mexico 3.14 15.00 11.64 1.05 5.82 36.15 1.33 75.78 Panamaa 3.69 15.88 15.25 0.41 1.03 7.91 2.83 59.02 Paraguaya 0.74 16.38 10.42 0.43 1.42 6.26 2.05 51.31 Trinidad and Tobago 2.48 16.74 11.87 3.33 0.67 9.55 3.87 170.91 Uruguay 1.43 15.18 10.05 4.02 1.45 5.95 3.27 60.10 Venezuela 3.19 19.39 23.20 2.24 0.84 11.21 1.81 119.36 EMR-B Kuwait 2.20 3.93 19.01 0.65 0.05 4.01 0.97 79.10 WPR-B Philippines (the)a 2.35 19.80 8.60 0.30 0.71 10.00 4.67 86.22 Republic of Korea (the)a 6.59 16.00 20.00 0.92 2.48 20.02 1.69 27.01

WHO Global Status Report on Alcohol 2004
57
Country Falls Intentional injuries
Traffic casualties
Accidentalpoisoning
Alcohol use
disorders
Liver cirrhosis
Mouth and
oropharynx cancer
Ischaemic heart
disease
AMR-A Canada 3.08 12.09 8.45 2.73 1.61 5.24 2.06 82.97 Cuba 12.26 18.22 12.19 0.32 2.31 7.61 3.82 108.52 United States of America (the) 6.78 20.21 15.00 0.58 1.90 7.47 2.00 112.40 EUR-A Austria 6.76 15.38 9.84 1.11 2.98 14.95 3.96 100.03 Croatia 8.33 17.32 11.27 1.72 3.18 20.90 5.27 127.98 Czech Republic (the) 12.18 14.31 8.65 2.76 0.76 12.36 4.04 141.13 Denmark 12.20 13.00 9.57 2.96 6.90 11.70 3.17 90.91 Finland 10.84 23.20 7.77 9.12 3.63 9.60 1.82 122.98 France 8.69 15.01 13.06 0.79 3.37 11.45 5.85 39.12 Germany 4.40 11.15 8.05 1.14 4.01 13.36 3.77 95.74 Greece 3.20 4.06 18.88 2.57 0.05 3.83 1.22 63.65 Icelandb 2.81 11.42 6.16 0.57 2.29 2.58 1.60 108.20 Ireland 7.00 11.97 10.14 1.04 1.98 3.94 3.04 133.70 Israel 1.46 8.26 5.57 0.26 0.93 3.85 1.20 77.33 Italy 7.48 6.38 11.76 0.37 0.22 10.73 2.90 57.20 Luxembourgb 5.25 16.77 17.36 5.22 4.17 12.19 4.28 59.33 Maltab 8.70 9.55 4.49 1.30 0.37 5.46 4.64 144.63 Netherlands (the) 2.66 9.54 6.59 0.74 1.39 4.44 2.47 70.17 Norway 8.05 12.16 6.05 1.99 3.44 3.10 2.47 81.19 Portugal 3.38 4.82 12.50 0.64 0.32 13.08 4.06 50.51 Spain 2.31 7.49 13.98 2.03 0.52 8.45 3.75 49.94 Sweden 18.45 21.10 5.84 1.49 2.47 3.97 1.69 89.28 Switzerland 2.88 14.65 6.50 3.85 2.31 5.79 3.33 70.55 United Kingdom (the) 14.80 14.62 5.62 1.91 0.87 7.36 2.15 112.41 WPR-A Australia 2.27 13.63 8.91 3.05 0.99 3.77 2.69 85.46 Japan 2.78 18.80 7.38 0.38 0.24 6.15 2.23 27.29 New Zealand 4.17 13.23 11.57 0.83 0.46 2.40 2.65 102.50 Singaporea 3.09 9.47 4.96 0.09 N.A. 2.84 5.83 91.24
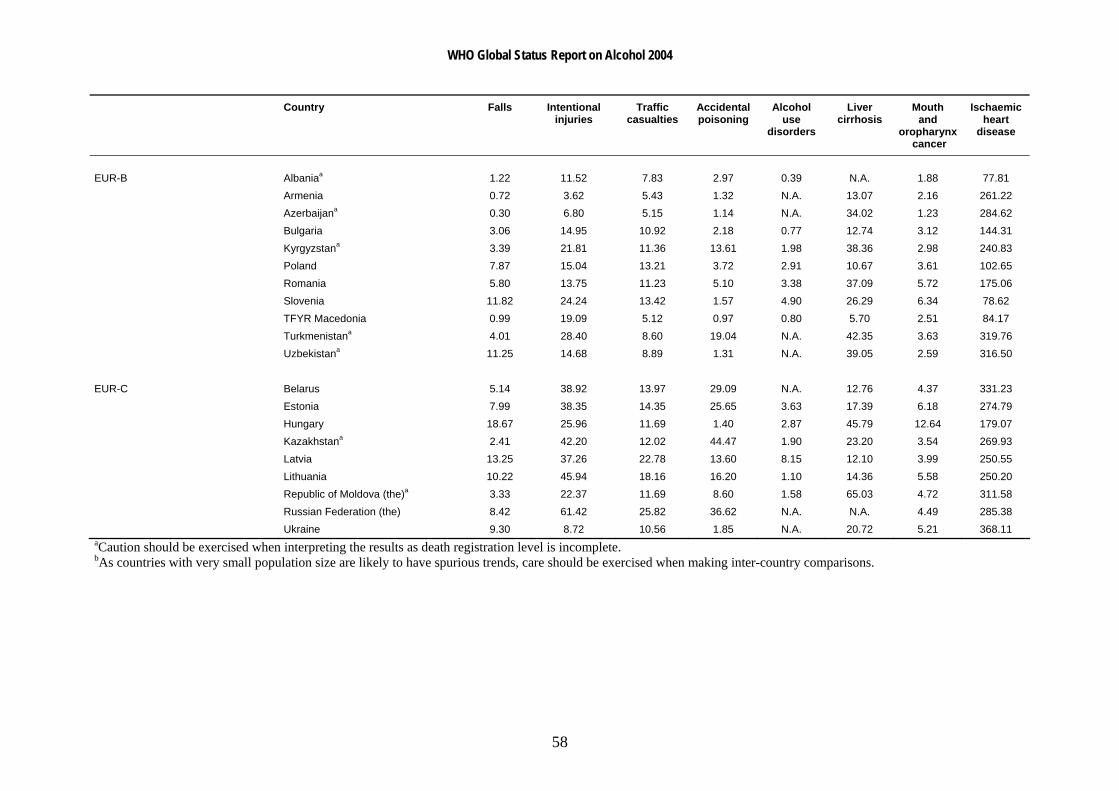
WHO Global Status Report on Alcohol 2004
58
Country Falls Intentional injuries
Traffic casualties
Accidentalpoisoning
Alcohol use
disorders
Liver cirrhosis
Mouth and
oropharynx cancer
Ischaemic heart
disease
EUR-B Albaniaa 1.22 11.52 7.83 2.97 0.39 N.A. 1.88 77.81 Armenia 0.72 3.62 5.43 1.32 N.A. 13.07 2.16 261.22 Azerbaijana 0.30 6.80 5.15 1.14 N.A. 34.02 1.23 284.62 Bulgaria 3.06 14.95 10.92 2.18 0.77 12.74 3.12 144.31 Kyrgyzstana 3.39 21.81 11.36 13.61 1.98 38.36 2.98 240.83 Poland 7.87 15.04 13.21 3.72 2.91 10.67 3.61 102.65 Romania 5.80 13.75 11.23 5.10 3.38 37.09 5.72 175.06 Slovenia 11.82 24.24 13.42 1.57 4.90 26.29 6.34 78.62 TFYR Macedonia 0.99 19.09 5.12 0.97 0.80 5.70 2.51 84.17 Turkmenistana 4.01 28.40 8.60 19.04 N.A. 42.35 3.63 319.76 Uzbekistana 11.25 14.68 8.89 1.31 N.A. 39.05 2.59 316.50 EUR-C Belarus 5.14 38.92 13.97 29.09 N.A. 12.76 4.37 331.23 Estonia 7.99 38.35 14.35 25.65 3.63 17.39 6.18 274.79 Hungary 18.67 25.96 11.69 1.40 2.87 45.79 12.64 179.07 Kazakhstana 2.41 42.20 12.02 44.47 1.90 23.20 3.54 269.93 Latvia 13.25 37.26 22.78 13.60 8.15 12.10 3.99 250.55 Lithuania 10.22 45.94 18.16 16.20 1.10 14.36 5.58 250.20 Republic of Moldova (the)a 3.33 22.37 11.69 8.60 1.58 65.03 4.72 311.58 Russian Federation (the) 8.42 61.42 25.82 36.62 N.A. N.A. 4.49 285.38 Ukraine 9.30 8.72 10.56 1.85 N.A. 20.72 5.21 368.11 aCaution should be exercised when interpreting the results as death registration level is incomplete. bAs countries with very small population size are likely to have spurious trends, care should be exercised when making inter-country comparisons.
WHO Global Status Report on Alcohol 2004
59
Social problems associated with alcohol use Alcohol consumption is linked to many harmful consequences for the individual drinker, the drinker’s immediate environment and society as a whole. Such social consequences as traffic accidents, workplace-related problems, family and domestic problems, and interpersonal violence have been receiving more public or research attention in recent years, indicating a growing interest in a broader concept of alcohol-related consequences (Klingemann & Gmel, 2001). On the other hand, however, social consequences affect individuals other than the drinker e.g. passengers involved in traffic casualties, or family members affected by failure to fulfill social role obligations, or incidences of violence in the family. Ultimately, however, these events have an impact on society as a whole insofar as they affect economic productivity or require the attention and resources of the criminal justice or health care system, or of other social institutions (Gmel & Rehm, 2003). Due to space constraints, this section will only highlight some issues and data involving the following selected social problems: alcohol consumption and workplace problems, alcohol consumption and family problems, poverty, and domestic violence.
Alcohol consumption and the workplace
Heavy drinking at the workplace may potentially lower productivity. Sickness absence associated with harmful use of alcohol and alcohol dependence entails a substantial cost to employees and social security systems. There is ample evidence that people with alcohol dependence and problem drinkers have higher rates of sickness absence than other employees (Klingemann & Gmel, 2001).
Klingemann & Gmel (2001) note that a number of studies have demonstrated an association between heavy drinking or alcohol abuse and unemployment. Here, a causal association may go in either direction, heavy drinking may lead to unemployment, as suggested by Mustonen, Paakkaned & Simpura (1994) and Mullahy & Sindelar (1996); but loss of work may also result in increased drinking, which may become heavy drinking, as indicated by Gallant (1993), Dooley & Prause (1998) and Claussen (1999).
Blum, Roman & Martin (1993) and Mangione et al. (1999) found that work performance was related to volume and pattern of drinking. Blum and her colleagues found no significant relationship between work performance and average daily volume when performance was assessed by self-reports of the drinker. However, lower performance, lack of self-direction and problems in personal relations were found to be related to heavy drinking, particularly when collateral reports were used. In the Mangione et al. study, it was found that although moderate-heavy and heavy drinkers reported more work performance problems than very light, or moderate drinkers, the lower-level-drinking employees, since they were more plentiful, accounted for a larger proportion of work performance problems than did the heavier drinking groups. A study conducted by Ames, Grube & Moore (1997) found modest but significant relationships between drinking behaviours and self-reports of workplace problems.
Some examples may highlight the extent to which alcohol affects work performance. It has been estimated that 30% of absenteeism and workplace accidents in Costa Rica were caused by alcohol dependence (Pan American Health Organization, 1990). According to industry association sources from India, 15% to 20% of absenteeism and 40% of accidents at work are due to alcohol consumption (Saxena, Sharma & Maulik, 2003). A study by the Department of
WHO Global Status Report on Alcohol 2004
60
Hygiene and Industrial Safety in three factories in La Paz, Bolivia found that 7.3% of absenteeism in the first two days of the work week and 1.2% of work-related accidents were directly related to the consumption of alcohol (Pan American Health Organization, 1990). It has been estimated that 20–22% of work-related accidents in Chile have a direct or indirect relationship with recent alcohol use. In a study of patients who required hospitalization for severe work-related accidents, it was found that 15% reported recent use of alcohol (Trucco et al., 1998). It has been reported that in Latvia, alcoholism has had adverse impacts on productivity in the workplace and increased absenteeism. No figures have been published on the extent of absenteeism due to excessive alcohol use. It is estimated that drinking and alcoholism have reduced labour productivity by some 10% (Trapenciere, 2000). A recent survey conducted in the United States of America found that farm residents who drank more frequently had significantly higher farm work injury incidence rates (3.35 per 10 000 person-days of observation) than others who consumed less frequently (1.94 injuries per 10 000 person-days) (Stallones & Xiang, 2003).
With regards to trauma, alcohol is the cause of 10% to 20% of work accidents in France (Costes & Martineau, 2002). A survey conducted in Australia of 833 employees at an industrial worksite found that problem drinkers were 2.7 times more likely to have injury-related absences than non-problem drinkers (Webb et al., 1994). In a 1994 survey, 90% of personnel directors from British organizations cited alcohol consumption as a problem within their workplace. Their major concerns included loss of productivity, absenteeism, safety, employee relations, poor behaviour and impacts on company image. About 8–14 million working days are lost annually to alcohol-related problems. With regard to safety, up to 25% of workplace accidents and around 60% of fatal accidents at work may be associated with alcohol (Hughes & Bellis, 2000). It is estimated that the annual alcohol-related costs to workplaces in the United Kingdom is £6.4 billion (Prime Minister's Strategy Unit, 2003).
Alcohol consumption and the family
It is well established that drinking can severely impair the individual’s functioning in various social roles. Alcohol misuse is associated with many negative consequences both for the drinker’s partner as well as the children. Maternal alcohol consumption during pregnancy can result in fetal alcohol syndrome in children, and parental drinking is correlated with child abuse and impacts a child’s environment in many social, psychological and economic ways (Gmel & Rehm, 2003). Drinking can impair performance as a parent, as a spouse or partner, and as a contributor to household functioning. There are also other aspects of drinking which may impair functioning as a family member. In many societies, drinking may be carried out primarily outside the family and the home. In this circumstance, time spent while drinking often competes with the time needed to carry on family life. Drinking also costs money and can impact upon resources particularly of a poor family, leaving other family members destitute. Also, it is worth noting that specific intoxicated events can also have lasting consequences, through home accidents and family violence (Room, 1998; Room et al., 2002). A recent paper by Bonu et al. (2004) suggests that adverse child health effects of alcohol use are primarily through two distal determinants (indirect effects) - forgone household disposable income and caretakers' time for childcare. Diversion of scant economic resources for alcohol use that could have otherwise been used for seeking health care, may lead to self-care or delay in seeking health care. The other potential ways by which alcohol use can reduce the household income are through morbidity associated with the drinking habit among the consuming individuals, resulting in increase in medical expenditures and loss of income due

WHO Global Status Report on Alcohol 2004
61
to lost wages, and, sometimes, resulting in the premature death of sole wage earners in a household (Bonu et al., 2004).
Implicit in the habitual drinker's potential impact on family life is the fact that the drinking and its consequences can result in substantial mental health problems of family members. Such effects, though potentially common, are not often documented. Some insight into this issue can be gained from interviews with members of Al-Anon, a companion organization to Alcoholic Anonymous for spouses and family members of people with alcohol dependence. In interviews with 45 Al-Anon members in Mexico (82% of them the wife of a husband who was alcohol-dependent), 73% reported feelings of anxiety, fear, and depression; 62% reported physical or verbal aggression by the spouse toward the family; and 31% reported family disintegration with serious problems involving money and the children (Rosovsky et al., 1992, cited in Room et al., 2002).
The effects of men's drinking on other members of the family is often particularly on women in their roles as mothers or wives of drinkers. The risks include violence, HIV infection, and an increased burden in their role of economic providers. In a paper that looked at alcohol and alcohol-related problems facing women in Lesotho, it was noted that as in many other developing countries, the cultural position of women in Lesotho facilitates a vicious circle in which women are at one time brewers of alcohol, then sellers, then become excessive consumers due to the problems created by their drinking husbands (Mphi, 1994). Case example 1: Botswana The economic consequences of chronic alcohol use are devastating and can seriously hinder any sense of development. In a study of alcohol use among the Basarwa of the Kgalagadi and Ghanzi districts in Botswana, informants stated that since a significant proportion of household income was spent on liquor, less cash was available for food, clothing and other essential items. As one informant succinctly stated ‘alcohol makes poor people poorer’. A person who is regularly under the influence of alcohol will have little motivation or interest in working, unless it is to obtain money to buy more alcohol. One particular problem is that a regular drinker can easily become economically tied and indebted to alcohol vendors who are only too pleased to provide alcohol ‘on credit’. Child neglect is an increasing problem when parents are intoxicated so early in the day that they are not able to prepare food for their children, even if there is food available. A concern is that some parents will sell food to buy alcohol while others will give alcohol to their children as a food substitute and to stave off hunger. Generally, the neglect of young children due to alcohol abuse means that these children are under-socialized as well as malnourished, leading to a refusal to attend school, begging and stealing for food, and other delinquent activities. Source: Molamu & MacDonald (1996)
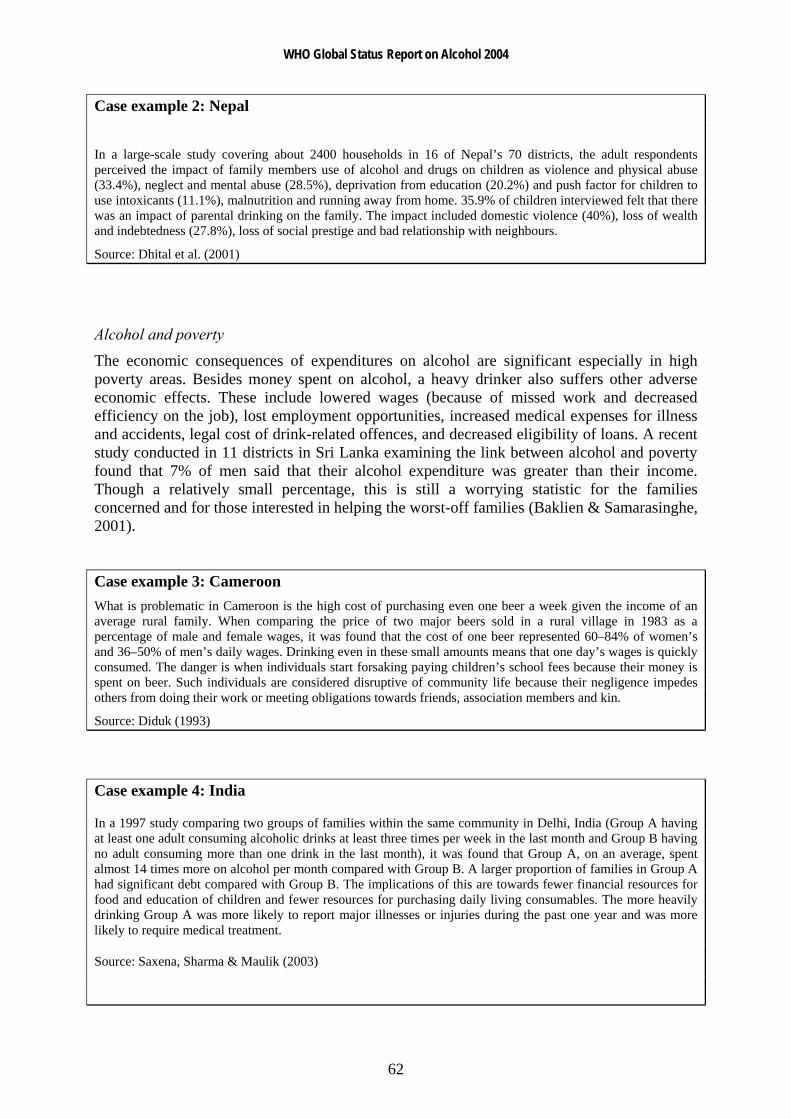
WHO Global Status Report on Alcohol 2004
62
Case example 2: Nepal
In a large-scale study covering about 2400 households in 16 of Nepal’s 70 districts, the adult respondents perceived the impact of family members use of alcohol and drugs on children as violence and physical abuse (33.4%), neglect and mental abuse (28.5%), deprivation from education (20.2%) and push factor for children to use intoxicants (11.1%), malnutrition and running away from home. 35.9% of children interviewed felt that there was an impact of parental drinking on the family. The impact included domestic violence (40%), loss of wealth and indebtedness (27.8%), loss of social prestige and bad relationship with neighbours.
Source: Dhital et al. (2001)
Alcohol and poverty
The economic consequences of expenditures on alcohol are significant especially in high poverty areas. Besides money spent on alcohol, a heavy drinker also suffers other adverse economic effects. These include lowered wages (because of missed work and decreased efficiency on the job), lost employment opportunities, increased medical expenses for illness and accidents, legal cost of drink-related offences, and decreased eligibility of loans. A recent study conducted in 11 districts in Sri Lanka examining the link between alcohol and poverty found that 7% of men said that their alcohol expenditure was greater than their income. Though a relatively small percentage, this is still a worrying statistic for the families concerned and for those interested in helping the worst-off families (Baklien & Samarasinghe, 2001).
Case example 3: Cameroon What is problematic in Cameroon is the high cost of purchasing even one beer a week given the income of an average rural family. When comparing the price of two major beers sold in a rural village in 1983 as a percentage of male and female wages, it was found that the cost of one beer represented 60–84% of women’s and 36–50% of men’s daily wages. Drinking even in these small amounts means that one day’s wages is quickly consumed. The danger is when individuals start forsaking paying children’s school fees because their money is spent on beer. Such individuals are considered disruptive of community life because their negligence impedes others from doing their work or meeting obligations towards friends, association members and kin.
Source: Diduk (1993)
Case example 4: India
In a 1997 study comparing two groups of families within the same community in Delhi, India (Group A having at least one adult consuming alcoholic drinks at least three times per week in the last month and Group B having no adult consuming more than one drink in the last month), it was found that Group A, on an average, spent almost 14 times more on alcohol per month compared with Group B. A larger proportion of families in Group A had significant debt compared with Group B. The implications of this are towards fewer financial resources for food and education of children and fewer resources for purchasing daily living consumables. The more heavily drinking Group A was more likely to report major illnesses or injuries during the past one year and was more likely to require medical treatment.
Source: Saxena, Sharma & Maulik (2003)

WHO Global Status Report on Alcohol 2004
63
Case example 5: Malaysia
Alcohol is a major factor in exacerbating poverty. In a month a rural labourer can spend about RM 300 (US$ 80) on alcohol which is about how much he earns. The alcohol menace ruins families and contributes to the breakdown of the basic social fabric of society. Often it is the women who bear the brunt of this problem – wife battery, discord in the home, abused and deprived children, non-working or chronically ill husbands who become a burden to both the family and society. Besides loss in family income, the burden on the family is worsened when the drinker falls ill, cannot work and requires medical attention.
Source: Assunta (2001–2002)
Alcohol and domestic violence
Research has found that alcohol is present in a substantial number of domestic violence accidents. The most common pattern is drinking by both offender and victim. Alcohol has been shown to be a significant risk factor for husband-to-wife violence. Studies have shown that the relationship between alcohol and domestic violence is complex.
Drinking frequently has been associated with intrafamily violence. Reviews have found that excessive alcohol use is a strong and consistent correlate of marital violence, but that violence rates vary based on research designs, methodologies, and samples. Therefore, the role of alcohol remains unclear. Studies based on interviews with abused wives tend to report higher proportions of alcohol involvement than do general population studies or police samples. In a study examining episodes of domestic violence reported to the police in Zurich, Switzerland, evidence of alcohol involvement was found in 40% of the investigated situations. Police officers thus believed there was a clear link between alcohol and violence in at least 26% of the cases studied (Maffli & Zumbrunn, 2003).
Regarding partner violence, research evidence indicates that it is more strongly associated with heavy drinking, whether usual or occasional, than is non-partner violence, and conflicts as to whether drinking by the victim makes violent acts by a partner more likely. That alcohol consumption has a stronger association with partner violence than with nonpartner violence may be a matter of access, with partners having more contact and thus more opportunities for violent encounters (Gmel & Rehm, 2003). Studies also report an association between drinking patterns and intimate partner violence; excessive drinkers and alcohol-dependent individuals are more likely to act violently toward their intimate partners (White & Chen, 2002).
To give some examples from the literature, a study conducted in Nigeria showed a strong association between domestic violence and alcohol use. Alcohol use was involved in 51% of the cases in which a husband stabbed a wife (Obot, 2000). In a 1998 cross-sectional study of violence against women undertaken in three provinces in South Africa, it was found that domestic violence was significantly positively associated with the women drinking alcohol and conflict over the partner's drinking (Jewkes, Levin & Penn-Kekana 2002).
In a 2000–2001 survey of 5109 women of reproductive age in the Rakai District of Uganda, it was found that the strength of the association between alcohol consumption and domestic violence was particularly noteworthy. Women whose partner frequently or always consumed alcohol before having sex faced risks of domestic violence almost five times higher than those whose partners never drank before having sex. Of women who recently experienced domestic violence, 52% reported that their partner had consumed alcohol and 27% reported that their
WHO Global Status Report on Alcohol 2004
64
partners had frequently consumed alcohol. This finding supports the conclusion that alcohol may play a direct precipitating role for domestic violence (Koenig et al., 2003).
In a study of 180 women seeking prenatal care in rural South India, it was found that 20% of the women reported domestic violence and 94.5% of these women identified their husbands as the aggressors. Husband’s alcohol use was a significant risk factor for domestic violence (Halasyamani, Davis & Battacharjee, 1997). The role of alcohol in domestic violence is also cited in another Indian study which found that 33% of spouse-abusing husbands were using alcohol. Of these 15% were occasional, 45% frequent and about 40% were daily users of alcohol. More than half of the spousal abuse took place during the period of intoxication (AIIMS, 1997). A cross-sectional study of a random sample of 275 women in Barranquilla, Colombia found that habitual alcohol consumption in the women and in the spouses were factors associated with marital violence (Tuesca & Borda, 2003).
It has been suggested that because alcohol-dependent individuals are intoxicated more frequently than non-dependent individuals, the observed association between spousal abuse and intoxication may occur simply by chance. In addition, most instances of spouse abuse occur in the absence of alcohol intoxication, suggesting the need to understand better the processes through which some episodes escalate into violence (Martin, 1992). Although many studies have found that alcohol use is associated with intimate partner violence, the nature of the association needs to be clarified.
In conclusion, however, there is little doubt that alcohol consumption is associated with many social consequences. The available data on consequences to the direct social and personal environment from short-term as well as long-term use of alcohol are sparse. Much more research into this issue would be required to obtain standard measures or data that would allow quantification of these consequences in a meaningful and comparable manner.

WHO Global Status Report on Alcohol 2004
65
Economic and social costs of alcohol use There is a strong interest in many countries regarding the development of scientifically valid, credible estimates of the economic costs of alcohol use (and use of other psychoactive substance use like tobacco and drugs). It is a well established fact that the use of alcohol entails a large number of adverse consequences in such widely differing areas as physical and mental health, traffic safety, violence, and labour productivity. There has been much effort in the past three decades in attempting to estimate these costs and recent investigations have suggested that they account annually for a substantial part of the Gross Domestic Product of industrialized countries (Klingemann & Gmel, 2001).
On the assumption that the harmful effects of drinking can be evaluated in monetary terms, health researchers and economists have attempted to estimate the costs of alcohol consumption to society. According to Klingemann & Gmel (2001), social costs are largely defined as costs to society, i.e. all costs arising from alcohol consumption that are not borne exclusively, knowingly and freely by the drinker, such as spending on the drinks. Thus, social costs are the negative economic impact of alcohol consumption on the material welfare of society. When defining costs, a key distinction is made between direct and indirect costs. According to Harwood, Fountain & Livermore (1998, cited in Klingemann & Gmel, 2001), direct costs refer to the value of goods and services actually delivered to address the harmful effects of alcohol consumption. In contrast, indirect costs represent the value of personal productive services that are not performed because of the adverse consequences of drinking.
Single and colleagues (2003) summarize the many purposes that estimates of the social and economic costs of alcohol use can serve:
Economic cost estimates can be used to argue or justify certain policies on alcohol i.e. such policies to reduce the harm associated with alcohol use should be given a high priority on the public policy agenda. The public is entitled to a quality standard against which individual cost estimation studies can be assessed.
Cost estimates help to appropriately target specific problems and policies. It is important for policy makers to be aware of which psychoactive substances involve the greatest economic costs. For example, the recent study conducted in Australia concluded that the costs of alcohol (and tobacco) far exceeds the social costs from illicit drugs, thus drawing greater attention on public policy towards the licit drugs. The specific types of cost may also draw attention to specific areas which need public attention, or where specific measures may be effective.
Economic costs studies help to identify information gaps, research needs and desirable refinements to national statistical reporting systems.
The development of improved estimates of the costs of alcohol abuse offers the potential to provide baseline measures to determine the efficacy of drug policies and programmes intended to reduce the damaging consequences of alcohol use.
Relatively few countries have attempted to estimate the costs of alcohol use. Estimating the costs of alcohol consumption encounters problems over availability of data as well as methodological difficulties. However, the fact that studies carried out in different countries using a variety of approaches and methods all seem to lead to convergent results is a positive indication that results are valid. In all cases, there is confirmation that alcohol consumption imposes significant damage on society.
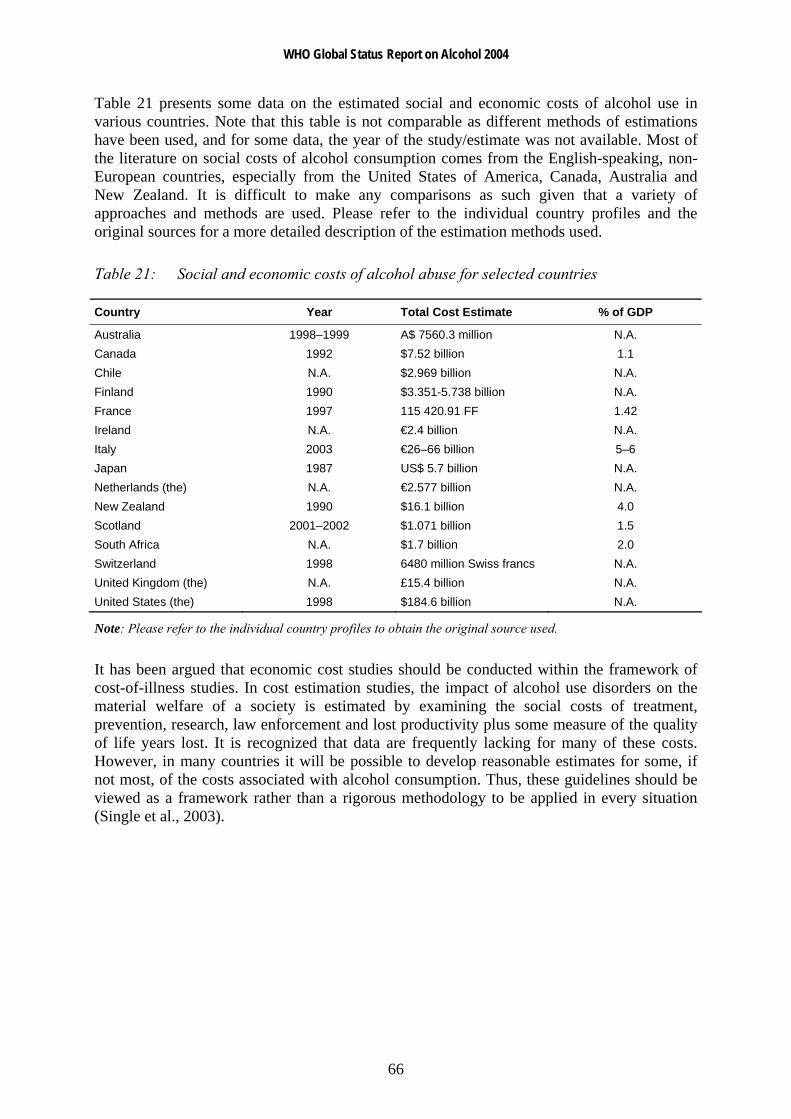
WHO Global Status Report on Alcohol 2004
66
Table 21 presents some data on the estimated social and economic costs of alcohol use in various countries. Note that this table is not comparable as different methods of estimations have been used, and for some data, the year of the study/estimate was not available. Most of the literature on social costs of alcohol consumption comes from the English-speaking, non-European countries, especially from the United States of America, Canada, Australia and New Zealand. It is difficult to make any comparisons as such given that a variety of approaches and methods are used. Please refer to the individual country profiles and the original sources for a more detailed description of the estimation methods used.
Table 21: Social and economic costs of alcohol abuse for selected countries
Country Year Total Cost Estimate % of GDP
Australia 1998–1999 A$ 7560.3 million N.A. Canada 1992 $7.52 billion 1.1 Chile N.A. $2.969 billion N.A. Finland 1990 $3.351-5.738 billion N.A. France 1997 115 420.91 FF 1.42 Ireland N.A. €2.4 billion N.A. Italy 2003 €26–66 billion 5–6 Japan 1987 US$ 5.7 billion N.A. Netherlands (the) N.A. €2.577 billion N.A. New Zealand 1990 $16.1 billion 4.0 Scotland 2001–2002 $1.071 billion 1.5 South Africa N.A. $1.7 billion 2.0 Switzerland 1998 6480 million Swiss francs N.A. United Kingdom (the) N.A. £15.4 billion N.A. United States (the) 1998 $184.6 billion N.A.
Note: Please refer to the individual country profiles to obtain the original source used.
It has been argued that economic cost studies should be conducted within the framework of cost-of-illness studies. In cost estimation studies, the impact of alcohol use disorders on the material welfare of a society is estimated by examining the social costs of treatment, prevention, research, law enforcement and lost productivity plus some measure of the quality of life years lost. It is recognized that data are frequently lacking for many of these costs. However, in many countries it will be possible to develop reasonable estimates for some, if not most, of the costs associated with alcohol consumption. Thus, these guidelines should be viewed as a framework rather than a rigorous methodology to be applied in every situation (Single et al., 2003).

WHO Global Status Report on Alcohol 2004
67
Conclusion
Alcohol is not an ordinary commodity. While it carries connotations of pleasure and sociability in the minds of many, harmful consequences of its use are diverse and widespread. As documented in this report, globally, alcohol problems exert an enormous toll on the lives and communities of many nations, especially those in the developing world. Research has shown that when extrapolating from historical trends, the role of alcohol as a major factor in the burden of disease will be increasing in the future. Particularly worrying trends are the increases in average volume of drinking predicted for the most populous regions of the world (e.g. in China and India) and the emerging trend of more harmful and risky patterns in drinking especially among young people. A global perspective on alcohol policy needs to acknowledge and take into account the characteristics, effects and consequences of alcohol use in different societies, and yet to focus and act on the public health goal which is to minimize the harm caused by drinking. Alcohol-related burden is linked to at least two different dimensions of consumption: average volume and patterns of drinking. Thus, in order to avoid or reduce burden, both dimensions should be taken into consideration. In other words, one may reduce burden by decreasing the average volume of alcohol consumed or by shifting patterns of drinking to less harmful patterns. One may also change burden by weakening the link between exposure and disease, e.g. by disaggregating the link between alcohol and traffic injuries by not combining drinking and driving (Rehm et al., 2003b). This report has contributed to the knowledge base for doing so, by documenting levels and trends in alcohol-related problems, and showing how drinking levels and patterns contribute to these problems. Another recent WHO publication - the Global status report: alcohol policy - seeks to evaluate and disseminate knowledge of strategies and policies that are effective in reducing the rates of alcohol problems. The Global Alcohol Database, as well as this report, aims at providing a standardized reference source of information for global epidemiological surveillance of alcohol use and related problems. It is evident from this report that there is a need for countries to develop national monitoring systems to keep track of alcohol consumption and its health and social consequences. This would be particularly useful in raising awareness among the general public and policy-makers of the serious implications that alcohol use have within the public health domain. To effectively reduce the level of harmful social and health consequences from alcohol use requires much preparation and planning. It is now the responsibility of governments worldwide and concerned citizens to encourage healthy debate and formulate effective public health-oriented countermeasures in order to minimize the harm caused by alcohol use.

WHO Global Status Report on Alcohol 2004
68
References Abel EL. Maternal alcohol consumption and spontaneous abortion. Alcohol and Alcoholism, 1997, 32(3):211-219.
Summary and recommendations. National Workshop on Alcohol Policy: Health Perspectives. New Delhi, All India Institute of Medical Sciences, 1997.
Ajani UA et al. Alcohol consumption and incidence of malignant neoplasms: The Physicians' Health Study. American Journal of Epidemiology, 1998, 147(11):45.
Ajani UA et al. Alcohol consumption and risk of type two diabetes mellitus. American Journal of Epidemiology, 1999, 149:S3.
Akyeampong E. Alcoholism in Ghana - a socio-cultural exploration. Culture, Medicine and Psychiatry, 1995, 19(2):261-280.
Alpert JE et al. Patterns of axis I comorbidity in early-onset versus late-onset major depressive disorder. Biological Psychiatry, 1999, 46(2):202-211.
Alvear J, Andreani S, Cortes F. Fetal alcohol syndrome and fetal alcohol effects: importance of early diagnosis and nutritional treatment. Revista Medica de Chile, 1998, 126(4):407-412.
Ames GM, Grube JW, Moore RS. The relationship of drinking and hangovers to workplace problems: an empirical study. Journal of Studies on Alcohol, 1997, 58(1):37-47.
Ammann RW, Heitz PU, Klöppel G. Course of alcoholic chronic pancreatitis: a prospective clinicomorphological long-term study. Gastroenterology, 1996, 111(1):224-231.
Apte MV, Wilson JS, Korsten MA. Alcohol-related pancreatic damage: mechanisms and treatment. Alcohol Health and Research World, 1997, 21(1):13-20.
Arokiasamy CV. Malaysia. In: Heath DB, ed. International Handbook on Alcohol and Culture. Westport, Greenwood Press, 1995.
Ashley MJ et al. Beyond ischemic heart disease: are there other health benefits from drinking alcohol? Contemporary Drug Problems, 2000, 27:735-777.
Assunta M. The alcohol problem in Malaysia. The Globe, 2001-2002, Special Issue 4:18-21.
Attili AF et al. Diet and gallstones in Italy: the cross-sectional MICOL results. Hepatology, 1998, 27(6):1492-1598.
Babor T et al. Alcohol: No ordinary commodity. Research and public policy. New York, Oxford University Press, 2003.
Babor T, Rehm J, Room R. Alcohol's role in the global burden of disease: implications for alcohol policy. Geneva, World Health Organization, in press.
Bagnardi V et al. Alcohol consumption and the risk of cancer: a meta-analysis. Alcohol Research and Health, 2001, 25(4):263-270.

WHO Global Status Report on Alcohol 2004
69
Baklien B, Samarasinghe D. Alcohol and poverty in Sri Lanka. FORUT (Solidaritetsaksjon for utvikling [Campaign for development and solidarity]), 2001.
Baraona E, Lieber CS. Alcohol and lipids. In: Galanter M, ed. The Consequences of Alcoholism. New York, Plenum Press, 1998:97-134.
Beaglehole R, Jackson R. Alcohol, cardiovascular diseases and all causes of death: a review of the epidemiological evidence. Drug and Alcohol Review, 1992, 11:175-290.
Beilin LJ, Puddey IB, Burke V. Alcohol and hypertension - kill or cure? Journal of Human Hypertension, 1996, 10(2):S1-S5.
Berger K et al. Light-to-moderate alcohol consumption and risk of stroke among U.S. male physicians. New England Journal of Medicine, 1999, 341(21):1557-1564.
Blixen CE, McDougall GJ, Suen LJ. Dual diagnosis in elders discharged from a psychiatric hospital. International Journal of Geriatric Psychiatry, 1997, 12(3):307-313.
Blum TC, Roman PM, Martin JK. Alcohol consumption and work performance. Journal of Studies on Alcohol, 1993, 54(1):61-70.
Bobak M, Marmot M. Alcohol and mortality in Russia: is it different than elsewhere? Annals of Epidemiology, 1999, 9(6):335-338.
Bode C, Bode JC. Alcohol's role in gastrointestinal tract disorders. Alcohol Health and Research World, 1997, 21(1):76-83.
Bondy SJ. Overview of studies on drinking patterns and their reported consequences. Addiction, 1996, 91(11):1661-1674.
Bonu S et al. Household tobacco and alcohol use, and child health: an exploratory study from India. Health Policy, 2004, 70:67–83.
Boutron MC et al. Tobacco, alcohol, and colorectal tumors: a multistep process. American Journal of Epidemiology, 1995, 141(11):1038-1046.
Bovet P. Alcohol consumption and association with the CAGE questionnaire and physiological variables in the Seychelles Islands (Indian Ocean). In: Demers A, Room R, Bourgault C. Survey of drinking patterns and problems in seven developing countries. Geneva, World Health Organization, 2001.
Bowlin SJ et al. Breast cancer risk and alcohol consumption: results from a large case-control study. International Journal of Epidemiology, 1997, 26(5):915-923.
Bradley KA et al. Medical risks for women who drink alcohol. Journal of General Internal Medicine, 1998, 13(9):627-639.
Breslow RA, Weed DL. Review of epidemiologic studies of alcohol and prostate cancer: 1971-1996. Nutrition and Cancer, 1998, 30(1):1-13.
WHO Global Status Report on Alcohol 2004
70
Britton A, McKee M. The relation between alcohol and cardiovascular disease in Eastern Europe: explaining the paradox. Journal of Epidemiology and Community Health, 2000, 54(5):328-332.
Brown SA, Schuckit MA. Changes in depression among abstinent alcoholics. Journal of Studies on Alcohol, 1988, 49:412-417.
Bruemmer B et al. Fluid intake and the incidence of bladder cancer among middle-aged men and women in a three-county area of Western Washington. Nutrition and Cancer, 1997, 29(2):163-168.
Bruun K et al. Alcohol Control Policies in Public Health Perspective. Helsinki, Finnish Foundation for Alcohol Studies, 1975.
Bushman BJ. Effects of alcohol on human aggression: Validity of proposed mechanisms. In: Galanter M, ed. Recent developments in alcoholism. New York, Plenum Press, 1997:227-244.
Camargo CA et al. Prospective study of moderate alcohol consumption and mortality in US male physicians. Archives of Internal Medicine, 1997, 157(1):79-85.
Caroli-Bosc FX et al. Cholelithiasis and dietary risk factors: an epidemiologic investigation in Vidauban, Southeast France. General Practitioner's Group of Vidauban. Digestive Diseases and Sciences, 1998, 43(9):2131-2137.
Chadwick DJ, Goode JA, eds. Alcohol and Cardiovascular Diseases: Novartis Foundation Symposium 216. New York, John Wiley & Sons, 1998.
Chen CY et al. The risk factors for gallstone disease among senior citizens: an Oriental study. Hepatogastroenterology, 1999, 46:1607-1612.
Chenet L et al. Daily variations in deaths in Lithuania: the possible contribution of binge drinking. International Journal of Epidemiology, 2001, 30(4):743-748.
Chenet L et al. Alcohol and cardiovascular mortality in Moscow; new evidence of a causal association. Journal of Epidemiology and Community Health, 1998, 52(12):772-774.
Cherpitel CJ. The epidemiology of alcohol-related trauma. Alcohol Health & Research World, 1992, 16:191-196.
Cherpitel CJ. Drinking patterns and problems and drinking in the event: An analysis of injury by cause among casualty patients. Alcoholism: Clinical and Experimental Research, 1996, 20:1130-1137.
Cherpitel CJ et al. Alcohol and non-fatal injury in the U.S. general population: A risk function analysis. Accident Analysis Prevention, 1995, 27:651-661.
Church MW et al. Hearing, language, speech, vestibular, and dentofacial disorders in fetal alcohol syndrome. Alcoholism, Clinical and Experimental Research, 1997, 21(2):227-237.
Claussen B. Alcohol disorders and re-employment in a 5-year follow-up of long-term unemployed. Addiction, 1999, 94(1):133-138.

WHO Global Status Report on Alcohol 2004
71
Connor PD, Streissguth AP. Effects of prenatal exposure to alcohol across the life span. Alcohol Health and Research World, 1996, 20(3):170-174.
Corrao G et al. Female sex and the risk of liver cirrhosis. Collaborative Groups for the Study of Liver Diseases in Italy. Scandinavian Journal of Gastroenterology, 1997, 32(11):1174-1180.
Corrao G et al. Meta-analysis of alcohol intake in relation to risk of liver cirrhosis. Alcohol and Alcoholism, 1998, 33(4):381-392.
Corrao G et al. Exploring the dose-response relationship between alcohol consumption and the risk of several alcohol-related conditions: a meta-analysis. Addiction, 1999, 94(10):1551-1573.
Corrao G et al. Alcohol and coronary heart disease: a meta-analysis. Addiction, 2000, 95(10):1505-1523.
Costes JM, Martineau H. Drugs and dependence - Indicators and trends in 2002. Tendances, 19. Paris, Observatoire Français des Drogues et des Toxicomanies [French Monitoring Centre of Drugs and Drug Addiction], 2002.
Criqui MH et al. Lipoprotein medicators for the effects of alcohol consumption and cigarette smoking on cardiovascular mortality. Results from the Lipid Research Clinics Follow-up Study. American Journal of Epidemiology, 1987, 126:629-637.
Criqui MH, Ringek BL. Does diet or alcohol explain the French paradox? The Lancet, 1994, 344:1719-1723.
Dackis CA et al. Evaluating depression in alcoholics. Psychiatry Research, 1986, 17(2):105-109.
Damström Thakker K. An overview of health risks and benefits of alcohol consumption. Alcoholism: Clinical and Experimental Research, 1998, 22(7):285S-298S.
Davidson KM. Diagnosis of depession in alcohol dependence: changes in prevalence with drinking status. British Journal of Psychiatry, 1995, 166:199-204.
De Stefani E et al. Tobacco smoking and alcohol drinking as risk factors for stomach cancer: a case-control study in Uruguay. Cancer Causes and Control, 1998, 9(3):321-329.
Dhital R et al. Alcohol and drug in Nepal: With reference to children. Kathmandu, Child Workers in Nepal Concerned Centre (CWIN), 2001.
Diduk S. European alcohol, history and the state in Cameroon. African Studies Review, 1993, 36(1):1-42.
Doll R. The benefit of alcohol in moderation. Drug and Alcohol Review, 1998, 17:353-363.
Doll R et al. Mortality in relation to consumption of alcohol: 13 years' observations on male British doctors. British Medical Journal, 1994, 309:911-918.

WHO Global Status Report on Alcohol 2004
72
Donato F et al. Bladder cancer, tobacco smoking, coffee and alcohol drinking in Brescia, northern Italy. European Journal of Epidemiology, 1997, 13(7):795-800.
Dooley D, Prause J. Underemployment and alcohol misuse in the National Longitudinal Survey of Youth. Journal of Studies on Alcohol, 1998, 59(6):669-680.
Drummond DC. The relationship between alcohol dependence and alcohol-related problems in a clinical population. British Journal of Addiction, 1990, 85(3):357-366.
Eckhardt MJ et al. Effects of Moderate Alcohol Consumption in the Central Nervous System. Alcoholism: Clinical and Experimental Research, 1998, 22(5):998-1040.
Edwards G et al. Alcohol Policy and the Public Good. New York, Oxford University Press, 1994.
Ellison LF et al. Monograph series on aging-related diseases: X. Prostate cancer. Chronic Diseases in Canada, 1998, 19(1):1-18.
English DR et al. The Quantification of Drug Caused Morbidity and Mortality in Australia, 1992. Canberra, Commonwealth Department of Human Services and Health, 1995.
Evans C et al. "I don't like Mondays" - day of the week of coronary heart disease deaths in Scotland: study of routinely collected data. British Medical Journal, 2000, 320(7229):218-219.
Ezzati M et al. and the Comparative Risk Assessment Collaborating Group. Selected major risk factors and global and regional burden of disease. Lancet, published online 30 October 2002 (http://image.thelancet.com/extras/02art9066web.pdf, accessed 15 June 2004).
Facchini F, Chen YD, Reaven GM. Light-to-moderate alcohol intake is associated with enhanced insulin sensitivity. Diabetes Care, 1994, 17:115-119.
Faden VB, Graubard BI, Dufour M. The relationship of drinking and birth outcome in a US national sample of expectant mothers. Paediatric and Perinatal Epidemiology, 1997, 11(2):167-180.
Fillmore KM et al. Alcohol consumption and mortality. III. Studies of female populations. Addiction, 1998, 93(2):219-229.
Flanagan DEH et al. Alcohol consumption and insulin resistance in young adults. European Journal of Clinical Investigation, 2000, 30(4):297-301.
Foppa M et al. Wine with the noon meal lowers post meal blood pressure: Randomized trial in centrally obese hypertensive patients. Hypertension, 1999, 33(4):119.
Freedland E, McMicken D, D'Onofrio G. Alcohol and trauma. Emergency Medicine Clinics of North America, 1993, 11:225-239.
Friedman HS. Cardiovascular effects of alcohol. In: Galanter M, ed. The Consequences of Alcoholism. New York, Plenum Press, 1998:135-166.
WHO Global Status Report on Alcohol 2004
73
Fuchs CS et al. Alcohol consumption and mortality among women. New England Journal of Medicine, 1995, 332(19):1245-1250.
Fuller M. Alcohol use and injury severity in trauma patients. Journal of Affective Disorders, 1995, 14:47-53.
Gallant DM. Unemployment and alcohol consumption. Alcoholism, Clinical and Experimental Research, 1993, 17(3):722-723.
Gapstur SM, Potter JD, Folsom AR. Alcohol consumption and colon and rectal cancer in postmenopausal women. International Journal of Epidemiology, 1994, 23(1):50-57.
Gentry RT. Effect of food on the pharmacokinetics of alcohol absorption. Alcoholism, Clinical and Experimental Research, 2000, 24(4):403-404.
Gibson S, Becker J. Changes in Alcoholics' Self-reported depression. Quarterly Journal of Studies on Alcohol, 1973, 34(3):829-836.
Global Alcohol Database. Geneva, World Health Organization, 2004a ( http://www.who.int/alcohol, accessed 15 June 2004).
Global Alcohol Policy Alliance. Youth and alcohol in Europe - WHO Ministerial Conference, Stockholm 2002. The Globe. Global Alcohol Policy Alliance, 2001.
Global school-based student health survey (GSHS). Geneva, World Health Organization, 2004b (http://www.who.int/school_youth_health/assessment/gshs/en/, accessed 15 June 2004).
Global Status Report on Alcohol. Geneva, World Health Organization, 1999.
Global Status Report: Alcohol and Young People. Geneva, World Health Organization, 2001a.
Global Status Report: Alcohol Policy. Geneva, World Health Organization, 2004c.
Gmel G, Rehm J. Harmful alcohol use. Alcohol Research and Health, 2003, 27(1):52-62.
Gmel G, Rehm J, Frick U. Trinkmuster, Pro-Kopf-Konsum von Alkohol und koronare Mortalität. Sucht, 2003, 49(2):95-104.
Gmel G, Rehm J, Kuntsche EN. Binge drinking in Europe: definitions, epidemiology, trends, and consequences. Sucht, 2003, 49(2):105-115.
Goldberg DM, Hahn SE, Parkes JG. Beyond alcohol: beverage consumption and cardiovascular mortality. Clinica Chimica Acta, 1995, 237:155-187.
Graham K et al. Current directions in research on understanding and preventing intoxicated aggression. Addiction, 1998, 93:659-676.
Graham K, Schmidt G. Alcohol use and psychosocial well-being among older adults. Journal of Studies on Alcohol, 1999, 60(3):345-351.

WHO Global Status Report on Alcohol 2004
74
Graham K, West P. Alcohol and crime. In: Heather N, Peters TJ, Stockwell T, eds. International handbook of alcohol dependence and problems. London, John Wiley & Sons, 2001:439-470.
Graham K, West P, Wells S. Evaluating theories of alcohol-related aggression using observations of young adults in bars. Addiction, 2000, 95:847-863.
Grant BF, Harford TC. Comorbidity between DSM-IV alcohol use disorders and major depression: Results of a national survey. Drug and Alcohol Dependence, 1995, 39(3):197-206.
Green M. Trading on inequality: gender and the drinks trade in Southern Tanzania. Africa, 1999, 69(3):404-425.
Greenfield TK. Individual risk of alcohol-related disease and problems. In: Heather N, Peters TJ, Stockwell T, eds. International Handbook of Alcohol Dependence and Problems - Part IV: Drinking Patterns and Types of Alcohol Problem. Chichester, John Wiley & Sons Ltd., 2001:413-438.
Gruenewald PJ, Mitchell PR, Treno AJ. Drinking and driving: drinking patterns and drinking problems. Addiction, 1996, 91:1649.
Gruenewald PJ, Nephew T. Drinking in California: theoretical and empirical analysis of alcohol consumption patterns. Addiction, 1994, 89:707-723.
Gruenewald PJ, Treno AJ, Mitchell PR. Drinking patterns and drinking behaviours: Theoretical models of risky acts. Contemporary Drug Problems, 1996, 23:407-440.
Gurr M. Alcohol: Health Issues Related to Alcohol Consumption. Brussels, ILSI Europe, 1996.
Gutjahr E, Gmel G. Die sozialen Kosten des Alkoholkonsum in der Schweiz: Epidemiologische Grundlagen 1995 - 1998. Forschungsbericht Nr. 36. Lausanne, Schweizerische Fachstelle für Alkohol- und andere Drogenprobleme (SFA), 2001.
Gutjahr E, Gmel G & Rehm J. Relation between average alcohol consumption and disease: an overview. European Addiction Research, 2001, 7(3):117-127.
Haard NF et al. Fermented cereals: a global perspective. Rome, Food and Agriculture Organization of the United Nations, 1999 (http://www.fao.org/docrep/x2184e/x2184e07.htm, accessed 27 March 2004).
Habbick BF et al. Mortality in foetal alcohol syndrome. Canadian Journal of Public Health, 1997, 88(3):181-183.
Haberman PW, Weinbaum DF. Liver cirrhosis with and without mention of alcohol as cause of death. British Journal of Addiction, 1990, 85(2):217-222.
Habgood R et al. Drinking in New Zealand: National Surveys Comparison 1995 and 2000. Wellington, New Zealand, Alcohol Advisory Council of New Zealand and the Health Research Council of New Zealand, 2001.
WHO Global Status Report on Alcohol 2004
75
Halasyamani MK, Davis MM, Bhattacharjee S. Spousal substance use and domestic violence reported by pregnant women in rural South India. Journal of General Internal Medicine, 1997, 12(Suppl. 1):127.
Hao W et al. Drinking and drinking patterns and health status in the general population of five areas of China. Alcohol and Alcoholism, 2004, 39(1):43-52.
Harnack LJ et al. Smoking, alcohol, coffee, and tea intake and incidence of cancer of the exocrine pancreas: the Iowa Women's Health Study. Cancer Epidemiology, Biomarkers and Prevention, 1997, 6(12):1081-1086.
Hart CL et al. Alcohol consumption and mortality from all causes, coronary heart disease, and stroke: results from a prospective cohort study of Scottish men with 21 years of follow up. British Medical Journal, 1999, 318:1725-1729.
Harwood H, Fountain D, Livermore G. The Economic Costs of Alcohol and Drug Abuse in the United States, 1992. Rockville, US Department of Health and Human Services, National Institute on Drug Abuse, 1998 (NIH Publication Number 98-4327). In: Klingemann H, Gmel G, eds. Mapping the Social Consequences of Alcohol Consumption. Dordrecht, Kluwer Academic Publishers, 2001.
Hayes RB et al. Alcohol use and prostate cancer risk in US blacks and whites. American Journal of Epidemiology, 1996, 143(7):692-697.
Hendriks HF et al. Effect of moderate dose of alcohol with evening meal on fibrinolytic factors. British Medical Journal, 1994, 308(6935):1003-1006.
Hiatt RA et al. Alcohol consumption, smoking, and other risk factors and prostate cancer in a large health plan cohort in California (United States). Cancer Causes and Control, 1994, 5(1):66-72.
Hilarski C, Wodarki JS. Comorbid substance abuse and mental illness: Diagnosis and treatment. Journal of Social Work Practice in the Addictions, 2001, 1(1):105-119.
Hillbom M. Alcohol consumption and stroke: benefits and risks. Alcoholism, Clinical and Experimental Research, 1998, 22(7):352S-358S.
Hillbom M, Juvela S, Karttunen V. Mechanisms of alcohol-related strokes. In: Chadwick DJ, Goode JA, eds. Alcohol and Cardiovascular Diseases. New York, John Wiley & Sons, Inc., 1998:193-207.
Hingson R, Howland J. Alcohol as a risk factor for injury or death resulting from accidental falls: A review of the literature. Journal of Studies on Alcohol, 1987, 48:212-219.
Hingson R, Howland J. Alcohol and non-traffic unintended injuries. Addiction, 1993, 88:877-883.
Holman CD et al. Meta-analysis of alcohol and all-cause mortality: A validation of NHMRC recommendations. Medical Journal of Australia, 1996, 164:141-145.
Horn-Ross PL, Ljung BM, Morrow M. Environmental factors and the risk of salivary gland cancer. Epidemiology, 1997, 8(4):414-419.
WHO Global Status Report on Alcohol 2004
76
Hughes K, Bellis MA. Alcohol: Some sobering statistics from the NWPHO. North West Public Health Ovservatory (NWPHO), 2000.
Hurst PM, Harte WJ, Firth WJ. The Grand Rapids dip revisited. Accident Analysis Prevention, 1994, 26:647-654.
Imhof A et al. Effect of alcohol consumption on systemic markers of inflammation. The Lancet, 2001, 357(9258):763-767.
International Guide for Monitoring Alcohol Consumption and Related Harm. Geneva, World Health Organization, 2000a.
Jackson R. Cardiovascular disease and alcohol consumption: evidence of benefits from epidemiologic studies. Contemporary Drug Problems, 1994, 21(1):5-24.
Jacques PF et al. Determinants of plasma total homocysteine concentration in the Framingham Offspring cohort. American Journal of Clinical Nutrition, 2001, 73:613-621.
Jallon P et al. Crises épileptiques, épilepsies et facteurs de risque: expérience d'une enquête en Martinique. Revue Neurologique, 1998, 154(5):408-411.
Jewkes R, Levin J, Penn-Kekana L. Risk factors for domestic violence: Findings from a South African cross-sectional study. Social Science and Medicine, 2002, 55(9):1603-1617.
Jhingan HP et al. Prevalence of alcohol dependence in a town in Nepal as assessed by the CAGE questionnaire. Addiction, 2003, 98(3):339-343.
Ji BT et al. The influence of cigarette smoking, alcohol, and green tea consumption on the risk of carcinoma of the cardia and distal stomach in Shanghai, China. Cancer, 1996, 77(12):2449-2457.
Kao WHL et al. Gender differences in the association of alcohol consumption and the risk of type 2 diabetes mellitus: the Atherosclerosis Risk in Communities (ARIC) study. American Journal of Epidemiology, 1998, 147(11):S60.
Kauhanen J et al. Frequent hangovers and cardiovascular mortality in middle-aged men. Epidemiology, 1997a, 8(3):310-314.
Kauhanen J et al. Beer binging and mortality: results from the Kuopio ischemic heart disease risk factor study: a prospective population based study. British Medical Journal, 1997b, 315(7112):846-851.
Keil U et al. The relation of alcohol intake to coronary heart disease and all-cause mortality in a beer-drinking population. Epidemiology, 1997, 8(2):150-156.
Kessler RC et al. Lifetime co-occurrence of DSM-III-R alcohol abuse and dependence with other psychiatric disorders in the National Comorbidity Survey. Archives of General Psychiatry, 1997, 54(5):313-321.
Kessler RC et al. Epidemiology of co-occuring addictive and mental disorders: Implications for prevention and service utilization. American Journal of Orthopsychiatry, 1996, 66(1):17-31.
WHO Global Status Report on Alcohol 2004
77
Kiechl S et al. Insulin sensitivity and regular alcohol consumption: large, prospective, cross sectional population study (Bruneck study). British Medical Journal, 1996, 313:1040-1044.
Kitamura A et al. Alcohol intake and premature coronary heart disease in urban Japanese men. American Journal of Epidemiology, 1998, 147(1):59-65.
Klatsky AL. Cardiovascular effects of alcohol. Scientific American Science and Medicine, 1995, 2(2):28-337.
Klingemann H, Gmel G, eds. Mapping the Social Consequences of Alcohol Consumption. Dordrecht, Kluwer Academic Publishers, 2001.
Knuiman MW, Vu HT. Risk factors for stroke mortality in men and women: The Busselton Study. Journal of Cardiovascular Risk, 1996, 3(5):447-452.
Koenig MA et al. Domestic violence in rural Uganda: Evidence from a community-based study. Bulletin of the World Health Organization, 2003, 81(1):53-60.
Kohlmeier L, Mendez M. Controversies surrounding diet and breast cancer. Proceedings of the Nutrition Society, 1997, 56(1B):369-382.
Kozarevic D et al. Drinking habits and coronary heart disease: the Yugoslavia Cardiovascular Disease Study. American Journal of Epidemiology, 1982, 116(5):748-758.
Krüger HP et al. Effects of low alcohol dosage: a review of the literature. In: Krüger HP et al., eds. Alcohol, Drugs and Trafic Safety - T'92. Cologne, Verlag TÜV Rheinland, 1993:763-778.
Larkby C, Day N. The effects of prenatal alcohol exposure. Alcohol Health and Research World, 1997, 21(3):192-198.
Larroque B, Kaminski M. Alcohol consumption during pregnancy and infant birth weight. Annals of Epidemiology, 1996, 6(2):169-170.
Lazarus R, Sparrow D, Weiss ST. Alcohol intake and insulin levels. The Normative Aging Study. American Journal of Epidemiology, 1997, 145:909-916.
Leifman H. Estimations of unrecorded alcohl consumption levels and trends in 14 European countries. Nordic Studies on Alcohol and Drugs, 2001, 18(English Supplement):54-69.
Leifman H, Österberg E, Ramstedt M. Alcohol in Postwar Europe, ECAS II: A discussion of indicators and alcohol-related harm. Stockholm, Almquist and Wiksell International, 2002.
Leitzmann MF et al. Alcohol intake and the risk of symptomatic gallstones in men. American Journal of Epidemiology, 1998, 147(11):S54.
Lelbach WK. Cirrhosis in the alcoholic and its relation to the volume of alcohol abuse. Annals of the New York Academy of Sciences, 1975, 252:85-105.
Lelbach WK. Epidemiology of liver disease. In: Popper H, Schaffner F, eds. Progress in Liver Diseases. New York, Grune & Stratton, 1976:494-515.
WHO Global Status Report on Alcohol 2004
78
Leon DA et al. Huge variation in Russian mortality rates 1984-94: artefact, alcohol, or what? The Lancet, 1997, 350:383-388.
Leone M et al. Alcohol use is a risk factor for a first generalized tonic clonic seizure. Neurology, 1997, 48:614-620.
Li G et al. Alcohol and injury severity: Reappraisal of the continuing controversy. Journal of Trauma, 1997, 42:562-569.
Logminiene Z et al. Avoidable mortality in Lithuania: 1991-1999 compared with 1970-1990. Public Health, 2004, 118(3):201-210.
Longnecker MP, Enger SM. Epidemiologic data on alcoholic beverage consumption and risk of cancer. Clinical Chimica Acta, 1996, 246(1-2):121-141.
Lundberg JC, Passik SD. Alcohol and cancer: a review for psycho-oncologists. Psychooncology, 1997, 6(4):253-266.
Lynskey MT. The comorbidity of alcohol dependence and affective disorders: treatment implications. Drug and Alcohol Dependence, 1998, 52(3):201-209.
Maffli E, Zumbrunn A. Alcohol and domestic violence in a sample of incidents reported to the police of Zurich City. Substance Use and Misuse, 2003, 38(7):881-893.
Mangione TW et al. Employee drinking practices and work performance. Journal of Studies on Alcohol, 1999, 60(2):261-270.
Markou A, Kosten TR, Koob GF. Neurobiological similarities in depression and drug dependence: A self-medication hypothesis. Neuropsychopharmacology, 1998, 18(3):135-174.
Martín R et al. Etiological and prognostic factors in the late onset epilepsy. Revista de Neurologia, 1995, 23(120):285-289.
Martin SE. Epidemiology of alcohol-related interpersonal violence. Alcohol Health & Research World, 1992, 16(3):230-237.
Martin SE, Bachman R. The relationship of alcohol to injury in assault cases. In: Galanter M, ed. Recent developments in alcoholism, Vol. 13, Alcohol and Violence. New York, Plenum Press, 1997:45-56.
Maskarinec G, Meng L, Kolonel LN. Alcohol intake, body weight, and mortality in a multiethnic prospective cohort. Epidemiology, 1998, 9(6):654-661.
Mattson SN et al. Heavy prenatal alcohol exposure with or without physical features of fetal alcohol syndrome leads to IQ deficits. Journal of Pediatrics, 1997, 131(5):718-721.
McClelland DC et al. The drinking man. Alcohol and human motivation. Toronto, Canada, Collier-Macmillan, 1972.
McElduff P, Dobson AJ. How much alcohol and how often? Population based case-control study of alcohol consumption and risk of a major coronary event. British Medical Journal, 1997, 314:1159.

WHO Global Status Report on Alcohol 2004
79
McKee M, Britton A. The positive relationship between alcohol and heart disease in eastern Europe: Potential physiological mechanisms. Journal of the Royal Society of Medicine, 1998, 91:402-407.
McKee M, Shkolnikov V, Leon DA. Alcohol is Implicated in the Fluctuations in Cardiovascular Disease in Russia Since the 1980s. Annals of Epidemiology, 2001, 11(1):1-6.
McKenzie CR, Eisenberg PR. Alcohol, coagulation, and arterial thrombosis. In: Zakhari S, Wassef M, eds. Alcohol and the Cardiovasular System. Bethesda, National Institutes of Health, National Institute on Alcohol Abuse and Alcoholism, 1996:413-439.
McKibben M. Pop fiction? The truth about alcopops. London, Alcohol Concern, 1996. In: McKeganey N. Alcopops and young people: a suitable cause for concern. Addiction, 1998, 93(4):471-473.
Mehrabian A. General relations among drug use, alcohol use, and major indexes of psychopathology. Journal of Psychology, 2001, 135(1):71-86.
Merikangas KR et al. Comorbidity of substance use disorders with mood and anxiety disorders: Results of the International Consortium in Psychiatric Epidemiology. Addictive Behaviors: An International Journal, 1998, 23(6):893-907.
Midanik LT, Room R. Epidemiology of alcohol consumption. Alcohol Health and Research World, 1992, 16(3):183-190.
Ministry of Health and Social Affairs. 2001 National Household Health Interview Survey. The Republic of Korea Ministry of Health and Social Affairs, 2002.
Mohan D et al. Alcohol consumption in India: a cross-sectional study. In: Demers A, Room R & Bourgault C. Surveys of drinking patterns and problems in seven developing countries. Geneva, World Health Organization, 2001.
Molamu L, MacDonald D. Alcohol abuse among the Basarwa of the Kgalagadi and Ghanzi Districts in Botswana. Drugs: Education, Prevention and Policy, 1996, 3(2):145-152.
Morrow DA, Ridker PM. C-reactive protein, inflammation, and coronary risk. Medical Clinics of North America, 2000, 84(1):149-161.
Moskowitz H, Robinson C. Effects of low doses of alcohol on driving-related skills: A review of the evidence. Washington, DC, National Highway Traffic Safety Administration, 1988.
Mphi M. Female alcoholism problems in Lesotho. Addiction, 1994, 89(8):945–949.
Mullahy J, Sindelar JL. Employment, unemployment, and problem drinking. Journal of Health Economics, 1996, 15(4):409-434.
Murdoch DD, Pihl RO, Ross D. Alcohol and crimes of violence: Present issues. International Journal of the Addictions, 1990, 25:1065-1081.
Mureithi K. Kenya's love of 'poison'. BBC News Africa Live, 27 August 2002.
WHO Global Status Report on Alcohol 2004
80
Murray CJL, Lopez A. The Global Burden of Disease. London, Oxford University Press, 1996a
Murray CJL, Lopez A. The Global Burden of Disease: A Comprehensive Assessment of Mortality and Disability from Diseases, Injuries and Risk Factors in 1990 and Projected to 2020. Boston, Harvard School of Public Health on behalf of the World Health Organization and the World Bank, 1996b.
Murray RP et al. Alcohol volume, drinking pattern, and cardiovascular disease morbidity and mortality: is there a U-shaped function? American Journal of Epidemiology, 2002, 155(3):242-248.
Muscat JE, Wynder EL. A case/control study of risk factors for major salivary gland cancer. Otolaryngology and Head and Neck Surgery, 1998, 118(2):195-198.
Mustonen H, Beukes L, Du Preez V. Alcohol drinking in Namibia. In: Demers A, Room R, Bourgault C. Surveys of drinking patterns and problems in seven developing countries. Geneva, World Health Organization, 2001.
Mustonen H, Paakkaned P, Simpura J. Drinking habits among the employed and unemployed. Nordic Alcohol Studies, 1994, 11(English Suppl.):21-34.
Mwesigye PK, Okurut TO. A survey of the production and consumption of traditional alcoholic beverages in Uganda. Process Biochemistry, 1995, 30(6):497-501.
Nasca PC et al. Alcohol consumption and breast cancer: estrogen receptor status and histology. American Journal of Epidemiology, 1994, 140(11):980-988.
Newcomb PA, Trentham-Dietz A, Storer BE. Alcohol consumption in relation to endometrial cancer risk. Cancer Epidemiology, Biomarkers and Prevention, 1997, 6(10):775-778.
Nikander P et al. Ingredients and contaminants of traditional alcoholic beverages in Tanzania. Transactions of the Royal Society of Tropical Medicine and Hygiene, 1991, 85(1):133-135.
Notzon FC et al. Causes of declining life expectancy in Russia. Journal of the American Medical Association, 1998, 279:793-800.
Obot IS. The measurement of drinking patterns and alcohol problems in Nigeria. Journal of Substance Abuse, 2000, 12(1-2):169-181.
Pan American Health Organization (PAHO). Epidemiologic report on the use and abuse of psychoactive substances in 16 countries of Latin America and the Caribbean. Bulletin of PAHO, 1990, 24(1):97-139.
Parazzini F et al. Alcohol and endometrial cancer risk: findings from an Italian case-control study. Nutrition and Cancer, 1995, 23(1):55-62.
Passaro KT, Little RE. Childbearing and alcohol use. In: Wilsnack Rw & Wilsnack Sc, eds. Gender and Alcohol: Individual and Social Perspectives. New Brunswick, Rutgers Center of Alcohol Studies, 1997:90-113.
WHO Global Status Report on Alcohol 2004
81
Passaro KT et al.The effect of maternal drinking before conception and in early pregnancy on infant birthweight. The ALSPAC Study Team (Avon Longitudinal Study of Pregnancy and Childhood). Epidemiology, 1996, 7(4):377-383.
Penick EC et al. The stability of coexisting psychiatric syndromes in alcoholic men after one year. Journal of Studies on Alcohol, 1988, 49:395-405.
Pernanen K. What is meant by "alcohol-related" consequences? In: Klingemann H, Gmel G, eds. Mapping the Social Consequences of Alcohol Consumption. Dordrecht, Kluwer Academic Publishers, 2001:21-31.
Perry IJ et al. Prospective study of risk factors for development of non-insulin dependent diabetes in middle aged British men. British Medical Journal, 1995, 310(6979):560-564.
Peterson JB et al. Acute alcohol intoxication and neuropsychological functioning. Journal of Studies on Alcohol, 1990, 51:114-122.
Pettinati H, Sugerman A, Maurer HS. Four-year MMPI changes in abstinent and drinking alcoholics. Alcoholism, Clinical and Experimental Research, 1982, 6:487-494.
Piette JD, Barnett PG, Moos RH. First-time admissions with alcohol-related medical problems: a 10-year follow-up of a national sample of alcoholic patients. Journal of Studies on Alcohol, 1998, 59(1):89-96.
Pihl RO, Peterson J, Lau M. A biosocial model of the alcohol-aggression relationship. Journal of Studies on Alcohol, 1993, 11(Suppl.):128-139.
Plant M, Miller P. Young people and alcohol: an international insight. Alcohol and Alcoholism, 2001, 36(6):513-515.
Poikolainen K. Inebriation and mortality. International Journal of Epidemiology, 1983, 12(2):151-155.
Polygenis D et al. Moderate alcohol consumption during pregnancy and the incidence of fetal malformations: a meta-analysis. Neurotoxicology and Teratology, 1998, 20(1):61-67.
Prime Minister's Strategy Unit. Interim Analytical Report. London, Stationary Office, 2003 (http://www.pm.gov.uk/output/page4498.asp, accessed 8 March 2004)
Puddey IB et al. Influence of pattern of drinking on cardiovascular disease and cardiovascular risk factors - A review. Addiction, 1999, 94(5):649-663.
Puffer R, Griffith GW. Patterns of Urban Mortality. Report No. 151. Washington, DC, Pan American Health Organization (PAHO), 1967.
Putnam SD et al. Alcohol consumption and prostate cancer in a cohort of Iowa males. American Journal of Epidemiology, 1998, 147(11):42.
Ramchandani VA, Kwo PY, Li TK. Effect of food and food composition on alcohol elimination rates in healthy men and women. Journal of Clinical Pharmacology, 2001, 41:1345-1350.
WHO Global Status Report on Alcohol 2004
82
Ramstedt M, Hope A. The Irish Drinking Culture: Drinking and Drinking-Related Harm, a European Comparison. Dublin, Department of Health and Children, 2003.
Rankin J. Biological mechanisms at moderate levels of alcohol consumption that may affect coronary heart disease. Contemporary Drug Problems, 1994, 21:45-57.
Reeder VC et al. Alcohol and the fibrinolytic system. In: Zakhari S & Wassef M, eds. Alcohol and the Cardiovascular System. Bethesda, National Institutes of Health, National Institute on Alcohol Abuse and Alcoholism, 1996:391-411.
Rehm J et al. On the emerging paradigm of drinking patterns and their social and health consequences. Addiction, 1996, 91(11):1615-1621.
Rehm J et al. Alcohol consumption and coronary heart disease morbidity and mortality. American Journal of Epidemiology, 1997, 146:495-501.
Rehm J, Eschmann S. Global monitoring of average volume of alcohol consumption. Sozial- und Präventivmedizin, 2002, 47(1):48-58.
Rehm J, Gmel G, eds. Alcohol per capita consumption, patterns of drinking and abstention worldwide after 1995. Appendix 2. European Addiction Research, 2001, 7(3):155-157.
Rehm J et al. Alcohol-related morbidity and mortality. Alcohol Research and Health, 2003a, 27(1):39-51.
Rehm J et al. The global distribution of average volume of alcohol consumption and patterns of drinking. European Addiction Research, 2003b, 9:147-156.
Rehm J et al. The relationship of average volume of alcohol consumption and patterns of drinking to burden of disease: an overview. Addiction, 2003c, 98:1209-1228.
Rehm J et al. Alcohol. In: Ezzati M et al., eds. Comparative Quantification of Health Risks: Global and Regional Burden of Disease Due to Selected Major Risk Factors. Geneva, World Health Organisation, in press.
Rehm J et al. Alcohol as risk factor for global burden of disease. European Addiction Research, 2003d, 9:157-164.
Reinke LA, McCay PB. Interaction between alcohol and antioxidants. In: Zakhari S, Wassef M, eds. Alcohol and the Cardiovascular System. Bethesda, National Institutes of Health, National Institute on Alcohol Abuse and Alcoholism, 1996.
Renaud SC, Ruf JC. Effects of alcohol on platelet function. Clinica Chimica Acta, 1996, 246:77-89.
Rhodés J, Salaspuro M, Sorensen TIA. Alcohol and liver diseases. In: Verschuren PM, ed. Health Issues Related to Alcohol Consumption. Washington, D.C., International Life Sciences Institute/ILSI Press, 1993:167-220.
Ridker PM. Role of inflammatory biomarkers in prediction of coronary heart disease. The Lancet, 2001, 358(9286):946-948.
WHO Global Status Report on Alcohol 2004
83
Ridolfo B, Stevenson CE. The Quantification of Drug-Caused Mortality and Morbidity in Australia 1998. Canberra, Australian Institute of Health and Welfare, 2001.
Riley L, Marshall M, eds. Alcohol and public health in 8 developing countries. Geneva, World Health Organization, 1999.
Rimm EB et al. Prospective study of cigarette smoking, alcohol use, and the risk of diabetes in men. British Medical Journal, 1995, 310(6979):555-559.
Robles-Diaz G, Gorelick FS. Alcohol and acute pancreatitis. Yale Journal of Biology and Medicine, 1997, 70(1):77-87.
Rodgers B et al. Non-linear relationships in associations of depression and anxiety with alcohol use. Psychological Medicine, 2000, 30(2):421-432.
Roebuck TM, Mattson SN, Riley EP. A review of the neuroanatomical findings in children with fetal alcohol syndrome or prenatal exposure to alcohol. Alcoholism, Clinical and Experimental Research, 1998, 22(2):339-344.
Room R. Alcohol-related urban mortality: a cross-national study. Drinking and Drug Practices Surveyor, 1972, 5:11-13.
Room R. Drinking patterns and alcohol-related social problems: Frameworks for analysis in developing societies. Drug and Alcohol Review, 1998, 17:389-398.
Room R et al. Alcohol in Developing Societies: A Public Health Approach. Helsinki, Finnish Foundation for Alcohol Studies in collaboration with World Health Organization, 2002.
Room R, Mäkelä K. Typologies of the cultural position of drinking. Journal of Studies on Alcohol, 2000, 61(3):475-483.
Room R, Rossow I. The share of violence attributable to drinking. Journal of Substance Use, 2001, 6:218-228.
Rosenberg L, Metzger LS, Palmer JR. Alcohol consumption and risk of breast cancer: a review of the epidemiologic evidence. Epidemiologic Reviews, 1993, 15(1):133-144.
Rosenqvist M. Alcohol and cardiac arrhythmias. Alcoholism, Clinical and Experimental Research, 1998, 22(7 Suppl.):318S-322S.
Rosovsky H et al. Al-anon groups in Mexico. Contemporary Drug Problems, 1992, 19:587-603. In: Room R et al. Alcohol in Developing Societies: A Public Health Approach. Helsinki, Finnish Foundation for Alcohol Studies in collaboration with World Health Organization, 2002.
Rossow I, Pernanen K, Rehm J. Accidents, suicide and violence. In: Klingemann H, Gmel G, eds. Mapping the Social Consequences of Alcohol Consumption. Dordrecht, Kluwer Academic Publishers, 2001:93-112.
Royo-Bordonada MA et al. Alcohol intake and risk of breast cancer: the euramic study. Neoplasma, 1997, 44(3):150-156.

WHO Global Status Report on Alcohol 2004
84
Rubin R. Effect of ethanol on platelet function. Alcoholism, Clinical and Experimental Research, 1999, 23:1114-1118.
Rusmidler i Norge [Alcohol and drugs in Norway]. Statens institutt for rusmiddelfoskning (SIRUS) [Norwegian Institute for Alcohol and Drug Research], 2003.
Sacco RL et al. The protective effect of moderate alcohol consumption on ischemic stroke. Journal of the American Medical Association, 1999, 281(1):53-60.
Sarles H, Bernard JP, Johnson CD. Alcohol and the pancreas. In: Peters TJ, ed. Alcohol Misuse: A European Perspective. Amsterdam, Harwood Academic Publishers, 1996:145-161.
Saxena S, Sharma R, Maulik PK. Impact of alcohol use on poor families: A study from North India. Journal of Substance Use, 2003, 8(2):78-84.
Sayette MA, Wilson T, Elias MJ. Alcohol and aggression: A social information processing analysis. Journal of Studies on Alcohol, 1993, 54:399-407.
Schatzkin A, Longnecker MP. Alcohol and breast cancer. Where are we now and where do we go from here? Cancer, 1994, 74(3 Suppl.):1101-1110.
Schuckit MA. Alcohol, anxiety, and depressive disorders. Alcohol Health & Research World, 1996, 20(2):81-85.
Schuckit MA et al. The life-time rates of three major mood disorders and four major anxiety disorders in alcoholics and controls. Addiction, 1997, 92(10):1289-1304.
Seale JP et al. Prevalence of problem drinking in a Venezuelan Native American population. Alcohol and Alcoholism, 2002, 37(2):198-204.
Sefa-Dedeh S. Yeasts in the traditional brewing of pito in Ghana. World Journal of Microbiology and Biochemistry, 1999, 15(5):593-597.
Seitz HK, Poschl G, Simanowski UA. Alcohol and cancer. Recent Developments in Alcoholism, 1998, 14:67-95.
Seitz HK et al. Cell proliferation and its evaluation in the colorectal mucosa: effect of ethanol. Zeitschrift für Gastroenterologie, 1998, 36(8):645-655.
Selinus R. The traditional foods of the Central Ethiopian highlands (research report No. 7). Scandinavian Institute of African Studies (http://ethnomed.org/ethnomed/cultures/ethiop/ethiop_foods.html, accessed 29 March 2004).
Shkolnikov V, McKee M, Leon DA. Changes in live expectancy in Russia in the mid-1990s. The Lancet, 2001, 357:917-921.
Shkolnikov VM, Nemtsov A. The anti-alcohol campaign and variations in Russian mortality. In: Bobadilla J, Costello C,Mitchell F, eds. Premature Death in the New Independent States. Washington DC, National Academy Press, 1997:239-261.
Shu I et al. Alcohol use and mortality from coronary heart disease: the role of high density lipoprotein cholesterol. Annals of Internal Medicine, 1992, 116(11):881-887.
WHO Global Status Report on Alcohol 2004
85
Shu XO et al. Maternal smoking, alcohol drinking, caffeine consumption, and fetal growth: results from a prospective study. Epidemiology, 1995, 6(2):115-120.
Single E et al. International guidelines on estimating the costs of substance abuse. Ottawa, Canadian Centre on Substance Abuse, 1996.
Single E et al. Morbidity and mortality attributable to alcohol, tobacco, and illicit drug use in Canada. American Journal of Public Health, 1999, 89(3):385-390.
Single E et al. International guidelines for estimating the costs of substance abuse. Geneva, World Health Organization, 2003.
Skinazi F, Lévy P, Bernades P. Les pancréatites aiguës alcooliques révèlent-elles toujours une pancréatite chronique? Gastroentérologie Clinique et Biologique, 1995, 19:266-269.
Smith-Warner SA et al. Alcohol and breast cancer in women: a pooled analysis of cohort studies. Journal of the American Medical Association, 1998, 279(7):535-540.
Soler M et al. Diet, alcohol, coffee and pancreatic cancer: final results from an Italian study. European Journal of Cancer Prevention, 1998, 7(6):455-460.
Stallones L, Xiang H. Alcohol consumption patterns and work-related injuries among Colorado farm residents. American Journal of Preventive Medicine, 2003, 25(1):25-30.
Steele CM, Josephs RA. Alcohol myopia: It's prized and dangerous effects. American Psychologist, 1990, 45:921-933.
Stinson FS et al. Alcohol-related mortality in the United States, 1979-1989. Alcohol Health and Research World, 1993, 17(3):251-260.
Subata E. Drug and alcohol abuse as a social phenomenon. In: Lithuanian Human Development Report 1999. United Nations Development Program, 1999.
Surveys of drinking patterns and problems in seven developing countries. Geneva, World Health Organization, 2001b.
Svärdsudd K. Moderate alcohol consumption and cardiovascular disease: is there evidence for a preventivee effect? Alcoholism, Clinical and Experimental Research, 1998, 22(7):307S-314S.
Swanson CA et al. Alcohol consumption and breast cancer risk among women under age 45 years. Epidemiology, 1997, 8(3):231-237.
Swendsen JD et al. Comorbidity of alcoholism with anxiety and depressive disorders in four geographic communities. Comprehensive Psychiatry, 1998, 39(4):176-184.
Tavani A et al. Alcohol consumption and risk of prostate cancer. Nutrition and Cancer, 1994, 21(1):24-31. The Schumacher Centre for Technology & Development. Toddy and palm wine – fermented plant saps. Technical Brief, Knowledge and Information Services

WHO Global Status Report on Alcohol 2004
86
(http://www.itdg.org/html/technical_enquiries/docs/toddy_palm_wine.pdf, accessed 27 March 2004).
The World Health Report 2000 - Health Systems: Improving Performance. Geneva, World Health Organization, 2000b.
The World Health Report: 2001 - Mental health: New understanding, new hope. Geneva, World Health Organization, 2001c.
The World Health Report 2002 - Reducing Risks, Promoting Healthy Life. Geneva, World Health Organization, 2002.
Thun JM et al. Alcohol consumption and mortality among middle-aged and elderly U.S. adults. New England Journal of Medicine, 1997, 337(24):1705-1714.
Tomsen SA. A top night out - social protest, masculinity and the culture of drinking violence. British Journal of Criminology, 1997, 37:990-1002.
Trapenciere I. Statistics on alcohol, drugs and crime in Latvia. In: Leifman H & Edgren-Henrichson N, eds. Statistics on alcohol, drugs and crime in the Baltic Sea regions. Helsinki, Nordic Council for Alcohol and Drug Research (NAD), 2000.
Treno AJ, Gruenewald PJ, Ponicki WR. The contribution of drinking patterns to the relative risk of injury in six communities: A self-report based probability approach. Journal of Studies on Alcohol, 1997, 58:372-381.
Treno AJ, Holder HD. Measurement of alcohol-involved injury in community prevention: the search for a surrogate III. Alcoholism: Clinical and Experimental Research, 1997, 21:1695-1703.
Trevisan M et al. Alcohol drinking patterns and myocardial infarction. American Journal of Epidemiology, 2001a, 153(11):S97.
Trevisan M et al. Drinking pattern and mortality: the Italian Risk Factor and Life Expectancy pooling project. Annals of Epidemiology, 2001b, 11(5):312-319.
Trolldal B. Alcohol sales figures in 15 European countries: Corrected for consumption abroad and tax-free purchases. Nordisk Alkohol- & Narkotikatidskrift (English supplement), 18(Suppl.):71-81, 2001.
Trucco M et al. Recent alcohol and drug consumption in victims of work-related accidents. Revista Medica de Chile, 1998, 126(10):1262-1267.
Tuesca R, Borda M. Violencia física marital en Barranquilla (Colombia): prevalencia y factores de riesgo [Marital violence in Barranquilla (Colombia): prevalence and risk factors]. Gaceta Sanitaria, 2003, 17(4):302-308.
US Department of Health and Human Services. Ninth Special Report to the U.S. Congress on Alcohol and Health from the Secretary of Health and Human Services, Vol. No. 97-4017. Rockville, MD, U.S. Department of Health and Human Services, Public Heath Service, National Institute of Health (NIH), National Institute on Alcohol Abuse and Alcoholism (NIAAA), 1997.
WHO Global Status Report on Alcohol 2004
87
US Department of Health and Human Services. Tenth Special Report to the U.S. Congress on Alcohol and Health: Highlights from the Current Research, Vol. No. 97-4017, NIH Publications No. 00-1583. Rockville, MD, US Department of Health and Human Services, Public Health Service, National Institutes of Health (NIH), National Institute on Alcohol Abuse and Alcoholism (NIAAA), 2000.
Ustun TB et al. The World Health Surveys. In: Murray CJL, Evans D, eds. Health systems performance assessment: Debates, methods and empiricism. Geneva, World Health Organization, 2003.
Vaillant GE. Is alcoholism more often the cause or the result of depression? Harvard Review of Psychiatry, 1993, 1(2):94-99.
van den Brandt PA, Goldbohm RA, van 't Veer P. Alcohol and breast cancer: results from The Netherlands Cohort Study. American Journal of Epidemiology, 1995, 141(10):907-915.
Veenstra J et al. Effects of moderate dose of alcohol on blood lipids and lipoproteins postprandially and in the fasting state. Alcohol, 1990, 25:371-377.
Wannamethee G, Shaper AG. Alcohol intake and variations in blood pressure by day of examination. Journal of Human Hypertension, 1991, 5(2):59-67.
Wannamethee SG, Shaper AG. Alcohol and sudden cardiac death. British Heart Journal, 1992, 68(5):443-448.
Wannamethee SG, Shaper AG. Patterns of alcohol intake and risk of stroke in middle-aged British men. Stroke, 1996, 27:1033-1039.
Washburne C. Alcohol, self and the group. Quarterly Journal of Studies on Alcohol, 1956, 12:108-123.
Webb GR et al. The relationships between high-risk and problem drinking and the occurrence of work injuries and related absences. Journal of Studies on Alcohol, 1994, 55(4):434-446.
Wei M et al. Alcohol intake and incidence of type 2 diabetes in men. Diabetes Care, 2000, 23(1):18-22.
White HR, Chen P. Problem drinking and intimate partner violence. Journal of Studies on Alcohol, 2002, 63(2):205-214.
Willenbring ML. Measurement of depression in alcoholics. Journal of Studies on Alcohol, 1986, 49:412-417.
Willich SN et al. Weekly variation of acute myocardial infarction. Increased Monday risk in the working population. Circulation, 1994, 90(1):87-93.
Windham GC et al. The association of moderate maternal and paternal alcohol consumption with birthweight and gestational age. Epidemiology, 1995, 6(6):591-597.
Windham GC et al. Moderate maternal alcohol consumption and risk of spontaneous abortion. Epidemiology, 1997, 8(5):509-514.
WHO Global Status Report on Alcohol 2004
88
Wingo PA et al. Alcohol consumption and the risk of fatal breast cancer in a prospective cohort of United States women. American Journal of Epidemiology, 1997, 145(11):28.
Wood D et al. Prevention of coronary heart disease in clinical practice. Summary of recommendations of the Second Joint Task Force of European and other Societies on Coronary Prevention. Blood Pressure, 1998, 7(5-6):262-269.
You RX et al. Risk factors for stroke due to cerebral infarction in young adults. Stroke, 1997, 28(10):1913-1918.
Young people's health in context. Geneva, World Health Organization, 2004d, (http://www.euro.who.int/eprise/main/who/informationsources/publications/catalogue/20040518_1, accessed 15 June 2004).
Yu Y et al. Risk factors for bladder cancer: a case-control study in northeast China. European Journal of Cancer Prevention, 1997, 6(4):363-369.
Yuan J-M et al. Follow-up study of moderate alcohol intake and mortality among middle-aged men in Shanghai, China. British Medical Journal, 1997, 314:18-23.
Zakhari S. Alcohol and the cardiovascular system: molecular mechanisms for beneficial and harmful action. Alcohol Health and Research World, 1997, 21:21-29.


