Photo Credit: Water for People Global Sustainability Report Addendum 2020 Data and Disclosures Assurance Governance Materiality ESG Disclosure for investors GRI Index Data Tables Awards Memberships
More details on our governance and corporate policies can be found on our website. Kimberly-Clark’s annual proxy statement also contains detailed information on our Board and committee structure.
Our Board has established and approved the framework for
our sustainability-related policies and procedures, including
environmental stewardship, energy and climate, fiber sourcing,
waste and water management, product safety, charitable
contributions, human rights, labor, and inclusion and diversity
in employment. As part of their oversight roles, the Board
and the Nominating and Corporate Governance Committee
receive regular reports from management on these topics, our
goals, and our progress toward achieving them.
Our Board oversees risk management, including risks related
to environmental and social issues. The Board is focused
on our long-term business strategy, including fostering
sustainability-driven innovations, and incorporates our
sustainability risks and opportunities into its overall strategic
decision-making process.
As a signatory to the United Nations Global Compact, we
are committed to upholding the Compact’s 10 Principles (per
UNGC) on human rights, labor standards, the environment,
and anti-corruption, working within our sphere of influence to
Sustainability Governance Kimberly-Clark’s sustainability program is overseen
by our Sustainability Executive Steering Committee,
which is comprised of members of the Executive
Leadership Team.
The committee meets quarterly to review and adjust the program’s direction, clear away barriers to success, and ensure the health of our long-term strategy.
We also receive guidance and direction from our
Sustainability Advisory Board (SAB), which provides
independent views on our sustainability program
and insights into potential business risks and
opportunities. SAB members are external thought
leaders who bring diverse experience and expertise
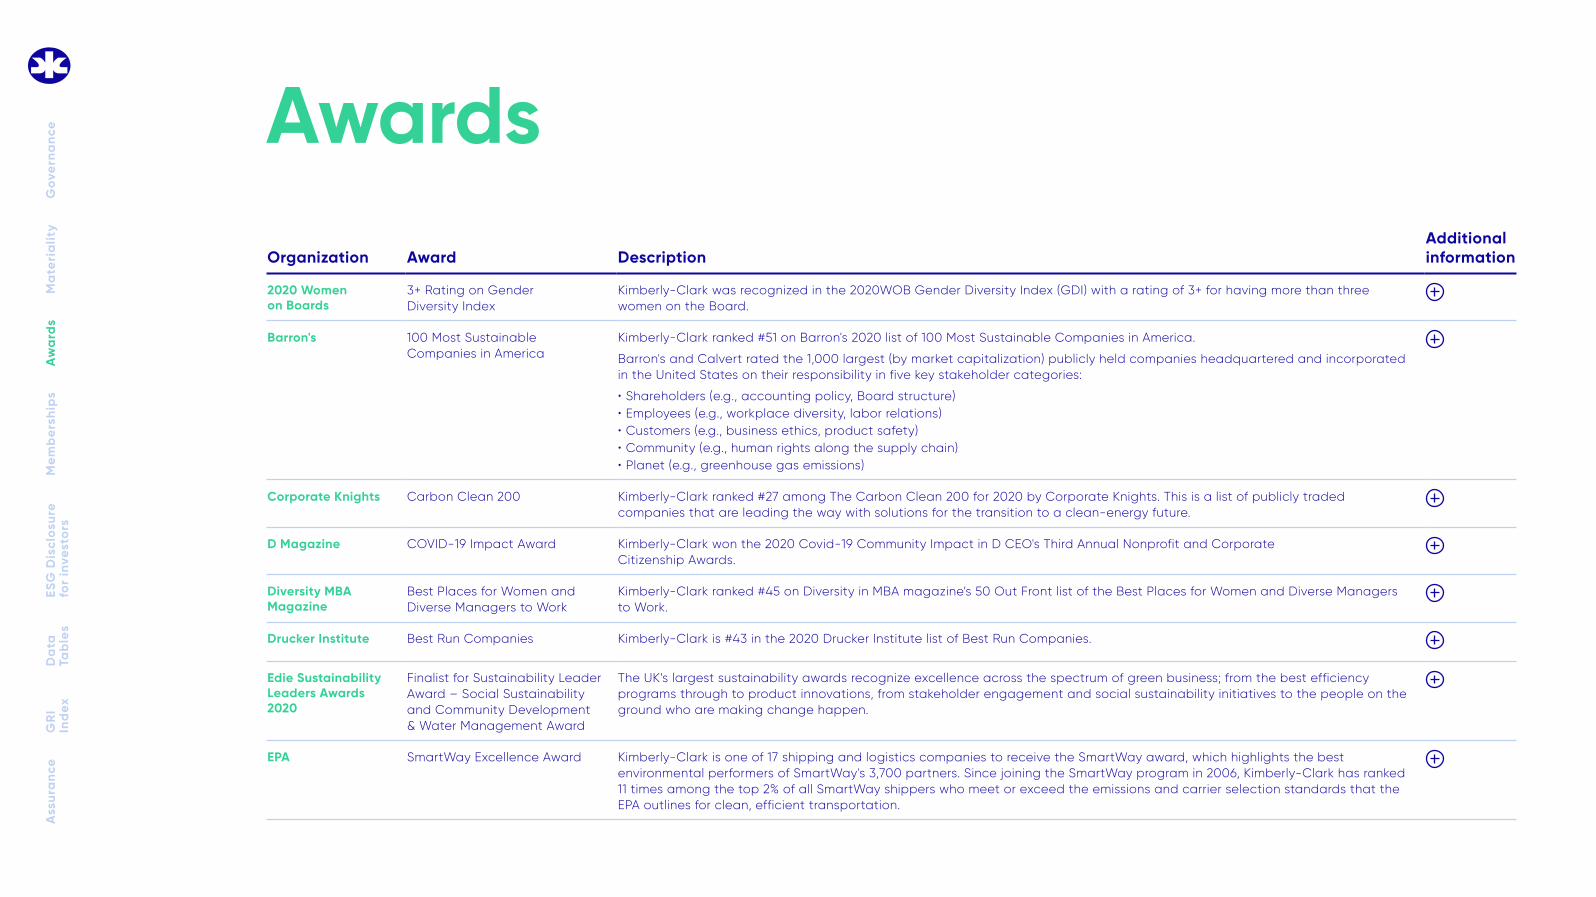
Organization Award DescriptionAdditional information
2020 Women on Boards
3+ Rating on Gender Diversity Index
Kimberly-Clark was recognized in the 2020WOB Gender Diversity Index (GDI) with a rating of 3+ for having more than three women on the Board.
Barron's 100 Most Sustainable Companies in America
Kimberly-Clark ranked #51 on Barron's 2020 list of 100 Most Sustainable Companies in America.
Barron's and Calvert rated the 1,000 largest (by market capitalization) publicly held companies headquartered and incorporated in the United States on their responsibility in five key stakeholder categories:
• Shareholders (e.g., accounting policy, Board structure)• Employees (e.g., workplace diversity, labor relations)• Customers (e.g., business ethics, product safety)• Community (e.g., human rights along the supply chain)• Planet (e.g., greenhouse gas emissions)
Corporate Knights Carbon Clean 200 Kimberly-Clark ranked #27 among The Carbon Clean 200 for 2020 by Corporate Knights. This is a list of publicly traded companies that are leading the way with solutions for the transition to a clean-energy future.
D Magazine COVID-19 Impact Award Kimberly-Clark won the 2020 Covid-19 Community Impact in D CEO's Third Annual Nonprofit and Corporate Citizenship Awards.
Diversity MBA Magazine
Best Places for Women and Diverse Managers to Work
Kimberly-Clark ranked #45 on Diversity in MBA magazine’s 50 Out Front list of the Best Places for Women and Diverse Managers to Work.
Drucker Institute Best Run Companies Kimberly-Clark is #43 in the 2020 Drucker Institute list of Best Run Companies.
Edie Sustainability Leaders Awards 2020
Finalist for Sustainability Leader Award – Social Sustainability and Community Development & Water Management Award
The UK’s largest sustainability awards recognize excellence across the spectrum of green business; from the best efficiency programs through to product innovations, from stakeholder engagement and social sustainability initiatives to the people on the ground who are making change happen.
EPA SmartWay Excellence Award Kimberly-Clark is one of 17 shipping and logistics companies to receive the SmartWay award, which highlights the best environmental performers of SmartWay's 3,700 partners. Since joining the SmartWay program in 2006, Kimberly-Clark has ranked 11 times among the top 2% of all SmartWay shippers who meet or exceed the emissions and carrier selection standards that the EPA outlines for clean, efficient transportation.
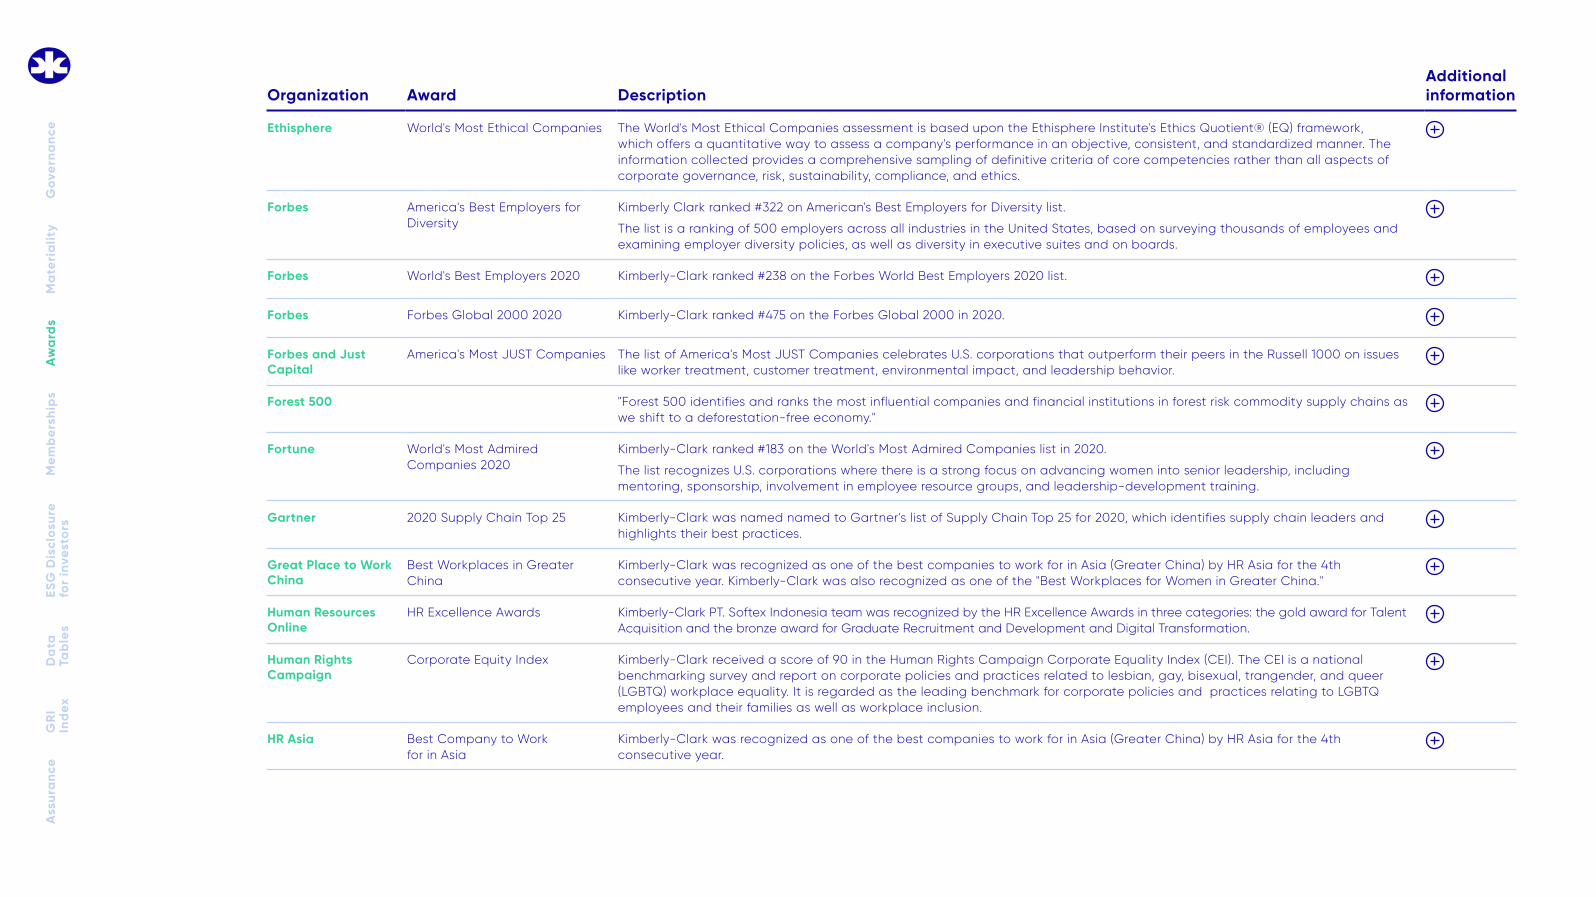
Organization Award DescriptionAdditional information
Ethisphere World's Most Ethical Companies The World's Most Ethical Companies assessment is based upon the Ethisphere Institute's Ethics Quotient® (EQ) framework, which offers a quantitative way to assess a company's performance in an objective, consistent, and standardized manner. The information collected provides a comprehensive sampling of definitive criteria of core competencies rather than all aspects of corporate governance, risk, sustainability, compliance, and ethics.
Forbes America's Best Employers for Diversity
Kimberly Clark ranked #322 on American's Best Employers for Diversity list.
The list is a ranking of 500 employers across all industries in the United States, based on surveying thousands of employees and examining employer diversity policies, as well as diversity in executive suites and on boards.
Forbes World's Best Employers 2020 Kimberly-Clark ranked #238 on the Forbes World Best Employers 2020 list.
Forbes Forbes Global 2000 2020 Kimberly-Clark ranked #475 on the Forbes Global 2000 in 2020.
Forbes and Just Capital
America's Most JUST Companies The list of America's Most JUST Companies celebrates U.S. corporations that outperform their peers in the Russell 1000 on issues like worker treatment, customer treatment, environmental impact, and leadership behavior.
Forest 500 "Forest 500 identifies and ranks the most influential companies and financial institutions in forest risk commodity supply chains as we shift to a deforestation-free economy."
Fortune World's Most Admired Companies 2020
Kimberly-Clark ranked #183 on the World's Most Admired Companies list in 2020.
The list recognizes U.S. corporations where there is a strong focus on advancing women into senior leadership, including mentoring, sponsorship, involvement in employee resource groups, and leadership-development training.
Gartner 2020 Supply Chain Top 25 Kimberly-Clark was named named to Gartner's list of Supply Chain Top 25 for 2020, which identifies supply chain leaders and highlights their best practices.
Great Place to Work China
Best Workplaces in Greater China
Kimberly-Clark was recognized as one of the best companies to work for in Asia (Greater China) by HR Asia for the 4th consecutive year. Kimberly-Clark was also recognized as one of the "Best Workplaces for Women in Greater China."
Human Resources Online
HR Excellence Awards Kimberly-Clark PT. Softex Indonesia team was recognized by the HR Excellence Awards in three categories: the gold award for Talent Acquisition and the bronze award for Graduate Recruitment and Development and Digital Transformation.
Human Rights Campaign
Corporate Equity Index Kimberly-Clark received a score of 90 in the Human Rights Campaign Corporate Equality Index (CEI). The CEI is a national benchmarking survey and report on corporate policies and practices related to lesbian, gay, bisexual, trangender, and queer (LGBTQ) workplace equality. It is regarded as the leading benchmark for corporate policies and practices relating to LGBTQ employees and their families as well as workplace inclusion.
HR Asia Best Company to Work for in Asia
Kimberly-Clark was recognized as one of the best companies to work for in Asia (Greater China) by HR Asia for the 4th consecutive year.
Organization Award DescriptionAdditional information
Korean Standards Association
Korea Sustainable CEO Award Choe KyooBok, the CEO of Yuhan-Kimberly in South Korea, won this year’s Korea Sustainable CEO Award at the 2020 Korea Sustainability Competition. Under his leadership, the company's “Keep Korea Green” campaign has helped plant approximately 53 million trees across the nation, and championed causes ranging from women leadership to supporting the underprivileged during the COVID-19 pandemic.
Korean Standards Association
Sustainability Report Award The Korea Sustainability Report Award is evaluated by the Korean Standards Association based on the GRI (Global Reporting Initiative) guideline, a global standard for sustainability management reports. Through independent evaluation and deliberation by CSR experts, they asses the sustainability management reports of domestic companies and select excellent reports every year.
Korean Standards Association
"Hall of Fame" Yuhan-Kimberly was inducted into the Hall of Fame for taking first place in the household goods category of the Sustainability Index in Korea for 10 consecutive years.
MERCO Social Responsibility and Corporate Governance (Peru)
Kimberly-Clark ranked 12th among companies with the best reputation in Social Responsibility and Corporate Governance.
MERCO Companies Award – Corporate Reputation (Peru, Costa Rica, Argentina)
Kimberly-Clark ranked 2nd place in the Toilet, Perfumery and Cosmetics Category in Peru; 10th place in Peru among companies with the best corporate reputation; 14th place among companies with the best corporate reputation in Costa Rica; and 78th place in Argentina.
Natl. Association for Executive Women
2020 NAFE Top Company for Executive Women
The NAFE 70 Top Companies and 10 Nonprofits for Executive Women Awards celebrate winning companies that are moving “Women to the Top.”
Newsweek America's Most Responsible Companies
"Newsweek partnered with global data research firm Statista Inc. to publish its first ranking of America's Most Responsible Companies. Kimberly-Clark ranked 47th."
Public Affairs Asia Gold Standard Award for Corporate Citizenship
Kimberly Clark awarded the Gold Standard Award for Corporate Citizenship (CSR and Sustainability) as part of the Good Business & Citizenship Categories for Philanthropy Across APAC During Covid-19 by Public Affairs Asia.
RepTrak Global 100 Kimberly-Clark ranked #76 on RepTrak's Global 100 for 2020. The 2020 Global RepTrak® 100 is the definitive ranking of corporate reputation for the world’s leading companies.
Talent Board CandE Award Winner Kimberly-Clark was one of Talent Board's 55 winners who were found to provide over tens of thousands of job candidates an exemplary candidate experience. Talent Board, a nonprofit organization focused on the promotion and benchmark research of a quality candidate experience, conducts a comprehensive evaluation and data analysis on the candidate experience.
Working Mother Magazine
2020 Diversity Best Practices Inclusion Index
Kimberly-Clark was recognized by the Working Mother Research Institute for their high-quality inclusion and diversity work and was named a Diversity Best Practices Inclusion Index member.
Working Mother Magazine
Best Companies for Dads Kimberly-Clark has been named one of the Best Companies for Dads for 2020. Companies included on this list offer either substantial paid gender-neutral or paternity leave, plus other benefits that help dads be their best at home and at work.
Working Mother Magazine
Top Companies for Executive Women
Kimberly-Clark has been named one of the 2020 and 2020+ Top Companies for Executive Women by Working Mother Magazine for the fourth consecutive time for our work to champion women’s advancement. We’re proud to be named among these trailblazing companies, and we remain committed to developing and promoting innovative policies that support our employees as they pursue their career ambitions.A
rise, tropical cyclone, river flooding, and precipitation.
The transition climate risk assessment, focused on the next
decade, was performed under a “well below 2°C” scenario
with considerations to operations (including geographical
variations in risk drivers), supply chain, and resources. Eleven
transition risks classified in four different categories (Policy &
Legal, Technology, Market and Reputation) were identified
and assessed.
We intend to compile the relevant findings and assessment results into a climate-related risk and opportunity report, fully aligned with the TCFD framework and published later in 2021.
GovernanceDisclose the
organization’s governance around climate-related risks and opportunities.
Strategy Disclose the actual
and potential impacts of climate-related
risks and opportunities on the organization’s
businesses, strategy, and financial planning.
Risk Management
Disclose how the organization
identifies, assesses, and manages
climate-related risks.
Metrics and Targets
Disclose the organization’s
governance around climate-related risks and opportunities.
We recognize the need for extended ESG reporting to allow investors access to standardized
and comparable ESG data. Below, we provide disclosures against the SASB standards. We
plan to continue evolving our reporting practices to better meet the needs of the investment
community in the coming years.
Sustainability Accounting Standards Board (SASB)
Topic Code Accounting Metric Response
Water Management CG-HP-140a.1 Total water withdrawn 88,287,290 m3/yr
% of total water withdrawn in regions with high or extremely high baseline water stress
6.50%
Total water consumed 9,558,631 m3/yr
% of water consumed in regions with high or extremely high baseline water stress
16.5%
CG-HP-140a.2 Description of water management risks and discussion of strategies and practices to mitigate those risks
N/A
Product Environmental, Health, and Safety Performance
CG-HP-250a.1 Revenue from products that contain REACH substances of very high concern (SVHC)
Based on information received from our suppliers and our own product data, Kimberly-Clark does not market products containing a substance included in the Registration, Evaluation, Authorisation, and Restriction of Chemicals (REACH) Candidate List of Substances of Very High Concern for Authorisation (SVHC) in a concentration above 0.1 % weight by weight (w/w).
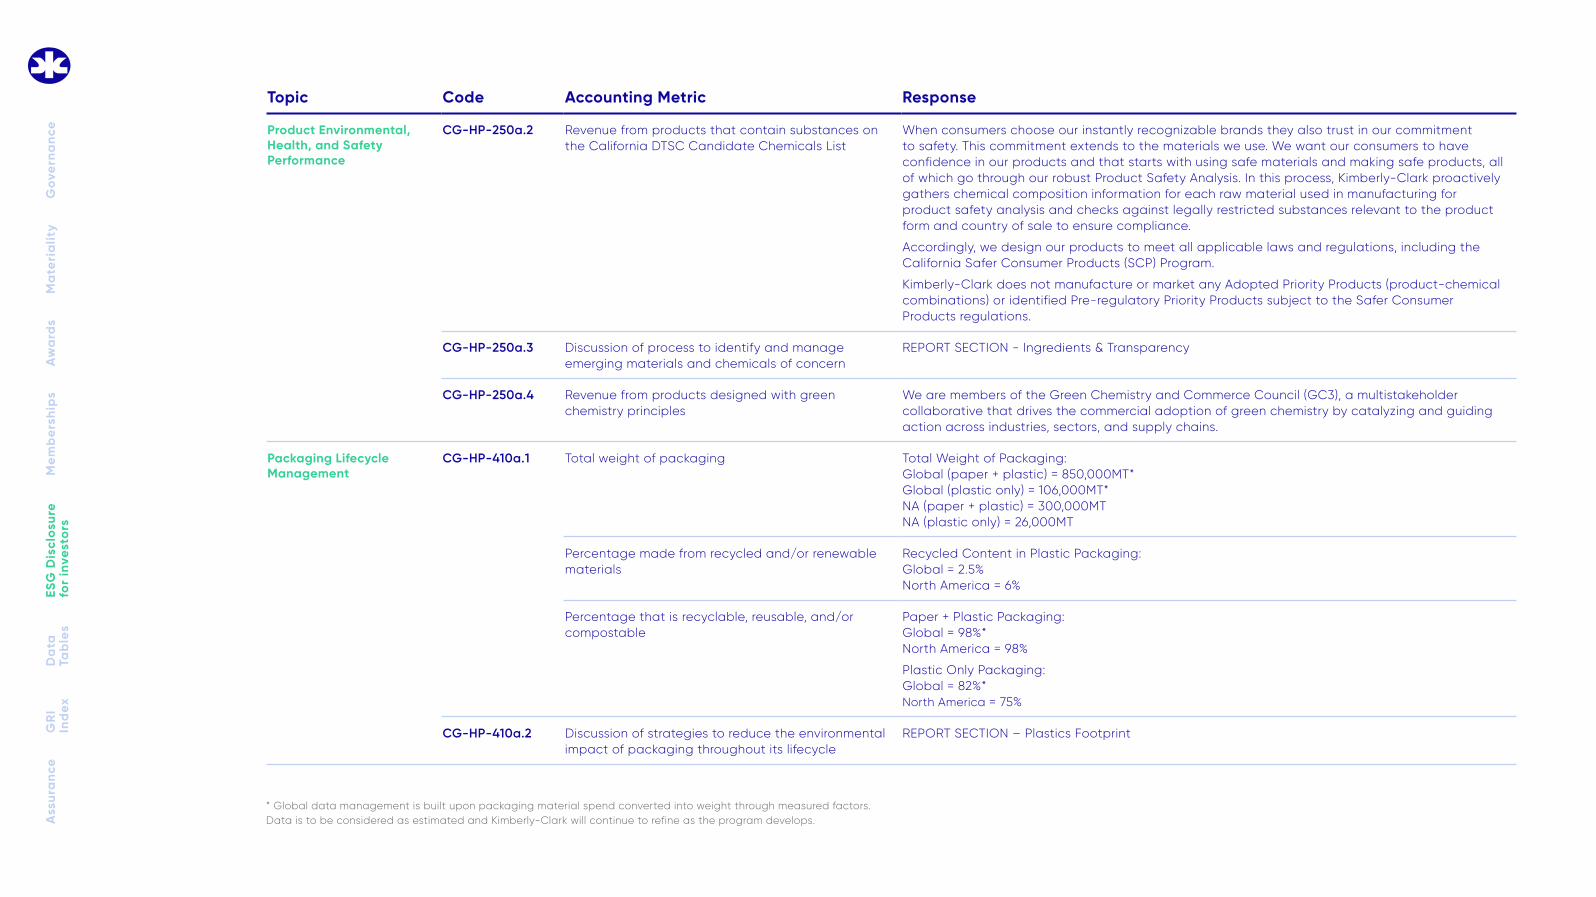
Product Environmental, Health, and Safety Performance
CG-HP-250a.2 Revenue from products that contain substances on the California DTSC Candidate Chemicals List
When consumers choose our instantly recognizable brands they also trust in our commitment to safety. This commitment extends to the materials we use. We want our consumers to have confidence in our products and that starts with using safe materials and making safe products, all of which go through our robust Product Safety Analysis. In this process, Kimberly-Clark proactively gathers chemical composition information for each raw material used in manufacturing for product safety analysis and checks against legally restricted substances relevant to the product form and country of sale to ensure compliance.
Accordingly, we design our products to meet all applicable laws and regulations, including the California Safer Consumer Products (SCP) Program.
Kimberly-Clark does not manufacture or market any Adopted Priority Products (product-chemical combinations) or identified Pre-regulatory Priority Products subject to the Safer Consumer Products regulations.
CG-HP-250a.3 Discussion of process to identify and manage emerging materials and chemicals of concern
REPORT SECTION - Ingredients & Transparency
CG-HP-250a.4 Revenue from products designed with green chemistry principles
We are members of the Green Chemistry and Commerce Council (GC3), a multistakeholder collaborative that drives the commercial adoption of green chemistry by catalyzing and guiding action across industries, sectors, and supply chains.
Packaging Lifecycle Management
CG-HP-410a.1 Total weight of packaging Total Weight of Packaging: Global (paper + plastic) = 850,000MT* Global (plastic only) = 106,000MT* NA (paper + plastic) = 300,000MT NA (plastic only) = 26,000MT
Percentage made from recycled and/or renewable materials
Recycled Content in Plastic Packaging: Global = 2.5% North America = 6%
Percentage that is recyclable, reusable, and/or compostable
Paper + Plastic Packaging: Global = 98%* North America = 98%
Plastic Only Packaging: Global = 82%* North America = 75%
CG-HP-410a.2 Discussion of strategies to reduce the environmental impact of packaging throughout its lifecycle
REPORT SECTION – Plastics Footprint
* Global data management is built upon packaging material spend converted into weight through measured factors. Data is to be considered as estimated and Kimberly-Clark will continue to refine as the program develops.A
Environmental & Social Impacts of Palm Oil Supply Chain
CG-HP-430a.1 Amount of palm oil source Kimberly-Clark purchased 206 metric tons of palm derivative material for its global businesses in 2020.
Kimberly-Clark purchased 2,368 metric tons of formulated solutions, which may have included palm oil or a palm oil derivative, as an ingredient for its global businesses in 2020.
% RSPO identity preserved 0%
% RSPO segregated 0%
% RSPO mass balance 0%
% RSPO book & claim 0%
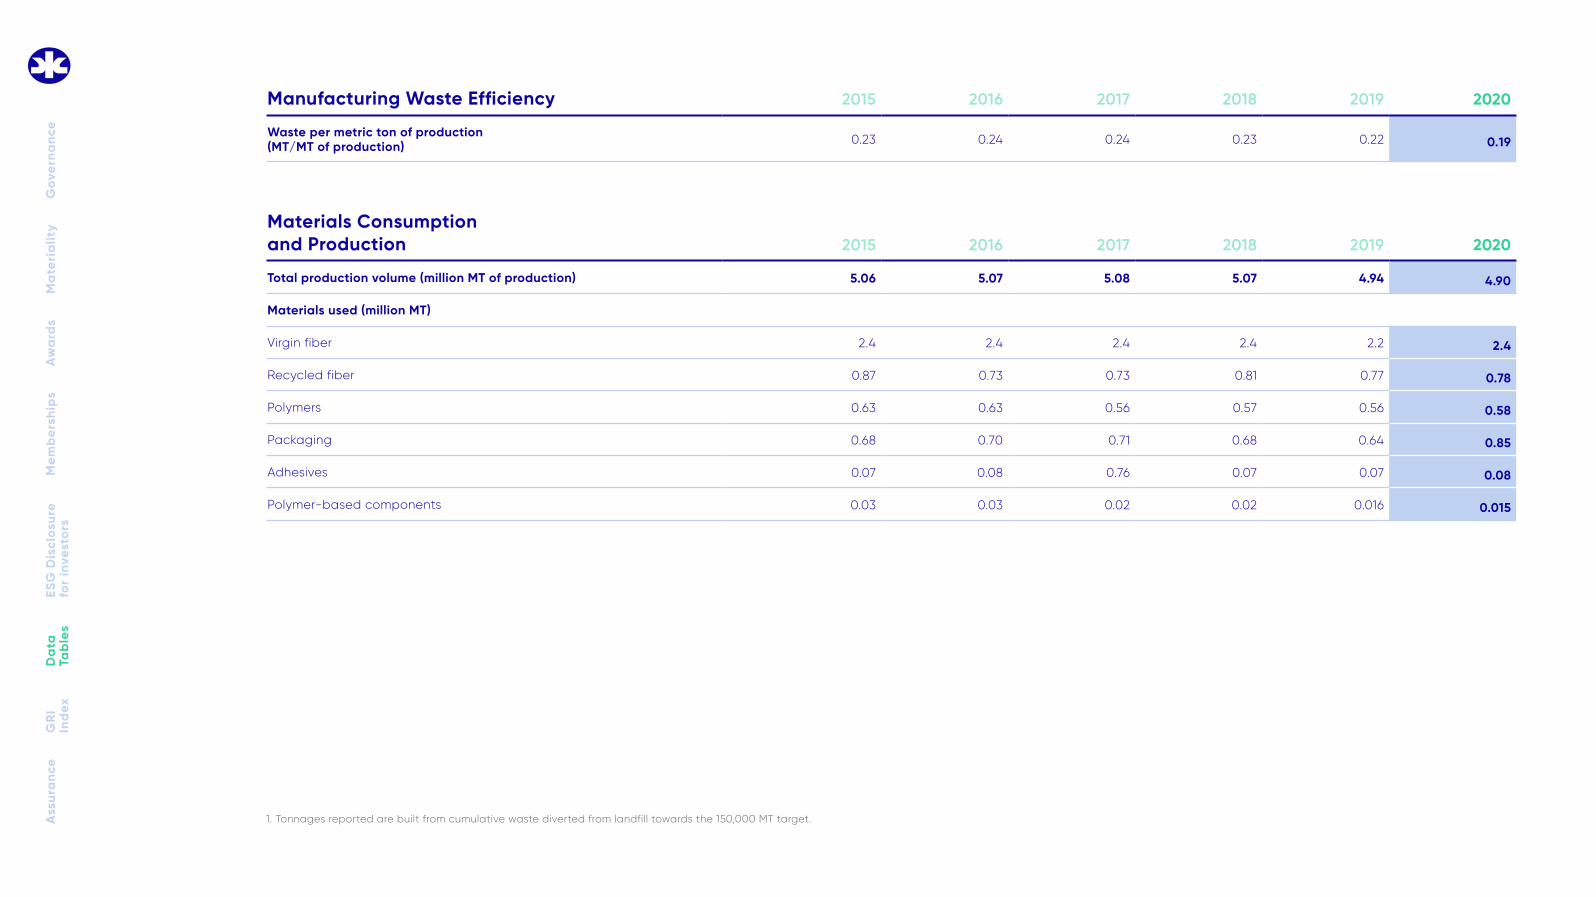
Activity Metrics CG-HP-000.A Total weight of products sold 4,900,000
Total environmental expenditures ($M)2 $173 $152 $126 $158 $221 $154
Capital $61 $44 $21 $45 $112 $63
O&M $96 $97 $89 $96 $96 $78
Government payments and R&D2 $16 $10 $16 $17 $13 $13
Assets ($B) $14.8 $14.6 $15.2 $14.5 $15.3 $17.5
Donations and community investments ($M) $29 $28 $26 $28 $28 $42
Percent of net income 1 2.9% 1.3% 1.1% 2.0% 1.1% 1.56%
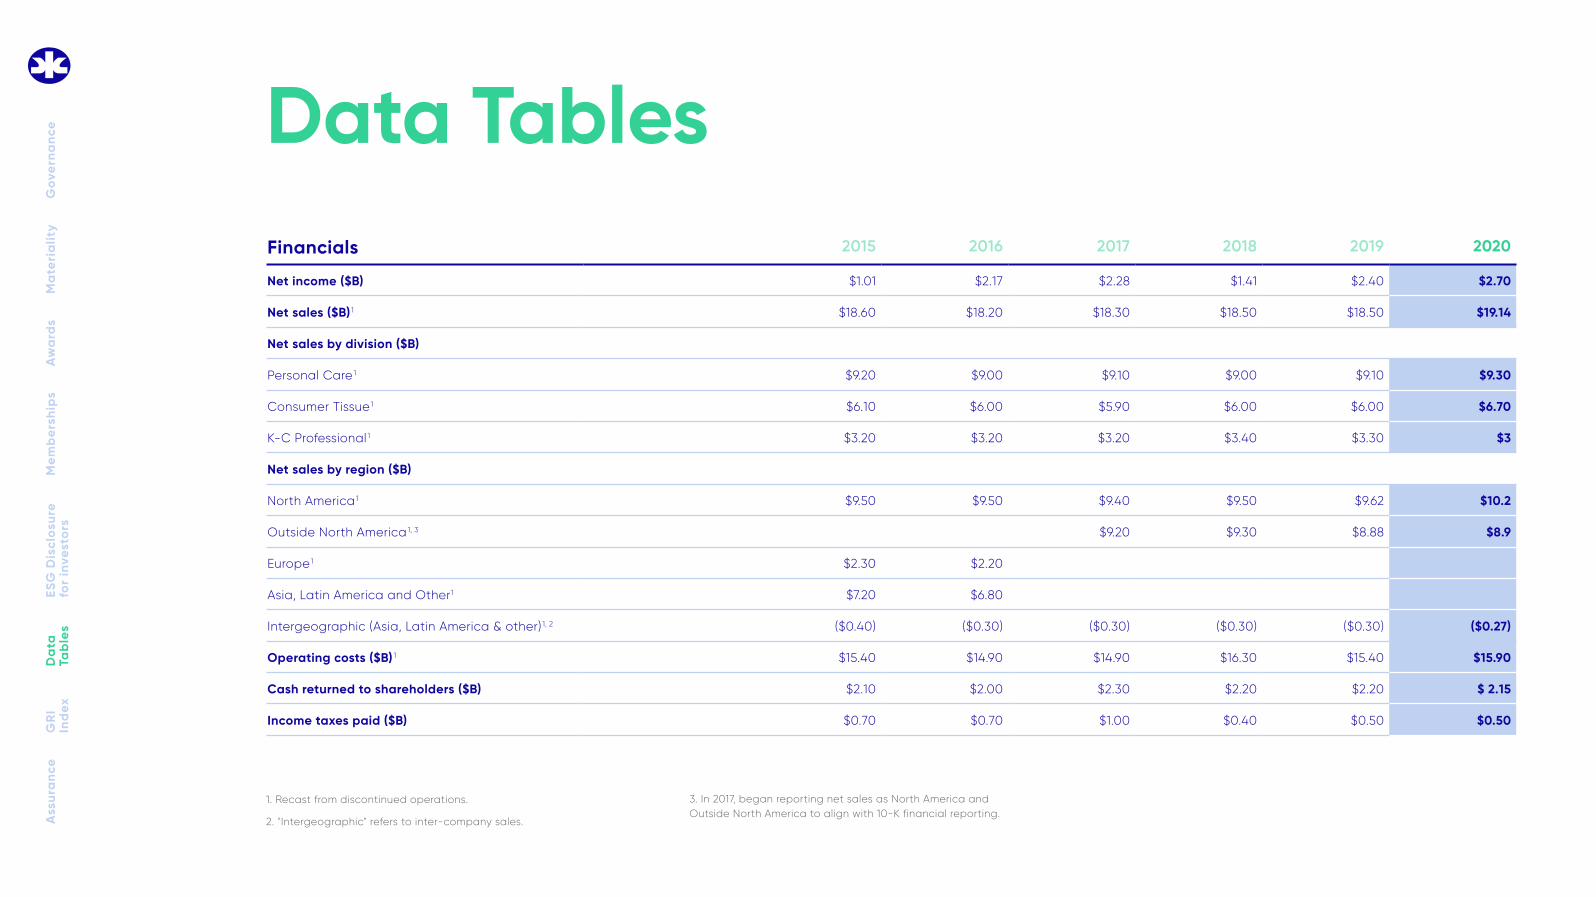
1. Recast from discontinued operations.
2. Total environmental expenditures were restated for 2014 to be consistent with prior years to not include equity company numbers. Totals for 2014 exclude equity companies and Health Care facilities.A
1. Restated data history to report Mexico as part of North America (instead of Latin America) for a geographical view.
2. The percentage of unionized workers is approximately 22% of our workforce in many countries. However, in many countries, union membership is considered a private matter and may not be tracked for those countries. Furthermore, in some countries, employees who are not union members specifically are subject to union agreements.
3. Beginning in 2015, turnover rate data is Global.
Union Membership 2015 2016 2017 2018 2019 2020
Percentage of North American employees with union membership 21% 21% 21% 22%2 27% 26%
1. In 2017 there was one fatality involving a K-C de Mexico employee at the Bajio facility.
2. In 2018 there were two Kimberly-Clark employee fatalities: one at the Paris, Texas, facility where an employee was crushed by a truck at the loading dock, the other at K-C de Mexico's Bajio facility, where an employee was crushed while threading a winder.
3. In 2020 there were two Kimberlyy-Clark employee fatalities: an employee at the Suzano, Brasil, facility was involved in a fatal Machine Shop accident and an employee at a Staff location in India was involved in a motorbike collision.
TRIR: Work-related events that result in fatalities, temporary or permanently disabling injuries, or illnesses, per 200,000 hours worked per annum.
LTRIR: Reportable injuries/illnesses that result in time away from work or restricted work, per 200,000 hours worked per annum.
1. Forced labor indicators are conditions that indicate the potential for forced labor in an operation, such as worker movement, restrictions, recruitment fees, witholding of worker documents, or other similar findings.A
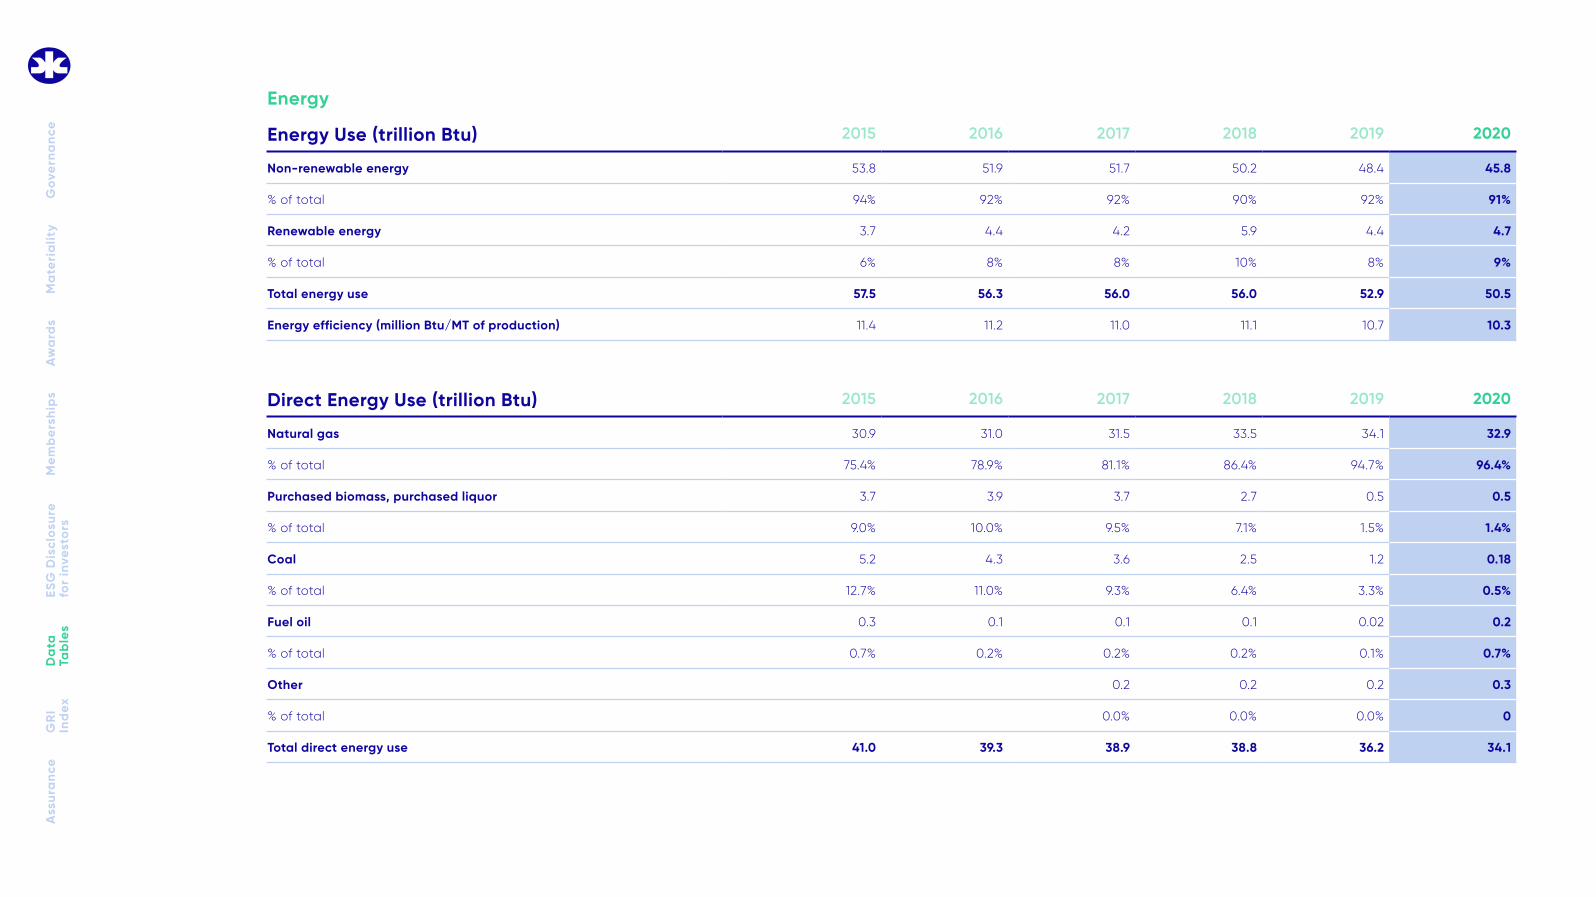
1. Data represents Kimberly-Clark and equity affiliates; In 2020, Kimberly-Clark Australia began use of 540 tons of Bamboo alternative non-wood fibers for bath tissue.
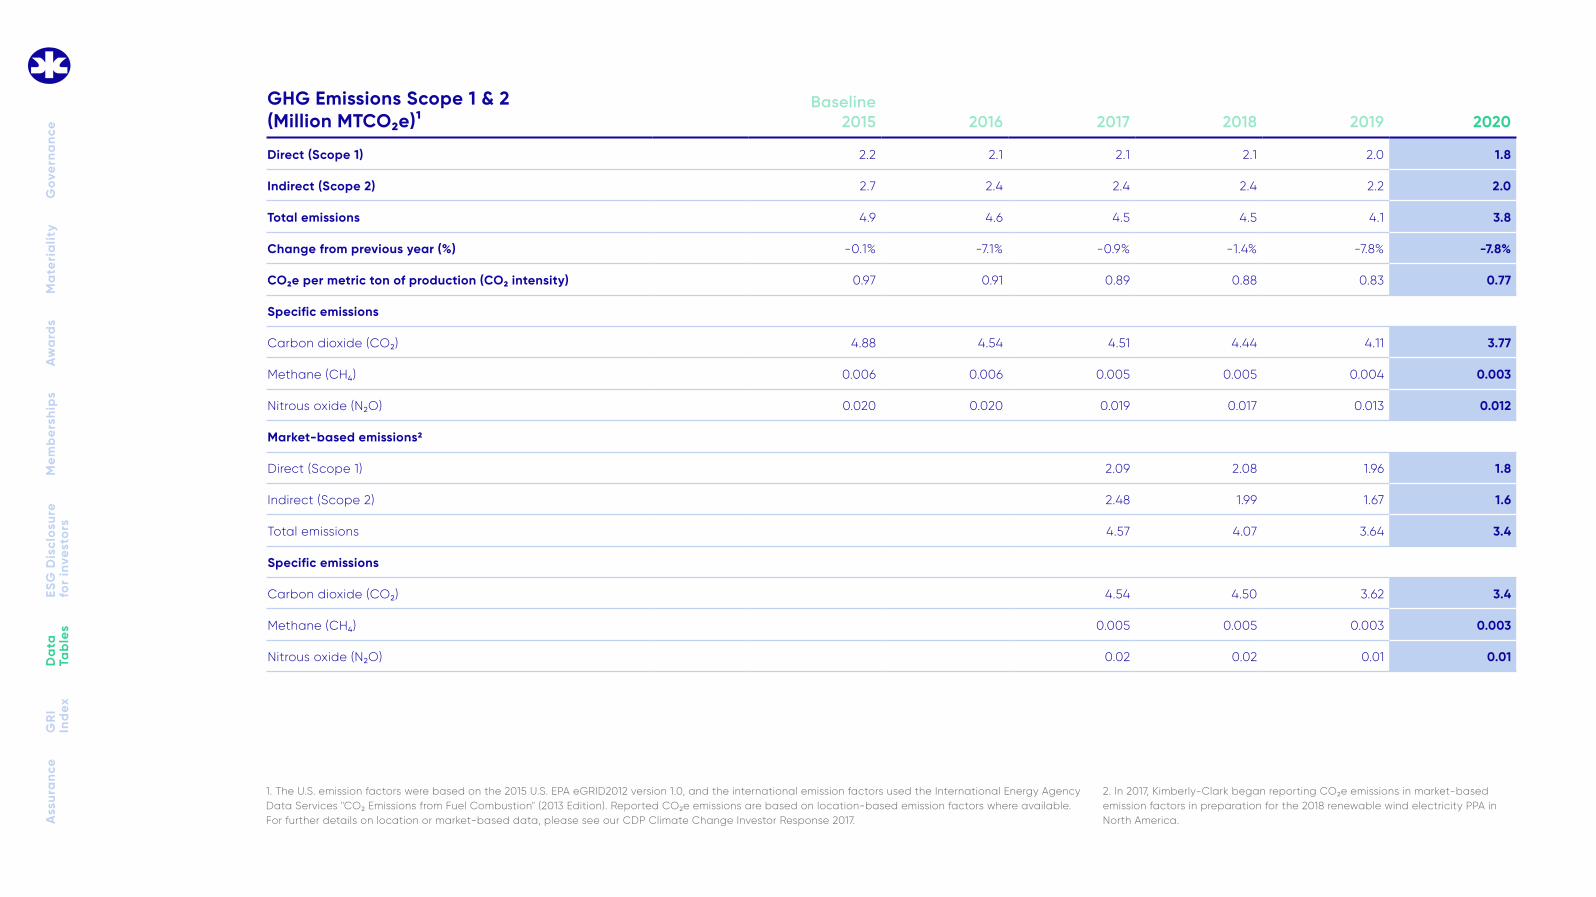
1. The U.S. emission factors were based on the 2015 U.S. EPA eGRID2012 version 1.0, and the international emission factors used the International Energy Agency Data Services "CO2 Emissions from Fuel Combustion" (2013 Edition). Reported CO2e emissions are based on location-based emission factors where available. For further details on location or market-based data, please see our CDP Climate Change Investor Response 2017.
2. In 2017, Kimberly-Clark began reporting CO2e emissions in market-based emission factors in preparation for the 2018 renewable wind electricity PPA in North America. A
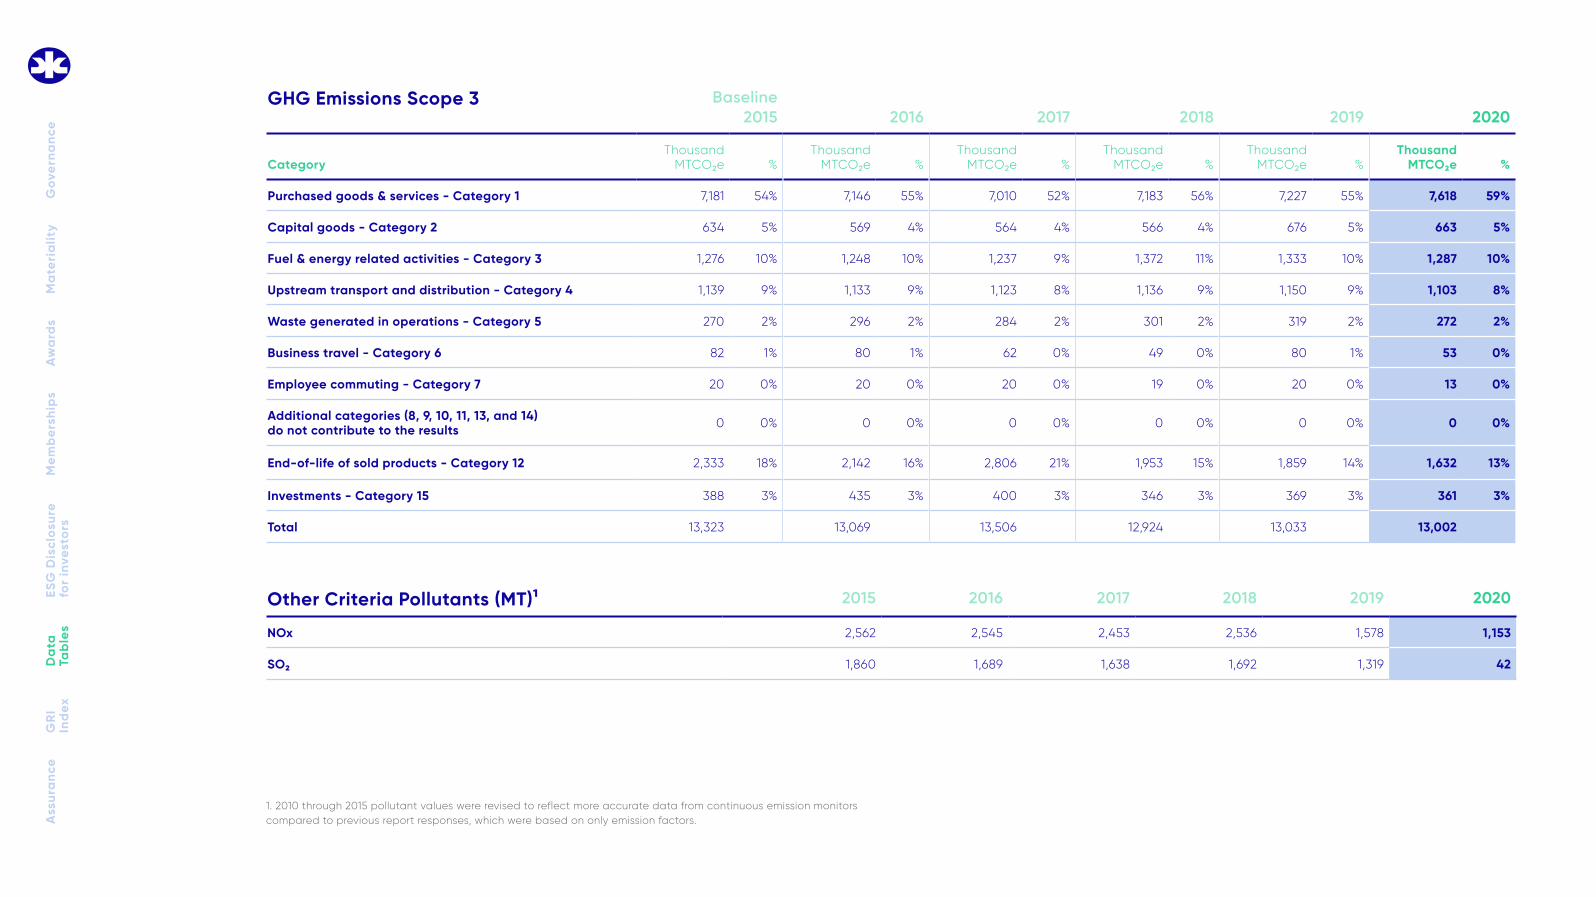
1. 2010 through 2015 pollutant values were revised to reflect more accurate data from continuous emission monitors compared to previous report responses, which were based on only emission factors.
Other Criteria Pollutants (MT)1 2015 2016 2017 2018 2019 2020
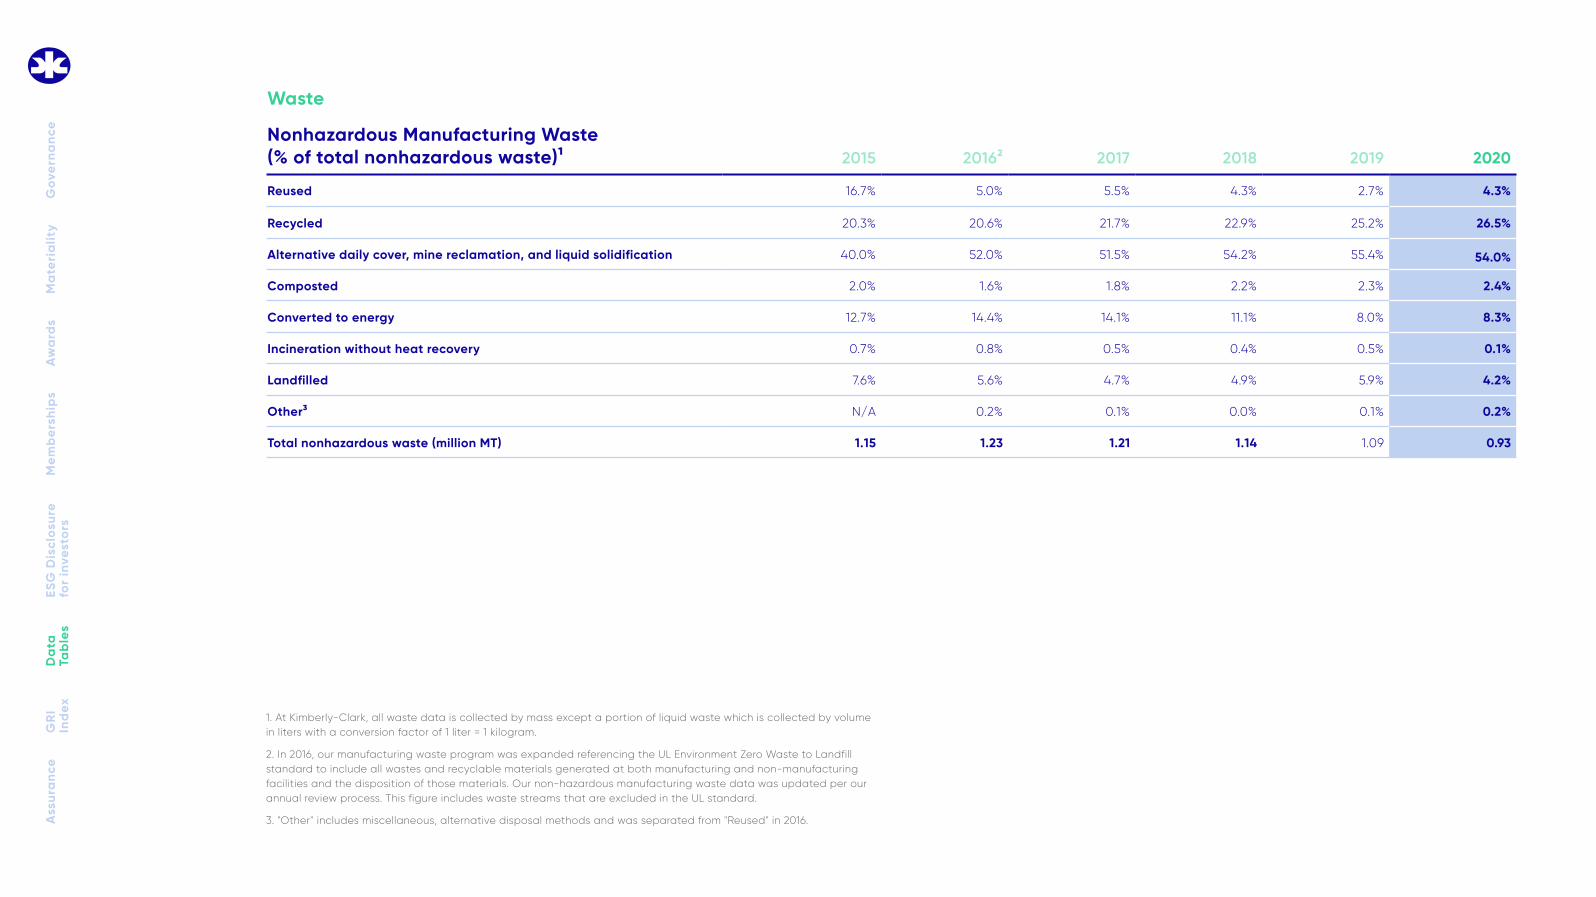
1. At Kimberly-Clark, all waste data is collected by mass except a portion of liquid waste which is collected by volume in liters with a conversion factor of 1 liter = 1 kilogram.
2. In 2016, our manufacturing waste program was expanded referencing the UL Environment Zero Waste to Landfill standard to include all wastes and recyclable materials generated at both manufacturing and non-manufacturing facilities and the disposition of those materials. Our non-hazardous manufacturing waste data was updated per our annual review process. This figure includes waste streams that are excluded in the UL standard.
3. "Other" includes miscellaneous, alternative disposal methods and was separated from "Reused" in 2016.Ass
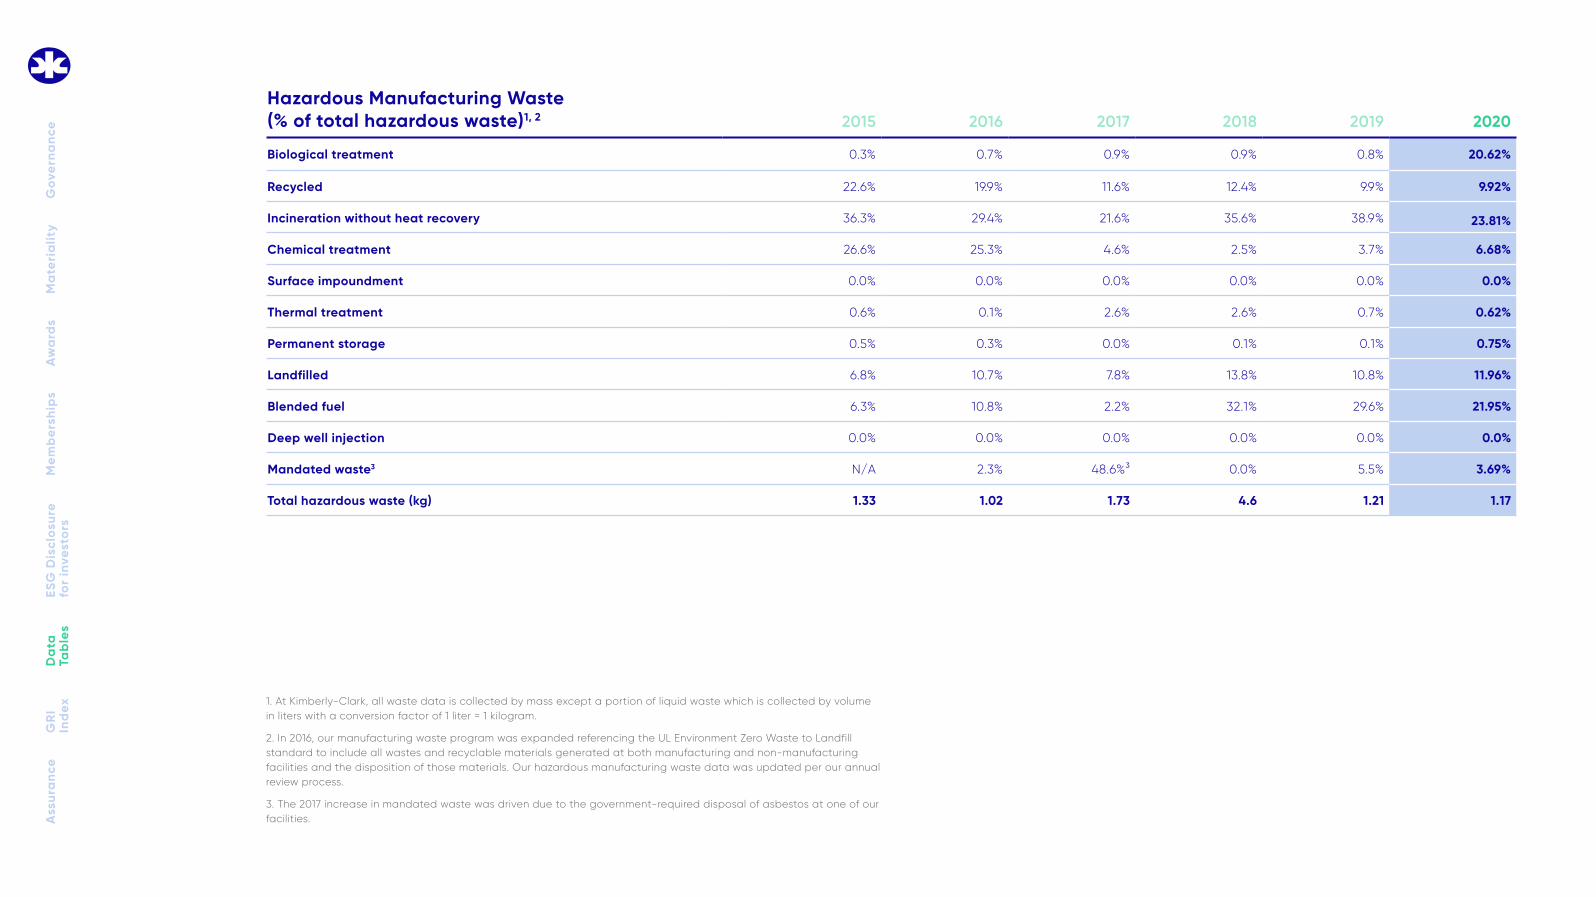
Incineration without heat recovery 36.3% 29.4% 21.6% 35.6% 38.9% 23.81%
Chemical treatment 26.6% 25.3% 4.6% 2.5% 3.7% 6.68%
Surface impoundment 0.0% 0.0% 0.0% 0.0% 0.0% 0.0%
Thermal treatment 0.6% 0.1% 2.6% 2.6% 0.7% 0.62%
Permanent storage 0.5% 0.3% 0.0% 0.1% 0.1% 0.75%
Landfilled 6.8% 10.7% 7.8% 13.8% 10.8% 11.96%
Blended fuel 6.3% 10.8% 2.2% 32.1% 29.6% 21.95%
Deep well injection 0.0% 0.0% 0.0% 0.0% 0.0% 0.0%
Mandated waste3 N/A 2.3% 48.6%3 0.0% 5.5% 3.69%
Total hazardous waste (kg) 1.33 1.02 1.73 4.6 1.21 1.17
1. At Kimberly-Clark, all waste data is collected by mass except a portion of liquid waste which is collected by volume in liters with a conversion factor of 1 liter = 1 kilogram.
2. In 2016, our manufacturing waste program was expanded referencing the UL Environment Zero Waste to Landfill standard to include all wastes and recyclable materials generated at both manufacturing and non-manufacturing facilities and the disposition of those materials. Our hazardous manufacturing waste data was updated per our annual review process.
3. The 2017 increase in mandated waste was driven due to the government-required disposal of asbestos at one of our facilities. A
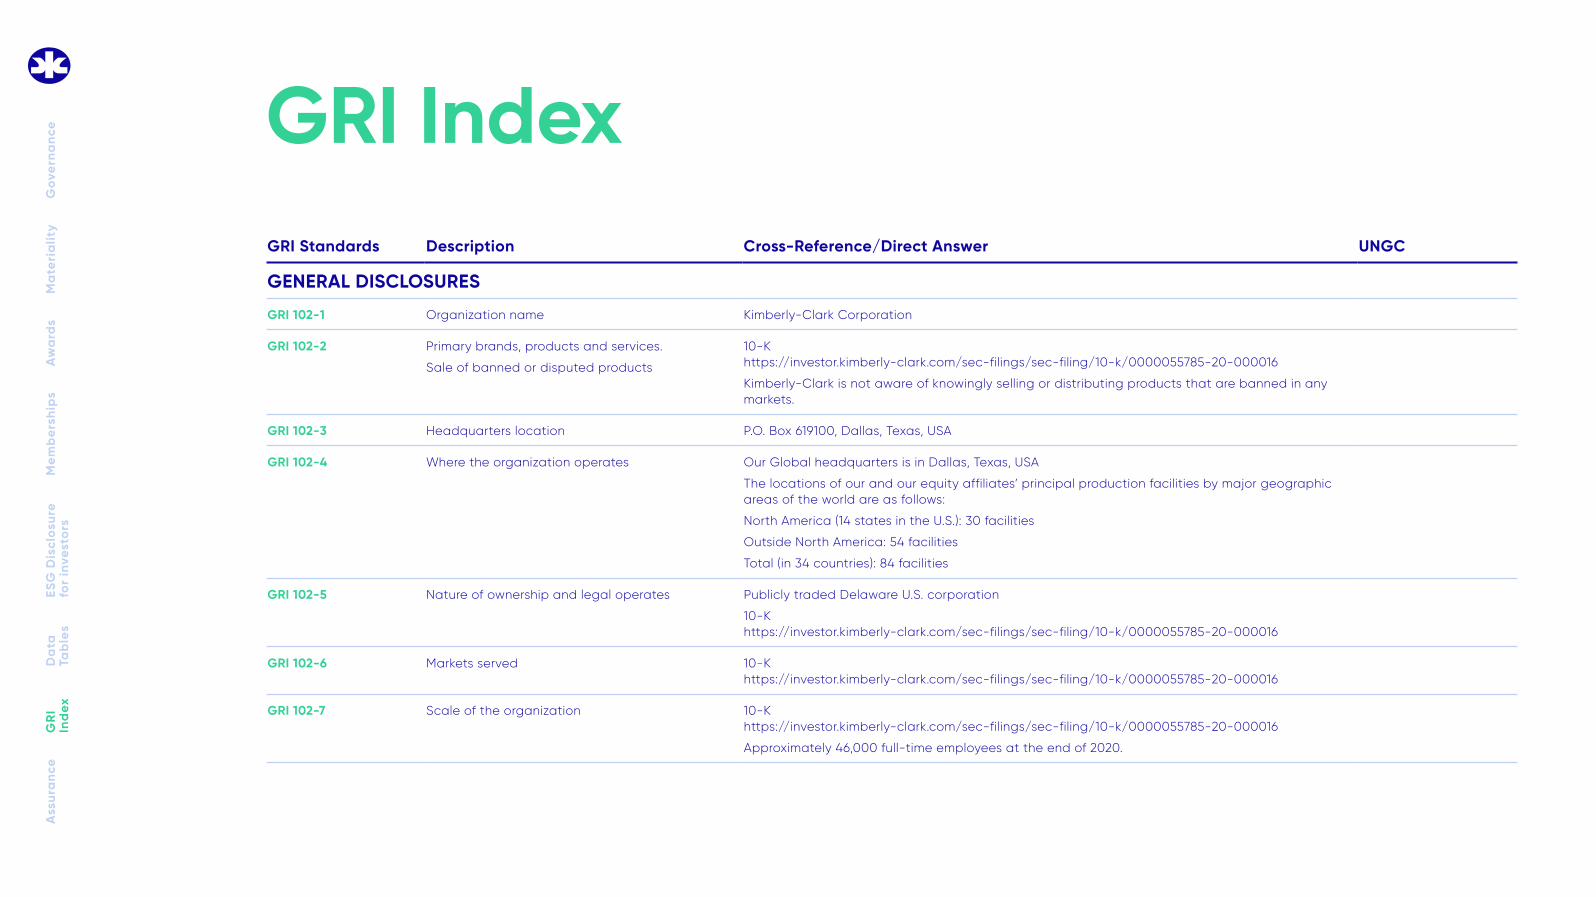
GRI 102-8 Total number of employees by type Approximately 46,000 total full-time employees.
Approximately 30 percent of our employees were located in North America and the remainder were in more than 65 countries outside of North America.
Approximately 60 percent of our workforce was directly involved in manufacturing and distribution operations.
Globally, 30.1% of all full-time employees are women.
35% of management globally is comprised of women.
GRI 102-9 Supply chain description We seek to do business with suppliers who share our social and environmental values, and to work to enhance the sustainability of their operations.
In manufacturing our trusted products, we are supported by more than 25,000 suppliers worldwide, who not only supply quality raw materials and finished goods, but also service our offices in over 35 countries around the world through office supplies, software, and outsourced services, and provide other services including marketing and media services which help us communicate with our customers and consumers.
GRI 102-10 Organizational changes during reporting period 10-K https://investor.kimberly-clark.com/sec-filings/sec-filing/10-k/0000055785-20-000016
GRI 102-11 Precautionary principle Our vision to provide the essentials for a better life includes our commitment to protect the environment. This vision inspires our search for more sustainable ways of meeting our customers’ needs.
We consider the precautionary principles in the processes, systems, and capabilities utilized within our Product Safety, Sustainability, Regulatory and Clinical Affairs, and Research and Engineering functions.
We seek ways to reduce environmental impact from our operations and design products that are environmentally innovative.
REPORT SECTION – Product Safety
Principle 7
GRI 102-12 External charters, principles, or other initiatives Our external charters, principles, and other initiatives include, but are not limited to:
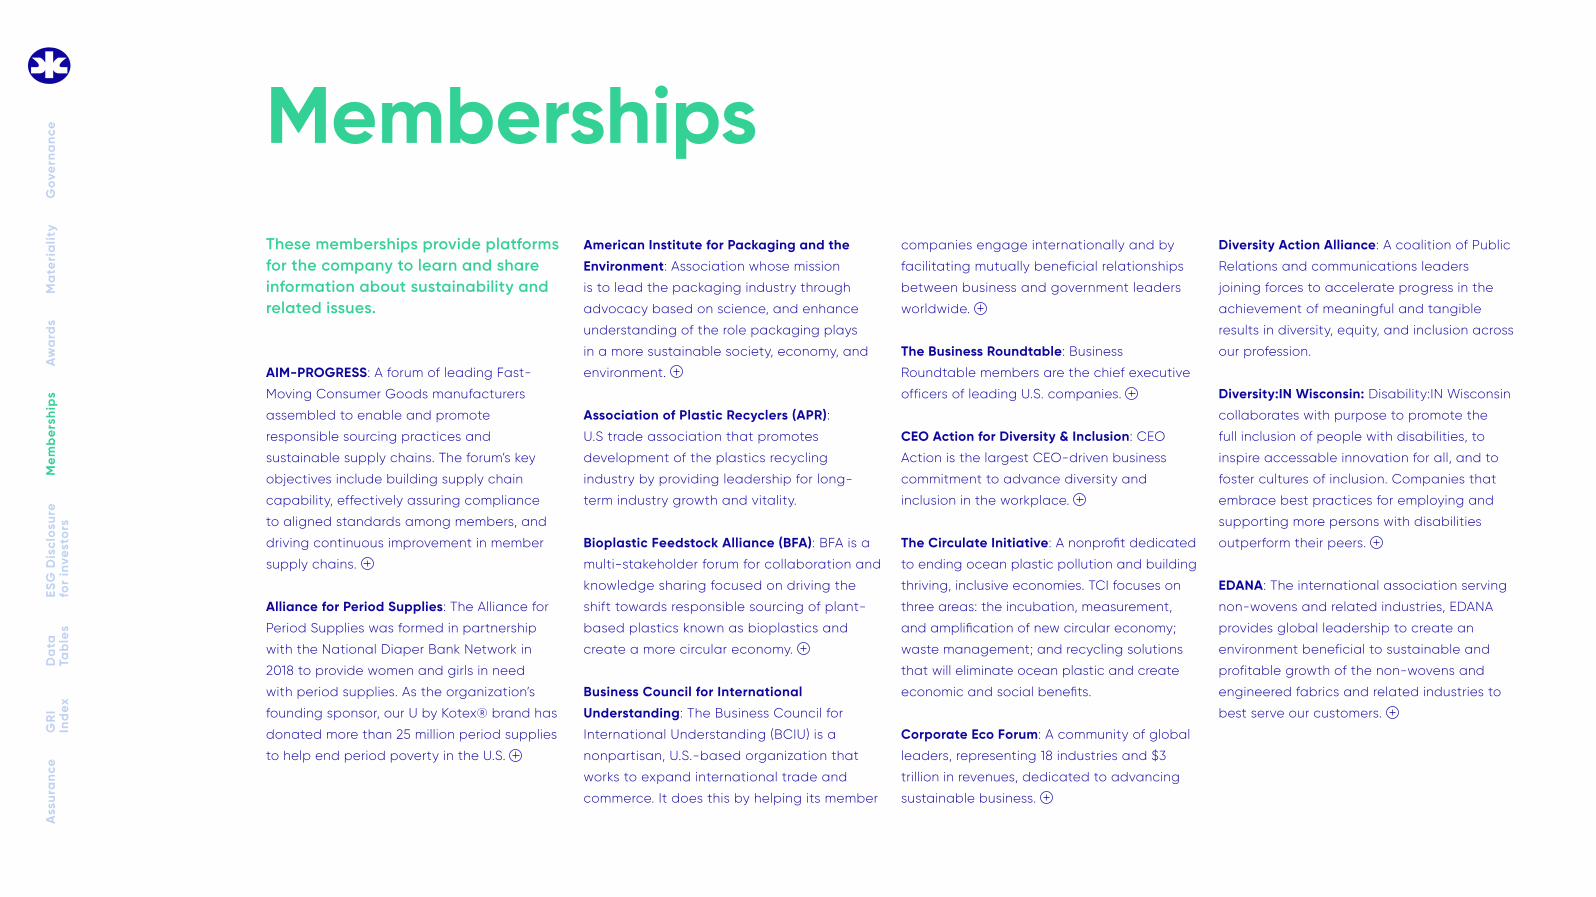
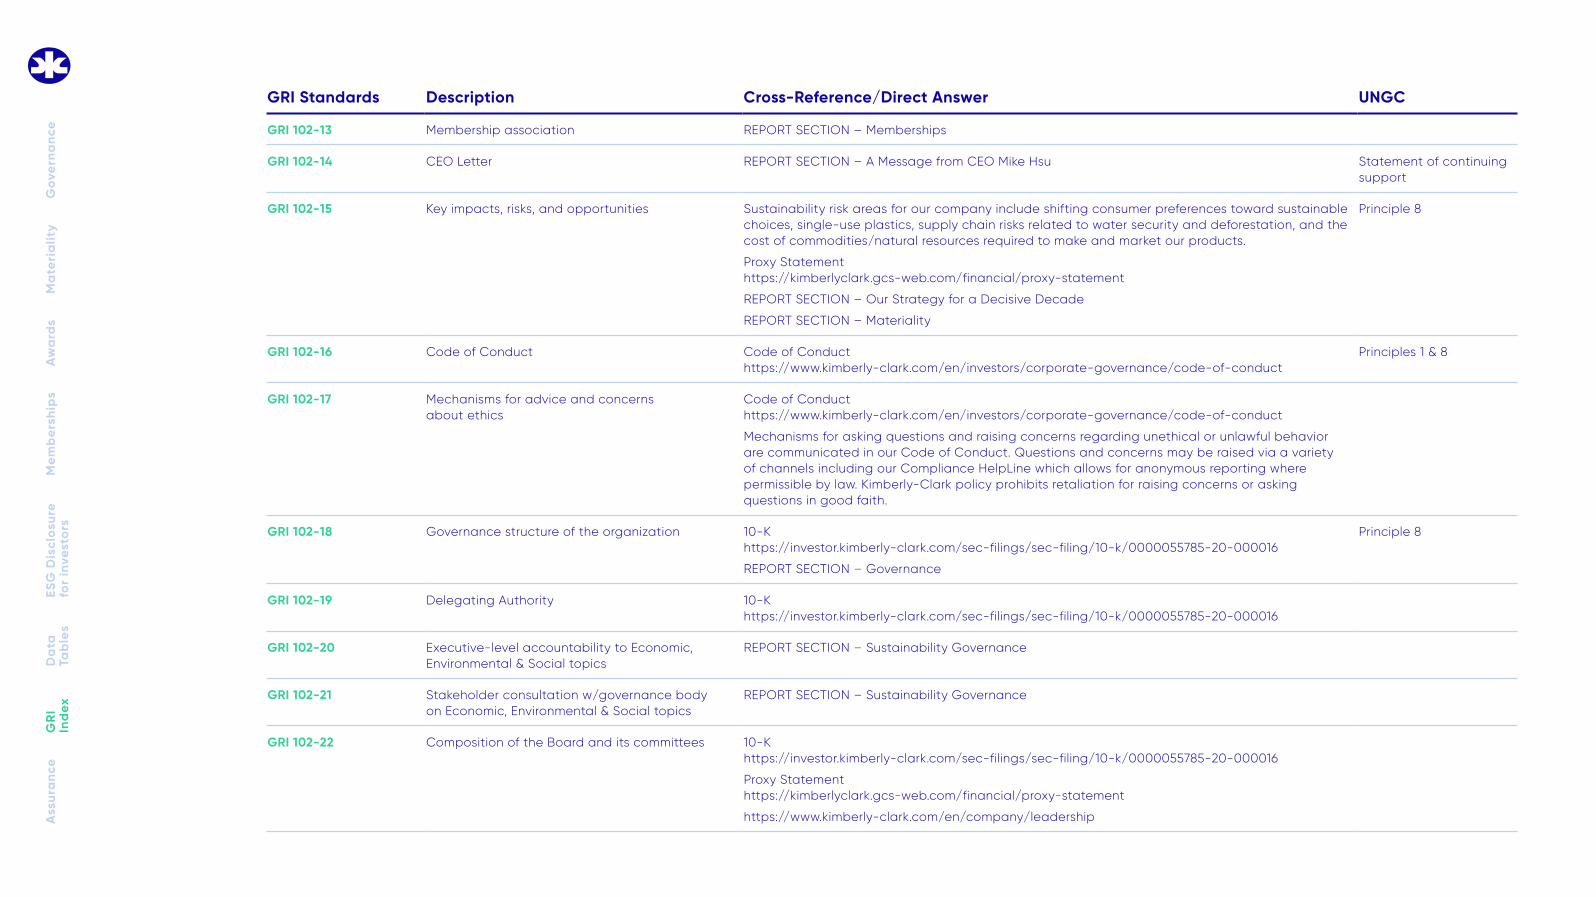
GRI 102-13 Membership association REPORT SECTION – Memberships
GRI 102-14 CEO Letter REPORT SECTION – A Message from CEO Mike Hsu Statement of continuing support
GRI 102-15 Key impacts, risks, and opportunities Sustainability risk areas for our company include shifting consumer preferences toward sustainable choices, single-use plastics, supply chain risks related to water security and deforestation, and the cost of commodities/natural resources required to make and market our products.
REPORT SECTION – Our Strategy for a Decisive Decade
REPORT SECTION – Materiality
Principle 8
GRI 102-16 Code of Conduct Code of Conduct https://www.kimberly-clark.com/en/investors/corporate-governance/code-of-conduct
Principles 1 & 8
GRI 102-17 Mechanisms for advice and concerns about ethics
Code of Conduct https://www.kimberly-clark.com/en/investors/corporate-governance/code-of-conduct
Mechanisms for asking questions and raising concerns regarding unethical or unlawful behavior are communicated in our Code of Conduct. Questions and concerns may be raised via a variety of channels including our Compliance HelpLine which allows for anonymous reporting where permissible by law. Kimberly-Clark policy prohibits retaliation for raising concerns or asking questions in good faith.
GRI 102-18 Governance structure of the organization 10-K https://investor.kimberly-clark.com/sec-filings/sec-filing/10-k/0000055785-20-000016
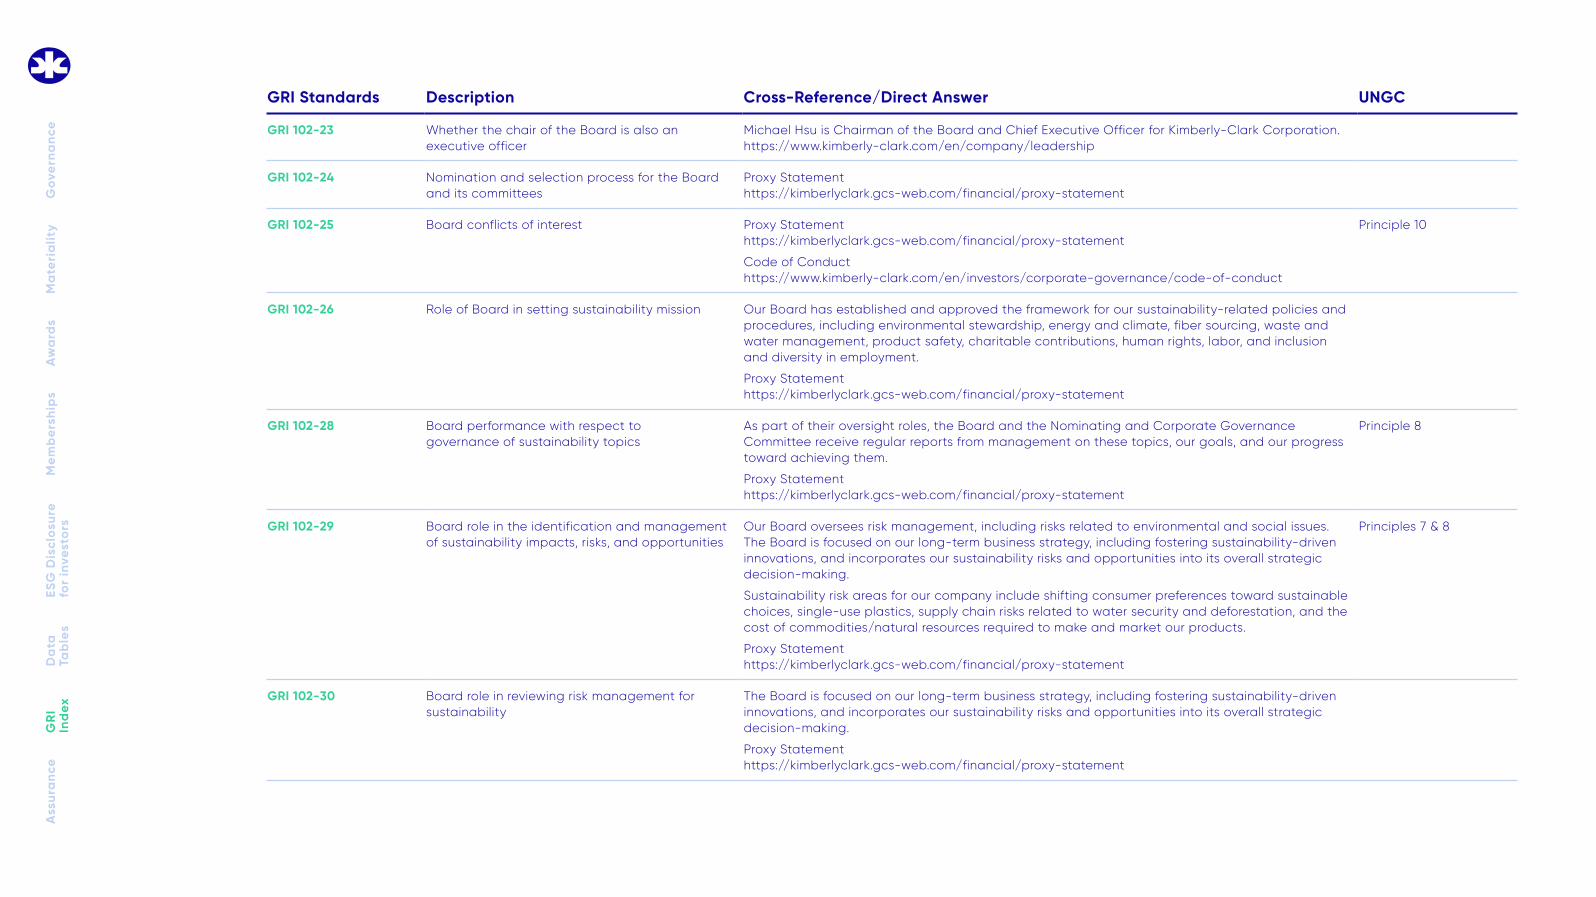
GRI 102-25 Board conflicts of interest Proxy Statement https://kimberlyclark.gcs-web.com/financial/proxy-statement
Code of Conduct https://www.kimberly-clark.com/en/investors/corporate-governance/code-of-conduct
Principle 10
GRI 102-26 Role of Board in setting sustainability mission Our Board has established and approved the framework for our sustainability-related policies and procedures, including environmental stewardship, energy and climate, fiber sourcing, waste and water management, product safety, charitable contributions, human rights, labor, and inclusion and diversity in employment.
GRI 102-28 Board performance with respect to governance of sustainability topics
As part of their oversight roles, the Board and the Nominating and Corporate Governance Committee receive regular reports from management on these topics, our goals, and our progress toward achieving them.
GRI 102-29 Board role in the identification and management of sustainability impacts, risks, and opportunities
Our Board oversees risk management, including risks related to environmental and social issues. The Board is focused on our long-term business strategy, including fostering sustainability-driven innovations, and incorporates our sustainability risks and opportunities into its overall strategic decision-making.
Sustainability risk areas for our company include shifting consumer preferences toward sustainable choices, single-use plastics, supply chain risks related to water security and deforestation, and the cost of commodities/natural resources required to make and market our products.
GRI 102-30 Board role in reviewing risk management for sustainability
The Board is focused on our long-term business strategy, including fostering sustainability-driven innovations, and incorporates our sustainability risks and opportunities into its overall strategic decision-making.
GRI 102-31 Frequency of the Board’s review of sustainability impacts, risks and opportunities
The Board and the Nominating and Corporate Governance Committee receive regular reports from management on key sustainability topics, our goals and our progress toward achieving them.
GRI 102-32 The highest committee or position that formally reviews and approves the organization’s sustainability report and ensures that all material topics are covered
CEO Mike Hsu
GRI 102-33 Process for communicating critical concerns to the Board
GRI 102-40 Stakeholder groups We engage with stakeholders in many ways on an ongoing basis—ranging from conducting customer and consumer research to engaging in dialogue and developing strategic partnerships with environmental and humanitarian organizations.
In addition, we communicate progress to the shareholder and investment communities through our Annual 10-K, through investor and shareholder meetings, at analyst-sponsored conferences, and through distribution of our sustainability reporting content.
Our key stakeholder groups include, but are not limited to:
• Investors
• NGOs
• Customers
• Consumers
• Employees
• Potential employees
• Suppliers
• Local communities
GRI 102-41 Collective bargaining agreements Approximately 26% of our manufacturing facility workforces are covered by collective bargaining agreements.
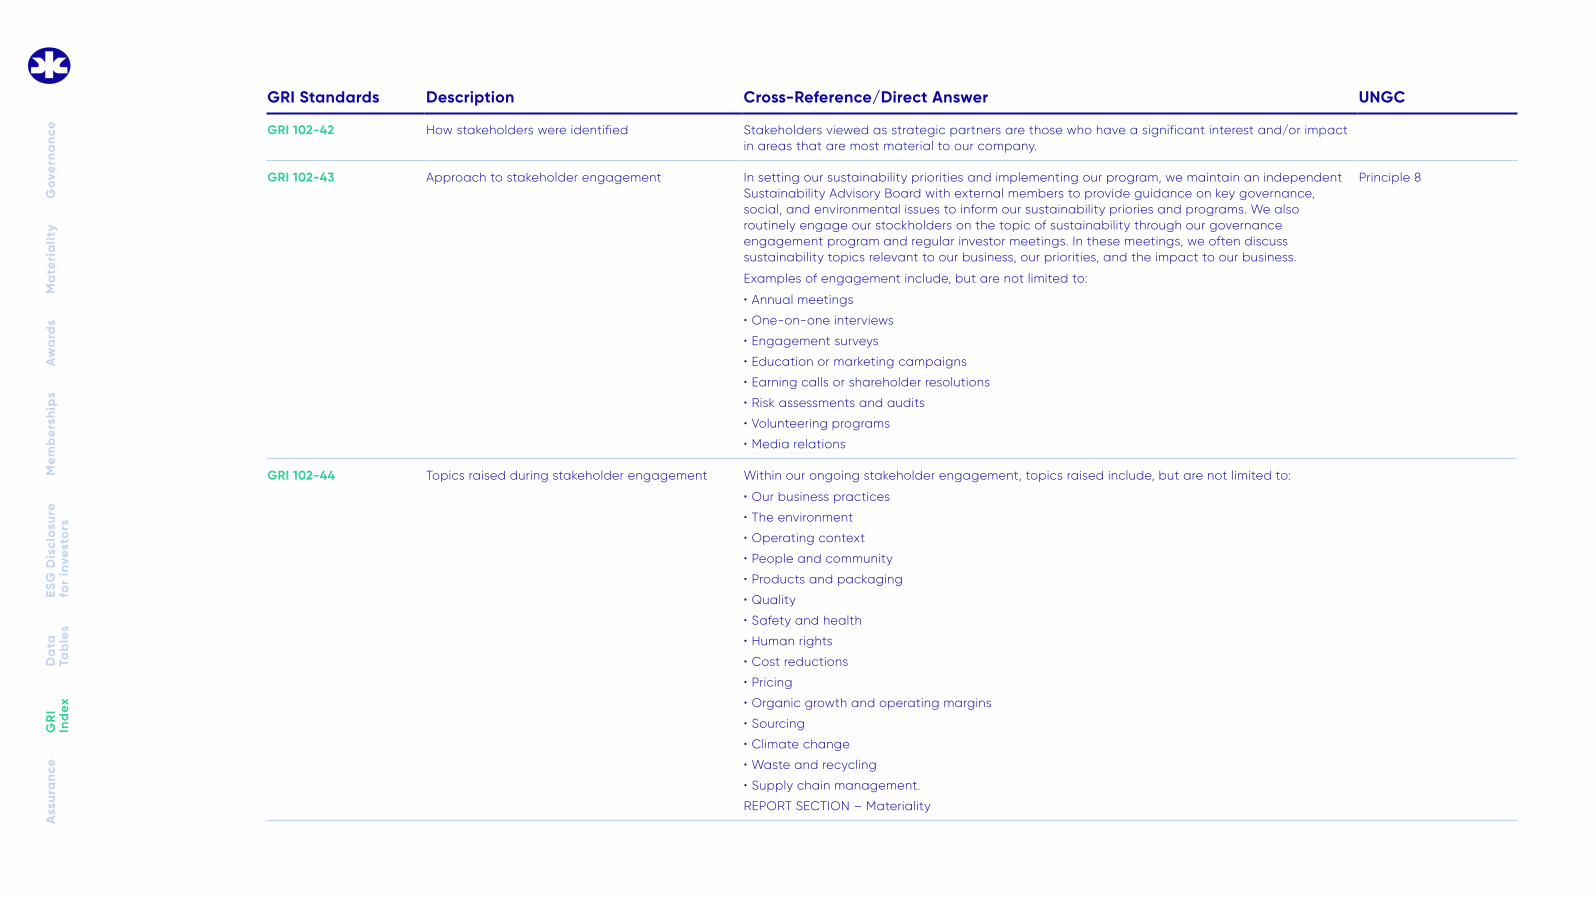
GRI 102-42 How stakeholders were identified Stakeholders viewed as strategic partners are those who have a significant interest and/or impact in areas that are most material to our company.
GRI 102-43 Approach to stakeholder engagement In setting our sustainability priorities and implementing our program, we maintain an independent Sustainability Advisory Board with external members to provide guidance on key governance, social, and environmental issues to inform our sustainability priories and programs. We also routinely engage our stockholders on the topic of sustainability through our governance engagement program and regular investor meetings. In these meetings, we often discuss sustainability topics relevant to our business, our priorities, and the impact to our business.
Examples of engagement include, but are not limited to:
• Annual meetings
• One-on-one interviews
• Engagement surveys
• Education or marketing campaigns
• Earning calls or shareholder resolutions
• Risk assessments and audits
• Volunteering programs
• Media relations
Principle 8
GRI 102-44 Topics raised during stakeholder engagement Within our ongoing stakeholder engagement, topics raised include, but are not limited to:
GRI 102-47 Material aspects included in the report REPORT SECTION – Our Strategy for the Decisive Decade
GRI 102-48 Restatements In 2020 we modified our formula for calculating percentage of waste diverted to more closely align with the UL Environment Zero Waste to Landfill standard as it relates to the consideration of Incineration Without Heat Recovery. As a result, we our updated landfill calculations.
In 2020, we were able to calculate the Scope 3 Category 4 - Upstream Transportation & Distribution GHG emissions data by mode of transportation going back to our 2015 base year. The methodology used to obtain the additional detailed data and the calculation for GHG emissions numbers were approved by WSP. As a result, we updated the 2015–2019 “Upstream Transportation & Distribution” MTCO2e GHG emissions in the “GHG Emissions Scope 3” table.
GRI 102-49 Changes from previous report in terms of scope and boundaries
No changes from previous report.
In 2019, we updated our materiality assessment to better reflect how the trends, risks, impacts, and opportunities that make up our operating environment around the world have changed. After retiring some topics that no longer felt relevant for our sustainability program and adding others that have recently risen on the agenda, we reflected on the changing priorities of our stakeholders and business. The priority topics that emerged include deforestation, ingredient transparency, single-use plastics, climate change, and water scarcity.
GRI 102-50 Reporting period January 1 – December 31, 2020
GRI 102-51 Date of most recent report July 8, 2020
GRI 102-54 Claims of reporting in accordance with GRI Standards
This report has been prepared in accordance with the Global Reporting Initiative (GRI) Sustainability Reporting Standards: Core option. In many cases, we go above and beyond the requirements of Core and include additional disclosures.
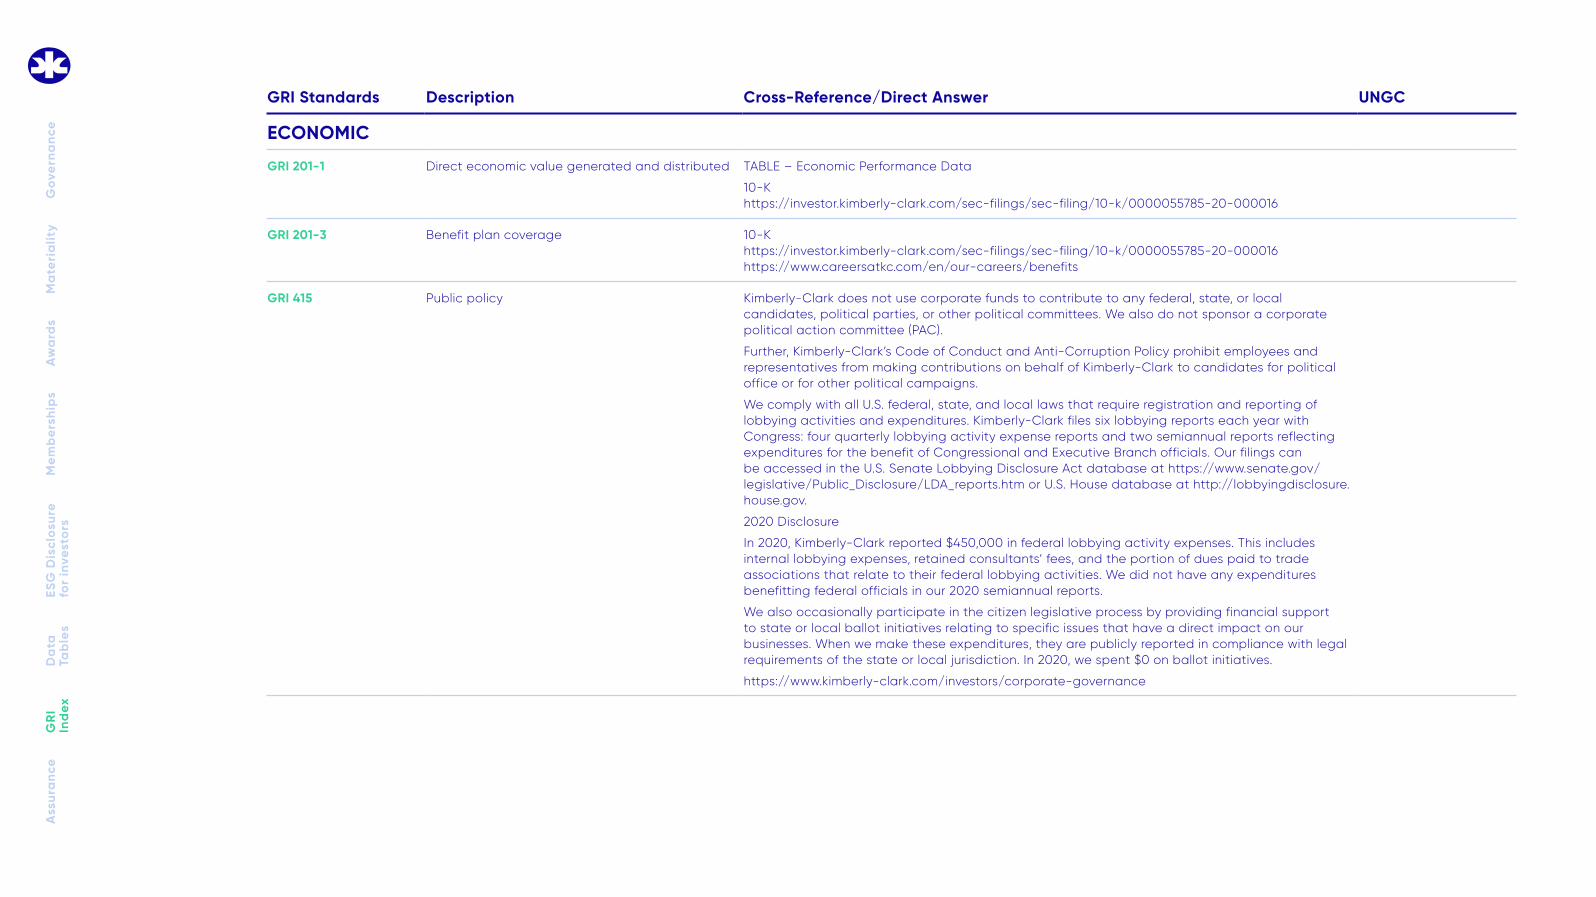
GRI 201-3 Benefit plan coverage 10-K https://investor.kimberly-clark.com/sec-filings/sec-filing/10-k/0000055785-20-000016 https://www.careersatkc.com/en/our-careers/benefits
GRI 415 Public policy Kimberly-Clark does not use corporate funds to contribute to any federal, state, or local candidates, political parties, or other political committees. We also do not sponsor a corporate political action committee (PAC).
Further, Kimberly-Clark’s Code of Conduct and Anti-Corruption Policy prohibit employees and representatives from making contributions on behalf of Kimberly-Clark to candidates for political office or for other political campaigns.
We comply with all U.S. federal, state, and local laws that require registration and reporting of lobbying activities and expenditures. Kimberly-Clark files six lobbying reports each year with Congress: four quarterly lobbying activity expense reports and two semiannual reports reflecting expenditures for the benefit of Congressional and Executive Branch officials. Our filings can be accessed in the U.S. Senate Lobbying Disclosure Act database at https://www.senate.gov/legislative/Public_Disclosure/LDA_reports.htm or U.S. House database at http://lobbyingdisclosure.house.gov.
2020 Disclosure
In 2020, Kimberly-Clark reported $450,000 in federal lobbying activity expenses. This includes internal lobbying expenses, retained consultants’ fees, and the portion of dues paid to trade associations that relate to their federal lobbying activities. We did not have any expenditures benefitting federal officials in our 2020 semiannual reports.
We also occasionally participate in the citizen legislative process by providing financial support to state or local ballot initiatives relating to specific issues that have a direct impact on our businesses. When we make these expenditures, they are publicly reported in compliance with legal requirements of the state or local jurisdiction. In 2020, we spent $0 on ballot initiatives.
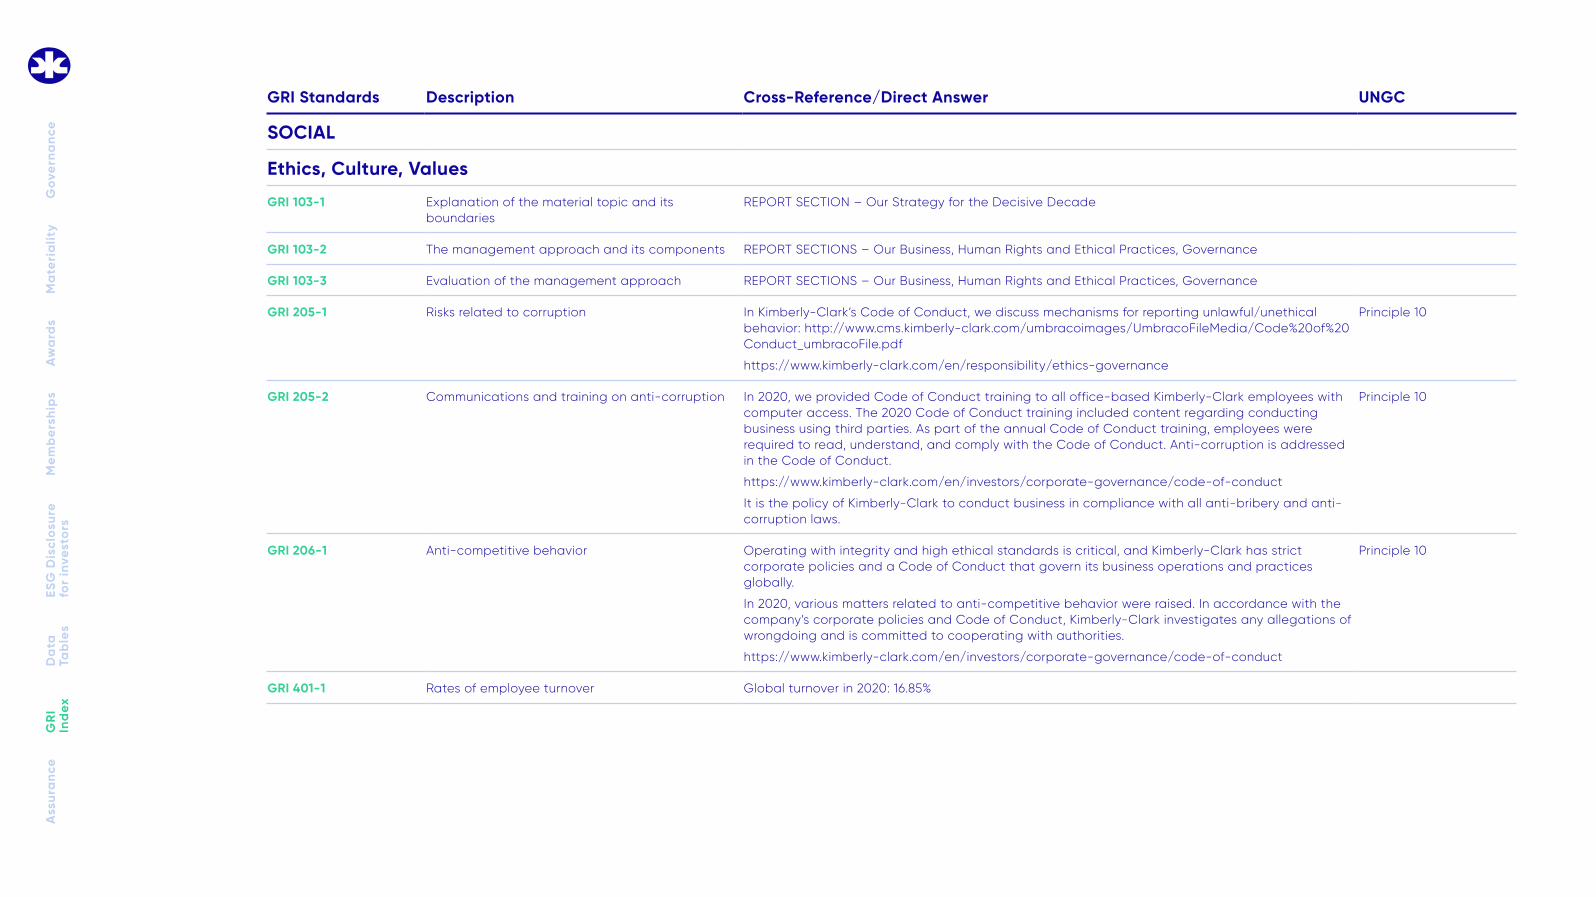
GRI 103-1 Explanation of the material topic and its boundaries
REPORT SECTION – Our Strategy for the Decisive Decade
GRI 103-2 The management approach and its components REPORT SECTION – Carbon Footprint
GRI 103-3 Evaluation of the management approach REPORT SECTION – Carbon Footprint
GRI 201-2 Financial implications and other risks and opportunities due to climate change
Kimberly-Clark deploys a targeted approach to address financial implications/risks and opportunities related to climate change throughout our global supply chain.
REPORT SECTION – Carbon Footprint
REPORT ADDENDUM SECTION – ESG Disclosures for Investors
GRI 305-7 Nitrogen oxides (NOX), sulfur oxides (SOX) and other significant air emissions
TABLE – Other Criteria Pollutants
GRI 308-1 New suppliers screened using environmental criteria
Kimberly-Clark deploys a targeted approach to addressing environmental impacts in our supply chain both at the initial sourcing and ongoing category management periods. These approaches include, but are not limited to:
• Kimberly-Clark’s Supplier portal provides a listing of applicable standards and requirements for raw materials and social responsibility. [https://www.kimberly-clark.com/en/company/supplier-link/standards-and-requirements]
• Fiber-based packaging suppliers must report their ongoing use of recycled and responsibly sourced fiber.
• Contract manufacturing & branded packaging suppliers are subject to periodic social compliance audits administered by our Corporate Social Compliance program.
• Contract manufacturers are reviewed through a thorough, multi-category due diligence process including environmental factors.
• Risk assessments are performed for existing suppliers on a multi-disciplinary basis, including for environmental and social sustainability risk factors.
GRI 308-2 Supply chain environmental impacts Kimberly-Clark deploys a targeted approach to addressing environmental impacts in our supply chain both during the initial sourcing and ongoing category management periods. These approaches include, but are not limited to:
• Kimberly-Clark’s Supplier portal provides a listing of applicable standards and requirements for raw materials and social responsibility. [https://www.kimberly-clark.com/en/company/supplier-link/standards-and-requirements]
• Fiber-based packaging suppliers must report their ongoing use of recycled and responsibly sourced fiber.
• Contract manufacturing & branded packaging suppliers are subject to periodic social compliance audits administered by our Corporate Social Compliance program.
• Contract manufacturers are reviewed through a thorough, multi-category due diligence process including environmental factors.
• Risk assessments are performed for existing suppliers on a multi-disciplinary basis, including for environmental and social sustainability risk factors.
GRI 103-1 Explanation of the material topic and its boundaries
REPORT SECTION – Our Strategy for the Decisive Decade
GRI 103-2 The management approach and its components REPORT SECTIONS – Our Business, Human Rights and Ethical Practices, Governance
GRI 103-3 Evaluation of the management approach REPORT SECTIONS – Our Business, Human Rights and Ethical Practices, Governance
GRI 205-1 Risks related to corruption In Kimberly-Clark’s Code of Conduct, we discuss mechanisms for reporting unlawful/unethical behavior: http://www.cms.kimberly-clark.com/umbracoimages/UmbracoFileMedia/Code%20of%20Conduct_umbracoFile.pdf
GRI 205-2 Communications and training on anti-corruption In 2020, we provided Code of Conduct training to all office-based Kimberly-Clark employees with computer access. The 2020 Code of Conduct training included content regarding conducting business using third parties. As part of the annual Code of Conduct training, employees were required to read, understand, and comply with the Code of Conduct. Anti-corruption is addressed in the Code of Conduct.
It is the policy of Kimberly-Clark to conduct business in compliance with all anti-bribery and anti-corruption laws.
Principle 10
GRI 206-1 Anti-competitive behavior Operating with integrity and high ethical standards is critical, and Kimberly-Clark has strict corporate policies and a Code of Conduct that govern its business operations and practices globally.
In 2020, various matters related to anti-competitive behavior were raised. In accordance with the company’s corporate policies and Code of Conduct, Kimberly-Clark investigates any allegations of wrongdoing and is committed to cooperating with authorities.
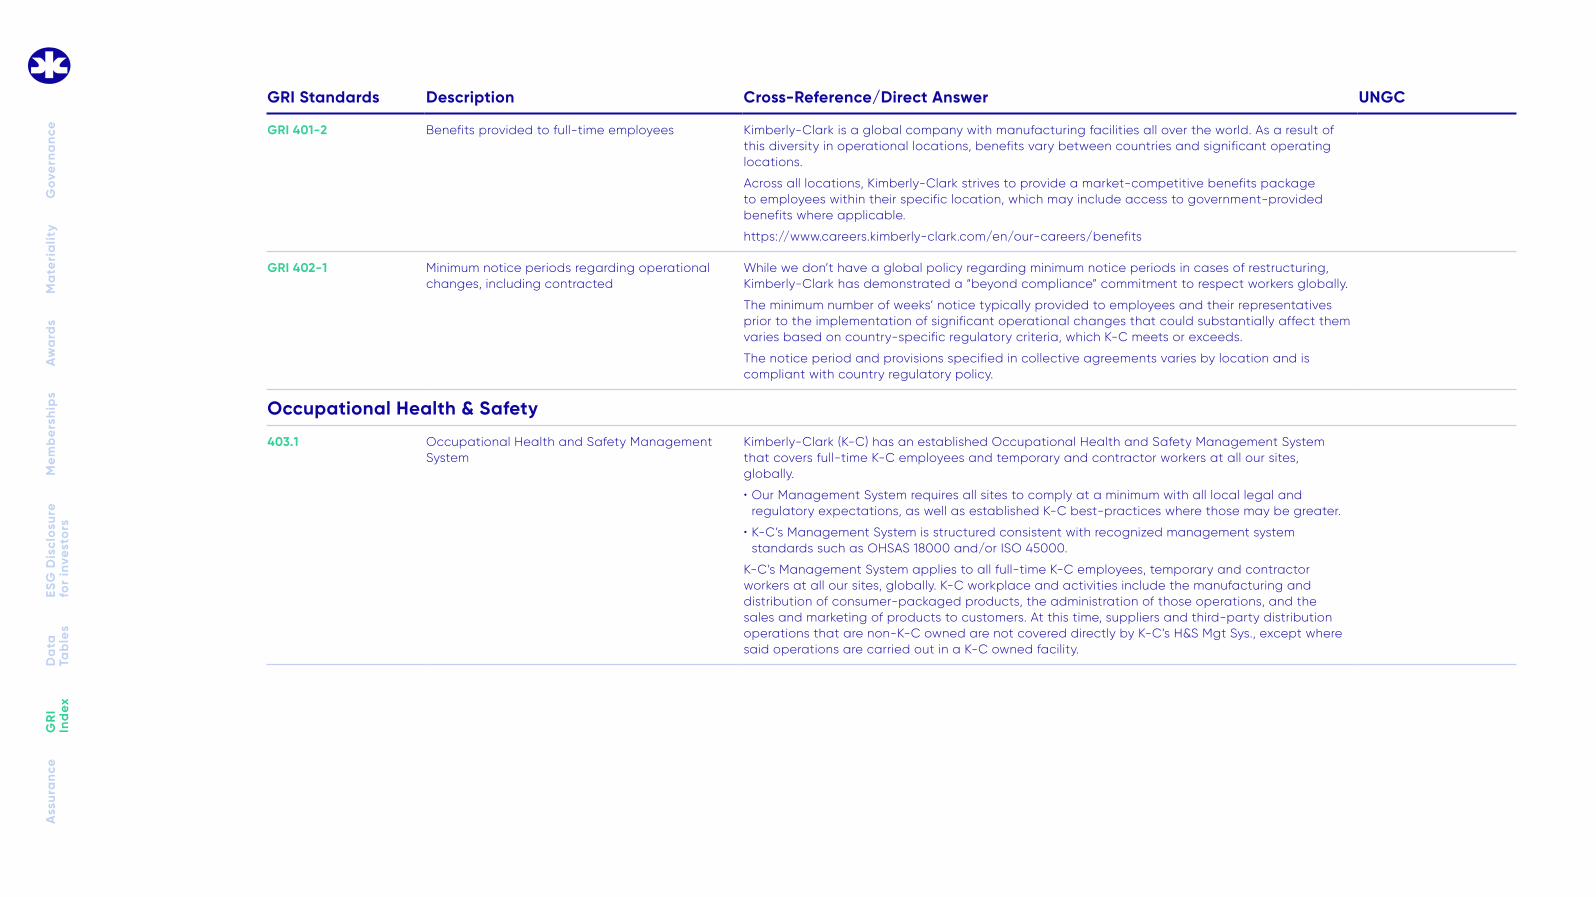
GRI 401-2 Benefits provided to full-time employees Kimberly-Clark is a global company with manufacturing facilities all over the world. As a result of this diversity in operational locations, benefits vary between countries and significant operating locations.
Across all locations, Kimberly-Clark strives to provide a market-competitive benefits package to employees within their specific location, which may include access to government-provided benefits where applicable.
GRI 402-1 Minimum notice periods regarding operational changes, including contracted
While we don’t have a global policy regarding minimum notice periods in cases of restructuring, Kimberly-Clark has demonstrated a “beyond compliance” commitment to respect workers globally.
The minimum number of weeks’ notice typically provided to employees and their representatives prior to the implementation of significant operational changes that could substantially affect them varies based on country-specific regulatory criteria, which K-C meets or exceeds.
The notice period and provisions specified in collective agreements varies by location and is compliant with country regulatory policy.
Occupational Health & Safety
403.1 Occupational Health and Safety Management System
Kimberly-Clark (K-C) has an established Occupational Health and Safety Management System that covers full-time K-C employees and temporary and contractor workers at all our sites, globally.
• Our Management System requires all sites to comply at a minimum with all local legal and regulatory expectations, as well as established K-C best-practices where those may be greater.
• K-C’s Management System is structured consistent with recognized management system standards such as OHSAS 18000 and/or ISO 45000.
K-C’s Management System applies to all full-time K-C employees, temporary and contractor workers at all our sites, globally. K-C workplace and activities include the manufacturing and distribution of consumer-packaged products, the administration of those operations, and the sales and marketing of products to customers. At this time, suppliers and third-party distribution operations that are non-K-C owned are not covered directly by K-C’s H&S Mgt Sys., except where said operations are carried out in a K-C owned facility.
403.2 Hazard identification, risk assessment and incident investigation
K-C’s management system requires a Risk Inventory to be developed and maintained that includes safety hazards/regulatory requirements, associated risks, documented controls following the hierarchy of controls, management of change process and an overall risk reduction/improvement plan.
• The quality of the Risk Inventory and associated components is assessed through a combination of the Management System self-assessment process along with a diagnostic governance/assurance process.
• The outcomes of both the Management System self-assessment & the diagnostic governance/assurance processes are used to determine the level of risk reduction achieved.
K-C expects all employees and temporary and contract workers to report all workplace injuries, illnesses, and hazards. The reporting process typically includes an electronic tool that enables teams to investigate and follow-up on reported events. By K-C’s Code of Conduct, retaliation is not tolerated against anyone who raises any type of health or safety concern in good faith or who cooperates in a review. Individuals engaging in this type of retaliatory conduct will be subject to disciplinary action. (Compliance Helpline Reporting Policy)
All K-C employees and temporary and contract workers are expected to follow and comply with K-C’s 3 Safety Obligations. K-C does not tolerate retaliation against anyone who raises any type of health or safety concern in good faith or who cooperates in a review. Individuals engaging in this type of retaliatory conduct will be subject to disciplinary action. (Compliance Helpline Reporting Policy)
Incident investigations utilizing a recognized Root Cause Analysis (RCA) process must be completed for all work-related fatalities, permanent/temporary injuries and illnesses, and reportable injuries and illnesses. The outcomes of the RCA are used to develop corrective actions leveraging the hierarchy of controls to prevent reoccurrence of similar events.
403.3 Occupational Health Services As part of Kimberly-Clark's Occupational Health and Safety Management System, we have specific performance standards to address Occupational Health and Industrial Hygiene exposure in the workplace. Our performance Standards set out minimum compliance expectations, as well as expectations for the identification, elimination, and management of those exposure risks.
In addition to performance Standards that drive the reduction in Occupational Health Exposures, Kimberly Clark conducts routine Medical surveillance for employees who are considered at risk of exposure to health hazards. These surveillance activities are conducted consistently with local regulations and aim to identify any changes in key employee health metrics, ensuring there is no deterioration in health associated with Industrial Hygiene and process system exposure.
These services are provided through qualified on-site Occupational health professionals, either directly employed by Kimberly Clark, or provided through third-party services on-site or off-site.
Employee Health data is maintained consistent with all data privacy laws (HIPPA, GDPS) and is retained and destroyed consistent with K-C’s data privacy policies.
At a local (country) level, and consistent with local regulations, Qualified Occupational Health staff (both K-C direct and third-party) use data and trends to ensure on-going conservation of employee health, and to inform improvement activities in Industrial Hygiene Risk reduction and elimination.
403.4 Worker participation, consultation, and communication on occupational health and safety
At Kimberly-Clark we have a combination of trade union and works council agreements that range from local to global. Health & Safety is a common topic in these agreements, and subject to negotiation, consultation, or information sharing depending on country. Typical subjects in these agreements involve H&S standards, training, PPE, hazard and incident reporting, risk assessment, worker participation, problem solving, and investigations. Trade unions, works councils, employee representatives, and other joint committees are also commonly engaged in these programs as well as audits. Frequency of meetings and employee communications varies by location and agreement, and typically includes the organization’s performance on health and safety.
403.5 Worker training on occupational health and safety
K-C’s management system requires health and safety awareness training in regard to policies, risks, regulatory requirements, employee’s and worker’s role in contributing to safe work environment and the implications for not conforming to safety rule and procedures/practices. Furthermore K-C’s management system requires a documented training program that includes a training needs assessment that is used to identify and address key health & safety training required for K-C employees, temporary workers, and contract workers. Training specific to the employee, temporary worker, and/or contract worker’s job duties includes controls for managing health & safety risks, standard operating procedures, and emergency response.
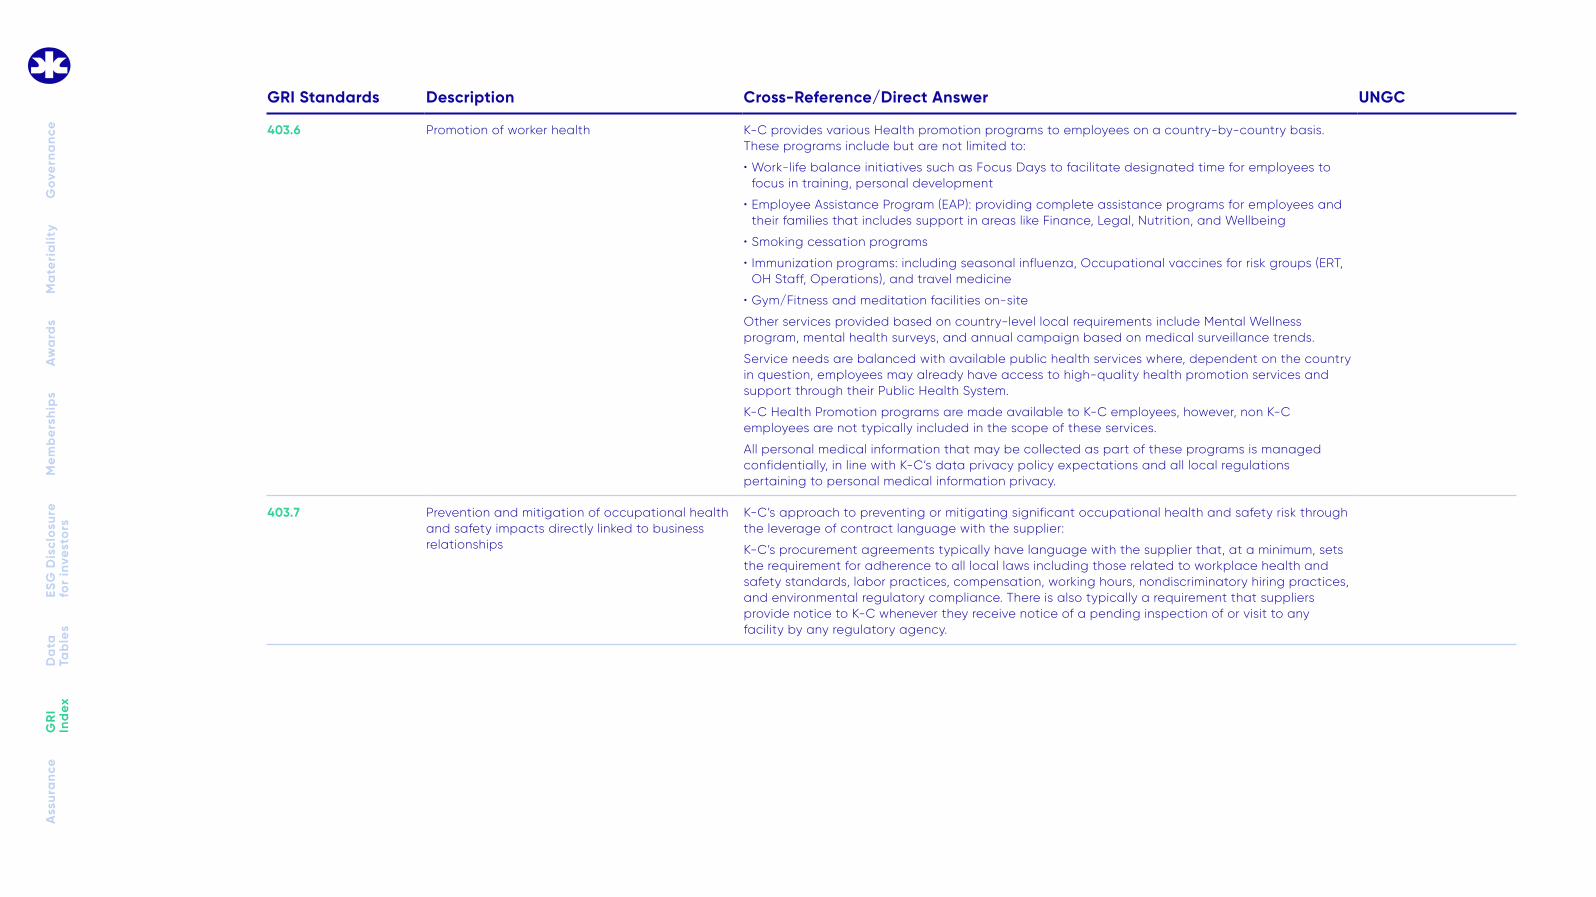
403.6 Promotion of worker health K-C provides various Health promotion programs to employees on a country-by-country basis. These programs include but are not limited to:
• Work-life balance initiatives such as Focus Days to facilitate designated time for employees to focus in training, personal development
• Employee Assistance Program (EAP): providing complete assistance programs for employees and their families that includes support in areas like Finance, Legal, Nutrition, and Wellbeing
• Smoking cessation programs
• Immunization programs: including seasonal influenza, Occupational vaccines for risk groups (ERT, OH Staff, Operations), and travel medicine
• Gym/Fitness and meditation facilities on-site
Other services provided based on country-level local requirements include Mental Wellness program, mental health surveys, and annual campaign based on medical surveillance trends.
Service needs are balanced with available public health services where, dependent on the country in question, employees may already have access to high-quality health promotion services and support through their Public Health System.
K-C Health Promotion programs are made available to K-C employees, however, non K-C employees are not typically included in the scope of these services.
All personal medical information that may be collected as part of these programs is managed confidentially, in line with K-C’s data privacy policy expectations and all local regulations pertaining to personal medical information privacy.
403.7 Prevention and mitigation of occupational health and safety impacts directly linked to business relationships
K-C’s approach to preventing or mitigating significant occupational health and safety risk through the leverage of contract language with the supplier:
K-C’s procurement agreements typically have language with the supplier that, at a minimum, sets the requirement for adherence to all local laws including those related to workplace health and safety standards, labor practices, compensation, working hours, nondiscriminatory hiring practices, and environmental regulatory compliance. There is also typically a requirement that suppliers provide notice to K-C whenever they receive notice of a pending inspection of or visit to any facility by any regulatory agency.
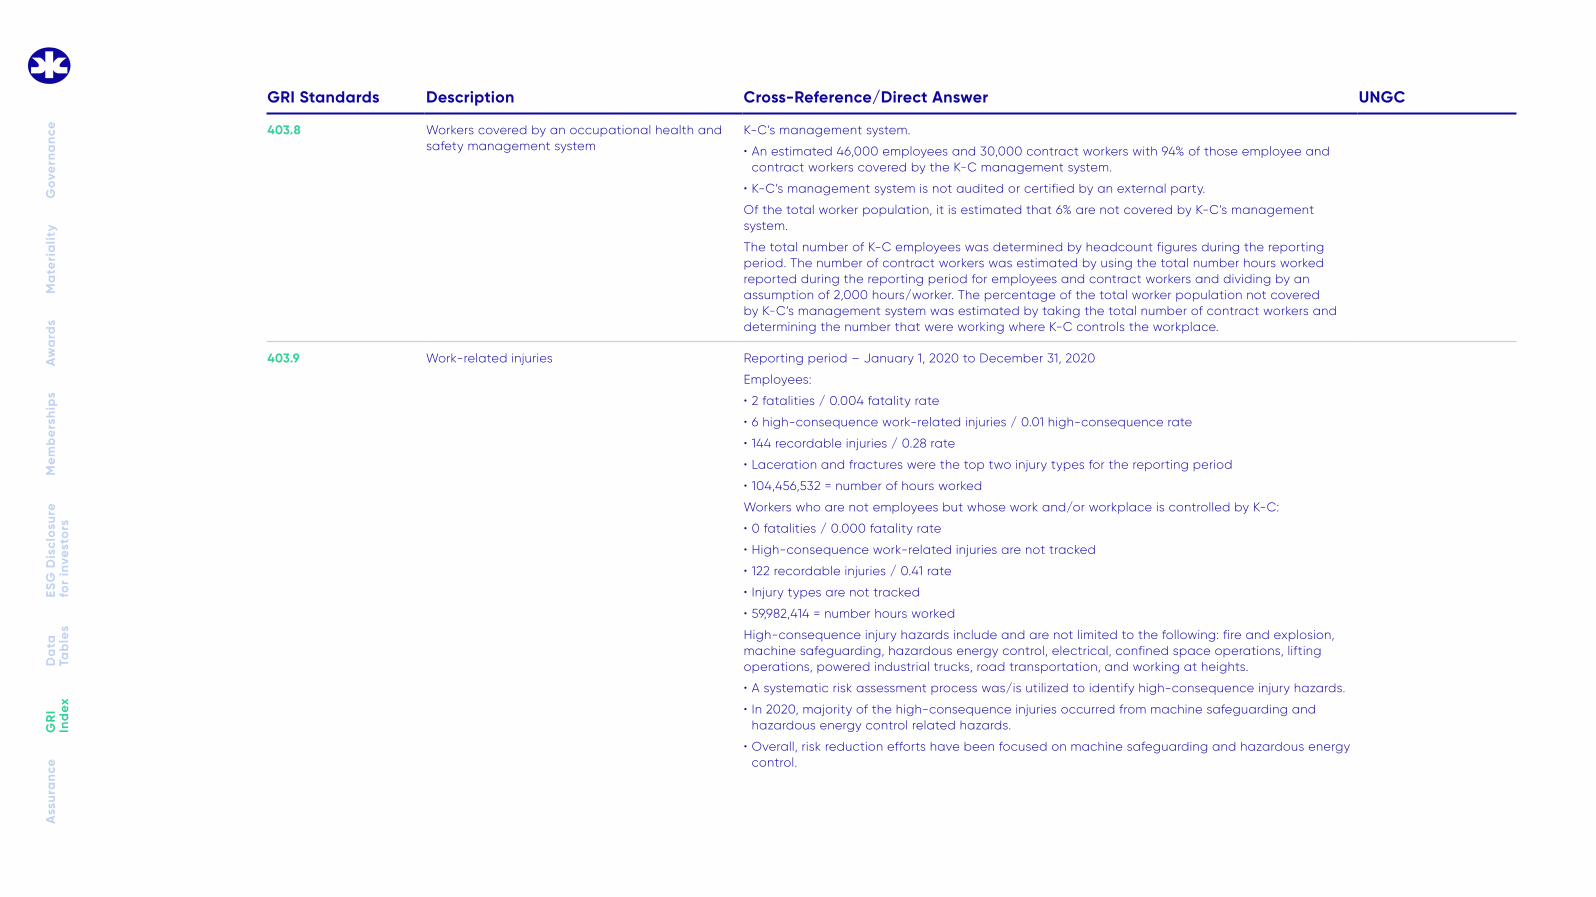
403.8 Workers covered by an occupational health and safety management system
K-C’s management system.
• An estimated 46,000 employees and 30,000 contract workers with 94% of those employee and contract workers covered by the K-C management system.
• K-C’s management system is not audited or certified by an external party.
Of the total worker population, it is estimated that 6% are not covered by K-C’s management system.
The total number of K-C employees was determined by headcount figures during the reporting period. The number of contract workers was estimated by using the total number hours worked reported during the reporting period for employees and contract workers and dividing by an assumption of 2,000 hours/worker. The percentage of the total worker population not covered by K-C’s management system was estimated by taking the total number of contract workers and determining the number that were working where K-C controls the workplace.
403.9 Work-related injuries Reporting period – January 1, 2020 to December 31, 2020
• Laceration and fractures were the top two injury types for the reporting period
• 104,456,532 = number of hours worked
Workers who are not employees but whose work and/or workplace is controlled by K-C:
• 0 fatalities / 0.000 fatality rate
• High-consequence work-related injuries are not tracked
• 122 recordable injuries / 0.41 rate
• Injury types are not tracked
• 59,982,414 = number hours worked
High-consequence injury hazards include and are not limited to the following: fire and explosion, machine safeguarding, hazardous energy control, electrical, confined space operations, lifting operations, powered industrial trucks, road transportation, and working at heights.
• A systematic risk assessment process was/is utilized to identify high-consequence injury hazards.
• In 2020, majority of the high-consequence injuries occurred from machine safeguarding and hazardous energy control related hazards.
• Overall, risk reduction efforts have been focused on machine safeguarding and hazardous energy control.
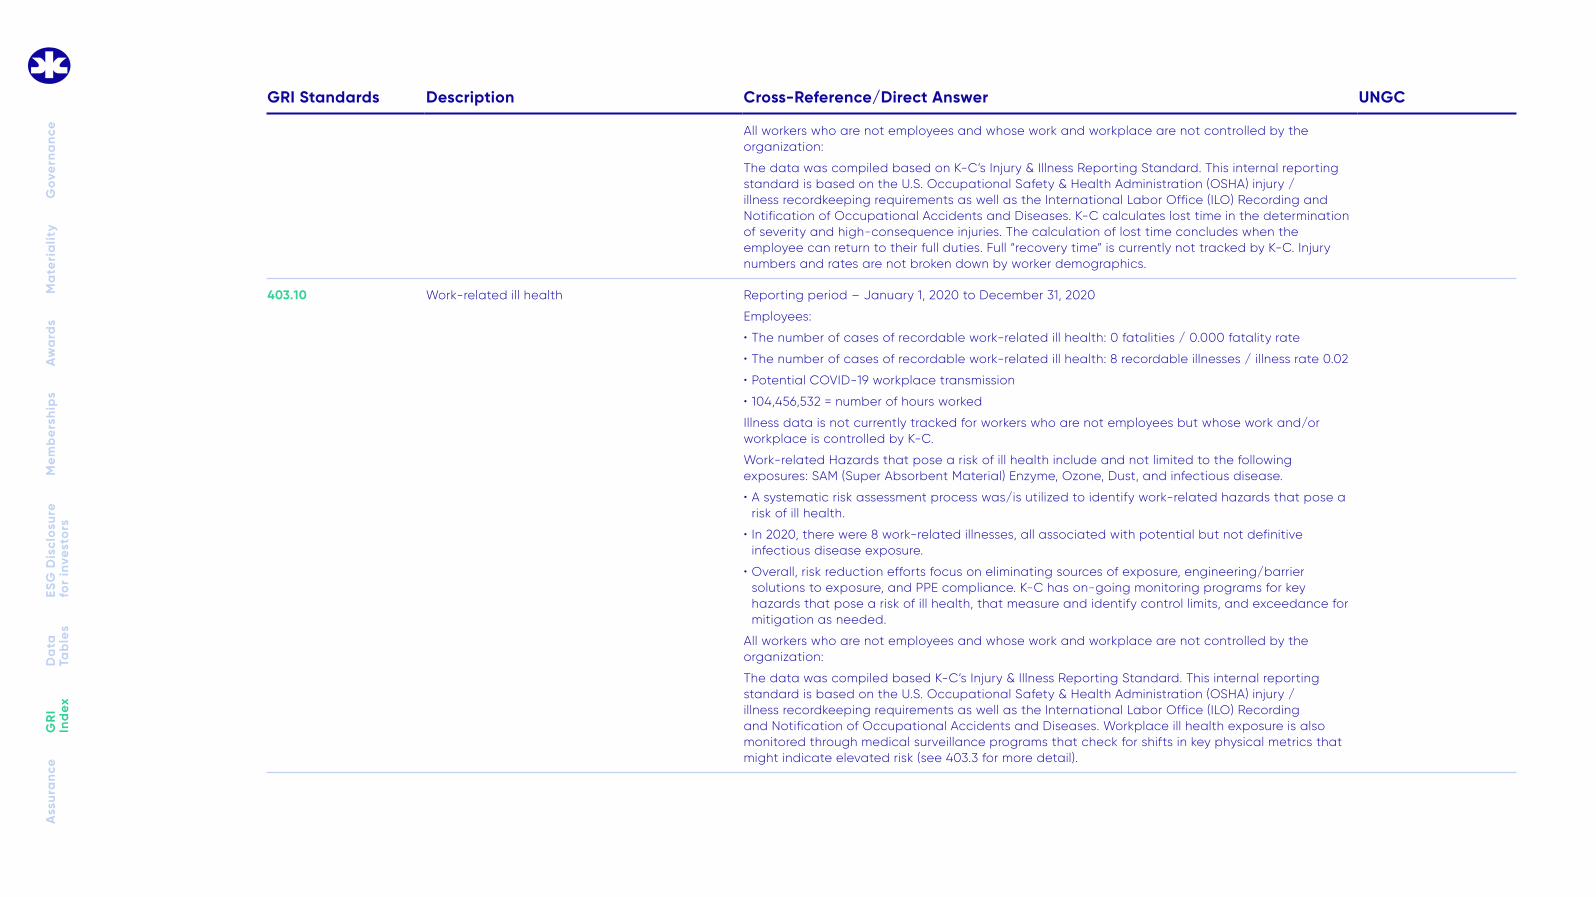
All workers who are not employees and whose work and workplace are not controlled by the organization:
The data was compiled based on K-C’s Injury & Illness Reporting Standard. This internal reporting standard is based on the U.S. Occupational Safety & Health Administration (OSHA) injury / illness recordkeeping requirements as well as the International Labor Office (ILO) Recording and Notification of Occupational Accidents and Diseases. K-C calculates lost time in the determination of severity and high-consequence injuries. The calculation of lost time concludes when the employee can return to their full duties. Full “recovery time” is currently not tracked by K-C. Injury numbers and rates are not broken down by worker demographics.
403.10 Work-related ill health Reporting period – January 1, 2020 to December 31, 2020
Employees:
• The number of cases of recordable work-related ill health: 0 fatalities / 0.000 fatality rate
• The number of cases of recordable work-related ill health: 8 recordable illnesses / illness rate 0.02
• Potential COVID-19 workplace transmission
• 104,456,532 = number of hours worked
Illness data is not currently tracked for workers who are not employees but whose work and/or workplace is controlled by K-C.
Work-related Hazards that pose a risk of ill health include and not limited to the following exposures: SAM (Super Absorbent Material) Enzyme, Ozone, Dust, and infectious disease.
• A systematic risk assessment process was/is utilized to identify work-related hazards that pose a risk of ill health.
• In 2020, there were 8 work-related illnesses, all associated with potential but not definitive infectious disease exposure.
• Overall, risk reduction efforts focus on eliminating sources of exposure, engineering/barrier solutions to exposure, and PPE compliance. K-C has on-going monitoring programs for key hazards that pose a risk of ill health, that measure and identify control limits, and exceedance for mitigation as needed.
All workers who are not employees and whose work and workplace are not controlled by the organization:
The data was compiled based K-C’s Injury & Illness Reporting Standard. This internal reporting standard is based on the U.S. Occupational Safety & Health Administration (OSHA) injury / illness recordkeeping requirements as well as the International Labor Office (ILO) Recording and Notification of Occupational Accidents and Diseases. Workplace ill health exposure is also monitored through medical surveillance programs that check for shifts in key physical metrics that might indicate elevated risk (see 403.3 for more detail).
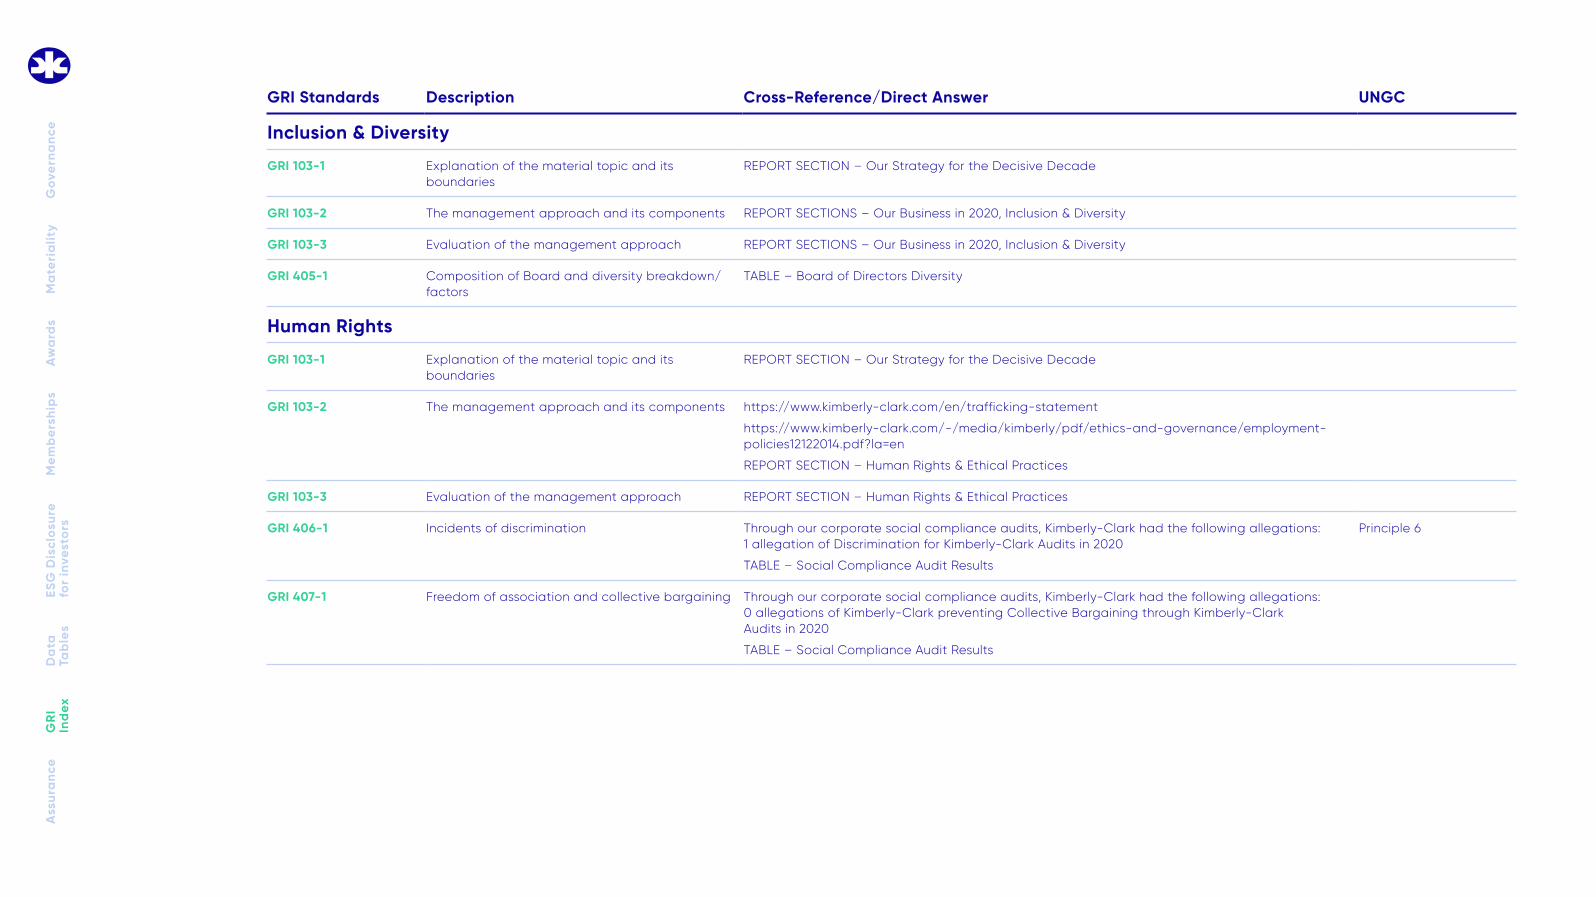
GRI 103-3 Evaluation of the management approach REPORT SECTION – Human Rights & Ethical Practices
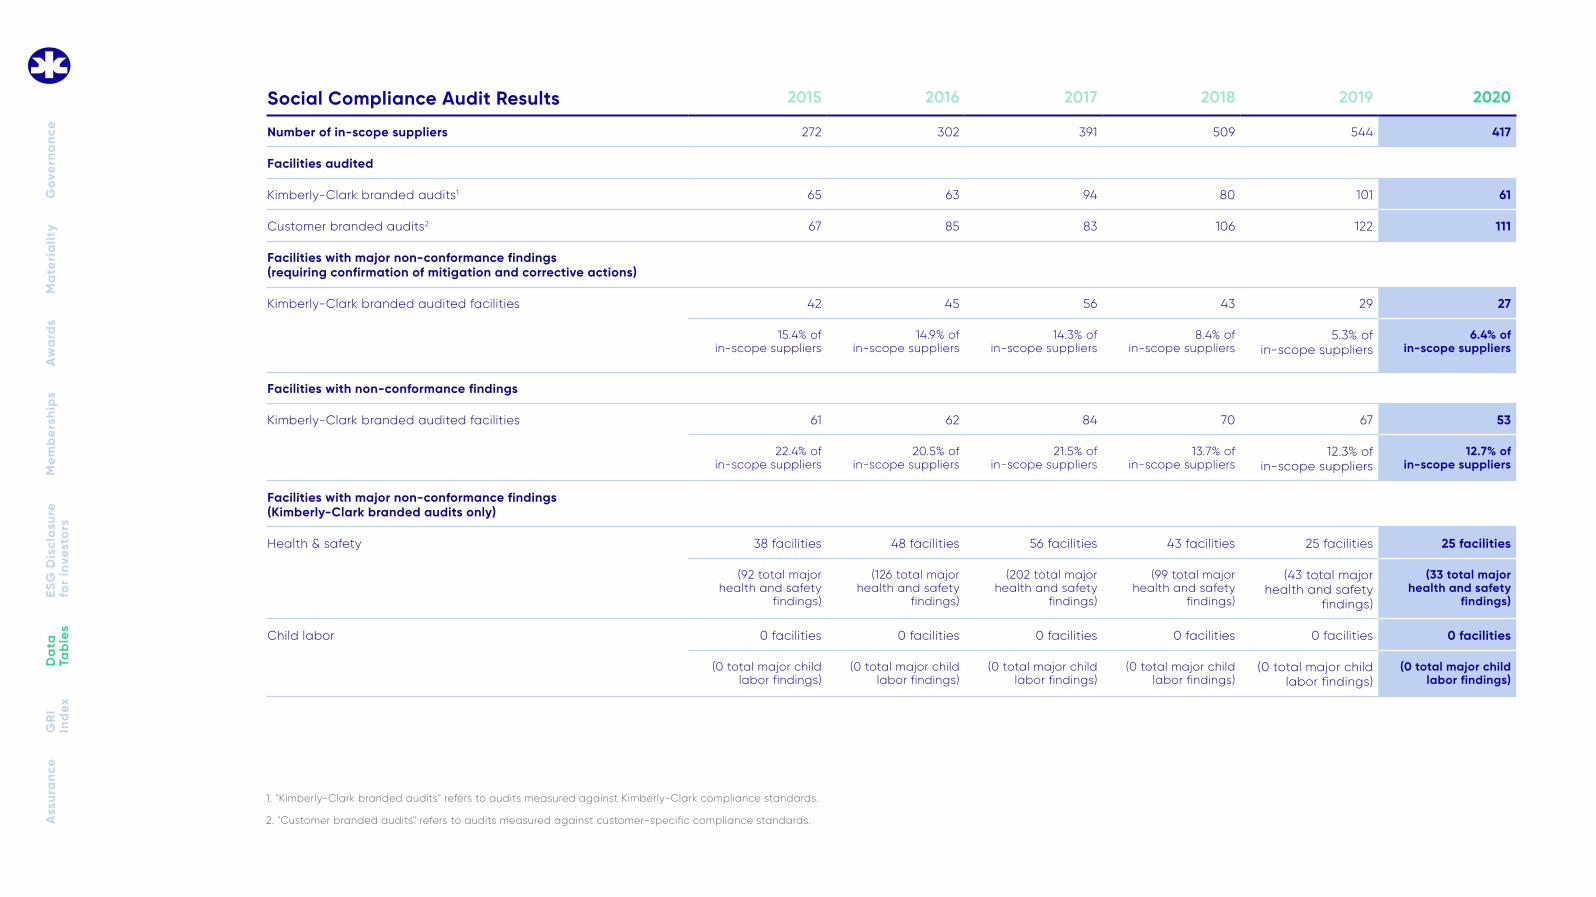
GRI 406-1 Incidents of discrimination Through our corporate social compliance audits, Kimberly-Clark had the following allegations: 1 allegation of Discrimination for Kimberly-Clark Audits in 2020
TABLE – Social Compliance Audit Results
Principle 6
GRI 407-1 Freedom of association and collective bargaining Through our corporate social compliance audits, Kimberly-Clark had the following allegations: 0 allegations of Kimberly-Clark preventing Collective Bargaining through Kimberly-Clark Audits in 2020
GRI 408-1 Child labor Through our Corporate Social Compliance Audits, Kimberly-Clark had the following allegations:
0 incidences of child labor within supply chain
Kimberly-Clark has systems in place to:
• Identify and monitor potential human rights risks in our operations and supply chain
• Mitigate the risk of modern slavery occurring in our supply chains
• Provide access and grievance mechanisms without fear of retaliation
Kimberly-Clark provides basic training on human trafficking and forced labor for employees and managers with direct responsibility for our supply chain. This training includes a strong focus on identifying and mitigating risks.
Principles 1, 2 & 5
GRI 409-1 Forced or compulsory labor TABLE – Social Compliance Audit Results Principles 1, 2 & 4
GRI 410-1 Security personnel trained in the organization’s human rights policies
Kimberly-Clark employees, including those security personnel who are Kimberly-Clark employees, receive Code of Conduct training which includes instructions on Kimberly-Clark’s Human Rights policies. https://www.kimberly-clark.com/en/responsibility/ethics-governance
Principles 1 & 2
GRI 411-1 Incidents of violations involving rights of indigenous peoples
We know of no incidents involving rights of indigenous peoples. Principles 1 & 2
GRI 412-1 Operations that have been subject to human rights assessments
We conducted corporate social compliance audits in 27 countries in 2020. Principles 1, 2, 4 & 5
GRI 412-2 Employee training on human rights Kimberly-Clark provides basic training on human trafficking and forced labor for employees and managers with direct responsibility for our supply chain. This training includes a strong focus on identifying and mitigating risks.
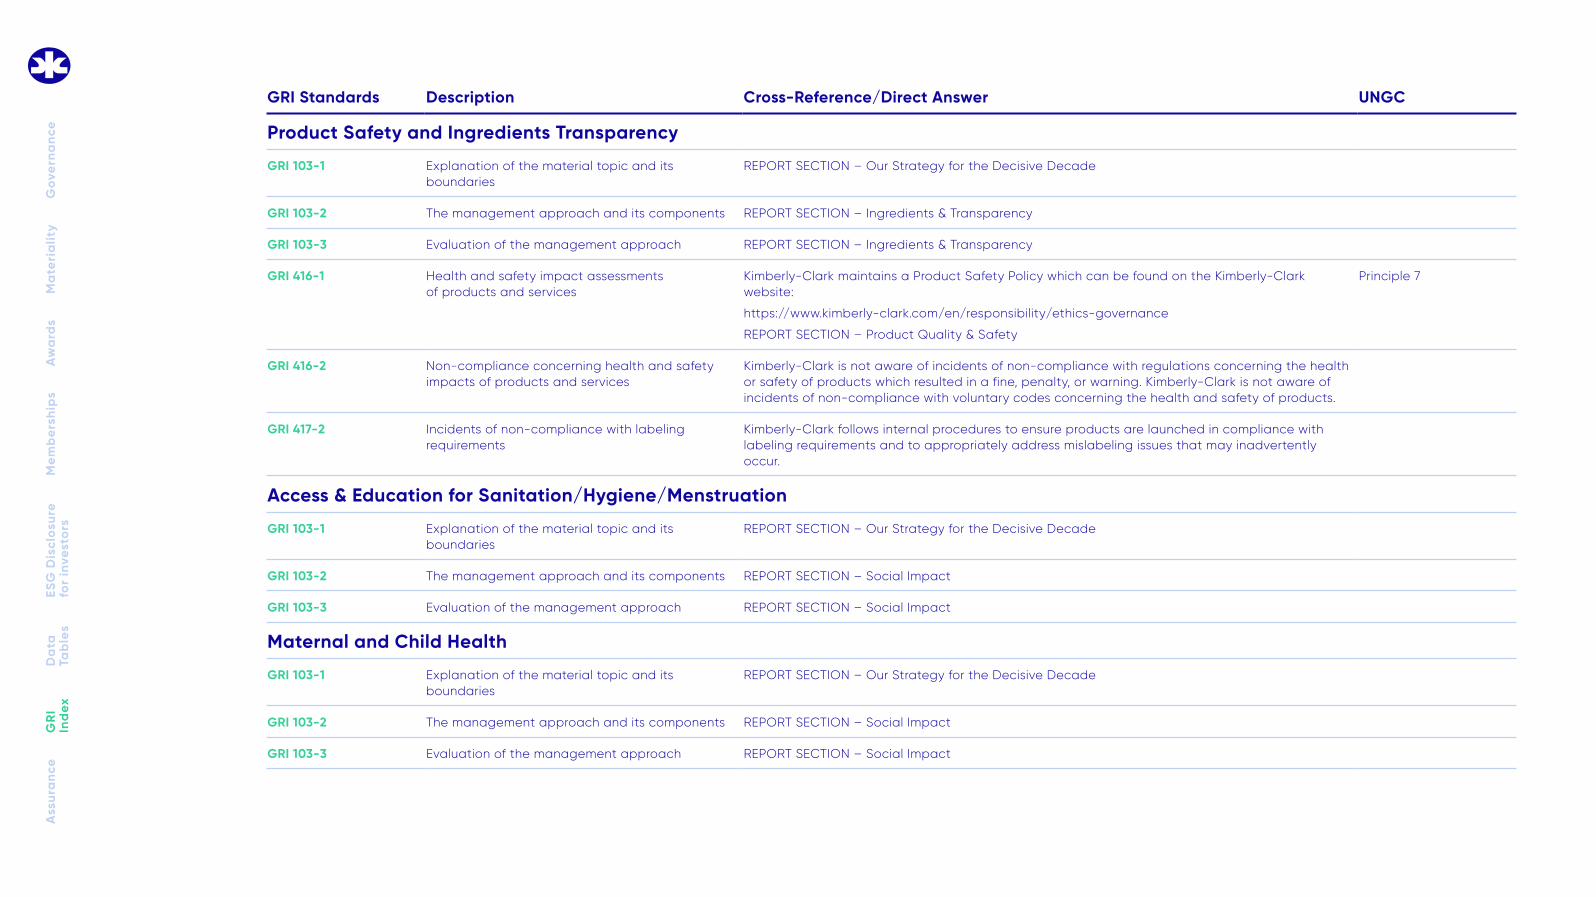
GRI 416-2 Non-compliance concerning health and safety impacts of products and services
Kimberly-Clark is not aware of incidents of non-compliance with regulations concerning the health or safety of products which resulted in a fine, penalty, or warning. Kimberly-Clark is not aware of incidents of non-compliance with voluntary codes concerning the health and safety of products.
GRI 417-2 Incidents of non-compliance with labeling requirements
Kimberly-Clark follows internal procedures to ensure products are launched in compliance with labeling requirements and to appropriately address mislabeling issues that may inadvertently occur.
Access & Education for Sanitation/Hygiene/Menstruation
GRI 103-1 Explanation of the material topic and its boundaries
REPORT SECTION – Our Strategy for the Decisive Decade
GRI 103-2 The management approach and its components REPORT SECTION – Social Impact
GRI 103-3 Evaluation of the management approach REPORT SECTION – Social Impact
Maternal and Child Health
GRI 103-1 Explanation of the material topic and its boundaries
REPORT SECTION – Our Strategy for the Decisive Decade
GRI 103-2 The management approach and its components REPORT SECTION – Social Impact
GRI 103-3 Evaluation of the management approach REPORT SECTION – Social Impact
Supporting Documents Reviewed GHG Scope 1, 2, and 3 Inventory activity data and calculations in SoFi
Energy purchasing data, spend data, product transportation data, waste and water inventory and invoice data, production volumes and investment allocations.
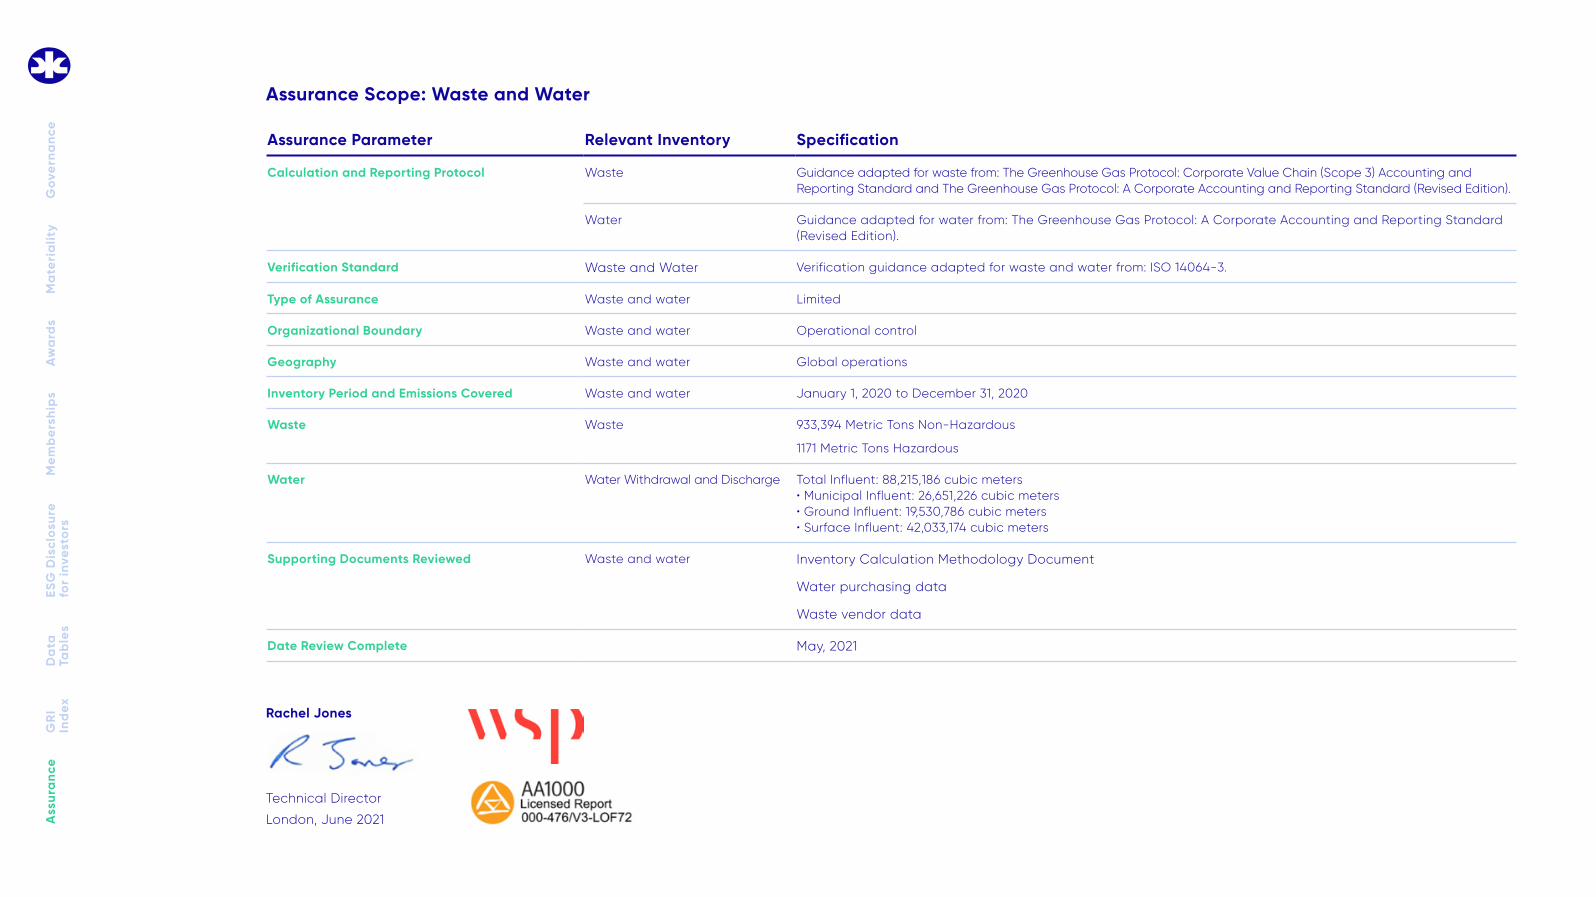
Calculation and Reporting Protocol Waste Guidance adapted for waste from: The Greenhouse Gas Protocol: Corporate Value Chain (Scope 3) Accounting and Reporting Standard and The Greenhouse Gas Protocol: A Corporate Accounting and Reporting Standard (Revised Edition).
Water Guidance adapted for water from: The Greenhouse Gas Protocol: A Corporate Accounting and Reporting Standard (Revised Edition).
Verification Standard Waste and Water Verification guidance adapted for waste and water from: ISO 14064-3.
Type of Assurance Waste and water Limited
Organizational Boundary Waste and water Operational control
Geography Waste and water Global operations
Inventory Period and Emissions Covered Waste and water January 1, 2020 to December 31, 2020
Waste Waste 933,394 Metric Tons Non-Hazardous
1171 Metric Tons Hazardous
Water Water Withdrawal and Discharge Total Influent: 88,215,186 cubic meters · Municipal Influent: 26,651,226 cubic meters · Ground Influent: 19,530,786 cubic meters · Surface Influent: 42,033,174 cubic meters
Supporting Documents Reviewed Waste and water Inventory Calculation Methodology Document