Global Timber Production, Trade, and Timberland Investments Speech Presented at the Southern Forest Resource Assessment Consortium 21-22 October 2008 Research Triangle Park, NC Fred Cubbage Professor North Carolina State University Department of Forestry and Environmental Resources
Transcript
Global Timber Production, Trade, and Timberland Investments
Speech Presented at the Southern Forest Resource Assessment Consortium
21-22 October 2008Research Triangle Park, NC
Fred CubbageProfessor
North Carolina State UniversityDepartment of Forestry and Environmental Resources
Current Research Components and Co-PIsGlobal and U.S. Trade
Ronalds Gonzalez, Sudipta Dasmohapatra, Daniel Saloni, Fred CubbageSadharga Koesbanda & Fred Cubbage
World Timber InvestmentsFred Cubbage, Patricio MacDonagh, Gustavo Balmelli, Rafael Rubilar, Rafael de la Torre, Ronalds Gonzalez, Omar Carrero, Greg Frey, Sadharga Koesbanda, Heyns Kotze, Jin Huang, Mauro Murara, Vitor Hoeflich, James Turner, Bob Abt
Colombia – Land, Site Quality, Transportation TradeoffsJuan Lopez, Rafael de la Torre, Fred Cubbage
Gross Domestic Product (GDP) and Growth, 2006Country GDP 2006
(Billion $US)GDP 2006 per
capita (000 $US) Forecast GDP
Growth, 2007 (%)
Argentina 213 5.5 7.5
Brazil 1 067 5.7 4.4
Chile 145 8.9 5.2
Colombia 135 2.9 5.5
Paraguay 10 1.6 5.0
Peru 93 3.4 6.0
Uruguay 19 6.0 6.0
Venezuela 182 6.8 6.2
S America Total 1 917 5.1 5.3
USA 7 814 37 ~2.4 (actual)
Africa (2004) Na 0.1-4.0 Na
Global 48 144 7.3 4.9
PriceWaterhouseCoopers 2007, IMF World Economics Outlook Database, FAO GFRA 2007
Forests and Plantations
Total World Forest Area By Region, 2005
1001832
677 635 572
20628
0
200
400
600
800
1000
1200
Europ
eS.
America
N. Ameri
ca
Africa
Asia
Ocean
iaC. A
merica
Mill
ion
Ha
FAO 2005; 3.952 billion ha total
Total Forest AreaFor Major Countries, 2005
809
478
310 303197 164 133 88 69 68
0100200300400500600700800900
Russian
Fed
Brazil
Canad
aU.S.A
.China
Australi
aD.R
. Congo
Indones
iaPeru India
Mill
ion
Ha
FAO 2007
Area of Planted Forests by Function, 2005
10798
44422
3833
2161517133
11326
2370
20474
326028
986 315192040
10000
20000
30000
40000
50000
Africa Asia Oceania Europe NorthAmerica
CentralAmerica
SouthAmerica
Mill
ion
Ha
Productive Forest Protective Forest
FAO 2005; 109.6 million ha productive (78%); 30.1 million ha protective (22%); 140.1 million ha total
Total Productive Plantation Area For Major Countries in the World, 2005
17061
11888
53843399 2661 1997 1968 1832 1792 1766 1573
28530
0
8000
16000
24000
32000
ChinaU.S.A
.Russ
ian FedBraz
ilIndon
esia
ChileThail
andFran
ceNew
Zealand
Viet N
amAustra
liaMalay
sia
Thou
sand
Ha
FAO 2007
Total Productive Plantation Area For Major Countries in the World, 2005
14261229
1067 1053
751 754627
312164
43
1471
0
500
1000
1500
2000
SpainS A
frica
Argen
tina
Portugal
IndiaUru
guayPeru
Venez
uelaColombia
Ecuad
orPara
guay
Thou
sand
Ha
FAO 2007, Asoplant 2007 for Venezuela
Industrial Roundwood Harvest from Plantations
172152
30
147
100
322
0
50
100
150
200
Europ
eS.
America
Africa
AsiaN. A
merica
Ocean
iaC. A
merica
Mill
ion
M 3
FAO 2006; country reports; Brown (1999); DANA; SOUTHEM, Siry et al. 2005
SummaryWorld forest plantations
Increasing in acreage and production (FAO 2007, Bael and Sedjo 2006)As were southern pine plantation in US South (Wear et al. 2007)Offsetting decline in natural forest extraction?Largest increase in southern hemisphere, China
U.S.Most plantations in AmericasBut with lower productivity rates than southern hemisphere
Industrial Roundwood Production
Ronalds Gonzalez, Sudipta Dasmohapatra, Daniel Saloni, Fred Cubbage
$0$20$40$60$80
$100$120$140$160$180
1980
1982
1984
1986
1988
1990
1992
1994
1996
1998
2000
Billion US$ Linear (Billion US$)
Global Trade in Forest Products expandedsince 1980, at about 4.5% per year . . .
AAGR = 4.5%
Schuler and Ince 2005
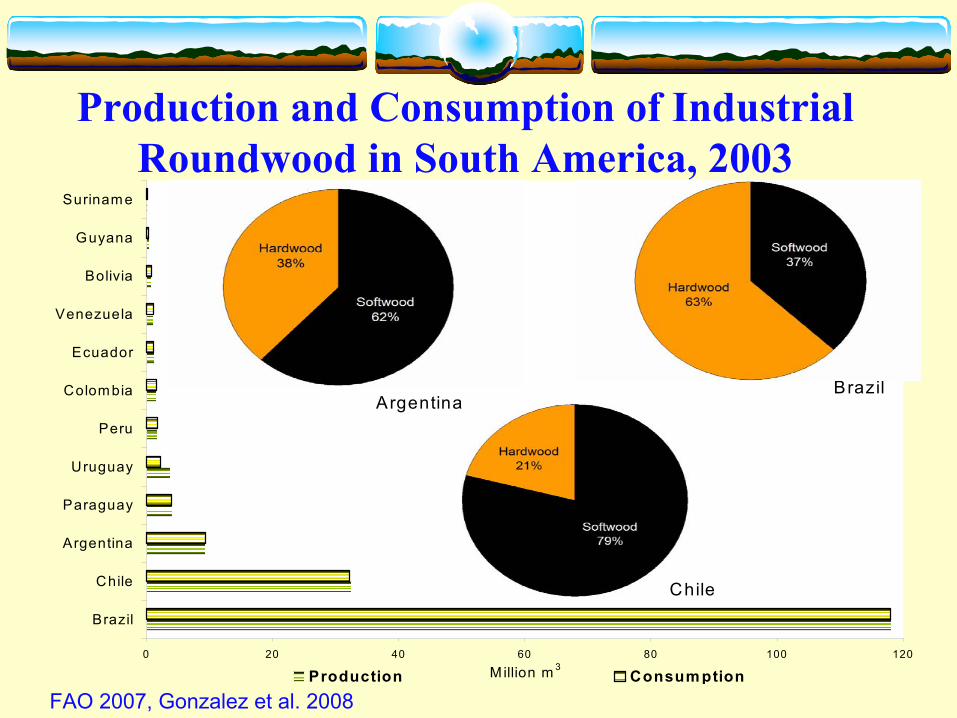
Also, with expanded pine plantation output, the Southern hemisphere & Latin America emerged as a growing softwood lumber supply source . . .
Oceania 8,961 8,963 2 1 (1)1. Papua New Guinea 5,533 5,533 0 0 02. Australia 3,092 3,092 0 0 0
1,766,925Total World
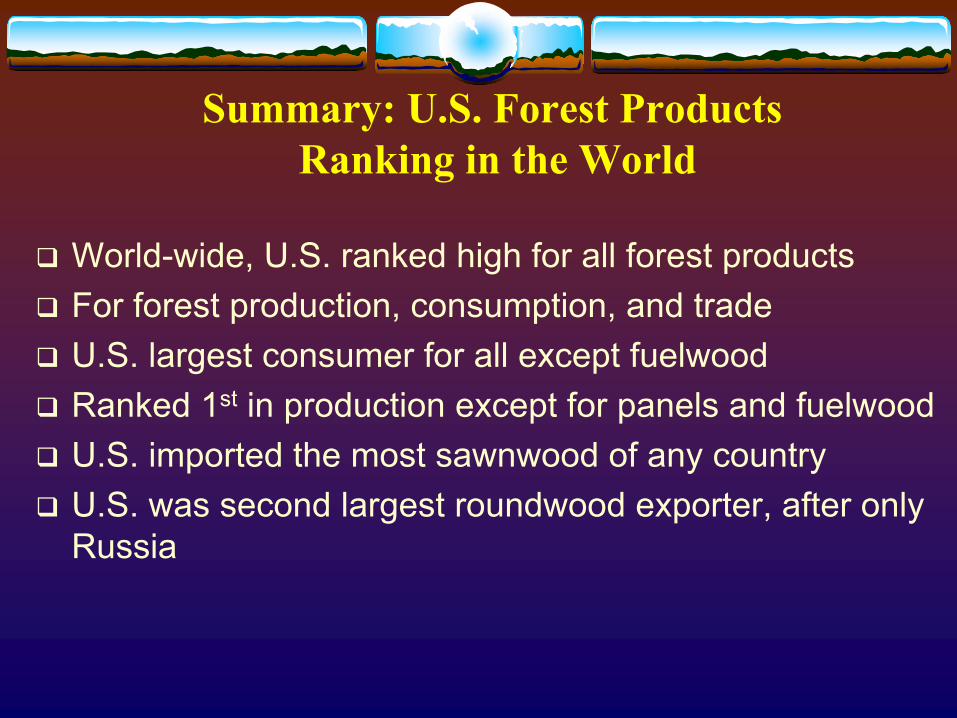
Summary: U.S. Forest ProductsRanking in the World
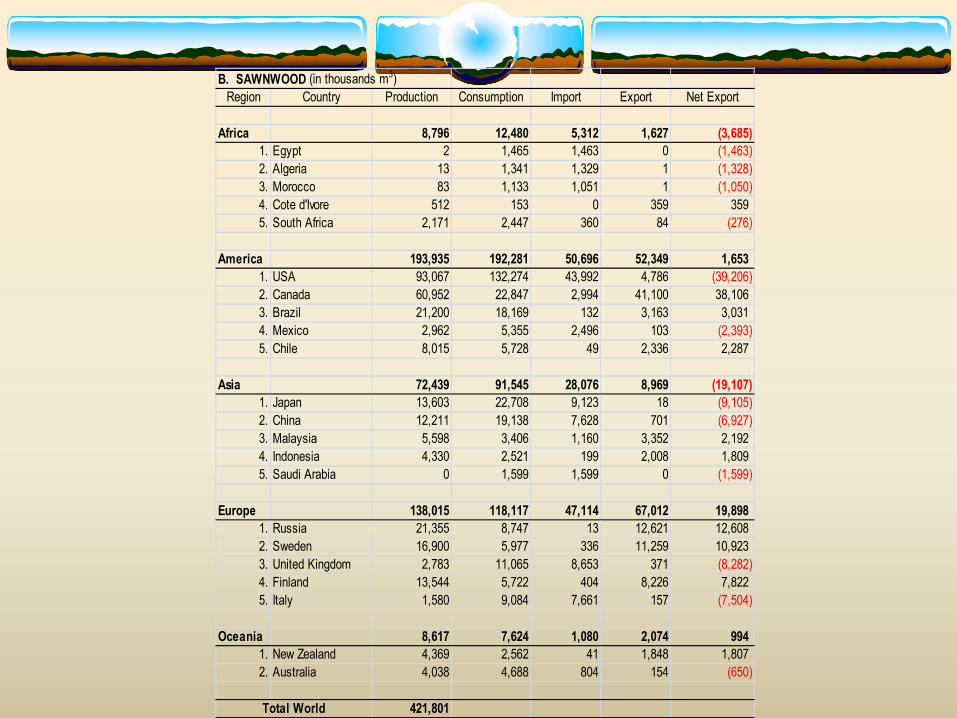
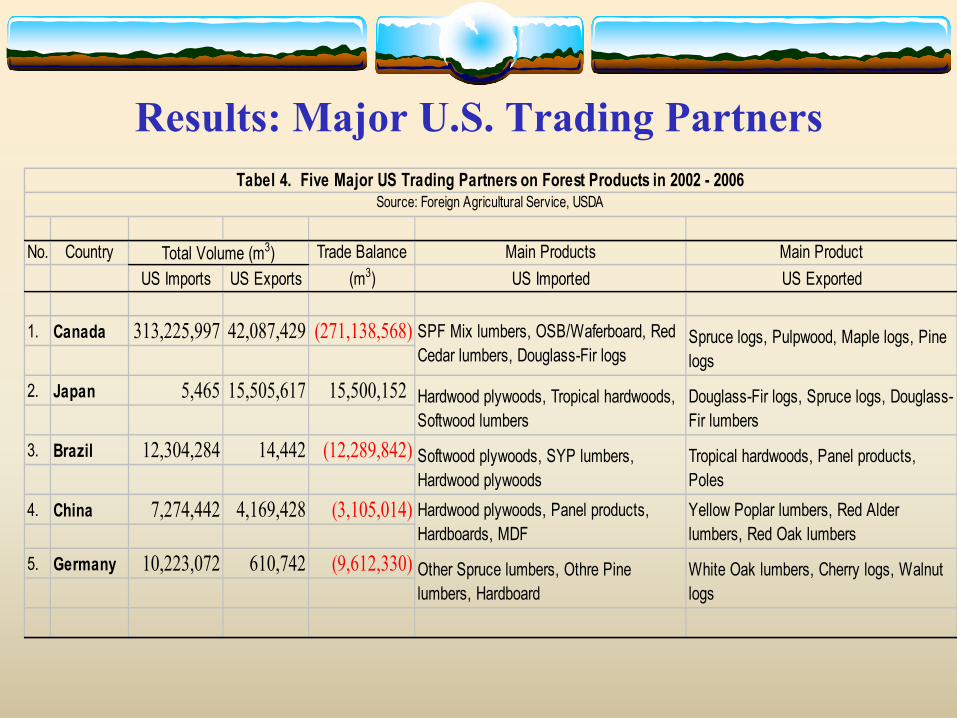
World-wide, U.S. ranked high for all forest productsFor forest production, consumption, and tradeU.S. largest consumer for all except fuelwood Ranked 1st in production except for panels and fuelwoodU.S. imported the most sawnwood of any countryU.S. was second largest roundwood exporter, after only Russia
Yellow Poplar lumbers, Red Alder lumbers, Red Oak lumbers
Other Spruce lumbers, Othre Pine lumbers, Hardboard
White Oak lumbers, Cherry logs, Walnut logs
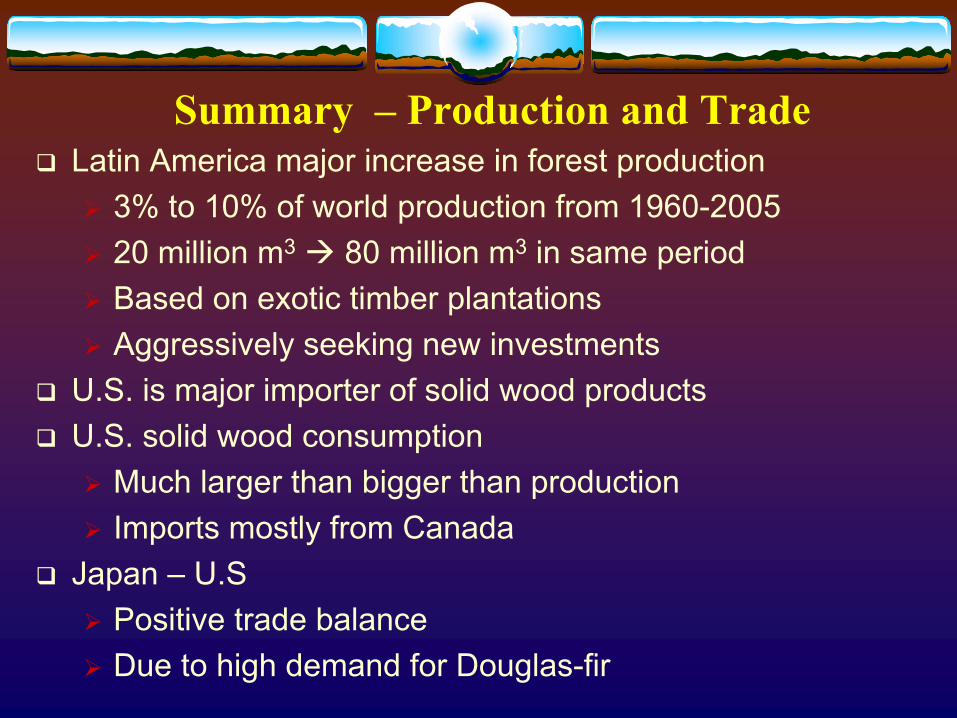
Summary – Production and TradeLatin America major increase in forest production
3% to 10% of world production from 1960-200520 million m3 80 million m3 in same periodBased on exotic timber plantationsAggressively seeking new investments
U.S. is major importer of solid wood productsU.S. solid wood consumption
Much larger than bigger than productionImports mostly from Canada
Japan – U.SPositive trade balanceDue to high demand for Douglas-fir
Global Timber Investment Returns
Co-Authors, Affiliations, Countries, 2008
Fred Cubbage North Carolina State University, USAPatricio Mac Donagh Universidad Nacional de Misiones, ArgentinaGustavo Balmelli Instituto Nacional de Investigación Agropecuaria, UruguayRafael Rubilar Universidad Concepcion de ChileRafael De La Torre Cellfor, USA, ColombiaRonalds Gonzalez NC State University, VenezuelaRonalds Gonzalez NC State University, VenezuelaHeyns Kote South AfricaGreg Frey NC State University, ParaguayJin Juang NC State University, ChinaVitor Hoeflich Universidade Federal do Paraná, BrasilMauro Murara Universidade de Contestado, BrasilJames Turner Scion Research, New ZealandBob Abt NC State University, New Zealand
MethodsSelect countries
Major world plantation timber producersArgentina, Brazil, Uruguay, Chile, US South
Select principal commercial timber species or prospectsAuthors’ estimates of:
Growth rates, typical current practices, geneticsFactor costs and output prices
Develop cash flow analyses / spreadsheetsCapital budgeting analysesIterative review by authors and foresters in each countrySensitivity analyses – land, reserves, subsidies
Assumptions
Discounted cash flow analysisReal (constant) input costs and timber prices
No inflationReal discount rate of 8%
No land costs in base caseBefore taxRepresentative sitesGood plantation and natural stand practices
Returns of Plantations, Brazil and Chile, 2008
5.73.6 2.9 2.8
0.8
25.5
20.8
16.3 15.613.1
0
5
10
15
20
25
30
Brasil Eucgrandis
Brasil P taeda Brasil Pelliotii
Chile Pradiata
sawtimber
Chile Pradiata
pulpwood
Land
Exp
ecta
tion
Valu
e ($
000/
ha)
or In
tern
al R
ate
of R
etur
n (%
)
8% discount rate; no land cost
Land Expectation Value Internal Rate of Return
Returns of Plantations, Argentina & Uruguay, 2008
3.2 3.2 2.4 1.8 1
2018.2
22.921.4
12.8
0
5
10
15
20
25
Argentina Ptaeda
ArgentinaEuc grandis
Uruguay Eucglobulus
Uruguay Eucgrandis
Uruguay Ptaeda
Land
Exp
ecta
tion
Valu
e ($
000/
ha)
or In
tern
al R
ate
of R
etur
n (%
)
8% discount rate; no land cost
Land Expectation Value Internal Rate of Return
Returns of Plantations, Colombia, 2008
5.4 5.44.1
16.6 15.5 14.7
11.2
1.6
0
5
10
15
20
25
ColombiaEucalyptus
Colombia Ptecunumanii
Colombia Pmaximinoi
Colombia Ppatula
Land
Exp
ecta
tion
Valu
e ($
000/
ha)
or In
tern
al R
ate
of R
etur
n (%
)
.7.
8% discount rate; no land cost
Land Expectation Value Internal Rate of Return
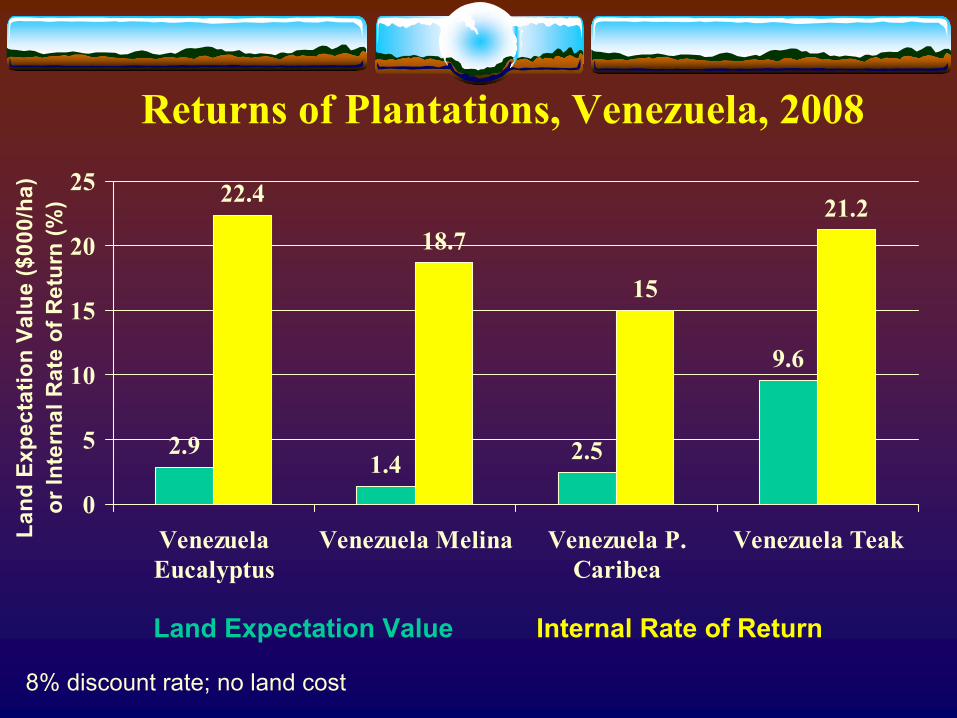
Returns of Plantations, Venezuela, 2008
2.91.4 2.5
9.6
22.4
18.7
15
21.2
0
5
10
15
20
25
VenezuelaEucalyptus
Venezuela Melina Venezuela P.Caribea
Venezuela TeakLand
Exp
ecta
tion
Valu
e ($
000/
ha)
or In
tern
al R
ate
of R
etur
n (%
)
8% discount rate; no land cost
Land Expectation Value Internal Rate of Return
Returns of Plantations, Paraguay, 2008
1.64.2
2
12
21.4
15.4
0
5
10
15
20
25
Paraguay P taeda Paraguay Euc grandis Paraguay Euccamuldensis
Land
Exp
ecta
tion
Valu
e ($
000/
ha)
or In
tern
al R
ate
of R
etur
n (%
)
8% discount rate; no land
Land Expectation Value Internal Rate of Return
Returns of Plantations, South Africa, China, New Zealand, & USA, 2008
2.3 1.70.1
-0.2
0.2
12.411.1 12.1
7.6 8.5
-5
0
5
10
15
20
25
S Afrcia Eucgrandis
S Africa Ppatula
China Pmassoniana
New ZealandP radiata
USA P taeda
Land
Exp
ecta
tion
Valu
e ($
000/
ha)
or In
tern
al R
ate
of R
etur
n (%
)
8% discount rate; no land
Land Expectation Value Internal Rate of Return
Returns of Native Species / Plantations, 2005
1.6
-0.15
12.410.9
7.8 7.4
-0.03
1 0.8
13.6
-5
0
5
10
15
Chile Nothofagus
dombeyiPlanted
BrasilAracauria
Planted
ChileNothofagus
nervosaplanted
USA Pinustaeda Natural
ArgentinaAracauria
Planted
Land
Exp
ecta
tion
Valu
e ($
000/
ha)
or In
tern
al R
ate
of R
etur
n (%
)
8% discount rate; no land cost
Land Expectation Value Internal Rate of Return Cubbage et al. 2007
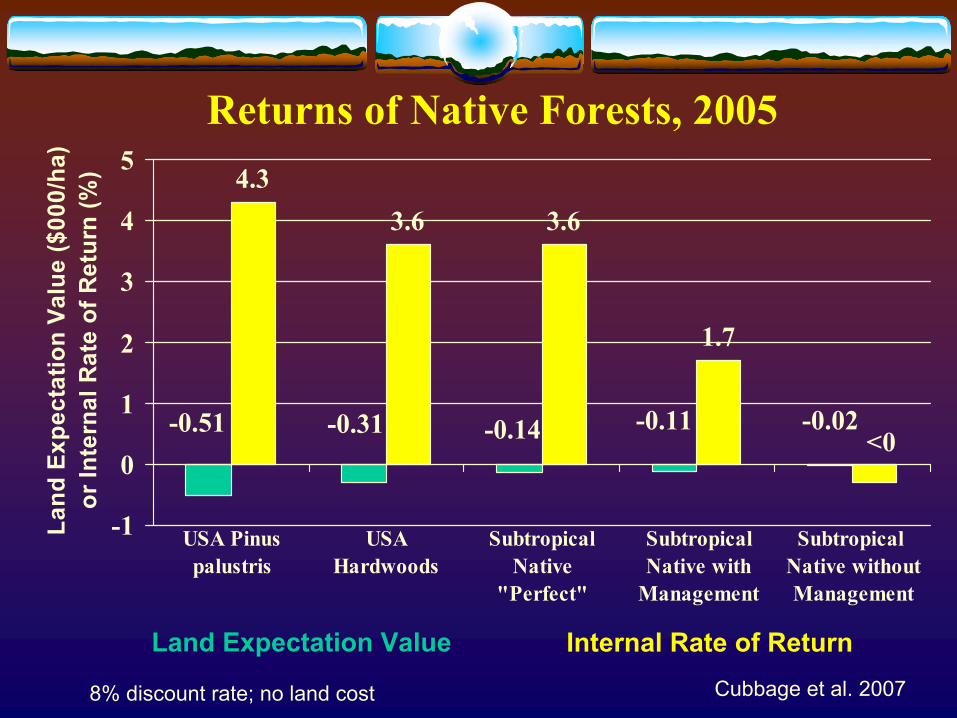
Returns of Native Forests, 2005 4.3
3.6 3.6
1.7
-0.51 -0.11-0.14-0.31 -0.02<0
-1
0
1
2
3
4
5
USA Pinuspalustris
USAHardwoods
SubtropicalNative
"Perfect"
SubtropicalNative with
Management
Subtropical Native withoutManagement
Land
Exp
ecta
tion
Valu
e ($
000/
ha)
or In
tern
al R
ate
of R
etur
n (%
)
8% discount rate; no land cost
Land Expectation Value Internal Rate of ReturnCubbage et al. 2007
OECD 2007; Range of 1-7; Lowest number is least risky
Trade and Development: Debate and AcrimonyEvangelina Corrazzo, Carnival Queen of Gualeguaychú, Entre Rios, Argentina
at the EU-Latinoamerica Summitt, Vienna, Austria, 13 May 2006
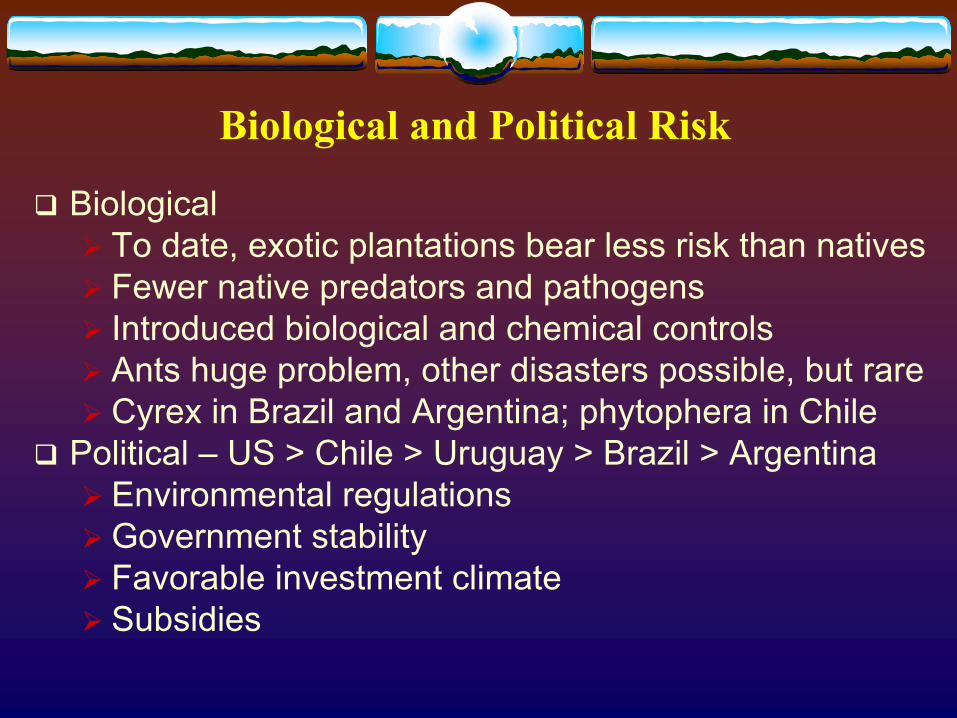
Biological and Political Risk
BiologicalTo date, exotic plantations bear less risk than nativesFewer native predators and pathogensIntroduced biological and chemical controlsAnts huge problem, other disasters possible, but rareCyrex in Brazil and Argentina; phytophera in Chile
Political – US > Chile > Uruguay > Brazil > ArgentinaEnvironmental regulationsGovernment stabilityFavorable investment climateSubsidies
Number of Days and Procedures Required to Start a Business in South America, 2006
Gonzalez et al. 2008, NCSU, from World Bank 2007
915
12 1115 14
17
1013
17
2732
43 4550
6974
102
116
152
0
20
40
60
80
100
120
140
160
Chile Argentina Colombia Uruguay Bolivia Ecuador Paraguay Peru Venezuela Brazil
Day
s
# Procedures # Days required for starting a business
Effect of Land Prices, Transportation Costs, and Site Productivity
on Timber Investment Returnsfor Pine Plantations in Colombia
Juan Lopez, Rafael de la Torre, and Fred CubbageNCSU, CellFor, & NCSU
Analysis of Factors Affecting Forest Investment Opportunities
Carter (2007), IQPC Timber Summit2007: Up to $4 billion seeking timber investmentsOn ~$40 billion base
Forest investments in Latin America increasingLatin America timber prices increasing > U.S.Large LAC plantation and production increasesTradeoffs between land quality, proximity, price crucial in purchase decisions
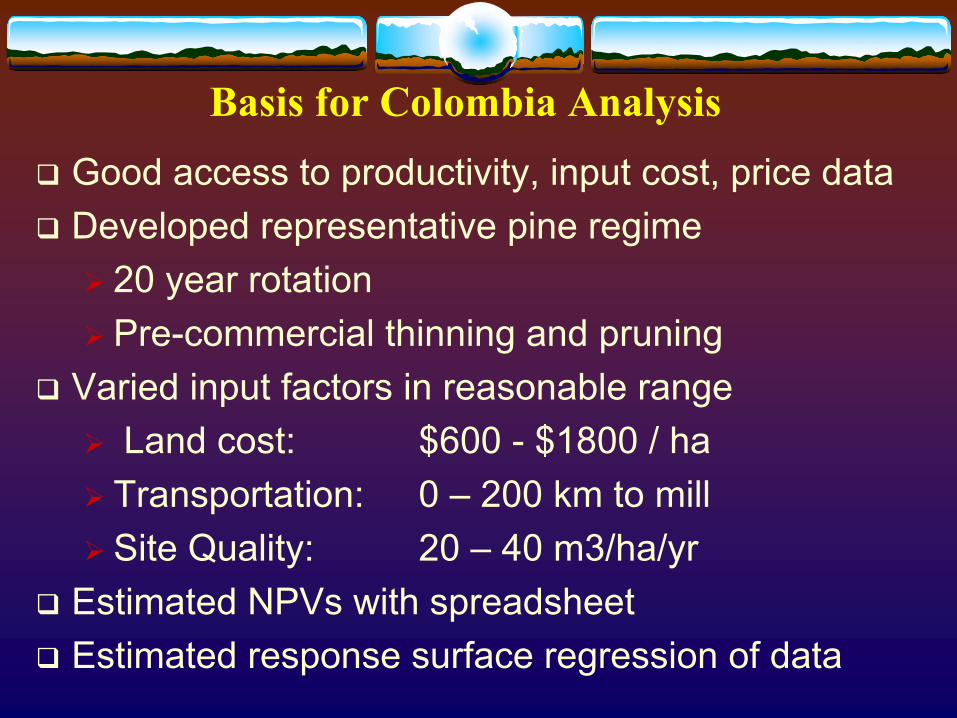
Basis for Colombia AnalysisGood access to productivity, input cost, price dataDeveloped representative pine regime
20 year rotationPre-commercial thinning and pruning
Varied input factors in reasonable rangeLand cost: $600 - $1800 / ha
Transportation: 0 – 200 km to millSite Quality: 20 – 40 m3/ha/yr
Estimated NPVs with spreadsheetEstimated response surface regression of data
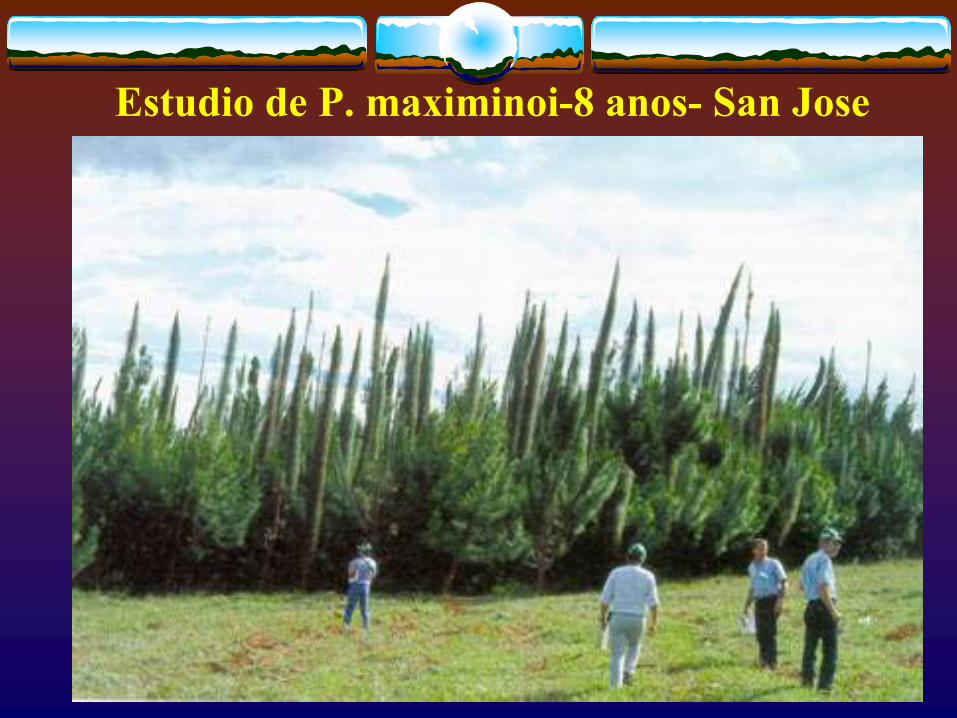
P. tecunumanii, 10 years old, Colombia
Estudio de P. maximinoi-8 anos- San Jose
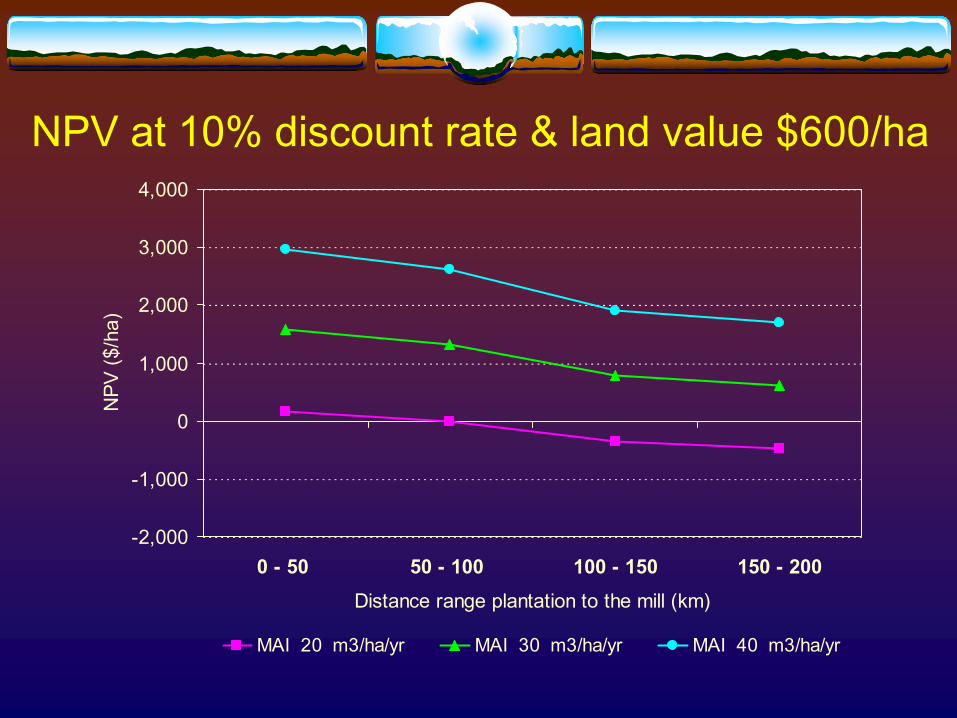
NPV at 10% discount rate & land value $600/ha
-2,000
-1,000
0
1,000
2,000
3,000
4,000
0 - 50 50 - 100 100 - 150 150 - 200Distance range plantation to the mill (km)
NPV
($/h
a)
MAI 20 m3/ha/yr MAI 30 m3/ha/yr MAI 40 m3/ha/yr
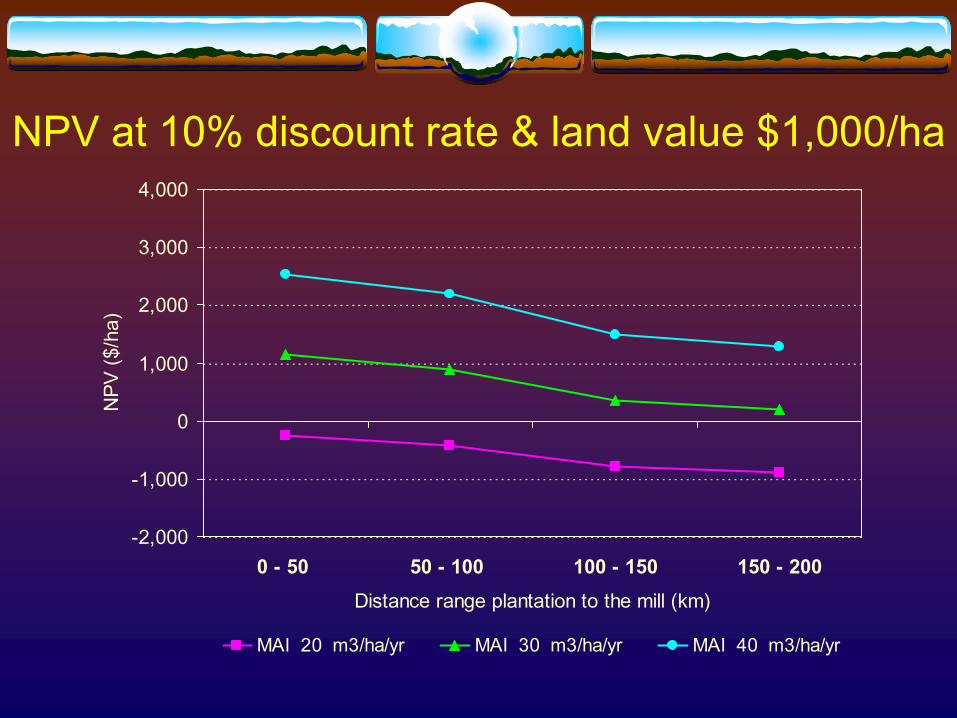
NPV at 10% discount rate & land value $1,000/ha
-2,000
-1,000
0
1,000
2,000
3,000
4,000
0 - 50 50 - 100 100 - 150 150 - 200Distance range plantation to the mill (km)
NPV
($/h
a)
MAI 20 m3/ha/yr MAI 30 m3/ha/yr MAI 40 m3/ha/yr
NPV at 10% discount rate & land value $1,400/ha
-2,000
-1,000
0
1,000
2,000
3,000
4,000
0 - 50 50 - 100 100 - 150 150 - 200Distance range plantation to the mill (km)
NPV
($/h
a)
MAI 20 m3/ha/yr MAI 30 m3/ha/yr MAI 40 m3/ha/yr
NPV at 10% discount rate & land value $1,800/ha
-2,000
-1,000
0
1,000
2,000
3,000
4,000
0 - 50 50 - 100 100 - 150 150 - 200Distance range plantation to the mill (km)
NPV
($/h
a)
MAI 20 m3/ha/yr MAI 30 m3/ha/yr MAI 40 m3/ha/yr
NPV at 10% discount rate distance to the mill 0 to 50 kms
-2,000
-1,000
0
1,000
2,000
3,000
4,000
600 1000 1400 1800Land price ($/ha)
NPV
($/h
a)
MAI 20 m3/ha/yr MAI 30 m3/ha/yr MAI 40 m3/ha/yr
NPV at 10% discount rate distance to the mill 50 to 100 kms
-2,000
-1,000
0
1,000
2,000
3,000
4,000
600 1000 1400 1800Land price ($/ha)
NPV
($/h
a)
MAI 20 m3/ha/yr MAI 30 m3/ha/yr MAI 40 m3/ha/yr
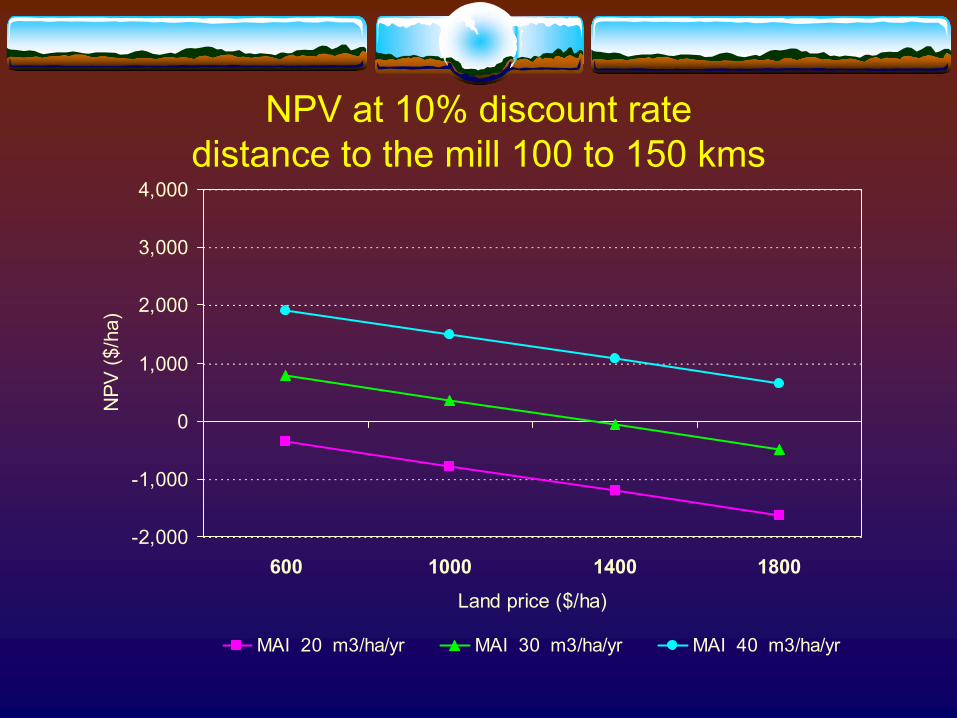
NPV at 10% discount rate distance to the mill 100 to 150 kms
-2,000
-1,000
0
1,000
2,000
3,000
4,000
600 1000 1400 1800Land price ($/ha)
NPV
($/h
a)
MAI 20 m3/ha/yr MAI 30 m3/ha/yr MAI 40 m3/ha/yr
NPV at 10% discount rate distance to the mill 150 to 200 kms
-2,000
-1,000
0
1,000
2,000
3,000
4,000
600 1000 1400 1800Land price ($/ha)
NPV
($/h
a)
MAI 20 m3/ha/yr MAI 30 m3/ha/yr MAI 40 m3/ha/yr
Proportional Effects at Median Value
Discount Rate
NPV of Factor at Median Value ($/ha)
Land Price(@ $1200/ha)
Transportation Distance
(@100 km)
Mean Annual Increment
(@ 30 m3/ha/yr)8% -1183 -905 5002
10% -1262 -677 3693
12% -1316 -512 2756
Colombia Case ConclusionsInvestment case study for Latin AmericaResults at i=10%
Lower productivity – negative NPVs in all casesHigher productivity – always positive NPVMedium productivity – positive in most cases
Partial response at the meanMAI/Site quality ~ 2-4 times more important than land priceMAI/Site quality ~ 5 time more important than transport cost
Related SOFAC Projects
DemandNCASI
Demand – Jacek Siry – Data Disk
Census: ASM by State; Pulp& paper FinancialsLumberPanelsPaper & PaperboardPulpwoodTimber Product PricesDocumentation
NCASI – Fred Cubbage and Bob Abt
Identify Wood Production Systems and RegionsEstimate Wood Production and Harvesting CostsLegal and Environmental ContextInternational ComparisonsCooperators – Related Projects
Tom Fox, VPIBecky Barlow, Daowei Zhang, AuburnAndy Ezell, Mississippi State
Conclusions
Summary - PlantationsWorld forest plantations
increasing in acreage and productionAs were southern pine plantation on US SouthOffsetting decline in natural forest extraction?Largest increase in southern hemisphere, China
U.S.Most plantations in AmericasBut with lower productivity rates than southern hemisphere
Summary – Production and TradeLatin America major increase in forest production
3% to 10% of world production from 1960-200520 million m3 80 million m3 in same periodBased on exotic timber plantationsAggressively seeking new investments
U.S. is major importer of solid wood productsU.S. solid wood consumption
Much larger than bigger than productionImports mostly from Canada
Japan – U.SPositive trade balanceDue to high demand for Douglas-fir
ConclusionsExotic Plantations Returns
8% to 23% base IRRs w/o land costs Possibility for much greater returns in S AmericaAnd good returns in other Southern HemisphereEarly investors with cheap land costs have profited most; more difficult nowBut U.S. returns have dropped, S Hemisphere increased since 2005Colombia case
Site quality / silviculture has largest potential effect on timber investment returns2-5 times transport, land costs at mean values
ConclusionsInvestment Analysis - Approach and CaveatsRobust cooperative research estimate
Best available data – common practiceKnowledgeable local experts, extensive review
AssumptionsReal rates of return, 2008 pricesWithout land costs, taxesInput & timber prices vary by area, change with time
TechnologyBetter sites / growth possible better returnsBetter management possible better returnsAnd vice versa
Conclusions Forestry Sector Prospects
Economic development opportunityForest sector GDP
2-4% Brazil, Chile1.2% USA1% Argentina, Uruguay
2 new pulp mills each in Chile and in UruguayMany new mills or pulp lines in Brazil More opportunities on other Southern Hemisphere countriesMany sawmills and panel millsRapidly developing forest clusters
Conclusions Forestry Sector Prospects
Modest expansion everywhere Most timber need and greatest prices – Chile & Brazil Larger supply, increasing prices – Argentina New supply, establishing markets – Uruguay Stasis, declining prices – U.S. South Emerging opportunities – Colombia, others
Least risk in most developed markets/countriesLonger term less certainBiological risks may emergeBut with short rotationsAnd strong GDP and export growth
World Timber Productionand Timberland Investments
Speech Presented at the Southern Forest Resource Assessment Consortium
21-22 October 2008Research Triangle Park, NC
Cubbage_Timber_Production_Investments_V7; 20 October 2008
Fred CubbageProfessor
North Carolina State UniversityDepartment of Forestry and Environmental Resources