14
| Date post: | 31-Dec-2015 |
| Category: |
Documents |
| Upload: | gray-rhodes |
| View: | 63 times |
| Download: | 2 times |

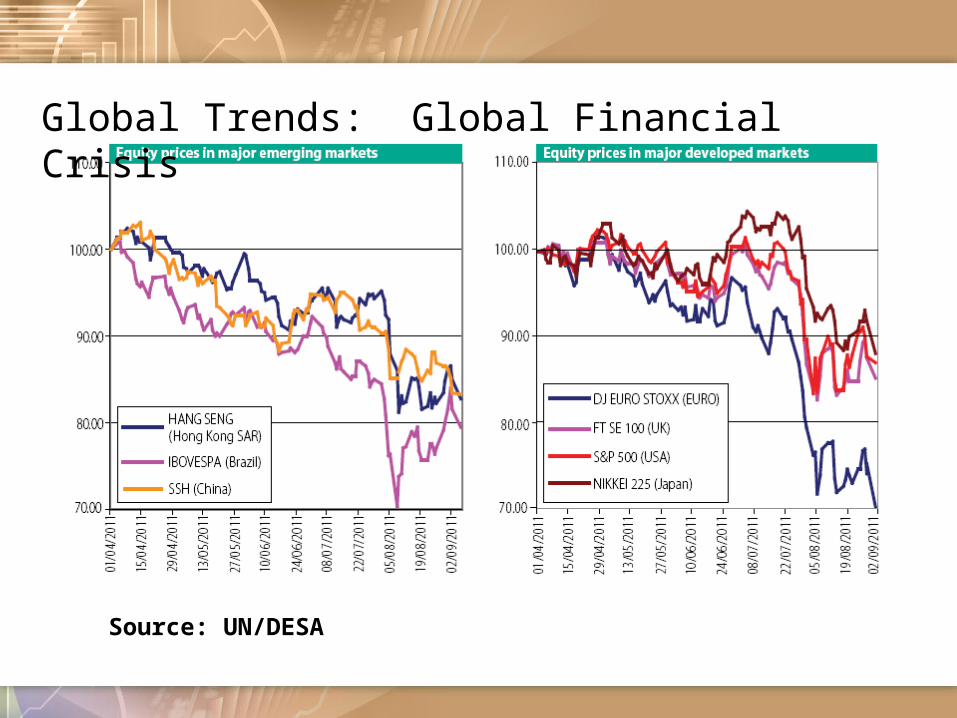
Global Trends: Global Financial Crisis
Source: UN/DESA

Global Trends: Global Financial CrisisGlobal GDP Growth
(Percent, quarter over quarter, annualized)
Source: IMF
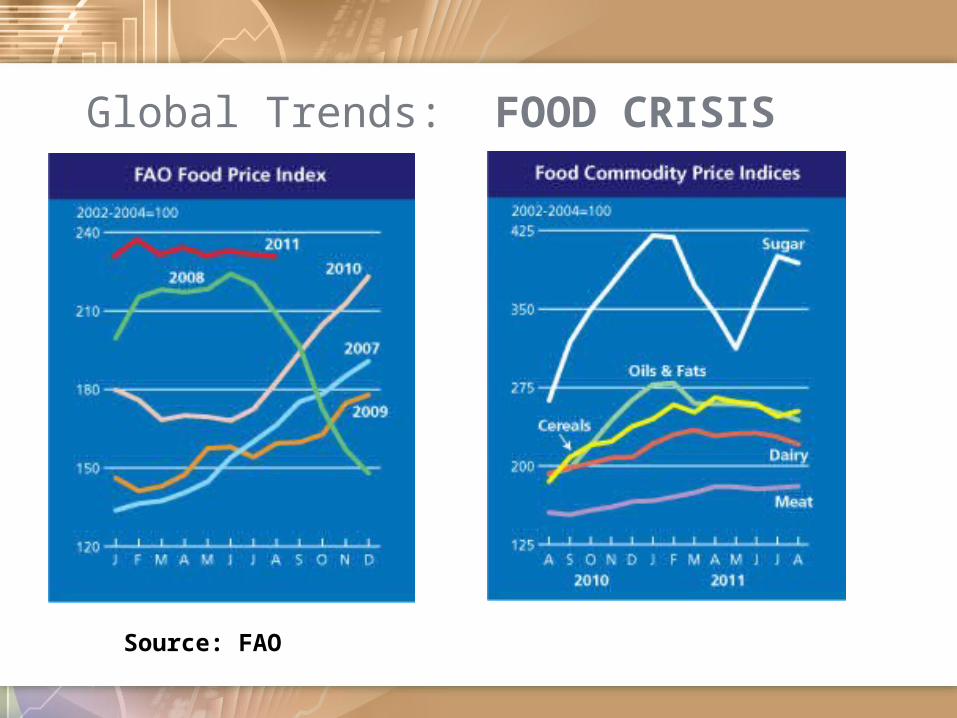
Global Trends: FOOD CRISIS
Source: FAO

EARLY WARNING INDICATORS A. FLASH QUARTERLY GDP
(NOW-CASTING)
Activity GDP share Primary data source / estimation method
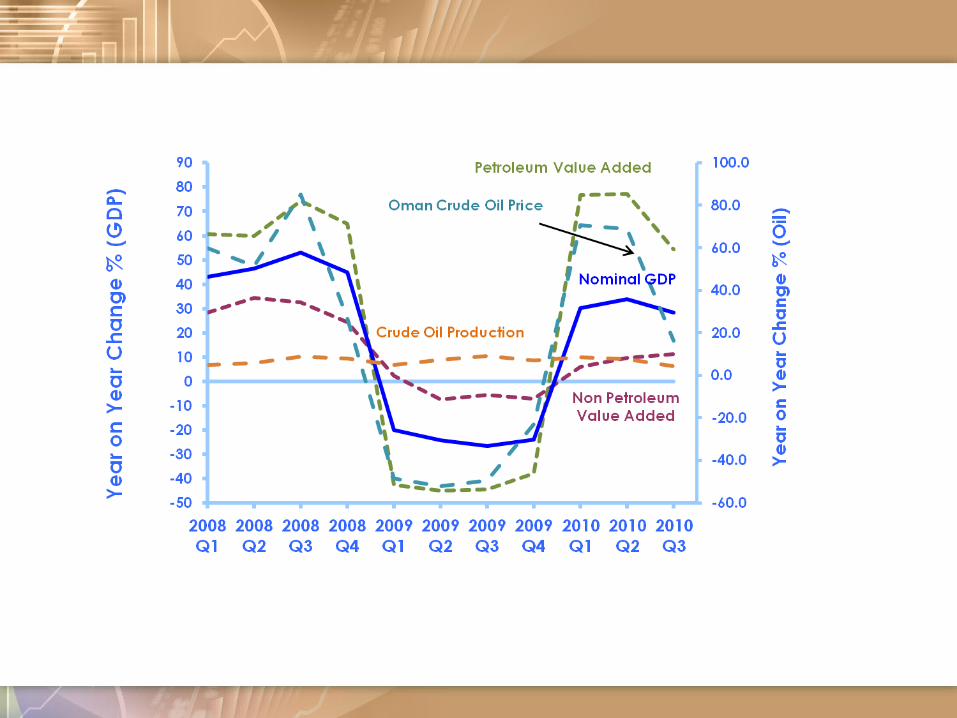
Oil and Gas 41% Actual data on quantity produced and the corresponded prices from Ministry of Oil and Gas
Refining and petrochemicals
7% Monthly Financial statement from the producers
Manufacturing 4% Turnover estimates, export values/quantities Construction 7% Production survey, labor statistics, construction
material index Services 41% Production Survey
Etc. Ministry of Finance, Sectoral Ministries
The First Estimate of Overall Economic Activities Imputation for the Last Month of the Quarter Timeliness 10 Days After end of the Ref. Period

QUARTERLY FLASH GDP

ACTUAL VS. FLASH GDP
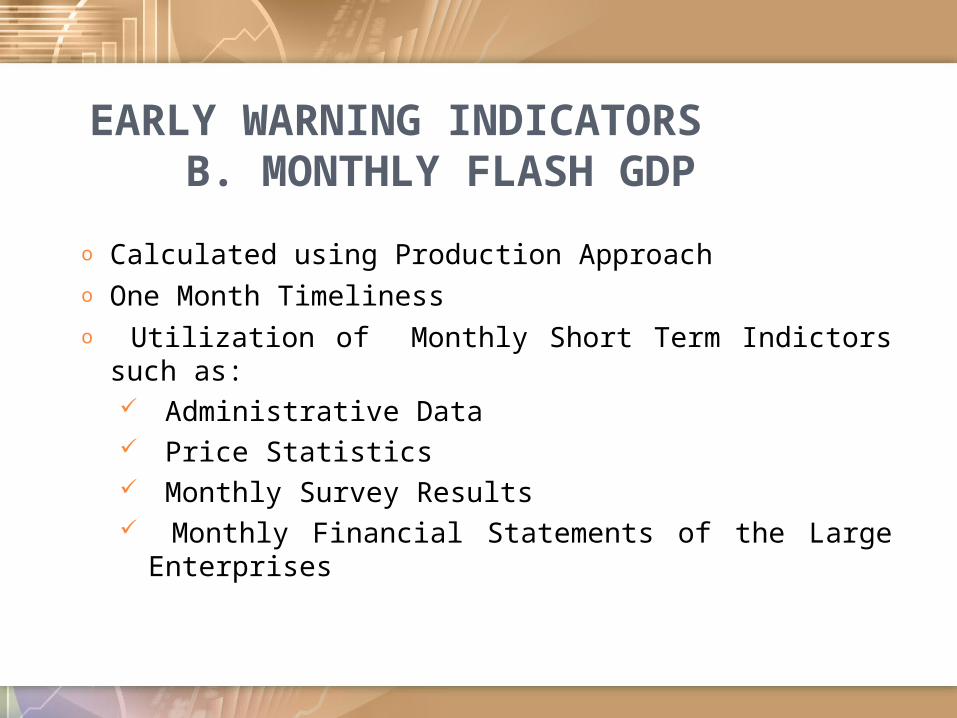
EARLY WARNING INDICATORS B. MONTHLY FLASH GDP
o Calculated using Production Approacho One Month Timelinesso Utilization of Monthly Short Term Indictors such as:
Administrative Data Price Statistics Monthly Survey Results Monthly Financial Statements of the Large Enterprises
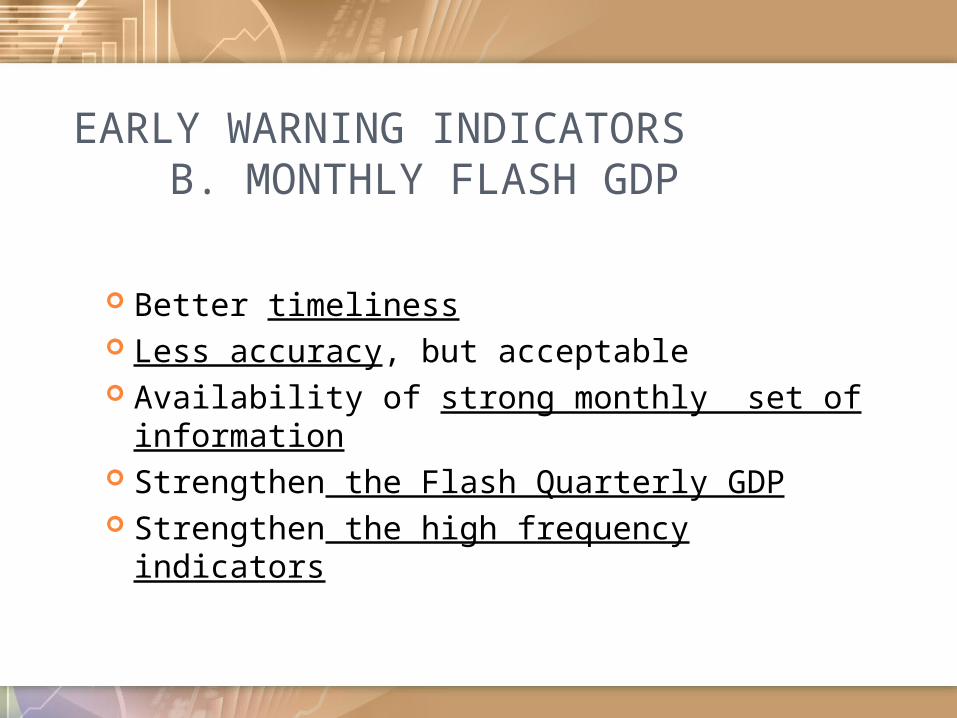
EARLY WARNING INDICATORS B. MONTHLY FLASH GDP
Better timeliness Less accuracy, but acceptable Availability of strong monthly set of information Strengthen the Flash Quarterly GDP Strengthen the high frequency indicators

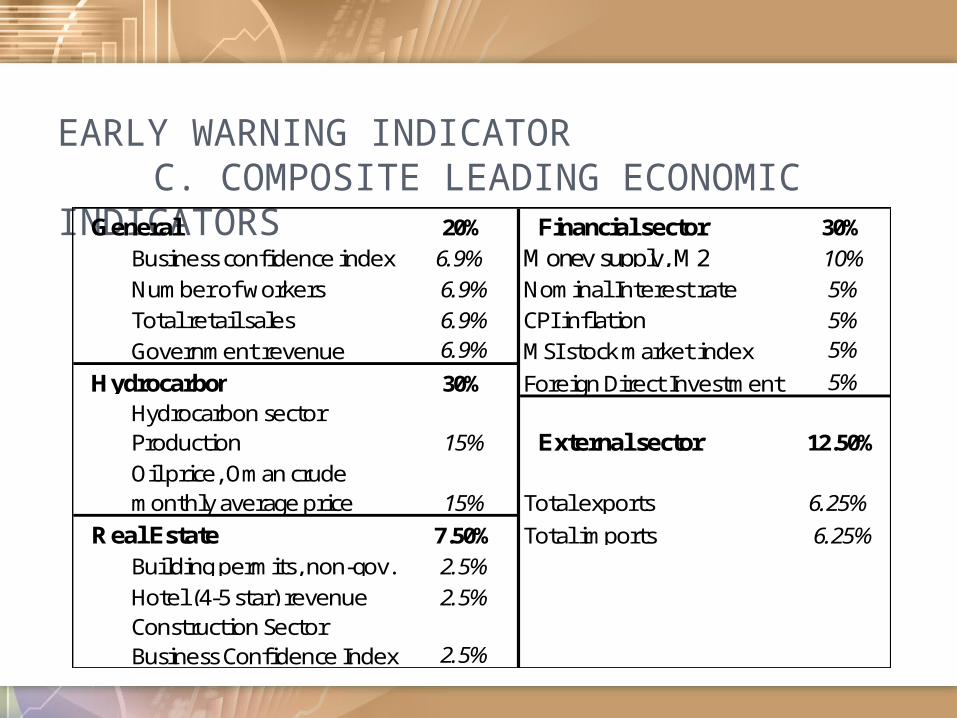
EARLY WARNING INDICATOR C. COMPOSITE LEADING ECONOMIC
INDICATORS Need for quick, broad indicator for overall economic
activity for immediate future Extracting signals and producing estimates for a
better understanding of cyclical movements This work is currently under construction Weighting system will be derived
EARLY WARNING INDICATOR C. COMPOSITE LEADING ECONOMIC
INDICATORS 20% 30%6.9% Money supply, M2 10% 6.9% Nominal Interest rate 5% 6.9% CPI inflation 5% 6.9% MSI stock market index 5%
30% Foreign Direct Investment 5%
15% 12.50%
15% 6.25% 7.50% 6.25% 2.5% 2.5%
2.5%
General Financial sectorBusiness confidence indexNumber of workersTotal retail salesGovernment revenue
Hydrocarbon sector
External sectorOil price, Oman crude monthly average price
Real Estate
Total exportsTotal imports
Hydrocarbon sector Production
Building permits, non-gov. Hotel (4-5 star) revenueConstruction Sector Business Confidence Index
CHALLENGES ENCOUNTERED
Rallying for resources Timeliness, periodicity and availability of high frequency
indicators – historic emphasis annual data Composite Leading Indicator
Lack of sufficient indicators Methodological improvements in existing data

Thank you


