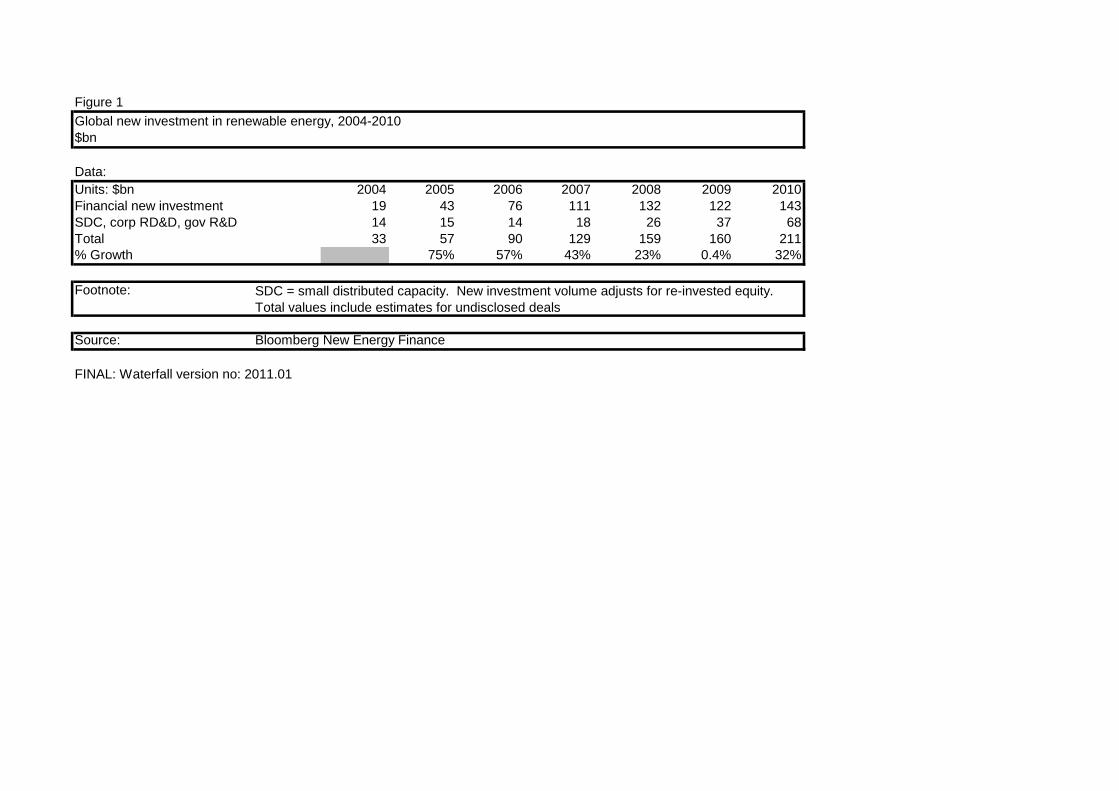
Figure 1. Global new investment in renewable energy, 2004-2010 $bn
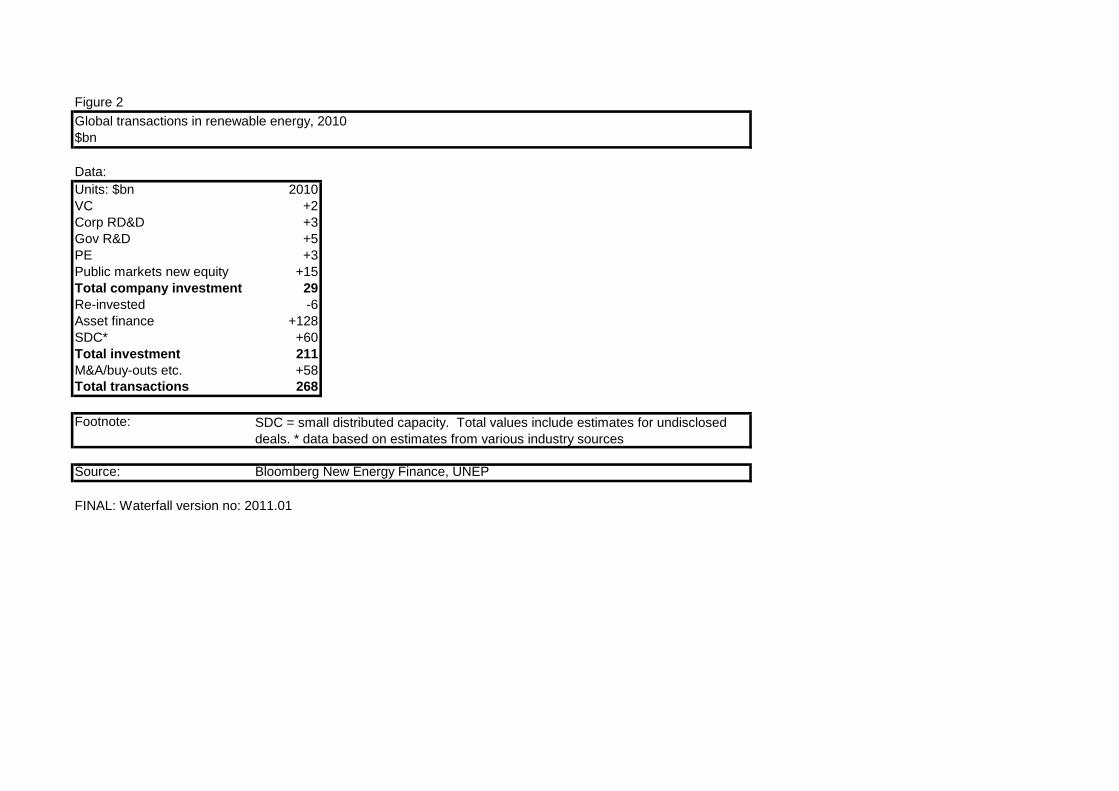
Figure 2. Global transactions in renewable energy, 2010 $bn
Figure 3. Global Trends In Renewable Energy Investment 2010 data table, $bn
Figure 4. Financial new investment and small distributed capacity in renewable energy: developed v developing countries, 2004-2010 $bn
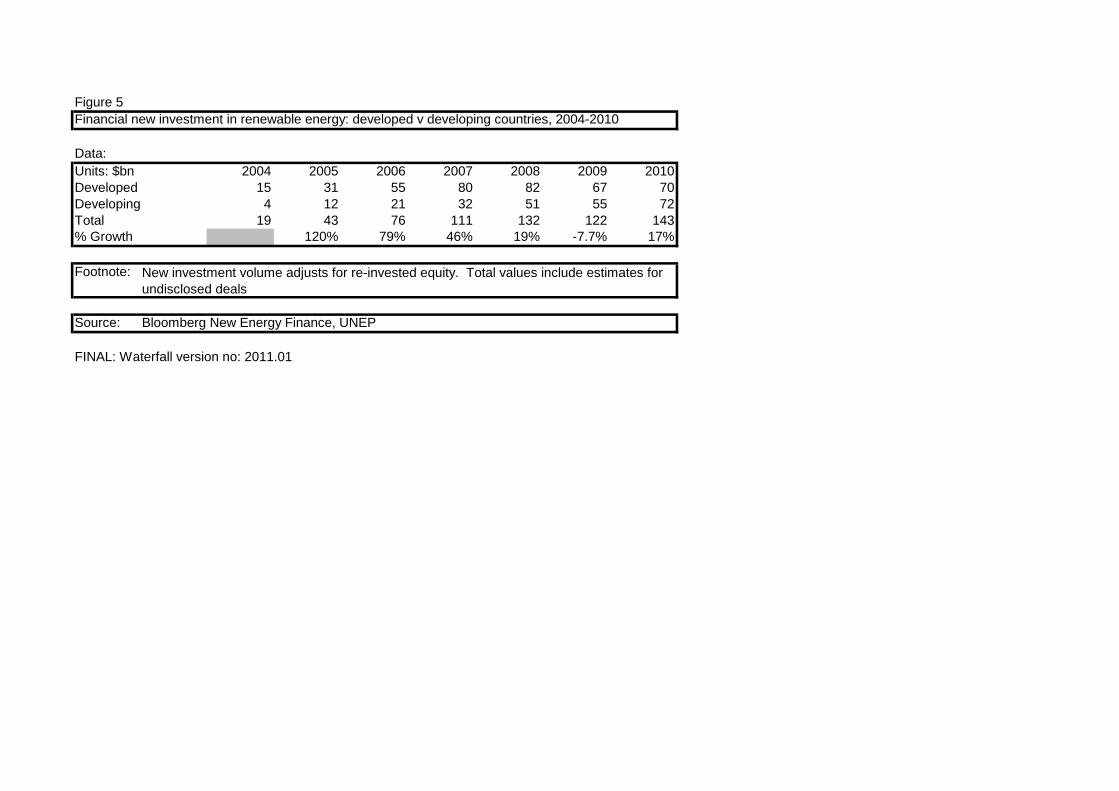
Figure 5. Financial new investment in renewable energy: developed v developing countries, 2004-2010 $bn
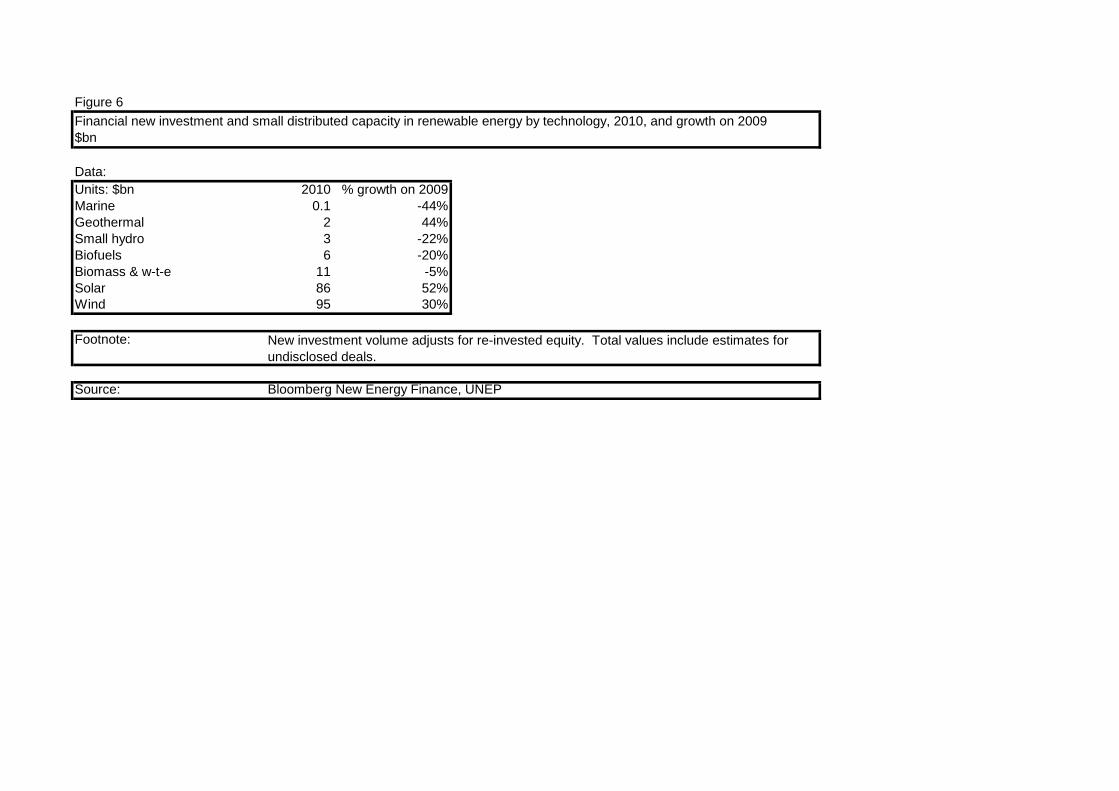
Figure 6. Financial new investment and small distributed capacity in renewable energy by technology, 2010, and growth on 2009 $bn
Figure 7. VC/PE new investment in renewable energy by technology, 2010 $bn
Figure 8. Public markets new investment in renewable energy by technology, 2010 $bn
Figure 9. Asset finance of new-build renewable energy assets by technology, 2010 $bn
Figure 10. Global financial new investment in renewable energy quarterly trend, Q1 2004-Q1 2011 $bn
Figure 11. Financial new investment and small distributed capacity in renewable energy by country, 2010, and growth on 2009 $bn
Figure 12. Financial new investment in renewable energy: developed v developing countries, 2010, and total growth on 2009 $bn
Figure 13. Financial new investment in renewable energy by region, 2010 $bn
Figure 14. Financial new investment in renewable energy by region, 2004-2010 $bn
Figure 15. Small distributed capacity investment by country, 2010, and growth on 2009 $bn
Figure 16. Financial new investment in renewable energy in China by sector and asset class, 2010 $bn
Figure 17. Financial new investment in renewable energy in India by sector and asset class, 2010 $bn
Figure 18. Financial new investment in renewable energy in Brazil by sector and asset class, 2010 $bn
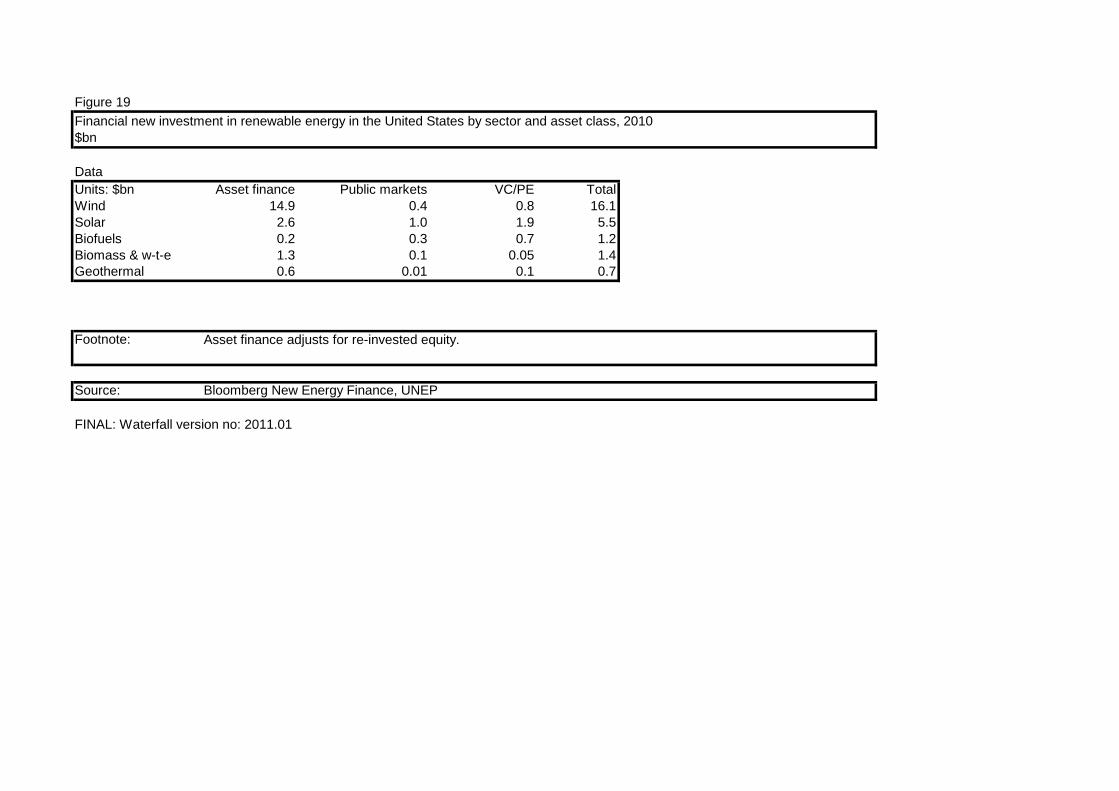
Figure 19. Financial new investment in renewable energy in the United States by sector and asset class, 2010 $bn
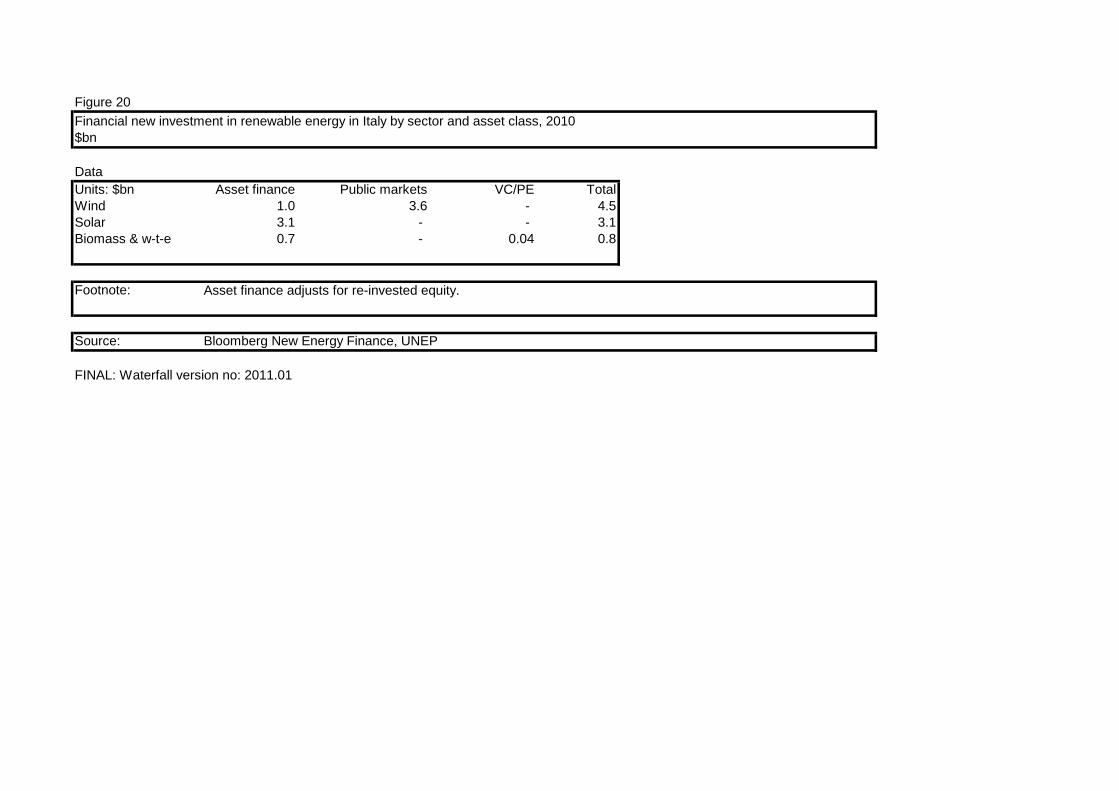
Figure 20. Financial new investment in renewable energy in Italy by sector and asset class, 2010 $bn
Figure 21. Financial new investment in renewable energy in Latin America (excluding Brazil) by country, 2010 $bn
Figure 22. Financial new investment in renewable energy in non-OECD Asia (excluding China and India) by country, 2010 $bn
Figure 23. Financial new investment in renewable energy in Africa by country, 2010 $bn
Figure 24. Renewable power generation and capacity as a proportion of global power, 2004-2010 %
Figure 25. Investment in clean energy v conventional capacity, 2004-2010 $bn
Figure 26. Forecast annual net capacity additions, 2010-2012 GW
Figure 27. Financial new investment in energy-smart technologies by region, 2004-2010 $bn
Figure 28. R&D investment in renewable energy, 2004-2010 $bn
Figure 29. Corporate and government R&D renewable energy investment by technology, 2010, and total growth on 2009 $bn
Figure 30. Corporate and government R&D renewable energy investment by region, 2010, and growth on 2009 $bn
Figure 31. VC/PE new investment in renewable energy by stage, 2004 - 2010 $bn
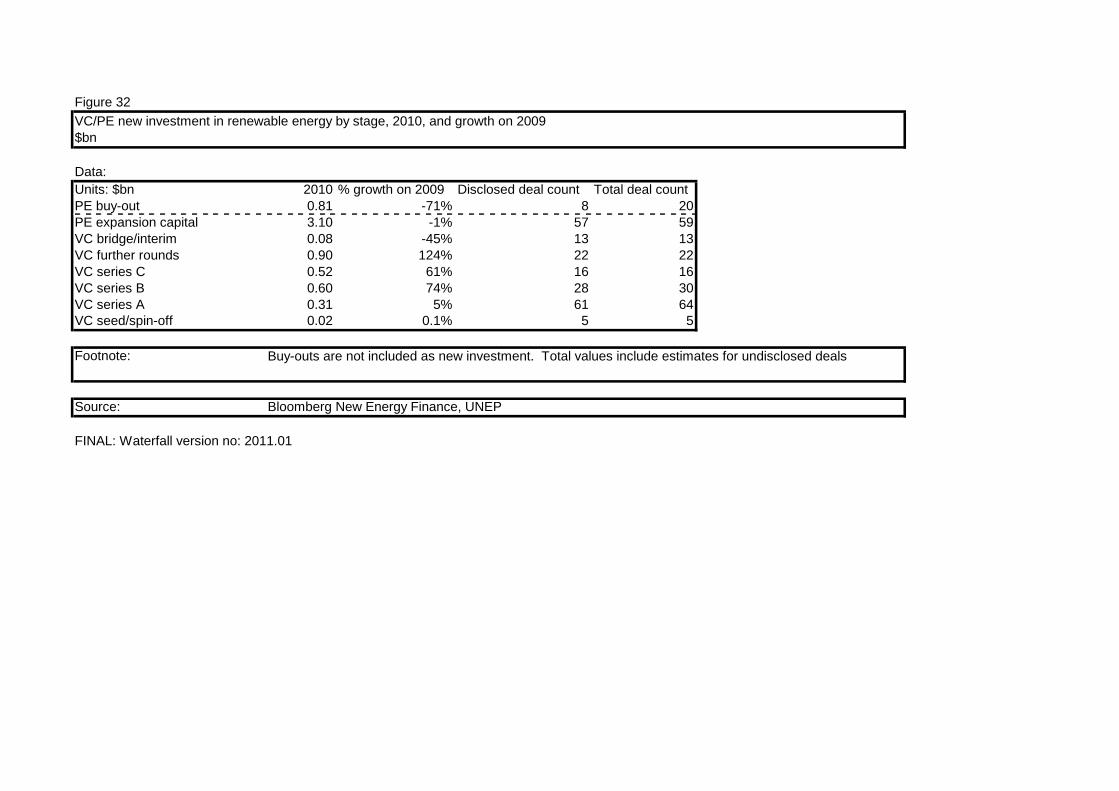
Figure 32. VC/PE new investment in renewable energy by stage, 2010, and growth on 2009 $bn
Figure 33. VC/PE new investment in renewable energy by sector, 2004-2010 $bn
Figure 34. VC/PE new investment in renewable energy by sector, 2010, and growth on 2009 $bn
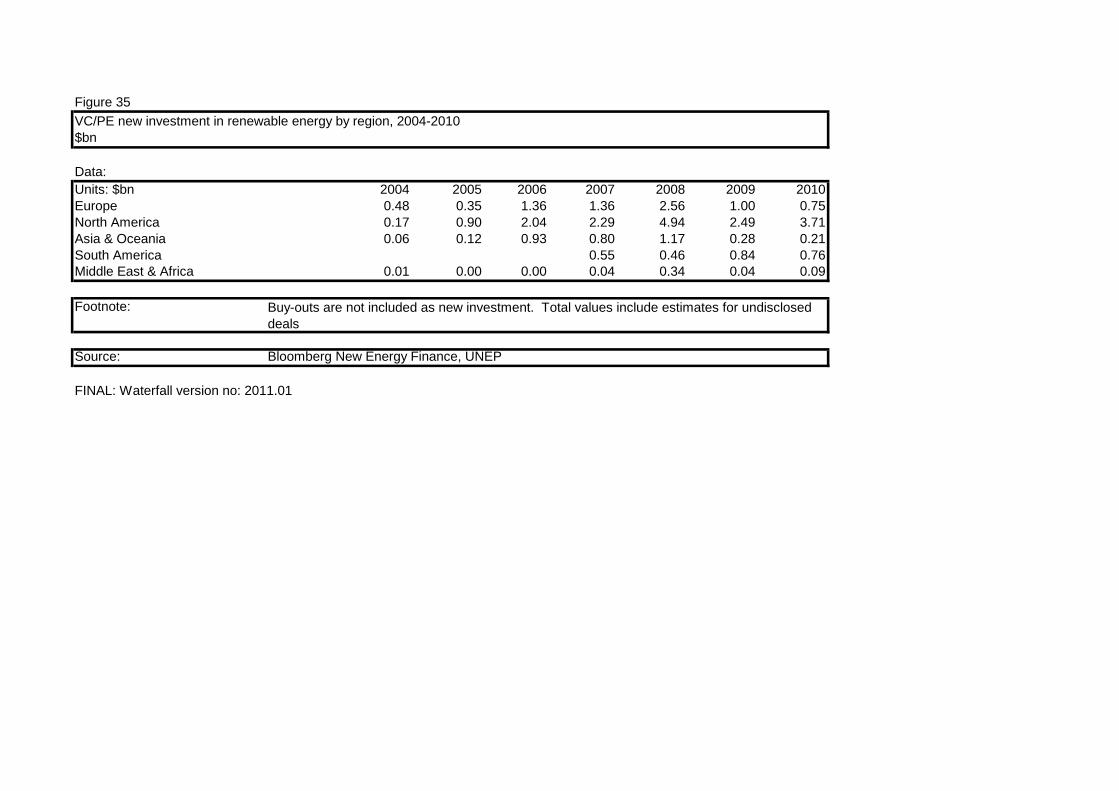
Figure 35. VC/PE new investment in renewable energy by region, 2004-2010 $bn
Figure 36. VC/PE new investment in renewable energy by region, 2010, and growth on 2009 $bn
Figure 37. Public market new investment in renewable energy by stage, 2004-2010 $bn
Figure 38. NEX vs selected indices
Figure 39. Public market new investment in renewable energy by sector, 2004-2010 $bn
Figure 40. Public market new investment in renewable energy by sector, 2010, and growth on 2009 $bn
Figure 41. Public market new investment in renewable energy by region of exchange, 2004-2010 $bn
Figure 42. Public market new investment in renewable energy by exchange, 2010, and growth on 2009 $bn
Figure 43. Public market new investment in renewable energy by company nationality, 2010, and growth on 2009 $bn
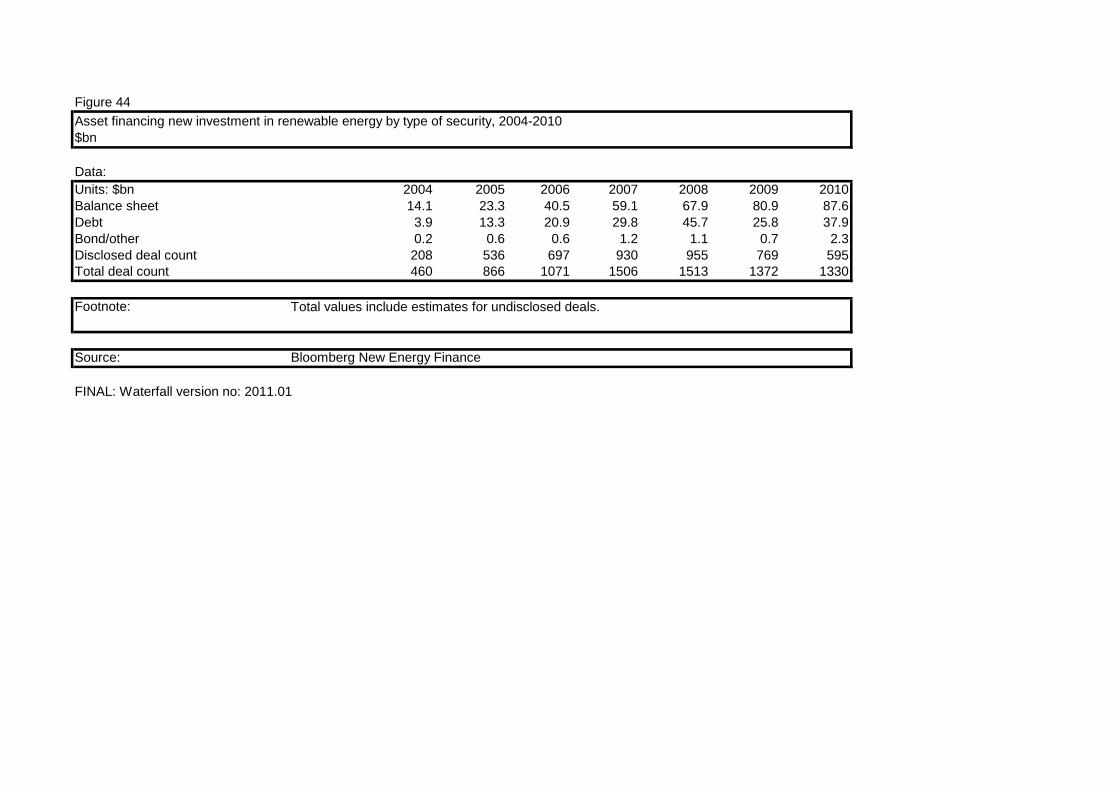
Figure 44. Asset financing new investment in renewable energy by type of security, 2004-2010 $bn
Figure 45. Asset financing new investment in renewable energy by region, 2004-2010 $bn
Figure 46. Asset financing new investment in renewable energy by sector, 2004-2010 $bn
Figure 47. Multilateral development banks: provision of finance for renewable energy projects
Figure 48. Small distributed capacity investment, 2004 - 2010 $bn
Figure 49. Small distributed capacity investment by country, 2010, and growth on 2009 $bn
Figure 50. Global installations of glazed water collectors by region, 2009 %
Figure 51. Acquisition transactions in renewable energy by type 2010 $bn
Figure 52. Acquisition transactions in renewable energy by sector 2010, and growth on 2009 $bn
Figure 53. Acquisition transactions in renewable energy by technology, 2010, and growth on 2009 $bn
Figure 54. Acquisition transactions in renewable energy by region, 2004-2010 $bn
Figure 55. Global acquisition transactions in renewable energy: quarterly trend, Q1 2004-Q1 2011 $bn
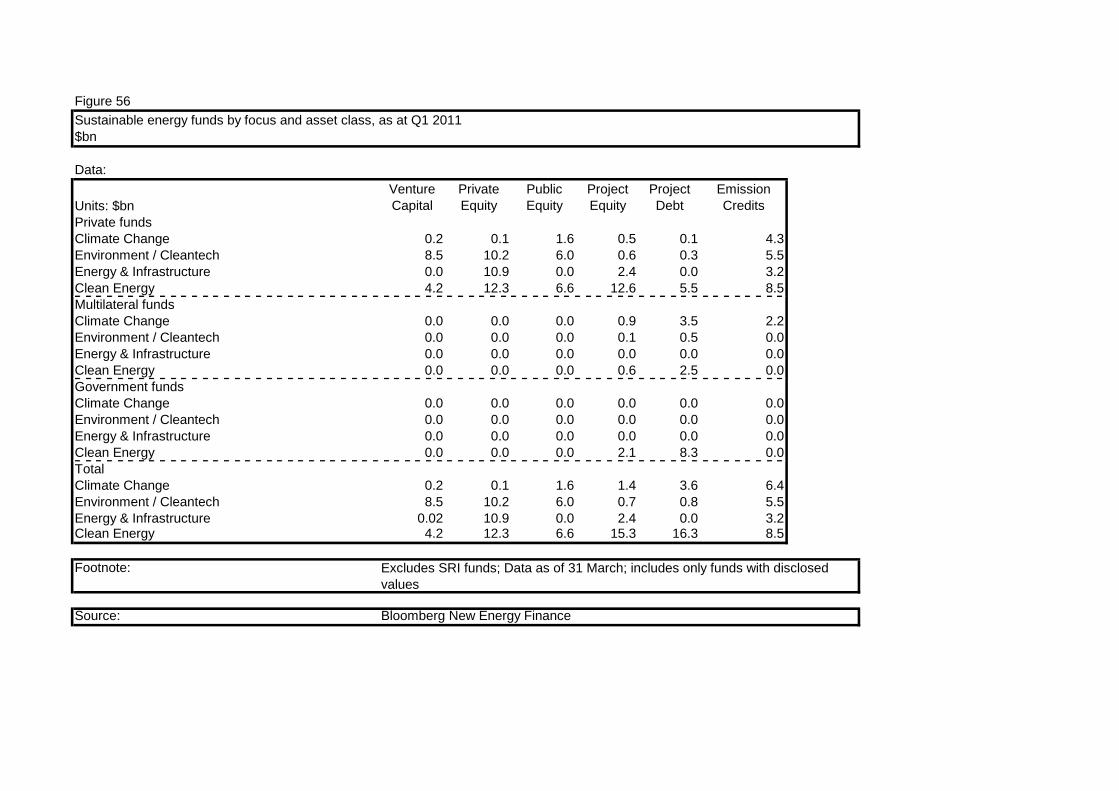
Figure 56. Sustainable energy funds by focus and asset class, as at Q1 2011 $bn
Figure 57. Sustainable energy funds by asset class, as at Q1 2011 %
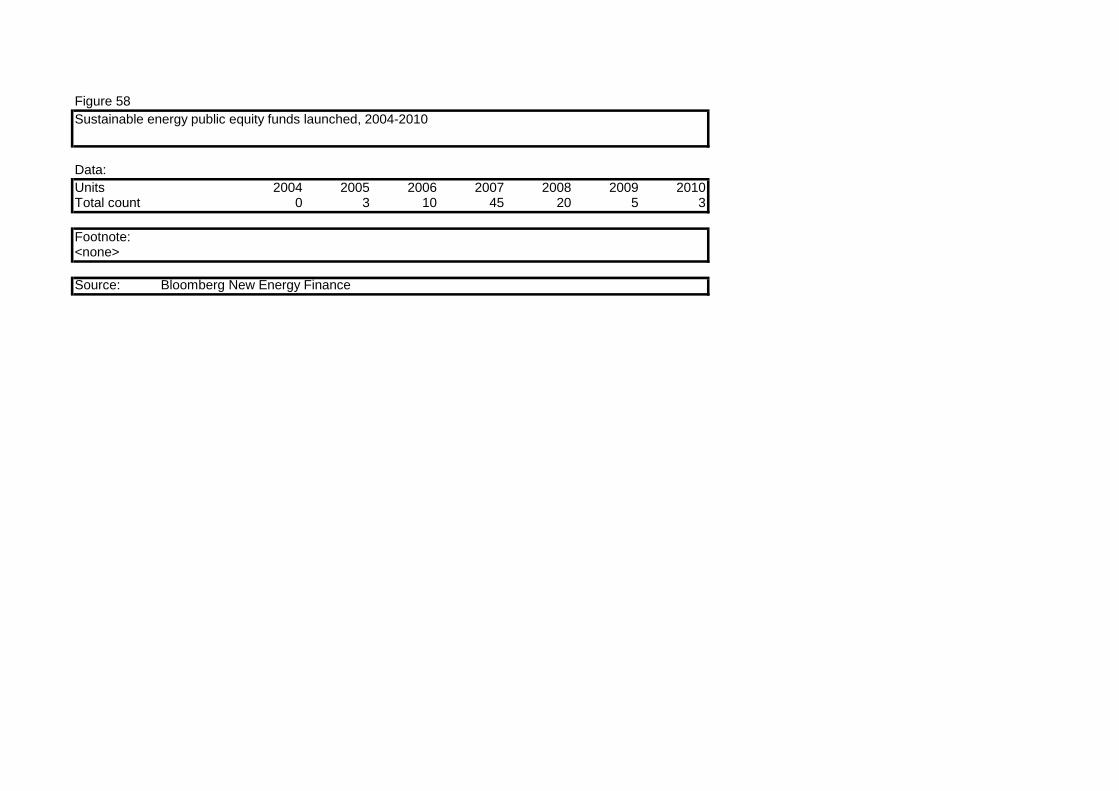
Figure 58. Sustainable energy public equity funds launched, 2004-2010
UN
ITED
NA
TIO
NS
ENV
IRO
NM
ENT
PR
OG
RA
MM
E
GLOBAL TRENDS IN RENEWABLE
ENERGY INVESTMENT 2011
Analysis of Trends and Issues in the Financing of Renewable Energy
Figure 1
Data:
Units: $bn 2004 2005 2006 2007 2008 2009 2010
Financial new investment 19 43 76 111 132 122 143
SDC, corp RD&D, gov R&D 14 15 14 18 26 37 68
Total 33 57 90 129 159 160 211
% Growth 75% 57% 43% 23% 0.4% 32%
Footnote:
Source: Bloomberg New Energy Finance
FINAL: Waterfall version no: 2011.01
Global new investment in renewable energy, 2004-2010
$bn
SDC = small distributed capacity. New investment volume adjusts for re-invested equity.
Total values include estimates for undisclosed deals
Figure 2
Data:
Units: $bn 2010
VC +2
Corp RD&D +3
Gov R&D +5
PE +3
Public markets new equity +15
Total company investment 29
Re-invested -6
Asset finance +128
SDC* +60
Total investment 211
M&A/buy-outs etc. +58
Total transactions 268
Footnote:
Source: Bloomberg New Energy Finance, UNEP
FINAL: Waterfall version no: 2011.01
Global transactions in renewable energy, 2010
$bn
SDC = small distributed capacity. Total values include estimates for undisclosed
deals. * data based on estimates from various industry sources
Figure 3. Global Trends In Renewable Energy Investment 2010 data table, $bn
Year 2004 2005 2006 2007 2008 2009 2010
2009-10
Growth
2004-10
CAGR
Category $bn $bn $bn $bn $bn $bn $bn % %
1 Total Investment
1.1 New Investment 33 57 90 129 159 160 211 32% 36%
1.2 Total Transactions 41 83 125 187 224 225 268 19% 37%
2 New Investment by Value Chain
2.1 Technology Development
2.1.1 Venture capital 0.4 0.6 1.3 1.9 2.9 1.5 2.4 59% 36%
2.1.2 Government R&D* 1.1 1.2 1.3 1.5 1.6 2.4 5.3 121% 29%
2.1.3 Corporate RD&D* 3.8 2.9 3.1 3.3 3.7 3.7 3.3 -12% -2%
2.2 Equipment Manufacturing
2.2.1 Private equity expansion capital 0.3 0.8 3.1 3.2 6.6 3.1 3.1 -1% 45%
2.2.2 Public markets 0.4 4.0 11.0 22.0 12.8 12.5 15.4 23% 87%
2.3 Projects
2.3.1 Asset finance 18.3 37.2 62.1 90.1 114.7 107.5 127.8 19% 38%
Of which re-invested equity 0.0 0.0 1.1 5.7 4.5 2.4 6.0
2.3.3 Small distributed capacity* 8.6 10.7 9.4 13.2 21.1 31.2 59.6 91% 38%
Total Financial Investment 19 43 76 111 132 122 143 17% 40%
Gov'n R&D, Corporate RD&D, Small projects 14 15 14 18 26 37 68 82% 31%
Total New Investment 33 57 90 129 159 160 211 32% 36%
3 M&A Transactions
3.1 Private equity buy-outs 0.8 3.3 1.6 3.3 5.5 2.8 0.8 -71% 0%
3.2 Public markets investor exits 0.0 1.3 2.1 3.9 1.0 2.0 1.3 -34% 243%
3.3 Corporate M&A 2.4 8.6 13.2 18.7 18.0 21.6 20.0 -7% 42%
3.4 Project acquistion & refinancing 5.3 12.7 18.1 31.5 40.7 39.3 35.6 -9% 37%
4 Financial New Investment by Technology
4.1 Wind 11.3 21.9 29.7 51.1 62.7 72.7 94.7 30% 43%
4.2 Solar 0.5 3.2 10.4 21.8 33.3 25.3 26.1 3% 91%
4.3 Biofuels 1.6 6.0 20.4 20.0 18.7 6.9 5.5 -20% 23%
4.4 Biomass & w-t-e 3.7 6.7 10.0 11.4 10.1 11.5 11.0 -5% 20%
4.5 Small hydro 1.1 4.4 4.2 5.0 5.8 4.1 3.2 -22% 19%
4.6 Geothermal 1.0 0.4 1.3 1.9 1.6 1.4 2.0 44% 12%
4.7 Marine 0.0 0.0 0.5 0.4 0.1 0.2 0.1 -44% 33%
Total 19 43 76 111 132 122 143 17% 40%
5 Financial New Investment by Geography
5.1 Global
5.1.1 Europe 9.0 18.4 27.3 46.6 47.6 45.0 35.2 -22% 25%
5.1.2 North America 3.8 10.3 24.6 29.4 32.3 19.7 30.1 53% 41%
5.1.3 South America 0.5 2.8 4.7 7.7 15.7 9.4 13.1 39% 70%
5.1.4 Asia & Oceania 5.6 11.0 18.3 26.2 34.4 45.7 59.3 30% 48%
5.1.5 Middle East & Africa 0.3 0.1 1.5 1.5 2.4 2.4 5.0 104% 57%
Total 19 43 76 111 132 122 143 17% 40%
5.2 Selected Developing Countries/Regions
5.2.1 Brazil 0.4 1.8 4.2 6.4 13.2 7.3 6.9 -5% 62%
5.2.2 China 1.5 4.7 9.2 14.2 23.9 38.3 48.9 28% 80%
5.2.3 India 1.3 2.7 3.8 5.1 4.1 3.0 3.8 25% 19%
5.2.5 Africa 0.3 0.1 0.6 0.7 1.1 0.7 3.6 384% 51%
Footnote:
Source: Bloomberg New Energy Finance, UNEP
New investment volume adjusts for re-invested equity. Total values include estimates for undisclosed deals.
Figure 4
Data:
Units: $bn 2004 2005 2006 2007 2008 2009 2010
developed FNI 15 31 55 80 82 67 70
developed SDC 9 10 8 11 19 28 56
Developed total 24 41 64 91 101 95 126
developing FNI 4 12 21 32 51 55 72
developing SDC 0 1 1 2 2 3 4
Developing total 4 13 22 34 53 59 76
Total 28 53 86 125 154 153 202
Footnote:
Source: Bloomberg New Energy Finance
FINAL: Waterfall version no: 2011.01
Financial new investment and small distributed capacity in renewable energy: developed v developing countries, 2004-2010
$bn
FNI = financial new investment; SDC = small distributed capacity. New investment volume
adjusts for re-invested equity. Total values include estimates for undisclosed deals.
Figure 5
Data:
Units: $bn 2004 2005 2006 2007 2008 2009 2010
Developed 15 31 55 80 82 67 70
Developing 4 12 21 32 51 55 72
Total 19 43 76 111 132 122 143
% Growth 120% 79% 46% 19% -7.7% 17%
Footnote:
Source: Bloomberg New Energy Finance, UNEP
FINAL: Waterfall version no: 2011.01
Financial new investment in renewable energy: developed v developing countries, 2004-2010
New investment volume adjusts for re-invested equity. Total values include estimates for
undisclosed deals
Figure 6
Data:
Units: $bn 2010 % growth on 2009
Marine 0.1 -44%
Geothermal 2 44%
Small hydro 3 -22%
Biofuels 6 -20%
Biomass & w-t-e 11 -5%
Solar 86 52%
Wind 95 30%
Footnote:
Source: Bloomberg New Energy Finance, UNEP
Financial new investment and small distributed capacity in renewable energy by technology, 2010, and growth on 2009
$bn
New investment volume adjusts for re-invested equity. Total values include estimates for
undisclosed deals.
Figure 7
Data:
Units: $bn 2010 % growth on 2009 2009 blank series
Solar 2.2 30% 1.7 0
Wind 1.5 17% 1.3 0
Biofuels 0.7 -36% 1.1 0
Small hydro 0.5 1704% 0.0 0
Biomass & w-t-e 0.4 8% 0.4 0
Geothermal 0.1 53% 0.1 0Marine 0.1 6% 0.1 0
Footnote:
Source: Bloomberg New Energy Finance, UNEP
FINAL: Waterfall version no: 2011.01
VC/PE new investment in renewable energy by technology, 2010
$bn
VC/PE new investment excludes PE buy-outs. Total values include estimates for
undisclosed deals.
Figure 8
Data:
Units: $bn 2010 % growth on 2009 2009 blank series
Wind 8.2 58% 5.2 0
Solar 5.3 -17% 6.4 0
Biofuels 0.8 113% 0.4 0
Small hydro 0.5 248% 0.1 0
Biomass & w-t-e 0.4 2413% 0.0 0
Geothermal 0.1 -70% 0.4 0
Marine 0.01 0 in 2009 0
Footnote:
<None>
Source: Bloomberg New Energy Finance, UNEP
FINAL: Waterfall version no: 2011.01
Public markets new investment in renewable energy by technology, 2010
$bn
Figure 9
Data:
Units: $bn 2010 % growth on 2009 2009 blank series
Wind 89.7 33% 67.3 0
Solar 18.9 5% 17.9 0
Biomass & w-t-e 10.2 -10% 11.4 0
Biofuels 4.7 -19% 5.8 0
Small hydro 2.3 -43% 4.0 0
Geothermal 2.0 108% 0.9 0
Marine 0.04 -74% 0.1 0
Footnote:
Source: Bloomberg New Energy Finance, UNEP
FINAL: Waterfall version no: 2011.01
Asset finance of new-build renewable energy assets by technology, 2010
$bn
Total values include estimates for undisclosed deals
Figure 10
Data:
Units: $bn Q1 04 Q2 04 Q3 04 Q4 04 Q1 05 Q2 05 Q3 05 Q4 05 Q1 06 Q2 06 Q3 06 Q4 06 Q1 07 Q2 07 Q3 07 Q4 07 Q1 08 Q2 08 Q3 08 Q4 08 Q1 09 Q2 09 Q3 09 Q4 09 Q1 10 Q2 10 Q3 10 Q4 10 Q1 11
Total 5 4 5 6 9 10 9 14 13 19 17 27 21 22 28 41 27 38 35 33 19 35 34 34 32 31 35 44 31
4Q running average 5 6 7 9 11 12 14 16 19 21 22 24 28 29 33 35 33 31 30 30 31 34 33 33 36 35
Footnote:
Source: Bloomberg New Energy Finance, UNEP
FINAL: Waterfall version no: 2010.04
Global financial new investment in renewable energy quarterly trend, Q1 2004-Q1 2011
$bn
New investment volume adjusts for re-invested equity. Total values include
estimates for undisclosed deals
Figure 11
Data
Units: $bn 2010 % growth on 2009
Czech Republic 3.6 102%
India 4.0 29%
France 4.0 26%
Spain 4.9 -53%
Canada 5.2 52%
Brazil 6.9 -5%
Italy 13.8 136%
United States 29.6 56%
Germany 41.0 100%
China 49.8 28%
Footnote:
Source: Bloomberg New Energy Finance, UNEP
Financial new investment and small distributed capacity in renewable energy by country, 2010, and growth on 2009
$bn
Top 10 countries. Adjusted for re-invested equity
Figure 12
Data:
Developed Developing Total
Units: $bn 2010 % growth on 2009 2010 % growth on 2009 % growth on 2009
Marine 0.1 -43% 0.01 -46% -44%
Geothermal 1.0 5% 1.0 143% 44%
Small hydro 0.7 -34% 2.5 -18% -22%
Biofuels 1.6 -46% 3.9 0% -20%
Biomass & w-t-e 5.1 -25% 5.9 24% -5%
Solar 18.9 -7% 7.2 48% 3%
Wind 44.1 27% 50.6 33% 30%
Footnote:
Source: Bloomberg New Energy Finance, UNEP
FINAL: Waterfall version no: 2011.01
Total values include estimates for undisclosed deals. Adjusts for re-invested equity. This comparison does not
include small-scale projects.
Financial new investment in renewable energy: developed v developing countries, 2010, and total growth on 2009
$bn
Figure 13
Data:
Units: $bn 2010 % growth on 2009 2009 Disclosed Total
Asia & Oceania 59.3 30% 45.7 170 412
Europe 35.2 -22% 45.0 99 118
North America 30.1 53% 19.7 351 460
South America 13.1 39% 9.4 46 121
Middle East & Africa 5.0 104% 2.4 15 23
Footnote:
Source: Bloomberg New Energy Finance, UNEP
FINAL: Waterfall version no: 2011.01
Financial new investment in renewable energy by region, 2010
$bn
No. Of Deals: 2008
New investment volume adjusts for re-invested equity. Total values include estimates for
undisclosed deals. This comparison does not include small-scale projects.
Figure 14
Data:
Units: $bn 2004 2005 2006 2007 2008 2009 2010
Europe 9.0 18.4 27.3 46.6 47.6 45.0 35.2
North America 3.8 10.3 24.6 29.4 32.3 19.7 30.1
Asia & Oceania 5.6 11.0 18.3 26.2 34.4 45.7 59.3
South America 0.5 2.8 4.7 7.7 15.7 9.4 13.1
Middle East & Africa 0.3 0.1 1.5 1.5 2.4 2.4 5.0
Total
Footnote:
Source: Bloomberg New Energy Finance, UNEP
FINAL: Waterfall version no: 2011.01
Financial new investment in renewable energy by region, 2004-2010
$bn
New investment volume adjusts for re-invested equity. Total values include estimates for
undisclosed deals. This comparison does not include small-scale projects.
Figure 15
Data:
Units: $bn 2010 % growth on 2009
Israel 0.4 90%
Belgium 0.6 16%
China 0.9 43%
Australia 0.9 74%
Czech Republic 2.3 163%
France 2.7 150%
Japan 3.3 48%
United States 4.5 49%
Italy 5.5 59%
Germany 34.3 132%
Footnote:
Source: Bloomberg New Energy Finance
FINAL: Waterfall version no: 2011.01
Small distributed capacity investment by country, 2010, and growth on 2009
$bn
Top 10 countries. Represents investments in solar PV projects with capacities below 1MW
Figure 16
Data
Units: $bn Asset finance Public markets VC/PE Total
Wind 38.1 3.2 0.1 41.4
Solar 2.0 1.8 0.01 3.8
Biomass & w-t-e 3.7 - - 3.7
Footnote:
Source: Bloomberg New Energy Finance, UNEP
FINAL: Waterfall version no: 2011.01
Financial new investment in renewable energy in China by sector and asset class, 2010
$bn
Asset finance adjusts for re-invested equity.
Figure 17
Data
Sector/asset class Asset finance Public markets VC/PE Grand Total
Wind 2.3 0.3 - 2.6
Biomass & w-t-e 0.4 0.2 0.02 0.6
Solar 0.4 0.1 0.03 0.5
Footnote:
Source: Bloomberg New Energy Finance, UNEP
FINAL: Waterfall version no: 2011.01
Financial new investment in renewable energy in India by sector and asset class, 2010
$bn
Asset finance adjusts for re-invested equity.
Figure 18
Data
Units: $bn Asset finance Public markets VC/PE Grand Total
Biofuels 2.1 0.3 - 2.4
Wind 2.3 0.1 - 2.4
Small hydro 1.0 - 0.2 1.2
Biomass & w-t-e 0.8 - 0.1 0.9
Footnote:
Source: Bloomberg New Energy Finance, UNEP
FINAL: Waterfall version no: 2011.01
Financial new investment in renewable energy in Brazil by sector and asset class, 2010
$bn
Asset finance adjusts for re-invested equity.
Figure 19
Data
Units: $bn Asset finance Public markets VC/PE Total
Wind 14.9 0.4 0.8 16.1
Solar 2.6 1.0 1.9 5.5
Biofuels 0.2 0.3 0.7 1.2
Biomass & w-t-e 1.3 0.1 0.05 1.4
Geothermal 0.6 0.01 0.1 0.7
Footnote:
Source: Bloomberg New Energy Finance, UNEP
FINAL: Waterfall version no: 2011.01
Financial new investment in renewable energy in the United States by sector and asset class, 2010
$bn
Asset finance adjusts for re-invested equity.
Figure 20
Data
Units: $bn Asset finance Public markets VC/PE Total
Wind 1.0 3.6 - 4.5
Solar 3.1 - - 3.1
Biomass & w-t-e 0.7 - 0.04 0.8
Footnote:
Source: Bloomberg New Energy Finance, UNEP
FINAL: Waterfall version no: 2011.01
Financial new investment in renewable energy in Italy by sector and asset class, 2010
$bn
Asset finance adjusts for re-invested equity.
Figure 21
Data
Units: $bn 2010
Colombia 0.12
Nicaragua 0.18
Panama 0.29
Honduras 0.40
Peru 0.48
Venezuela 0.65
Argentina 0.74
Chile 0.96
Mexico 2.32
Footnote:
Source: Bloomberg New Energy Finance, UNEP
FINAL: Waterfall version no: 2011.01
Financial new investment in renewable energy in Latin America (excluding Brazil) by country, 2010
$bn
Omits countries with less than $0.1bn investment
Figure 22
Data
Units: $bn 2010
Laos 0.10
Indonesia 0.25
Vietnam 0.38
Taiwan 0.66
Thailand 0.70
Pakistan 1.45
Footnote:
Source: Bloomberg New Energy Finance, UNEP
FINAL: Waterfall version no: 2011.01
Financial new investment in renewable energy in non-OECD Asia (excluding China and India) by country, 2010
$bn
Omits countries with less than $0.1bn investment
Figure 23
Data
Units: $bn 2010
Sudan 0.10
Libya 0.15
Cape Verde 0.16
Morocco 0.18
Zambia 0.18
Kenya 1.33Egypt 1.33
Footnote:
Source: Bloomberg New Energy Finance, UNEP
FINAL: Waterfall version no: 2011.01
Financial new investment in renewable energy in Africa by country, 2010
$bn
Omits countries with less than $0.1bn investment
Figure 24
Data:
Unit: % 2004 2005 2006 2007 2008 2009 2010
Renewable power capacity change as a % of global power capacity change (net) 10.2% 14.8% 13.4% 16.2% 25.9% 34.1% 34.2%
Renewable power generation change as a % of global power generation change (net) 3.5% 4.5% 5.0% 7.9% 17.3% 29.4% 29.9%
Renewable power as a % of global power capacity 4.3% 4.6% 5.0% 5.4% 6.1% 7.1% 8.1%
Renewable power as a % of global power generation 3.5% 3.5% 3.6% 3.8% 4.0% 4.7% 5.4%
Footnote:
Source: EIA, IEA, Bloomberg New Energy Finance
FINAL: Waterfall version no: 2011.01 (for renewable energy portion)
Renewable power excludes large hydro. Renewable capacity figures based on Bloomberg New Energy
Finance global totals.
Renewable power generation and capacity as a proportion of global power, 2004-2010
%
Figure 25
Data:
Units: $bn 2004 2005 2006 2007 2008 2009 2010
Fossil fuel investment 132 132 187 201 196 212 219
Renewable energy investment 27 48 72 103 136 139 187
Difference -106 -84 -116 -97 -60 -74 -31Total investment 159 180 259 304 332 351 406
Footnote:
Source: EIA, IEA, Bloomberg New Energy Finance
FINAL: Waterfall version no: 2011.01 (for renewable energy portion)
Investment in clean energy v conventional capacity, 2004-2010
$bn
Values represent investment for new build capacity, where fossil fuel investment is calculated from EIA & IEA
data and clean energy investment is sourced from Bloomberg New Energy Finance (comprising new build
asset finance and small distributed capacity investment).
Figure 26
Data:
Units: GW 2010 2011 2012
Renewable energy 60 69 79
Fossil fuel 92 95 97
Footnote:
Source: Bloomberg New Energy Finance, EIA, IEA
FINAL: Waterfall version no: 2011.01 (for clean energy portion)
Forecast annual net capacity additions, 2010-2012
GW
Renewable forecast based on Bloomberg New Energy Finance projections for wind, solar, bioenergy and
geothermal. Conventional thermal capacity projection based on IEA compound growth rate
Figure 27
Data:
Units: $bn 2004 2005 2006 2007 2008 2009 2010
North America 1.0 1.3 2.2 3.0 2.5 3.1 3.3
Europe 0.2 0.4 0.7 0.7 0.3 0.4 0.5
Asia & Oceania 0.1 0.04 0.1 0.1 0.4 0.6 1.2
Middle East & Africa - 0.03 0.02 0.03 0.01 0.01 0.02
South America - 0.004 - - - - -
Disclosed deal count 119 148 180 213 174 166 182
Total deal count 136 173 207 231 185 188 192
Total 1.3 1.8 3.0 3.8 3.2 4.2 5.0
Footnote:
Source: Bloomberg New Energy Finance
FINAL: Waterfall version no: 2011.01
Financial new investment in energy-smart technologies by region, 2004-2010
$bn
Includes fundraisings of energy smart technology companies through VC/PE or PM
transactions. Does not include investment in energy smart technology projects.
Figure 28
Data:
Units: $bn 2004 2005 2006 2007 2008 2009 2010
Corporate R&D 4 3 3 3 4 4 3
Government R&D 1 1 1 2 2 2 5
Total 5 4 4 5 5 6 9
% Growth -16% 6% 10% 11% 14% 40%
Footnote:
<none>
Source: Bloomberg, Bloomberg New Energy Finance, IEA, IMF, various government agencies
FINAL: Waterfall version no: 2011.01
R&D investment in renewable energy, 2004-2010
$bn
Figure 29
Data:
Corporate R&D Government R&D Total
Units: $bn 2010 % growth on 2009 2010 % growth on 2009 % growth on 2009
Small hydro 0.03 -18% 0.07 177% 60%
Marine 0.01 -11% 0.17 167% 135%
Geothermal 0.03 4% 0.41 62% 56%
Biomass & w-t-e 0.26 5% 0.33 30% 18%
Wind 0.49 15% 0.81 220% 92%
Biofuels 0.33 -4% 2.01 142% 100%
Solar 2.12 -19% 1.48 108% 8%
Footnote:
<none>
Source: Bloomberg, Bloomberg New Energy Finance, IEA, IMF, various government agencies
FINAL: Waterfall version no: 2011.01
Corporate and government R&D renewable energy investment by technology, 2010, and total growth on 2009
$bn
Figure 30
Data:
Total Corporate R&D Government R&D
Units: nominal $bn 2010 % growth on 2009 2010 % growth on 2009 % growth on 2009 2009 blank series 2009 blank serieschart labels Growth labels
Middle East & Africa 0.00 0% 0.00 8% 0% 3.78699458 0 1 0 0.004/0.001 0% | 8%
India 0.04 50% 0.04 10% 27% 28.5102227 0 37 0 0.04/0.04 50% | 10%
AMER (exc. US & Brazil) 0.02 -4% 0.09 3% 2% 16.6463812 0 83 0 0.02/0.1 -4% | 3%
Brazil 0.01 -16% 0.10 8% 5% 11.7639925 0 90 0 0.01/0.1 -16% | 8%
China 0.13 21% No data No data No data 103.318622 0 No data 0 0.13/No data 21% | No data
United States 0.50 25% 1.01 3% 9% 399.178554 0 982 0 0.5 1.0 25% | 3%
Europe 0.87 -2% 1.11 2% 0% 889.420405 0 1091 0 0.9 1.1 -2% | 2%
ASOC (exc. China & India) 1.71 -25% 2.94 2591% 96% 2263.64919 0 109 0 1.7 2.9 -25% | 2591%
Footnote:
<none>
Source: Bloomberg, Bloomberg New Energy Finance, IEA, IMF, various government agencies
FINAL: Waterfall version no: 2011.01
Corporate and government R&D renewable energy investment by region, 2010, and growth on 2009
$bn
Corporate R&D Government R&D
Figure 31
Data:
Units: $bn 2004 2005 2006 2007 2008 2009 2010
VC early stage 0.21 0.25 0.65 1.15 1.50 0.66 0.93
VC late stage 0.17 0.32 0.63 0.74 1.37 0.87 1.49
PE expansion capital 0.33 0.80 3.05 3.15 6.59 3.12 3.10
Total 0.7 1.4 4.3 5.0 9.5 4.6 5.5
% Growth 90% 217% 16% 88% -51% 19%
Disclosed deal count 52 76 143 209 236 179 202
Total deal count 73 95 178 242 278 207 209
Footnote:
Source: Bloomberg New Energy Finance, UNEP
FINAL: Waterfall version no: 2011.01
VC/PE new investment in renewable energy by stage, 2004 - 2010
$bn
Buy-outs are not included as new investment. Total values include estimates for undisclosed
deals
Figure 32
Data:
Units: $bn 2010 % growth on 2009 Disclosed deal count Total deal count 2009 blank series
PE buy-out 0.81 -71% 8 20 2.79 0
PE expansion capital 3.10 -1% 57 59 3.12 0
VC bridge/interim 0.08 -45% 13 13 0.15 0
VC further rounds 0.90 124% 22 22 0.40 0
VC series C 0.52 61% 16 16 0.32 0
VC series B 0.60 74% 28 30 0.34 0
VC series A 0.31 5% 61 64 0.30 0
VC seed/spin-off 0.02 0.1% 5 5 0.02 0
Footnote:
Source: Bloomberg New Energy Finance, UNEP
FINAL: Waterfall version no: 2011.01
VC/PE new investment in renewable energy by stage, 2010, and growth on 2009
$bn
Buy-outs are not included as new investment. Total values include estimates for undisclosed deals
Figure 33
Data:
Units: $bn 2004 2005 2006 2007 2008 2009 2010
Solar 0.21 0.45 1.47 2.44 4.69 1.69 2.21
Biofuels 0.07 0.50 1.46 1.30 1.69 1.10 0.70
Wind 0.35 0.20 0.87 0.52 1.81 1.30 1.53
Biomass & w-t-e 0.06 0.15 0.35 0.48 0.59 0.39 0.42
Small hydro 0.00 0.00 0.05 0.05 0.43 0.03 0.48
Geothermal 0.00 0.05 0.05 0.11 0.17 0.08 0.13
Marine 0.01 0.01 0.07 0.16 0.09 0.06 0.06
Total 0.7 1.4 4.3 5.0 9.5 4.6 5.5
Footnote:
Source: Bloomberg New Energy Finance, UNEP
FINAL: Waterfall version no: 2011.01
VC/PE new investment in renewable energy by sector, 2004-2010
$bn
Buy-outs are not included as new investment. Total values include estimates for undisclosed deals.
Figure 34
Data:
Units: $bn 2010 % growth on 2009 2009 blank series
Marine 0.1 6% 0.1 0
Geothermal 0.1 53% 0.1 0
Biomass & w-t-e 0.4 8% 0.4 0
Small hydro 0.5 1704% 0.0 0
Biofuels 0.7 -36% 1.1 0
Wind 1.5 17% 1.3 0
Solar 2.2 30% 1.7 0
Total 5522
Footnote:
Source: Bloomberg New Energy Finance, UNEP
FINAL: Waterfall version no: 2011.01
VC/PE new investment in renewable energy by sector, 2010, and growth on 2009
$bn
Buy-outs are not included as new investment. Total values include estimates for undisclosed
deals
Figure 35
Data:
Units: $bn 2004 2005 2006 2007 2008 2009 2010
Europe 0.48 0.35 1.36 1.36 2.56 1.00 0.75
North America 0.17 0.90 2.04 2.29 4.94 2.49 3.71
Asia & Oceania 0.06 0.12 0.93 0.80 1.17 0.28 0.21
South America 0.55 0.46 0.84 0.76
Middle East & Africa 0.01 0.00 0.00 0.04 0.34 0.04 0.09
total 0.0 0.7 1.4 4.3 5.0 9.5 4.6 5.5
Footnote:
Source: Bloomberg New Energy Finance, UNEP
FINAL: Waterfall version no: 2011.01
VC/PE new investment in renewable energy by region, 2004-2010
$bn
Buy-outs are not included as new investment. Total values include estimates for undisclosed
deals
Figure 36
Data:
Units: $bn 2010 % growth on 2009 2009 blank series
Middle East & Africa 0.09 133% 0.04 0
Asia & Oceania 0.21 -25% 0.28 0
Europe 0.75 -25% 1.00 0
South America 0.76 -9% 0.84 0
North America 3.71 49% 2.49 0
Total 5.5
Footnote:
Source: Bloomberg New Energy Finance, UNEP
FINAL: Waterfall version no: 2011.01
VC/PE new investment in renewable energy by region, 2010, and growth on 2009
$bn
Buy-outs are not included as new investment. Total values include estimates for
undisclosed deals
Figure 37
Data:
Units: $bn 2004 2005 2006 2007 2008 2009 2010
IPO 0.2 2.5 7.5 11.8 3.3 3.2 9.3
Secondary & PIPE 0.1 1.0 2.8 5.1 2.4 6.3 3.2
Convertible & Other 0.0 0.4 0.3 4.8 6.6 2.5 2.5
OTC 0.0 0.1 0.4 0.3 0.4 0.5 0.4
IPO/Secondary & PIPE/Convertible & Other/OTC deal count(7/12/4/7) (30/47/29/13) (39/53/37/41) (41/89/54/40) (18/63/62/30) (11/90/42/25) (28/73/44/25)
Total 0.0 0.4 4.0 11.0 22.0 12.8 12.5 15.4
Footnote:
<none>
Source: Bloomberg New Energy Finance, UNEP
FINAL: Waterfall version no: 2011.01
Public market new investment in renewable energy by stage, 2004-2010
$bn
Figure 38
Data:
2009
Total
Footnote:
Source: Bloomberg New Energy Finance
NEX vs selected indices
N/a
Index Values as of 8 April 2011; AMEX Oil, NASDAQ and S&P 500 rebased
to 100 on 30 December 2002
Figure 39
Data:
Units: $bn 2004 2005 2006 2007 2008 2009 2010
Solar 0.06 1.74 4.76 7.79 6.74 6.40 5.32
Wind 0.05 1.24 1.62 10.84 3.60 5.18 8.22
Biofuels 0.08 0.72 3.63 1.45 1.74 0.36 0.76
Biomass & w-t-e 0.01 0.26 0.55 1.32 0.20 0.02 0.44
Geothermal 0.14 0.03 0.47 0.36 0.49 0.39 0.12
Small hydro 0.02 0.01 0.02 0.15 0.00 0.14 0.49
Marine 0.00 0.00 0.00 0.12 0.00 0.00 0.01
Total 0.4 4.0 11.0 22.0 12.8 12.5 15.4
Total deal count 30 119 170 224 173 168 170
Footnote:
<none>
Source: Bloomberg New Energy Finance, UNEP
FINAL: Waterfall version no: 2011.01
Public market new investment in renewable energy by sector, 2004-2010 $bn
Figure 40
Data:
Units: $bn 2010 % growth on 2009 2009 blank series
Marine 0.01 0 in 2009 0.00 0
Geothermal 0.12 -70% 0.39 0
Biomass & w-t-e 0.44 2413% 0.02 0
Small hydro 0.49 248% 0.14 0
Biofuels 0.76 113% 0.36 0
Solar 5.32 -17% 6.40 0
Wind 8.22 58% 5.18 0
Footnote:
<none>
Source: Bloomberg New Energy Finance, UNEP
FINAL: Waterfall version no: 2011.01
Public market new investment in renewable energy by sector, 2010, and growth on 2009
$bn
Figure 41
Data:
Units: $bn 2004 2005 2006 2007 2008 2009 2010
Europe 0.1 1.7 6.9 13.6 5.9 2.8 5.7
North America 0.2 1.1 3.2 5.6 4.7 3.1 2.6
Asia & Oceania 0.0 0.7 0.8 2.7 0.8 6.5 6.6
South America 0.4 0.2 0.1 1.4 0.0 0.5
Middle East & Africa 0.0 0.0 0.0 0.0 0.0 0.0 0.0
Total 0.4 4.0 11.0 22.0 12.8 12.5 15.4
Footnote:
<none>
Source: Bloomberg New Energy Finance, UNEP
FINAL: Waterfall version no: 2011.01
Public market new investment in renewable energy by region of exchange, 2004-2010
$bn
Figure 42
Data:
Units: $bn 2010 % growth on 2009 2009 blank series
AIM (London) 0.42 2324% 0.02 0
Deutsche Börse - Official Market 0.49 27% 0.39 0
Toronto Stock Exchange 0.60 -7% 0.65 0
NASDAQ Global Market 0.71 -7% 0.76 0
Oslo Stock Exchange 0.77 -38% 1.25 0
Shenzhen Stock Exchange - ChiNext 0.82 489% 0.14 0
New York Stock Exchange 1.01 -4% 1.06 0
Shanghai Stock Exchange 1.04 424% 0.20 0
Hong Kong Stock Exchange 2.85 -31% 4.15 0
Borsa Italiana - MTA 3.55 0 in 2009 0.00 0
Footnote:
Source: Bloomberg New Energy Finance
FINAL: Waterfall version no: 2011.01
Public market new investment in renewable energy by exchange, 2010, and growth on 2009
$bn
Top 10 exchanges
Figure 43
Data:
Units: $bn 2010 % growth on 2009 2009 blank series
Brazil 0.42 1364% 28.455 0
United Kingdom 0.42 28646% 1.47 0
Germany 0.55 41% 388.5 0
India 0.56 -20% 699.195 0
Canada 0.61 -10% 677.185 0
Norway 0.77 -38% 1250.34 0
United States 0.79 -31% 1138.115 0
Taiwan 0.82 51% 543.815 0
Italy 3.55 221989% 1.6 0
China 5.92 34% 4406.915 0
Footnote:
Source: Bloomberg New Energy Finance
FINAL: Waterfall version no: 2011.01
Public market new investment in renewable energy by company nationality, 2010, and growth on 2009
$bn
Top 10 countries
Figure 44
Data:
Units: $bn 2004 2005 2006 2007 2008 2009 2010
Balance sheet 14.1 23.3 40.5 59.1 67.9 80.9 87.6
Debt 3.9 13.3 20.9 29.8 45.7 25.8 37.9
Bond/other 0.2 0.6 0.6 1.2 1.1 0.7 2.3
Disclosed deal count 208 536 697 930 955 769 595
Total deal count 460 866 1071 1506 1513 1372 1330
Total 18 37 62 90 115 107 128
Footnote:
Source: Bloomberg New Energy Finance
FINAL: Waterfall version no: 2011.01
Table for internal use only:
Units: $bn 2004 2005 2006 2007 2008 2009
Balance sheet 11.2 17.6 31.4 50.2 55.2 68.8
Bond 0.1 0.3 0.1 1.1 0.3 0.5
Construction convertible/term loan 4.3 15.1 23.5 31.6 45.9 28.4
Construction debt 0.2 0.1 3.6 6.2 6.6 3.3
Lease finance 0.1 0.1 0.2 0.0 0.0 0.0
Syndicated equity 0.0 0.0 0.0 0.0 0.4 0.0
Vendor finance 0.0 0.0 0.0 0.0 0.0 0.0
Asset financing new investment in renewable energy by type of security, 2004-2010
$bn
Total values include estimates for undisclosed deals.
Figure 45
Data:
Units: $bn 2004 2005 2006 2007 2008 2009 2010
Europe 8.5 16.3 19.2 34.1 42.0 42.3 28.9
Asia & Oceania 5.5 10.1 16.7 22.9 33.0 39.2 56.0
North America 3.4 8.3 20.0 24.2 23.4 14.5 25.2
South America 0.5 2.4 4.6 7.3 14.2 9.0 12.6
Middle East & Africa 0.3 0.1 1.5 1.6 2.0 2.4 5.0
Disclosed deal count 208 536 697 930 955 769 595
Total deal count 460 866 1071 1506 1513 1372 1330
Total 18 37 62 90 115 107 128
Footnote:
Source: Bloomberg New Energy Finance, UNEP
FINAL: Waterfall version no: 2011.01
Asset financing new investment in renewable energy by region, 2004-2010
$bn
Total values include estimates for undisclosed deals.
Figure 46
Data:
Units: $bn 2004 2005 2006 2007 2008 2009 2010
Wind 11 20 28 42 60 67 90
Solar 0 1 4 12 23 18 19
Biofuels 1 5 16 20 16 6 5
Biomass & w-t-e 4 6 9 10 9 11 10
Small hydro 1 4 4 5 6 4 2
Geothermal 1 0 1 2 1 1 2
Marine 0 0 0 0 0 0 0
Disclosed deal count 208 536 697 930 955 769 595
Total deal count 460 866 1071 1506 1513 1372 1330
Total 18 37 62 90 115 107 128
Footnote:
Source: Bloomberg New Energy Finance, UNEP
FINAL: Waterfall version no: 2011.01
Asset financing new investment in renewable energy by sector, 2004-2010
$bn
Total values include estimates for undisclosed deals.
Figure 47
Multilateral development banks: provision of finance for renewable energy projects
$bn
Data:
Units: $bn 2007 2008 2009 2010
Total 4.5 11.0 8.9 13.5% Growth 142% -19% 52%
blank series 0 0 0 0 0 0
Footnote:
Source: Bloomberg New Energy Finance
Excludes debt and equity provided to renewable energy manufacturers, and
debt and equity for energy efficiency
Figure 48
Data:
Units: $bn 2004 2005 2006 2007 2008 2009 2010
Total 9 11 9 13 21 31 60
% Growth 24% -11% 40% 60% 48.1% 91%
blank series 0 0 0 0 0 0 0
Footnote:
Source: Bloomberg New Energy Finance
FINAL: Waterfall version no: 2011.01
Small distributed capacity investment, 2004 - 2010
$bn
Represents investments in solar PV projects with capacities below 1MW
Figure 49
Data:
Units: $bn 2010 % growth on 2009
Israel 0.4 90%
Belgium 0.6 16%
China 0.9 43%
Australia 0.9 74%
Czech Republic 2.3 163%
France 2.7 150%
Japan 3.3 48%
United States 4.5 49%
Italy 5.5 59%
Germany 34.3 132%
Footnote:
Source: Bloomberg New Energy Finance
FINAL: Waterfall version no: 2011.01
Small distributed capacity investment by country, 2010, and growth on 2009
$bn
Top 10 countries. Represents investments in solar PV projects with capacities below 1MW
Figure 50
Data:
Units: % 2010
China 80.6%
Europe 10.2%
South America 2.0%
North America 2.3%
Oceania 2.2%
Asia (excl. China & Japan) 1.4%
Middle East 0.6%
Japan 0.3%Africa 0.3%
Footnote:
Source: International Energy Agency
Global installations of glazed water collectors by region, 2009
%
Newly installed capacity of glazed water collectors by economic region in 2009
Figure 51
Data:
Units: $bn 2004 2005 2006 2007 2008 2009 2010
PE buy-outs 1 3 2 3 6 3 1
Public market investor exits 0 1 2 4 1 2 1
Corporate M&A 2 9 13 19 18 22 20
Asset acquisitions & refinancing 5 13 18 31 41 39 36
Total 9 26 35 57 65 66 58
Disclosed deal count 43 131 162 266 279 266 228
Total deal count 84 253 335 482 501 493 459
Footnote:
Source: Bloomberg New Energy Finance
FINAL: Waterfall version no: 2011.01
Total values include estimates for undisclosed deals.
Acquisition transactions in renewable energy by type 2010
$bn
Figure 52
Data:
Units: $bn 2004 2005 2006 2007 2008 2009 2010
Wind 5 17 24 31 43 37 31
Solar 0 1 4 10 12 17 14
Biomass & w-t-e 1 3 1 2 2 2 3
Biofuels 0 1 4 6 4 6 7
Geothermal 0 1 0 7 1 2 2
Small hydro 2 2 1 1 2 3 1
Marine 0 0 0 0 0 0 0
Total 0 9 26 35 57 65 66 58
Footnote:
Source: Bloomberg New Energy Finance
FINAL: Waterfall version no: 2011.01
Acquisition transactions in renewable energy by sector 2010, and growth on 2009
$bn
Total values include estimates for undisclosed deals.
Figure 53
Data:
Units: $bn 2010 % growth on 2009 2009 blank series
Marine 0.2 6% 0.2 0
Small hydro 1 -65% 2.7 0
Geothermal 2 1% 1.8 0
Biomass & w-t-e 3 69% 1.6 0
Biofuels 7 20% 5.8 0
Solar 14 -15% 16.7 0
Wind 31 -16% 36.9 0
Footnote:
Source: Bloomberg New Energy Finance
FINAL: Waterfall version no: 2011.01
Acquisition transactions in renewable energy by technology, 2010, and growth on 2009
$bn
Total values include estimates for undisclosed deals.
Figure 54
Data:
Units: $bn 2004 2005 2006 2007 2008 2009 2010 Total
Europe 4.8 14.6 19.6 25.0 36.8 30.8 21.4 153.0
North America 3.3 8.1 11.4 21.2 18.1 20.4 22.5 105.0
Asia & Oceania 0.1 2.8 3.0 7.6 5.7 10.1 7.6 36.9
South America 0.3 0.3 1.0 3.5 2.7 3.4 6.1 17.4
Middle East & Africa 0.1 0.0 0.01 0.1 1.8 1.0 0.01 3.0
Total 0.0 8.6 25.8 35.1 57.3 65.1 57.7
Footnote:
Source: Bloomberg New Energy Finance
FINAL: Waterfall version no: 2011.01
Acquisition transactions in renewable energy by region, 2004-2010
$bn
Total values include estimates for undisclosed deals
Figure 55
Data:
Units: $bn Q1 04 Q2 04 Q3 04 Q4 04 Q1 05 Q2 05 Q3 05 Q4 05 Q1 06 Q2 06 Q3 06 Q4 06 Q1 07 Q2 07 Q3 07 Q4 07 Q1 08 Q2 08 Q3 08 Q4 08 Q1 09 Q2 09 Q3 09 Q4 09 Q1 10 Q2 10 Q3 10 Q4 10 Q1 11
Total 1 3 1 3 4 5 5 11 8 9 6 12 9 12 17 19 20 14 15 17 11 18 15 21 19 12 13 14 11
4Q running average 2 3 3 4 6 7 8 9 9 9 10 13 14 17 17 17 16 14 15 15 16 18 17 16 14 12
Footnote:
Source: Bloomberg New Energy Finance
FINAL: Waterfall version no: 2011.04
Global acquisition transactions in renewable energy: quarterly trend, Q1 2004-Q1 2011
$bn
Total values include estimates for undisclosed deals
Figure 56
Data:
Units: $bn
Venture
Capital
Private
Equity
Public
Equity
Project
Equity
Project
Debt
Emission
Credits
Private funds
Climate Change 0.2 0.1 1.6 0.5 0.1 4.3
Environment / Cleantech 8.5 10.2 6.0 0.6 0.3 5.5
Energy & Infrastructure 0.0 10.9 0.0 2.4 0.0 3.2
Clean Energy 4.2 12.3 6.6 12.6 5.5 8.5
Multilateral funds
Climate Change 0.0 0.0 0.0 0.9 3.5 2.2
Environment / Cleantech 0.0 0.0 0.0 0.1 0.5 0.0
Energy & Infrastructure 0.0 0.0 0.0 0.0 0.0 0.0
Clean Energy 0.0 0.0 0.0 0.6 2.5 0.0
Government funds
Climate Change 0.0 0.0 0.0 0.0 0.0 0.0
Environment / Cleantech 0.0 0.0 0.0 0.0 0.0 0.0
Energy & Infrastructure 0.0 0.0 0.0 0.0 0.0 0.0
Clean Energy 0.0 0.0 0.0 2.1 8.3 0.0
Total
Climate Change 0.2 0.1 1.6 1.4 3.6 6.4
Environment / Cleantech 8.5 10.2 6.0 0.7 0.8 5.5
Energy & Infrastructure 0.02 10.9 0.0 2.4 0.0 3.2Clean Energy 4.2 12.3 6.6 15.3 16.3 8.5
Footnote:
Source: Bloomberg New Energy Finance
Sustainable energy funds by focus and asset class, as at Q1 2011
$bn
Excludes SRI funds; Data as of 31 March; includes only funds with disclosed
values
Figure 57
Data:
Units: $bn Venture capital Private equity Public equity Project equity Project debt Emission credits Total
Climate change 1% 0% 11% 7% 0% 27% 8%
Environment / cleantech 66% 30% 42% 4% 5% 23% 26%
Energy & infrastructure 0% 32% 0% 12% 0% 13% 14%Clean energy 33% 37% 47% 77% 95% 36% 52%
100% 100% 100% 100% 100% 100%
Footnote: Excludes SRI
Source: Bloomberg New Energy Finance
Sustainable energy funds by asset class, as at Q1 2011
%