+ All Categories
Home > Documents > Global Value Chains Mapping: Methodology and Cases for ...

Global Value Chains Mapping: Methodology and Cases for ...

Date post: 14-Mar-2022
Category:
Upload: others
View: 3 times
Download: 0 times
Share this document with a friend
73
Emanuela Todeva Ruslan Rakhmatullin Thematic Work on Value Chain Mapping in the Context of Smart Specialisation Global Value Chains Mapping: Methodology and Cases for Policy Makers 2016 EUR 28085 EN
Transcript

Emanuela Todeva Ruslan Rakhmatullin

Thematic Work on Value

Chain Mapping in the

Context of Smart

Specialisation

Global Value Chains Mapping: Methodology and Cases

for Policy Makers

2016

EUR 28085 EN

This publication is a Science for Policy report by the Joint Research Centre, the European Commission’s in-house

science service. It aims to provide evidence-based scientific support to the European policy-making process.

The scientific output expressed does not imply a policy position of the European Commission. Neither the

European Commission nor any person acting on behalf of the Commission is responsible for the use which might

be made of this publication.

JRC Science Hub

https://ec.europa.eu/jrc

JRC102803

EUR 28085 EN

PDF ISBN 978-92-79-61507-8 ISSN 1831-9424 doi:10.2791/273290

© European Union, 2016

Reproduction is authorised provided the source is acknowledged.

How to cite: E. Todeva, R. Rakhmatullin 2016; Global Value Chains Mapping: Methodology and Cases

for Policy Makers, JRC Science for Policy Report, European Union, EUR 28085 EN; doi:10.2791/273290

All images © European Union 2016

Abstract:

This paper is a paper in a series of work on Global Value Chains (GVCs), developed under the auspices of the

Joint Research Centre (JRC) of the European Commission. It builds upon the theoretical discussion presented

in the first two papers and offers a new methodological approach for mapping GVCs, using a bespoke dataset

of the most innovative biopharma MNEs. The paper takes the example of the global biopharma value chain

and describes the step-by-step procedure for mapping interconnected capabilities at a global scale, the

concentration of biopharma capabilities in Europe, and two cases of regional and national specialisation in this

sector. The proposed methodological approach contains two distinctive methodologies – for top-down global

value chain mapping of an established industry sector (such as biopharma), and for a bottom-up mapping of

capabilities within the GVC that operate at specific locations. Both methodologies can be applied to emerging

sectors and segments driven by key enabling technologies, such as photonics, advanced materials, 3D

printing, or renewable energy, or any other cross-sectoral value chains. The paper includes two cases of

application of this methodology at regional and national level. These are the cases of Bulgaria and the Greater

South East of England in the UK. The novel methodology and methods for data collection and visualisation

demonstrate the linkages across segments of the biopharmaceutical GVC and the position of firms at the

cross-section of biotechnology discovery and pharmaceutical drug development and manufacturing activities,

managing a complex network of outsourcing, insourcing and supply relationships, through a vast empire of

subsidiaries around the world. Capturing and representing the value-chain within biopharma MNEs enables

policy makers to understand the complexity of industry organisation across multiple locations around the

world and the global knowledge and resource linkages that drive further growth in the sector.

Table of contents

Executive summary ............................................................................................... 2

1. Introduction: the need for value chain capability mapping .............................. 3

1.1. The global biopharma ................................................................................ 5

2. Mapping global value chains with data on multinational firms .......................... 7

2.1. Lead principles .......................................................................................... 8

2.2. Methodological steps .................................................................................. 9

2.3. Analysis of the structure of biopharma GVC ................................................ 19

3. Case study: Bulgarian biopharma value chain ............................................. 28

3.1. Capability mapping methodology overview ................................................. 28

3.2. Analysis of the value chain structure of Bulgarian biopharma ........................ 31

4. Case study: biomedical and biopharma value chain in the Greater South East of

England, UK ............................................................................................ 35

4.1. Cluster overview ..................................................................................... 35

4.2. Capability mapping methodology overview ................................................. 35

4.3. Analysis of the value chain structure of biomedical and

biopharma cluster in the Greater South East of England ............................... 37

5. Recommendations for policy makers .......................................................... 41

5.1. Smart specialisation strategy implementation ............................................. 42

5.2. Cluster growth ........................................................................................ 43

5.3. SME support ........................................................................................... 44

5.4. Technology policy and key enabling technologies (KETs) .............................. 45

5.5. Inter-regional cooperation networks .......................................................... 45

5.6. Recommendations on how to map strategic capabilities and value chains ....... 46

6. References ............................................................................................. 48

Data Sources .......................................................................................... 50

Web-links to resources ............................................................................. 50

List of tables ........................................................................................... 52

List of figures .......................................................................................... 53

List of maps ............................................................................................ 53

Appendix: additional tables, figures and maps ............................................ 54

2

Executive summary

Policy context

This paper is the third paper in a series of work on Global Value Chains (GVCs),

developed under the auspices of the Joint Research Centre (JRC) of the European

Commission. The proposed methodological approach for mapping of global value chains,

illustrated by two empirical cases of regional and national capabilities audit provide the

foundations of evidence-based policy intervention which is co-aligned with a number of

policy frameworks in Europe: EU industrial policy ‘Towards Industrial Renaissance’,

Regional growth through Smart Specialisation Strategy, COSME programme for SME

support, building Circular Economy for sustainable and inclusive growth, cluster policies

such as cluster internationalisation and mobilisation of European Strategic Cluster

Partnerships for smart specialisation investments, RECONFIRM Initiative for Regional

Co-Operation Networks, or the implementation of regional smart specialisation strategies

and inter-regional cooperation under the new thematic platforms launched at the Smart

Regions conference.

Key conclusions

The paper takes the example of the global biopharma value chain and describes the

step-by-step procedure for mapping interconnected capabilities at a global scale, the

concentration of biopharma capabilities in Europe, and two cases of regional and national

specialisation in this sector. The proposed methodological approach contains two

distinctive methodologies – for top-down global value chain mapping of an established

industry sector (such as biopharma), and for a bottom-up mapping of capabilities within

the GVC that operate at specific locations. Both methodologies can be applied to

emerging sectors and segments driven by key enabling technologies, such as photonics,

advanced materials, 3D printing, or renewable energy, or any other cross-sectoral value

chains. The paper includes two cases of application of this methodology at regional and

national level. These are the cases of Bulgaria and the Greater South East of England in

the UK.

The cases are selected to represent a country with no cluster concentrations in

biopharma (Bulgaria), and a region that hosts a mature biopharma cluster (the Greater

South East of England in the UK). The UK region combines 5 distinctive regional entities

surrounding London - East, South, South East of England, Inner London and Outer

London. The mapping of biopharma capabilities in these two cases follows the bottom-up

data collection method in order to include all small and medium size firms for each

location, representing a comprehensive dataset.

The proposed methodologies are designed to assist regions, cluster managers and

network coordinators in their efforts to advance through the first two stages of the

Vanguard methodology for inter-regional collaboration: Learn – Connect – Demonstrate -

Commercialise. It is suggested that mapping cross-sectoral and cross-regional value

chains for individual demonstration projects and thematic prototypes will enhance the

knowledge of regional stakeholders of their own capabilities and will enable them to

connect to other regions in the most effective way, facilitating accelerated input-output

market relationships through match-making.

3

1. Introduction: the need for value chain capability

mapping

Value chains are product and technology driven, where each new radical innovation in

product design or technology development initiates a new cycle of connectivity called a

value chain. Modern value chains are so complex that they are better described as value

networks, or interconnected firms and value added activities that integrate resource

flows across manufacturing and service providers, pushing final outputs to markets.

All current European economic development policy initiatives state that inter-firm, inter-

cluster, or inter-regional networks should be based on value chains – upgrading

positions or facilitating the emergence of new ones. Inter-cluster and inter-regional

business ecosystems for innovation and entrepreneurship are designed to facilitate the

development of new industrial value chains 1. Strategic cluster partnerships 2 , or the

current European cluster consortia all aspire to build innovative value chains which foster

joint inter-cluster, inter-regional and international strategies and activities.

Although the emphasis on value chain integration is profound in all current initiative of

the European Commission, the most recent thematic paper promoted by DG Growth on

mapping advanced manufacturing networks is still short of utilising firm databases in

order to scale up the value chain integration processes in Europe 3. Naming the key

European players is extremely important as large companies design the value chains and

drive their integration. Large firms play a pivotal role also in driving innovation, but

share this role with small technology and service firms, which sometimes operate under

the radar. Listing of the key players, hence bares the strong risk of omission, as it

circulates information of firms with reputation, ignoring innovation capabilities at the

periphery, or early stage creative ideas. Patenting also is a weak predictor of

investments in new products, processes and systems. The short lists of large and

medium size companies and public research organisations hardly represent value chain

integrators, but rather can be seen as lead components of fragmented value chains. The

observation that 20% of the regions in EU28 account for 80% of all innovation activities

indicates a high concentration of innovation capabilities and value chain activities in the

Vanguard and the first tier regions.

This concentration, however, cannot be substituted for value chain integration, and

identifying the detailed mapping of the physical location of scattered capabilities across

all European regions is paramount in order to enhance the collective performance of the

new priority sectors, such as energy, agro-food, advanced manufacturing and industrial

modernisation, ICT, digital and circular economy sectors.

The recently announced thematic platforms on agro-food, Industrial modernisation and

Energy (Smart regions conference) exhibit a new approach to economic growth, whereby

inter-regional and inter-sectoral collaboration is sought to address essential societal and

economic challenges. The essence of this approach is that inter-regional and inter-

1 Cluster facilitated projects for new industrial value chains. 2 ESCP, 2016. 3 Regional Innovation Monitor Plus, 2015.

Value Chain Networks are interconnected firms and value

added activities that integrate resource flows across

manufacturing and service providers, pushing final outputs to

markets.

4

cluster collaborations should be driven by the smart specialisation priorities, set by each

region; such inter-regional partnerships should refocus existing capabilities to address

major societal challenges, and they should aim to establish new and transform existing

value chains through innovation in technologies, products, processes, or services4. The

harvesting of information through entrepreneurial discovery process during the platform

info-days on industrial modernisation and agro-food, and the official platform launch

event at the smart regions conference highlight that we need to learn more about value

chains, so to be able to orchestrate them through investment in specific and selected

projects and activities.

Economic development policies require more GVC insights and comprehensive

understanding of the concentration of capabilities in countries, regions and clusters, as

well as the backward and forward linkages that are taking place across sectors and

between core and periphery actors, and the distribution of these capabilities across

SMEs, medium and large firms. Using comprehensive databases of firms for representing

industry value chains is an essential step towards scaling up from single demonstration

projects, to integrated capabilities and global competitive advantage in emerging

industries. Mapping strategic concentrations of capabilities and areas of firm

specialisation and diversification across sectors is the way forward for effective

orchestration of GVCs.

The current methodology paper, advances our knowledge on value chain mapping and

capability mapping for established industrial sectors such as biopharma, and offers a

new analytical tool for mapping of emerging and integrated cross-sectoral value chains

at regional and national level. This approach is designed to offer practical solutions for

the successful implementation and operability of the new thematic platforms. It

addresses four main challenges:

- How to map value chains and concentrations of capabilities in new

emerging sectors and to demonstrate the transformations that are taking place in

established sectors under intense innovation in products, processes and services;

- How to identify region's own capabilities in each specific industry segment that

is part of an integrated global value chain;

- How to identify all business actors, who are active R&D performers in a

particular industry segment (including SMEs with potential but no visibility, or

established reputation);

- How to exhibit the region’s position in global value chains.

The use of industry codes and data on large multinational enterprises (MNEs) is not new.

The value chain mapping methodology, outlined in this paper, however, offers a new

approach for mapping synergies across industry sectors and interconnected segments,

facilitating scaling up of value chain integration. Our approach is based on the

assumption that MNEs as multiproduct and multi-technology establishments internalise

multiple value chains and exhibit an integrated value system. Related diversification of

MNEs, combined with concentrations of localised capabilities in SMEs and medium size

firms exhibits chains of value added activities. Combining data across the top MNEs in a

sector can deliver a comprehensive value chain map that can be used for positioning

SMEs and new market players.

This paper discriminates between two distinctive methodological stages that require

different datasets. These are: a) mapping the global value chain (GVC) through

interrelated capabilities across MNEs and their subsidiaries; and b) mapping regional

capabilities in a sector, and positioning of these capabilities within the GVC through a

comprehensive dataset of firms in a particular location.

4 Smart regions conference.

5

For the purpose of illustration of this approach, we have selected the global biopharma,

which is an established sector with clearly identifiable related industry codes and an

integrated global value chain. An adaptation of this methodology using text mining

enables building a dataset of firms and value chain mapping in emerging industry

sectors. For the second stage of mapping of regional capabilities and positioning these

capabilities on the global value chain we have selected two cases – a national case with

smart specialisation strategy under the label of healthy life and biopharma (Bulgaria),

and a regional case of strong biomedical and biopharma capabilities (UK – Greater South

East, comprising East of England, Southeast of England and Inner / Outer London). Each

of these cases required the development of a bespoke dataset of firms within the

regional and national boundaries.

1.1. The global biopharma

Biopharma sector is an example of multi-product and multi-technology production

environment with multiple intermediary markets for technologies, intermediate products

and services, where co-specialisation is an essential component in the knowledge and

technology management process. Biopharma global value chain, hence, is expected to

follow the internationalisation of firm activities and the growth of the MNEs in this sector.

Biopharma MNEs are particularly efficient in generating synergies across multiple

technologies – both in the drug discovery and development and in the market

development segments.

Biopharma analysts have created numerous representations of the value-added links –

from drug discovery – through drug development and market development. The

biopharmaceutical industry is traditionally represented by 6 groups of activities (or

micro-bundles of resources and capabilities): design, make, test & develop, license and

reimburse, distribute, sell. This flow of value added along the chain of interconnected

activities in biopharma, however, is far too simplified, and industry analysts already have

pointed that the biopharma value chain is driven by two distinctive business models -

disease driven discovery activities, and development driven set of operations5.

A large biopharma MNE, such as Abbot laboratories, have capabilities across the entire

spectrum of operations and integrate both parts of the biopharma GVC. Abbot

laboratories has 135 registered large and very large subsidiary firms, active in 40

countries around the world, including 16 subsidiaries registered in the UK and 1 in

Bulgaria. This company alone manages operations across 24 industry codes and report

total revenue for 2013 over €33 bn6.

Regarding the representation of biopharma GVCs through input-output tables, World

Bank, OECD and other international institutions have selected the International Standard

Industrial Classification (ISIC) system, specially developed for global comparisons. The

ISIC categorisation bundles biopharma industry with the chemical sector at a two-digit

level (ISIC code 21 - Manufacture of pharmaceuticals, medicinal chemical and botanical

products), which excludes all other related activities, such as manufacturing of herb

infusions, pharmaceutical glassware, medical, surgical and dental instruments and

supplies, as well as research and development (R&D) for pharmaceuticals and biotech

pharmaceuticals, as well as growing of drug and pharmaceutical crops7.

The industry codes used in the European Union (NACE), or the North American Industrial

Classification System (NAICS) in the same way provide a fragmented representation of

the biopharma sector. As a result, current mapping initiatives that focus on the

biopharma sector offer metaphorical evidence of interconnected activities in the

5 Figure 13; Kearney (2013). 6 Bespoke global biopharma MNE dataset 2015, own calculations. 7 Table 8.

http://s3platform.jrc.ec.europa.eu/map?_captargmap_WAR_CapTargMapportlet_formDate=1466092512183&p_p_id=captargmap_WAR_CapTargMapportlet&p_p_lifecycle=0&p_p_state=normal&p_p_mode=view&p_p_col_id=column-1&p_p_col_count=1&_captargmap_WAR_CapTargMapportlet_mvcPath=%2Fhtml%2Fcaptargmap%2Fregioninfo_search.jsp&_captargmap_WAR_CapTargMapportlet_redirect=http%3A%2F%2Fs3platform.jrc.ec.europa.eu%2Fmap%3Fp_p_id%3Dcaptargmap_WAR_CapTargMapportlet%26p_p_lifecycle%3D0%26p_p_state%3Dnormal%26p_p_mode%3Dview%26p_p_col_id%3Dcolumn-1%26p_p_col_count%3D1%26_captargmap_WAR_CapTargMapportlet_mvcPath%3D%252Fhtml%252Fcaptargmap%252Fregioninfo_search.jsp&_captargmap_WAR_CapTargMapportlet_keywords=&_captargmap_WAR_CapTargMapportlet_advancedSearch=false&_captargmap_WAR_CapTargMapportlet_andOperator=1&_captargmap_WAR_CapTargMapportlet_regioninfoid=0&_captargmap_WAR_CapTargMapportlet_regionid=0&_captargmap_WAR_CapTargMapportlet_categoryid1_1=0&_captargmap_WAR_CapTargMapportlet_categoryid2_1=0&_captargmap_WAR_CapTargMapportlet_categoryid31=0&_captargmap_WAR_CapTargMapportlet_categoryid1_2=0&_captargmap_WAR_CapTargMapportlet_categoryid2_2=0&_captargmap_WAR_CapTargMapportlet_Categoryid3_2=0&_captargmap_WAR_CapTargMapportlet_regionname=Bulgaria&_captargmap_WAR_CapTargMapportlet_nutsid=&_captargmap_WAR_CapTargMapportlet_description=&_captargmap_WAR_CapTargMapportlet_description_search_type=OR&_captargmap_WAR_CapTargMapportlet_eu-country=on&_captargmap_WAR_CapTargMapportlet_eu-region=on&_captargmap_WAR_CapTargMapportlet_published=0&_captargmap_WAR_CapTargMapportlet_regionInfosSearchContainerPrimaryKeys=10454

6

biopharma. For example, European Cluster Panorama has labelled the biopharma R&D as

education and knowledge creation activities, while the US cluster mapping defines the

biopharma outputs as biological products, biopharma products, health and beauty

products, as well as ophthalmic goods, diagnostic substances, dental instruments and

suppliers, surgical instruments and medical equipment, and the R&D is qualified as

activities of teaching and specialised hospitals, research organisations and educational

institutions 8 . All current biopharma mapping initiatives exclude both generic and

biopharma specific R&D codes identifying strictly commercial activity, as well as other

related value added activities that support the biopharma GVC.

At the same time, an early application of the value chain mapping methodology reveals

that the core biopharma industry codes include a strong wholesale of drugs component,

as well as other related manufacturing segments, such as diagnostic substances, toilet

preparations, and broad woven fabric and cotton (both as input and output market for

biotech products) 9 . Although this connectivity is empirically observed for companies

located in the South East of England (UK), it can be argued that such connectivity

represents technological pathways of interconnected markets, and hence, can be

expected in other regional contexts.

A later study with the same methodology reveals also that the commercial R&D sector

comprises of two distinctive segments - Bio-pharma R&D and Drug development

support, where the second segment exhibits consistently a better performance10. The

two R&D strategic groups are bundled in the region with other strategic groups of related

activities, such as: IT and technical support services, diagnostics and telecare – among

other medical and health services. Both of the studies in 2006 and 2008 provide data

driven evidence from bespoke datasets at regional and industry level.

The conceptual representation of the biopharma value chain in the South East of England

(UK) clearly indicates distinctive specialisation of firms into R&D, manufacturing,

wholesale / trade, and other support services, whereby the service component contains

approximately 25% of the firms and the wholesale, trade and retail component contains

additional 37% of firms. The manufacturing itself is concentrated only in 25% of the

firms, including 115 large biopharma MNEs that have capabilities across the entire value

chain11. Similar proportions of distribution of industry capabilities across the value chain

are observed in the EU Cluster observatory sector report on biopharmaceuticals12.

The building of the bespoke global biopharma MNE dataset was facilitated by the

preliminary allocation of MNEs to the biopharma sector using EU R&D scoreboard13. The

bespoke dataset contains the top biopharma MNEs with all of their subsidiaries. The

company data has been collected from Orbis: international corporate database in 2015

and includes detailed description of activities and firm level data on operations, revenue

and employment, country of origin and location of operations. The bespoke datasets of

the two cases of biopharma capabilities in Bulgaria and in the Greater South East (UK)

have been built from the same source, using specific selection criteria – to match the

capabilities already identified in the global biopharma value chain. Full details are

described in the methodological section of each case. The dataset of the two cases

include all relevant SMEs, and hence capture the regional biopharma capabilities with

more depth.

8 European Cluster Observatory, 2014a; Figure 15; US cluster mapping initiative; Figure 16. 9 Todeva and Keskinova, 2006; Figure 17. 10 Todeva, 2008. 11 Figure 18, own calculations based on Bespoke GSE biomedical and biopharma dataset

(2008), Todeva, 2008. 12 Figure 15. 13 EU R&D Scoreboard, 2014.

7

2. Mapping global value chains with data on multinational firms

Large MNEs internalise large parts of the value chain across their network of

subsidiaries, and each of their products or service groups is delivered through a uniquely

designed chain of value added activities. The MNEs are the main vehicle both for the

fragmentation and the integration of global production, and hence mapping the

diversification portfolio of MNEs is a way of representing GVCs14. Each MNE designs its

own value chain in all three dimensions of upstream, mid-stream, and downstream

activities, as well as auxiliary services that support their operations. The diversification

and scope of MNEs, determine how their value chain network is constituted, where

individual products, services or technologies generate their own value chain and value

chains intersect within the boundaries of the MNE into a value network. The upstream

supply chains are assumed to be constituted outside of the firms, and in the case of

MNEs, they often run through the network of subsidiaries.

The outline of biopharma mapping techniques and methodological approaches to analysis

of GVCs clearly points at the diversity of theoretical foundations and empirical research

to capture, measure and represent the global connectivity of biopharma 15 . It is

acknowledged that using trade statistics and indicators of input-output of intermediary

products and services at country level gives an aggregate number which can be used for

global comparisons, but the picture often is difficult to interpret. All current efforts focus

heavily on the manufacturing side and are lacking insights into the support and services,

or the R&D and innovation that is taking place behind the scene of intermediate trading.

There are currently three attempts at mapping diversified capabilities within regional

(cluster) boundaries and as a value chain network. These are the concerted efforts of the

European cluster panorama that establishes a tree or cluster relatedness based on prior

categorisation of industries, the US cluster mapping initiative that combines regional /

industry economic data from multiple sources, and the novel data driven approach by

Todeva and Keskinova16, which is developed and elaborated further in this paper.

Although the European cluster panorama map demonstrates a creative and systematic

effort to combine data from multiple sources and to measure concentration and growth

at regional and industry level, their data source is incomplete. The lack of adequate

representation of the UK biopharma on the European cluster map exposes one of the

inherited weaknesses in the dataset, as self-reporting clusters are not necessarily the

most legitimate source. In addition, categories, such as ‘Education and knowledge

creation’ misrepresent the actual biopharma activities, such as biopharma R&D, medical

testing and drug trials.

The US cluster mapping initiative represents another and more comprehensive effort to

establish comparability of clusters and regional performance. The methodology,

however, is top-down, using the natural geographic boundaries of the 172 Economic

Areas in the USA, categorising individual industries into cluster-related categories, and

applying national statistics to these categories. All clusters, according to this

methodology, are first divided into 16 local and 51 traded, excluding effective cross-

industry fertilisation, and then, each cluster is described using sub-cluster names, on the

14 Todeva and Rakhmatullin, 2016. 15 Todeva and Rakhmatullin, 2016. 16 Todeva and Keskinova, 2006.

8

basis of categorised NAICS industry codes. The biopharma sector is referred to three

distinctive categories of traded activities: Biopharmaceutical Products, Biological

Products, and Diagnostic Substances 17 . Although this systematic benchmarking of

standardised industry agglomerations enables comparability of cluster measures and

industry measures across the geographic regions in the USA, it does not represent the

real diversification of firms generating inter-industry value-added links, and hence, has

limited applicability to mapping global value chains.

Todeva and Keskinova18 on the other hand, offer a bottom-up approach for mapping

GVC, that builds upon intra-firm and inter-industry diversification, and combines ideas

from multiple approaches. The foundation of this methodology is to generate a unique

and comprehensive dataset of firms and to categorise the entire population in strategic

groups according to domineering patterns of diversification, enabling subsequent

analysis of concentrations, connectivity, and comparative performance19. This study is a

demonstration of the advantages of this mapping approach and its application at

regional and national level.

The subsequent sections of the paper outline the main methodological principles and

steps for the value chain mapping and mapping of regional and sectoral capabilities of

the global integrated biopharma. The value chain mapping methodology is applied with

three bespoke datasets: one containing the global biopharma, second, containing

biopharma capabilities in Bulgaria, and third, containing the regional biomedical and

biopharma capabilities in one of the fastest growing regions in the UK – the Greater

South East. The analysis of all three bespoke biopharma datasets follows the same

steps, aiming to reveal the main strategic value chain groups (VCGs) - as evidence of

patterns of diversification and bundles of capabilities that add value to the final output

markets, and subsequent analysis of the location and connectivity across the value

chain.

2.1. Lead principles

A: MNEs are the lead firms in E/GVC – MNEs design and initiate activities in the value

chain by making strategic choices about the scope of their capabilities (to undertake

activities in-house or outsourced); the geographic location of operations; the industry

segment; the ownership structure of governance and control; selecting suppliers and

placing orders to them (including governing supply relationships); giving market power

to suppliers (through volumes of trading and sharing market information); implementing

selected product / process technologies; and developing specialised strategic capabilities

within their own value chain, including R&D, manufacturing or services. GVCs are

constituted within MNEs and hence, mapping MNE subsidiaries can be used for mapping

the GVCs that they control. The industry codes declared by the selected MNEs and all

their subsidiaries represent a unique bundle of capabilities within the value chain. The

geographic location of operations indicates the global spread of the GVC and the main

hubs with concentration of capabilities that are integrated into the GVC.

17 US cluster mapping initiative. 18 Todeva and Keskinova, 2006. 19 The literature on strategic groups highlights that industries are constituted of firms

that exhibit group behaviour, or while aiming to gain strategic advantage in the market

place, they follow similar strategies (Caves and Porter, 1977, Porter, 1980, Caves, 1982,

Kogut, 1984). Kogut also highlights that strategic groups are under-researched, and

hence we know very little about how multinational firms transfer strategic advantages

across various geographic locations of operations.

9

B: Industry fragmentation in E/GVC - emerges out of product and process

specialisation and a combination of cost reduction strategic outsourcing by MNEs and

entrepreneurial activity in a particular geographic location. Fragmentation leads to

cluster development and regional co-specialisation. Hence, there is a strong link between

dynamic industry / regional clusters and participation in GVCs. Mapping co-location of

activities and capabilities in geographic locations can represent regional comparative

advantage and competitiveness in attracting further E/GVC participation.

C: Geographical dispersion of E/GVC - results from the internationalisation strategies

of the lead MNEs, building subsidiaries and operations, or outsourcing to host countries,

selecting suppliers abroad and selling products and services in global destinations

through: ‘importing to produce’ (I2P), ‘importing to export’ (I2E) and cross-border ‘value

added trade’20. Mapping trade flows between countries can confirm increase/decrease of

GVC participation of a particular country or a region. This, however, cannot confirm an

upgrade of the position of this region in the GVC.

D: E/GVC re-integration – is affected by a combination of market and technology

drivers, such as specific customer demand, or technology upgrade and disruptive

technologies, and the strategic choices made by MNCs in response to these drivers.

Regions and governments can play very little role in this respect, apart from promoting,

facilitating and financing networking with potential customers.

E: Total global connectivity - there are no clear boundaries between industries and

value chains – both upstream and downstream components of value chains connect to

multiple other industries, or input/output markets. Each value chain resembles a

segment of a highly interconnected global network of money and resource flows, and

large MNEs have ownership ties to multiple other industries that constitute input / output

markets. In this complex scenario, mapping GVC requires data at the level of MNEs,

including identifying strategic groups of firms that co-specialise in a particular segment

of the value chain. The geographic location and dispersion of economic activities is best

identified through mapping of the location of firms. The most critical requirements are to

identify a method that reveal and demonstrate the re-integration of value added and the

global connectivity, and as such the application of network analysis techniques are

essential complementors.

2.2. Methodological steps

Step 1: Identifying core industry boundaries

The first step requires identifying the industry boundaries, as value chains are industry

specific, product specific and technology specific. As value chain boundaries are not self-

evident, a decision is needed on what value chain is to be mapped. This decision

determines the scope of the subsequent work, as each value chain is connected to other

sectors of the economy. A definition of the core product / market / technology is used to

determine the boundaries within which a requirement for a comprehensive dataset of all

firm capabilities is fulfilled. At this stage of value chain mapping, geographic boundaries

are not required as value chains cross regional boundaries. However, when mapping

regional capabilities within a value chain, then administrative boundaries of the target

location are necessary.

For mature industries, sectoral boundaries can be determined around core industry

codes. For emerging industries value chain boundaries can be determined by core

technologies, or core products, services and processes. In our example, the boundary

definition of the global biopharma sector was pragmatically adopted from the European

20 Baldwin and Lopez-Gonzalez, 2015.

10

R&D Scoreboard and the 2014 listing of the world top 2 500 companies21 with the

highest investment in R&D.

The pragmatic selection of the boundaries for the global biopharma enables us to

determine the analytical strategy for: the building of the bespoke sectoral dataset and

the extraction of firm data; and the analytical procedures for the global value chain

mapping. The sections below outline the subsequent steps of the mapping procedure.

Step 2: Building a comprehensive dataset of firms

Although it is assumed that each MNE has internalised the biopharma value chain, a

single case cannot establish a generic industry pattern. In order to derive at a generic

representation of the sectoral biopharma GVC, a dataset of all lead MNEs with their

complete portfolio of operations is required. The data source may vary and different data

sources have different coverage of MNE activities. The extracted data should contain a

detailed description of activities and operations of all firms in the MNE portfolio – in order

to categorise them in strategic value chain groups.

Dataset boundaries that are determined by key words of technologies and product

markets are built in the same way as those using industry codes. However, firm data of

activities in this case contains text description, and the subsequent categorisation of

firms in strategic value chain groups requires text analysis.

Further in this section we illustrate this step with a description of the build of the

bespoke global biopharma MNE dataset. Essentially this is extraction of data from ORBIS

International Corporate Database, on firms that comply with a set of selection criteria

regarding industry and geographic boundaries. Firms are identified by their unique BvD

ID number – either as parents, or as subsidiaries. Essential principle in the building of

the dataset is to obtain comprehensive full population data and a thorough cleaning of

the data from errors, duplications, or incomplete records.

The pre-selection criteria for our dataset were the following:

- The top global R&D investors in biopharma, identified by the EU R&D Scoreboard

2014 – identified as MNE parents;

- All of their subsidiaries worldwide (maximum of 10 levels of subordination);

- All additional data on branches of the MNEs;

- When duplicate records of the same company exist, the highest level of authority

is selected – starting from parent, subsidiary level 1, … subsidiary level 10;

- All ownership data is preserved in the output dataset;

- Only companies with activities data remain in the derivative dataset (European

record preferred for the mapping in cases of dual ownership subsidiaries).

Firm level data for the core 293 biopharma MNEs was obtained for all of their

subsidiaries (up to level 10), and branches.

21Source: http://iri.jrc.ec.europa.eu/scoreboard14.html

Step 1: The industry boundaries can be determined pragmatically in many

different ways – either adopting existing categorisations, or by key words

that represent lead technologies, products or service markets. This top-

down selection is complemented by a bottom-up approach for the build of

the comprehensive bespoke dataset to include all subsidiaries of the selected MNEs and all NACE codes declared as part of the MNEs’ portfolio.

11

The final output dataset after cleaning comprised of 33 653 cases of firms with

ownership ties22. The output dataset preserves duplicate cases when subsidiaries have

more than one parent. These ties are preserved for the network analysis, while all

duplicates are deleted for the cluster analysis23. This dataset is used for the analysis of

the biopharma GVC and the geographical maps showing concentration of generic

biopharma capabilities around the world. In the output dataset every parent appears as

many times as its subsidiaries.

After cleaning all duplicates with dual ownership ties and firms without activity data, we

establish the final derivative dataset containing 20 508 firms with a record of

activities, revenue and employment for the last available year, as well as further

ownership, management and performance data 24 . All these firms develop drugs,

manufacture, supply, finance, or deliver services in the global biopharma industry. A

sub-sample of this data, containing the full population of large and very large firms – a

total of 4 656 in total (BvD categorisation), is further selected for the categorisation and

mapping of strategic value chain groups in the GVC. The main assumption behind this

selection is that diversification is more likely among large and very large firms. In

addition, the re-focusing of the categorisation in value chain groups on the largest firms

reduces the cases with missing data25.

22 Table 10; The first level cleaning involves removal of duplicate cases with identical

parent and subsidiary BvD ID number, or cases in which a subsidiary appears on more

than one level of subordination under the same parent. It is possible to be

simultaneously a parent and a subsidiary when firms have engaged in a swap of shares,

or other cross-ownership ties. In these cases, the record of the parent is kept in the

dataset for further analysis. 23 Cluster analysis as a statistical technique is used in the multi-stage cluster

methodology (Todeva and Keskinova, 2006; Todeva, Knoke and Keskinova, 2016) as

part of the pattern recognition procedure for mapping strategic value chain groups. 24 Table 10. 25 A descriptive analysis of the sub-sample from the derivative dataset reveals that the

population of firms declare activities in 416 related and unrelated industries. There are

150 firms in the derivative sub-sample, that have no NACE code, 2 507 firms have 1

code only, and 1999 firms have more than 1 code (14 of which are multi-diversified

firms with 20 industry codes). These observations confirm a highly heterogeneous

dataset of firms (Table 10). Two core codes domineer the entire dataset sub-sample with

30% occurrence (NACE 2120 – ‘manufacture of pharmaceutical preparations’ and NACE

4646 – ‘wholesale of pharmaceutical goods’. Only 8% of the sub-sample of the largest

biopharma R&D performers declared the specific NACE 7211 – ‘research and

experimental development on biotechnology’, while 10% declared the more generic code

NACE 7219 – ‘other research and experimental development on natural sciences and

engineering’.

Step 2: The building of a comprehensive bespoke dataset of firms involves

multiple steps of cleaning and organising of the data and includes multiple

formats and structures of the data, broadly described as output dataset and

derivative dataset. Each format of the data is used for different observations

and analytical procedures, enabling rich and insightful analysis (Steps 3, 4, and

5). The sub-sample of large and largest firms is a convenience sample for the

data categorisation – to reduce the heterogeneity and the cases with missing data.

12

The top-down development of the bespoke biopharma dataset ensures that the

population of firms represent the entire sector. The full use of all declared industry codes

by the firms ensures that the strategic value chain groups represent the actual

diversification of firms. All decisions during the development of the bespoke dataset aim

to ensure simultaneously sectoral focus, and all-inclusive diversification profile of firms26.

Step 3: Categorisation of firms in core value chain groups

The observations of the global biopharma dataset confirm that the original ORBIS BvD

categorisation of firms in peer groups does not correspond with the declared primary and

secondary NACE codes, and hence, cannot be used for mapping of strategic value chain

groups. In addition, large firms maintain cross-sectoral diversified portfolios, which are

exhibited by multiple industry codes connecting complementary value added activities

across industries, which cannot be captured by a single industry code. The categorisation

of firms according to the pattern of their diversification offers an insightful

representation of the complex organisation of interconnected value added activities. This

approach is suitable for any R&D intensive sector, as value chains are technology driven,

and large firms are expected to engage in diverse activities aiming to gain competitive

advantage through vertical and horizontal integration.

The mapping of the core value chain groups was undertaken with the derivative dataset,

which was divided into sub-segments for the application of different categorisation

procedures. The segmentation involved the following:

Segment A: a sub-sample of the top 4 656 large and very large firms (Table 10).

Segment B: firms from Segment A that contain two or more industry codes -

identified for the application of the first stage cluster analysis and the subsequent

network analysis (1 999 firms in total).

Segment C: all firms in the derivative dataset that contain only one NACE code and

firms that have only text description of activities.

Segment D: unique multi-diversified cases in the derivative dataset, individually

allocated to strategic value chain groups.

The categorisation of firms and the constitution of strategic value chain groups within

the biopharma GVC was executed in four stages. The first stage of categorisation

involved formal clustering of the diversified firms in Segment A. Due to the huge

diversity of codes, only 17 of the most commonly occurring NACE codes were selected –

to represent the core and the largest concentrations of biopharma capabilities. These

codes were selected on the basis of occurrence and relatedness and represent core

biopharma activities, including manufacturing, R&D, and specialised services. The pre-

selection of codes mainly ensures that the strategic value chain groups are framed by

core value added activities27.

The pre-selected NACE codes represent the following28:

26 All industry codes, are transformed into dichotomous variables for the analytical

categorisation of firms. 27 Table 8, 9. The pre-selected NACE codes are expected to have a strong impact on the

categorisation process and to generate meaningful ‘centres of capabilities’ for the

strategic value chain groups. A number of generic industry codes with high occurrence

that potentially can represent biopharma, as well as capabilities in other sectors, were

suppressed from the analytical categorisation, so they cannot form an independent

strategic value chain group. Firms with missing NACE code, containing text description of

activities are categorised using text mining technique, replicated from previous studies. 28 Overall 3759 firms from the sub-segment have declared at least one of our pre-

selected NACE codes, while 747 firms contained codes that do not represent core

13

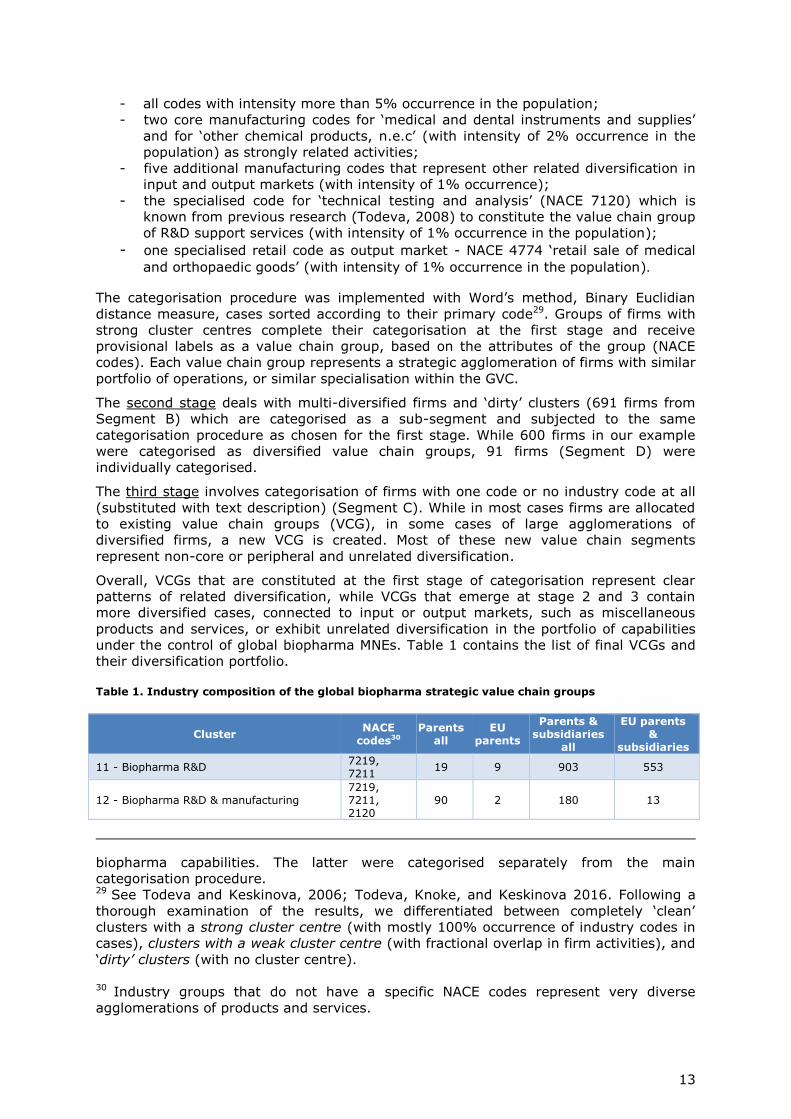
- all codes with intensity more than 5% occurrence in the population;

- two core manufacturing codes for ‘medical and dental instruments and supplies’

and for ‘other chemical products, n.e.c’ (with intensity of 2% occurrence in the

population) as strongly related activities;

- five additional manufacturing codes that represent other related diversification in

input and output markets (with intensity of 1% occurrence);

- the specialised code for ‘technical testing and analysis’ (NACE 7120) which is

known from previous research (Todeva, 2008) to constitute the value chain group

of R&D support services (with intensity of 1% occurrence in the population);

- one specialised retail code as output market - NACE 4774 ‘retail sale of medical

and orthopaedic goods’ (with intensity of 1% occurrence in the population).

The categorisation procedure was implemented with Word’s method, Binary Euclidian

distance measure, cases sorted according to their primary code29. Groups of firms with

strong cluster centres complete their categorisation at the first stage and receive

provisional labels as a value chain group, based on the attributes of the group (NACE

codes). Each value chain group represents a strategic agglomeration of firms with similar

portfolio of operations, or similar specialisation within the GVC.

The second stage deals with multi-diversified firms and ‘dirty’ clusters (691 firms from

Segment B) which are categorised as a sub-segment and subjected to the same

categorisation procedure as chosen for the first stage. While 600 firms in our example

were categorised as diversified value chain groups, 91 firms (Segment D) were

individually categorised.

The third stage involves categorisation of firms with one code or no industry code at all

(substituted with text description) (Segment C). While in most cases firms are allocated

to existing value chain groups (VCG), in some cases of large agglomerations of

diversified firms, a new VCG is created. Most of these new value chain segments

represent non-core or peripheral and unrelated diversification.

Overall, VCGs that are constituted at the first stage of categorisation represent clear

patterns of related diversification, while VCGs that emerge at stage 2 and 3 contain

more diversified cases, connected to input or output markets, such as miscellaneous

products and services, or exhibit unrelated diversification in the portfolio of capabilities

under the control of global biopharma MNEs. Table 1 contains the list of final VCGs and

their diversification portfolio.

Table 1. Industry composition of the global biopharma strategic value chain groups

Cluster NACE

codes30 Parents

all EU

parents

Parents & subsidiaries

all

EU parents &

subsidiaries

11 - Biopharma R&D 7219, 7211

19 9 903 553

12 - Biopharma R&D & manufacturing 7219, 7211, 2120

90 2 180 13

biopharma capabilities. The latter were categorised separately from the main

categorisation procedure. 29 See Todeva and Keskinova, 2006; Todeva, Knoke, and Keskinova 2016. Following a

thorough examination of the results, we differentiated between completely ‘clean’

clusters with a strong cluster centre (with mostly 100% occurrence of industry codes in

cases), clusters with a weak cluster centre (with fractional overlap in firm activities), and

‘dirty’ clusters (with no cluster centre).

30 Industry groups that do not have a specific NACE codes represent very diverse

agglomerations of products and services.

14

Cluster NACE

codes30 Parents

all EU

parents

Parents & subsidiaries

all

EU parents &

subsidiaries

13 - Biopharma R&D & services diversified

7219, 7211, 4646, 6420

8 3 262 126

14 - Clinical research & human health activities

8690, 2660, 3250, 2120

2 0 475 194

21 - Bio-pharma manufacturing 2120, 2110

71 20 6 271 761

22 - Biopharma manufacturing and wholesale

2120, 3250, 4646

41 9 282 145

23 - Perfumes and cosmetics manufacturing 2042, 2041

1 1 64 23

24 - Biopharma manufacturing multi-diversified

2120, 3250, 7219

23 4 753 95

25 - Chemical & biopharma manufacturing diversified

2014, 1101, 2041, 2059

6 4 459 168

26 - Medical instruments, dental & electrotherapeutic manufacturing

2660, 2670, 3250

4 0 306 91

27 - Manufactured goods, electronics and instruments

2611 0 0 161 47

28 - Special purpose machinery and

equipment 1 0 105 39

31 - Specialised biopharma wholesale 4646 3 2 1 424 1 098

32 - Biopharma retail 4773, 4775, 4618

0 0 1 829 215

33 - Biopharma & cosmetics, wholesale 4645, 4646, 4690

3 0 1 251 43

34 - Pharma wholesale trade & services diversified

4646 0 0 71 60

35 - Chemical & biopharma wholesale 4675, 4646

0 0 119 52

36 - Medical & hospital equipment wholesale & supplies

4690 0 0 355 53

41 - Holding, financial & administrative head office services

6420, 7010, 8299

14 8 1 517 974

42 - Other business and management services

7490, 7220, 7311

3 3 854 555

43 - Finance & insurance services

6499, 6512,

6619, 6492, 6612

0 0 574 152

44 - Miscellaneous services 3 2 1 267 519

51 - Agriculture, food processing & drinks of bio products

1 1 589 115

52 - Manufactured miscellaneous goods 1729 0 0 111 11

53 - Electricity, gas and water supply & services

0 0 290 238

54 - Other miscellaneous wholesale 0 0 615 165

Total 293 68 20 508 6 505

Source: Bespoke global biopharma MNE derivative dataset (2015).

15

The categorisation of firms in strategic value chain groups based on their diversification

portfolio of activities is a major breakthrough in the challenge how to capture unique

positions in complex value chains.

The method of categorisation enables to reveal patterns of specialisation across the

entire population of firms in the bespoke industry dataset. The strategic value chain

groups (or strategic industry groups) demonstrate dominant patterns of related and

unrelated diversification in the particular sector, and represent complementarities of

value-added activities, determined manufacturing technologies. Following this

categorisation, the next step of mapping of value chain capabilities represents

visualisation of existing relationships.

Step 4: Mapping of the industry value chain

The mapping of value chain capabilities essentially is visualisation of existing strong links

that connect value added activities within firms and across industry segments. This

visualisation enables firms to determine the focus for their investment in core

capabilities, while outsourcing to input and output markets. Naturally, the business

process of firm growth involves backward and forward integration within the value chain,

and hence, the visualisation of value chains and value networks should exhibit these

linkages. The categorisation of firms in value chain groups using a comprehensive

dataset enables the application of network analysis techniques to reveal such underlying

relationships. Step 4 of the GVC mapping, hence, involves evaluation of the content of

all VCGs and analysis of the connectivity across VCGs.

In our example of the bespoke global biopharma dataset, the list of VCGs in Table 1

confirms the complexity of input and output relationships across industry segments. This

complexity is not currently recognised by the existing conceptual models of biopharma

GVC31. The network analysis of the relationships between industry codes and value chain

groups reveals a fragmented global picture with some emergent connectivity and real

evidence of backward and forward integration. Figure 1 exhibits two very distinctive

value chains, where diversification across industries is strong. These are the R&D chain,

containing all R&D value chain groups (VCGs 11, 12, 13), and the chain of medical and

hospital supply of interconnected engineering products and equipment, which includes

multi-diversified biopharma companies (VCGs 24, 26, 27, 28).

Figure 1 exhibits further evidence confirming that the multi-stage cluster methodology

has produced a clear categorisation of firms, where core industry codes belong to a

unique value chain group. All graphic representations of the value chain32 reveal an

important observation that firm specialisation in the global industry in reality involves

both vertical integration and horizontal diversification.

31 Todeva and Rakhmatullin, 2016. 32 Figure 1, 2, 3.

Step 3: The categorisation of firms in core value chain groups involves a

multi-stage categorisation technique that consist of formal statistical

methods and conceptual allocation. The number of stages and the formal

statistical methods are determined mainly by the size, structure and heterogeneity of the data in the dataset.

16

Figure 1: Ties between value chain groups and NACE codes

Source: Bespoke global biopharma MNE derivative dataset (2015). Note: Exhibited ties with frequency > 0,1% or 25+ firms, 30% of ties; size of the dot indicates number of

firms; links indicate interconnected industries through firm co-specialisation.

Figure 2. Biopharma global value chain (A)

Source: Bespoke global biopharma MNE derivative dataset (2015).

17

Figure 3. Biopharma global value chain (B)

Source: Todeva / Bell (2015).

Overall the mapping of biopharma value chain reveals 9 groups of activities that

correspond with a distinctive diversification portfolio of firms (Figure 2, 3). These are the

following33:

- Biopharma R&D (VCGs 11, 12, 13, 14)

- Biopharma manufacturing (VCGs 21, 22, 24)

- Biopharma trade (VCGs 31, 32, 33, 34, 35, 36)

- Specialised finance, business, management and other related services (VCGs 41,

42, 43)

- Perfumes and cosmetics manufacturing (VCG 23)

- Chemical and biopharma manufacturing diversified (VCG 25)

- Medical and hospital instruments, equipment and supplies and special purpose

machinery manufacturing (VCGs 26, 27, 28)

- Agriculture and food processing (VCG 51)

- Unrelated goods and services (VCGs 52, 53, 44).

Figure 3 illustrates clearly how well integrated into the biopharma value chain are the

‘medical and hospital instruments, equipment and supplies’, as well as the ‘agriculture

and food processing’, both of which contain parents MNEs34. A new observation is also

the significant number of subsidiaries in services and non-related sectors, which are

labelled as miscellaneous products and services and various utility and infrastructure

companies such as gas and electricity35. What is also evident from the graphic displays

of biopharma GVC in Figures 2 and 3 is the strong presence and integration with

engineering activities, grouped in four VCGs - all directly linked both to the biopharma

GVC and to health care 36 . The large number of specialised and generic wholesale

strategic groups, as well as finance and services indicates two distinctive models of

growth – one driven by the market pull, and the other through finance and investment in

new products and technologies.

33 Table 12. 34 Table 11, 12. 35 Tables 11, 12, 13, 14. 36 Figure 2 and 3; Table 12.

18

The value chain maps (Figures 2 and 3) are complementary and provide two different

perspectives on the global biopharma. While both figures represent real value chain

connectivity based on synergies across related biopharma activities, each of them

evokes a different narrative. Figure 2 provides insights into the backward and forward

integration of activities across related industries, and the scale of diversification of firms

in different VCGs. Figure 3 replicates the same diversification links and shows the

circular loops across all segments of the biopharma value chain - more clearly described

as a value network. All links in Figure 3 represent shared capabilities across VCGs. These

links represent value added flows and provide a map for inter-firm collaboration and

seeking suppliers in match-making initiatives.

The input and output markets in Figure 3 show the direction of value added and the

interdependence and interconnectedness of intermediate markets. This graphic display

of the biopharma industry exhibits also the co-specialisation of firms within the portfolio

of large multinationals and the emergence of complex networks and multi-sectoral value

added flows.

The proposed methodology for mapping biopharma GVC is a generic approach that can

be applied to different industry sectors or geographic locations. It includes four

distinctive methodological steps, as exhibited in Table 2.

19

Table 2. Mapping global value chains – a synthesis

Methodological step Method Outcome

Step 1 Identifying core industry boundaries (at regional or country level)

Selection of NACE codes, regional boundaries and key words of products and technologies for text mining

Clear representation of industries and firm capabilities in regions and clusters

Step 2 Building a comprehensive dataset of firms

Extraction of firm data from ORBIS; cleaning the dataset; organising and structuring the records; identifying segments for categorisation of value chain groups

A bespoke dataset of firms enabling the application of a broad range of analytical tools for micro (firms), mezzo (value chain groups), and macro (regions and clusters) level of analysis; Key resource for selection of firms for match-making, R&D partnerships, or investment programmes

Step 3 Categorisation of firms in core value chain groups (VCGs)

Multi-stage clusterisation and categorisation of firms by their diversification portfolio

Identified bundles of capabilities and patterns of specialisation at a regional level

Step 4 Mapping of the industry value chain

Visualisation of interlinked strategic capabilities and the geographic location of these capabilities

Value chain maps with details of concentration of firm capabilities and value chain integration links

The proposed methodology for mapping of value chains has six main advantages:

1. It is based on mapping of real links between value added activities

2. It can be used for mapping of both established sectors and emerging value chains

in emerging industries, where the bespoke dataset developed for the mapping

exercise determines the scope of the subsequent value chain

3. It enables further in-depth analysis of strategic value chain groups, comparative

performance analysis across stages of the value chain, the impact of ownership

ties and the patterns of integration of supply chain relationships across different

segments of the value chain

4. It enables mapping of regional capabilities and a region’s position in global value

chains

5. It enables regions to determine the scope of their specialisation in specific

industry segments

6. It provides a resource for selection of firms who are active R&D performers in

specific industry segments for match-making events and for selecting partners

that have complementary capabilities

The following section demonstrates the in-depth analysis of the concentration of firm

capabilities and the patterns of integration that reveal emergent business models in the

global biopharma.

2.3. Analysis of the structure of biopharma GVC

The bespoke global biopharma MNE dataset enables to perform a number of analyses

with firm level data. The categorisation of firms in strategic value chain groups enhances

this capability providing additional insights into synergies across activities, linkages, and

strategic behaviour of biopharma firms. The retained information on the ownership ties

in the original dataset enables also to discriminate between European MNEs and the rest

of the world, and to compare performance of European and non-European segments of

the global biopharma value chain. The revealed cross-ownership cases and the location

of foreign subsidiaries in Europe are indicative of the competitive dynamics in the sector.

20

The analysis of the concentration of capabilities in locations and segments of the value

chain is undertaken with a series of network analysis techniques with one mode and

two-mode networks, generated by the membership of firms in VCGs as a secondary

attribute. The example of the biopharma GVC explores both network analysis of deeper

patterns of ownership ties and detailed geographic mapping of co-specialisation and

regional capabilities. In addition, the prior categorisation of firms in value chain groups

enables comparative performance analysis revealing the distribution of profits and

performance across the value chain and within each value chain group. The subsequent

section starts with a preliminary observation of the top biopharma MNEs and

demonstrates the insights from the application of the value chain mapping methodology.

The 293 largest pharmaceuticals & biotechnology companies, represent 12% of the total

population of the world’s largest investors in R&D. These firms are the ‘parents’, or

‘global ultimate owners’ (GUO) of assets in the pharmaceuticals and biotechnology sector

that design and orchestrate the GVC. Parent companies with European country of origin

are 68 (or 23%)37, while EU is hosting 68% of all subsidiaries of global biopharma38.

Network analysis of the ownership ties and the relationships between firm

specialisation/diversification and value chain groups reveal the structure and connectivity

in the global value chain. Figures 4 and 19 reproduce links between parents and

subsidiaries. There are two types of ‘parents’ – those whose subsidiaries are integrated

in all segments of the GVC (in the centre of Figure 19), and those that are more

narrowly specialised, which are integrated only with part of the biopharma GVC, but are

pulled by other value chains, such as: perfumes and cosmetics (VCG 23); medical

instruments (VCG 26), or special purpose machinery (VCG 28).

Table 3. Biopharma MNEs from the top 2500 R&D investors by country of origin39

Europe Other

Country Count Country Count

Belgium 2 Australia 1

Denmark 6 Bermuda 1

Finland 1 Canada 2

France 9 Cayman Islands 3

Germany 8 China 14

Greece 1 Hong Kong 2

Hungary 1 India 8

Ireland 5 Israel 1

Italy 5 Japan 28

Portugal 1 South Korea 12

Slovenia 1 Taiwan 1

Spain 3 US 144

37 Table 3. 38 Table 14, 15. 39 The EU R&D Scoreboard identified 294 top Biopharmaceutical firms with the largest

investment in R&D, including 77 MNE parents located in Europe (data from 2013). At the

time of our research (2015) the total number of parents was reduced to 293 and EU

parents to 68, following an acquisition of DURATA THERAPEUTICS by ACTAVIS on 17

November 2014, 4 company name changes, and the classification of Swiss parent

companies under the group of ‘Other global’.

Analysis of the structure of the GVC involves multiple analytical techniques

that reveal different business models for structuring input-output

relationships, as well as the connectivity and distribution of capabilities in selected locations.

21

Europe Other

Sweden 7

Switzerland 10

The Netherlands 3

UK 14

Total 77 (68) 217

Source: EU R&D Scoreboard 2014. Note: ‘Other’ refers to ‘the rest of the world’.

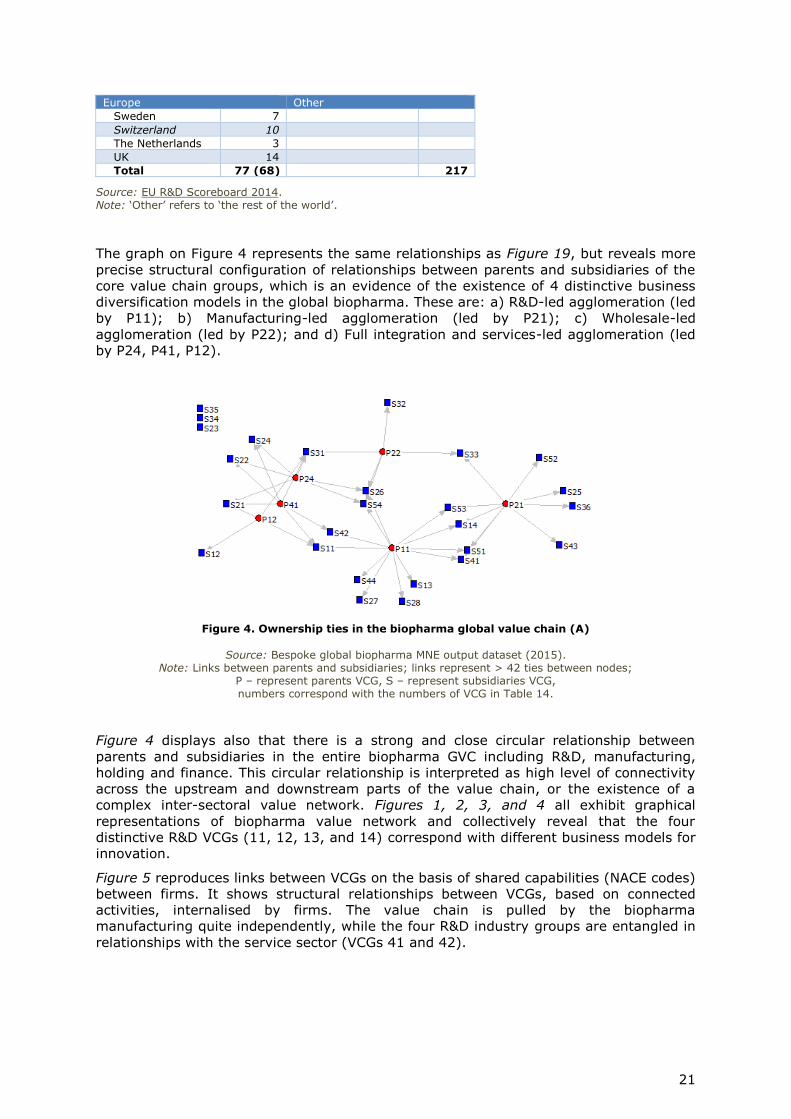
The graph on Figure 4 represents the same relationships as Figure 19, but reveals more

precise structural configuration of relationships between parents and subsidiaries of the

core value chain groups, which is an evidence of the existence of 4 distinctive business

diversification models in the global biopharma. These are: a) R&D-led agglomeration (led

by P11); b) Manufacturing-led agglomeration (led by P21); c) Wholesale-led

agglomeration (led by P22); and d) Full integration and services-led agglomeration (led

by P24, P41, P12).

Figure 4. Ownership ties in the biopharma global value chain (A)

Source: Bespoke global biopharma MNE output dataset (2015). Note: Links between parents and subsidiaries; links represent > 42 ties between nodes;

P – represent parents VCG, S – represent subsidiaries VCG, numbers correspond with the numbers of VCG in Table 14.

Figure 4 displays also that there is a strong and close circular relationship between

parents and subsidiaries in the entire biopharma GVC including R&D, manufacturing,

holding and finance. This circular relationship is interpreted as high level of connectivity

across the upstream and downstream parts of the value chain, or the existence of a

complex inter-sectoral value network. Figures 1, 2, 3, and 4 all exhibit graphical

representations of biopharma value network and collectively reveal that the four

distinctive R&D VCGs (11, 12, 13, and 14) correspond with different business models for

innovation.

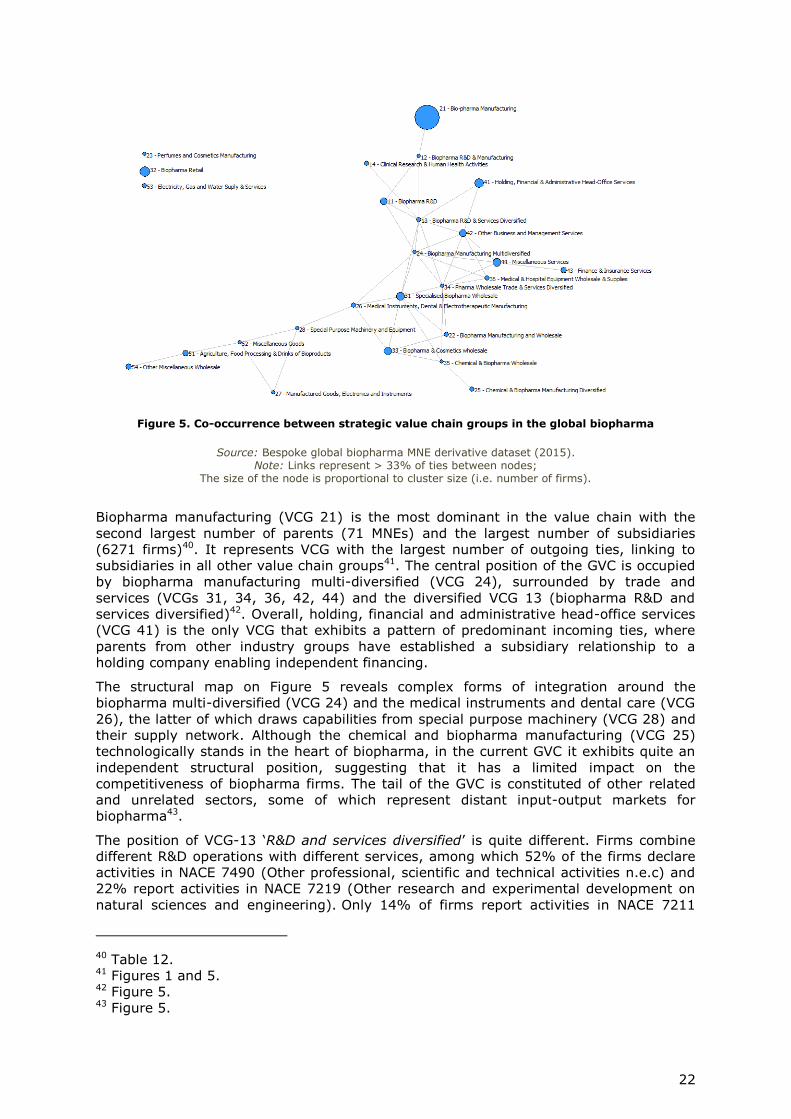
Figure 5 reproduces links between VCGs on the basis of shared capabilities (NACE codes)

between firms. It shows structural relationships between VCGs, based on connected

activities, internalised by firms. The value chain is pulled by the biopharma

manufacturing quite independently, while the four R&D industry groups are entangled in

relationships with the service sector (VCGs 41 and 42).

22

Figure 5. Co-occurrence between strategic value chain groups in the global biopharma

Source: Bespoke global biopharma MNE derivative dataset (2015). Note: Links represent > 33% of ties between nodes;

The size of the node is proportional to cluster size (i.e. number of firms).

Biopharma manufacturing (VCG 21) is the most dominant in the value chain with the

second largest number of parents (71 MNEs) and the largest number of subsidiaries

(6271 firms)40. It represents VCG with the largest number of outgoing ties, linking to

subsidiaries in all other value chain groups41. The central position of the GVC is occupied

by biopharma manufacturing multi-diversified (VCG 24), surrounded by trade and

services (VCGs 31, 34, 36, 42, 44) and the diversified VCG 13 (biopharma R&D and

services diversified)42. Overall, holding, financial and administrative head-office services

(VCG 41) is the only VCG that exhibits a pattern of predominant incoming ties, where

parents from other industry groups have established a subsidiary relationship to a

holding company enabling independent financing.

The structural map on Figure 5 reveals complex forms of integration around the

biopharma multi-diversified (VCG 24) and the medical instruments and dental care (VCG

26), the latter of which draws capabilities from special purpose machinery (VCG 28) and

their supply network. Although the chemical and biopharma manufacturing (VCG 25)

technologically stands in the heart of biopharma, in the current GVC it exhibits quite an

independent structural position, suggesting that it has a limited impact on the

competitiveness of biopharma firms. The tail of the GVC is constituted of other related

and unrelated sectors, some of which represent distant input-output markets for

biopharma43.

The position of VCG-13 ‘R&D and services diversified’ is quite different. Firms combine

different R&D operations with different services, among which 52% of the firms declare

activities in NACE 7490 (Other professional, scientific and technical activities n.e.c) and

22% report activities in NACE 7219 (Other research and experimental development on

natural sciences and engineering). Only 14% of firms report activities in NACE 7211

40 Table 12. 41 Figures 1 and 5. 42 Figure 5. 43 Figure 5.

23

(Research and experimental development on biotechnology), and 14% - in NACE 7120

(Technical testing and analysis), or another range of combinations around the R&D and

services spectrum. This industry group clearly represents emergent segment which

operates on the edge of our standard understanding of industries, offering a new

business model within the biopharma GVC.

Aggregate statistics with the bespoke biopharma dataset show cases with extreme

performance results and very high variation of indicators across the population. The

median indicates that on average European biopharma MNEs report better results for

R&D expenditure and sales in 2013, but lower 1-year growth of these indicators and

relatively low R&D intensity. European MNEs, report better results on employees for

2013 and 1-year employee growth, which is a good indicator of building capabilities. It is

important, however, to identify the exact location of this growth within the value chain,

which can be assessed with further analysis of the firm data in our bespoke dataset44.

Table 4. Comparative business performance - European vs. other global MNEs

EU countries Other countries Total

Median N Median N Median N

R&D 2013 (€ million) 53.1 77 36.4 217 42.3 294

R&D 1-year growth (%) 7.1 77 15.4 210 13.0 287

R&D intensity (%) 14.2 76 21.1 195 18.1 271

Sales 2013 (€ million) 512.5 76 260.3 195 315.8 271

Sales 1-year growth (%) 2.9 73 8.3 192 5.2 265

Profits 2013 (€ million) 49.0 77 -7.6 216 12.7 293

Profits 1-year growth (%) 8.7 76 16.0 214 13.8 290

Profitability (%) 12.3 76 2.3 195 7.0 271

Employees 2013 2 018.0 70 433.0 194 765.5 264

Employees 1-year growth (%) 2.9 71 5,6 180 4.0 251

Source: EU R&D Scoreboard 2014

Preliminary observations with the bespoke biopharma dataset also revealed that the

scale and scope of diversification does have an impact on performance 45 . The best

performers in the four distinctive R&D value chain groups reveal that as average revenue

is four times higher for the diversified firms compared with the specialised R&D firms.

The geographic distribution of biopharma capabilities is exhibited in the following maps.

Although the global R&D parents are predominantly from the USA (Map 1), the combined

number of R&D parents and subsidiaries in Europe is quite significant46. The population

of USA firms is strongly domineered by the manufacturing activities. The Japanese

market shows much higher concentration of manufacturing and R&D in smaller number

of firms, and the proliferation of the wholesale and retail market.

44 Table 4. 45 Table 16. 46 Map 2.

24

Map 1. Global parents

Source: Bespoke global biopharma MNE derivative dataset (2015). Note: Total of 293 firms.

Map 2. Global parents and subsidiaries

Source: Bespoke global biopharma MNE derivative dataset (2015). Note: Total of 20 508 firms.

25

Map 3. European biopharma parents and subsidiaries

Source: Bespoke global biopharma MNE derivative dataset (2015). Note: Total of 6 505 firms.

Map 4. Biopharma subsidiaries in Europe by source of ownership (EU vs Others)

Source: Bespoke global biopharma MNE derivative dataset (2015).

26

European biopharma exhibits a balance of activities across all segments of the GVC,

while the UK shows some particular strength in services. Zooming into the European

market reveals that the size of the industry in the UK is comparable with this one in

Germany and marginally larger, in spite of the fact that UK does not have officially

registered biopharma clusters on the European cluster observatory. The distribution of

biopharma capabilities in Europe (Map 3) shows mature and diversified industry

agglomerations in most member-states, which makes it easy for firms to seek suppliers

and to form inter-firm relationships locally.

A distinctive feature of the population of firms is a growing number of cross-ownership

between European and other parents (Map 4). The total number of biopharma firms

operating in Europe is identified as 6 437, which includes subsidiaries of European

parents, subsidiaries of other global parents, and subsidiaries that are co-owned by

both47. This feature is more profound in Europe and in the USA, and much less observed

in the rest of the world48.

The activities data of the global biopharma companies in the bespoke global biopharma

MNE dataset reveal a complex picture of focused and diversification strategies, whereby

the traditional simple value chain of R&D, manufacturing and wholesale/trade is

extended with a combined vertical and horizontal integration of activities 49 . The

consequent value chain map contains strategic value chain groups of firms with a

specific pattern of diversification towards related services and input / output markets.

Examples are the strong presence of the agriculture and food processing firms (VCG 51),

or perfumes and cosmetics (VCG 23) and medical and hospital supplies (VCG 36)

companies integrated in the portfolio of global biopharma MNEs. The ownership ties

recorded in the dataset reveal also a significant overlap, where 4% of subsidiaries have

dual or multiple EU / global ownership. It is expected that these business entities are

active and profitable units, open to global markets. The large number of subsidiaries and

parents that operate in the service sector (such as holding and business administration

companies) is also a distinctive feature of the biopharma GVC that requires further

research. The service sector comprises approximately 21% of the population of firms in

the biopharma GVC, while the R&D segment (including diversified R&D with services and

wholesale) is only 9%.

Map 5. Biopharma subsidiaries worldwide by source of ownership (EU vs Others)

Source: Bespoke global biopharma MNE derivative dataset (2015).

47 Map 4. 48 Map 5. 49 Figure 2, 3.

27

In summary, the mapping of GVCs require firm level data and discrimination by country

of origin of ‘parents’ and ‘subsidiaries’, to demonstrate the flow of value added within

MNEs and across European boundaries. The significant cross between foreign

subsidiaries in Europe, and European controlled subsidiaries around the world indicates

how entangles is the real flows of value added. This raises a challenge at all levels of

organisation of capabilities – industry, cluster, regional, or country level.

The precise location of parents and subsidiaries is important particularly in terms of

cluster integration and impact on employment and growth. Investments and acquisitions

of university biotech spin-offs accelerate the location advantages of some clusters and

regions, generating a positive dynamic for growth. The specialisation of these locations

hence, becomes less important, compared with the rate of innovation outputs that

attracts investment flow. The smart specialisation, in this context, becomes a function of

the university system, the university-industry interactions, and the acceleration of

knowledge transfer practices, such as spin-offs, start-ups, contract research50.

The concentration of capabilities in strategic value chain groups (VCGs) reveals

alternative business models for diversification and for re-integration of value added

activities. Relationships between firms from the same VCG, however, remain

competitive, and inter-regional collaboration programmes can increase competition, as

well as cooperation.

Membership of firms in regional clusters indicates openness and readiness for

collaboration, but not necessarily regional strategic advantage. Patterns of

specialisation in regions and clusters, however, exhibit cluster depth, and as such – it

is an attractor for investment. The presence of more diversified firms in clusters is a

measure of cluster maturity and a potential for value chain integration, upgrade and

growth.

The subsequent sections of this paper demonstrate the use of value chain mapping at

regional level. The implementation of the value chain mapping methodology at regional

level can be described as a capability audit, where regions can identify their leading

business actors in a particular industry segment. Mapping of regional capabilities in a

particular segment requires a bespoke dataset of firms, built within known industry

boundaries (i.e. biopharma), and representing the entire population of firms operating

within these boundaries. The two cases selected for this work are the biopharma

industries in Bulgaria and in the UK Greater South East region, which combines the

former regional authorities of East of England, South East of England, and Greater

London.

50 Todeva, 2013.

Overall the mapping of GVC results in a dataset that contain details of the

location on capabilities in a particular industry (in our example – the

biopharma), the concentration of capabilities in regions and in strategic

value chain groups, and the dominant patterns of specialisation that drive

industry dynamics. All these are valuable prerequisites for an effective selection of partners in matchmaking events.

28

3. Case study: Bulgarian Biopharma value chain

Among the strategic priorities in the approved Smart Specialisation Strategy for Bulgaria

(2014) are biotechnology, pharmaceuticals and healthy living. Although these sectors do

not exhibit significant foreign direct investment (FDI) (with exception of food processing

and bio-foods), they show increase in exports and growth. The strategic document,

however, point at biotechnology capabilities only in the capital city Sofia, and does not

provide evidence of the pharma capabilities in the country, or the exact location of the

emerging bio-food cluster.

The main objectives of this case are to reveal what are the Bulgarian biopharma

capabilities and where is their location in the country. For this purpose, we built a

comprehensive bespoke dataset for the Bulgarian biopharma industry from Orbis data

source. The methodology for mapping the industry capabilities followed the same

principles as outlined for the bespoke global biopharma MNE dataset, but designed as

bottom-up selection within clear industry and administrative boundaries.

3.1. Capability mapping methodology overview

Step 1: Identifying core industry boundaries at country level

The boundaries of the sector were drawn using the results from the mapping of the

global biopharma value chain in the previous section and the observations and analysis

of the bespoke global biopharma MNE datasets, extracted from ORBIS. We selected the

core 15 NACE codes that capture all biopharma R&D, manufacturing, and specialised

biopharma wholesale including some generic R&D activities 51 . These codes were

identified in the bespoke global biopharma MNE dataset as core related industries

constituting the biopharma GVC and attracting the largest concentration of

subsidiaries52. We excluded from the categorisation two generic codes, which clearly

refer to corporate administration, and do not represent specific biopharma activity53.

Step 2: Building a comprehensive dataset of firms

We applied the same methodology of identifying firms through their unique BvD ID

number and expanding the data extraction from ORBIS with all their subsidiaries. After

the removal of: duplicate cases by BvD ID, firms with no activity data, or foreign

subsidiaries (as capabilities that are not within the administrative boundaries of the

51 The 11 core NACE codes selected for the construction of the bespoke Bulgarian biopharma

dataset were: 2014-Manufacture of other organic basic chemicals; 2041-Manufacture of soap

and detergents, cleaning and polishing preparations; 2042- Manufacture of perfumes and

toilet preparations; 2053 - Manufacture of essential oils; 2110-Manufacture of basic

pharmaceutical products; 2120-Manufacture of pharmaceutical preparations; 2660-

Manufacture of irradiation, electro-medical and electrotherapeutic equipment; 2670-

Manufacture of optical instruments and photographic equipment; 3250-Manufacture of

medical and dental instruments and supplies; 4646-Wholesale of pharmaceutical goods;

7211-Research and experimental development on biotechnology, subsequently amended by

four more generic codes (7120-Technical testing and analysis; 7219-Other research and

experimental development on natural sciences and engineering; 7220- Research and

experimental development on social sciences and humanities; 8690-Other human health

activities). 52 Table 9. 53 NACE 6420 - Activities of holding companies; NACE 7010 - Activities of head offices.

29

Bulgarian state), we derived at a total population for the output dataset of 7 156

firms, including 6 235 parents and 921 subsidiaries54.

Our observations of the concentration of firms in the generic R&D and services codes

concluded that nine generic codes cannot be used to define centres of biopharma

capabilities, as they capture firms across multiple value chains. This methodological step

is described in Table 18, where the population of firms in the output dataset was divided

into three subgroups – for further observations. The first group of firms resemble those

declaring the 11 pre-selected biopharma specific R&D codes55 All firms containing these

codes were selected as our derivative dataset56. After removing firms that do not contain

at least one of our 11 selected codes, the population in the derivative dataset was set

at 1 295 firms, among which 1 058 parents and 237 subsidiaries.

Only 13% of these firms represent large and very large entities, where we may expect

some diversification or horizontal and vertical integration within the value chain57. The

relatively large number of small and medium size firms indicate good potential for

innovation in the sector.

Table 5. Bulgarian biopharma capabilities by firm size

Type of company Count %

Very large (VL) 75 7%

Large (LA) 66 6%

Medium (ME) 212 20%

Small (SM) 690 66%

Total 1 043 100%

Missing 152

Source: Bespoke Bulgarian biopharma dataset (2015).

Step 3: Categorisation of firms in core value chain groups

The VCGs of the Bulgarian pharmaceutical industry were structured to correspond with

the VCGs identified in the global biopharma MNE dataset. The assumption here is that

the technological drivers in the industry are the same, and hence, interconnected

markets and interconnected technologies are expected to generate similar value chain

linkages, and to induce similar patterns of diversification.

All Bulgarian firms from the biopharma derivative dataset were categorised in groups

defined by the VCG core codes identified with the global biopharma MNE dataset. The

main objective of the categorisation was to achieve maximum co-alignment between the

core NACE codes of the Bulgarian VCGs and the core global biopharma VCGs58.

The population of Bulgarian biopharma contained 642 firms with a single NACE code and

653 firms that have 2 or more NACE codes 59. Firms with two or more codes were

categorised using Ward method of clusterisation with Euclidian distance and pre-set

cluster centres, transferred from the global MNE dataset methodology. Due to the small

number of firms, the clusterisation took place in one step. All small and dirty cluster

54 Table 17. 55 Table 18, codes highlighted in yellow. 56 Table 18, generic codes for holding, finance and business services (highlighted in

brown), and the generic R&D codes (highlighted in blue) were excluded from the

categorisation procedure. 57 Table 5. 58 Figure 2, 3. 59 Table 19.

30

groups were reviewed at firm level and cases were directly allocated to a VCG according

to their portfolio of activities. All VCGs from the Bulgariaх dataset received the label of

the coordinating VCG in the global dataset60.

Table 6. Strategic value chain groups in the Bulgarian biopharma sector

Strategic value chain groups Count %

11 - Biopharma R&D 177 14%

12 - Biopharma R&D & manufacturing 9 1%

13 - Biopharma R&D & services diversified 42 3%

14 - Clinical research & human health activities 141 11%

21 - Bio-pharma manufacturing 70 5%

22 - Biopharma manufacturing and wholesale 10 1%

23 - Perfumes and cosmetics manufacturing 266 21%

24 - Biopharma manufacturing multi-diversified 13 1%

25 - Chemical & biopharma manufacturing diversified 120 9%

26 - Medical Instruments, dental & electrotherapeutic manufacturing 176 14%

27 - Manufactured goods, electronics and instruments 10 1%

31 - Biopharma retail 18 1%

33 - Cosmetics & biopharma wholesale 10 1%

35 - Specialised biopharma wholesale 48 4%

41 - Holding, financial & administrative head office services 8 1%

42 - Other business and management services 15 1%

43 - Finance & insurance services 7 1%

44 - Miscellaneous services 81 6%

51 - Agriculture, food processing & drinks of bio-products 16 1%

52 - Manufactured miscellaneous goods 13 1%

53 - Electricity, gas and water supply & services 26 2%

54 - Other miscellaneous wholesale 19 1%

Total 1 295 100%

Source: Bespoke Bulgarian biopharma dataset (2015).

Step 4: Mapping of the industry value chain

The graphical display of the relationships between strategic value chain groups on Figure

6 reveals mature and diversified operations across most of the VCGs. The industry value

chain, however, exhibits different drivers that shape the sector61.

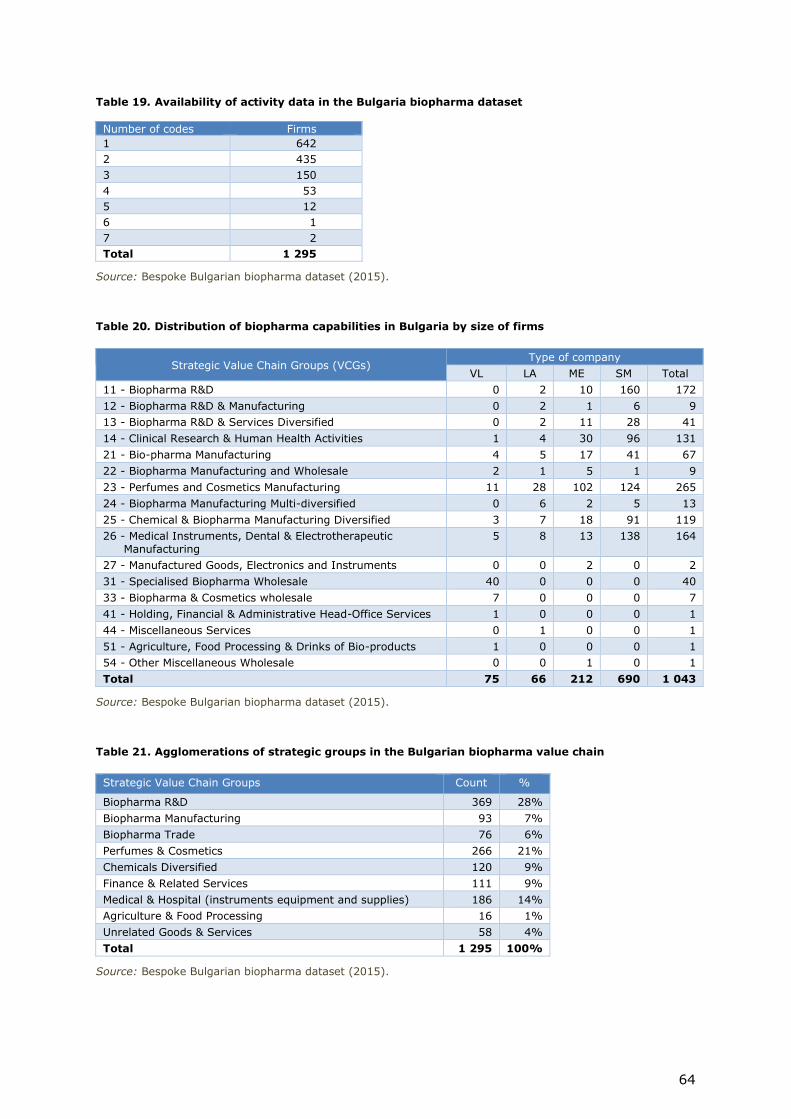
The Bulgarian biopharma value chain demonstrates capabilities across R&D,

manufacturing, and trade, as well as services and other related industries. Particular

strengths are exhibited in the cosmetics and medical instruments, where there is a high

proportion of operating firms. The large number of firms in the clinical research also

indicate capabilities towards the high end of value added.

These capabilities, however, may not be necessarily connected in the most effective way

as the current mapping does not indicate inter-firm resource and knowledge ties. The

additional network analysis with the Bulgarian dataset in fact reveals fragmentation of

the sector62.

60 Table 6 and Figure 2, 3. 61 Figures 6 and 7. 62 Figure 7.

31

Figure 6. Strategic value chain groups in the biopharma cluster in Bulgaria

Source: Bespoke Bulgarian biopharma dataset (2015). Note: Background colour indicates major type of activity;

Numbers indicate number of firms in each value chain group.

3.2. Analysis of the value chain structure of Bulgarian biopharma

Following the allocation of all Bulgarian biopharma firms in the derivative dataset in

specific VCGs, we applied a number of analytical procedures to reveal the structure of

capabilities within the value chain and the diversification links across firms. We used

network analysis techniques with two-mode networks to reveal structural relationships

within the dataset.

Ties between industry groups and NACE codes indicate patterns of specialisation and

diversification in the dataset and reveal a relatively fragmented sector63. The biopharma

value chain in Bulgaria contains four distinctive components where some integration of

capabilities is taking place. There are strong relationships of value added integration

between biopharma R&D and services (VCGs 11, 13), agriculture and food processing

and organic chemical (VCGs 25, 51), and medical instruments with clinical research

(VCGs 14, 26). It is expected, therefore, that firms in these interconnected components

of the value chain are looking for specific synergies and complementarities along

technological and market links between these segments. Further analysis of these four

components is necessary, but we may formulate a hypothesis that these segments are

driven by substantially different technological and market processes, and hence,

construct their own value chains on a micro scale.

An interesting observation is the relationship between perfumes and cosmetics

manufacturing (VCG 23) and biopharma manufacturing (VCG 21), which pulls the entire

wholesale and trade portfolio of operations (VCGs 31, 32, 33). The network

63 Figure 7.

32

demonstrates also that perfumes and cosmetics (VCG 23) and medical instruments (VCG

26) are quite strong in terms of number of firms that have capabilities in these

distinctive segments of the value chain. In addition, the large number of SMEs in

biopharma R&D, clinical research, perfumes and cosmetics and medical instruments

indicates a high level of entrepreneurial activity64.

Figure 7. Integrated segments of the Bulgarian biopharma value chain

Source: Bespoke Bulgarian biopharma dataset (2015). Note: Ties between clusters and NACE codes; the strongest 35% of ties in the network (Chi Sqr >24).

Holding companies in Bulgaria are connected to wholesale, rather than to R&D, as

observed in the global biopharma value chain65. The same network reveals that the

manufacturing capabilities are quite central to the Bulgarian biopharma value chain

(VCGs 21, 22, 12). It is through these manufacturing activities that chemical (VCG 25)

and agro food (VCG 51) operations are integrated.

The medical instruments group is observed on the same graph as quite disconnected

from the biopharma value chain, and this gives scope for intervention that could

enhance the synergies between these segments. Perfumes and cosmetics are also quite

isolated from the main biopharma value chain, which also gives scope for future

integration.

Another interesting observation on Figure 8 is the structural position of the diversified

R&D (VCG 13), which is at the end of integrated operations. This position indicates that

these diversified capabilities are pulled by other sectors and value chains, and potentially

represent areas where cross-fertilisation of technologies may occur. This VCG has 2

large firms, 11 medium size and 28 SMEs, which shows quite a small pool of capabilities,

but with a good potential.

64 Table 20. 65 Figure 8.

33

Figure 8. Structural integration of the Bulgarian value chain

Source: Bespoke Bulgarian biopharma dataset (2015). Note: Co-occurrence between strategic value chain groups within the value chain; the strongest 30% of ties

between nodes; size of the node is proportional to cluster size – i.e. number of firms.

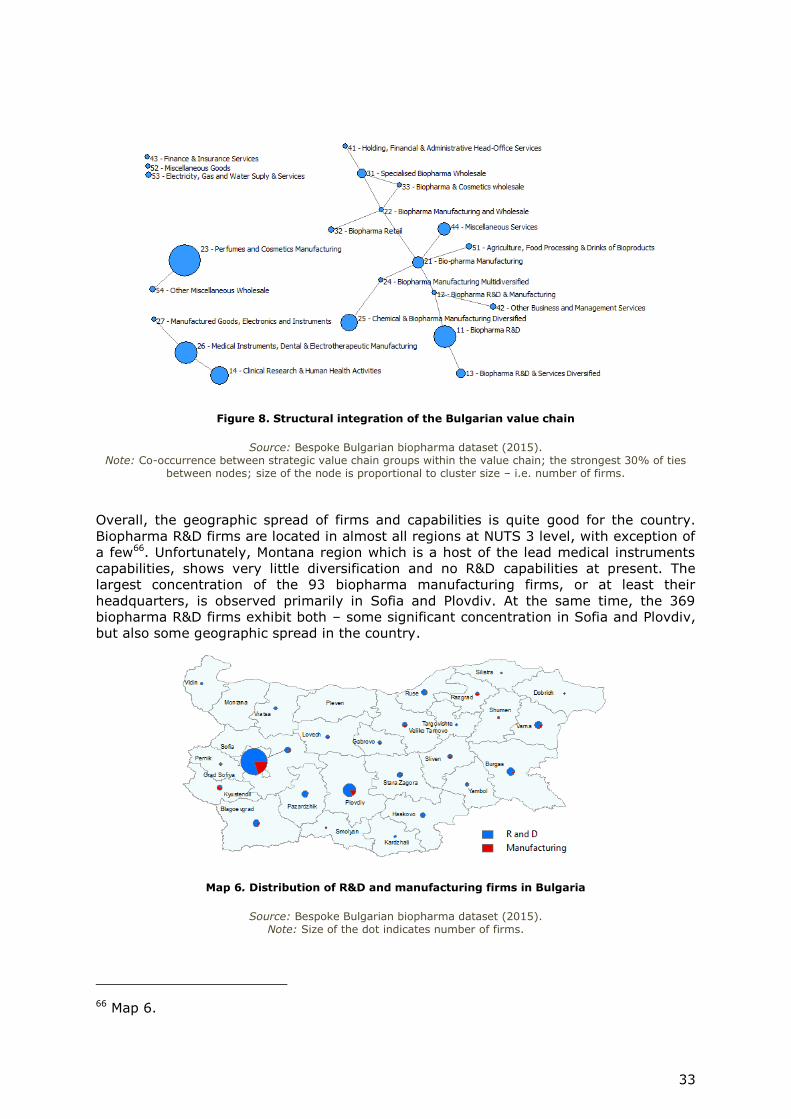
Overall, the geographic spread of firms and capabilities is quite good for the country.

Biopharma R&D firms are located in almost all regions at NUTS 3 level, with exception of

a few66. Unfortunately, Montana region which is a host of the lead medical instruments

capabilities, shows very little diversification and no R&D capabilities at present. The

largest concentration of the 93 biopharma manufacturing firms, or at least their

headquarters, is observed primarily in Sofia and Plovdiv. At the same time, the 369

biopharma R&D firms exhibit both – some significant concentration in Sofia and Plovdiv,

but also some geographic spread in the country.

Map 6. Distribution of R&D and manufacturing firms in Bulgaria

Source: Bespoke Bulgarian biopharma dataset (2015). Note: Size of the dot indicates number of firms.

66 Map 6.

34

Regarding the spread of other strategic capabilities related to the biopharma sector,

Sofia, Montana and Pazardzhik are the main centres for medical instruments, dental &

electrotherapeutic manufacturing (total 176 firms). Sofia, Plovdiv and Varna show strong

concentration of perfumes and cosmetics manufacturing (265 firms in total), while Sofia

and Plovdiv show relatively strong capabilities in chemical with biopharma diversified

(total 120 firms)67.

Map 7. Location and concentration of biopharma capabilities in Bulgaria

Source: Bespoke Bulgarian biopharma dataset (2015). Note: Leading segments of the biopharma value chain; Size of the dot indicates number of firms.

The case of mapping Bulgarian biopharma capabilities and positioning these within the

global value chain demonstrates that the country has good potential to implement its

smart specialisation strategy – related to developing ‘Healthy life and biotechnology’68.

While the bespoke dataset shows diversified capabilities, the subsequent analysis

demonstrates fragmentation of the value chain in the country. Providing opportunities

for value chain integration through matchmaking will enhance the competitiveness of the

sector as a whole. In addition, the large number of small biopharma firms, identified

through the value chain analysis, offer strategic opportunity for acceleration of the

technological entrepreneurship at country and regional level. The concentration of

specialised capabilities in three particular areas further offers new investment

opportunities in the sector69.

67 The strategic group on chemicals and biopharma diversified includes only part of this

sector, i.e. firms that have diversified across organic chemicals with pharma. 68 ‘Healthy life and biotechnology’ is one of the strategic priorities in the Bulgarian smart

specialisation strategy. 69 Map 7.

http://s3platform.jrc.ec.europa.eu/map?_captargmap_WAR_CapTargMapportlet_formDate=1467835866939&p_p_id=captargmap_WAR_CapTargMapportlet&p_p_lifecycle=0&p_p_state=normal&p_p_mode=view&p_p_col_id=column-1&p_p_col_count=1&_captargmap_WAR_CapTargMapportlet_mvcPath=%2Fhtml%2Fcaptargmap%2Fregioninfo_search.jsp&_captargmap_WAR_CapTargMapportlet_redirect=http%3A%2F%2Fs3platform.jrc.ec.europa.eu%2Fmap%3Fp_p_id%3Dcaptargmap_WAR_CapTargMapportlet%26p_p_lifecycle%3D0%26p_p_state%3Dnormal%26p_p_mode%3Dview%26p_p_col_id%3Dcolumn-1%26p_p_col_count%3D1%26_captargmap_WAR_CapTargMapportlet_mvcPath%3D%252Fhtml%252Fcaptargmap%252Fregioninfo_search.jsp&_captargmap_WAR_CapTargMapportlet_keywords=&_captargmap_WAR_CapTargMapportlet_advancedSearch=false&_captargmap_WAR_CapTargMapportlet_andOperator=1&_captargmap_WAR_CapTargMapportlet_regioninfoid=0&_captargmap_WAR_CapTargMapportlet_regionid=0&_captargmap_WAR_CapTargMapportlet_categoryid1_1=0&_captargmap_WAR_CapTargMapportlet_categoryid2_1=0&_captargmap_WAR_CapTargMapportlet_categoryid31=0&_captargmap_WAR_CapTargMapportlet_categoryid1_2=0&_captargmap_WAR_CapTargMapportlet_categoryid2_2=0&_captargmap_WAR_CapTargMapportlet_Categoryid3_2=0&_captargmap_WAR_CapTargMapportlet_regionname=Bulgaria&_captargmap_WAR_CapTargMapportlet_nutsid=&_captargmap_WAR_CapTargMapportlet_description=&_captargmap_WAR_CapTargMapportlet_description_search_type=AND&_captargmap_WAR_CapTargMapportlet_eu-country=on&_captargmap_WAR_CapTargMapportlet_eu-region=on&_captargmap_WAR_CapTargMapportlet_published=0&_captargmap_WAR_CapTargMapportlet_regionInfosSearchContainerPrimaryKeys=10454%2C10453%2C10455%2C10456

35

4. Case study: biomedical and biopharma value chain in

the Greater South East of England, UK

Regional economies are embedded into national political and economic environment and

exhibit both characteristics of the region and of the country. Regional boundaries are

politically constructed and regional policies are enacted by the authorities that govern

given territory. Following the restructuring of the regional authorities in the UK (2012),

there are currently eleven subnational regions in England. Five of these correspond with

what was previously known as the Greater South East (GSE), or inner London, outer

London and the three surrounding regions - East, South and South East of England. It is

known from the regional development literature that large metropolitan cities hold

concentration of educated labour and hence, attract economic activities. London as a

large global city has attracted significant international biopharma business, but the

distribution of biopharma capabilities has occurred in a wider regional context.

4.1. Cluster overview

Research undertaken just before the financial crises of 2008 identified that London and

the combined surrounding regions command over 4 700 core companies in the

biomedical and biopharma sector, generating revenues of almost £100 billion p.a. and

around 11 400 supply and delivery companies, generating additional £32 billion. All the

world’s top pharmaceutical companies are represented in the GSE, among which are the

top 115 multi-diversified biopharma companies, with over 200 000 employees

generating revenues in excess of £51 billion.

The GSE has a superb research base with over 60 research active universities, including

4 out of the world’s top 10 universities, which attracted a total of over £4 billion in public

sector and charity funding from 2000 – 2007. The GSE has an excellent well diversified

health technologies sector with depth and very good supply chain opportunities - from

basic research and development through to customers (Todeva, 2008). In this context,

the aim of this case was to identify the concentration and dispersion of biopharma

capabilities within the value chain and their geographic dispersion surrounding London.

Although the two areas of inner and outer London hold a large proportion of the

biopharma cluster activities, Map 8 shows a very good distribution of operations

throughout the entire region. The number of firms near Oxford and Cambridge, which

are known to host biopharma clusters, is comparable with the concentration of firms in

Guildford, Milton Keynes, Chelmsford, or Canterbury. The size of operations in Reading –

Slough even exceeds the concentration in Oxfordshire and Cambridgeshire70.

Overall, the biopharma and biomedical technology cluster in the GSE is a market driven

cluster, and exists as a powerful industry house for innovation and growth71. It holds a

mature cluster environment, as the region commands capabilities in all segments of the

biomedical and biopharma global value chain. The specific value chain that is constituted

in the GSE demonstrates large breath and scope of biopharma capabilities72.

4.2. Capability mapping methodology overview

The proposed methodology for mapping the biomedical and biopharma cluster in the

GSE originates from the ‘Multi-stage methodology for cluster mapping’ and aims to build

a bespoke dataset of firms that represent the entire population (within selected industry

70 Map 8. 71 Todeva, 2015. 72 Figure 9.

36

and geographic boundaries)73. The steps of this methodology aim to allocate all firms in

strategic value chain groups according to their activities and operations, and to analyse

the structure of capabilities within the biomedical and biopharma value chain. The cluster

boundaries are revealed through the administrative boundaries and through the location

choices of the firms operating in the region. The collection of performance data of all

firms for a period of 4 years enabled additional performance analysis, which was

undertaken at the level of strategic value chain groups within the value chain.

Step 1: Identifying core industry and regional boundaries

We established specific selection criteria that describe the leading technologies and

product fields in order to demarcate the boundaries of the health technology sector. The

selection criteria refer to 236 key words and selected industry codes from UK SIC, US

SIC, NACE, NAICS, CSO - that represent: biotechnology, diagnostics, surgical / medical

instruments and devices, pharmaceuticals, and medical research. A firm is included in

the dataset if it satisfies at least one of our selection criteria. The regional boundaries

include 20 administrative sub-regions within SEEDA, EEDA and LDA.

Step 2: Building a comprehensive dataset of firms

The bespoke GSE biomedical and biopharma dataset contains the entire population of

firms that correspond with our geographic and sectoral definitions, and are registered in

Amadeus data source (or have submitted tax returns for the period 2005-March 2008).

The population of firms in the dataset was enlarged with additional 95 SMEs that have

no Amadeus record for the UK, but have been identified by experts from the three

regional development agencies (SEEDA, EEDA and LDA 74 ). The complete Amadeus

records for individual firms in the dataset contain registration details, description of

activities, firm annual turnover, employment, and performance indicators, provided for

the last available year and the previous 3 years of tax returns by these firms (2005-

2007).

After cleaning the total population in the bespoke GSE biomedical and biopharma output

dataset (2008) contained 16,260 firms registered in the region, of which inner and

outer London contained the largest part (7,619 firms), followed by South East of England

– including Oxford, Kent, Reading and Milton Keynes clusters (5,587 firms) and by East

of England – including Cambridge, Bedford and Hemel Hempstead clusters (3,054

firms)75.

After a thorough examination, it was decided to select a subsample from our dataset,

containing the core groups most closely related to the biopharma value chain. This

selection produced our derivative dataset (4,783 firms in the core VCGs), which was

used for further substantial cluster mapping, network analysis and comparative

performance analysis76.

Step 3: Categorisation of firms in core value chain groups

The categorisation of firms followed the multi-stage methodology for cluster mapping

developed in 2006 for the mapping of regional capabilities in the South East of

England77. For the statistical clustering we used K-means algorithm developed under the

SPSS software, which is applicable to large data sets with large number of variables. All

73 Todeva, 2006. 74 South East of England Development Agency (SEEDA), East of England Development

Agency (EEDA), and London Development Agency (LDA). 75 Table 22. 76 Table 22 documents this selection of the derivative dataset and Table 23 provides

further details on employment and revenue for each of the core VCGs. 77 Todeva, 2006.

37

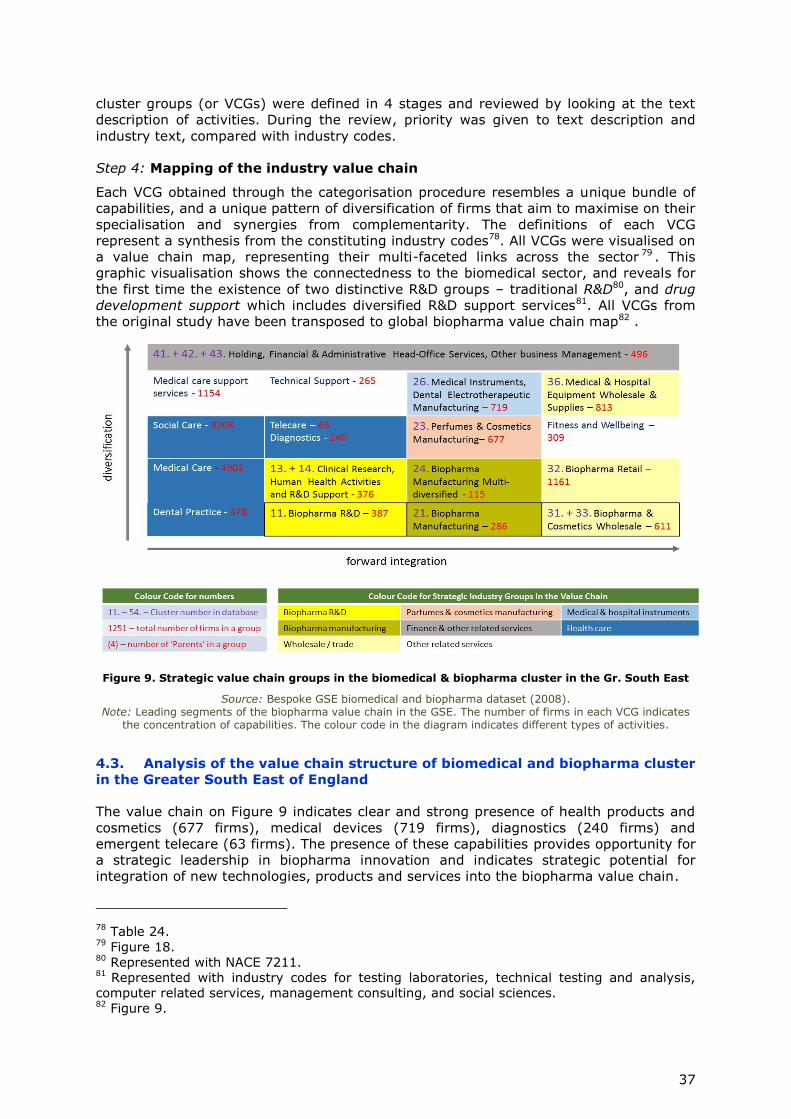
cluster groups (or VCGs) were defined in 4 stages and reviewed by looking at the text

description of activities. During the review, priority was given to text description and

industry text, compared with industry codes.

Step 4: Mapping of the industry value chain

Each VCG obtained through the categorisation procedure resembles a unique bundle of

capabilities, and a unique pattern of diversification of firms that aim to maximise on their

specialisation and synergies from complementarity. The definitions of each VCG

represent a synthesis from the constituting industry codes78. All VCGs were visualised on

a value chain map, representing their multi-faceted links across the sector 79 . This

graphic visualisation shows the connectedness to the biomedical sector, and reveals for

the first time the existence of two distinctive R&D groups – traditional R&D80, and drug

development support which includes diversified R&D support services81. All VCGs from

the original study have been transposed to global biopharma value chain map82 .

Figure 9. Strategic value chain groups in the biomedical & biopharma cluster in the Gr. South East

Source: Bespoke GSE biomedical and biopharma dataset (2008). Note: Leading segments of the biopharma value chain in the GSE. The number of firms in each VCG indicates

the concentration of capabilities. The colour code in the diagram indicates different types of activities.

4.3. Analysis of the value chain structure of biomedical and biopharma cluster

in the Greater South East of England

The value chain on Figure 9 indicates clear and strong presence of health products and

cosmetics (677 firms), medical devices (719 firms), diagnostics (240 firms) and

emergent telecare (63 firms). The presence of these capabilities provides opportunity for

a strategic leadership in biopharma innovation and indicates strategic potential for

integration of new technologies, products and services into the biopharma value chain.

78 Table 24. 79 Figure 18. 80 Represented with NACE 7211. 81 Represented with industry codes for testing laboratories, technical testing and analysis, computer related services, management consulting, and social sciences. 82 Figure 9.

38

Biopharma manufacturing capabilities exhibit maturity and scope, where there are two

distinctive VCGs – specialised biopharma manufacturing (286 firms), and integrated

multi-diversified biopharma manufacturing (115 firms) 83. The geographic map of the

region 84 indicates a good distribution of these capabilities across the entire GSE,

indicating maturity, specialisation and integration of the value chain.

Map 8. Dispersion of biomedical and biopharma activities throughout the GSE

Source: Bespoke GSE biomedical and biopharma dataset (2008). Note: The dot represents number of firms and the portfolio of capabilities in a location.

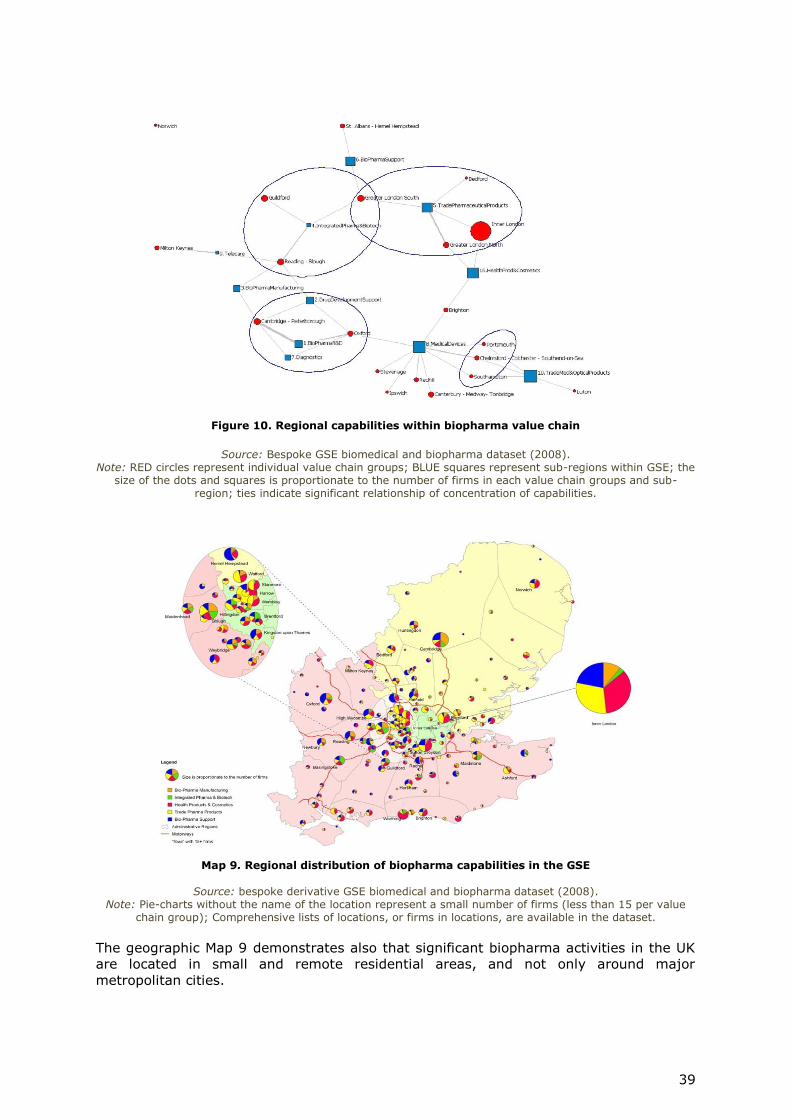
Further analysis into the concentration of capabilities across sub-regions reveals certain

preferences, which are clearly associated with the structure of the regional economy in

micro-locations. The three sub-regions with shipbuilding and sea-port activities

(Chelmsford, Portsmouth, and Southampton), for example exhibit strong concentration

of capabilities in medical instruments and devices 85 . The diagnostics VCG is clearly

associated more closely with the two biopharma R&D VCGs and firms are located in close

proximity to university medical hospital research. An interesting observation is that

telecare capabilities are not closely related to medical devices, but to other engineering

industries, which are co-located around Milton Keynes. The areas of Inner and Outer

London exhibit strong specialisation in health products and cosmetics and in wholesale /

trade of pharmaceuticals, both of which require strong marketing capabilities86. The

geographic spread of capabilities also demonstrates that the highest concentration of

firms is not around Oxford and Cambridge, as previously claimed, but at the intersection

of the three regions (East of England, South East of England and London)87.

83 Table 22. 84 Map 8. 85 Figure 10. 86 Figure 10 and Map 9. 87 Map 9.

39

Figure 10. Regional capabilities within biopharma value chain

Source: Bespoke GSE biomedical and biopharma dataset (2008). Note: RED circles represent individual value chain groups; BLUE squares represent sub-regions within GSE; the

size of the dots and squares is proportionate to the number of firms in each value chain groups and sub-region; ties indicate significant relationship of concentration of capabilities.

Map 9. Regional distribution of biopharma capabilities in the GSE

Source: bespoke derivative GSE biomedical and biopharma dataset (2008). Note: Pie-charts without the name of the location represent a small number of firms (less than 15 per value

chain group); Comprehensive lists of locations, or firms in locations, are available in the dataset.

The geographic Map 9 demonstrates also that significant biopharma activities in the UK

are located in small and remote residential areas, and not only around major

metropolitan cities.

40

Table 7. Comparative performance within the value chain

Strategic value chain

Groups

Median Profit Margins Coefficient of Variance of Profit Margins

t t-1 t-2 t-3 t-4 t-5 t t-1 t-2 t-3 t-4 t-5

1.BioPharma R&D 4.5% 3.7% 4.8% 0.7% 3.5% 3.1% 23.2 11.0 11.3 20.6 8.7 11.1

2.Drug Development

Support 5.3% 6.8% 6.6% 6.2% 7.4% 6.7% 4.9 3.5 2.9 3.0 3.1 3.0

3.BioPharma

Manufacturing 10.5% 7.7% 7.3% 7.2% 7.2% 6.1% 2.0 4.6 3.6 1.6 3.7 6.0

4.Integrated Pharma&

Biotech 7.3% 7.8% 7.3% 7.2% 6.9% 5.3% 5.5 17.6 5.1 3.6 2.5 4.6

5.Trade Pharmaceutical

Products 2.9% 2.7% 2.7% 3.0% 3.3% 3.4% 2.7 11.7 4.7 4.3 4.4 3.0

6.BioPharma Support 15.6% 15.8% 13.9% 13.5% 13.0% 8.1% 1.5 1.4 1.6 1.9 1.5 2.6

7.Diagnostics 6.5% 6.2% 4.3% 3.4% 5.7% 4.5% 2.8 5.1 10.7 6.0 3.4 2.8

8.Medical Devices 5.6% 5.4% 4.2% 5.2% 5.1% 4.8% 5.5 4.8 5.0 4.4 4.7 2.8

9.Telecare 1.0% 3.1% -0.3% 0.8% 2.1% 1.3% -12.1 11.5 -4.0 15.9 9.4 2.3

10.TradeMed & Optical

Products 5.8% 5.8% 5.9% 5.8% 4.9% 5.3% 2.9 2.5 2.2 2.8 3.6 2.4

16.Health Prod &

Cosmetics 4.0% 5.6% 4.2% 5.65 5.6% 4.8% 37.4 4.9 9.8 5.1 6.2 3.1

Source: bespoke derivative GSE biomedical and biopharma dataset (2008). Note: For the performance analysis we have used the median to counteract the strong asymmetric distribution of data and the presence of extreme cases.

Figure 11. Risk-adjusted performance within biopharma value chain

Source: Bespoke derivative GSE biomedical and biopharma dataset (2008). Note: The matrix uses the model of ‘sharp ratio’ (or mean by the standard deviation); The fit line represents

the theoretical expectation for a balance between risk and reward; Each observation indicates the risk-adjusted performance for an individual cluster group for a specific year (02, 03, 04, 05, 06); Observations below the fit line indicate relatively higher risk related to received reward; Observations above the fit line indicate relatively

higher performance for the risk associated with it.

Table 7 and Figure 11 both indicate that consistently over the 6 reported years (2002-

2007) drug development support firms have exhibited higher performance than the

41

biotech R&D firms. In addition, the high coefficient of variance in the biopharma R&D

group indicates very high level of risk for this type of activity within the value chain. The

consistent underperformance of biopharma R&D is more clearly exhibited on Figure 20,

where there is a very clear contrast between biopharma R&D and biopharma

management services. Telecare and diagnostics both appear on Figure 20 to be

underperforming, while integrated pharma and specialised biopharma manufacturing

demonstrate good performance results.

This comparative performance analysis of different segments of biopharma value chain is

possible only with a bespoke, comprehensive and clean dataset with firm activity and

performance data, which has been recommended with this methodology paper. The

challenge of mapping value chains is best addressed with firm data, as it is the firms

make strategic choices to specialise within the value chain, or to diversify across

segments. Each VCG represents a pattern, or similarity in how firms strategically

maximise efficiencies and optimise performance. The use of VCGs, hence, is

recommended as a unit that represents both geographic concentration and industry

specialisation of capabilities. On the basis of these critical observations, the final section

of this report outlines a set of policy recommendations related to enhancement of value

chain connectivity and maximising impact of policy interventions and regional and cluster

level.

We applied different performance metrics for the performance evaluation, i.e. market

performance metrics (return on equity and return on capital), economic development

performance metrics (employment and revenue growth), and accounting performance

metrics (profit margins, cash flow, and operating revenue).

Working with a comprehensive database of firms in a particular industry sector enables

us to use firm performance data and to analysis the distribution of profits along the

value chain comparing directly the value added and value extraction that is taking place

along the value chain. Table 8 compares performance of different strategic value chain

groups within the biomedical and biopharma cluster in the GSE.

Overall the value chain mapping of the GSE case demonstrates the advantages of using

bespoke sector datasets of firms at regional level, as this enables insightful analysis of

the pattern of diversification in a cluster and the concentration of specialised capabilities.

The analysis of the biomedical and biopharma value chain in the GSE provides evidence

for the maturity of the sector and the integration of the value chain within the

administrative boundaries of Greater South East of England. The comparative

performance analysis of different value chain groups provides insight both for strategic

positioning by firms and for regulatory intervention in cases of underperforming

segments. The details of specialised capabilities are essential for effective selection of

firms for matchmaking events.

5. Recommendations for policy makers

The entrepreneurial discovery process (EDP) which is an essential step towards building

smart specialisation strategies, requires stakeholder mapping and detailed knowledge of

the key industry players and knowledge providers at regional level. Building an effective

triple helix of proactive public authorities, universities and business enterprises is a

prerequisite for the development and implementation of smart specialisation strategies

through interregional cooperation at European level. The mapping exercises that have

already taken place across European regions demonstrate diversity and lack of

consistency. How to categorise stakeholders is important, but what is more important –

is to develop a better fine-tuned methodology for categorising the industry specialisation

in individual regions and clusters.

42

Mapping of regional capabilities within selected priority sectors and identifying the

location of these capabilities within the GVC is an essential tool in the implementation of

a number of EU policies.

5.1. Smart specialisation strategy implementation

Smart specialisation as a new growth strategy within the EU can be characterised by

regional level entrepreneurial discovery, identification and development of cross-sectoral

activities, selection and prioritisation of the activities under development, and

experimentation. The challenge for policy makers is to select the right priority areas,

where there is existing concentration of capabilities, and where policy intervention can

enhance the regional competitiveness in these areas. Statistical analysis rarely gives an

insightful picture on regional capabilities. Mapping regional capabilities with firm

level data is a new method that empowers cluster, regional and national authorities to

see who are the key stakeholders, what is their contribution to economic growth, and

what is the scope for policy intervention to enhance the regional competitiveness.

In order to formulate smart specialisation policies, government agencies need to

circulate a vision – how their specialisation will connect to wider European and global

markets. Smart specialisation strategies and implementation process should be driven

by facts as well as strategic vision, where the amalgamation of public and private

interests has to be carefully orchestrated. Export-led growth is nothing new, and the

policy instruments have a long history of application and cases. Value chain connectivity

via exports, however, is new and requires a profound understanding of the scope of

positioning strategies that can lead endogenous growth.

The proposed methodology strongly supports the practical implementation of all

principles that are essential for the smart specialisation strategy. First, the granularity

approach is very difficult to achieve, if governments do not have a detailed knowledge of

the structural composition of a particular priority sector. The use of single cases as

examples and anecdotal evidence as a justification of selection choices are quite

inadequate. Hence, a GVC mapping with a comprehensive dataset of firm-level

data offers a way to gain insights into the structural composition of already prioritised

sectors.

The entrepreneurial discovery principle requires obtaining a comprehensive list of

innovative SMEs, which can be achieved with the proposed new methodology. The firm-

level data collected for the entire population of firms enables both – match-making for

the smallest entrepreneurial firms, and observation of agglomeration effects at regional

Categorisation of industrial and technological specialisation in firms is an essential

prerequisite for mapping of regional capabilities and analysis of the position of

regions and clusters within established and emerging value chains.

The translation of knowledge from specialisation of individual leading firms into

concentration of capabilities in strategic value chain groups is an essential

step forward towards scaling up of pan-European collaborative ventures.

The proposed methodology gives details on: how to develop a bespoke industry

dataset for mapping concentration of capabilities within value chains and at

specific locations and how to identify active R&D firms in a particular industry

segment.

43

level.The proposed mapping technique enables to collect data also on measuring spill

overs and measuring structural changes. As an inclusive strategy, smart specialisation

strategy requires implementation activities at micro-firm level, or down to market.

Essential part of the implementation of smart specialisation strategy should be

identifying concentrations of capabilities and linking capabilities with markets in

Europe and abroad.

5.2. Cluster growth

Recent report from the European Secretariat for Cluster Analysis advocates that cluster

organisations should provide additional services to their members, such as: promotion of

the cluster location and facilitating media visibility, support for the internationalisation of

cluster members, collaborative technology development and technology transfer,

matchmaking and networking with external partners (ESCA, 2013). All of these activities

require knowing the entire population of firms in the cluster, and targeted promotion of

different firms from different strategic value chain groups. In fact, promoting strategic

value chain groups brings a higher value added to clusters and avoids the well

criticised ‘cherry picking’, enhancing collaborative advantage for businesses. Innovation

dynamics at cluster lever requires that innovation outputs are promoted throughout the

entire population of member firms, rather than for champions only.

Smart specialisation priorities at cluster and regional level require co-alignment of firm

strategies and incentivising the entire population of firms. Bespoke datasets of firms

focused on an area of specialisation can reveal existing concentrations of specialised

capabilities and new networking opportunities. Categorisation of firms and analysis of

value chain groups can point at complementarity and synergies along established

value chains and supply networks, contained in the cluster. Value chain maps enable

cluster members to enhance their self-awareness of the externalised advantages of their

co-location, suggestion new cluster cooperation possibilities.

The most recent reports on cluster performance and benchmarking, provide insightful

observations for specialised clusters, but are not capable to measure the depth of the

cluster in terms scale and scope of diversification, or structural position and value chain

participation, and hence, cannot offer a reliable method to monitor the long-term

position and upgrade of firms and clusters (European Cluster Observatory, 2014a, b).

The smart guide to cluster policy clearly indicates that linkages across related industries

are critical for cluster growth, and mapping these linkages within specific location

boundaries is essential to mobilising cluster activities and building the necessary critical

mass. Most current cluster initiatives require both:

a) knowledge and insight in the underlying value chains within clusters, as well as

how they connect to other related industry activities; and

b) detailed and exhaustive list of firms (including SMEs) that have capabilities in a

particular specialised area.

The value chain mapping methodology described in this paper enables mapping of

cluster capability and offers the next step of the Vanguard learning methodology - from

listing of key players, to maintaining a database with firms co-located in segments and

strategic value chain groups. Bespoke datasets of firms enable performance

measurement across segments of the value chain and inform key players how to

progress from ‘Learn’ to ’Connect’, ‘Develop’ and ‘Commercialise’. Cluster

internationalisation and match-making do require envisioning buyer-supplier

relationships and facilitating the connectivity across input and output markets,

which are best described by elaborate value chain maps.

European strategic cluster partnerships and consortia also can make use of the proposed

methodology for value chain mapping. Coordination of collaboration activities across

44

firms, regions and sectors that stand behind partnering clusters, require mapping at

multiple levels. Each partnership embraces inter-sectoral business developments that

cross and re-combine numerous value chains. Each partnership, hence, needs to

articulate its emerging value chain, as well as value chains in transformation. For

example, there are no blue prints for recombining the multitude of environmental

technologies products, processes and services, pursuit by the WIINTECH cluster

consortium, but a combined value chain mapping across their core technologies

and markets can enable to identify the critical competences and bridges that can

enhance the circulation of value added across all value chains, and will enable the

consortium to scale up their activities. The combination of waste management, water

and air treatment, transportation, construction and renewable energy is not accidental –

from a value chain perspective. Knowing how to accelerate the transformation of

traditional value chains and to re-combine with emerging technologies and markets,

requires a lot of oversight and value chain mapping can provide a critical input.

Leadership in the biopharma value network requires enhanced capabilities and

innovation thrust that attract companies either from the input or the output markets.

Gaining connectivity within the value network is more likely for cluster concentration of

entities, rather than for single players.

The European Cluster Collaboration Platform has currently 19 registered biopharma

clusters from 8 EU member states, which hardly represents the full capacity of the

European biopharma sector. The only registered UK biopharma cluster in the North East

of England represents only a small fraction of the biopharma capabilities in the UK,

exhibited by the case of Greater South East of England. It is important, hence, to

enhance this picture with a comprehensive value chain map of all current capabilities

located in EU member-states – to accelerate the connectivity and integration across

regions and fragmented capabilities. Similar is the picture across all other sectoral

agglomerations, where value chain mapping of capabilities can enhance both the self-

awareness of the clusters themselves, and their ability to reach out for new partners

across the European industry landscape.

5.3. SME support

The main orientation of the policy measures towards supporting SMEs is the

development of business friendly environment, providing financial support, encouraging

cluster growth, integration of SMEs in clusters, and support for internationalisation (EC

Growth). All these measures require knowledge of the SME capabilities in the first

instance, and adapting the policy instruments to accelerate existing entrepreneurial

strengths. Mapping the capabilities of SMEs in clusters and regions, hence, is

essential to providing support.

A new emergent policy framework suggests that the best way to deliver support to SMEs

is if they are organised in clusters. This approach is based on the assumption that

clusters are effective forms of organising capabilities and coordinating support measures.

The matchmaking events aim at building strategic partnerships, although the

methodology of what is matched to whom is still unclear.

There is clearly a need to translate the concept of GVC at a cluster, regional, or national

level. The current list of strategic cluster partnerships in Europe demonstrates the

weakness of the current cluster initiatives to map complex technological linkages

and value added sequences. Comprehensive firm level datasets at regional and cluster

level are necessary to understand and manage strategic cluster collaborations, and in

particular to provide a platform for technological entrepreneurship. A comprehensive

dataset of firms provides an opportunity to produce validated industry data for value

chain groups, segments and patterns of strategic behaviour of firms, enabling

matchmaking and strategic partnerships that can accelerate firm performance and

regional growth.

45

5.4. Technology policy and key enabling technologies (KETs)

The Commission defines that the engine for growth in Europe are knowledge intensive

sectors around key enabling technologies (KETs). The policy agenda is to support these

knowledge intensive sectors and the ‘technology bricks’ that support them and enable a

wide range of product application (COM, 2012: 341). The Commission has acknowledged

that KETs feed into many different industrial value chains and sectors and provide value

along the whole chains. The implementation of KETs technology and investment policy is

envisaged through a number of policy tools such as the Commission’s cluster policy and

cohesion policy, both of which require inside knowledge of the industry as a key

stakeholder. Yet, knowing the industry requires firm-level data, including inter-

firm connectivity within value chains. The proposed mapping methodology and the

associated with it comprehensive dataset of firms, hence is a key enabler in this process.

Encouraging regions and clusters to develop comprehensive maps of the value chains

that capture their regional capabilities will enhance all current policies of the European

Executive Agency for SMEs, or policies that support the ‘Industrial Renaissance in

Europe’.

In essence, European policies for growth, such as: Industrial policy; innovation and

competitiveness; key enabling technologies; industrial sustainability; or

internationalisation of firms, all will benefit from a more transparent picture of the

concentration of capabilities in strategic value chain groups. Facilitated co-

specialisation and collaboration of firms across strategic value chain groups is expected

to accelerate the optimisation of resources as well as spill-over effects from bridging.

Global value chains are at the intersection of numerous challenges for Europe 2020.

Mapping of KET value chains and in general the value chains of the core European

industries will provide a robust body of data in support of the core policy initiatives for

growth. Seeking Complementarity across the European technology space requires

comprehensive technology maps, as well as how these maps penetrate across firms.

5.5. Inter-regional cooperation networks

From its inception, the smart specialisation strategy initiative was envisaged to enhance

capabilities at regional level. Although for small member states it makes sense to

develop a smart specialisation strategy at a national level, the implementation process

requires active regional authorities, pro-actively mobilising local public and private sector

actors and adopting a multi-stakeholder approach to policy and strategy implementation.

Leading example of effective inter-regional cooperation supported by political

commitment at regional level is the Vanguard initiative, whereby a large interregional

consortium of over 30 regions follows a 4-step methodology of learning – connecting –

demonstration – commercialisation. The success of the vanguard initiative is partially

due to its effective institutionalisation of cooperation through specific task groups

focused on policy influencing, financial instruments, communication, monitoring and

foresight. The entrepreneurial discovery process, however, takes place in substantially

different way across connected regions, generating different implementation models. It

is recognised the need to develop a more standardised framework to guide the

implementation phase.

The new EDIP model (Figure 12) highlights that the implementation of interregional

collaboration strategies and the successful interregional cooperation networks require

more detailed mapping of industry and regional capabilities (strategic value chain groups

and innovation networks), communication platform for inter-sectoral and cross-border

stakeholder engagement that encompass industry-university and government (triple

helix), elaborate business models across input and output markets (designing value

chains and value added flows), and matchmaking within and across value chains (Figure

12).

46

Figure 12. EDIP model for inter-regional cooperation

Note: EDIP Entrepreneurial discovery and implementation model.

The new thematic platforms for interregional cooperation clearly put emphasis on the

need to enhance:

- knowledge of value chains in established and emerging industries;

- complementarities across regions based on more detailed mapping of regional

capabilities;

- matchmaking of partners within and across complementary strategic value chain

groups – to accelerate and scale up the development and commercialisation of new

products, services and technologies.

The current mapping methodology, hence, offers a tool to identify concentration of

capabilities in regions and industry segments, in order to facilitate the inter-sectoral and

cross-border matchmaking, and to assist in the wider selection of active R&D

performers.

5.6. Recommendations on how to map strategic capabilities and value chains

Although the methodologies presented in this paper encompass complex technicalities in

building bespoke and comprehensive datasets, ultimately the approach rests on the

simple principle that mapping (or visualisation) of concentration of capabilities in

strategic value chain groups across geographies and industry segments. Firm level

data on Actors, Capabilities, Flows, and Co-location enables strategic choices for

partnerships on a larger scale then single firm matchmaking. Firm data on scale and

scope of value chain operations is now available and the global coverage is

comprehensive at the level of the largest corporations and their subsidiaries worldwide.

Analysis of patterns of specialisation vs. diversification and inter-industry

connectivity enables selecting groups of firms for matchmaking and extending

complementarities. A value chain is constituted not by single suppliers, but by

technologically connected input and output markets with multiple specialised and

diversified firms. Hence, the analytical insights from the bespoke dataset support directly

the design of new emerging value chains. Comparative analysis of financial and

operating data effectively delivers insight into the drivers for competitiveness for

individual value chain groups.

This paper outlines a ’how-to-do’ approach for mapping and orchestration of GVCs which

can be described as a strategic effort to develop analytical products and practice that

assist in the design of value chain networks and in the positioning and upgrade of

47

countries, regions, clusters and firms. The approach includes the following elements

(Figure 13):

a) mapping of industry value chain groups -provides evidence of dynamic

capabilities at inter-sectoral and regional level;

b) mapping of regional concentration of capabilities across the EU at NUTS2/3

level - enables regional authorities and cluster managers to scale up the

matchmaking in established and emerging value chains;

c) comparative performance of value chain groups – provides evidence of the

distribution of profits and incentives within the value chains;

d) mapping specialised suppliers and lead R&D firms - empower cluster

managers, lead firms and small R&D firms – to connect to each other and

generate synergies across complementary activities;

e) empowering triple helix actors, cluster partnerships and knowledge

networks – to create effective match-making events and scale up the impact of

innovation;

f) using data to orchestrate the design of emerging value chain networks

and to optimise the entrepreneurial discovery and implementation process.

Figure 13. The complexity of GVC orchestration

Note: EDIP Entrepreneurial discovery and implementation model.

Orchestrating GVCs is also known as governance, or mechanisms for coordination and

control of the value added flows and the value extraction process. Managing GVC

requires in-depth knowledge of the technology drivers that create cross-sectoral

connectivity and facilitate innovation and commercial links. Overall orchestrating value

chain connectivity can focus independently on products, technologies, industry

segments, or locations, exploring future scenarios, challenging established trajectories,

and outlining new investment choices.

48

6. References

Baldwin, R. and Lopez-Gonzalez, J. (2015) Supply-chain Trade: A Portrait of Global

Patterns and Several Testable Hypotheses, The World Economy, 38 (11): 1682-

1721.

Caves, R. E and Porter, M. E. (1977) From Entry Barriers to Mobility Barriers:

Conjectural Decisions and Contrived Deterrence to New Competition, Quarterly

Journal of Economics, 9 (3): 241-261.

Caves, R. E. (1982) Multinational Enterprise and Economic Analysis. Cambridge, UK:

Cambridge University Press.

Delgado, M., Porter, M. and Stern, S. (2016) Defining Clusters of Related Industries,

Journal of Economic Geography, 16 (1): 1–38.

Eisenhardt, K. and Martin, J. (2000) Dynamic Capabilities: What Are They?, Strategic

Management Journal, 21 (10/11): 1105-1121.

European Commission COM (2012) 341 Communication from The Commission to The

European Parliament, The Council, The European Economic and Social Committee

and The Committee of the Regions - ‘A European Strategy for Key Enabling

Technologies – A Bridge to Growth and Jobs’, European Commission.

European Cluster Observatory (2014a) Cross-sectoral Trends and Geographic Patterns in

the Biopharmaceutical Industry: Report, European Commission, DG Enterprise and

Industry.

European Cluster Observatory (2014b) Cross-sectoral Trends and Geographic Patterns in

the Medical Devices Industry: Report, European Commission, DG Enterprise and

Industry.

Gereffi, G. and Korzeniewicz, M. (eds.) (1994) Commodity Chains and Global Capitalism,

Westport: Praeger.

Gereffi, G., Humphrey, J. and Sturgeon, T. (2005) The Governance of Global Value

Chains, Review of International Political Economy, 21 (1): 78–104.

Grant, R. (1996) Towards a Knowledge-Based Theory of the Firm, Strategic Management

Journal, 17: 109-122.

Kearney, A.T. (2013) Unleashing Pharma from the R&D Value Chain, Innovation: Ideas

and Insights, https://www.atkearney.com/innovation/ideas-insights/article/-

/asset_publisher/VHe1Q1yQRpCb/content/unleashing-pharma-from-the-r-d-

value-

chain/10192?_101_INSTANCE_VHe1Q1yQRpCb_redirect=%2Finnovation%2Fidea

s-insights; Accessed on 10.10.2015.

Kogut, B. (1984) Normative Observations on the International Value-Added Chain and

Strategic Groups, Journal of International Business Studies, Fall 1984, 151–167.

Kogut, B. and Zander, U. (1992) Knowledge of the Firm. Combinative Capabilities, and

the Replication of Technology, Organization Science, 3: 383-397.

Mudambi, R. (2008) Location, control and innovation in knowledge-intensive industries.

Journal of Economic Geography, 8(5): 699-725.

Porter, M. (1980) Competitive Strategy. Techniques for Analyzing Industries and

Competitors, New York: Free Press.

Shin, N., Kraemer, K. and J. Dedrick, J. (2012) Value Capture in the Global Electronics

Industry: Empirical Evidence for the ‘Smiling Curve’ Concept, Industry and

Innovation, 19 (1): 1–19.

49

Todeva, E. (2015) Market Driven Clusters as Prerequisites and Consequences of Smart

Specialisation, Journal of the Knowledge Economy, 6: 250-269.

Todeva, E. and Rakhmatullin, R. (2016) Industry Global Value Chains, Connectivity and

Regional Smart Specialisation in Europe. An Overview of Theoretical Approaches and

Mapping Methodologies, European Commission, Institute for Prospective

Technological Studies.

Todeva, E. (2006) Business Networks: Strategy and Structure, New York: Taylor &

Francis.

Todeva, E. (2008) Health Technology Cluster in the Greater South East, SEHTA-BIT

Report for SEEDA, EEDA, LDA, O2C.

Todeva, E. (2013) Governance of Innovation and Intermediation in The Triple Helix

Interactions, Industry and Higher Education, 27(4): 263-278.

Todeva, E., Knoke, D. and Keskinova, D. (2016) Multi-Stage Cluster Methodology with

Complementary Structural Analysis of 2-mode Networks, forthcoming in

International Journal for Social Research Methodology.

Todeva, E. and Keskinova, D. (2006) Clusters in the South East of England, University of

Surrey, ISBN: 1-84469-011-3.

Todeva, E. and Keskinova, D. (2013) The Studies of Blogs and On-Line Communities:

From Information to Knowledge and Action, in: N. Agarwal, R. T. Wigand, & M.

Lim (Eds.), Online Collective Action: Dynamics of the Crowd in Social Media,

Springer.

Todeva, E. and Rakhmatullin, R. (2016) Industry Global Value Chains, Connectivity and

Regional Smart Specialisation in Europe. An Overview of Theoretical Approaches

and Mapping Methodologies, JRC Science for Policy Report, European Union.

50

Data Sources

Bespoke Bulgarian biopharma dataset (2015)

Bespoke global biopharma MNE output dataset (2015)

Bespoke global biopharma MNE derivative dataset (2015)

Bespoke GSE biomedical and biopharma dataset (2008)

Bespoke regional South East of England dataset (2005)

Orbis: international corporate database. Link: http://www.bvdinfo.com/en-gb/our-

products/company-information/international-products/

orbis?gclid=CJebneLdu8sCFUKZGwodSd4G8Q

Web-links to resources

Agro-food - http://s3platform.jrc.ec.europa.eu/-/agri-food-s3-platform-information-

day?inheritRedirect=true&redirect=http%3A%2F%2Fs3platform.jrc.ec.europa.eu%2F

home

Circular economy policy - http://ec.europa.eu/growth/industry/sustainability/circular-

economy/index_en.htm

Cluster facilitated projects for new industrial value chains -

http://ec.europa.eu/research/participants/portal/desktop/en/opportunities/h2020/topics/

6084-innosup-01-2016-2017.html

Cluster internationalisation -

http://ec.europa.eu/growth/smes/cluster/internationalisation/index_en.htm

Clusters and emerging industries - http://ec.europa.eu/growth/smes/cluster/emerging-

industries/index_en.htm

Competitiveness in the healthcare industries -

http://ec.europa.eu/growth/sectors/healthcare/competitiveness/index_en.htm

COSME programme for SME support (DG GROWTH) -

http://ec.europa.eu/growth/smes/cosme/index_en.htm

EC COM: For a European industrial renaissance - http://eur-lex.europa.eu/legal-

content/EN/TXT/?uri=CELEX:52014DC0014

EC Growth: Internal Market, Industry, Entrepreneurship and SMEs -

http://ec.europa.eu/growth/index_en.htm

ESCP, 2016 -

http://www.clustercollaboration.eu/sites/default/files/Table%20of%20European%20Clus

ter%20Strategic%20Partnerships-4i_VF%20for%20publication.pdf

EU R&D Scoreboard 2014 - http://iri.jrc.ec.europa.eu/scoreboard14.html

European Cluster Collaboration Platform - http://www.clustercollaboration.eu/cluster-list

European cluster consortia - http://archive.clustercollaboration.eu/european-

strategy;jsessionid=C10FA959B1E6FA9DE91B618C6E0BCF9D

European cluster panorama –

http://ec.europa.eu/growth/smes/cluster/observatory/about/index_en.htm

European Executive Agency for SMEs (EASME) - http://ec.europa.eu/easme/en

European strategic cluster partnerships - http://www.clustercollaboration.eu/escp-list

51

European Strategic Cluster Partnerships - http://www.clustercollaboration.eu/eu-cluster-

partnerships

EYE@RIS3 search tool - http://s3platform.jrc.ec.europa.eu/map

Industrial modernisation - http://s3platform.jrc.ec.europa.eu/-/information-day-

industrial-modernisation-s3-

platform?inheritRedirect=true&redirect=http%3A%2F%2Fs3platform.jrc.ec.europa.eu

%2Fhome

Industrial Renaissance in Europe - http://eur-lex.europa.eu/legal-

content/EN/TXT/?uri=CELEX:52014DC0014

RECONFIRM Initiative for Regional Co-Operation Networks -

https://ec.europa.eu/easme/en/tender/8029/regional-cooperation-networks-industrial-

modernisation-reconfirm-initiative

Regional Innovation Monitor Plus (2015) Mapping advanced manufacturing networks and

exploring new business Opportunities, TECHNOPOLIS & FRAUNHOFER,

https://ec.europa.eu/growth/tools-databases/regional-innovation-

monitor/sites/default/files/report/RIM%20Plus_Mapping%20Advanced%20Manufactur

ing%20Networks_Thematic%20Paper.pdf

Regional Innovation Monitor Plus, 2015 - https://ec.europa.eu/growth/tools-

databases/regional-innovation-

monitor/sites/default/files/report/RIM%20Plus_Mapping%20Advanced%20Manufacturing

%20Networks_Thematic%20Paper.pdf

Regional smart specialisation strategies - http://s3platform.jrc.ec.europa.eu/home

Smart guide to cluster policy -

http://ec.europa.eu/DocsRoom/documents/16903/attachments/1/translations/en/ren

ditions/native

Smart regions conference (2016) -

http://ec.europa.eu/regional_policy/en/conferences/smart-regions/

Smart Specialisation Strategy - http://s3platform.jrc.ec.europa.eu/home

Thematic Platforms - http://s3platform.jrc.ec.europa.eu/s3-themes

Towards industrial renaissance –

http://ec.europa.eu/growth/industry/policy/renaissance/index_en.htm

US cluster mapping initiative - http://clustermapping.us/about

Vanguard initiative - http://www.s3vanguardinitiative.eu/ambitions

Vanguard initiative methodology -

http://s3platform.jrc.ec.europa.eu/documents/20182/170991/2.1+Wim+de+Kindere

nSSP+Industry+Modernisation+Info+Day+-+ppt+Vanguard+FINAL.pdf/564e3431-

ee25-4033-a494-0a5df01ac54e

52

List of tables

Table 1. Industry composition of the global biopharma strategic value chain groups .... 13

Table 2. Mapping global value chains – a synthesis .................................................. 19

Table 3. Biopharma MNEs from the top 2500 R&D investors by country of origin ......... 20

Table 4. Comparative business performance - European vs. other global MNEs ........... 23

Table 5. Bulgarian biopharma capabilities by firm size ............................................. 29

Table 6. Strategic value chain groups in the Bulgarian biopharma sector .................... 30

Table 7. Comparative performance within the value chain ........................................ 40

Table 8. Biopharma industry codes and industry segments for measuring outputs (NACE,

NAICS, ISIC) .......................................................................................... 54

Table 9. Top biopharma MNEs - activities in related and unrelated industries .............. 57

Table 10. Structure of the bespoke global biopharma MNE datasets: (A) output dataset;

(B) derivative dataset; (C) sub-sample of all very large and large firms ....... 58

Table 11. Strategic value chain groups in the biopharma GVC ................................... 59

Table 12. Strategic biopharma value chain groups by parents and subsidiaries ........... 60

Table 13. Core Biopharma GVC agglomerations .................................................... 061

Table 14. European biopharma value chain agglomerations ...................................... 61

Table 15. European biopharma value chain agglomerations by parents and subsidiaries

......................................................................................................................... 61

Table 16. Best performers in the biopharma global R&D strategic groups ................... 62

Table 17. Structure of the bespoke Bulgarian biopharma datasets: (A) output dataset;

(B) derivative dataset ............................................................................ 63

Table 18. Distribution of firms by industry in the Bulgarian biopharma dataset ............ 63

Table 19. Availability of activity data in the Bulgaria biopharma dataset ..................... 64

Table 20. Distribution of biopharma capabilities in Bulgaria by size of firms ................ 64

Table 21. Agglomerations of strategic groups in the Bulgarian biopharma value chain .. 64

Table 22. Distribution of biomedical and biopharma capabilities in the GSE ................. 65

Table 23. Size of biomedical and biopharma VCGs in the GSE cluster ......................... 65

Table 24. Definitions of strategic value chain groups in the GSE cluster ...................... 66

Table 25. Distributions of Operating Revenue / Turnover (th GBP) in Sub-regions in the

GSE cluster ........................................................................................... 67

53

List of figures

Figure 1: Ties between value chain groups and NACE codes ..................................... 16

Figure 2. Biopharma global value chain (A) ............................................................ 16

Figure 3. Biopharma global value chain (B) ............................................................ 17

Figure 4. Ownership ties in the biopharma global value chain (A) .............................. 21

Figure 5. Co-occurrence between strategic value chain groups in the global biopharma 22

Figure 6. Strategic value chain groups in the biopharma cluster in Bulgaria ................ 31

Figure 7. Integrated segments of the Bulgarian biopharma value chain ...................... 32

Figure 8. Structural integration of the Bulgarian value chain ..................................... 33

Figure 9. Strategic value chain groups in the biomedical and biopharma cluster in the

Greater South East ................................................................................ 37

Figure 10. Regional capabilities within biopharma value chain ................................... 39

Figure 11. Risk-adjusted performance within biopharma value chain .......................... 40

Figure 12. EDIP model for inter-regional cooperation ............................................... 46

Figure 13. The complexity of GVC orchestration ...................................................... 47

Figure 14. The two ends of the R&D process in biopharma value chain ....................... 55

Figure 15. Biopharma and related cluster categories ................................................ 55

Figure 16. Boston bio-pharmaceuticals cluster ........................................................ 56

Figure 17. South East of England pharmaceuticals cluster map ................................. 56

Figure 18. Greater South East of England biomedical and biopharma cluster map........ 57

Figure 19. Ownership ties in the biopharma global value chain (B) ............................ 62

List of maps

Map 1. Global parents .......................................................................................... 24

Map 2. Global parents and subsidiaries .................................................................. 24

Map 3. European biopharma parents and subsidiaries .............................................. 25

Map 4. Biopharma subsidiaries in Europe by source of ownership (EU vs Others) ........ 25

Map 5. Biopharma subsidiaries worldwide by source of ownership (EU vs Others) ........ 26

Map 6. Distribution of R&D and manufacturing firms in Bulgaria ................................ 33

Map 7. Location and concentration of biopharma capabilities in Bulgaria .................... 34

Map 8. Dispersion of biomedical and biopharma activities throughout the GSE ............ 38

Map 9. Regional distribution of biopharma capabilities in the GSE .............................. 39

Map 10. University collaborations in biomedical research across the GSE ................... 68

54

Appendix: additional tables, figures and maps

Table 8. Biopharma industry codes and industry segments for measuring outputs (NACE, NAICS, ISIC)

CODES Code Description

NACE 21 2110 2120 72 721 72 11 7219 7220

Manufacture of basic pharmaceutical products and pharmaceutical preparations Manufacture of basic pharmaceutical products Manufacture of pharmaceutical preparations Scientific research and development Research and experimental development on natural sciences and engineering Research and experimental development on biotechnology Other research and experimental development on natural sciences and engineering Research and experimental development on social sciences and humanities

NAICS 325199 325411

325412 325413 325414 334510 423450 423460 424210 446110 446120 446130 446191 541711 541712 621492 621511 621512 621991 623312

All Other Basic Organic Chemical Manufacturing Medicinal and Botanical Manufacturing

Pharmaceutical Preparation Manufacturing In-Vitro Diagnostic Substance Manufacturing Biological Product (except Diagnostic) Manufacturing Electro-medical and Electrotherapeutic Apparatus Manufacturing Medical, Dental, and Hospital Equipment and Supplies Merchant Wholesalers Ophthalmic Goods Merchant Wholesalers Drugs and Druggists' Sundries Merchant Wholesalers Pharmacies and Drug Stores Cosmetics, Beauty Supplies, and Perfume Stores Optical Goods Stores Food (Health) Supplement Stores Research and Development in Biotechnology Research and Development in the Physical, Engineering, and Life Sciences (except Biotechnology) Kidney Dialysis Centres Medical Laboratories Diagnostic Imaging Centres Blood and Organ Banks Assisted Living Facilities for the Elderly

ISIC 2100 0128 1079 2310 3250 4649 4772 7210 8292

Division 21: Manufacture of pharmaceuticals, medicinal chemical and botanical products Manufacture of pharmaceuticals, medicinal chemical and botanical products Growing of spices, aromatic, drug and pharmaceutical crops Manufacture of herb infusions Manufacture of glass and glass products (including manufacture of laboratory, hygienic or pharmaceutical glassware) Manufacture of medical, surgical and dental instruments and supplies (including 34 major product groups such as: bone reconstruction cements, dental, ophthalmic orthopaedic and laboratories goods, appliances, devices and instruments) Wholesale of other household goods (including wholesale of pharmaceutical and medical goods) Retail sale of pharmaceutical and medical goods, cosmetic and toilet articles in specialised stores Research and development for pharmaceuticals and biotech pharmaceuticals Packaging activities (including security packaging of pharmaceutical preparations)

55

Figure 14. The two ends of the R&D process in biopharma value chain

Source: Adopted from Kearney (2013).

Figure 15. Biopharma and related cluster categories

Source: Adopted from European Cluster Panorama, 2014.

56

Figure 16. Boston bio-pharmaceuticals cluster

Source: Adopted from US Cluster Mapping Initiative, Cluster 101.

Figure 17. South East of England pharmaceuticals cluster map

Source: Adopted from Todeva and Keskinova (2006). Note: Data from Amadeus (2005); Bespoke regional South East of England dataset (2005); network map is based on 5% of ties, or > 6 firms; Size of the dot indicates number of firms; Links indicate cross-sectoral

complementarities in value added (based on US SIC codes).

57

Figure 18. Greater South East of England biomedical and biopharma cluster map

Source: Adopted from Todeva (2008). Note: Bespoke GSE biomedical and biopharma dataset (2008); Data from Amadeus (2008);

numbers indicate firms in each strategic value chain group; Links indicate input-output relationships; Colours discriminate between different type of activity.

Table 9. Top biopharma MNEs - activities in related and unrelated industries

NACE Codes* Count %

2120 - Manufacture of pharmaceutical preparations 1 395 30%

4646 - Wholesale of pharmaceutical goods 1 392 30%

7219 - Other research and experimental development on natural sciences and engineering

450 10%

4645 - Wholesale of perfume and cosmetics 404 9%

2110 - Manufacture of basic pharmaceutical products 385 8%

7211 - Research and experimental development on biotechnology 351 8%

6420 - Activities of holding companies 280 6%

7010 - Activities of head offices 259 6%

4690 - Non-specialised wholesale trade 185 4%

8299 - Other business support service activities n.e.c. 180 4%

4618 - Agents specialised in the sale of other particular products 136 3%

7022 - Business and other management consultancy activities 122 3%

4675 - Wholesale of chemical products 118 3%

3250 - Manufacture of medical and dental instruments and supplies 114 2%

2059 - Manufacture of other chemical products n.e.c. 110 2%

4773 - Dispensing chemist in specialised stores 104 2%

8690 - Other human health activities 85 2%

7320 - Market research and public opinion polling 80 2%

7490 - Other professional, scientific and technical activities n.e.c. 79 2%

7311 - Advertising agencies 73 2%

2042 - Manufacture of perfumes and toilet preparations 50 1%

2660 - Manufacture of irradiation, electromedical and electrotherapeutic equipment

44 1%

58

NACE Codes* Count %

2014 - Manufacture of other organic basic chemicals 42 1%

4774 - Retail sale of medical and orthopaedic goods in specialised stores 41 1%

2013 - Manufacture of other inorganic basic chemicals 38 1%

2020 - Manufacture of pesticides and other agrochemical products 33 1%

7120 - Technical testing and analysis 32 1%

Source: Bespoke global biopharma MNE derivative dataset (2015); sub-sample of large and very large firms (4656). Note: Pre-selected NACE codes for the categorisation procedure are highlighted in red; Count measures the number of firms in each industry in the dataset.

Table 10. Structure of the bespoke global biopharma MNE datasets: (A) output dataset; (B)

derivative dataset; (C) sub-sample of all very large and large firms

A) Output dataset – parents with their subsidiaries without duplicate

Extracted cases of subsidiaries 37 793

Removed all duplicate cases by parent BvD ID number & subsidiary BvD ID number (these are cases in which the subsidiary appears on more than one level)

4 140

A) Final output dataset – parents with their subsidiaries without duplicate 33 653

of which firms with activity data 23 280

B) Derivative dataset – ALL parents and subsidiaries with activities data and no duplicates

Parents 293

Subsidiaries from output dataset (subsidiaries can occur more than 1 time in the dataset, when they have more than 1 parent)

33 653

Initial derivative dataset 33 946

Removed all duplicate cases 4 349

Removed cases of subsidiaries with ownership and location data, but no activities data

9 089

B) Derivative dataset - All parents and subsidiaries with activities data and no duplicates 20 508

of which parents 293

subsidiaries 20 215

C) Sub-sample from (B) of the large and very large firms 4 656

Source: Bespoke global biopharma MNE derivative dataset (2015). Note: Dark fields represent sums; italic represents data cleaning.

59

Table 11. Strategic value chain groups in the biopharma GVC

Strategic Value Chain Groups All

Parents EU

Parents Parents &

Subsidiaries EU Parents & Subsidiaries

11 - Biopharma R&D 19 9 903 553

12 - Biopharma R&D & Manufacturing 90 2 180 13

13 - Biopharma R&D & Services Diversified 8 3 262 126

14 - Clinical Research & Human Health Activities 2 0 475 194

21 - Bio-pharma Manufacturing 71 20 6 271 761

22 - Biopharma Manufacturing and Wholesale 41 9 282 145

23 - Perfumes and Cosmetics Manufacturing 1 1 64 23

24 - Biopharma Manufacturing Multi-diversified 23 4 173 95

25 - Chemical & Biopharma Manufacturing Diversified 6 4 459 168

26 - Medical Instruments, Dental & Electrotherapeutic Manufacturing

4 0 306 91

27 - Manufactured Goods, Electronics and Instruments 0 0 162 47

28 - Special Purpose Machinery and Equipment 1 0 105 39

31 - Specialised Biopharma Wholesale 3 2 1 424 1 098

32 - Biopharma Retail 0 0 1 829 215

33 - Biopharma & Cosmetics wholesale 3 0 1 251 43

34 - Pharma Wholesale Trade & Services Diversified 0 0 71 60

35 - Chemical & Biopharma Wholesale 0 0 119 52

36 - Medical & Hospital Equipment Wholesale & Supplies 0 0 355 53

41 - Holding, Financial & Administrative Head-Office Services

14 8 1 517 974

42 - Other Business and Management Services 3 3 854 555

43 - Finance & Insurance Services 0 0 574 152

44 - Miscellaneous Services 3 2 1 267 519

51 - Agriculture, Food Processing & Drinks of Bio-products 1 1 589 115

52 - Miscellaneous Goods 0 0 111 11

53 - Electricity, Gas and Water Supply & Services 0 0 290 238

54 - Other Miscellaneous Wholesale 0 0 615 165

Total 293 68 20 508 6 505

Source: Bespoke global biopharma MNE derivative dataset (2015).

60

Table 12. Strategic biopharma value chain groups by parents and subsidiaries

Strategic Value Chain Groups

Parents Subsidiaries

EU Other Global EU Other Global

Count Row % Count Row % Count Row % Count Row %

11 - Biopharma R&D 9 47% 10 53% 544 62% 340 38%

12 - Biopharma R&D & manufacturing

2 2% 88 98% 11 12% 79 88%

13 - Biopharma R&D &

services diversified 3 38% 5 63% 123 48% 131 52%

14 - Clinical research & human health activities

0 0% 2 100% 194 41% 279 59%

21 - Bio-pharma manufacturing

20 28% 51 72% 741 12% 5 459 88%

22 - Biopharma manufacturing and wholesale

9 22% 32 78% 136 56% 105 44%

23 - Perfumes and cosmetics manufacturing

1 100% 0 0% 22 35% 41 65%

24 - Biopharma manufacturing multi-diversified

4 17% 19 83% 91 61% 59 39%

25 - Chemical & biopharma manufacturing diversified

4 67% 2 33% 164 36% 289 64%

26 - Medical Instruments, dental & electrotherapeutic manufacturing

0 0% 4 100% 91 30% 211 70%

27 - Manufactured goods, electronics and instruments

0 0% 0 0% 47 29% 115 71%

28 - Special purpose machinery and equipment

0 0% 1 100% 39 38% 65 63%

31 - Specialised biopharma wholesale

2 67% 1 33% 1 096 77% 325 23%

32 - Biopharma retail 0 0% 0 0% 215 12% 1 614 88%

33 - Cosmetics & biopharma wholesale

0 0% 3 100% 43 3% 1 205 97%

34 - Pharma wholesale trade & services diversified

0 0% 0 0% 60 85% 11 15%

35 - Chemical & biopharma

wholesale 0 0% 0 0% 52 44% 67 56%

36 - Medical & hospital equipment wholesale & supplies

0 0% 0 0% 53 15% 302 85%

41 - Holding, financial & administrative head-office services

8 57% 6 43% 966 64% 537 36%

42 - Other business and management services

3 100% 0 0% 552 65% 299 35%

43 - Finance & insurance services

0 0% 0 0% 152 26% 422 74%

44 - Miscellaneous services 2 67% 1 33% 517 41% 747 59%

51 - Agriculture, food processing & drinks of bio products

1 100% 0 0% 114 19% 474 81%

52 - Manufactured misc. goods

0 0% 0 0% 11 10% 100 90%

53 - Electricity, gas and water supply & services

0 0% 0 0% 238 82% 52 18%

54 - Other misc. wholesale 0 0% 0 0% 165 27% 450 73%

Total 68 23% 225 77% 6 437 32% 13 778 68%

Source: Bespoke global biopharma MNE derivative dataset (2015). Note: Data for parents and subsidiaries is from the derivative dataset of 20508 categorised firms with activity data. 9 European parents are located in non-EU member states.

61

Table 13. Core Biopharma GVC agglomerations

Value Chain Agglomerations Parents Subsidiaries Total

Biopharma R&D 119 1 701 1 820

Biopharma Manufacturing 135 6 591 6 726

Biopharma Trade 6 4 688 4 694

Perfumes & Cosmetics 1 63 64

Chemicals Diversified 6 453 459

Finance & Related Services 20 4 192 4 212

Medical & Hospital (instruments equipment and supplies) 5 923 928

Agriculture & Food Processing 1 588 589

Unrelated Goods & Services 0 1 016 1 016

Total 293 20 215 20 508

Source: Bespoke global biopharma MNE derivative dataset (2015).

Table 14. European biopharma value chain agglomerations

Value Chain Agglomerations All

Parents EU Parents

All Parents & Subsidiaries

EU Parents & Subsidiaries

Biopharma R&D 119 14 1 820 886

Biopharma Manufacturing 135 33 6 726 1 001

Biopharma Trade 6 2 4 694 1 468

Finance & Related Services 20 13 4 212 2 200

Perfumes & Cosmetics 1 1 64 23

Chemicals Diversified 6 4 459 168

Medical & Hospital (instruments equipment and supplies)

5 0 928 230

Agriculture & Food Processing 1 1 589 115

Unrelated Goods & Services 0 0 1 016 414

Total 293 68 20 508 6 505

Source: Bespoke global biopharma MNE derivative dataset (2015).

Table 15. European biopharma value chain agglomerations by parents and subsidiaries

Value Chain Agglomerations

All Parents All Subsidiaries

EU Other Global EU Other Global

Count Row % Count Row % Count Row % Count Row %

Biopharma R&D 14 12% 105 88% 872 51% 829 49%

Biopharma Manufacturing 38 26% 108 74% 1 245 17% 6 164 83%

Biopharma Wholesale/Trade 2 33% 4 67% 1 684 30% 3 974 70%

Biopharma Services 11 65% 6 35% 1 670 57% 1 258 43%

Biopharma Other Input / Output Industries

3 60% 2 40% 966 38% 1 553 62%

Total 68 23% 225 77% 6 437 32% 13 778 68%

Source: Bespoke global biopharma MNE derivative dataset (2015). Note: Categorised 20508 firms. The category ‘Other Input / Output Industries’, contains all VCGs in Perfumes and cosmetics; Medical & hospital instruments, equipment and supplies; Agriculture and food processing; Unrelated goods and services.

62

Table 16. Best performers in the biopharma global R&D strategic groups

Industr

y group Company name Country City

Last

avail.

year

Revenue

th EUR Employees

11 ILLUMINA INC USA SAN DIEGO 2014 1 533 118 3 700

11 QIAGEN NV Netherlands VENLO 2013 947 176 4 015

11 GENUS PLC United Kingdom

BASINGSTOKE 2014 464 228 2 314

11 INCYTE CORPORATION USA WILMINGTON 2014 421 296 588

11 MUNDIPHARMA RESEARCH LTD United

Kingdom CAMBRIDGE 2013 124 173 271

12 GILEAD SCIENCES INC USA FOSTER CITY 2014 20 500 782 7 000

12 AMGEN INCORPORATED USA THOUSAND

OAKS 2014 16 524 998 17 900

12 ABBVIE INC. USA NORTH

CHICAGO 2014 16 440 161 26 000

12 ELI LILLY AND COMPANY USA INDIANAPOLIS 2014 16 156 494 39 135

12 BIOGEN INC USA CAMBRIDGE 2014 7 992 195 7550

13 SHIRE PLC United

Kingdom ST. HELIER 2014 4 967 466 5016

13 PAREXEL INTERNATIONAL CORP USA WALTHAM 2014 1 659 351 15 560

13 JAZZ PHARMACEUTICALS PLC Ireland DUBLIN 2014 9 660 445 870

13 CK LIFE SCIENCES

INTERNATIONAL (HOLDINGS) INC

Cayman

Islands

GEORGE

TOWN 2014 531 440 1 675

13 SIMCERE PHARMACEUTICAL

GROUP

Cayman

Islands 2012 255 878 4 046

14 WEST PHARMACEUTICAL

SERVICES, INC. USA EXTON 2014 1 170 744 7 000

14 NEUROCRINE BIOSCIENCES INC USA SAN DIEGO 2014 0 94

Source: Bespoke global biopharma MNE derivative dataset (2015). Note: Industry groups 11 (R&D); 12 (R&D and manufacturing); 13 (R&D and Services); 14 (Clinical research and human health activities).

Figure 19. Ownership ties in the biopharma global value chain (B)

Source: Bespoke global biopharma MNE output dataset (2015). Note: Links between parents and subsidiaries; all ownership ties based on 23280 firms with activity data

(Table 10); Parents in the centre of the diagram control subsidiaries across the entire GVC, while parents at the periphery have more specialised portfolio.

63

Table 17. Structure of the bespoke Bulgarian biopharma datasets: (A) output dataset; (B) derivative dataset

(A) Output Dataset – parents and their subsidiaries

Parents 6 266

Subsidiaries 2 454

Total 8 720

Removed all duplicate cases by BvD ID number 1 142

Removed foreign firms 79

Removed firms with no activity data 343

Final output dataset – parents and their subsidiaries 7 156

(B) Derivative dataset

Initial Derivative Data set 7 156

Removed firms with generic services codes but no biopharma codes (4 NACE codes in brown)

145

Removed firms with generic R&D codes but no biopharma codes (5 NACE codes in blue) 5 018

Removed firms that do not have any of the selected 20 codes (Table 17) 698

Final Cases of parents and subsidiaries 1 295

of which parents 1 058

subsidiaries 237

Source: Bespoke Bulgarian biopharma dataset (2015).

Table 18. Distribution of firms by industry in the Bulgarian biopharma dataset

NACE Codes Core biopharma Services R&D Total

Parent Subsid

2014 - Manufacture of other organic basic chemicals 106 106

2041 - Manufacture of soap and detergents, cleaning and polishing preparations

181 181

2042 - Manufacture of perfumes and toilet preparations 173 173

2053 - Manufacture of essential oils 4 4

2110 - Manufacture of basic pharmaceutical products 26 26

2120 - Manufacture of pharmaceutical preparations 77 77

2660 - Manufacture of irradiation, electro-medical and electro-therapeutic equipment

218 218

2670 - Manufacture of optical instruments and photographic equipment

40 40

3250 - Manufacture of medical and dental instruments and supplies

86 86

4646 - Wholesale of pharmaceutical goods 82 82

7211 - Research and experimental development on

biotechnology 212 212

6420 - Activities of holding companies 3 3 10 16

6430 - Trusts, funds and similar financial entities 3 14 17

6499 - Other financial service activities, except insurance and pension funding n.e.c.

2 11 13

7022 - Business and other management consultancy activities 4 2 110 116

7120 - Technical testing and analysis 11 2 43 1 341 1 397

7219 - Other research and experimental development on

natural sciences and engineering 148 5 18 640 811

7220 - Research and experimental development on social

sciences and humanities 8 3 5 354 370

7490 - Other professional, scientific and technical activities

n.e.c. 7 13 3 100 123

8690 - Other human health activities 131 11 33 2 894 3 069

Source: Bespoke Bulgarian biopharma dataset (2015).

64

Table 19. Availability of activity data in the Bulgaria biopharma dataset

Number of codes Firms

1 642

2 435

3 150

4 53

5 12

6 1

7 2

Total 1 295

Source: Bespoke Bulgarian biopharma dataset (2015).

Table 20. Distribution of biopharma capabilities in Bulgaria by size of firms

Strategic Value Chain Groups (VCGs) Type of company

VL LA ME SM Total

11 - Biopharma R&D 0 2 10 160 172

12 - Biopharma R&D & Manufacturing 0 2 1 6 9

13 - Biopharma R&D & Services Diversified 0 2 11 28 41

14 - Clinical Research & Human Health Activities 1 4 30 96 131

21 - Bio-pharma Manufacturing 4 5 17 41 67

22 - Biopharma Manufacturing and Wholesale 2 1 5 1 9

23 - Perfumes and Cosmetics Manufacturing 11 28 102 124 265

24 - Biopharma Manufacturing Multi-diversified 0 6 2 5 13

25 - Chemical & Biopharma Manufacturing Diversified 3 7 18 91 119

26 - Medical Instruments, Dental & Electrotherapeutic

Manufacturing

5 8 13 138 164

27 - Manufactured Goods, Electronics and Instruments 0 0 2 0 2

31 - Specialised Biopharma Wholesale 40 0 0 0 40

33 - Biopharma & Cosmetics wholesale 7 0 0 0 7

41 - Holding, Financial & Administrative Head-Office Services 1 0 0 0 1

44 - Miscellaneous Services 0 1 0 0 1

51 - Agriculture, Food Processing & Drinks of Bio-products 1 0 0 0 1

54 - Other Miscellaneous Wholesale 0 0 1 0 1

Total 75 66 212 690 1 043

Source: Bespoke Bulgarian biopharma dataset (2015).

Table 21. Agglomerations of strategic groups in the Bulgarian biopharma value chain

Strategic Value Chain Groups Count %

Biopharma R&D 369 28%

Biopharma Manufacturing 93 7%

Biopharma Trade 76 6%

Perfumes & Cosmetics 266 21%

Chemicals Diversified 120 9%

Finance & Related Services 111 9%

Medical & Hospital (instruments equipment and supplies) 186 14%

Agriculture & Food Processing 16 1%

Unrelated Goods & Services 58 4%

Total 1 295 100%

Source: Bespoke Bulgarian biopharma dataset (2015).

65

Table 22. Distribution of biomedical and biopharma capabilities in the GSE

Distribution of Firms in Strategic Value Chain Groups in GSE Sub-regions

EEDA LDA SEEDA Total

Core VCGs

1.Bio-Pharma R&D 115 132 140 387

2.Drug Development & Support 82 140 154 376

3.Bio-Pharma Manufacturing 70 105 111 286

4.Integrated Pharma & Biotech 17 36 62 115

5.Trade Pharma & Bio Products 87 352 172 611

6.Bio Pharma Support 92 212 192 496

7.Diagnostics 44 91 105 240

8.Medical Devices 192 188 339 719

9.Telecare 3 17 43 63

10.Trade Medical & Optical Products

174 338 301 813

16.Health Products & Cosmetics 96 356 225 677

Total 972 1 967 1 844 4 783

Periphery VCGs

11.Technical Support 49 98 118 265

12.Medical Care 953 2 183 1 766 4 902

13.Dental Practice 92 216 170 478

14.Social Care 629 1 616 963 3 208

15.Medical Care Support Services

154 621 379 1 154

17.Fitness & Wellbeing 47 136 126 309

18.Pharmacies & Drug Stores 158 782 221 1 161

Total 2 082 5 652 3 743 11 477

Total 3 054 7 619 5 587 16 260

Source: Bespoke GSE biomedical and biopharma dataset (2008). Note: Distribution of firms by sub-regions and by VCGs in the output and the derivative dataset.

Table 23. Size of biomedical and biopharma VCGs in the GSE cluster

Strategic Value Chain Groups Firms

Employees Last Year

Operating Revenue / Turnover Last Year (in thousands GBP)

Count Sum Mean Sum Mean

1.Bio-Pharma R&D 387 8 911 61 5 167 390 31 897

2.Drug Development Support 376 29 934 249 2 924 008 15 805

3.Bio-Pharma Manufacturing 286 24 470 275 4 595 224 41 775

4.Integrated Pharma & Biotech 115 215 717 2 876 51 063 865 719 209

5.Trade Pharma & Bio Products 611 18 450 148 10 971 274 54 046

6.Bio-Pharma Support 496 5 439 71 1 034 648 3 749

7.Diagnostics 240 18 239 253 1 851 291 14 132

8.Medical Devices 719 75 704 362 8 750 634 30 490

9.Telecare 63 3 157 105 673 203 19 234

10.Trade Med & Optical Products 813 17 595 139 3 175 035 8 795

16.Health Prod & Cosmetics 677 55 745 680 9 568 695 33 340

Total 4 783 473 361 411 99 775 267 47 332

Source: Bespoke GSE biomedical and biopharma dataset (2008). Note: Size measured by number of firms, employment and revenue; data for 2007 provided by firms in their tax returns; derivative dataset.

66

Table 24. Definitions of strategic value chain groups in the GSE cluster

Value Chain

Groups Definition Type

1 Bio-Pharma R&D Research and development resulting in a pharmaceutical or biotechnology product

Core

2 Drug Development Support

Research supplies, contract research, platform technology,

medical-related research, nano-biotech, clinical trials, supportive research foundations, other related engineering R&D

Core

3 Bio-Pharma Manufacturing

Companies with primary activity being the manufacture of biopharmaceutical products

Core

4 Integrated Pharma and Biotech

Pharmaceutical R&D Companies which also manufacture and market medicines developed in house

Core

5

Trade Pharmaceutical Products

Companies providing pharmaceutical products, including wholesalers, retailers and marketers

Core

6 Bio-Pharma Business Support Services

Consulting, market research, finance, patents and regulatory for health technology sector, incubators, recruitment, leasing ie. NO products on sale

Core

7 Diagnostics Diagnostic kits, equipment, reagents, imaging technologies, development, manufacturing, marketing

Core

8 Medical Devices Development, manufacture, sales of medical devices including laboratory equipment, optical and drug delivery devices

Core

9 Telecare Companies engaged in assistive technology Core

10 Trade Medical and Optical Products

Companies selling medical and optical products and equipment, including wholesalers and retailers

Core

11 Technical Support and Equipment

Installation, maintenance of medical equipment, software solutions, specialised IT, sale of equipment, data management

Peripheral

12 Medical Care Companies providing medical care, including medical clinics and hospitals, ambulance services, eye care, osteopaths, chiropractors

Peripheral

13 Dental Practice Companies providing dental care and services Peripheral

14 Social Care Counselling, care homes, hostels Peripheral

15

Medical Care Business Support Services

Consultancy, management, external supportive services for primary and secondary care, recruitment, transport

Peripheral

16 Health Products and Cosmetics

Companies developing, manufacturing and providing cosmetics and health products, and cosmetic services.

Core

17 Fitness and Wellbeing

Companies providing fitness, wellness and lifestyle services including Pilates, gym, yoga

Peripheral

18 Pharmacies and Drug Stores

Drugs and Druggists Peripheral

Source: Bespoke GSE biomedical and biopharma dataset (2008). Note: Definitions are based on the outcome from categorisation of the bespoke GSE biomedical and biopharma output dataset.

67

Table 25. Distributions of Operating Revenue / Turnover (th GBP) in Sub-regions in the GSE cluster

Operating Revenue in Amadeus Sub-regions

In Core Value Chain Groups Total in Sub-Region

Sum % Mean Sum % Mean

EEDA

Cambridge - Peterborough

1 834 888 2 12 398 1 970 389 1 9 706

Chelmsford - Colchester - Southend-on-Sea

1 882 728 2 28 100 2 639 196 2 10 035

Ipswich 624 617 1 48 047 644 915 0 14 331

Luton 580 840 1 30 571 1 245 889 1 32 787

Bedford 433 118 0 30 937 669 316 1 27 888

Norwich 117 420 0 5 591 351 012 0 5 572

St. Albans - Hemel Hempstead

2 102 315 2 28 031 2 515 232 2 18 770

Stevenage 1 057 417 1 25 177 1 359 064 1 14 157

Total 8 633 343 9 21 637 11 395 013 9 13 158

LDA

Greater London North 1 093 912 1 12 155 1 365 470 1 4 391

Greater London South 37 591 266 38 250 608 41 482 405 31 89 595

Inner London 26 411 086 26 41 527 48 195 404 36 25 870

Total 65 096 264 65 74 311 91 043 279 69 34 525

SEEDA

Milton Keynes 1 551 969 2 19 645 1 915 842 1 11 270

Brighton 418 220 0 6 337 476 031 0 3 071

Canterbury - Medway- Tonbridge

4 727 727 5 48 242 5 884 964 4 19 551

Guildford 2 845 252 3 19 897 3 807 368 3 11 399

Oxford 1 196 068 1 12 205 1 546 161 1 10 040

Portsmouth 960 699 1 24 633 993 267 1 11 550

Reading - Slough 12 895 584 13 70 468 13 672 054 10 36 951

Redhill 1 155 366 1 14 442 1 265 990 1 7 536

Southampton 294 775 0 6 272 372 743 0 4 096

Total 26 045 660 26 31 267 29 934 420 23 16 367

Total 99 775 267 100 47 332 132 372 712 100 24 826

Source: Bespoke GSE biomedical and biopharma dataset (2008). Note: Definitions are based on the outcome from categorisation of the bespoke GSE biomedical and biopharma output dataset.

68

Map 10. University collaborations in biomedical research across the GSE

Source: Bespoke GSE biomedical and biopharma dataset (2008).

69

List of abbreviations

COSME European programme for the Competitiveness of Enterprises and

Small and Medium-sized Enterprises

FDI Foreign Direct Investment

GTAP Global Trade Analysis Project

GVC Global value chain

ICT Information and Communication Technologies

ISIC International Standard Industrial Classification

JRC Joint Research Centre

KET Key Enabling Technology

MNE Multinational Enterprise

NACE European Classification of Economic Activities

NAICS North-Atlantic Industry Classification System

OECD Organisation for Economic Cooperation and Development

R&D Research and Development

S3 Smart Specialisation Strategy

SIC Standard Industrial Classification

SIGs Strategic Industry Groups

SME Small and Medium Enterprises

UNCTAD United Nations Conference on Trade and Development

VCG Value chain group

VCGs Value Chain Groups

WTO World Trade Organisation

Europe Direct is a service to help you find answers to your questions about the European Union

Free phone number (*): 00 800 6 7 8 9 10 11

(*) Certain mobile telephone operators do not allow access to 00 800 numbers or these calls may be billed.

A great deal of additional information on the European Union is available on the Internet.

It can be accessed through the Europa server http://europa.eu

How to obtain EU publications

Our publications are available from EU Bookshop (http://bookshop.europa.eu),

where you can place an order with the sales agent of your choice.

The Publications Office has a worldwide network of sales agents.

You can obtain their contact details by sending a fax to (352) 29 29-42758.

2

XX-N

A-x

xxxx-E

N-N

doi:10.2791/273290

ISBN 978-92-79-61507-8

LF-N

A-2

8085-E

N-N


Recommended