Global versus Local Call Global versus Local Call Admission Control in Admission Control in CDMA Cellular Networks CDMA Cellular Networks Robert Akl, D.Sc. Robert Akl, D.Sc. Asad Parvez Asad Parvez University of North University of North Texas Texas
Transcript
Global versus Local Call Admission Global versus Local Call Admission Control in CDMA Cellular NetworksControl in CDMA Cellular Networks
Robert Akl, D.Sc.Robert Akl, D.Sc.
Asad ParvezAsad Parvez
University of North TexasUniversity of North Texas
OutlineOutline
• Interference model impact on capacityInterference model impact on capacity• Global call admission controlGlobal call admission control• Local call admission controlLocal call admission control• Global vs localGlobal vs local• ConclusionsConclusions
Relative Average Inter-cell Relative Average Inter-cell Interference ModelInterference Model
dA
Cell j
Cell i
jr
ir
yxdAA
n
yxr
yxrji
j
j
Cji
mi
jmjI ,
/,
10,E
2
10
),( ),(
),(2
yxdAyxr
yxrI Cj m
i
mj
A
neji
j
js
jiI Relative average interference at cell i caused by nj users in cell j
A
B
Back
1111 1212 1313 …… …… 1M1M
2121 2222
3131 3232
…… ……
…… ……
M1M1 M2M2 MMMM
ijF ,
Interference Matrix
jn
MjinIijF
j
jji
cellin users ofnumber theis and
,,...,1,for /],[ where
Hence, the total relative average inter-cell interference experienced by cell i is
ijFnIM
j
ji ,1
1111 1212 1313 …… …… 1M1M
2121 2222
3131 3232
…… ……
…… ……
M1M1 M2M2 MMMM
12I
C
]2,1[12 FI
Relative Actual Inter-cell Relative Actual Inter-cell Interference ModelInterference Model
• Interference matrix F cannot be calculated in advance• Instead, a new interference matrix U is computed as follows• For a user k in cell j, the relative actual interference offered by this user to cell i is
m
i
jsk r
rejiU
2
jiUikji
jn
k
M
j
I
for ,11
• Hence, the total relative actual inter-cell interference at cell i caused by every user in the network is
D
E
k users in cell j
Actual Interference Matrix Actual Interference Matrix UU
•Example: for a new call in cell 2, compute row matrix U[2,i] for i = 1,…,M using equation D
]2M ...... 23 22 21[2 iU
• Update 2nd row of interference matrix U by adding the above row matrix to it.
1111 1212 1313 …… …… 1M1M
2121 2222
3131 3232
…… ……
…… ……
M1M1 M2M2 MMMM
iUijU 2],[
CapacityCapacity
• The capacity of a CDMA network is determined by maintaining a lower bound on the bit energy to interference density ratio, given by
Mi
NWInRE
E
I
E
iib
b
i
b
,...,1for
/1 00
W = Spread signal bandwidth
R = bits/sec (information rate)
α = voice activity factor
ni = users in cell i
N0 = background noise spectral
density
F
,...,1for
1/
11/
0
Mi
cNE
RWIn eff
bii
• Let τ be that threshold above which the bit error rate must be maintained, then by rewriting Eq. F
G
Back
Global Call Admission Control (CAC)Global Call Admission Control (CAC)
• A CAC algorithm decides whether or not a A CAC algorithm decides whether or not a network shall accept a call.network shall accept a call.
• Designing a CAC algorithm for CDMA is harder Designing a CAC algorithm for CDMA is harder than designing for TDMA or FDMA.than designing for TDMA or FDMA. Self interference.Self interference. Affects the entire network.Affects the entire network.
• A A globalglobal CAC algorithm takes the entire network CAC algorithm takes the entire network in account for every call making decision.in account for every call making decision.
Mobility ModelMobility Model
• Call arrival process is a Poisson process with rate: Call arrival process is a Poisson process with rate: λλ• Call dwell time is a random variable with exponential Call dwell time is a random variable with exponential
distribution having mean: distribution having mean: 1/μ1/μ• Probability that a call in cell Probability that a call in cell ii goes to cell goes to cell jj after after
completing its dwell time: completing its dwell time: qqijij• Probability that a call in progress in cell Probability that a call in progress in cell ii remains in cell remains in cell ii
after completing its dwell time: after completing its dwell time: qqiiii• Probability that a call will leave the network after Probability that a call will leave the network after
completing its dwell time: completing its dwell time: qqii
Mobility Model – Handoff CallsMobility Model – Handoff Calls
• Handoff calls (Handoff calls (vvjiji): calls that have moved from cell ): calls that have moved from cell
jj to an adjacent cell to an adjacent cell ii..
jAx
xjjijjijjji qBqB 11
jjijji qB 1
• Bj : Call blocking probability for cell j• Aj : Set of cells adjacent to cell i• ρj : Total offered traffic to cell j
j
jAx
jjxjjj
New arriving calls
Handoff calls
i
Global CAC AlgorithmGlobal CAC Algorithm
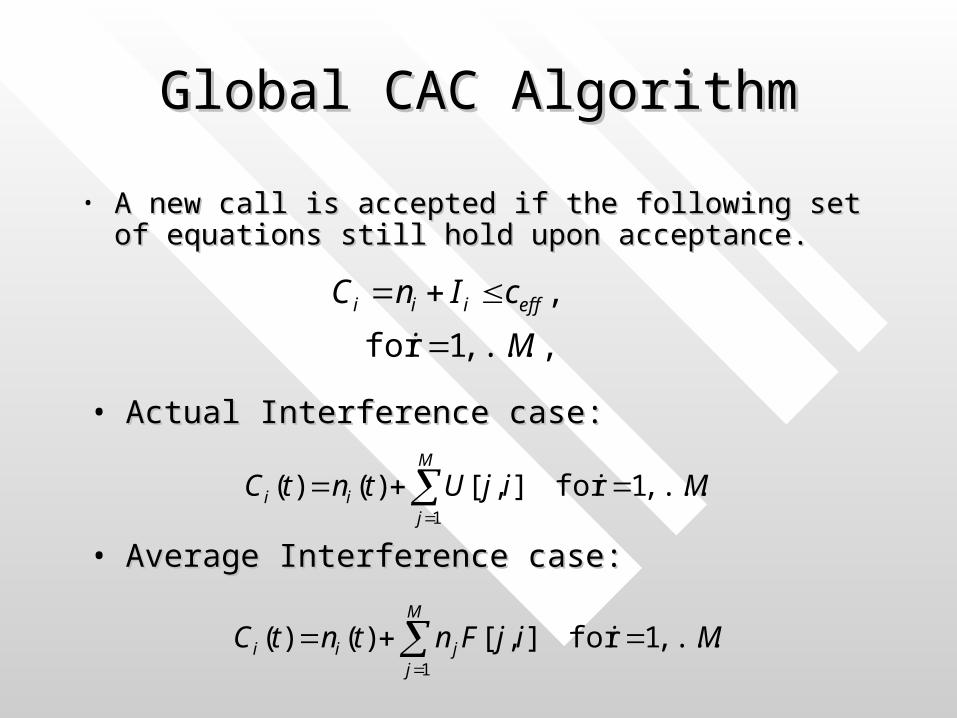
• A new call is accepted if the following set of equations A new call is accepted if the following set of equations still hold upon acceptance.still hold upon acceptance.
Mi
cInC effiii
,...,1for
,
• Actual Interference case:Actual Interference case:
MiijUtntCM
jii ,...,1for ],[)()(
1
• Average Interference case:Average Interference case:
MiijFntntCM
jjii ,...,1for ],[)()(
1
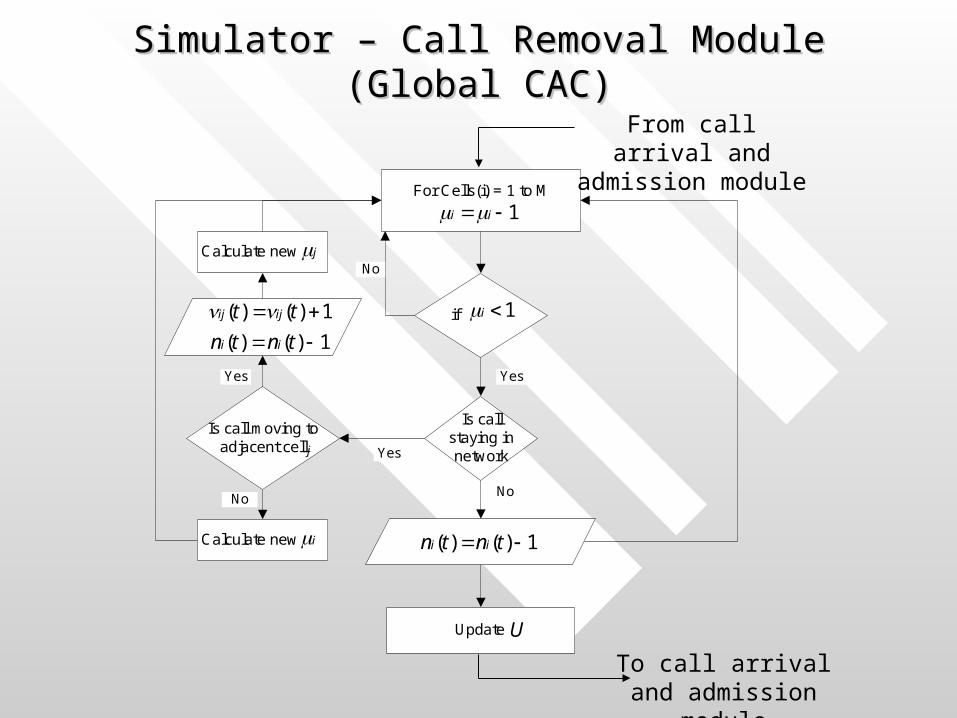
Simulator – Call Arrival and Admission Module Simulator – Call Arrival and Admission Module (Global CAC)(Global CAC)
For Cells(i) = 1 to M
No
Yes
For Cell(i) = 1 to M Calculate )(ti
)()()( ttt iii
for Cells(i)=1 to M Is ffi CeC )()()( tAttR iii
Calculate
1)()(
1)()(
tntn
tAtA
ii
ii
i
For new call arriving in cell i Calculate Calculate
• Network throughput:Network throughput: Number of calls per unit time that are Number of calls per unit time that are admitted and stay in the network till termination.admitted and stay in the network till termination.
• Blocking probability:Blocking probability: For a cell, it is the ratio of rejected For a cell, it is the ratio of rejected calls to total offered traffic to that cell.calls to total offered traffic to that cell.
T
t
M
iiiT ttA
TH
1 1
)()(1
T
t i
iiT t
tR
TB
1 )(
)(1)(
Local Call Admission ControlLocal Call Admission Control
• A A local local CAC algorithm considers only a single CAC algorithm considers only a single cell for making a call admittance decision even cell for making a call admittance decision even though its design may look at the network as a though its design may look at the network as a whole.whole.
• A simple approach: Find N, the maximum number A simple approach: Find N, the maximum number of users that are allowed in a cell, which is the of users that are allowed in a cell, which is the same for all the cells in the network.same for all the cells in the network.• Disadvantage: InefficientDisadvantage: Inefficient
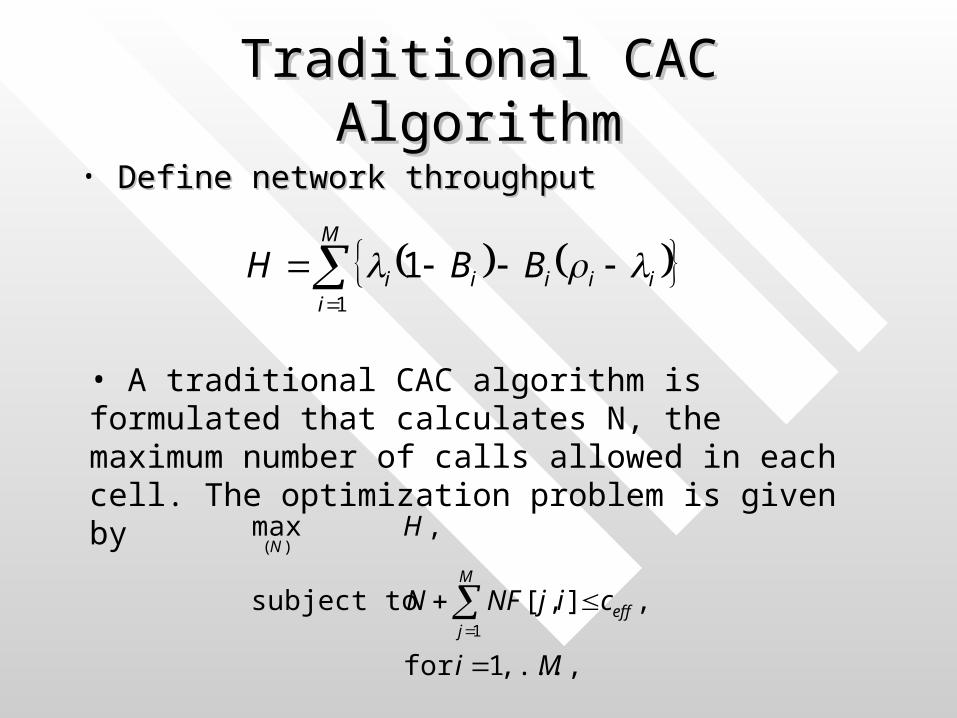
Traditional CAC AlgorithmTraditional CAC Algorithm
Mi
cijNFN
H
M
jeff
N
,...,1for
,],[ subject to
, max
1
)(
• A traditional CAC algorithm is formulated that calculates N, the maximum number of calls allowed in each cell. The optimization problem is given by
Our Optimized Local CAC Our Optimized Local CAC AlgorithmAlgorithm
Mi
cijFNN
H
M
jeffji
NN M
,...,1for
,],[ subject to
, max
1
),...,(
• Solve a constrained optimization problem that maximizes Solve a constrained optimization problem that maximizes the network throughput with signal-to-interference ratio the network throughput with signal-to-interference ratio constraints as lower bounds.constraints as lower bounds.
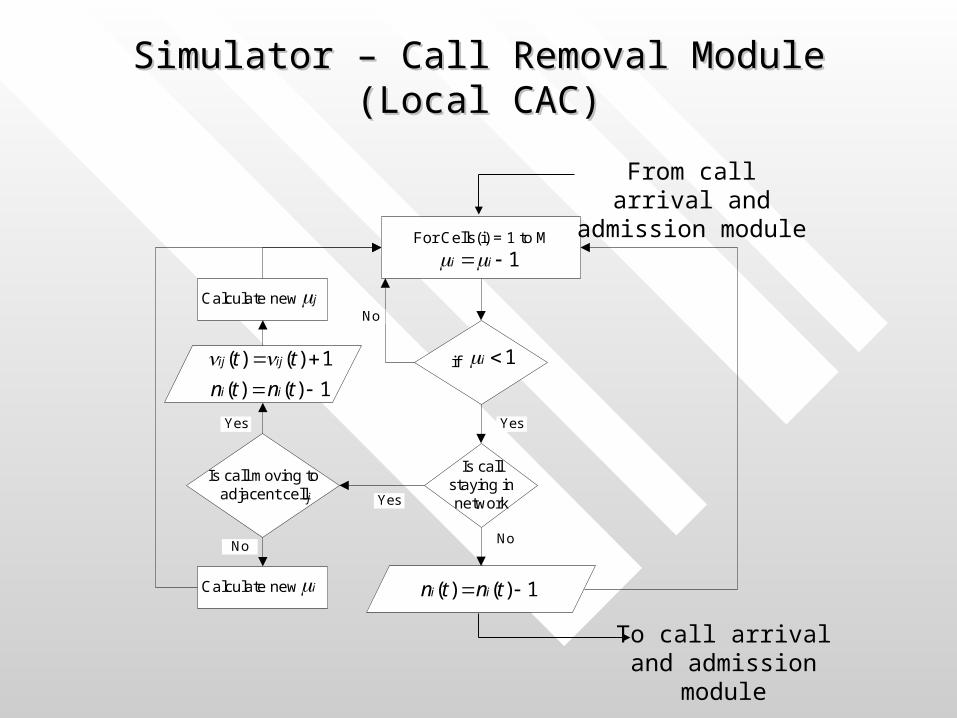
Simulator – Call Arrival and Admission Module Simulator – Call Arrival and Admission Module (Local CAC)(Local CAC)
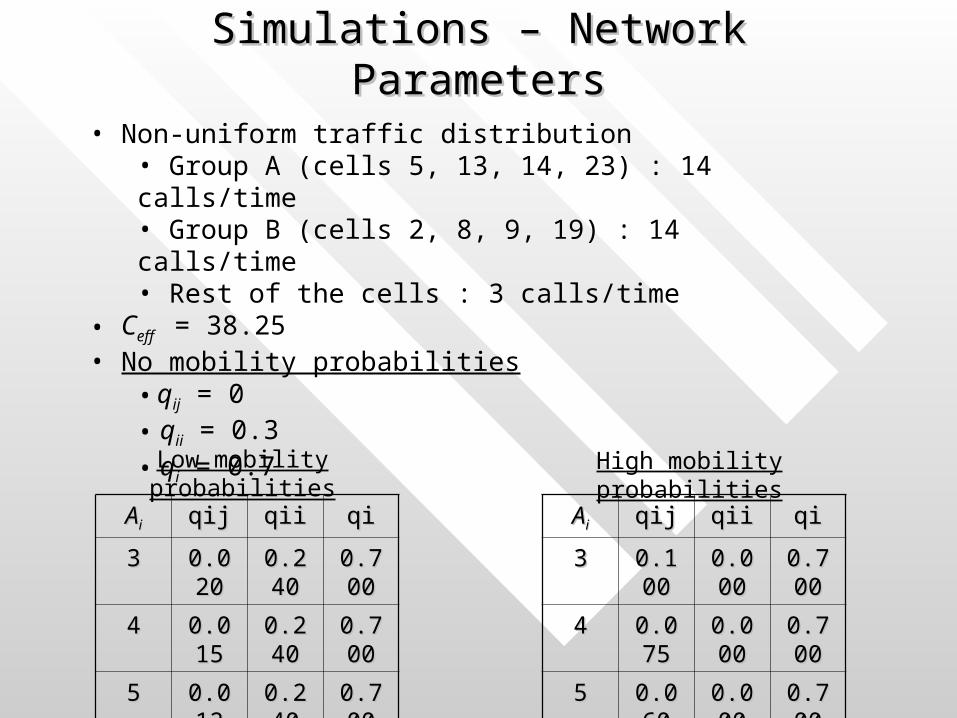
• Non-uniform traffic distribution• Group A (cells 5, 13, 14, 23) : 14 calls/time• Group B (cells 2, 8, 9, 19) : 14 calls/time• Rest of the cells : 3 calls/time
• Ceff = 38.25• No mobility probabilities
• qij = 0• qii = 0.3• qi = 0.7
AAii qijqij qiiqii qiqi
33 0.0200.020 0.2400.240 0.7000.700
44 0.0150.015 0.2400.240 0.7000.700
55 0.0120.012 0.2400.240 0.7000.700
66 0.0100.010 0.2400.240 0.7000.700
AAii qijqij qiiqii qiqi
33 0.1000.100 0.0000.000 0.7000.700
44 0.0750.075 0.0000.000 0.7000.700
55 0.0600.060 0.0000.000 0.7000.700
66 0.0500.050 0.0000.000 0.7000.700
Low mobility probabilities High mobility probabilities
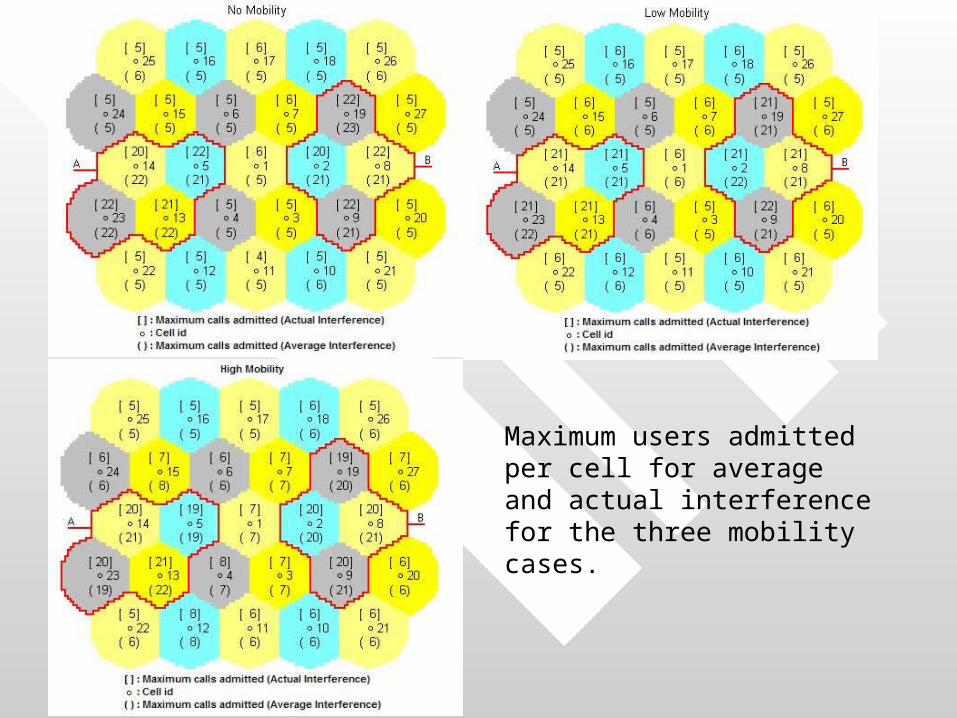
Maximum users admitted per cell for average and actual interference for the three mobility cases.
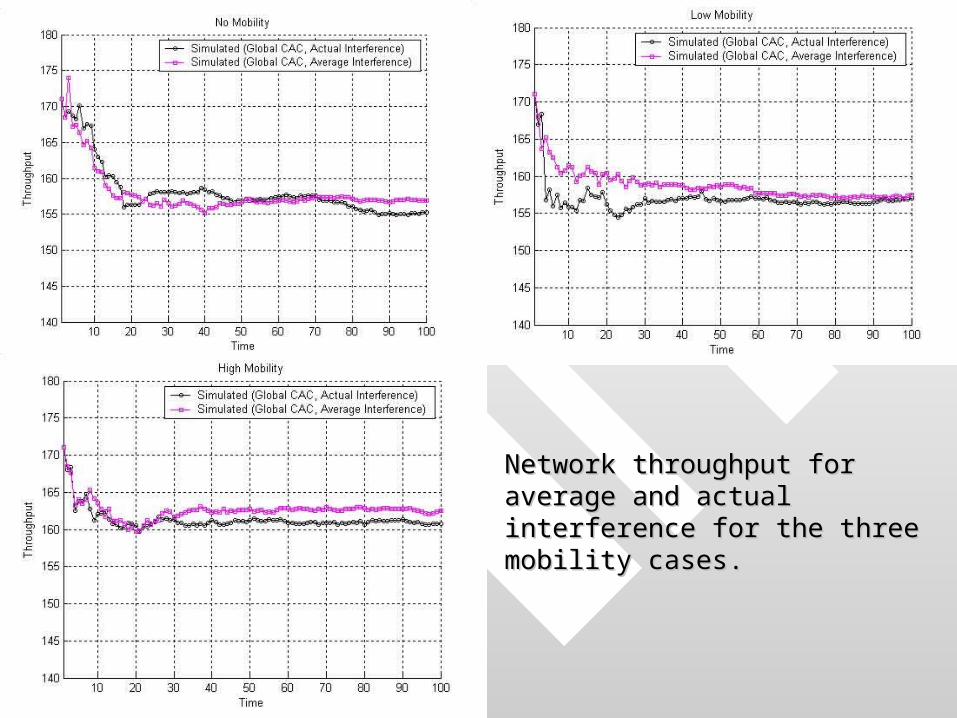
Network throughput for average and Network throughput for average and actual interference for the three actual interference for the three mobility cases.mobility cases.
Blocking probability for Blocking probability for average and actual interference average and actual interference for the three mobility cases.for the three mobility cases.
Results Global CACResults Global CAC
• Network throughput is always a little higher for average Network throughput is always a little higher for average interference in all the three mobility cases.interference in all the three mobility cases.
• Blocking probabilities are a little higher for actual interference Blocking probabilities are a little higher for actual interference for all three mobility cases. for all three mobility cases.
• Blocking probability is around 10% in all the three mobility Blocking probability is around 10% in all the three mobility cases for the cells with high demand.cases for the cells with high demand.
• Throughput is highest and blocking probability is lowest for the Throughput is highest and blocking probability is lowest for the high mobility case.high mobility case.
Erlang traffic and maximum number of Erlang traffic and maximum number of calls allowed to be admitted per cell for calls allowed to be admitted per cell for all three mobility cases.all three mobility cases.
High mobility has an equalizing effect on non-uniform traffic distribution.
Network throughput for our Network throughput for our optimized local CAC for all optimized local CAC for all three mobility cases.three mobility cases.
Theoretical and simulated network Theoretical and simulated network throughput for our optimized local throughput for our optimized local CAC and traditional CAC for all three CAC and traditional CAC for all three mobility cases.mobility cases.
Theoretical and simulated Theoretical and simulated blocking probability for our blocking probability for our optimized local CAC and optimized local CAC and traditional CAC for all three traditional CAC for all three mobility cases.mobility cases.
Results Local CACResults Local CAC
• Our optimized local CAC algorithm adapts in Our optimized local CAC algorithm adapts in response to the traffic demand due to users’ response to the traffic demand due to users’ mobility.mobility.
• Our local CAC network throughput is higher than Our local CAC network throughput is higher than traditional CAC throughput by nearly 13%.traditional CAC throughput by nearly 13%.
• Our local CAC algorithm strikes a good balance Our local CAC algorithm strikes a good balance between the blocking probabilities of the low and between the blocking probabilities of the low and high traffic cells.high traffic cells.
Network throughput for our Network throughput for our optimized local and global optimized local and global CAC algorithms.CAC algorithms.
Blocking probability for our Blocking probability for our optimized local and global optimized local and global CAC algorithms.CAC algorithms.
SummarySummary
• High mobility results in highest throughput High mobility results in highest throughput because it equalizes non-uniform traffic.because it equalizes non-uniform traffic.
• Our optimized local CAC algorithm performance Our optimized local CAC algorithm performance is better than traditional CAC algorithm.is better than traditional CAC algorithm.
• Our optimized local CAC algorithm performance Our optimized local CAC algorithm performance is just as good as a global for a given traffic is just as good as a global for a given traffic distribution.distribution.