29
Global View of Grain Markets James Dunn Ag Economist Pennsylvania State University
| Date post: | 01-Jan-2016 |
| Category: |
Documents |
| Upload: | salvador-macias |
| View: | 33 times |
| Download: | 0 times |

Global View of Grain Markets
James Dunn
Ag Economist
Pennsylvania State University

Issues for Ag Economy
• Bio-Fuel
• High crop prices
• Expensive inputs
• More debt
• Cheap dollar
• China and India
• Banking crisis
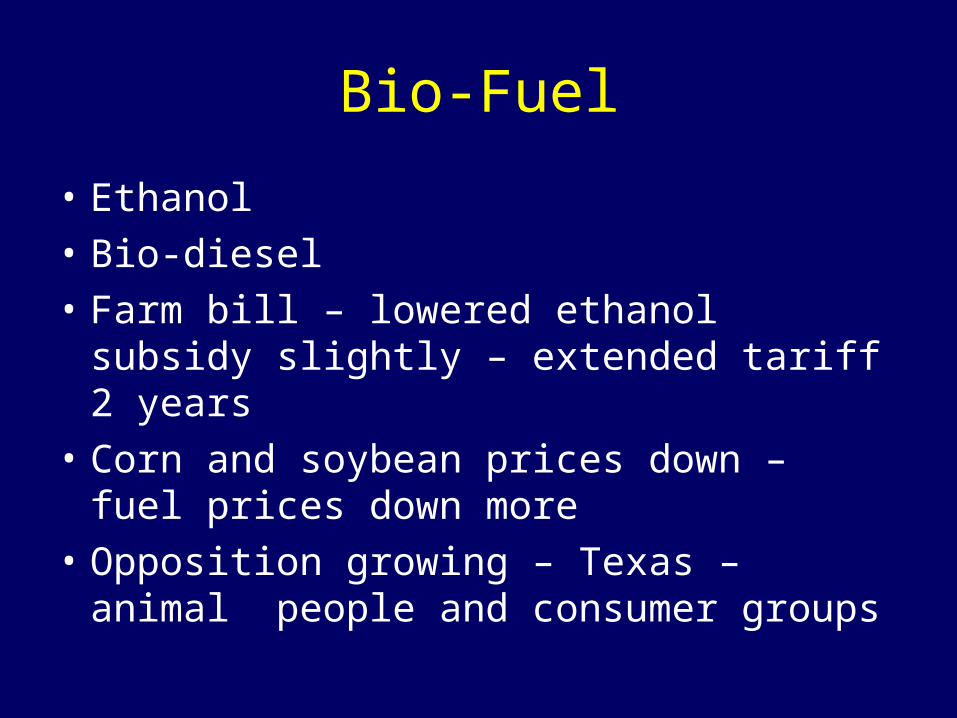
Bio-Fuel
• Ethanol
• Bio-diesel
• Farm bill – lowered ethanol subsidy slightly – extended tariff 2 years
• Corn and soybean prices down – fuel prices down more
• Opposition growing – Texas – animal people and consumer groups

7/3/2006 11/20/2006 4/9/2007 8/27/2007 1/14/2008 6/2/2008 10/20/080
5
10
15
20
25
30
35
40
vsunqavrpeix
Ethanol Company Stock PricesJuly 06- Dec 08
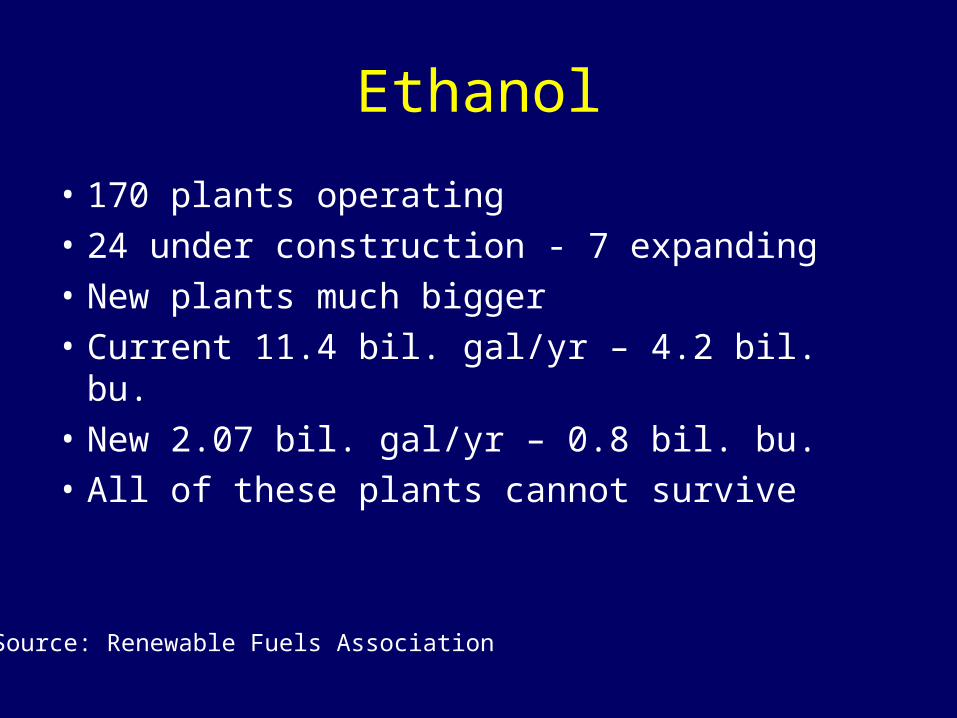
Ethanol
• 170 plants operating
• 24 under construction - 7 expanding
• New plants much bigger
• Current 11.4 bil. gal/yr – 4.2 bil. bu.
• New 2.07 bil. gal/yr – 0.8 bil. bu.
• All of these plants cannot survive
Source: Renewable Fuels Association

Corn Supply Year Beg stocks Production Supply
Bil. Bu.
2002/03 1.60 9.01 10.62
2003/04 1.09 10.11 11.21
2004/05 0.96 11.81 13.15
2005/06 2.11 11.03 13.15
2006/07 1.97 10.54 12.51
2007/08 1.30 13.07 14.40
2008/09 1.62 12.10 13.74

Corn Usagebil. bu
Crop year feed food exports total2002 5.56 2.34 1.59 9.492003 5.80 2.54 1.90 10.232004 6.16 2.69 1.81 10.662005 6.16 2.98 2.13 11.272006 5.60 3.49 2.12 11.212007 5.90 4.36 2.44 12.742008 5.35 4.99 1.70 12.04
Source: USDA
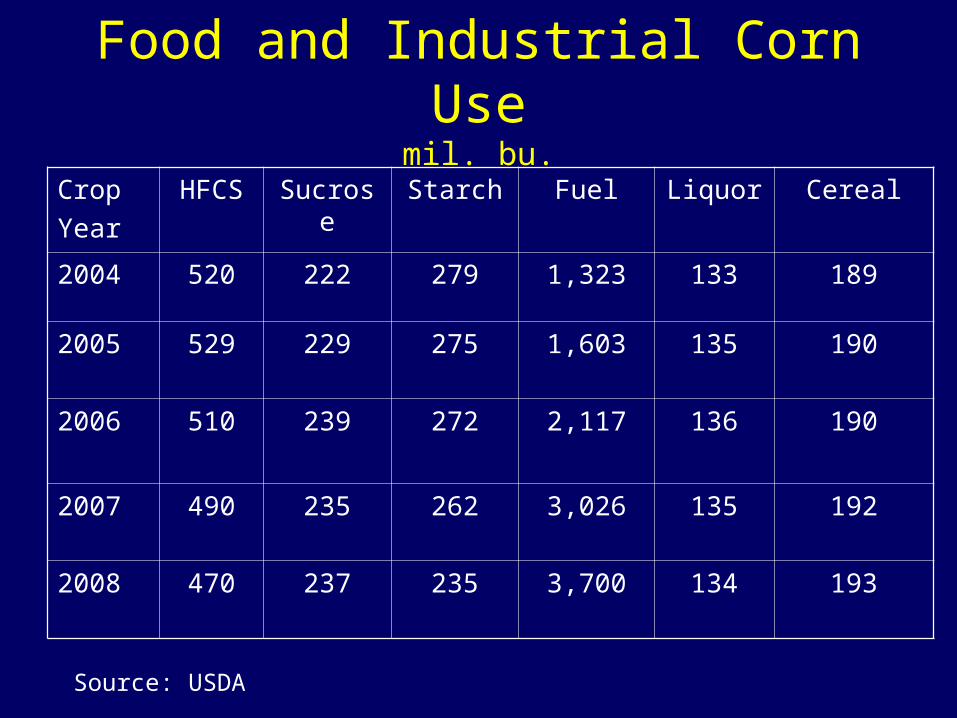
Food and Industrial Corn Usemil. bu.
Crop
Year
HFCS Sucrose Starch Fuel Liquor Cereal
2004 520 222 279 1,323 133 189
2005 529 229 275 1,603 135 190
2006 510 239 272 2,117 136 190
2007 490 235 262 3,026 135 192
2008 470 237 235 3,700 134 193
Source: USDA

Corn Usage
2002 2007 2008
Feed 57.8% 46.6% 44.4%
Food 12.9% 10.3% 10.7%
Exports 19.1% 19.1% 14.2%
Ethanol 10.3% 23.7% 30.7%

US66%
Argentina16%
Brazil10%
Other8%
World Corn Exports2007 Crop Year
Source: National Corn Growers

May 2009 Corn Price (CBOT)
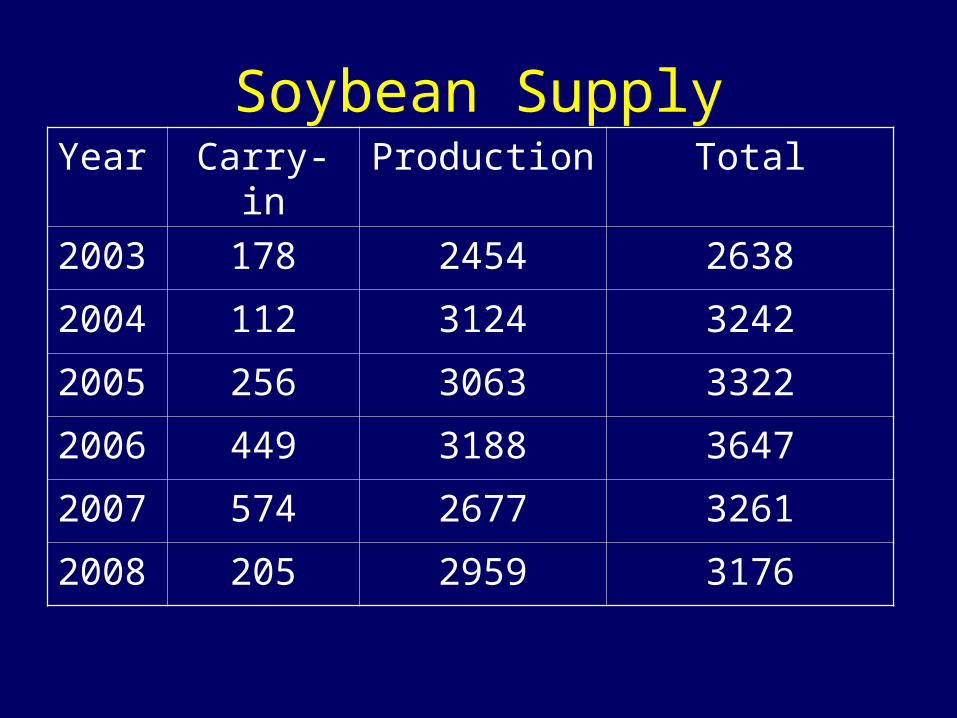
Soybean SupplyYear Carry-in Production Total
2003 178 2454 2638
2004 112 3124 3242
2005 256 3063 3322
2006 449 3188 3647
2007 574 2677 3261
2008 205 2959 3176

Soybean Usage
Year Crush Exports Seed Total
2003 1530 887 109 2525
2004 1696 1097 193 2986
2005 1739 940 194 2873
2006 1806 1118 148 3073
2007 1801 1160 93 3056
2008 1635 1210 166 3011

Soybean Carryout & Price
Year Carryout Price
2003 112 $7.34
2004 256 $5.74
2005 449 $5.66
2006 574 $6.43
2007 205 $10.40
2008 165 $9.65

Bio-Diesel
Crop Year
Methyl-Ester Production
2005/06 1,555
2006/07 2,761
2007/08 2,981
2008/09 2,200
• Rapid growth• Even data collection new• Production estimate
marked down considerably from earlier this year
• Unprofitable now• $2.50 worth of soybean
oil makes $1.50 worth of bio-diesel – plus expenses

March 2009 Bean Prices

Soybeans
• Very small Crop in 2007
• Very little carry-over
• More acreage in 2008
• 2008 crop will not cover usage
• Very low ending stocks in Sept. 2009
• Continuing high prices
• More acreage in 2009
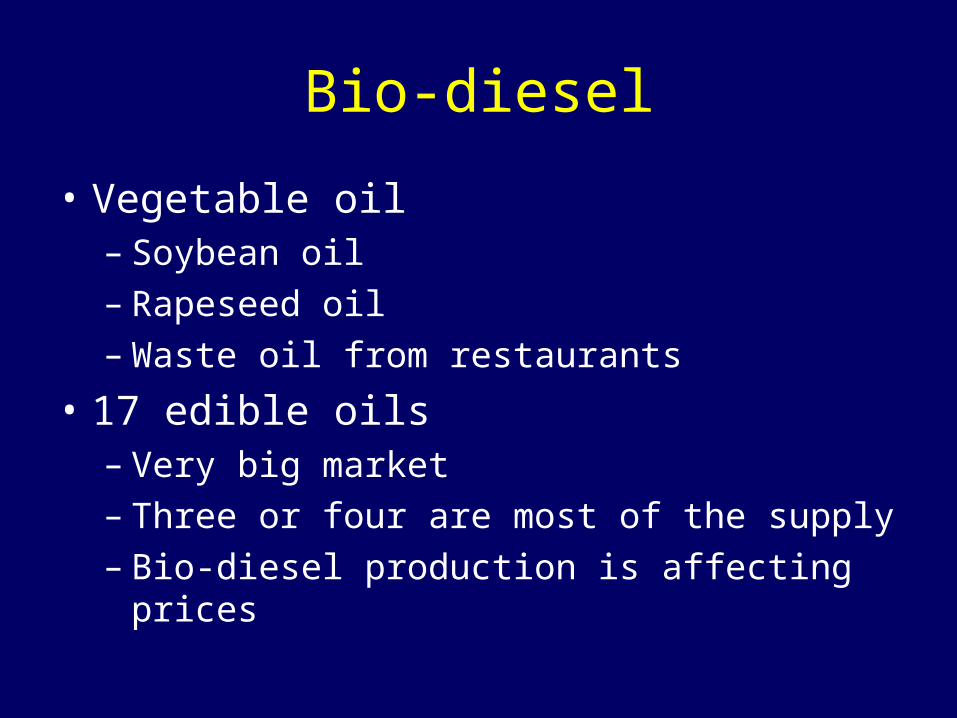
Bio-diesel
• Vegetable oil– Soybean oil– Rapeseed oil– Waste oil from restaurants
• 17 edible oils– Very big market– Three or four are most of the supply– Bio-diesel production is affecting prices
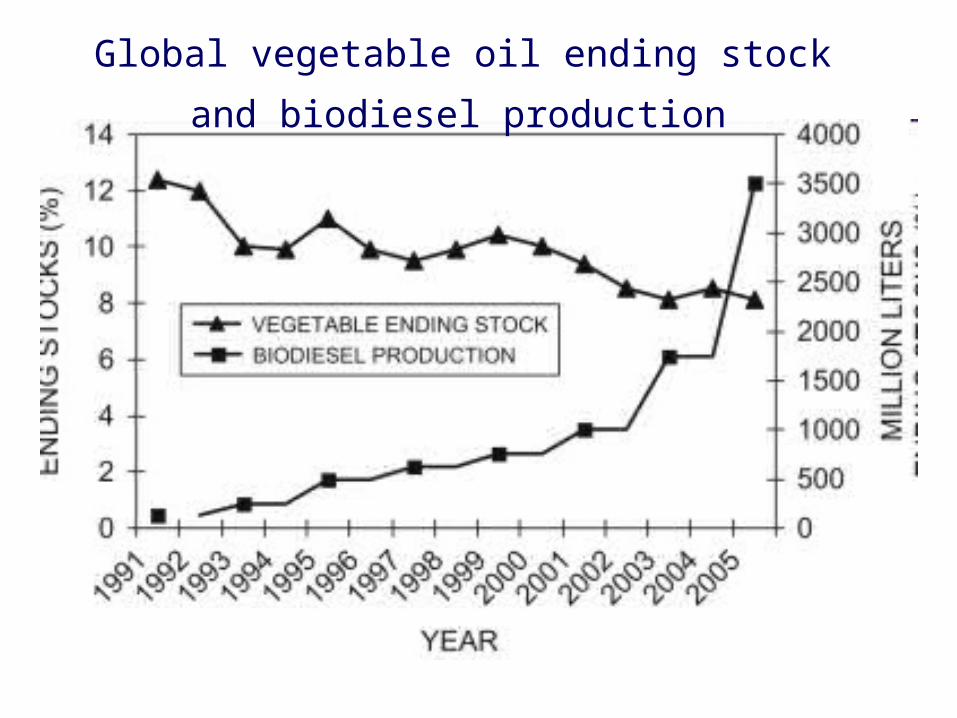
Global vegetable oil ending stock
and biodiesel production

Exports
• Almost all corn and beans through Gulf via Mississippi River
• Ships were scarce and fuel was high• Neither is the case now• Global trade is down• Container ships from Europe back to
China going around Africa instead of through Suez Canal – toll - $600,000 – plus pirates
The Rest of the World
• Global economic problems hitting some hard
• Credit and input costs hitting world farmers hard
• Food grains still expensive
• Strong dollar makes imports more expensive

Jan-06 Jun-06 Nov-06 Apr-07 Sep-07 Feb-08 Jul-08 Dec-080.5
0.75
1
1.25
1.5
1.75
CanadaAustraliaNew ZealandCRB Index
Commodity Prices and Exchange Rates Relative to US Dollar
2006-09January 2006=1


Will production keep up with world population growth?
• 6.6 bil. July 2007, 1.16% in growth in 2007• Africa – about 1 bil. – very poor, AIDS,
wars, bad government –Zimbabwe • Latin America 570 mil. – very poor, bad
government• Asia – 4 bil. – mostly poor, bad
government• Europe – 730 mil. and losing population• North America – 440 mil. slow growth
Agriculture
• Productivity growing faster than population• Productivity growth spreading worldwide• Coelli and Rao estimate world annual growth in
agricultural productivity from 1980 to 2000 to be “2.1% , with efficiency change (or catch-up) contributing 0.9% per year and technical change providing the other 1.2%. (p. 133)”
• Food should be able to keep up• Four Horsemen of the Apocalypse – kill
population off – disease, war, famine, pestilence

Can third world afford to pay?
• No, probably not• Fastest growth in poorest countries• Generally countries with worst
governments – Myanmar!• Doubling of food prices increases the
share of food in income from 10% to 10.6% in rich countries- from 50% to 61% in poor countries (Ron Trostle, Economic Research Service, USDA)

Planting
• Corn down 1%
• Soybeans up 1%
• Fertilizer prices – same as last year
• Chemical prices – up from last year
• Seed prices
Concluding Questions
• How much will ethanol & bio-diesel production fall?
• How will consumers adjust consumption in weak economy?
• Will we really keep cutting per capita meat consumption?
• How about the dollar?• Agriculture is pretty independent of
economy!


