36
Global warming and Extremes of Weather Prof. Richard Allan, Department of Meteorology University of Reading
Global warming and Extremes of Weather
Prof. Richard Allan, Department of MeteorologyUniversity of Reading
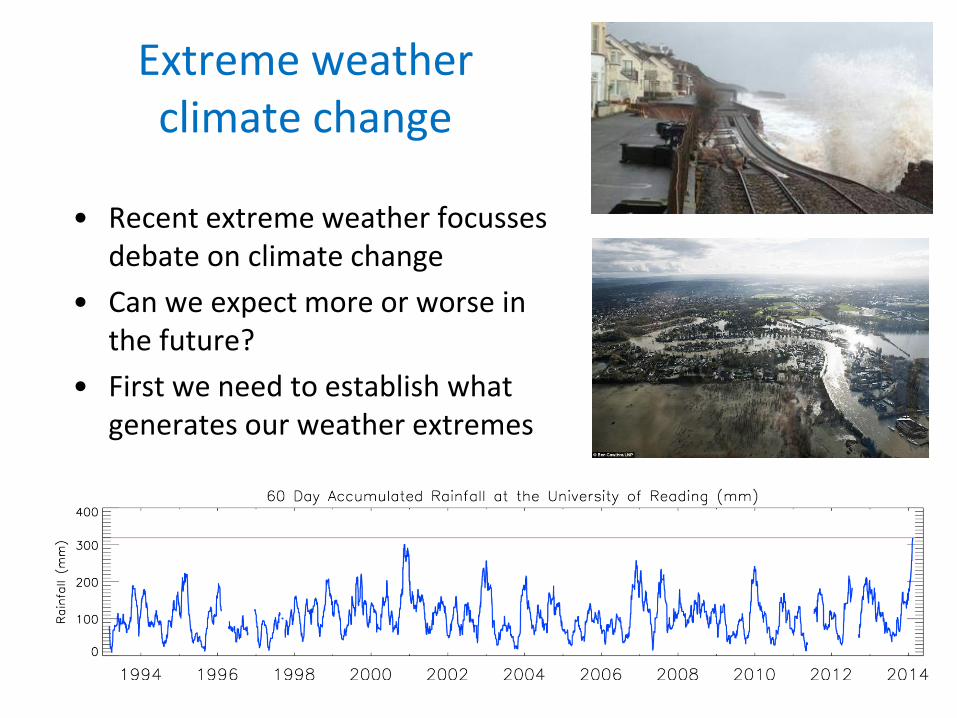
Extreme weather climate change
• Recent extreme weather focusses debate on climate change
• Can we expect more or worse in the future?
• First we need to establish what generates our weather extremes

1) What determines our climate?
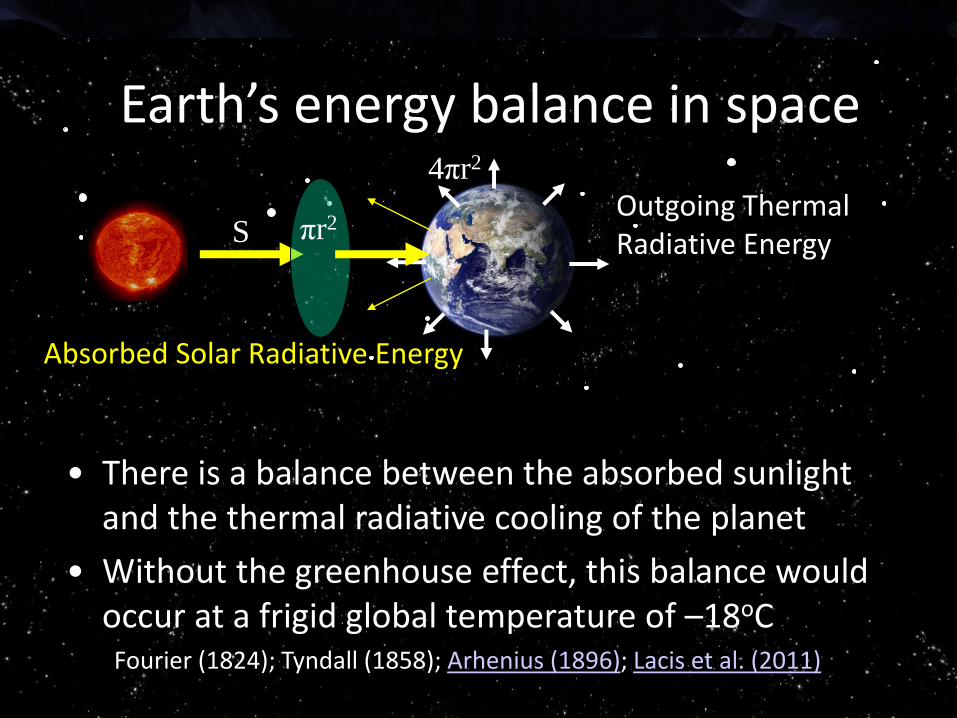
Absorbed Solar Radiative Energy
Outgoing Thermal Radiative Energyπr2S
Earth’s energy balance in space4πr2
• There is a balance between the absorbed sunlight and the thermal radiative cooling of the planet
• Without the greenhouse effect, this balance would occur at a frigid global temperature of –18oCFourier (1824); Tyndall (1858); Arhenius (1896); Lacis et al. (2011)
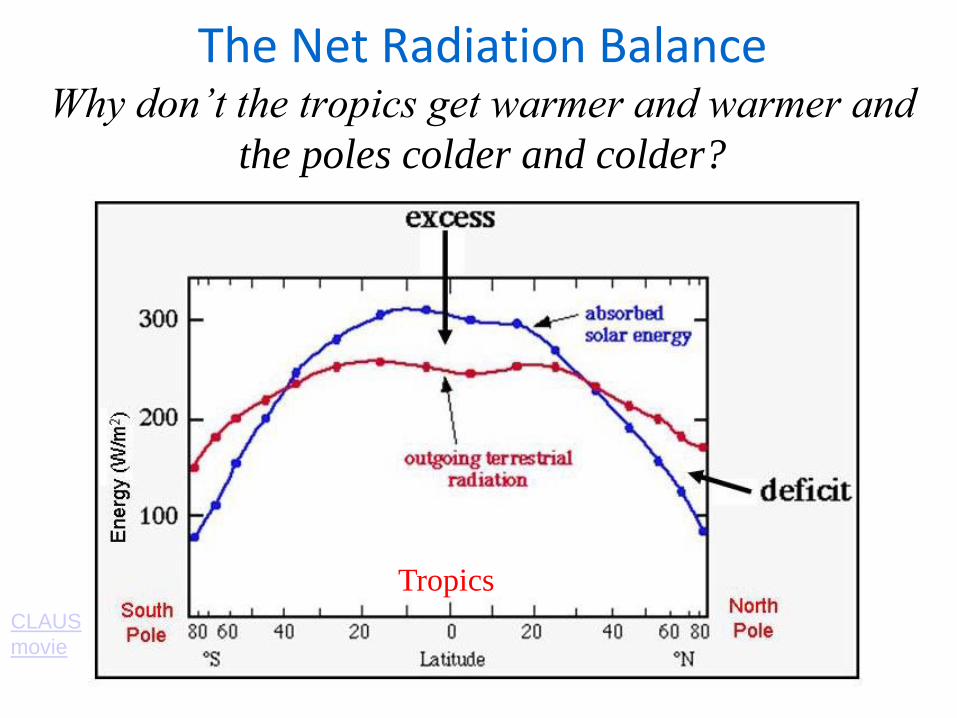
The Net Radiation BalanceWhy don’t the tropics get warmer and warmer and
the poles colder and colder?
Tropics
CLAUS
movie
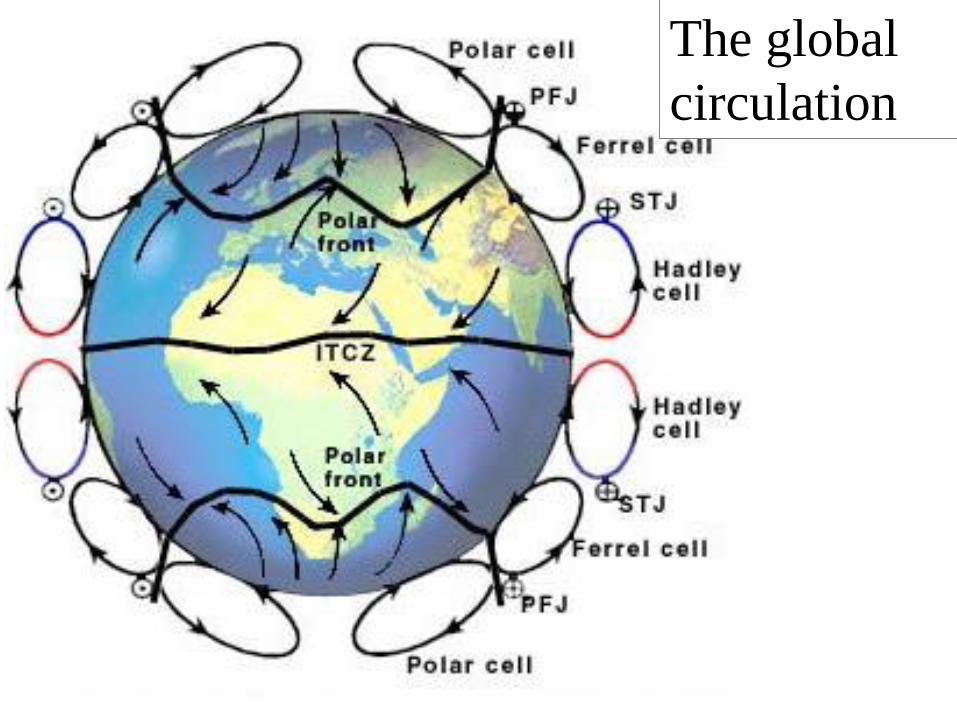
The global
circulation
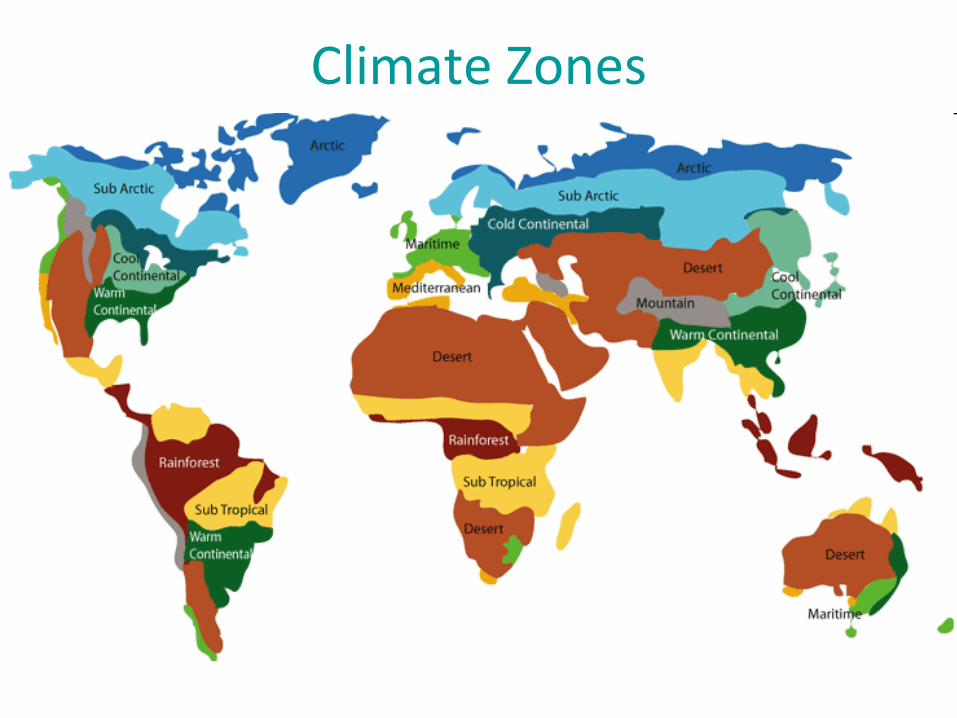
Climate Zones

The UK’s weather is sensitive to the circulation of the atmosphere and ocean
Mild ocean
currents and
atmospheric
winds
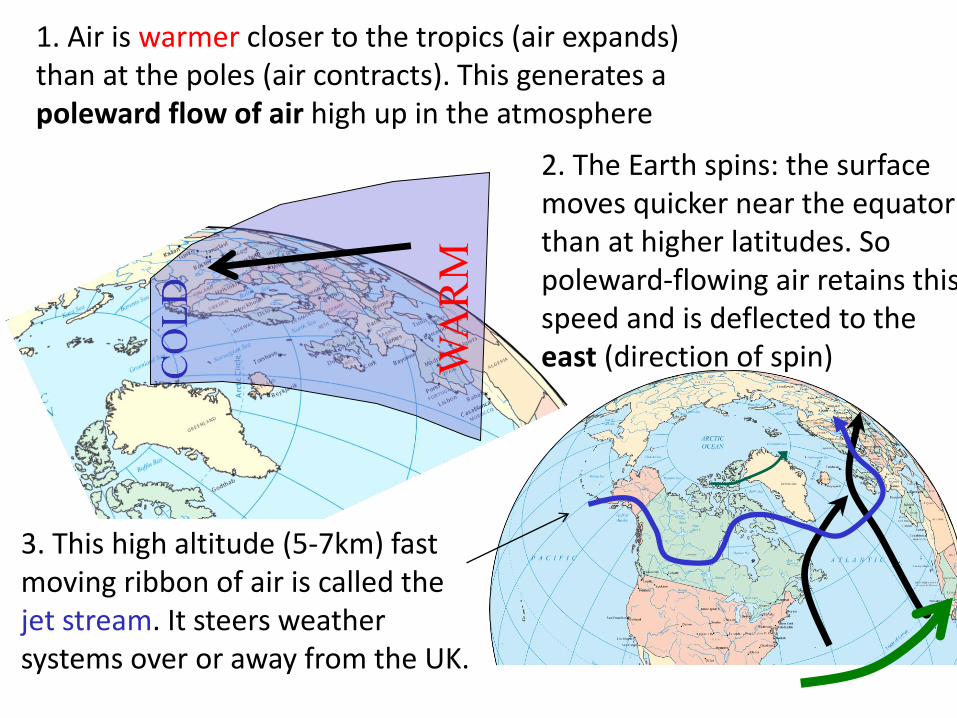
1. Air is warmer closer to the tropics (air expands) than at the poles (air contracts). This generates a poleward flow of air high up in the atmosphere
2. The Earth spins: the surface moves quicker near the equator than at higher latitudes. So poleward-flowing air retains this speed and is deflected to the east (direction of spin)
3. This high altitude (5-7km) fast moving ribbon of air is called the jet stream. It steers weather systems over or away from the UK.
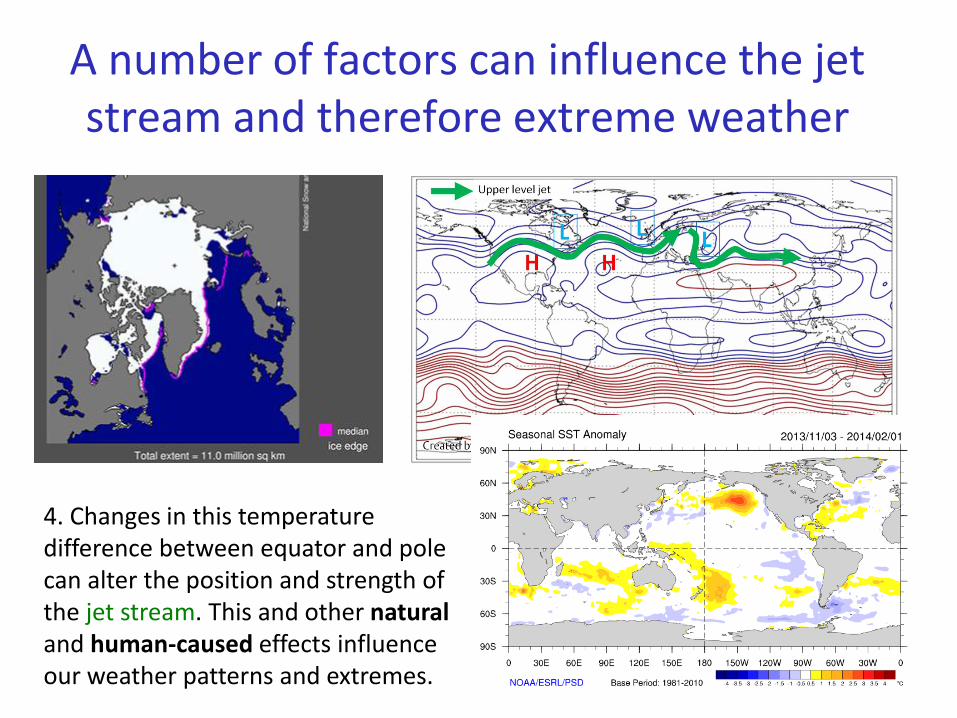
A number of factors can influence the jet stream and therefore extreme weather
4. Changes in this temperature difference between equator and pole can alter the position and strength of the jet stream. This and other naturaland human-caused effects influence our weather patterns and extremes.
2) Is our climate changing?

Top: Differences in
global average
surface temperature
compared to the
1961-1990 average
Middle: Changes in
the July-September
average summer
Arctic sea ice extent
Bottom: Changes in
global average sea
level compared with
1900-1905 average Source: IPCC WGI
(2013) SPM
40 years
Evidence for current climate
change“Warming of the climate
system is unequivocal, and since the 1950s,
many of the observed changes are
unprecedented over decades to millennia. The atmosphere and
ocean have warmed, the amounts of snow and
ice have diminished, sea level has risen, and the
concentrations of greenhouse gases have increased.” IPCC (2013)

3)What is currently causing global warming?

“Radiative forcing” of climate
• Increases in greenhouse gases
heat the planet by reducing how
easily Earth can cool to space
through infra-red emission
• Small pollutant aerosol particles
cool the planet by reflecting
sunlight
• If more energy is arriving than
leaving the planet, the planet
should heat up…
Currently energy is accumulating at rate
equivalent to 300 billion electric heaters
(1 kilo Watt) spread over the globe (link)

Carbon dioxide, methane
and nitrous oxide
Changes in greenhouse gases from ice core and modern data
IPCC (2007) Summary for Policy Makers Fig. SPM.1
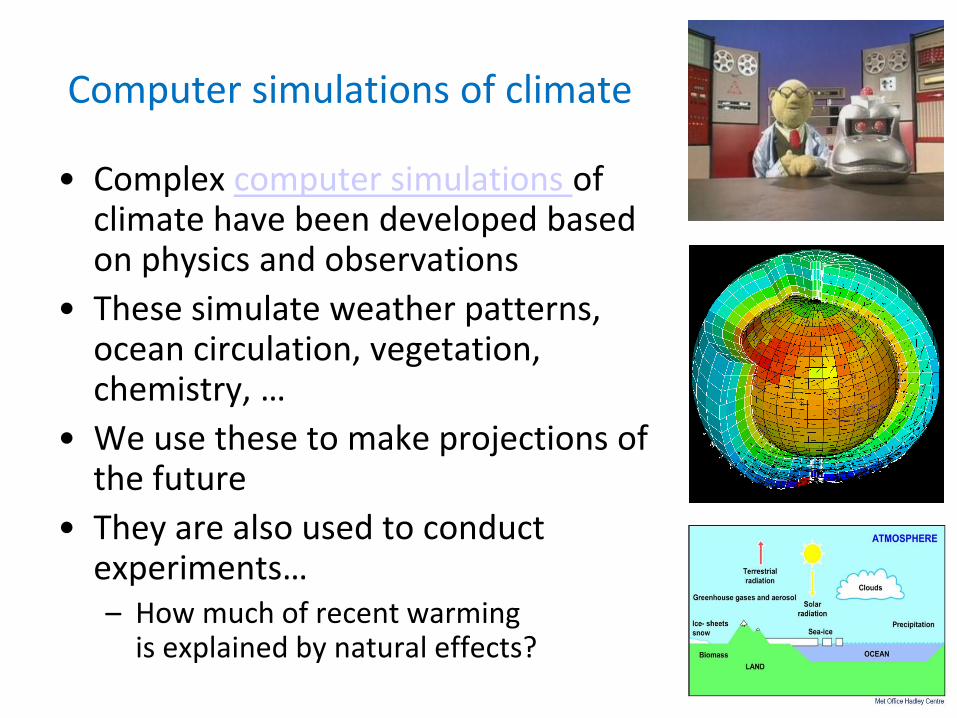
Computer simulations of climate
• Complex computer simulations of climate have been developed based on physics and observations
• These simulate weather patterns, ocean circulation, vegetation, chemistry, …
• We use these to make projections of the future
• They are also used to conduct experiments…– How much of recent warming
is explained by natural effects?

See IPCC FAQ 10.1and SPM Fig. 6
Observations
Simulations –natural factors
Recent warming cannot be simulated when only natural factors are included
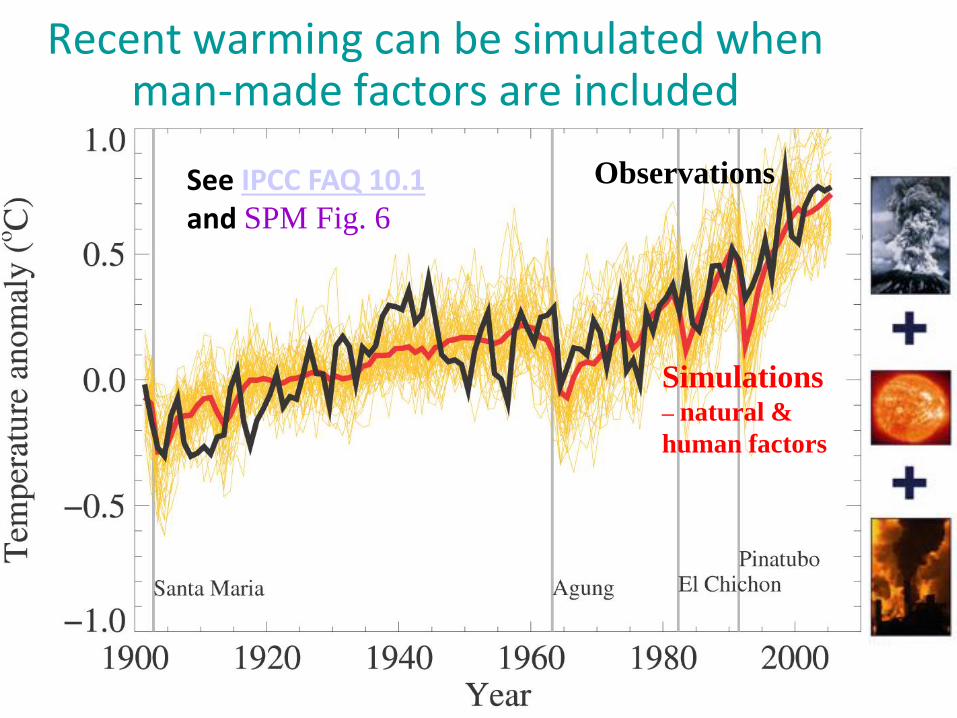
Recent warming can be simulated when man-made factors are included
See IPCC FAQ 10.1and SPM Fig. 6
Observations
Simulations – natural &
human factors
4) What are the predictions for the future?
1.0
0.8
0.6
0.4
0.2
0.0
(m)
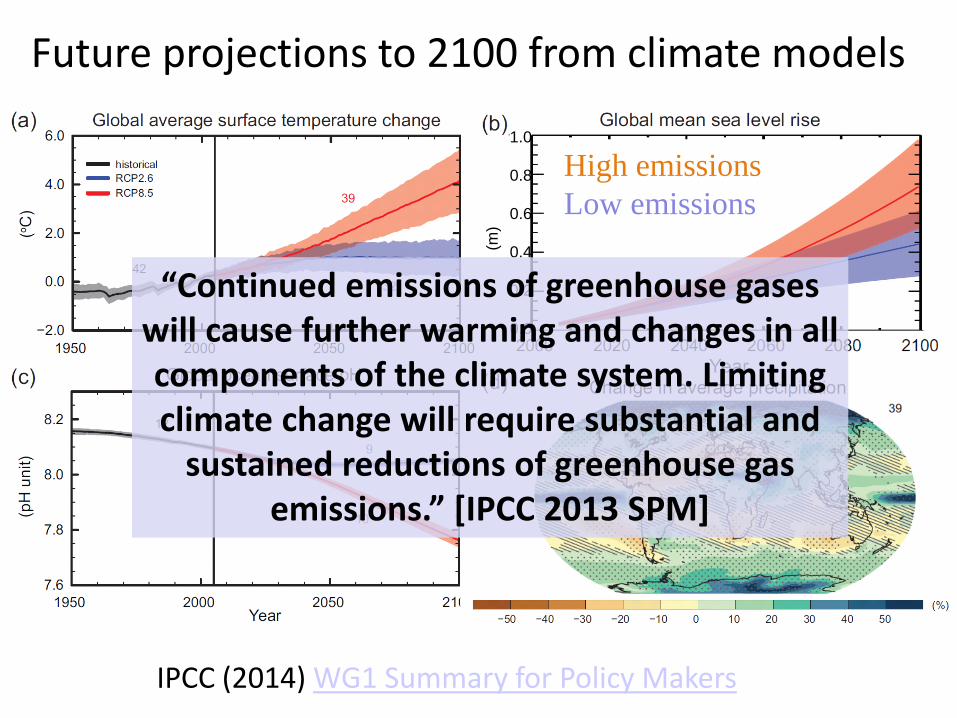
Future projections to 2100 from climate models
IPCC (2014) WG1 Summary for Policy Makers
High emissions
Low emissions
“Continued emissions of greenhouse gases will cause further warming and changes in all components of the climate system. Limiting climate change will require substantial and
sustained reductions of greenhouse gas emissions.” [IPCC 2013 SPM]

N Sea storm surges could be a metre higher by the 2080s Medium High Emissions with a 30 cm sea level rise
Return periods of extreme sea
levels in the Thames Estuary
(courtesy of Jason Lowe)

Changing extremes
• Characterising change in variability?
• Characterising change in frequency of extremes?
IPCC AR4 WG1 Box TS.5: Extreme Weather Events

“It is virtually certain that there will be more frequent hot and fewer cold temperature
extremes over most land areas on daily and seasonal timescales as global mean
temperatures increase. It is very likely that heat waves will occur with a higher frequency and duration. Occasional cold winter extremes
will continue to occur.” [IPCC 2013 SPM]
IPCC (2013)
TFE.9 Fig. 1
Extremes of temperature
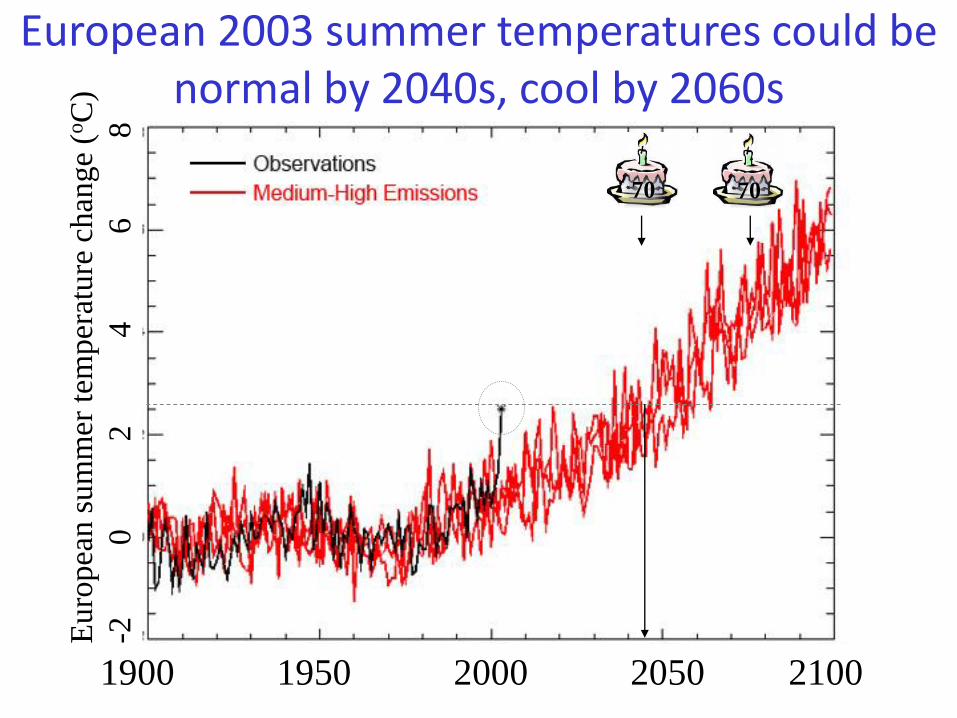
European 2003 summer temperatures could be normal by 2040s, cool by 2060s
1900 1950 2000 2050 2100
Euro
pea
n s
um
mer
tem
per
ature
chan
ge
(oC
)
-2 0
2
4
6
8
7070
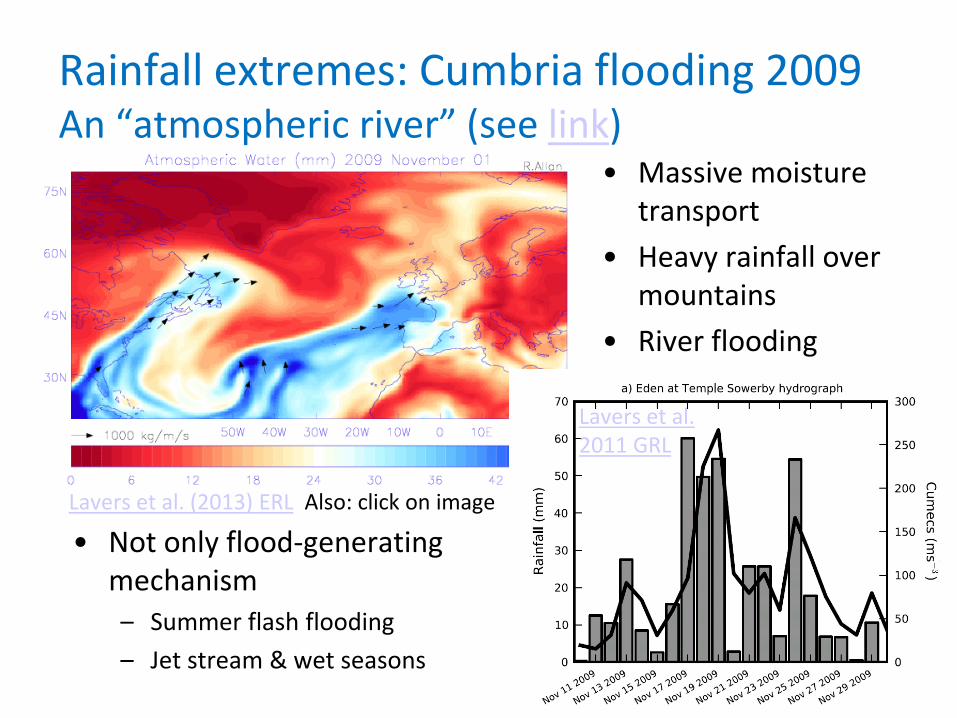
• Not only flood-generating mechanism– Summer flash flooding
– Jet stream & wet seasons
• Massive moisture transport
• Heavy rainfall over mountains
• River flooding
Rainfall extremes: Cumbria flooding 2009 An “atmospheric river” (see link)
Lavers et al. 2011 GRL
Lavers et al. (2013) ERL Also: click on image
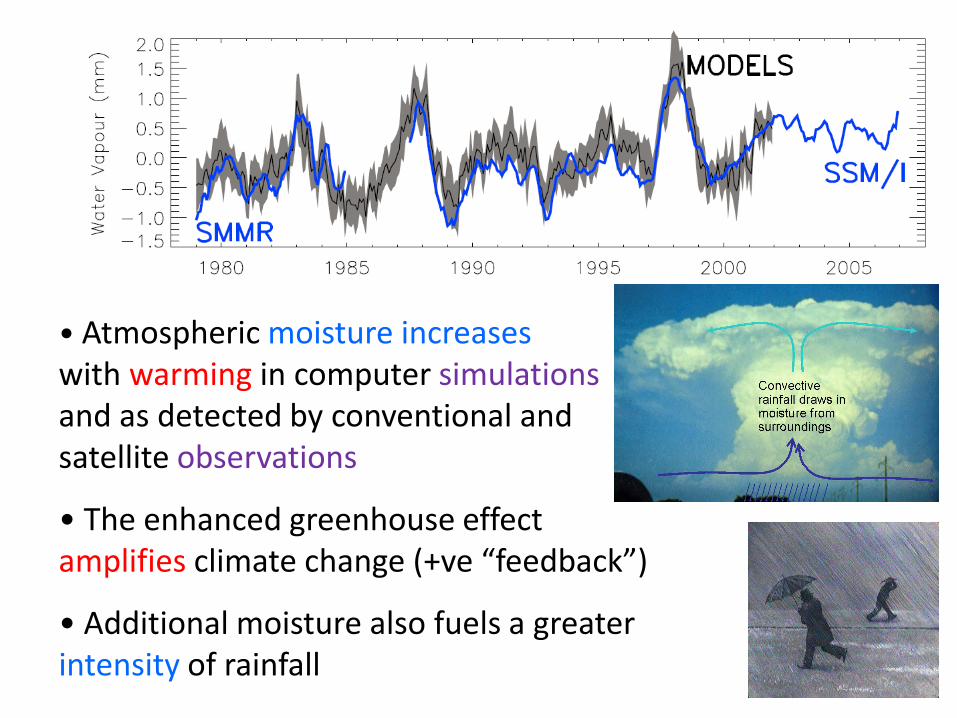
• Atmospheric moisture increases with warming in computer simulationsand as detected by conventional and satellite observations
• The enhanced greenhouse effect amplifies climate change (+ve “feedback”)
• Additional moisture also fuels a greater intensity of rainfall
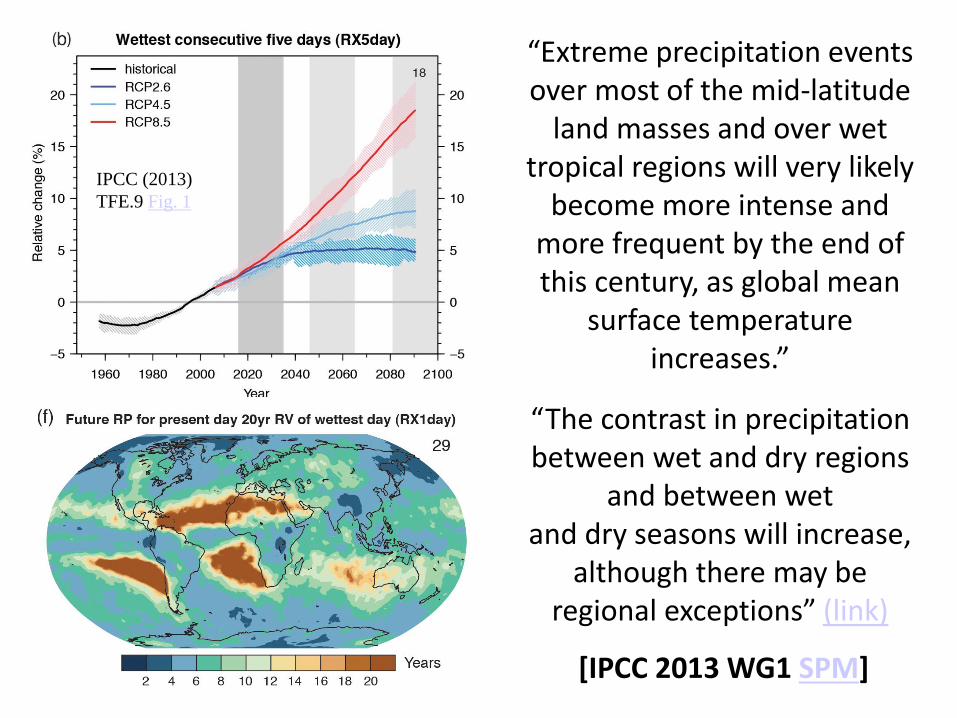
IPCC (2013)
TFE.9 Fig. 1
“Extreme precipitation events over most of the mid-latitude
land masses and over wet tropical regions will very likely
become more intense and more frequent by the end of this century, as global mean
surface temperature increases.”
“The contrast in precipitation between wet and dry regions
and between wetand dry seasons will increase,
although there may be regional exceptions” (link)
[IPCC 2013 WG1 SPM]
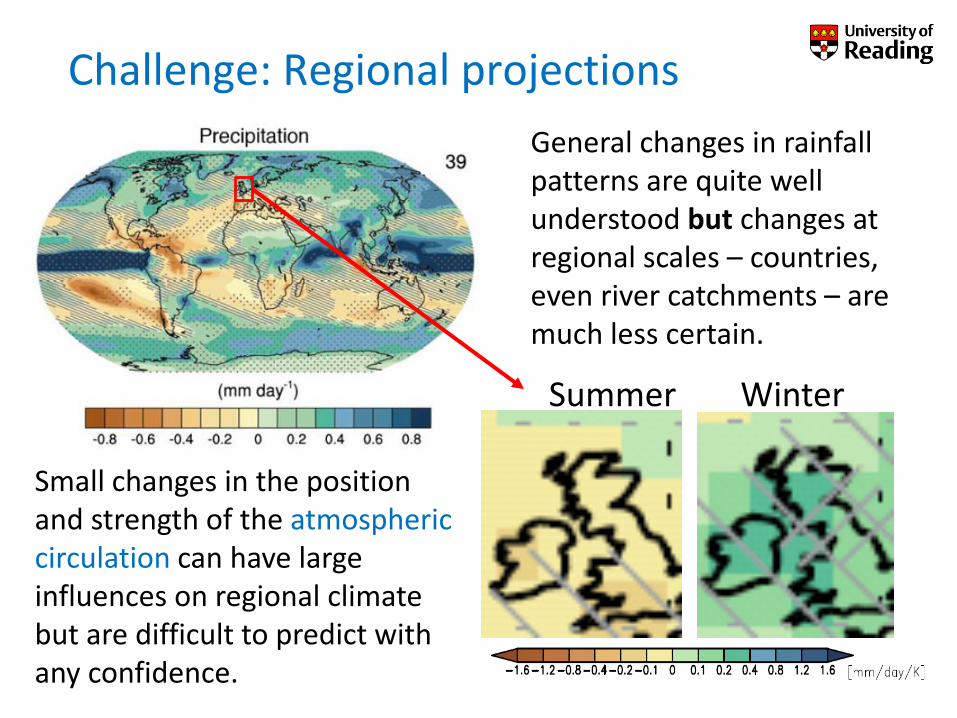
General changes in rainfall patterns are quite well understood but changes at regional scales – countries, even river catchments – are much less certain.
Small changes in the position and strength of the atmospheric circulation can have large influences on regional climate but are difficult to predict with any confidence.
Challenge: Regional projections
Summer Winter
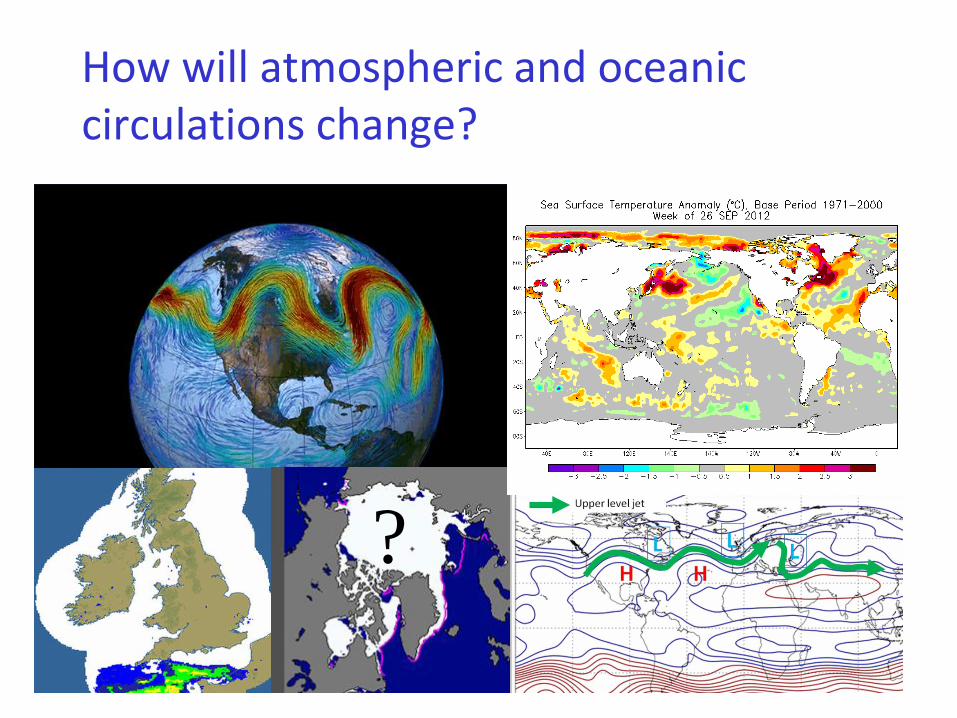
How will atmospheric and oceanic circulations change?
?
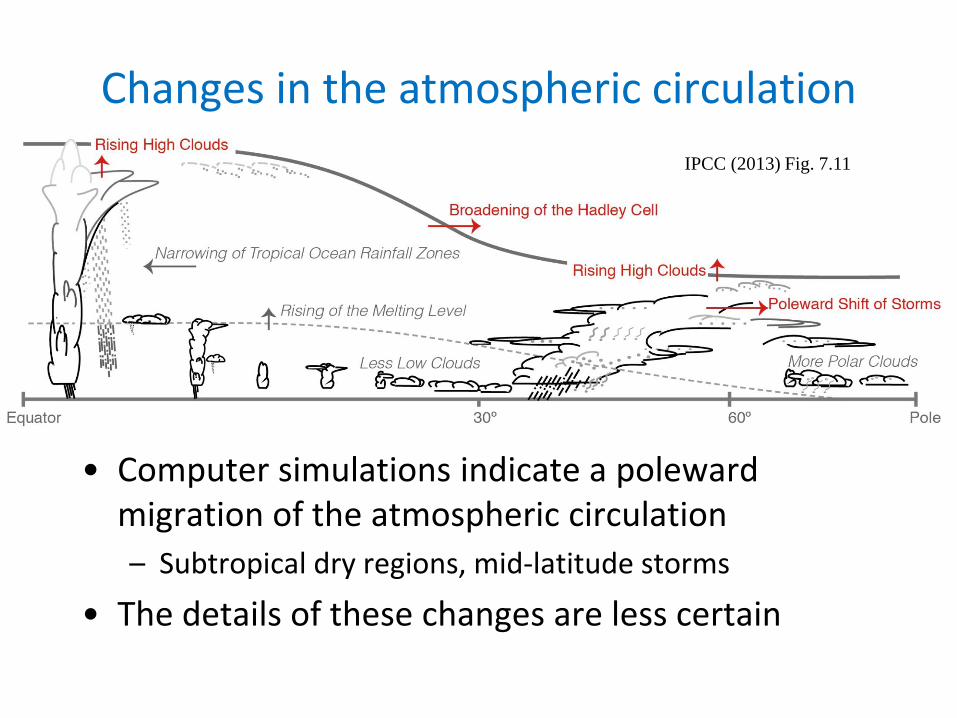
• Computer simulations indicate a polewardmigration of the atmospheric circulation
– Subtropical dry regions, mid-latitude storms
• The details of these changes are less certain
Changes in the atmospheric circulation
IPCC (2013) Fig. 7.11
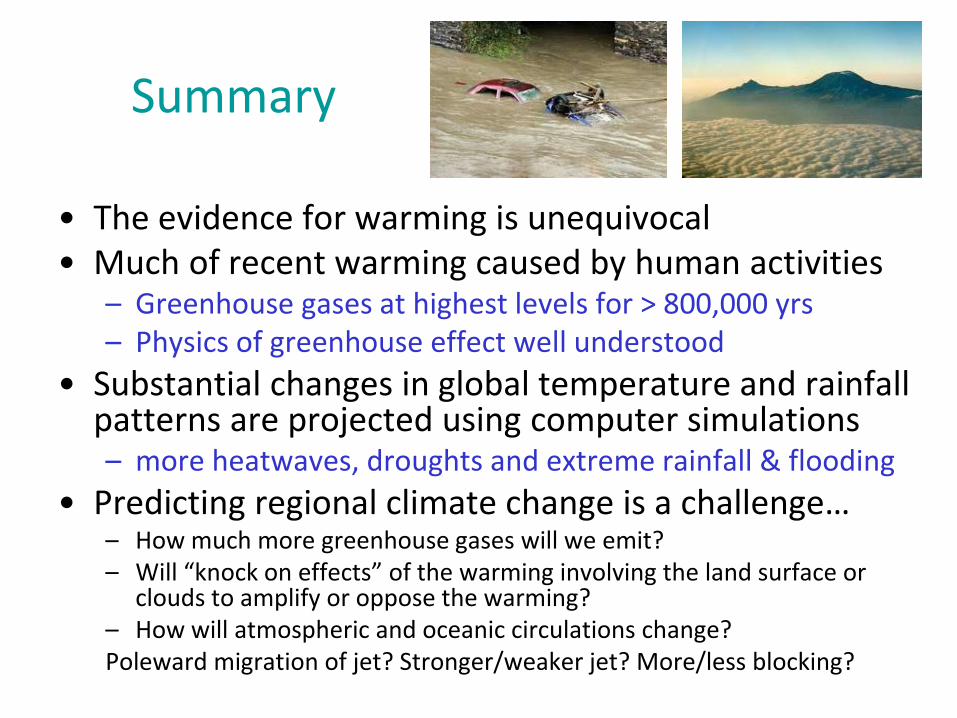
Summary
• The evidence for warming is unequivocal• Much of recent warming caused by human activities
– Greenhouse gases at highest levels for > 800,000 yrs– Physics of greenhouse effect well understood
• Substantial changes in global temperature and rainfall patterns are projected using computer simulations– more heatwaves, droughts and extreme rainfall & flooding
• Predicting regional climate change is a challenge…– How much more greenhouse gases will we emit?– Will “knock on effects” of the warming involving the land surface or
clouds to amplify or oppose the warming?– How will atmospheric and oceanic circulations change?Poleward migration of jet? Stronger/weaker jet? More/less blocking?

Extra slides
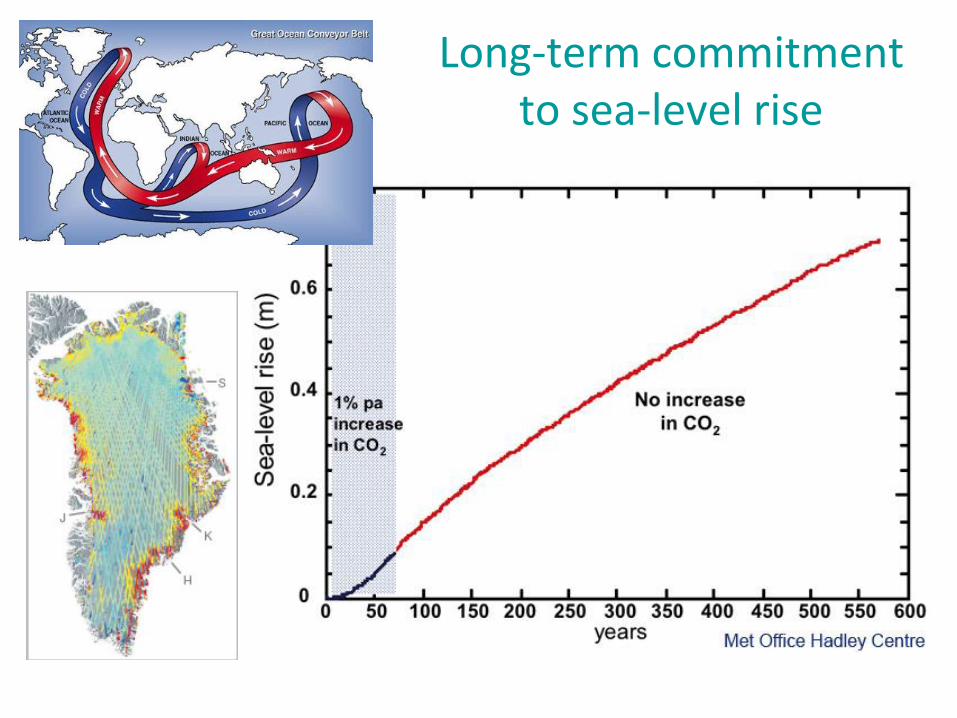
Long-term commitment to sea-level rise
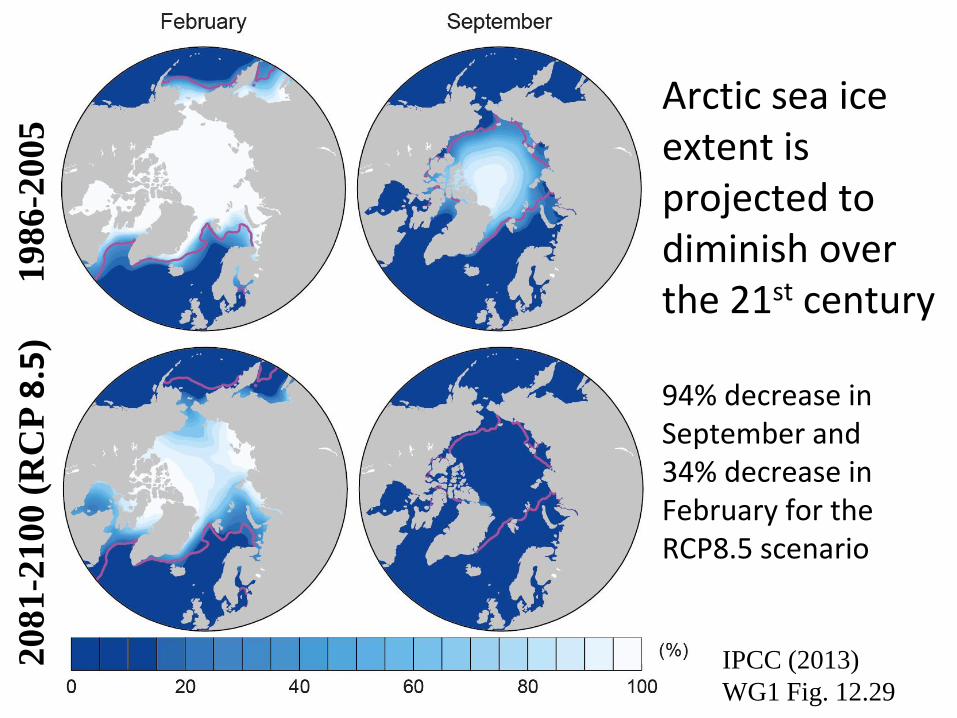
Arctic sea ice extent is projected to diminish over the 21st century
94% decrease in September and34% decrease in February for the RCP8.5 scenario
20
81
-21
00
(R
CP
8.5
)1
98
6-2
00
5
IPCC (2013)
WG1 Fig. 12.29

• Increased Precipitation• More Intense Rainfall• More droughts• Wet regions get wetter,
dry regions get drier?• Regional projections??
Projections of the water cycle
IPCC
WGI
(2013)
Precipitation intensity

Change in average surface temperature (1986−2005 to 2081−2100) RCP 8.5 Scenario


