88
GLOBAL WETLAND OUTLOOK State of the world’s wetlands and their services to people 2018 Convention on Wetlands
cover pic to show natural wetland with human flourishing
GLOBAL WETLAND OUTLOOKState of the world’s wetlands and their services to people 2018
Convention on Wetlands
© Ramsar Convention Secretariat 2018
Citation: Ramsar Convention on Wetlands. (2018). Global Wetland Outlook: State of the World’s Wetlands and their Services to People. Gland, Switzerland: Ramsar Convention Secretariat.
Coordinating Lead Authors: Royal C. Gardner and C. Max Finlayson
Section 1: Lead Authors: Royal C. Gardner and C. Max Finlayson
Section 2: Lead Authors: C. Max Finlayson, Nick Davidson, Siobhan Fennessy, David Coates, and Royal C. Gardner. Contributing Authors: Will Darwall, Michael Dema, Mark Everard, Louise McRae, Christian Perennou and David Stroud
Section 3: Lead Author: Anne van Damm. Contributing Authors: Channa Bambaradeniya, Peter Davies, Wei-Ta Fang, Vincent Hilomen, Kassim Kulindwa, Laura Martinez, Christian Perennou, Luisa Ricaurte, Michael Scoullos, Sanjiv de Silva, and Gert Michael Steiner
Section 4: Lead Authors: Royal C. Gardner, Chris Baker, Nick Davidson, Ritesh Kumar and David Stroud. Contributing Authors: Stefano Barchiesi, C. Max Finlayson, Erin Okuno, Christian Perennou
Editor: Nigel Dudley
Design and layout: Miller Design
Front cover photograph: San Miguel National Park, Uruguay © Charlie Waite
Paper: Cocoon Silk 100% Recycled
Project coordination, support and production assistance provided by the Secretariat of the Ramsar Convention on Wetlands under the leadership of the Secretary General, Martha Rojas Urrego.
Disclaimer: The views expressed in this information product are those of the authors or contributors and do not necessarily reflect the views or policies of the Ramsar Convention and do not imply the expression of any opinion whatsoever on the part of the Convention on Wetlands (the Ramsar Convention) concerning the legal or development status of any country, territory, city or area or of its authorities, or concerning the delimitation of its frontiers or boundaries.
Acknowledgements: The authors would like to express sincere thanks to the many wetland experts who contributed to the Global Wetland Outlook, including the participants in a writing workshop held on the margins of INTECOL in Changshu, China, in September 2016; the participants in the 20th and 21st meetings of the Ramsar Scientific and Technical Review Panel (STRP) held in Gland, Switzerland, in February 2017 and January 2018; STRP National Focal Points who reviewed and provided comments on the first order draft; and six anonymous reviewers with a wide range of wetland experience and regional diversity who provided comments on the second order draft. The authors are also deeply grateful for the support of the Ramsar Secretariat led by Martha Rojas Urrego and especially for the outstanding contributions of the editor, Nigel Dudley.
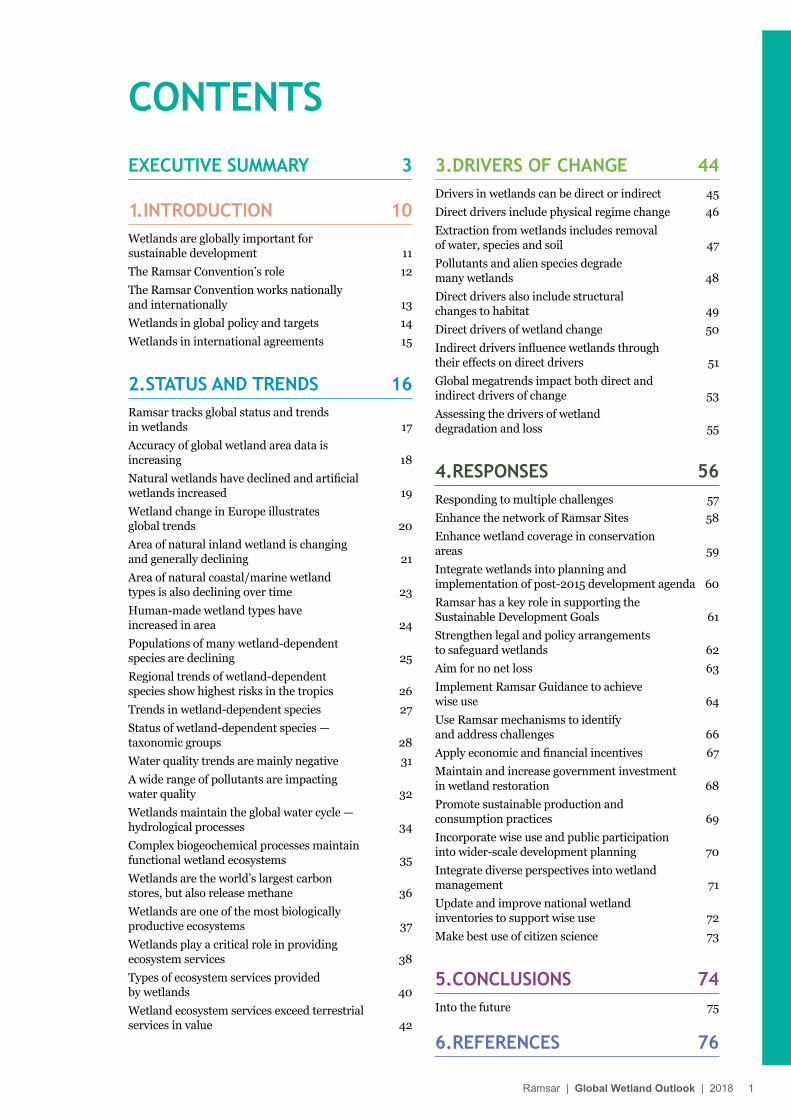
CONTENTSEXECUTIVE SUMMARY 3
1. INTRODUCTION 10Wetlands are globally important for sustainable development 11The Ramsar Convention’s role 12The Ramsar Convention works nationally and internationally 13Wetlands in global policy and targets 14Wetlands in international agreements 15
2.STATUS AND TRENDS 16Ramsar tracks global status and trends in wetlands 17Accuracy of global wetland area data is increasing 18Natural wetlands have declined and artificial wetlands increased 19Wetland change in Europe illustrates global trends 20Area of natural inland wetland is changing and generally declining 21Area of natural coastal/marine wetland types is also declining over time 23Human-made wetland types have increased in area 24Populations of many wetland-dependent species are declining 25Regional trends of wetland-dependent species show highest risks in the tropics 26Trends in wetland-dependent species 27Status of wetland-dependent species — taxonomic groups 28Water quality trends are mainly negative 31A wide range of pollutants are impacting water quality 32Wetlands maintain the global water cycle — hydrological processes 34Complex biogeochemical processes maintain functional wetland ecosystems 35Wetlands are the world’s largest carbon stores, but also release methane 36Wetlands are one of the most biologically productive ecosystems 37Wetlands play a critical role in providing ecosystem services 38Types of ecosystem services provided by wetlands 40Wetland ecosystem services exceed terrestrial services in value 42
3.DRIVERS OF CHANGE 44Drivers in wetlands can be direct or indirect 45Direct drivers include physical regime change 46Extraction from wetlands includes removal of water, species and soil 47Pollutants and alien species degrade many wetlands 48Direct drivers also include structural changes to habitat 49Direct drivers of wetland change 50Indirect drivers influence wetlands through their effects on direct drivers 51Global megatrends impact both direct and indirect drivers of change 53Assessing the drivers of wetland degradation and loss 55
4.RESPONSES 56Responding to multiple challenges 57Enhance the network of Ramsar Sites 58Enhance wetland coverage in conservation areas 59Integrate wetlands into planning and implementation of post-2015 development agenda 60Ramsar has a key role in supporting the Sustainable Development Goals 61Strengthen legal and policy arrangements to safeguard wetlands 62Aim for no net loss 63Implement Ramsar Guidance to achieve wise use 64Use Ramsar mechanisms to identify and address challenges 66Apply economic and financial incentives 67Maintain and increase government investment in wetland restoration 68Promote sustainable production and consumption practices 69Incorporate wise use and public participation into wider-scale development planning 70Integrate diverse perspectives into wetland management 71Update and improve national wetland inventories to support wise use 72Make best use of citizen science 73
5.CONCLUSIONS 74Into the future 75
6.REFERENCES 76
Ramsar | Global Wetland Outlook | 2018 1
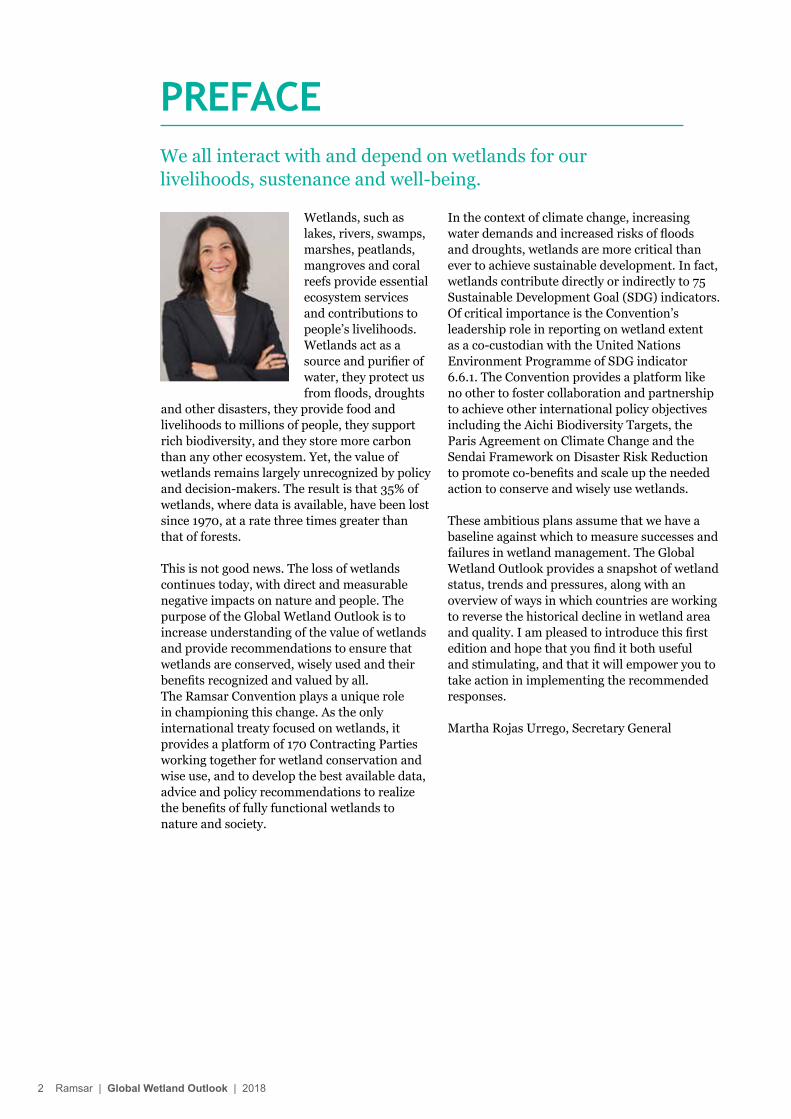
Wetlands, such as lakes, rivers, swamps, marshes, peatlands, mangroves and coral reefs provide essential ecosystem services and contributions to people’s livelihoods. Wetlands act as a source and purifier of water, they protect us from floods, droughts
and other disasters, they provide food and livelihoods to millions of people, they support rich biodiversity, and they store more carbon than any other ecosystem. Yet, the value of wetlands remains largely unrecognized by policy and decision-makers. The result is that 35% of wetlands, where data is available, have been lost since 1970, at a rate three times greater than that of forests.
This is not good news. The loss of wetlands continues today, with direct and measurable negative impacts on nature and people. The purpose of the Global Wetland Outlook is to increase understanding of the value of wetlands and provide recommendations to ensure that wetlands are conserved, wisely used and their benefits recognized and valued by all. The Ramsar Convention plays a unique role in championing this change. As the only international treaty focused on wetlands, it provides a platform of 170 Contracting Parties working together for wetland conservation and wise use, and to develop the best available data, advice and policy recommendations to realize the benefits of fully functional wetlands to nature and society.
PREFACEWe all interact with and depend on wetlands for our livelihoods, sustenance and well-being.
In the context of climate change, increasing water demands and increased risks of floods and droughts, wetlands are more critical than ever to achieve sustainable development. In fact, wetlands contribute directly or indirectly to 75 Sustainable Development Goal (SDG) indicators. Of critical importance is the Convention’s leadership role in reporting on wetland extent as a co-custodian with the United Nations Environment Programme of SDG indicator 6.6.1. The Convention provides a platform like no other to foster collaboration and partnership to achieve other international policy objectives including the Aichi Biodiversity Targets, the Paris Agreement on Climate Change and the Sendai Framework on Disaster Risk Reduction to promote co-benefits and scale up the needed action to conserve and wisely use wetlands.
These ambitious plans assume that we have a baseline against which to measure successes and failures in wetland management. The Global Wetland Outlook provides a snapshot of wetland status, trends and pressures, along with an overview of ways in which countries are working to reverse the historical decline in wetland area and quality. I am pleased to introduce this first edition and hope that you find it both useful and stimulating, and that it will empower you to take action in implementing the recommended responses.
Martha Rojas Urrego, Secretary General
2 Ramsar | Global Wetland Outlook | 2018
KEY MESSAGES
• Healthy, functioning natural wetlands are critical to human livelihoods and sustainable development.
• Although still covering a global area almost as large as Greenland, wetlands are declining fast, with 35% losses since 1970, where data are available.
• Wetland plants and animals are therefore in crisis, with a quarter of species at risk of extinction.
• Quality of remaining wetlands is also suffering, due to drainage, pollution, invasive species, unsustainable use, disrupted flow regimes and climate change.
• Yet wetland ecosystem services, ranging from food security to climate change mitigation, are enormous, far outweighing those of terrestrial ecosystems.
• The Ramsar Convention promotes wetland conservation and wise use and is at the centre of efforts to halt and reverse wetland loss.
• Key steps in conserving and regaining healthy wetlands include:
• enhancing the network of Ramsar Sites and other wetland protected areas
• integrating wetlands into planning and the implementation of the post-2015 development agenda
• strengthening legal and policy arrangements to conserve all wetlands
• implementing Ramsar guidance to achieve wise use • applying economic and financial incentives for
communities and businesses• ensuring participation of all stakeholders in wetland
management • improving national wetland inventories and tracking
wetland extent.
Ramsar | Global Wetland Outlook | 2018 3
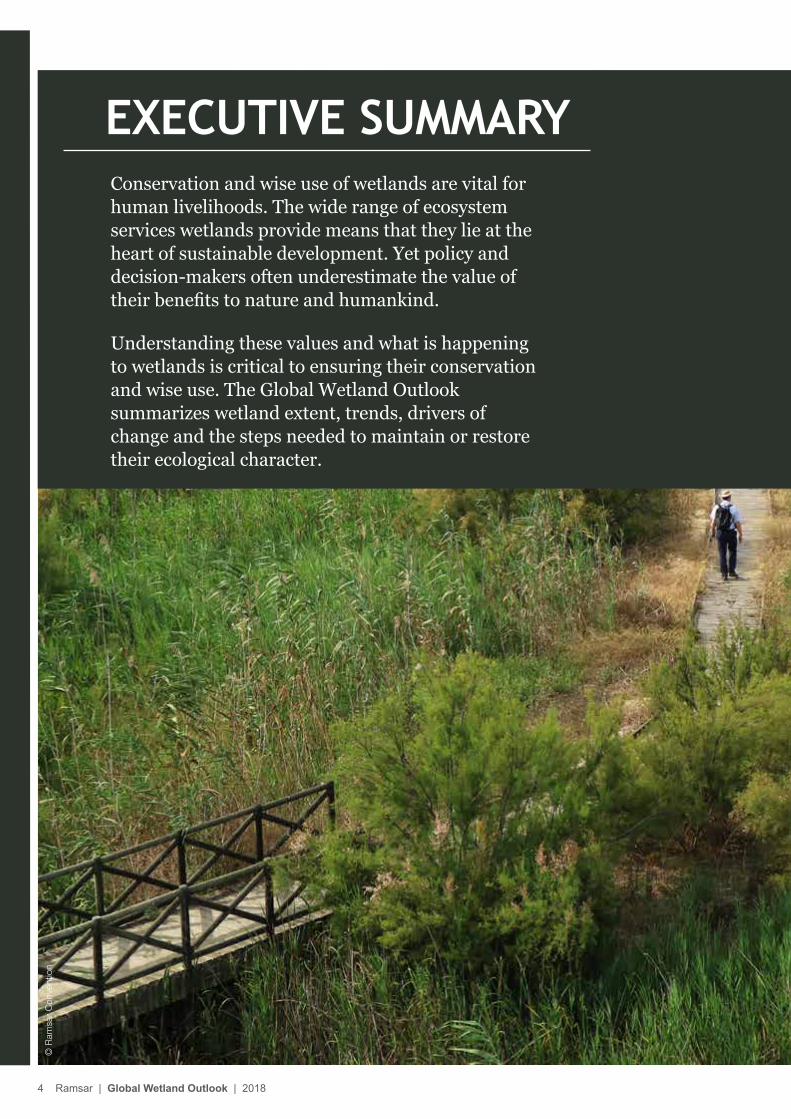
Conservation and wise use of wetlands are vital for human livelihoods. The wide range of ecosystem services wetlands provide means that they lie at the heart of sustainable development. Yet policy and decision-makers often underestimate the value of their benefits to nature and humankind.
Understanding these values and what is happening to wetlands is critical to ensuring their conservation and wise use. The Global Wetland Outlook summarizes wetland extent, trends, drivers of change and the steps needed to maintain or restore their ecological character.
EXECUTIVE SUMMARY
© R
amsa
r C
onve
ntio
n
4 Ramsar | Global Wetland Outlook | 2018
EXECUTIVE SUMMARY
ExtentAccuracy of global wetland area data is increasing. Global inland and coastal wetlands cover over 12.1 million km2, an area almost as large as Greenland, with 54% permanently inundated and 46% seasonally inundated. However, natural wetlands are in long-term decline around the world; between 1970 and 2015, inland and marine/coastal wetlands both declined by approximately 35%, where data are available, three times the rate of forest loss. In contrast, human-made wetlands, largely rice paddy and reservoirs, almost doubled over this period, now forming 12% of wetlands. These increases have not compensated for natural wetland loss.
Biodiversity Overall available data suggest that wetland-dependent species such as fish, waterbirds and turtles are in serious decline, with one-quarter threatened with extinction particularly in the tropics. Since 1970, 81% of inland wetland species populations and 36% of coastal and marine species have declined.
Global threat levels are high (over 10% of species globally threatened) for almost all inland and coastal wetland-dependent taxa assessed. Highest levels of extinction threat (over 30% of species globally threatened) are for marine turtles, wetland-dependent megafauna, freshwater reptiles, amphibians, non-marine molluscs, corals, crabs and crayfish. Extinction risk appears to be increasing. Although waterbird species have a relatively low global threat level, most populations are in long-term decline. Only coral reef-dependent parrotfish and surgeonfish, and dragonflies have a low threat status.
Water qualityWater quality trends are mostly negative. Since the 1990s, water pollution has worsened in almost all rivers in Latin America, Africa and Asia. Deterioration is projected to escalate.
Major threats include untreated wastewater, industrial waste, agricultural runoff, erosion and changes in sediment. By 2050, one-
third of the global population will likely be exposed to water with excessive nitrogen and phosphorous, leading to rapid algal growth and decay that can kill fish and other species. Severe pathogen pollution affects one-third of rivers in Latin America, Africa and Asia, with faecal coliform bacteria increasing over the last two decades. Salinity has built up in many wetlands, including in groundwater, damaging agriculture. Nitrogen oxides from fossil fuels and ammonia from agriculture cause acid deposition. Acid mine drainage is a major pollutant. Thermal pollution from power plants and industry decreases oxygen, alters food chains and reduces biodiversity. At least 5.25 trillion persistent plastic particles are afloat in the world’s oceans and have huge impacts in coastal waters. In nearly half OECD countries, water in agricultural areas contains pesticides above national recommended limits. These impacts harm our health, undermine ecosystem services and further damage biodiversity.
Ecosystem processes Wetlands are one of the most biologically productive ecosystems. They play a major role in the water cycle by receiving, storing and releasing water, regulating flows and supporting life. River channels, floodplains and connected wetlands play significant roles in hydrology, but many “geographically isolated” wetlands are also important. However, land use change and water regulation infrastructure have reduced connectivity in many river systems and with floodplain wetlands. Wetlands regulate nutrient and trace metal cycles and can filter these and other pollutants. They store the majority of global soil carbon, but in the future climate change may cause them to become carbon sources, particularly in permafrost regions.
Ecosystem servicesWetland ecosystem services far exceed those of terrestrial ecosystems. They provide critical food supplies including rice and freshwater and coastal fish, and fresh water, fibre and fuel. Regulating services influence climate and hydrological regimes, and reduce both pollution and disaster risk. Natural features of wetlands often have cultural and spiritual importance.
Status and Trends
Ramsar | Global Wetland Outlook | 2018 5
Drivers
Wise use of wetlands requires a thorough understanding of the drivers of change so that the root causes of wetland loss and degradation can be addressed. Wetlands continue to be lost and degraded through drainage and conversion, introduction of pollution and invasive species, extraction activities, and other actions affecting the water quantity and frequency of flooding and drying.
These immediate drivers are in turn affected by indirect drivers, relating to supply of energy, food, fibre, infrastructure, tourism and recreation. Climate change is a direct and indirect driver of change. Therefore, adaptation and mitigation measures can have multiplier effects in addressing other drivers of wetland change. Global megatrends are also important, including demography, globalization, consumption and urbanization, with climate change creating uncertainty at every level.
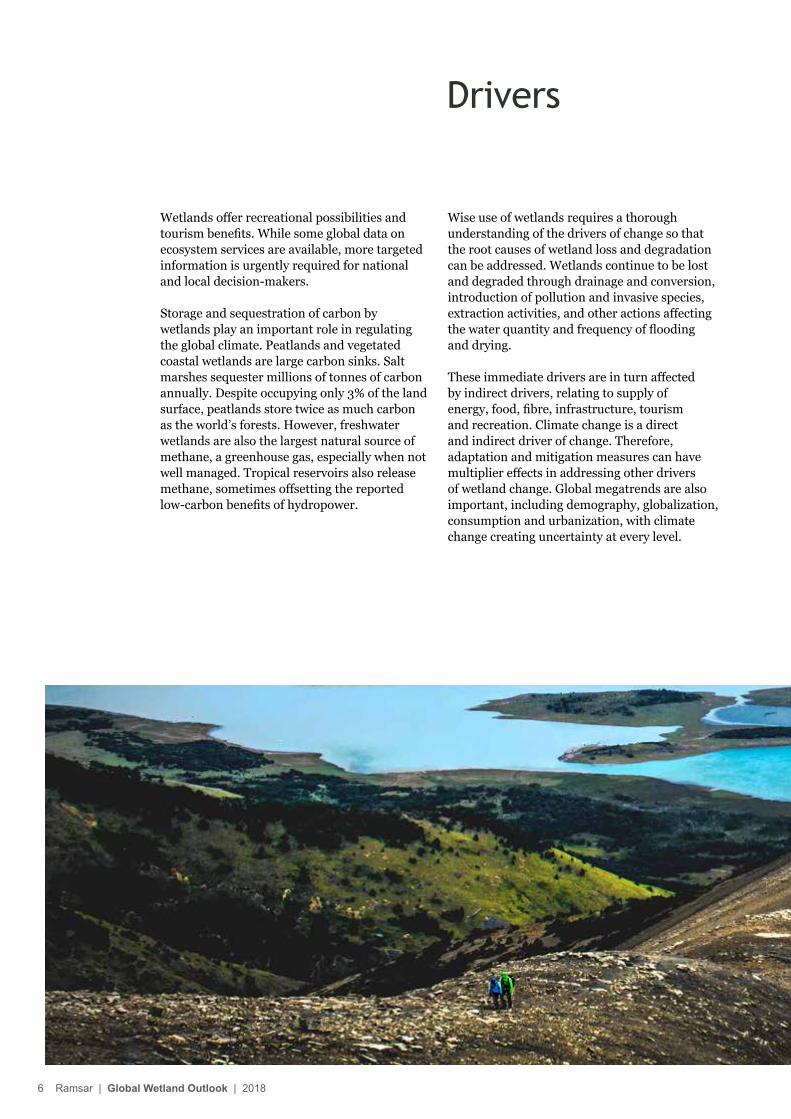
Wetlands offer recreational possibilities and tourism benefits. While some global data on ecosystem services are available, more targeted information is urgently required for national and local decision-makers.
Storage and sequestration of carbon by wetlands play an important role in regulating the global climate. Peatlands and vegetated coastal wetlands are large carbon sinks. Salt marshes sequester millions of tonnes of carbon annually. Despite occupying only 3% of the land surface, peatlands store twice as much carbon as the world’s forests. However, freshwater wetlands are also the largest natural source of methane, a greenhouse gas, especially when not well managed. Tropical reservoirs also release methane, sometimes offsetting the reported low-carbon benefits of hydropower.
6 Ramsar | Global Wetland Outlook | 2018
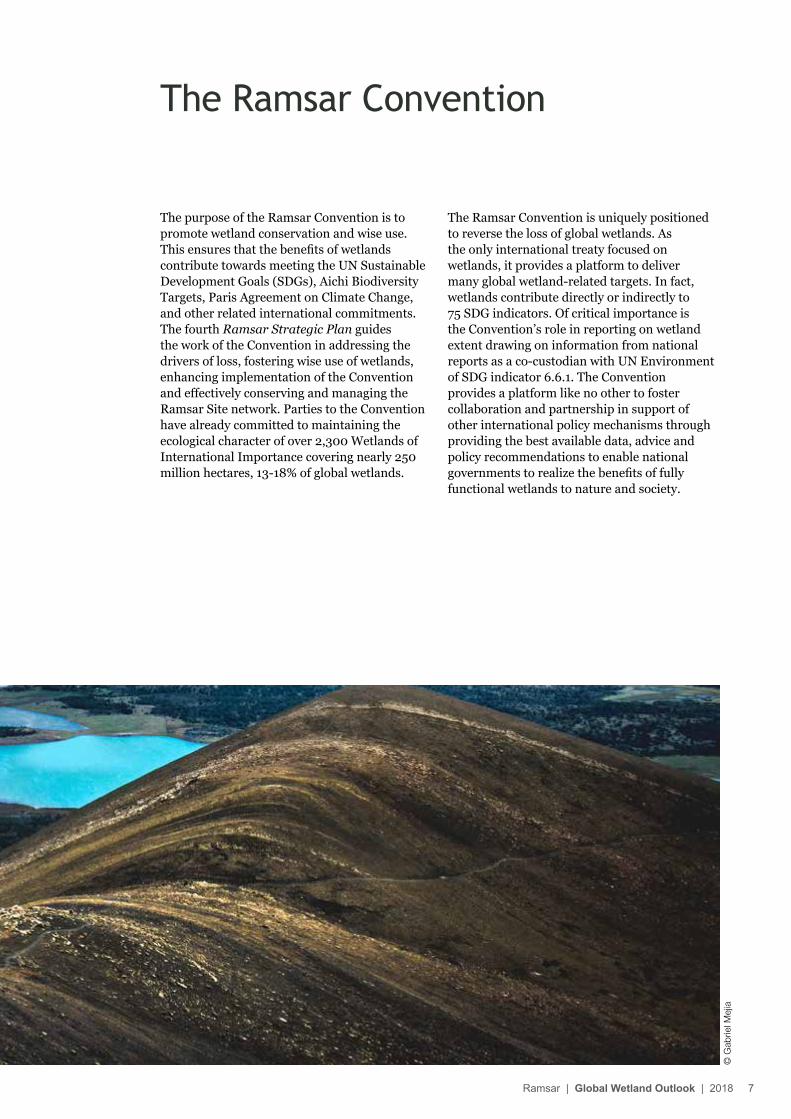
The purpose of the Ramsar Convention is to promote wetland conservation and wise use. This ensures that the benefits of wetlands contribute towards meeting the UN Sustainable Development Goals (SDGs), Aichi Biodiversity Targets, Paris Agreement on Climate Change, and other related international commitments. The fourth Ramsar Strategic Plan guides the work of the Convention in addressing the drivers of loss, fostering wise use of wetlands, enhancing implementation of the Convention and effectively conserving and managing the Ramsar Site network. Parties to the Convention have already committed to maintaining the ecological character of over 2,300 Wetlands of International Importance covering nearly 250 million hectares, 13-18% of global wetlands.
The Ramsar Convention
The Ramsar Convention is uniquely positioned to reverse the loss of global wetlands. As the only international treaty focused on wetlands, it provides a platform to deliver many global wetland-related targets. In fact, wetlands contribute directly or indirectly to 75 SDG indicators. Of critical importance is the Convention’s role in reporting on wetland extent drawing on information from national reports as a co-custodian with UN Environment of SDG indicator 6.6.1. The Convention provides a platform like no other to foster collaboration and partnership in support of other international policy mechanisms through providing the best available data, advice and policy recommendations to enable national governments to realize the benefits of fully functional wetlands to nature and society.
© G
abrie
l Mej
ia
Ramsar | Global Wetland Outlook | 2018 7
© V
icen
te W
eipp
ert
8 Ramsar | Global Wetland Outlook | 2018
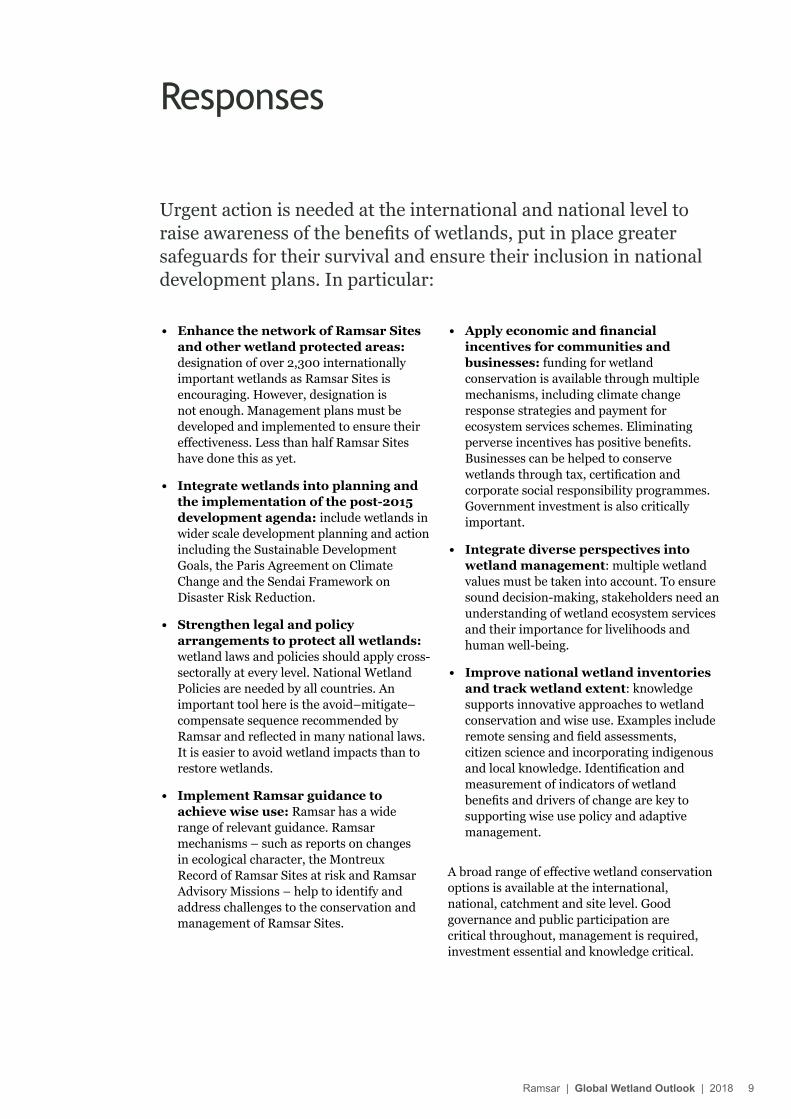
Urgent action is needed at the international and national level to raise awareness of the benefits of wetlands, put in place greater safeguards for their survival and ensure their inclusion in national development plans. In particular:
Responses
• Enhance the network of Ramsar Sites and other wetland protected areas: designation of over 2,300 internationally important wetlands as Ramsar Sites is encouraging. However, designation is not enough. Management plans must be developed and implemented to ensure their effectiveness. Less than half Ramsar Sites have done this as yet.
• Integrate wetlands into planning and the implementation of the post-2015 development agenda: include wetlands in wider scale development planning and action including the Sustainable Development Goals, the Paris Agreement on Climate Change and the Sendai Framework on Disaster Risk Reduction.
• Strengthen legal and policy arrangements to protect all wetlands: wetland laws and policies should apply cross-sectorally at every level. National Wetland Policies are needed by all countries. An important tool here is the avoid–mitigate–compensate sequence recommended by Ramsar and reflected in many national laws. It is easier to avoid wetland impacts than to restore wetlands.
• Implement Ramsar guidance to achieve wise use: Ramsar has a wide range of relevant guidance. Ramsar mechanisms – such as reports on changes in ecological character, the Montreux Record of Ramsar Sites at risk and Ramsar Advisory Missions – help to identify and address challenges to the conservation and management of Ramsar Sites.
• Apply economic and financial incentives for communities and businesses: funding for wetland conservation is available through multiple mechanisms, including climate change response strategies and payment for ecosystem services schemes. Eliminating perverse incentives has positive benefits. Businesses can be helped to conserve wetlands through tax, certification and corporate social responsibility programmes. Government investment is also critically important.
• Integrate diverse perspectives into wetland management: multiple wetland values must be taken into account. To ensure sound decision-making, stakeholders need an understanding of wetland ecosystem services and their importance for livelihoods and human well-being.
• Improve national wetland inventories and track wetland extent: knowledge supports innovative approaches to wetland conservation and wise use. Examples include remote sensing and field assessments, citizen science and incorporating indigenous and local knowledge. Identification and measurement of indicators of wetland benefits and drivers of change are key to supporting wise use policy and adaptive management.
A broad range of effective wetland conservation options is available at the international, national, catchment and site level. Good governance and public participation are critical throughout, management is required, investment essential and knowledge critical.
Ramsar | Global Wetland Outlook | 2018 9
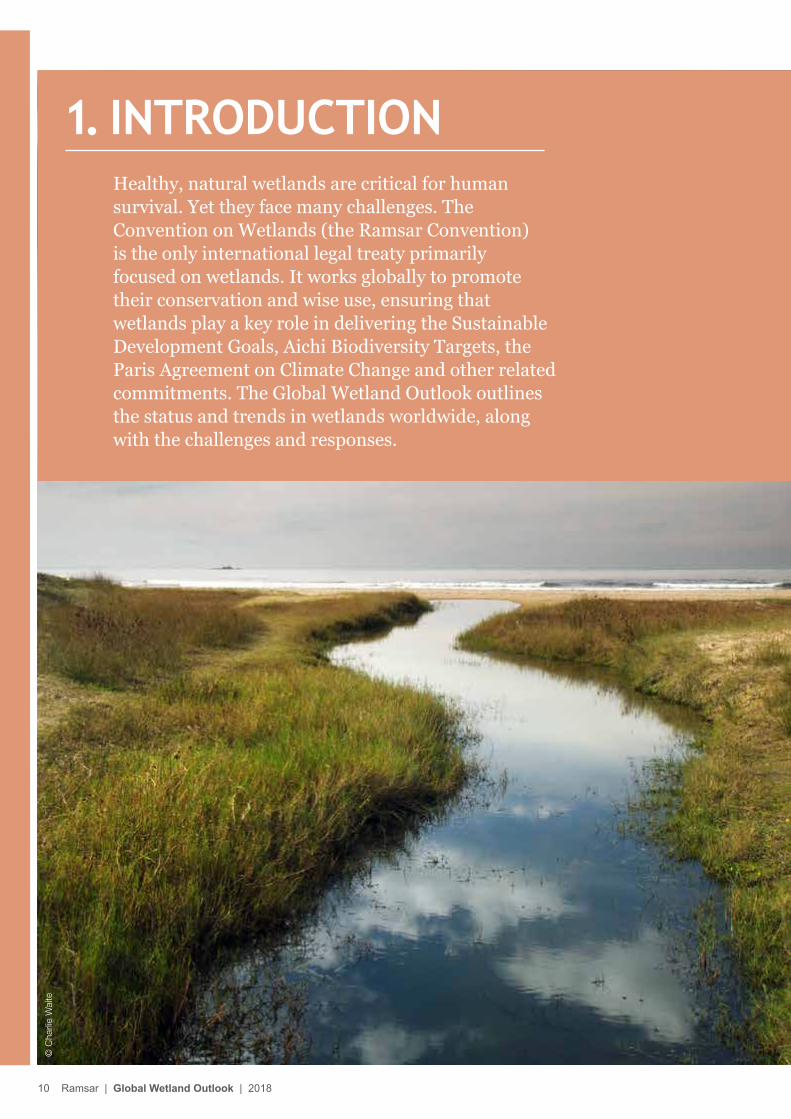
Healthy, natural wetlands are critical for human survival. Yet they face many challenges. The Convention on Wetlands (the Ramsar Convention) is the only international legal treaty primarily focused on wetlands. It works globally to promote their conservation and wise use, ensuring that wetlands play a key role in delivering the Sustainable Development Goals, Aichi Biodiversity Targets, the Paris Agreement on Climate Change and other related commitments. The Global Wetland Outlook outlines the status and trends in wetlands worldwide, along with the challenges and responses.
1. INTRODUCTION
© C
harli
e W
aite
10 Ramsar | Global Wetland Outlook | 2018
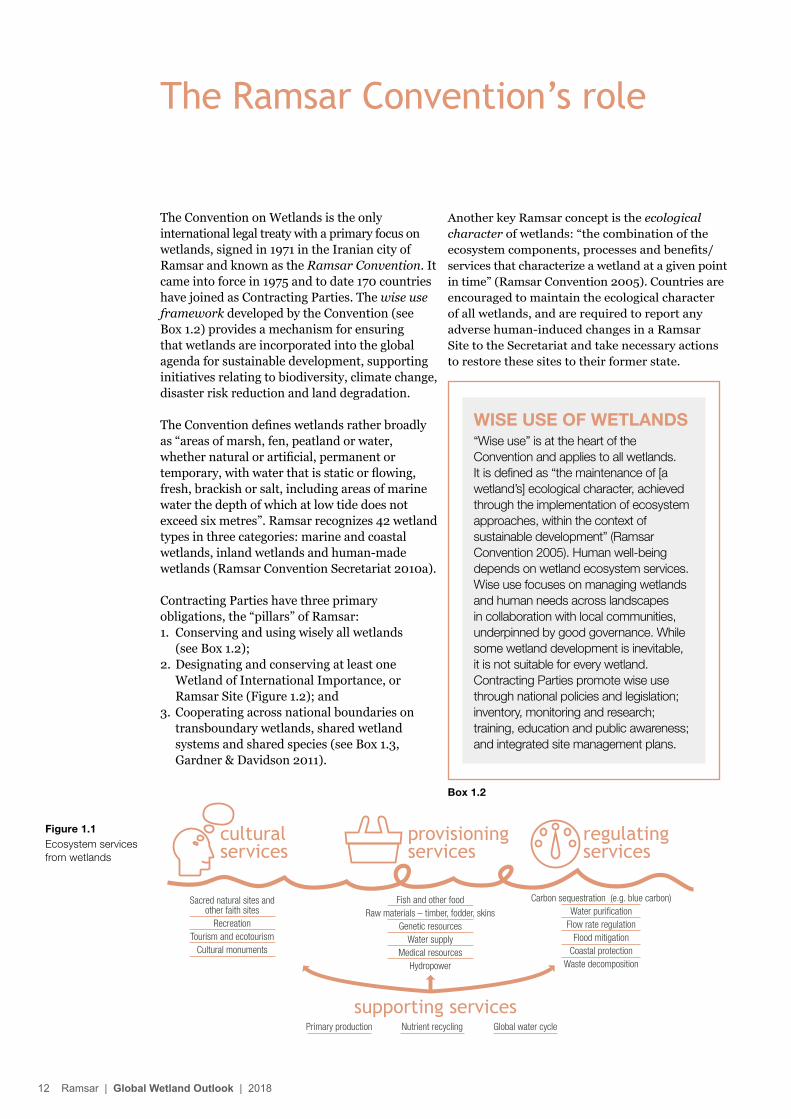
Wetlands are vital for human survival. They include some of the world’s most productive ecosystems and provide ecosystem services leading to countless benefits (MEA 2005; Russi et al. 2013). Wetlands include permanently or seasonally inundated freshwater habitats ranging from lakes and rivers to marshes, along with coastal and marine areas such as estuaries, lagoons, mangroves and reefs. The global water cycle underpins primary production and nutrient recycling and provides fresh water and food for people. Wetlands are used for transport and hydropower. They provide raw materials and genetic resources, including medicines. They also help to mitigate floods, protect coastlines and store and sequester carbon. Many are important for culture, spiritual values, recreation and inspiration. Some of these benefits are summarized in Figure 1.1 below.
The contributions that wetlands make to human well-being have often been overlooked or underappreciated. Consequently, wetland management has been underplayed in development planning. Stakeholders in one sector make decisions based on narrow and short-term interests, losing opportunities to achieve multiple benefits, and causing further wetland loss and degradation. Encouraging
policy makers across all sectors to recognize and take account of multiple wetland values, and their interdependencies, is essential if wetland wise use and sustainable development are to be achieved. Effective management of wetlands requires collaboration from many sectors of society, in particular those who make use of the many benefits provided by wetlands, or who can influence their management and conservation.
This report outlines the state of the world’s wetlands and their associated benefits. It will set a baseline to assess progress on the Ramsar Convention’s Strategic Plan, 2016-2024, and strengthen the attention given to wetlands in the Sustainable Development Goals, Aichi Biodiversity Targets, Sendai Framework for Disaster Risk Reduction and the Paris Climate Agreement. It examines the state and trends of wetlands, identifies knowledge gaps and looks to potential changes in the future. The Global Wetland Outlook identifies many negative trends, but also highlights successes and best practices. It reviews the drivers of wetland loss and degradation and outlines responses for the wetland community and other sectors.
Box 1.1
CONTEXT FOR THE GLOBAL WETLAND OUTLOOKThe Global Wetland Outlook builds on analyses such as the Millennium Ecosystem Assessment (MEA 2005), the Global Biodiversity Outlook (Convention on Biological Diversity 2014), Global Land Outlook (UNCCD 2017), Land Degradation and Restoration Assessment (IPBES 2018), and The Economics of Ecosystems and
Biodiversity (Russi et al. 2013), which all noted the loss and degradation of wetlands and the importance of wetlands for ecosystem services and supporting local communities. It draws on a large body of published literature, including that developed and compiled by the Convention’s Scientific and Technical Review Panel since its inception in 1993.
Wetlands are globally important for sustainable development
Ramsar | Global Wetland Outlook | 2018 11
WISE USE OF WETLANDS“Wise use” is at the heart of the Convention and applies to all wetlands. It is defined as “the maintenance of [a wetland’s] ecological character, achieved through the implementation of ecosystem approaches, within the context of sustainable development” (Ramsar Convention 2005). Human well-being depends on wetland ecosystem services. Wise use focuses on managing wetlands and human needs across landscapes in collaboration with local communities, underpinned by good governance. While some wetland development is inevitable, it is not suitable for every wetland. Contracting Parties promote wise use through national policies and legislation; inventory, monitoring and research; training, education and public awareness; and integrated site management plans.
Box 1.2
Figure 1.1Ecosystem services from wetlands
The Ramsar Convention’s role
The Convention on Wetlands is the only international legal treaty with a primary focus on wetlands, signed in 1971 in the Iranian city of Ramsar and known as the Ramsar Convention. It came into force in 1975 and to date 170 countries have joined as Contracting Parties. The wise use framework developed by the Convention (see Box 1.2) provides a mechanism for ensuring that wetlands are incorporated into the global agenda for sustainable development, supporting initiatives relating to biodiversity, climate change, disaster risk reduction and land degradation.
The Convention defines wetlands rather broadly as “areas of marsh, fen, peatland or water, whether natural or artificial, permanent or temporary, with water that is static or flowing, fresh, brackish or salt, including areas of marine water the depth of which at low tide does not exceed six metres”. Ramsar recognizes 42 wetland types in three categories: marine and coastal wetlands, inland wetlands and human-made wetlands (Ramsar Convention Secretariat 2010a).
Contracting Parties have three primary obligations, the “pillars” of Ramsar: 1. Conserving and using wisely all wetlands
(see Box 1.2); 2. Designating and conserving at least one
Wetland of International Importance, or Ramsar Site (Figure 1.2); and
3. Cooperating across national boundaries on transboundary wetlands, shared wetland systems and shared species (see Box 1.3, Gardner & Davidson 2011).
Another key Ramsar concept is the ecological character of wetlands: “the combination of the ecosystem components, processes and benefits/services that characterize a wetland at a given point in time” (Ramsar Convention 2005). Countries are encouraged to maintain the ecological character of all wetlands, and are required to report any adverse human-induced changes in a Ramsar Site to the Secretariat and take necessary actions to restore these sites to their former state.
supporting servicesPrimary production Nutrient recycling Global water cycle
Sacred natural sites and other faith sites
RecreationTourism and ecotourism
Cultural monuments
Fish and other foodRaw materials – timber, fodder, skins
Genetic resourcesWater supply
Medical resourcesHydropower
Carbon sequestration (e.g. blue carbon)Water purification
Flow rate regulationFlood mitigation
Coastal protectionWaste decomposition
culturalservices
provisioning services
regulating services
12 Ramsar | Global Wetland Outlook | 2018
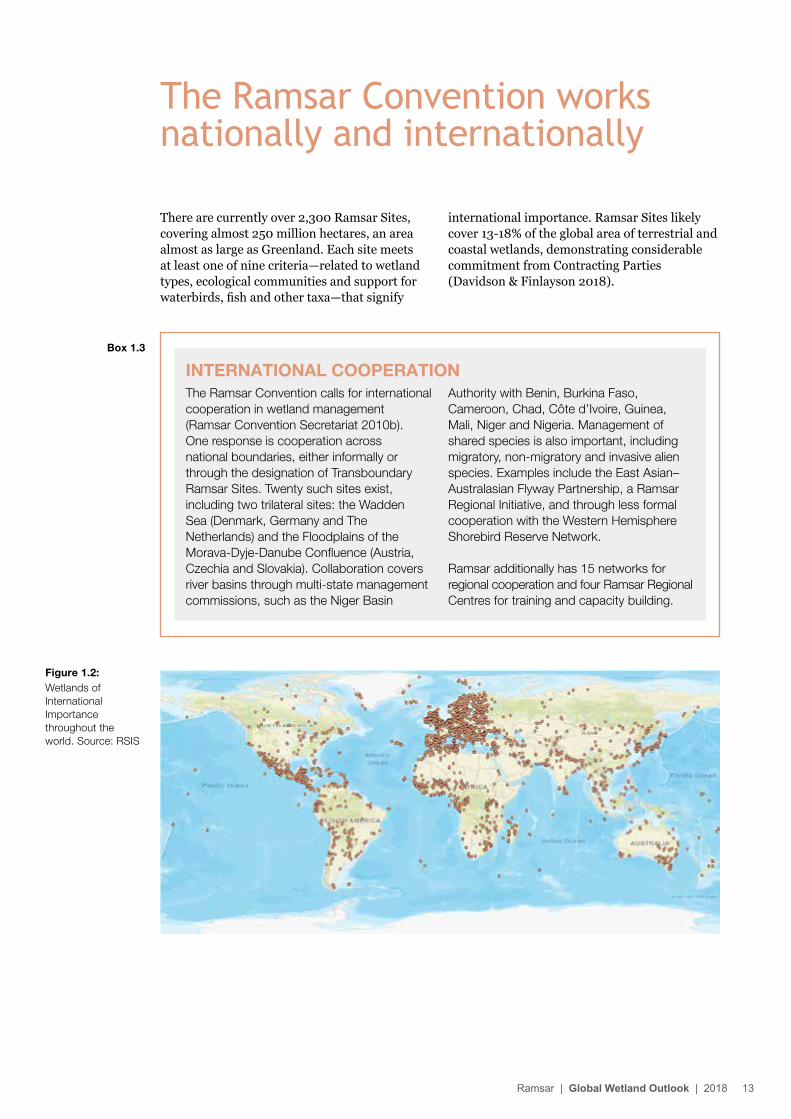
Figure 1.2:Wetlands of International Importance throughout the world. Source: RSIS
Box 1.3
There are currently over 2,300 Ramsar Sites, covering almost 250 million hectares, an area almost as large as Greenland. Each site meets at least one of nine criteria—related to wetland types, ecological communities and support for waterbirds, fish and other taxa—that signify
international importance. Ramsar Sites likely cover 13-18% of the global area of terrestrial and coastal wetlands, demonstrating considerable commitment from Contracting Parties (Davidson & Finlayson 2018).
The Ramsar Convention works nationally and internationally
INTERNATIONAL COOPERATIONThe Ramsar Convention calls for international cooperation in wetland management (Ramsar Convention Secretariat 2010b). One response is cooperation across national boundaries, either informally or through the designation of Transboundary Ramsar Sites. Twenty such sites exist, including two trilateral sites: the Wadden Sea (Denmark, Germany and The Netherlands) and the Floodplains of the Morava-Dyje-Danube Confluence (Austria, Czechia and Slovakia). Collaboration covers river basins through multi-state management commissions, such as the Niger Basin
Authority with Benin, Burkina Faso, Cameroon, Chad, Côte d’Ivoire, Guinea, Mali, Niger and Nigeria. Management of shared species is also important, including migratory, non-migratory and invasive alien species. Examples include the East Asian–Australasian Flyway Partnership, a Ramsar Regional Initiative, and through less formal cooperation with the Western Hemisphere Shorebird Reserve Network.
Ramsar additionally has 15 networks for regional cooperation and four Ramsar Regional Centres for training and capacity building.
Ramsar | Global Wetland Outlook | 2018 13
Healthy, ecologically functioning wetlands are a key delivery mechanism for several other global commitments, including those relating to biodiversity, sustainable development, land degradation, climate change and disaster risk reduction.
2030 Sustainable Development Agenda and Sustainable Development GoalsWetlands are central to meeting many of the United Nation’s 17 Sustainable Development Goals (SDGs) and 169 associated targets, focusing on poverty, hunger, health, energy, consumption and climate change. These will set the agenda for global development efforts in the next decade. SDG 15 specifically calls for conservation and sustainable use of “inland freshwater ecosystems and their services”. SDG 14 encourages protection of coastal and marine areas. SDG 6 focuses on water and sanitation with a target relating to trends in water-related ecosystems, which will draw on data from Ramsar. Several SDGs are modelled on Aichi targets (see below) and like them will be revised after 2020.
Aichi TargetsThe “Aichi Biodiversity Targets” are part of the Strategic Plan for Biodiversity 2011-2020, from the Convention on Biological Diversity; virtually all are relevant to wetlands (Juffe-Bignoli et al. 2016). Several seek to halt ecosystem loss, including Target 5 that aims to at least halve, and ideally eliminate, loss of natural habitats by 2020, and Target 11 that aims to conserve at least 17% of terrestrial and inland water, and 10% of coastal and marine areas by 2020 in “effectively and equitably managed, ecological representative and well connected systems of protected areas and other effective area-based conservation measures”. Target 10 focuses on conservation of coral reefs, Target 6 on sustainable use of aquatic species and Target 7 on management of aquaculture (CBD 2010).
Land degradation neutralityThe UN Convention to Combat Desertification set a target for land degradation neutrality to halt the slide towards further degradation. Many forms of land degradation are linked to water management, and land degradation directly impacts wetlands such as peatlands, estuaries and rivers; these include some of the degradation hotspots around the world.
Wetlands in global policy and targets
14 Ramsar | Global Wetland Outlook | 2018
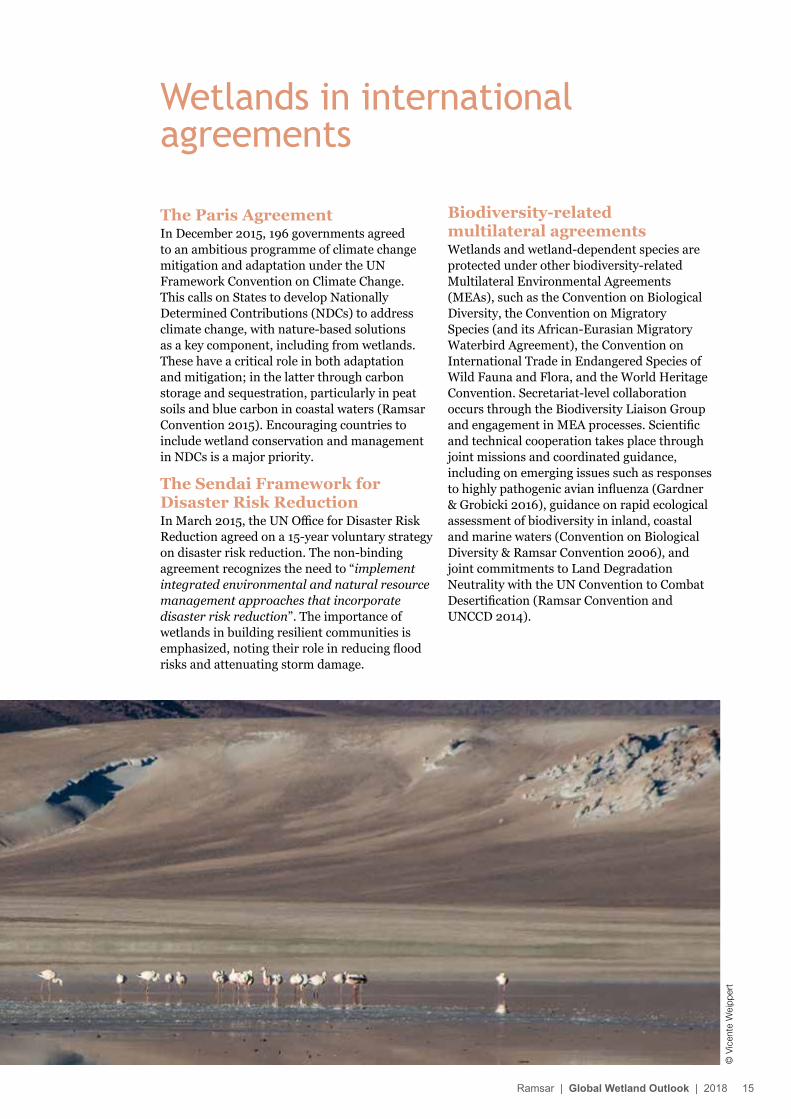
The Paris AgreementIn December 2015, 196 governments agreed to an ambitious programme of climate change mitigation and adaptation under the UN Framework Convention on Climate Change. This calls on States to develop Nationally Determined Contributions (NDCs) to address climate change, with nature-based solutions as a key component, including from wetlands. These have a critical role in both adaptation and mitigation; in the latter through carbon storage and sequestration, particularly in peat soils and blue carbon in coastal waters (Ramsar Convention 2015). Encouraging countries to include wetland conservation and management in NDCs is a major priority.
The Sendai Framework for Disaster Risk ReductionIn March 2015, the UN Office for Disaster Risk Reduction agreed on a 15-year voluntary strategy on disaster risk reduction. The non-binding agreement recognizes the need to “implement integrated environmental and natural resource management approaches that incorporate disaster risk reduction”. The importance of wetlands in building resilient communities is emphasized, noting their role in reducing flood risks and attenuating storm damage.
Biodiversity-related multilateral agreementsWetlands and wetland-dependent species are protected under other biodiversity-related Multilateral Environmental Agreements (MEAs), such as the Convention on Biological Diversity, the Convention on Migratory Species (and its African-Eurasian Migratory Waterbird Agreement), the Convention on International Trade in Endangered Species of Wild Fauna and Flora, and the World Heritage Convention. Secretariat-level collaboration occurs through the Biodiversity Liaison Group and engagement in MEA processes. Scientific and technical cooperation takes place through joint missions and coordinated guidance, including on emerging issues such as responses to highly pathogenic avian influenza (Gardner & Grobicki 2016), guidance on rapid ecological assessment of biodiversity in inland, coastal and marine waters (Convention on Biological Diversity & Ramsar Convention 2006), and joint commitments to Land Degradation Neutrality with the UN Convention to Combat Desertification (Ramsar Convention and UNCCD 2014).
Wetlands in international agreements
© V
icen
te W
eipp
ert
Ramsar | Global Wetland Outlook | 2018 15
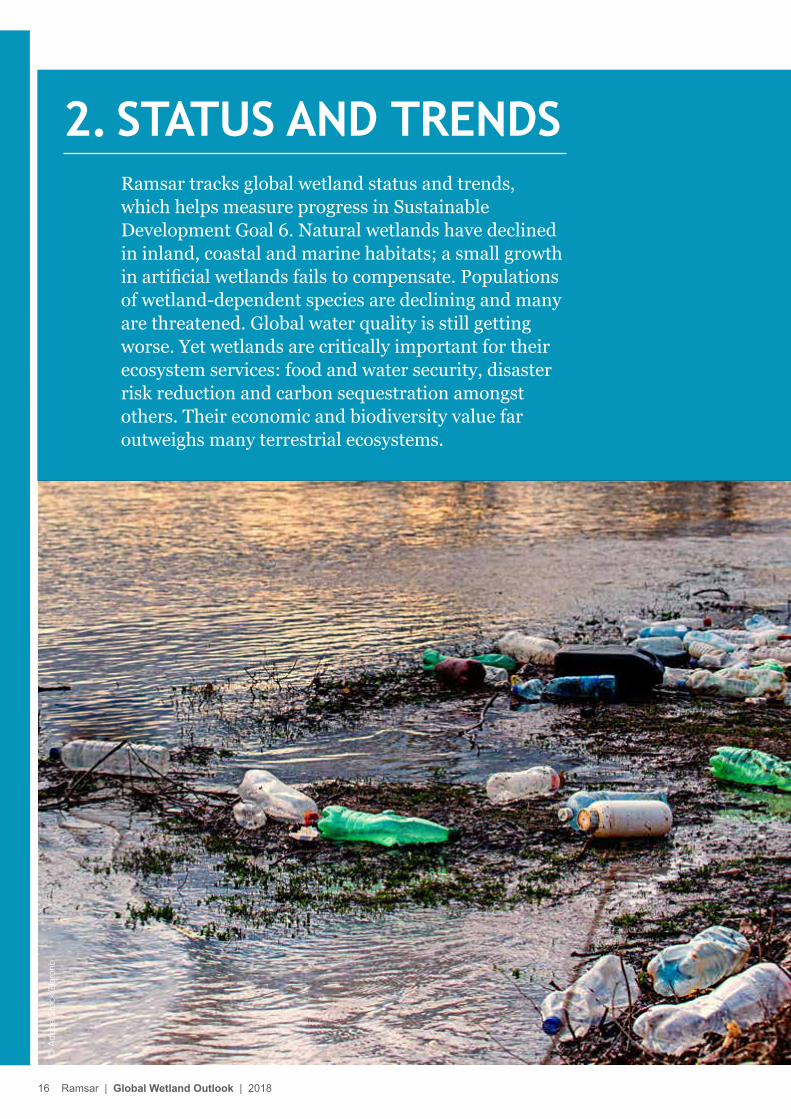
Ramsar tracks global wetland status and trends, which helps measure progress in Sustainable Development Goal 6. Natural wetlands have declined in inland, coastal and marine habitats; a small growth in artificial wetlands fails to compensate. Populations of wetland-dependent species are declining and many are threatened. Global water quality is still getting worse. Yet wetlands are critically important for their ecosystem services: food and water security, disaster risk reduction and carbon sequestration amongst others. Their economic and biodiversity value far outweighs many terrestrial ecosystems.
2. STATUS AND TRENDS
© A
dobe
Sto
ck/B
aron
b
16 Ramsar | Global Wetland Outlook | 2018
ECOLOGICAL CHARACTER OF WETLANDS (RAMSAR CONVENTION 2005)
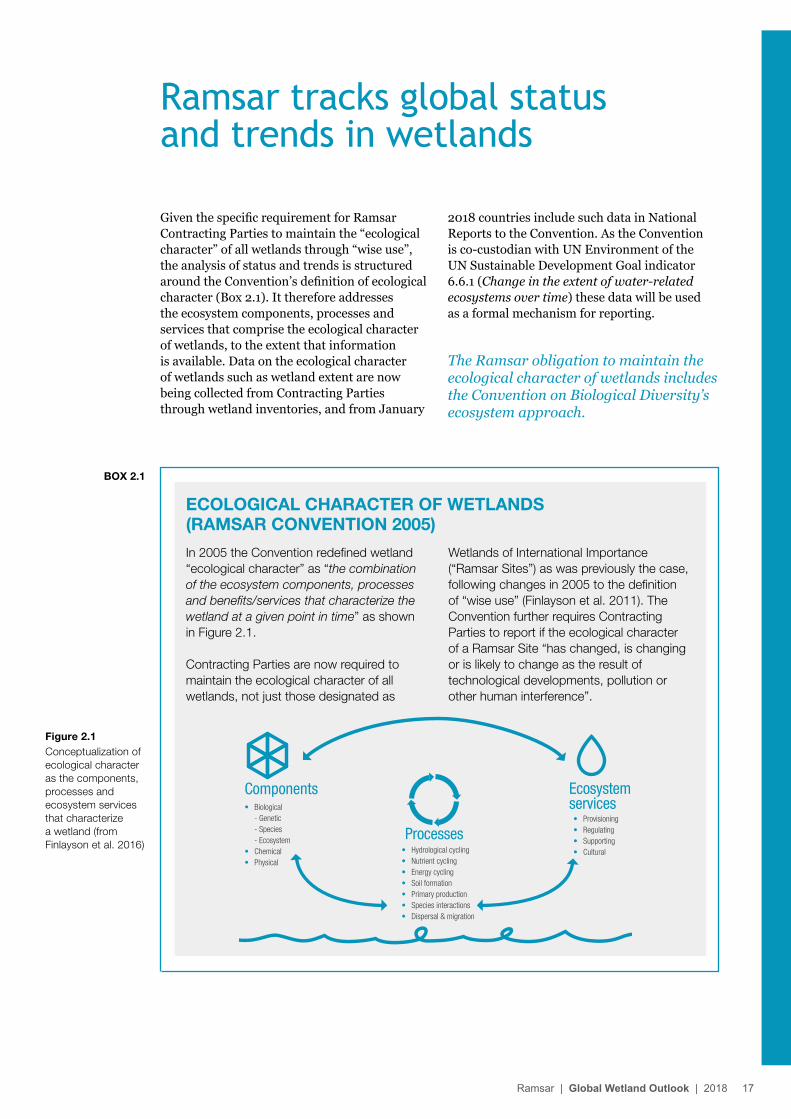
In 2005 the Convention redefined wetland “ecological character” as “the combination of the ecosystem components, processes and benefits/services that characterize the wetland at a given point in time” as shown in Figure 2.1.
Contracting Parties are now required to maintain the ecological character of all wetlands, not just those designated as
Wetlands of International Importance (“Ramsar Sites”) as was previously the case, following changes in 2005 to the definition of “wise use” (Finlayson et al. 2011). The Convention further requires Contracting Parties to report if the ecological character of a Ramsar Site “has changed, is changing or is likely to change as the result of technological developments, pollution or other human interference”.
Given the specific requirement for Ramsar Contracting Parties to maintain the “ecological character” of all wetlands through “wise use”, the analysis of status and trends is structured around the Convention’s definition of ecological character (Box 2.1). It therefore addresses the ecosystem components, processes and services that comprise the ecological character of wetlands, to the extent that information is available. Data on the ecological character of wetlands such as wetland extent are now being collected from Contracting Parties through wetland inventories, and from January
Figure 2.1Conceptualization of ecological character as the components, processes and ecosystem services that characterize a wetland (from Finlayson et al. 2016)
BOX 2.1
Ramsar tracks global status and trends in wetlands
The Ramsar obligation to maintain the ecological character of wetlands includes the Convention on Biological Diversity’s ecosystem approach.
• Provisioning• Regulating• Supporting• Cultural
Ecosystem services• Biological
- Genetic - Species - Ecosystem• Chemical• Physical
Components
• Hydrological cycling• Nutrient cycling• Energy cycling• Soil formation• Primary production• Species interactions• Dispersal & migration
Processes
2018 countries include such data in National Reports to the Convention. As the Convention is co-custodian with UN Environment of the UN Sustainable Development Goal indicator 6.6.1 (Change in the extent of water-related ecosystems over time) these data will be used as a formal mechanism for reporting.
Ramsar | Global Wetland Outlook | 2018 17
The most recent estimate of global inland and coastal wetland area is in excess of 12.1 million km2, an area almost as large as Greenland. Of this, 54% is permanently inundated and 46% seasonally inundated. An estimated further 5.2 million km2 are intermittently or occasionally inundated, but this is believed to include areas of former converted wetlands affected by extreme storm events. Around 93% of wetlands are inland systems, with 7% being marine and coastal – although this coastal estimate does not include several wetland classes such as nearshore subtidal wetlands, which also fall into the Ramsar definition. Global areas of human-made wetlands are small in comparison: reservoirs cover an estimated 0.3 million km2 and rice paddy 1.3 million km2 (Davidson et al. 2018; Davidson & Finlayson 2018).
Estimates of global wetland extent have increased considerably since the 1980s, due largely to recent improvements in remote sensing and mapping methods; this is not a reflection of any real increase in the area of wetlands (Davidson et al. 2018).
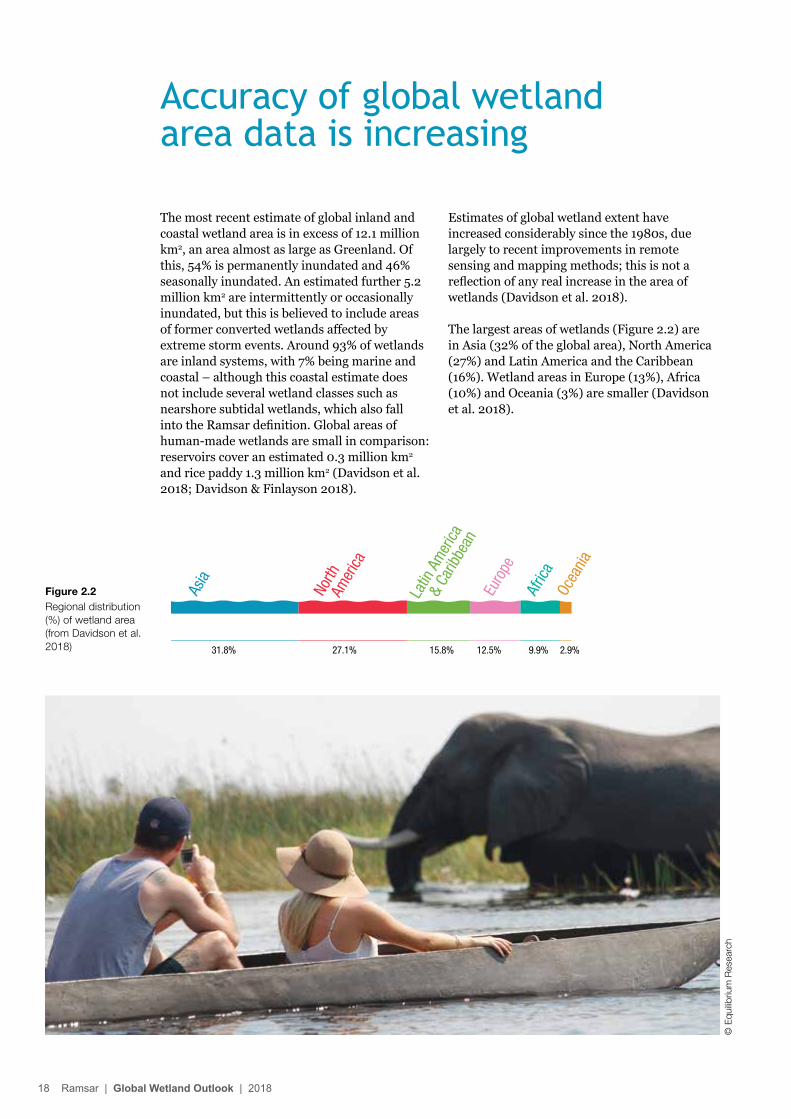
The largest areas of wetlands (Figure 2.2) are in Asia (32% of the global area), North America (27%) and Latin America and the Caribbean (16%). Wetland areas in Europe (13%), Africa (10%) and Oceania (3%) are smaller (Davidson et al. 2018).
Accuracy of global wetland area data is increasing
Figure 2.2Regional distribution (%) of wetland area (from Davidson et al. 2018)
INSERT PIC - problem
31.8% 27.1% 15.8% 12.5% 9.9% 2.9%
Asia
North
Am
erica
Latin
Am
erica
&
Carib
bean
Euro
pe
Afric
aOc
eania
© E
quilib
rium
Res
earc
h
18 Ramsar | Global Wetland Outlook | 2018
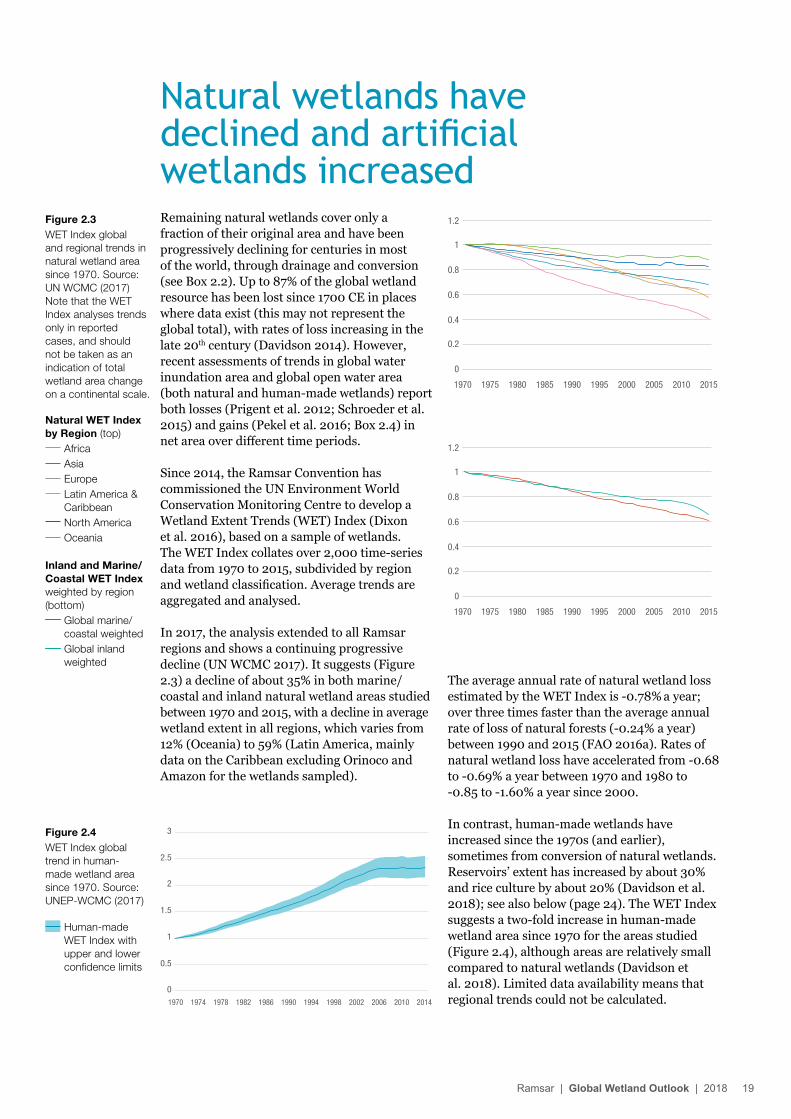
Remaining natural wetlands cover only a fraction of their original area and have been progressively declining for centuries in most of the world, through drainage and conversion (see Box 2.2). Up to 87% of the global wetland resource has been lost since 1700 CE in places where data exist (this may not represent the global total), with rates of loss increasing in the late 20th century (Davidson 2014). However, recent assessments of trends in global water inundation area and global open water area (both natural and human-made wetlands) report both losses (Prigent et al. 2012; Schroeder et al. 2015) and gains (Pekel et al. 2016; Box 2.4) in net area over different time periods.
Since 2014, the Ramsar Convention has commissioned the UN Environment World Conservation Monitoring Centre to develop a Wetland Extent Trends (WET) Index (Dixon et al. 2016), based on a sample of wetlands. The WET Index collates over 2,000 time-series data from 1970 to 2015, subdivided by region and wetland classification. Average trends are aggregated and analysed.
In 2017, the analysis extended to all Ramsar regions and shows a continuing progressive decline (UN WCMC 2017). It suggests (Figure 2.3) a decline of about 35% in both marine/coastal and inland natural wetland areas studied between 1970 and 2015, with a decline in average wetland extent in all regions, which varies from 12% (Oceania) to 59% (Latin America, mainly data on the Caribbean excluding Orinoco and Amazon for the wetlands sampled).
The average annual rate of natural wetland loss estimated by the WET Index is -0.78% a year; over three times faster than the average annual rate of loss of natural forests (-0.24% a year) between 1990 and 2015 (FAO 2016a). Rates of natural wetland loss have accelerated from -0.68 to -0.69% a year between 1970 and 1980 to -0.85 to -1.60% a year since 2000.
In contrast, human-made wetlands have increased since the 1970s (and earlier), sometimes from conversion of natural wetlands. Reservoirs’ extent has increased by about 30% and rice culture by about 20% (Davidson et al. 2018); see also below (page 24). The WET Index suggests a two-fold increase in human-made wetland area since 1970 for the areas studied (Figure 2.4), although areas are relatively small compared to natural wetlands (Davidson et al. 2018). Limited data availability means that regional trends could not be calculated.
Natural wetlands have declined and artificial wetlands increased
Figure 2.3WET Index global and regional trends in natural wetland area since 1970. Source: UN WCMC (2017) Note that the WET Index analyses trends only in reported cases, and should not be taken as an indication of total wetland area change on a continental scale.
Figure 2.4WET Index global trend in human-made wetland area since 1970. Source: UNEP-WCMC (2017)
0
0.2
0.4
0.6
0.8
1
1.2
1970 1975 1980 1985 1990 1995 2000 2005 2010 2015
0
0.2
0.4
0.6
0.8
1
1.2
1970 1975 1980 1985 1990 1995 2000 2005 2010 2015
Human-made WET Index with upper and lower confidence limits
Natural WET Index by Region (top)
Africa Asia Europe Latin America & Caribbean
North America Oceania
Inland and Marine/Coastal WET Index weighted by region (bottom)
Global marine/coastal weighted Global inland weighted
0
0.5
1
1.5
2
2.5
3
1970 1974 1978 1982 1986 1990 1994 1998 2002 2006 2010 2014
Ramsar | Global Wetland Outlook | 2018 19
Wetland change in Europe illustrates global trends
Box 2.2
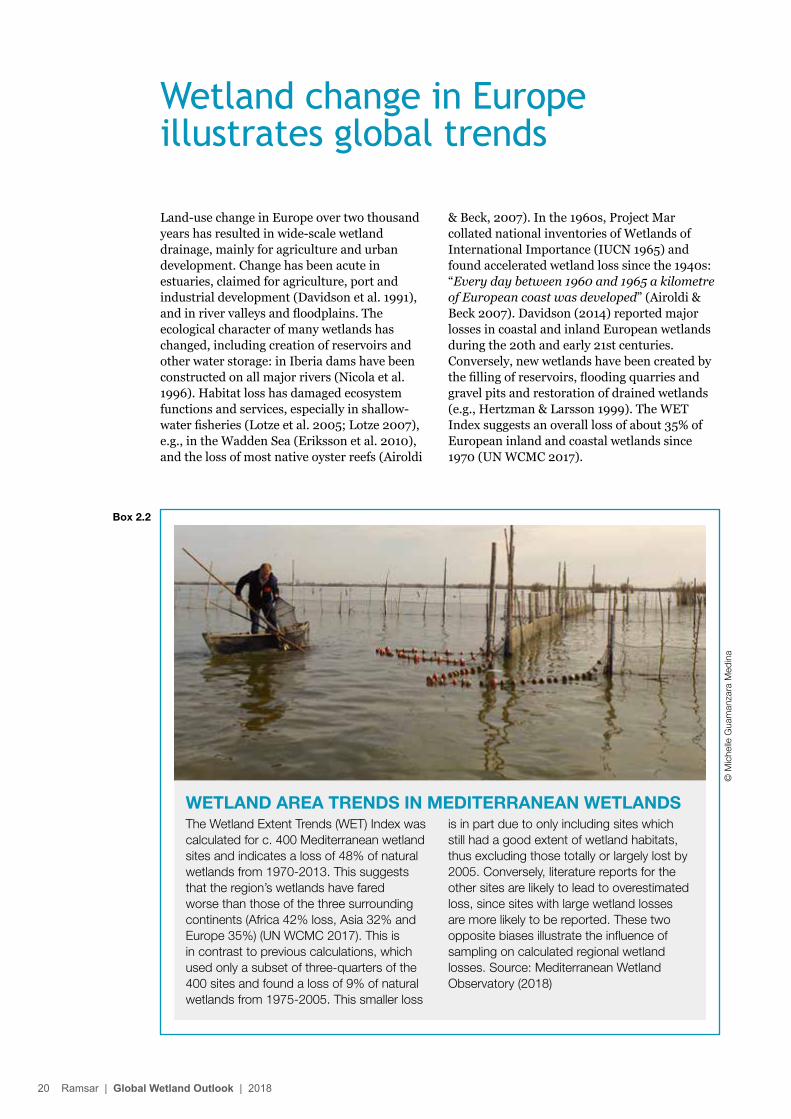
Land-use change in Europe over two thousand years has resulted in wide-scale wetland drainage, mainly for agriculture and urban development. Change has been acute in estuaries, claimed for agriculture, port and industrial development (Davidson et al. 1991), and in river valleys and floodplains. The ecological character of many wetlands has changed, including creation of reservoirs and other water storage: in Iberia dams have been constructed on all major rivers (Nicola et al. 1996). Habitat loss has damaged ecosystem functions and services, especially in shallow-water fisheries (Lotze et al. 2005; Lotze 2007), e.g., in the Wadden Sea (Eriksson et al. 2010), and the loss of most native oyster reefs (Airoldi
& Beck, 2007). In the 1960s, Project Mar collated national inventories of Wetlands of International Importance (IUCN 1965) and found accelerated wetland loss since the 1940s: “Every day between 1960 and 1965 a kilometre of European coast was developed” (Airoldi & Beck 2007). Davidson (2014) reported major losses in coastal and inland European wetlands during the 20th and early 21st centuries. Conversely, new wetlands have been created by the filling of reservoirs, flooding quarries and gravel pits and restoration of drained wetlands (e.g., Hertzman & Larsson 1999). The WET Index suggests an overall loss of about 35% of European inland and coastal wetlands since 1970 (UN WCMC 2017).
WETLAND AREA TRENDS IN MEDITERRANEAN WETLANDSThe Wetland Extent Trends (WET) Index was calculated for c. 400 Mediterranean wetland sites and indicates a loss of 48% of natural wetlands from 1970-2013. This suggests that the region’s wetlands have fared worse than those of the three surrounding continents (Africa 42% loss, Asia 32% and Europe 35%) (UN WCMC 2017). This is in contrast to previous calculations, which used only a subset of three-quarters of the 400 sites and found a loss of 9% of natural wetlands from 1975-2005. This smaller loss
is in part due to only including sites which still had a good extent of wetland habitats, thus excluding those totally or largely lost by 2005. Conversely, literature reports for the other sites are likely to lead to overestimated loss, since sites with large wetland losses are more likely to be reported. These two opposite biases illustrate the influence of sampling on calculated regional wetland losses. Source: Mediterranean Wetland Observatory (2018)
© M
iche
lle G
uam
anza
ra M
edin
a
20 Ramsar | Global Wetland Outlook | 2018
TRENDS IN GLOBAL SURFACE WATER AREABetween 1984 and 2015 there was an estimated loss of almost 0.09 million km2 of permanent surface water (fresh and saline) (2% of global water area measured). This loss was offset by 0.21 million km2 of new permanent water bodies, of which 0.03 million km2 changed from seasonally to permanently flooded and 0.18 million km2 of
permanent water formed in areas previously devoid of surface water. All continental regions show a net increase in permanent water, except Oceania, which had a fractional (1%) net loss (Pekel et al. 2016). These data need to be interpreted in relation to the time period assessed, taking into account extreme events such as drought and floods.
Data on the extent, distribution and trends of wetland types are still incomplete, although national reporting on extent by Ramsar Contracting Parties to the thirteenth Ramsar Conference of Parties provides preliminary national data. Further reporting will soon provide national data that can be aggregated at regional and global levels as well as on Ramsar Classification of Wetlands, Inland, Marine and Coastal and Human Made Wetlands. Through this mechanism, national validated data on an accepted international definition of wetlands will be provided to measure SDG indicator 6.6.1 on extent of water related ecosystems. Multiple sources of information about different wetland types are presented from Davidson and Finlayson (2018); however separate information is not available for all 42 wetland types in the Ramsar classification. Generalized wetland classes are therefore used in the descriptions below (see Tables 2.1-2.3).
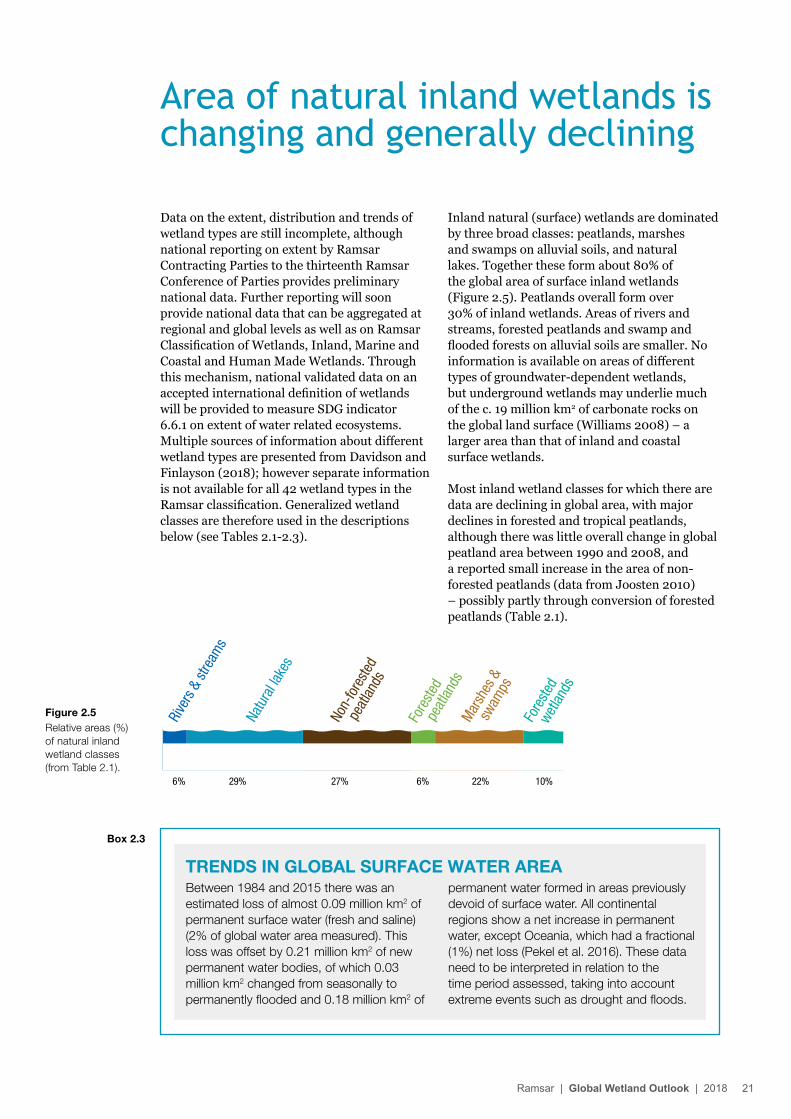
Inland natural (surface) wetlands are dominated by three broad classes: peatlands, marshes and swamps on alluvial soils, and natural lakes. Together these form about 80% of the global area of surface inland wetlands (Figure 2.5). Peatlands overall form over 30% of inland wetlands. Areas of rivers and streams, forested peatlands and swamp and flooded forests on alluvial soils are smaller. No information is available on areas of different types of groundwater-dependent wetlands, but underground wetlands may underlie much of the c. 19 million km2 of carbonate rocks on the global land surface (Williams 2008) – a larger area than that of inland and coastal surface wetlands.
Most inland wetland classes for which there are data are declining in global area, with major declines in forested and tropical peatlands, although there was little overall change in global peatland area between 1990 and 2008, and a reported small increase in the area of non-forested peatlands (data from Joosten 2010) – possibly partly through conversion of forested peatlands (Table 2.1).
Area of natural inland wetlands is changing and generally declining
Box 2.3
Figure 2.5Relative areas (%) of natural inland wetland classes (from Table 2.1).
6% 29% 27% 6% 22% 10%
Rive
rs &
stre
ams
Natu
ral la
kes
Non-
fore
sted
pe
atlan
ds
Mar
shes
&
sw
amps
Fore
sted
wet
lands
Fore
sted
pe
atlan
ds
Ramsar | Global Wetland Outlook | 2018 21
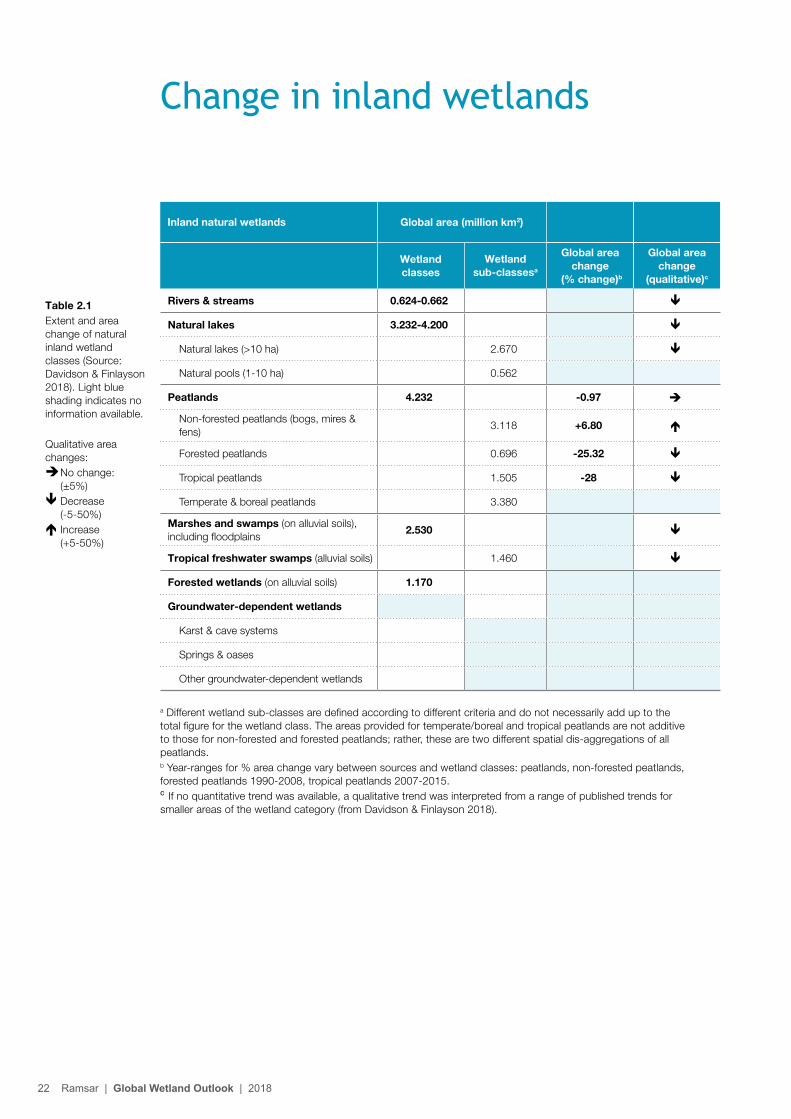
Table 2.1Extent and area change of natural inland wetland classes (Source: Davidson & Finlayson 2018). Light blue shading indicates no information available.
Qualitative area changes: èNo change:
(±5%) êDecrease
(-5-50%)éIncrease
(+5-50%)
Change in inland wetlands
Inland natural wetlands Global area (million km2)
Wetland classes
Wetland sub‑classesa
Global area change
(% change)b
Global area change
(qualitative)c
Rivers & streams 0.624‑0.662 ê
Natural lakes 3.232‑4.200 ê
Natural lakes (>10 ha) 2.670 ê
Natural pools (1-10 ha) 0.562
Peatlands 4.232 ‑0.97 è
Non-forested peatlands (bogs, mires & fens)
3.118 +6.80 é
Forested peatlands 0.696 ‑25.32 ê
Tropical peatlands 1.505 ‑28 ê
Temperate & boreal peatlands 3.380
Marshes and swamps (on alluvial soils), including floodplains
2.530 ê
Tropical freshwater swamps (alluvial soils) 1.460 ê
Forested wetlands (on alluvial soils) 1.170
Groundwater‑dependent wetlands
Karst & cave systems
Springs & oases
Other groundwater-dependent wetlands
a Different wetland sub-classes are defined according to different criteria and do not necessarily add up to the total figure for the wetland class. The areas provided for temperate/boreal and tropical peatlands are not additive to those for non-forested and forested peatlands; rather, these are two different spatial dis-aggregations of all peatlands.b Year-ranges for % area change vary between sources and wetland classes: peatlands, non-forested peatlands, forested peatlands 1990-2008, tropical peatlands 2007-2015.c If no quantitative trend was available, a qualitative trend was interpreted from a range of published trends for smaller areas of the wetland category (from Davidson & Finlayson 2018).
22 Ramsar | Global Wetland Outlook | 2018
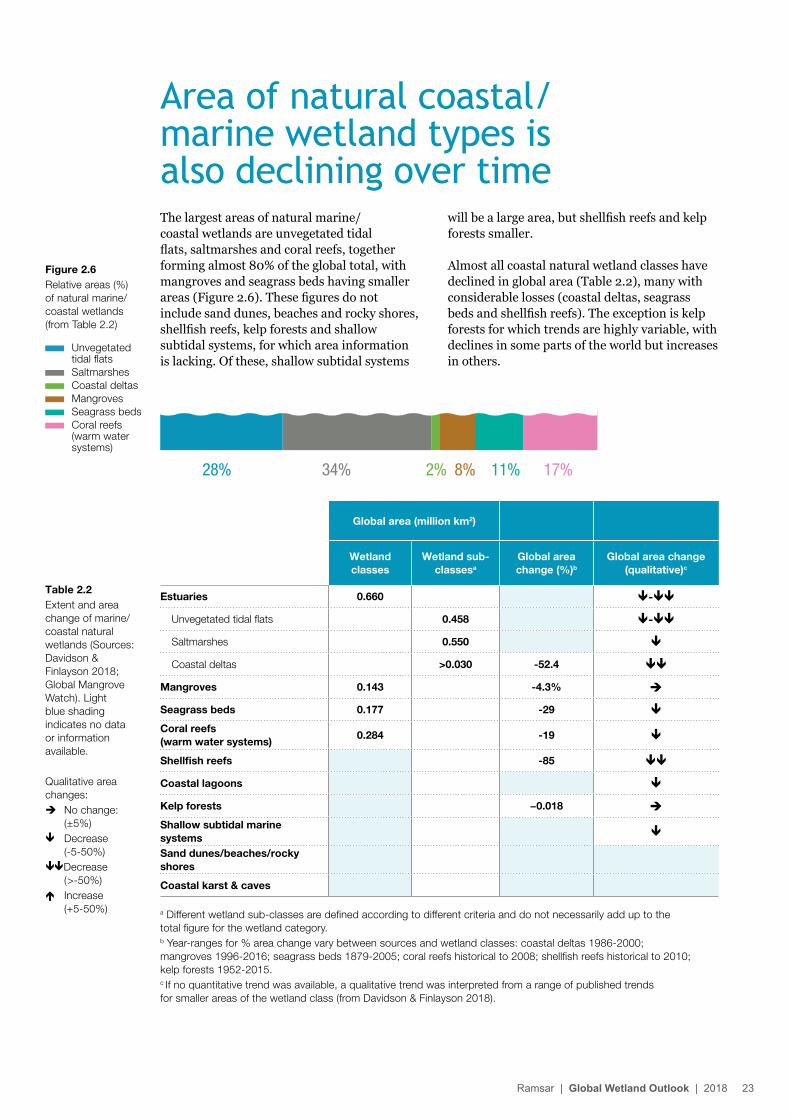
The largest areas of natural marine/coastal wetlands are unvegetated tidal flats, saltmarshes and coral reefs, together forming almost 80% of the global total, with mangroves and seagrass beds having smaller areas (Figure 2.6). These figures do not include sand dunes, beaches and rocky shores, shellfish reefs, kelp forests and shallow subtidal systems, for which area information is lacking. Of these, shallow subtidal systems
will be a large area, but shellfish reefs and kelp forests smaller.
Almost all coastal natural wetland classes have declined in global area (Table 2.2), many with considerable losses (coastal deltas, seagrass beds and shellfish reefs). The exception is kelp forests for which trends are highly variable, with declines in some parts of the world but increases in others.
Area of natural coastal/marine wetland types is also declining over time
Figure 2.6Relative areas (%) of natural marine/coastal wetlands (from Table 2.2)
Global area (million km2)
Wetland classes
Wetland sub‑classesa
Global area change (%)b
Global area change (qualitative)c
Estuaries 0.660 ê‑êê
Unvegetated tidal flats 0.458 ê‑êê
Saltmarshes 0.550 ê
Coastal deltas >0.030 ‑52.4 êê
Mangroves 0.143 ‑4.3% è
Seagrass beds 0.177 ‑29 ê
Coral reefs (warm water systems)
0.284 ‑19 ê
Shellfish reefs ‑85 êê
Coastal lagoons ê
Kelp forests −0.018 è
Shallow subtidal marine systems ê
Sand dunes/beaches/rocky shores
Coastal karst & caves
a Different wetland sub-classes are defined according to different criteria and do not necessarily add up to the total figure for the wetland category.b Year-ranges for % area change vary between sources and wetland classes: coastal deltas 1986-2000; mangroves 1996-2016; seagrass beds 1879-2005; coral reefs historical to 2008; shellfish reefs historical to 2010; kelp forests 1952-2015. c If no quantitative trend was available, a qualitative trend was interpreted from a range of published trends for smaller areas of the wetland class (from Davidson & Finlayson 2018).
Table 2.2Extent and area change of marine/coastal natural wetlands (Sources: Davidson & Finlayson 2018; Global Mangrove Watch). Light blue shading indicates no data or information available.
Qualitative area changes: èNo change:
(±5%) êDecrease
(-5-50%)êêDecrease
(>-50%)éIncrease
(+5-50%)
28% 34% 2% 8% 11% 17%
Unvegetated tidal flats
Saltmarshes Coastal deltas Mangroves Seagrass beds Coral reefs
(warm water systems)
Ramsar | Global Wetland Outlook | 2018 23
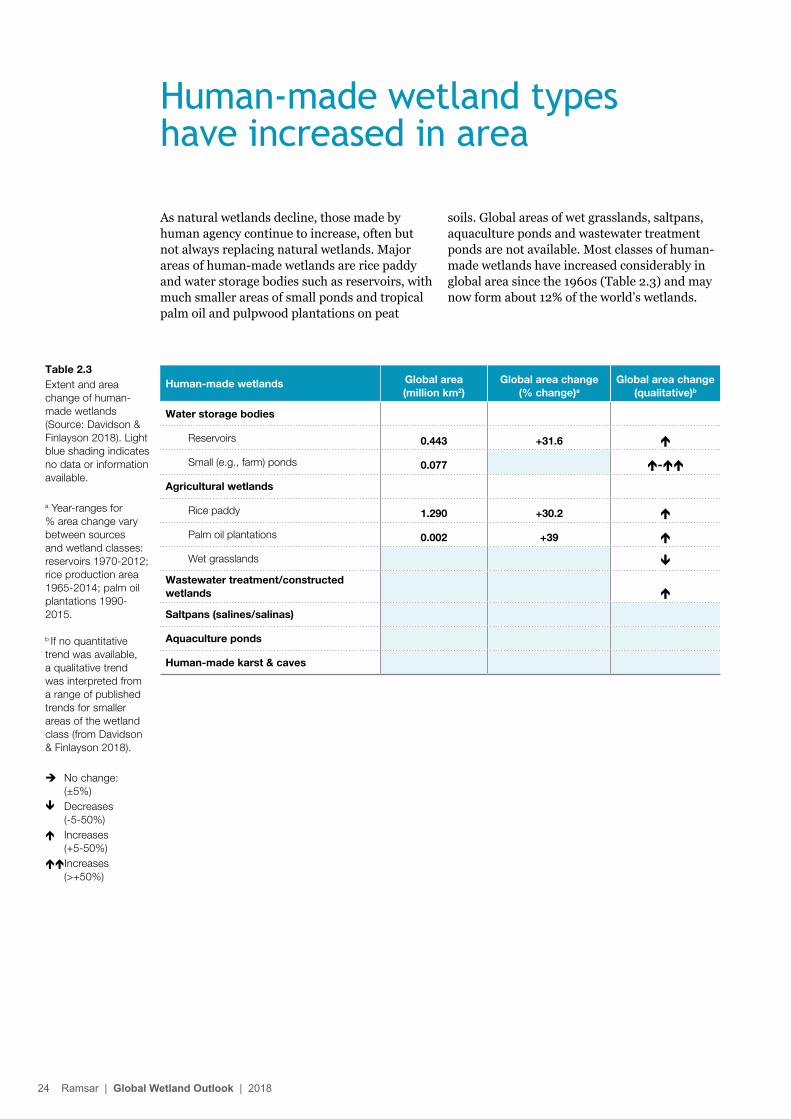
Human‑made wetlands Global area (million km2)
Global area change (% change)a
Global area change (qualitative)b
Water storage bodies
Reservoirs 0.443 +31.6 é
Small (e.g., farm) ponds 0.077 é‑éé
Agricultural wetlands
Rice paddy 1.290 +30.2 é
Palm oil plantations 0.002 +39 é
Wet grasslands ê
Wastewater treatment/constructed wetlands é
Saltpans (salines/salinas)
Aquaculture ponds
Human‑made karst & caves
Human-made wetland types have increased in area
Table 2.3Extent and area change of human-made wetlands (Source: Davidson & Finlayson 2018). Light blue shading indicates no data or information available.
a Year-ranges for % area change vary between sources and wetland classes: reservoirs 1970-2012; rice production area 1965-2014; palm oil plantations 1990-2015.
As natural wetlands decline, those made by human agency continue to increase, often but not always replacing natural wetlands. Major areas of human-made wetlands are rice paddy and water storage bodies such as reservoirs, with much smaller areas of small ponds and tropical palm oil and pulpwood plantations on peat
soils. Global areas of wet grasslands, saltpans, aquaculture ponds and wastewater treatment ponds are not available. Most classes of human-made wetlands have increased considerably in global area since the 1960s (Table 2.3) and may now form about 12% of the world’s wetlands.
b If no quantitative trend was available, a qualitative trend was interpreted from a range of published trends for smaller areas of the wetland class (from Davidson & Finlayson 2018).
èNo change: (±5%)
êDecreases (-5-50%)
éIncreases (+5-50%)
ééIncreases (>+50%)
24 Ramsar | Global Wetland Outlook | 2018
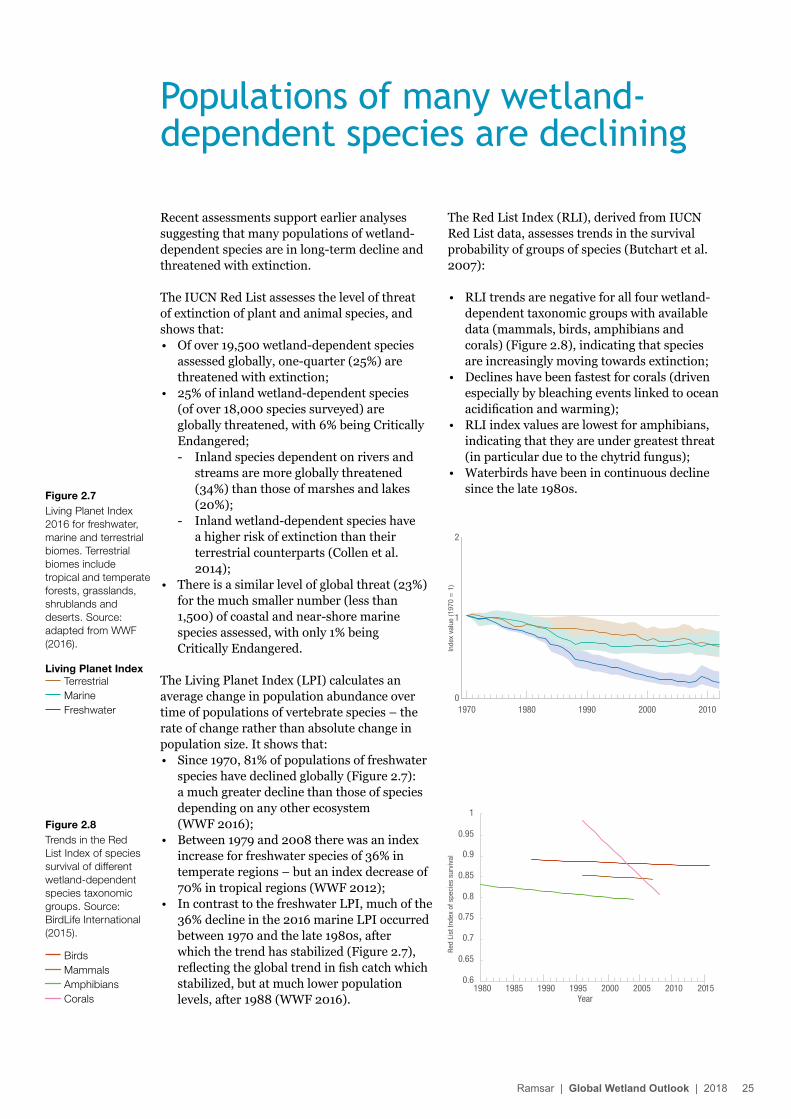
Recent assessments support earlier analyses suggesting that many populations of wetland-dependent species are in long-term decline and threatened with extinction.
The IUCN Red List assesses the level of threat of extinction of plant and animal species, and shows that:• Of over 19,500 wetland-dependent species
assessed globally, one-quarter (25%) are threatened with extinction;
• 25% of inland wetland-dependent species (of over 18,000 species surveyed) are globally threatened, with 6% being Critically Endangered;- Inland species dependent on rivers and
streams are more globally threatened (34%) than those of marshes and lakes (20%);
- Inland wetland-dependent species have a higher risk of extinction than their terrestrial counterparts (Collen et al. 2014);
• There is a similar level of global threat (23%) for the much smaller number (less than 1,500) of coastal and near-shore marine species assessed, with only 1% being Critically Endangered.
The Living Planet Index (LPI) calculates an average change in population abundance over time of populations of vertebrate species – the rate of change rather than absolute change in population size. It shows that: • Since 1970, 81% of populations of freshwater
species have declined globally (Figure 2.7): a much greater decline than those of species depending on any other ecosystem (WWF 2016);
• Between 1979 and 2008 there was an index increase for freshwater species of 36% in temperate regions – but an index decrease of 70% in tropical regions (WWF 2012);
• In contrast to the freshwater LPI, much of the 36% decline in the 2016 marine LPI occurred between 1970 and the late 1980s, after which the trend has stabilized (Figure 2.7), reflecting the global trend in fish catch which stabilized, but at much lower population levels, after 1988 (WWF 2016).
The Red List Index (RLI), derived from IUCN Red List data, assesses trends in the survival probability of groups of species (Butchart et al. 2007):
• RLI trends are negative for all four wetland-dependent taxonomic groups with available data (mammals, birds, amphibians and corals) (Figure 2.8), indicating that species are increasingly moving towards extinction;
• Declines have been fastest for corals (driven especially by bleaching events linked to ocean acidification and warming);
• RLI index values are lowest for amphibians, indicating that they are under greatest threat (in particular due to the chytrid fungus);
• Waterbirds have been in continuous decline since the late 1980s.
Populations of many wetland-dependent species are declining
Figure 2.7Living Planet Index 2016 for freshwater, marine and terrestrial biomes. Terrestrial biomes include tropical and temperate forests, grasslands, shrublands and deserts. Source: adapted from WWF (2016).
Figure 2.8Trends in the Red List Index of species survival of different wetland-dependent species taxonomic groups. Source: BirdLife International (2015).
0
1
2
1970 1980 1990 2000 2010
Inde
x va
lue
(197
0 =
1)
Living Planet Index Terrestrial Marine Freshwater
Birds Mammals Amphibians Corals
0.6
0.65
0.7
0.75
0.8
0.85
0.9
0.95
1
1980 1985 1990 1995 2000 2005 2010 2015
Red
Lis
t Ind
ex o
f spe
cies
sur
viva
l
Year
Ramsar | Global Wetland Outlook | 2018 25
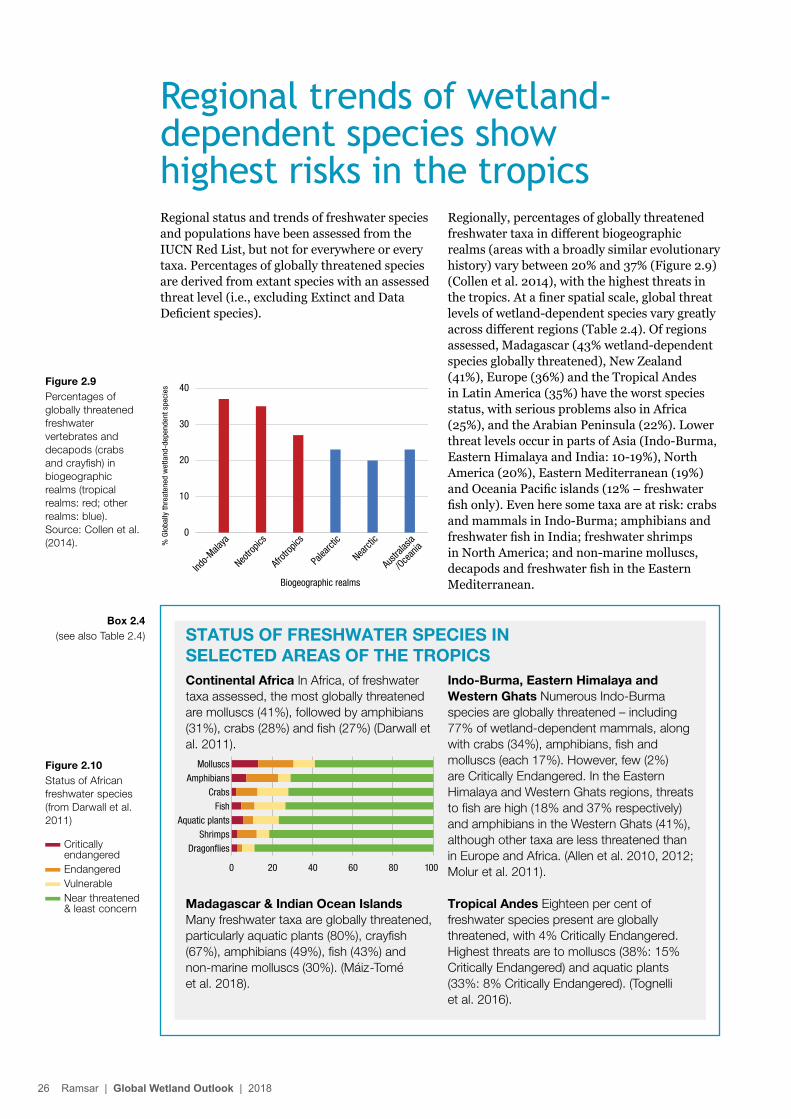
Regional status and trends of freshwater species and populations have been assessed from the IUCN Red List, but not for everywhere or every taxa. Percentages of globally threatened species are derived from extant species with an assessed threat level (i.e., excluding Extinct and Data Deficient species).
Regional trends of wetland-dependent species show highest risks in the tropics
Figure 2.9Percentages of globally threatened freshwater vertebrates and decapods (crabs and crayfish) in biogeographic realms (tropical realms: red; other realms: blue). Source: Collen et al. (2014).
0
10
20
30
40
Indo-M
alaya
Neotro
pics
Afrotr
opics
Palea
rctic
Nearct
ic
Austr
alasia
/Oce
ania%
Glo
bally
thre
aten
ed w
etla
nd-d
epen
dent
spe
cies
Biogeographic realms
Box 2.4 (see also Table 2.4)
Regionally, percentages of globally threatened freshwater taxa in different biogeographic realms (areas with a broadly similar evolutionary history) vary between 20% and 37% (Figure 2.9) (Collen et al. 2014), with the highest threats in the tropics. At a finer spatial scale, global threat levels of wetland-dependent species vary greatly across different regions (Table 2.4). Of regions assessed, Madagascar (43% wetland-dependent species globally threatened), New Zealand (41%), Europe (36%) and the Tropical Andes in Latin America (35%) have the worst species status, with serious problems also in Africa (25%), and the Arabian Peninsula (22%). Lower threat levels occur in parts of Asia (Indo-Burma, Eastern Himalaya and India: 10-19%), North America (20%), Eastern Mediterranean (19%) and Oceania Pacific islands (12% – freshwater fish only). Even here some taxa are at risk: crabs and mammals in Indo-Burma; amphibians and freshwater fish in India; freshwater shrimps in North America; and non-marine molluscs, decapods and freshwater fish in the Eastern Mediterranean.
Figure 2.10Status of African freshwater species (from Darwall et al. 2011)
STATUS OF FRESHWATER SPECIES IN SELECTED AREAS OF THE TROPICSContinental Africa In Africa, of freshwater taxa assessed, the most globally threatened are molluscs (41%), followed by amphibians (31%), crabs (28%) and fish (27%) (Darwall et al. 2011).
Madagascar & Indian Ocean Islands Many freshwater taxa are globally threatened, particularly aquatic plants (80%), crayfish (67%), amphibians (49%), fish (43%) and non-marine molluscs (30%). (Máiz-Tomé et al. 2018).
Indo‑Burma, Eastern Himalaya and Western Ghats Numerous Indo-Burma species are globally threatened – including 77% of wetland-dependent mammals, along with crabs (34%), amphibians, fish and molluscs (each 17%). However, few (2%) are Critically Endangered. In the Eastern Himalaya and Western Ghats regions, threats to fish are high (18% and 37% respectively) and amphibians in the Western Ghats (41%), although other taxa are less threatened than in Europe and Africa. (Allen et al. 2010, 2012; Molur et al. 2011).
Tropical Andes Eighteen per cent of freshwater species present are globally threatened, with 4% Critically Endangered. Highest threats are to molluscs (38%: 15% Critically Endangered) and aquatic plants (33%: 8% Critically Endangered). (Tognelli et al. 2016).
0 20 40 60 80 100
DragonfliesShrimps
Aquatic plantsFish
Crabs
MolluscsAmphibians
Critically endangered
Endangered
Vulnerable
Near threatened & least concern
26 Ramsar | Global Wetland Outlook | 2018
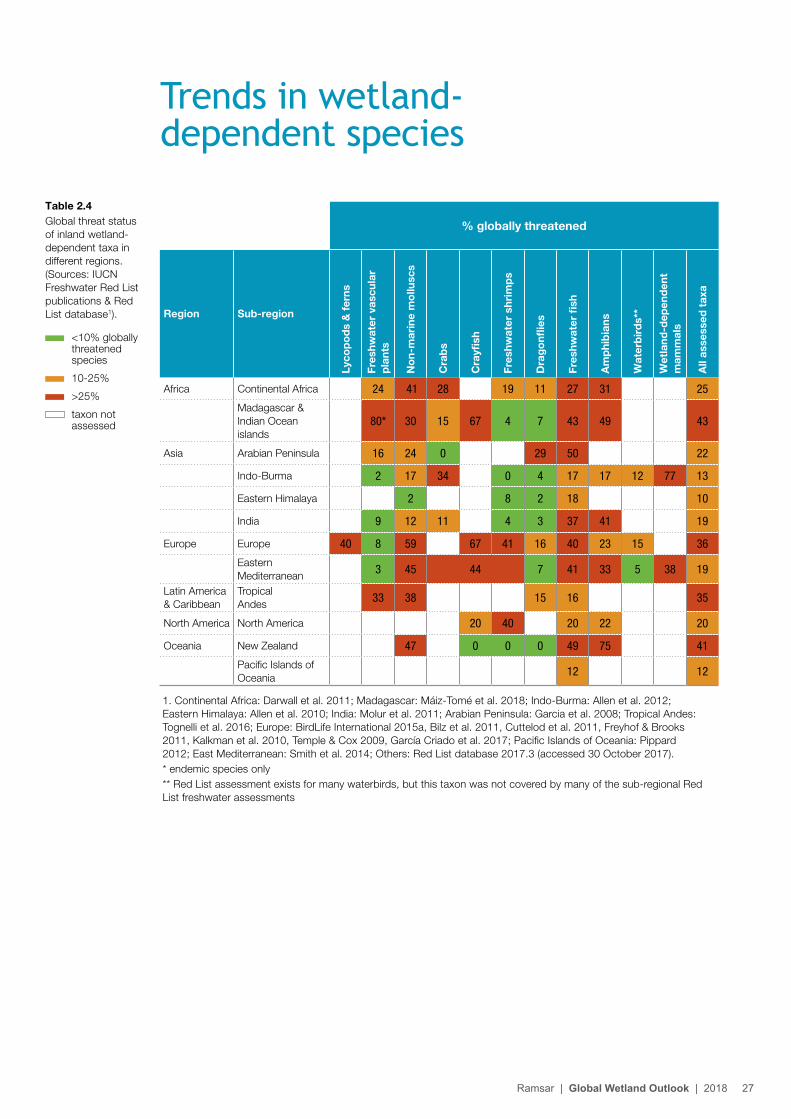
Trends in wetland- dependent species
1. Continental Africa: Darwall et al. 2011; Madagascar: Máiz-Tomé et al. 2018; Indo-Burma: Allen et al. 2012; Eastern Himalaya: Allen et al. 2010; India: Molur et al. 2011; Arabian Peninsula: Garcia et al. 2008; Tropical Andes: Tognelli et al. 2016; Europe: BirdLife International 2015a, Bilz et al. 2011, Cuttelod et al. 2011, Freyhof & Brooks 2011, Kalkman et al. 2010, Temple & Cox 2009, García Criado et al. 2017; Pacific Islands of Oceania: Pippard 2012; East Mediterranean: Smith et al. 2014; Others: Red List database 2017.3 (accessed 30 October 2017).* endemic species only** Red List assessment exists for many waterbirds, but this taxon was not covered by many of the sub-regional Red List freshwater assessments
Table 2.4Global threat status of inland wetland-dependent taxa in different regions. (Sources: IUCN Freshwater Red List publications & Red List database1).
% globally threatened
Region Sub‑region
Lyco
po
ds
& f
erns
Fres
hwat
er v
ascu
lar
pla
nts
No
n‑m
arin
e m
ollu
scs
Cra
bs
Cra
yfish
Fres
hwat
er s
hrim
ps
Dra
go
nflie
s
Fres
hwat
er fi
sh
Am
phi
bia
ns
Wat
erb
ird
s**
Wet
land
‑dep
end
ent
mam
mal
s
All
asse
ssed
tax
a
Africa Continental Africa 24 41 28 19 11 27 31 25
Madagascar & Indian Ocean islands
80* 30 15 67 4 7 43 49 43
Asia Arabian Peninsula 16 24 0 29 50 22
Indo-Burma 2 17 34 0 4 17 17 12 77 13
Eastern Himalaya 2 8 2 18 10
India 9 12 11 4 3 37 41 19
Europe Europe 40 8 59 67 41 16 40 23 15 36
Eastern Mediterranean 3 45 44 7 41 33 5 38 19
Latin America & Caribbean
Tropical Andes 33 38 15 16 35
North America North America 20 40 20 22 20
Oceania New Zealand 47 0 0 0 49 75 41
Pacific Islands of Oceania 12 12
<10% globally threatened species
10-25%
>25%
taxon not assessed
Ramsar | Global Wetland Outlook | 2018 27
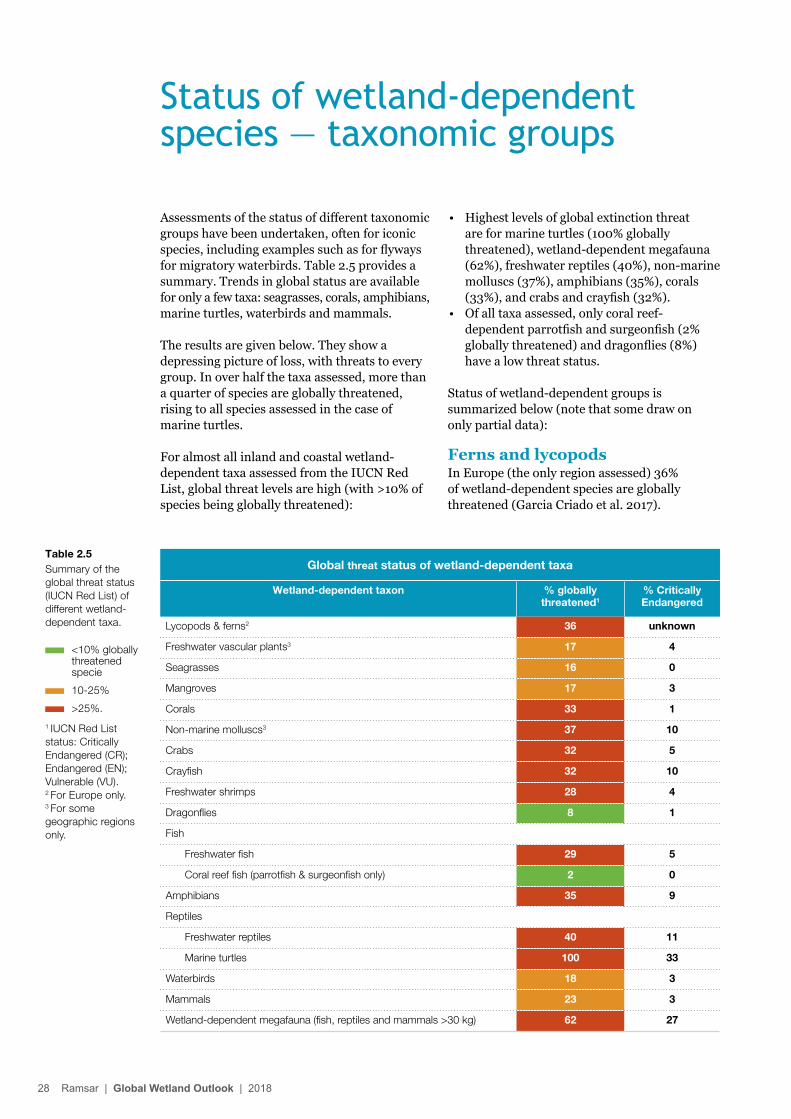
Assessments of the status of different taxonomic groups have been undertaken, often for iconic species, including examples such as for flyways for migratory waterbirds. Table 2.5 provides a summary. Trends in global status are available for only a few taxa: seagrasses, corals, amphibians, marine turtles, waterbirds and mammals.
The results are given below. They show a depressing picture of loss, with threats to every group. In over half the taxa assessed, more than a quarter of species are globally threatened, rising to all species assessed in the case of marine turtles.
For almost all inland and coastal wetland-dependent taxa assessed from the IUCN Red List, global threat levels are high (with >10% of species being globally threatened):
Status of wetland-dependent species — taxonomic groups
Table 2.5Summary of the global threat status (IUCN Red List) of different wetland-dependent taxa.
Global threat status of wetland‑dependent taxa
Wetland‑dependent taxon % globally threatened1
% Critically Endangered
Lycopods & ferns2 36 unknown
Freshwater vascular plants3 17 4
Seagrasses 16 0
Mangroves 17 3
Corals 33 1
Non-marine molluscs3 37 10
Crabs 32 5
Crayfish 32 10
Freshwater shrimps 28 4
Dragonflies 8 1
Fish
Freshwater fish 29 5
Coral reef fish (parrotfish & surgeonfish only) 2 0
Amphibians 35 9
Reptiles
Freshwater reptiles 40 11
Marine turtles 100 33
Waterbirds 18 3
Mammals 23 3
Wetland-dependent megafauna (fish, reptiles and mammals >30 kg) 62 27
<10% globally threatened specie
10-25%
>25%.
1 IUCN Red List status: Critically Endangered (CR); Endangered (EN); Vulnerable (VU). 2 For Europe only. 3 For some geographic regions only.
• Highest levels of global extinction threat are for marine turtles (100% globally threatened), wetland-dependent megafauna (62%), freshwater reptiles (40%), non-marine molluscs (37%), amphibians (35%), corals (33%), and crabs and crayfish (32%).
• Of all taxa assessed, only coral reef-dependent parrotfish and surgeonfish (2% globally threatened) and dragonflies (8%) have a low threat status.
Status of wetland-dependent groups is summarized below (note that some draw on only partial data):
Ferns and lycopodsIn Europe (the only region assessed) 36% of wetland-dependent species are globally threatened (Garcia Criado et al. 2017).
28 Ramsar | Global Wetland Outlook | 2018
Freshwater vascular plantsOverall Red List threat status is relatively low (17% globally threatened), but varies considerably, from 2% (Indo-Burma) to 24% in Africa and 33% in the tropical Andes.
SeagrassesOf 72 species, 31% are decreasing with only 7% increasing. Ten (16%) are at elevated risk of extinction, with three Endangered (Short et al. 2011).
MangrovesEleven (17%) of 66 species assessed are globally threatened (Polidoro et al. 2010). Particular areas of concern are the Atlantic and Pacific coasts of Central America, with up to 40% of species threatened with extinction.
Corals33% of 704 species assessed are globally threatened (Carpenter et al. 2008). Regionally the Caribbean and the Coral Triangle (western Pacific) have the highest proportions of corals of high extinction risk. Global threat status worsened by -17.8% between 1996 and 2008 (BirdLife International 2015).
Non-marine molluscsGlobal threat status is high, at 37%, rising to 59% in Europe, 45% in the Eastern Mediterranean, 41% in Africa and 38% in the tropical Andes (Cuttelod et al. 2011).
Crabs 32% are globally threatened, with 5% Critically Endangered (Collen et al. 2014). Threat levels are high in Africa and Indo-Burma.
Freshwater crayfish32% are globally threatened, with 10% Critically Endangered (Richman et al. 2015).
Freshwater shrimps28% of 479 species are globally threatened, with 4% Critically Endangered. The highest threat levels are in the Nearctic (46% globally threatened from only a small number of species), Palearctic (32%) and Indo-Malayan (30%) (De Grave et al. 2015). Regionally, European (41%) and North American (40%) shrimps have high threat status (Table 2.4).
DragonfliesThe only insect group whose global status has been assessed (Clausnitzer et al. 2009). Only 8% are threatened, a low level of threat compared to other wetland-dependent taxa. For 1,968 species assessed regionally there is also low average threat level (8%), with 1.5% Critically Endangered.
Freshwater fishOf 8,389 species assessed, 29% are globally threatened, with 5% Critically Endangered. Threat levels are highest in the Arabian Peninsula (50%), New Zealand (49%), Madagascar (43%), the Eastern Mediterranean (41%) and Europe (40%).
Parrotfish and surgeonfishMost of the 160 species of these coral reef fish are widespread and of Least Concern status, with only three (2%) being globally threatened (Comeros-Raynal et al. 2012).
AmphibiansWetland-dependent amphibians are amongst the most globally threatened of the freshwater taxa assessed, due particularly to the impacts of chytrid fungus, with 35% globally threatened, of which 9% are Critically Endangered (Stuart et al. 2004; Red List database 2017). There are high levels of threat in New Zealand (75%), Madagascar (49%), India (41%) and Eastern Mediterranean (33%). Amphibians depending on rivers and streams are more globally threatened than those of static waters (Stuart et al. 2004). The global status has deteriorated by -4.3% between 1980 and 2004 (BirdLife International 2015).
ReptilesAlso one of the most threatened taxa, with 40% of species globally threatened, and 11% Critically Endangered (Collen et al. 2014). Of the seven marine turtle species all six assessed are globally threatened: two Vulnerable (Leatherback and Olive Ridley), two Endangered (Loggerhead and Green) and two Critically Endangered (Hawksbill and Kemp’s Ridley) (IUCN-SSC Marine Turtle Specialist Group). Recent assessments indicate population increases in some populations of six of the seven species, but with continued decreasing trends in the western Pacific (Mazaris et al. 2017).
Global threat status of wetland‑dependent taxa
Wetland‑dependent taxon % globally threatened1
% Critically Endangered
Lycopods & ferns2 36 unknown
Freshwater vascular plants3 17 4
Seagrasses 16 0
Mangroves 17 3
Corals 33 1
Non-marine molluscs3 37 10
Crabs 32 5
Crayfish 32 10
Freshwater shrimps 28 4
Dragonflies 8 1
Fish
Freshwater fish 29 5
Coral reef fish (parrotfish & surgeonfish only) 2 0
Amphibians 35 9
Reptiles
Freshwater reptiles 40 11
Marine turtles 100 33
Waterbirds 18 3
Mammals 23 3
Wetland-dependent megafauna (fish, reptiles and mammals >30 kg) 62 27
Ramsar | Global Wetland Outlook | 2018 29
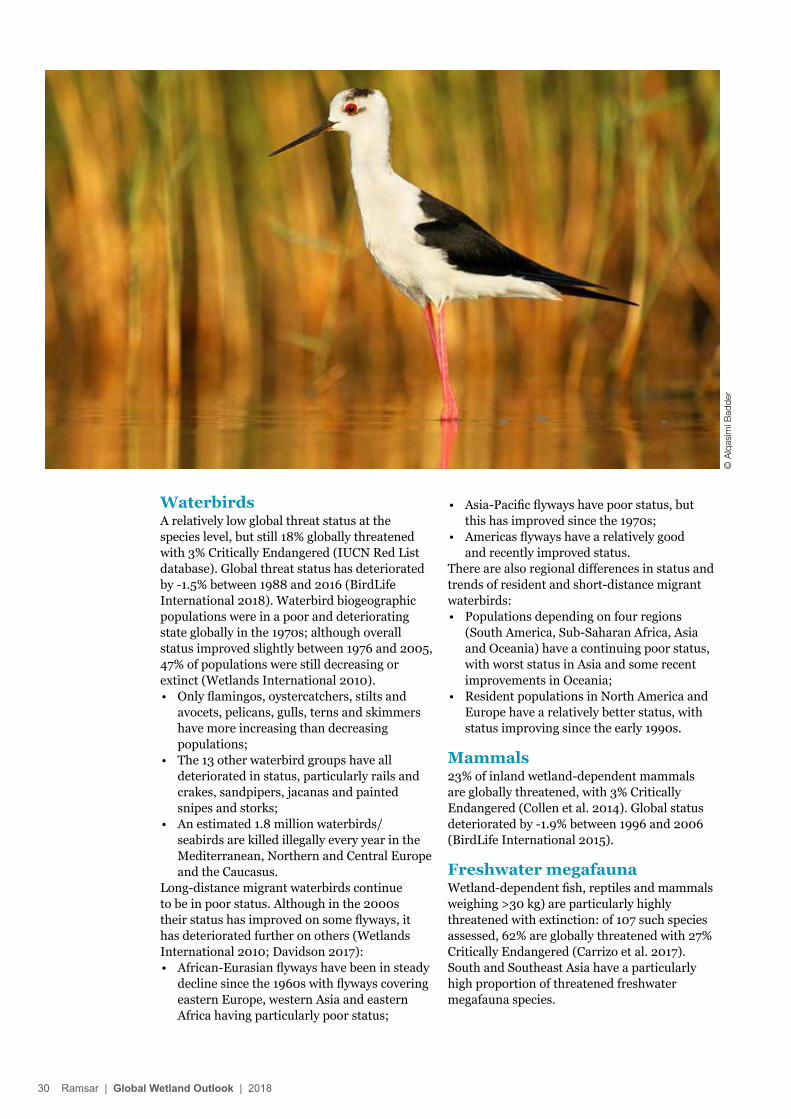
WaterbirdsA relatively low global threat status at the species level, but still 18% globally threatened with 3% Critically Endangered (IUCN Red List database). Global threat status has deteriorated by -1.5% between 1988 and 2016 (BirdLife International 2018). Waterbird biogeographic populations were in a poor and deteriorating state globally in the 1970s; although overall status improved slightly between 1976 and 2005, 47% of populations were still decreasing or extinct (Wetlands International 2010). • Only flamingos, oystercatchers, stilts and
avocets, pelicans, gulls, terns and skimmers have more increasing than decreasing populations;
• The 13 other waterbird groups have all deteriorated in status, particularly rails and crakes, sandpipers, jacanas and painted snipes and storks;
• An estimated 1.8 million waterbirds/seabirds are killed illegally every year in the Mediterranean, Northern and Central Europe and the Caucasus.
Long-distance migrant waterbirds continue to be in poor status. Although in the 2000s their status has improved on some flyways, it has deteriorated further on others (Wetlands International 2010; Davidson 2017): • African-Eurasian flyways have been in steady
decline since the 1960s with flyways covering eastern Europe, western Asia and eastern Africa having particularly poor status;
• Asia-Pacific flyways have poor status, but this has improved since the 1970s;
• Americas flyways have a relatively good and recently improved status.
There are also regional differences in status and trends of resident and short-distance migrant waterbirds: • Populations depending on four regions
(South America, Sub-Saharan Africa, Asia and Oceania) have a continuing poor status, with worst status in Asia and some recent improvements in Oceania;
• Resident populations in North America and Europe have a relatively better status, with status improving since the early 1990s.
Mammals23% of inland wetland-dependent mammals are globally threatened, with 3% Critically Endangered (Collen et al. 2014). Global status deteriorated by -1.9% between 1996 and 2006 (BirdLife International 2015).
Freshwater megafaunaWetland-dependent fish, reptiles and mammals weighing >30 kg) are particularly highly threatened with extinction: of 107 such species assessed, 62% are globally threatened with 27% Critically Endangered (Carrizo et al. 2017). South and Southeast Asia have a particularly high proportion of threatened freshwater megafauna species.
© A
lqas
imi B
adde
r
30 Ramsar | Global Wetland Outlook | 2018
Water quality is a key concern for human well-being (Horwitz et al. 2012), yet trends are mostly negative. Declining water quality degrades wetlands, although conversely wetlands also improve water quality through ecosystem regulating services (Russi et al. 2013). Major threats include untreated wastewater, industrial waste, agricultural runoff, erosion and changes in sediment (see drivers section). Since the 1990s, water pollution has worsened in almost all rivers in Latin America, Africa and Asia (WWAP 2017). Deterioration is expected to escalate as climate change, economic development, and agricultural expansion and intensification continue, generating increasing threats to human health, wetlands and sustainable development (Figure 2.11, Veolia & IFPRI 2015).
Industrial and municipal wastewater treatment generally reflects a country’s income. On average, high-income countries treat 70% of wastewater, upper middle-income countries 38%, lower middle-income countries 28% and low-income countries only 8% (Sato et al. 2013). Globally over 80% of wastewater is released into wetlands without adequate treatment (WWAP 2012; UN-Water 2015).
Some 25 to 40 billion tonnes of topsoil erode every year, mainly from farmland. Erosion transports 23-42 million tonnes of nitrogen and 15-26 million tonnes of phosphorus (FAO and ITPS 2015). Globally, nutrient loading and eutrophication of wetlands remain the largest water quality challenges (Figure 2.12). In the North American Great Lakes, the increase in diffuse sources from agriculture and domestic lawns means that Lake Erie is becoming more eutrophic again (Michalak et al. 2013; Scavia et al. 2014). In Europe, eutrophication affects about 30% of water bodies in 17 Member States (European Commission 2012), particularly from diffuse pollution sources. Almost 15% of groundwater monitoring stations exceeds the World Health Organization standard for nitrates in drinking water (European Commission 2013). By 2050, an estimated one-fifth of the global population will face risks from eutrophication and one-third will be exposed to water with excessive nitrogen and phosphorous (WWAP 2017).
Too much sedimentation can damage aquatic biodiversity (e.g., Jones et al. 2012; Kemp et al. 2011), while conversely trapping sediments behind dams can reduce sediment loads to coastal and delta zones (“sediment starvation”) resulting in land subsidence and wetland loss. The loss of wetlands and their storm and flood protection in the Mississippi Delta, due in part to dam construction, contributed significantly to increasing the impacts of Hurricane Katrina in 2005 (Batker et al. 2010).
Early findings from the global water quality monitoring programme show severe pathogen pollution (Figure 2.13) already affects one-third of all river stretches in Latin America, Africa and Asia (UNEP 2016). Despite some improvements in sanitation coverage (WHO/UNICEF 2015), for two decades loadings of faecal coliform bacteria have generally increased in these regions. Microbial contamination of wetlands is a serious health risk (Santo Domingo et al. 2007), responsible for diseases such as cholera and giardiasis (Horwitz et al. 2012).
Salinity is another key determinant of water quality. Clearing vegetation and irrigating salt-affected soils can leach salts as irrigation water percolates through the soil profile, increasing groundwater salinity (OECD 2012a). Rising water tables cause salinization of soils and wetlands. In coastal areas, both over-abstraction of groundwater, and sea level rise, contribute to saltwater intrusion (OECD 2015a; Werner et al. 2013). Groundwater salinity and soil salinization are largely irreversible (Bennett et al. 2009).
Control of sulphur pollutants from power plants has reduced the occurrence and impacts of acid deposition in OECD countries (OECD 2017). However, nitrogen oxides from fossil fuels and ammonia from agriculture still cause acid deposition to wetlands, and subsequent eutrophication. Acid mine drainage is a major pollutant in many countries (Simate & Ndlovu 2014), and mining can also be a significant source of dissolved heavy metals.
Thermal pollution of wetlands is commonly associated with power plants and industry. It decreases oxygen, alters food chains, reduces
Water quality trends are mainly negative
Ramsar | Global Wetland Outlook | 2018 31
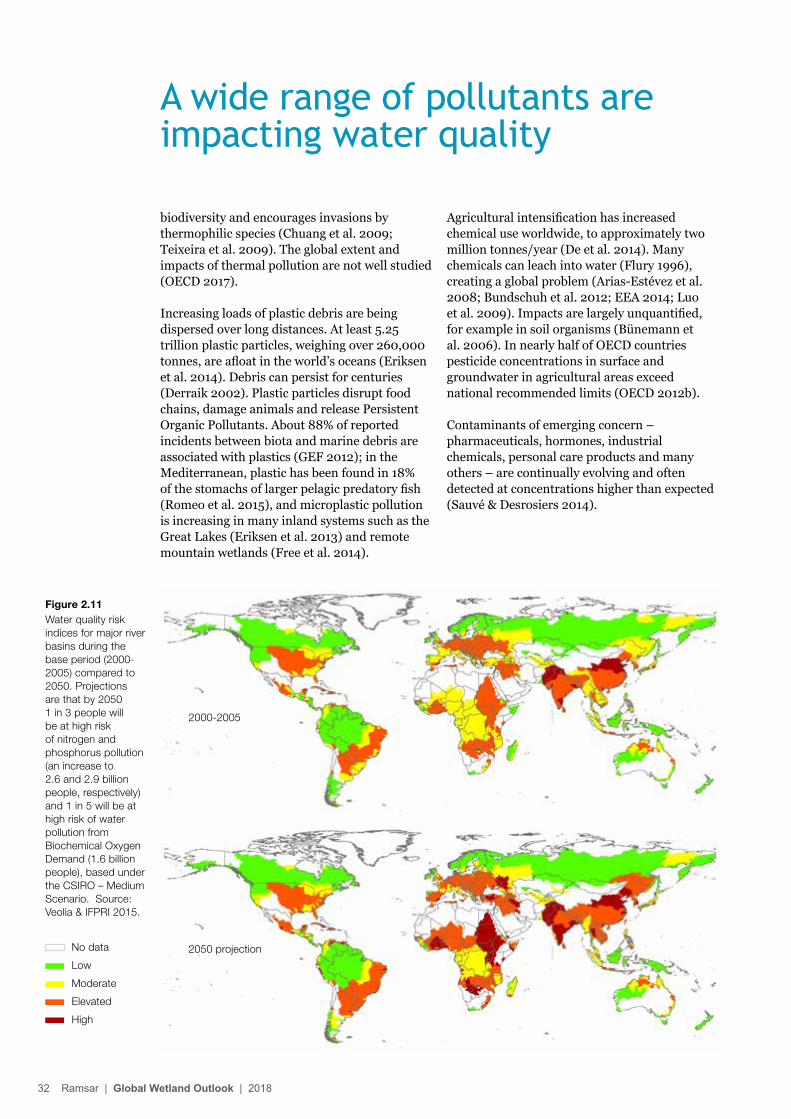
biodiversity and encourages invasions by thermophilic species (Chuang et al. 2009; Teixeira et al. 2009). The global extent and impacts of thermal pollution are not well studied (OECD 2017).
Increasing loads of plastic debris are being dispersed over long distances. At least 5.25 trillion plastic particles, weighing over 260,000 tonnes, are afloat in the world’s oceans (Eriksen et al. 2014). Debris can persist for centuries (Derraik 2002). Plastic particles disrupt food chains, damage animals and release Persistent Organic Pollutants. About 88% of reported incidents between biota and marine debris are associated with plastics (GEF 2012); in the Mediterranean, plastic has been found in 18% of the stomachs of larger pelagic predatory fish (Romeo et al. 2015), and microplastic pollution is increasing in many inland systems such as the Great Lakes (Eriksen et al. 2013) and remote mountain wetlands (Free et al. 2014).
Agricultural intensification has increased chemical use worldwide, to approximately two million tonnes/year (De et al. 2014). Many chemicals can leach into water (Flury 1996), creating a global problem (Arias-Estévez et al. 2008; Bundschuh et al. 2012; EEA 2014; Luo et al. 2009). Impacts are largely unquantified, for example in soil organisms (Bunemann et al. 2006). In nearly half of OECD countries pesticide concentrations in surface and groundwater in agricultural areas exceed national recommended limits (OECD 2012b).
Contaminants of emerging concern – pharmaceuticals, hormones, industrial chemicals, personal care products and many others – are continually evolving and often detected at concentrations higher than expected (Sauvé & Desrosiers 2014).
Figure 2.11Water quality risk indices for major river basins during the base period (2000-2005) compared to 2050. Projections are that by 2050 1 in 3 people will be at high risk of nitrogen and phosphorus pollution (an increase to 2.6 and 2.9 billion people, respectively) and 1 in 5 will be at high risk of water pollution from Biochemical Oxygen Demand (1.6 billion people), based under the CSIRO – Medium Scenario. Source: Veolia & IFPRI 2015.
No data
Low
Moderate
Elevated
High
A wide range of pollutants are impacting water quality
2000-2005
2050 projection
32 Ramsar | Global Wetland Outlook | 2018
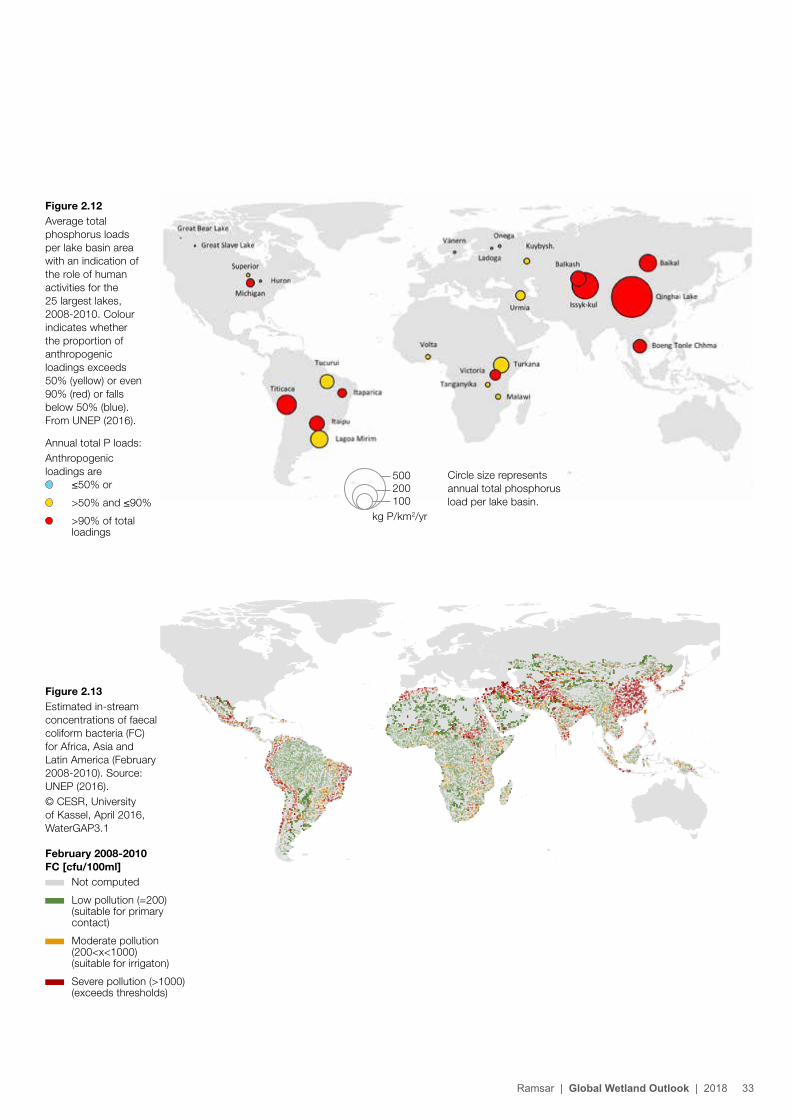
Figure 2.12Average total phosphorus loads per lake basin area with an indication of the role of human activities for the 25 largest lakes, 2008-2010. Colour indicates whether the proportion of anthropogenic loadings exceeds 50% (yellow) or even 90% (red) or falls below 50% (blue). From UNEP (2016).
Figure 2.13Estimated in-stream concentrations of faecal coliform bacteria (FC) for Africa, Asia and Latin America (February 2008-2010). Source: UNEP (2016).© CESR, University of Kassel, April 2016, WaterGAP3.1
February 2008‑2010 FC [cfu/100ml]
Not computed
Low pollution (=200) (suitable for primary contact)
Moderate pollution (200<x<1000) (suitable for irrigaton)
Severe pollution (>1000) (exceeds thresholds)
Annual total P loads:Anthropogenic loadings are
≤50% or
>50% and ≤90%
>90% of total loadings
Circle size represents annual total phosphorus load per lake basin.
500200100
kg P/km2/yr
Ramsar | Global Wetland Outlook | 2018 33
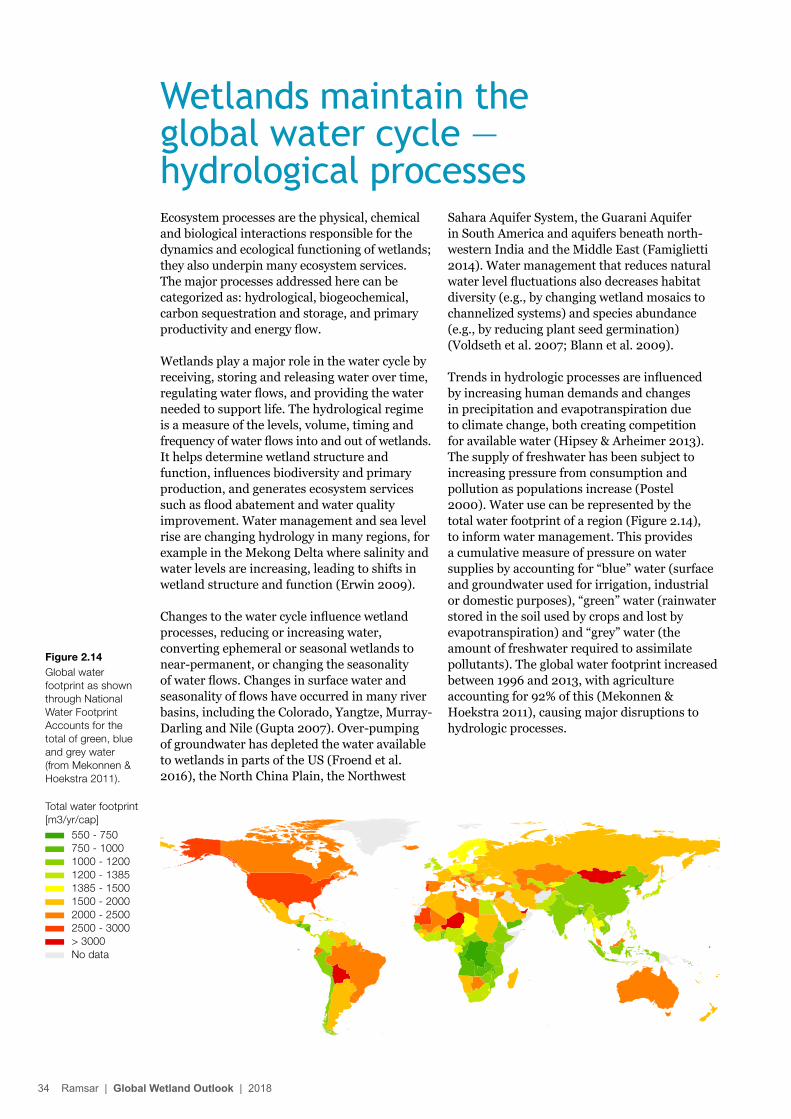
Ecosystem processes are the physical, chemical and biological interactions responsible for the dynamics and ecological functioning of wetlands; they also underpin many ecosystem services. The major processes addressed here can be categorized as: hydrological, biogeochemical, carbon sequestration and storage, and primary productivity and energy flow.
Wetlands play a major role in the water cycle by receiving, storing and releasing water over time, regulating water flows, and providing the water needed to support life. The hydrological regime is a measure of the levels, volume, timing and frequency of water flows into and out of wetlands. It helps determine wetland structure and function, influences biodiversity and primary production, and generates ecosystem services such as flood abatement and water quality improvement. Water management and sea level rise are changing hydrology in many regions, for example in the Mekong Delta where salinity and water levels are increasing, leading to shifts in wetland structure and function (Erwin 2009).
Changes to the water cycle influence wetland processes, reducing or increasing water, converting ephemeral or seasonal wetlands to near-permanent, or changing the seasonality of water flows. Changes in surface water and seasonality of flows have occurred in many river basins, including the Colorado, Yangtze, Murray-Darling and Nile (Gupta 2007). Over-pumping of groundwater has depleted the water available to wetlands in parts of the US (Froend et al. 2016), the North China Plain, the Northwest
Sahara Aquifer System, the Guarani Aquifer in South America and aquifers beneath north-western India and the Middle East (Famiglietti 2014). Water management that reduces natural water level fluctuations also decreases habitat diversity (e.g., by changing wetland mosaics to channelized systems) and species abundance (e.g., by reducing plant seed germination) (Voldseth et al. 2007; Blann et al. 2009).
Trends in hydrologic processes are influenced by increasing human demands and changes in precipitation and evapotranspiration due to climate change, both creating competition for available water (Hipsey & Arheimer 2013). The supply of freshwater has been subject to increasing pressure from consumption and pollution as populations increase (Postel 2000). Water use can be represented by the total water footprint of a region (Figure 2.14), to inform water management. This provides a cumulative measure of pressure on water supplies by accounting for “blue” water (surface and groundwater used for irrigation, industrial or domestic purposes), “green” water (rainwater stored in the soil used by crops and lost by evapotranspiration) and “grey” water (the amount of freshwater required to assimilate pollutants). The global water footprint increased between 1996 and 2013, with agriculture accounting for 92% of this (Mekonnen & Hoekstra 2011), causing major disruptions to hydrologic processes.
Wetlands maintain the global water cycle — hydrological processes
Figure 2.14Global water footprint as shown through National Water Footprint Accounts for the total of green, blue and grey water (from Mekonnen & Hoekstra 2011).
Total water footprint [m3/yr/cap]
550 - 750 750 - 1000 1000 - 1200 1200 - 1385 1385 - 1500 1500 - 2000 2000 - 2500 2500 - 3000 > 3000 No data
34 Ramsar | Global Wetland Outlook | 2018
Wetlands support a unique set of biogeochemical processes as a result of their hydrologic and soil characteristics. When saturated, wetland soils store, transform and export nutrients and other compounds. Ecosystem processes that lead to the uptake and retention of nutrients include: plant uptake and storage in tissues, microbial processing (particularly of carbon, nitrogen and sulphur), and the physical process of sediment deposition. Many biogeochemical processes are the foundation for ecosystem services such as water quality improvement, particularly the removal of nutrients from agricultural and urban runoff.
Nitrogen is a key nutrient needed for growth (Vitousek et al. 1997), but in excess it can run off from agricultural and urban lands to pollute surface and groundwater (Paerl et al. 2016; Rabalais et al. 2002). In waterlogged soils nitrate-nitrogen is transformed by microbes to nitrogen gas and returned to the atmosphere through the process of denitrification, (Groffman et al. 2009), which can remove up to 90% of the incoming nitrate loads (Zedler & Kercher 2005). Denitrification rates are closely correlated with the availability of organic matter and soil nitrate, both of which can be abundant in wetlands, making them denitrification “hot-spots” (Groffman et al. 2012). The increases in nitrate runoff associated with agricultural runoff lead to
higher rates of denitrification (Zedler & Kercher 2005). Nitrogen is also deposited in wetlands through atmospheric processes.
Phosphorus is also a critical nutrient and at natural levels it is often limiting to plant growth. As many of its forms are insoluble, the bulk of phosphorus is attached to and transported by sediments. Agricultural intensification is increasing application of mineral phosphorus fertilizer and thence its loss to wetlands (Ockenden et al. 2017). Some sinks to the bottom and is absorbed into soil (Kadlec 2008) while some stimulates plant growth (Marton et al. 2015) and thus eutrophication. Climate change is projected to increase phosphorus loss to wetlands by 30% by 2050 (Ockenden et al. 2017).
Nutrients are exported from wetlands in several ways including in the form of organic matter. Nutrient uptake and temporary storage in plants can have the beneficial effect of desynchronizing nutrient movement in watersheds. For example, in temperate climates, phosphorus is taken up by plants in the spring and summer then released in the autumn as plants die back. This improves water quality during the critical growing season, reducing eutrophication (Mitsch & Gosselink 2015).
Complex biogeochemical processes maintain functional wetland ecosystems
Ramsar | Global Wetland Outlook | 2018 35
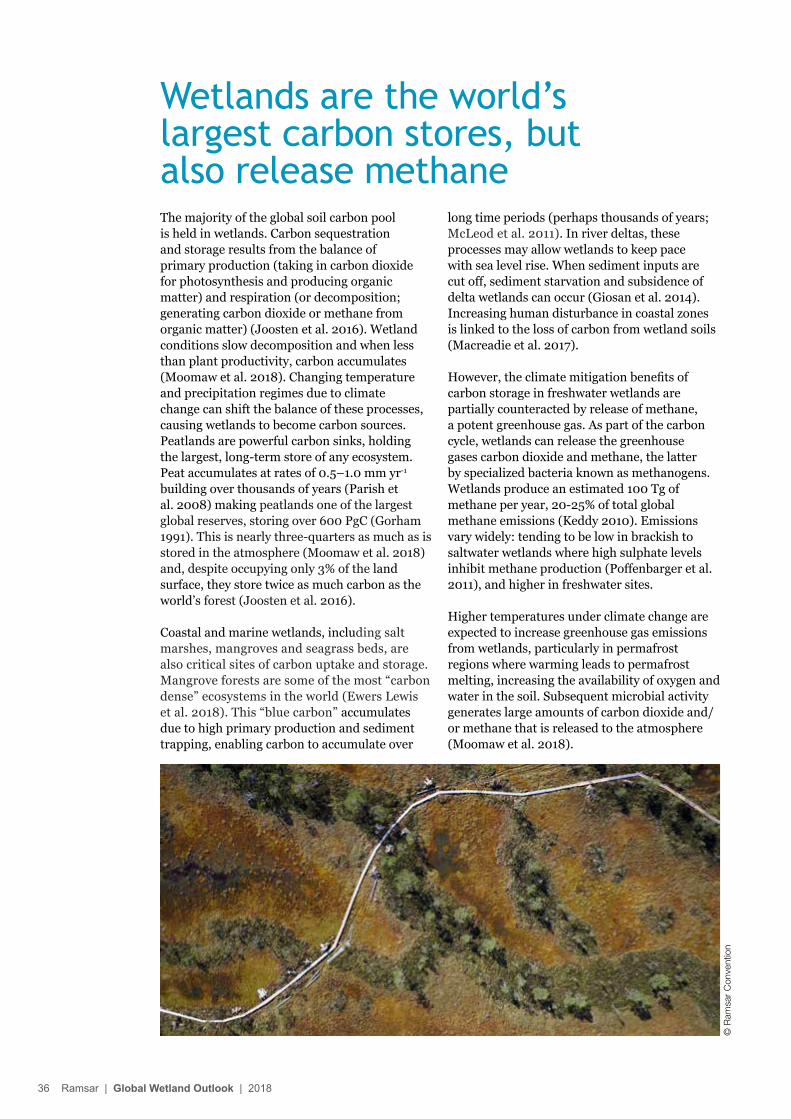
The majority of the global soil carbon pool is held in wetlands. Carbon sequestration and storage results from the balance of primary production (taking in carbon dioxide for photosynthesis and producing organic matter) and respiration (or decomposition; generating carbon dioxide or methane from organic matter) (Joosten et al. 2016). Wetland conditions slow decomposition and when less than plant productivity, carbon accumulates (Moomaw et al. 2018). Changing temperature and precipitation regimes due to climate change can shift the balance of these processes, causing wetlands to become carbon sources. Peatlands are powerful carbon sinks, holding the largest, long-term store of any ecosystem. Peat accumulates at rates of 0.5–1.0 mm yr-1 building over thousands of years (Parish et al. 2008) making peatlands one of the largest global reserves, storing over 600 PgC (Gorham 1991). This is nearly three-quarters as much as is stored in the atmosphere (Moomaw et al. 2018) and, despite occupying only 3% of the land surface, they store twice as much carbon as the world’s forest (Joosten et al. 2016).
Coastal and marine wetlands, including salt marshes, mangroves and seagrass beds, are also critical sites of carbon uptake and storage. Mangrove forests are some of the most “carbon dense” ecosystems in the world (Ewers Lewis et al. 2018). This “blue carbon” accumulates due to high primary production and sediment trapping, enabling carbon to accumulate over
long time periods (perhaps thousands of years; McLeod et al. 2011). In river deltas, these processes may allow wetlands to keep pace with sea level rise. When sediment inputs are cut off, sediment starvation and subsidence of delta wetlands can occur (Giosan et al. 2014). Increasing human disturbance in coastal zones is linked to the loss of carbon from wetland soils (Macreadie et al. 2017).
However, the climate mitigation benefits of carbon storage in freshwater wetlands are partially counteracted by release of methane, a potent greenhouse gas. As part of the carbon cycle, wetlands can release the greenhouse gases carbon dioxide and methane, the latter by specialized bacteria known as methanogens. Wetlands produce an estimated 100 Tg of methane per year, 20-25% of total global methane emissions (Keddy 2010). Emissions vary widely: tending to be low in brackish to saltwater wetlands where high sulphate levels inhibit methane production (Poffenbarger et al. 2011), and higher in freshwater sites.
Higher temperatures under climate change are expected to increase greenhouse gas emissions from wetlands, particularly in permafrost regions where warming leads to permafrost melting, increasing the availability of oxygen and water in the soil. Subsequent microbial activity generates large amounts of carbon dioxide and/or methane that is released to the atmosphere (Moomaw et al. 2018).
Wetlands are the world’s largest carbon stores, but also release methane
© R
amsa
r C
onve
ntio
n
36 Ramsar | Global Wetland Outlook | 2018
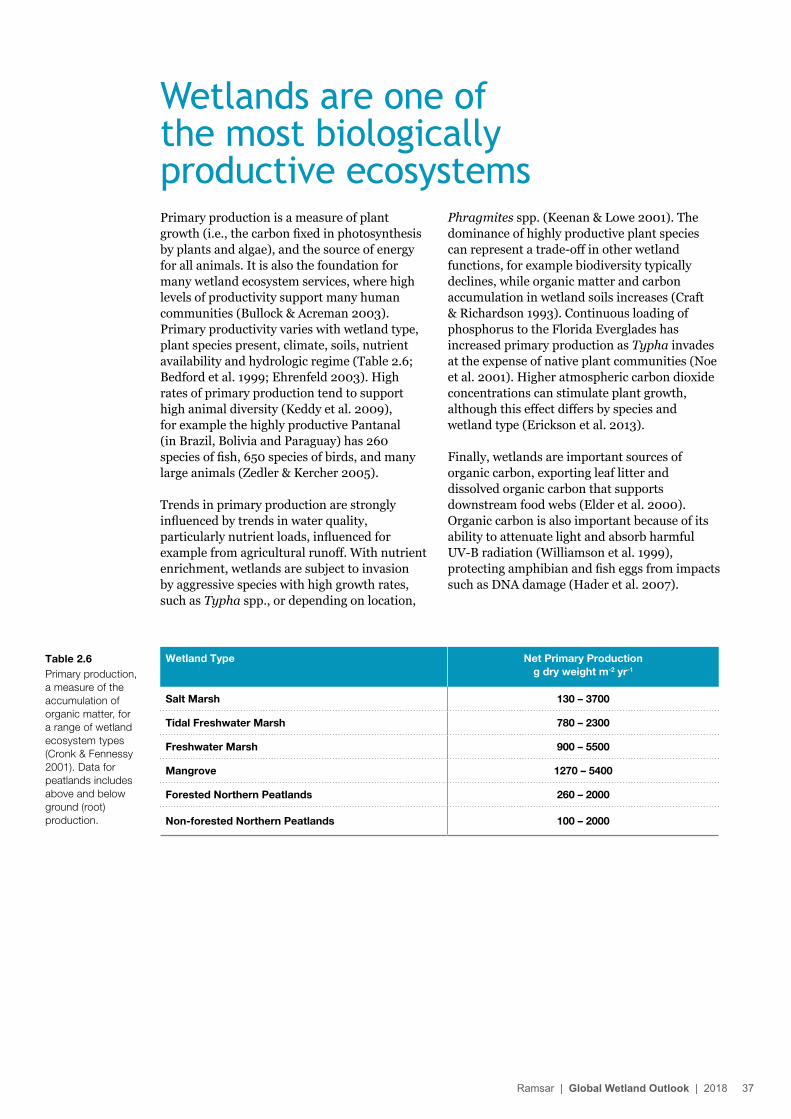
Primary production is a measure of plant growth (i.e., the carbon fixed in photosynthesis by plants and algae), and the source of energy for all animals. It is also the foundation for many wetland ecosystem services, where high levels of productivity support many human communities (Bullock & Acreman 2003). Primary productivity varies with wetland type, plant species present, climate, soils, nutrient availability and hydrologic regime (Table 2.6; Bedford et al. 1999; Ehrenfeld 2003). High rates of primary production tend to support high animal diversity (Keddy et al. 2009), for example the highly productive Pantanal (in Brazil, Bolivia and Paraguay) has 260 species of fish, 650 species of birds, and many large animals (Zedler & Kercher 2005).
Trends in primary production are strongly influenced by trends in water quality, particularly nutrient loads, influenced for example from agricultural runoff. With nutrient enrichment, wetlands are subject to invasion by aggressive species with high growth rates, such as Typha spp., or depending on location,
Phragmites spp. (Keenan & Lowe 2001). The dominance of highly productive plant species can represent a trade-off in other wetland functions, for example biodiversity typically declines, while organic matter and carbon accumulation in wetland soils increases (Craft & Richardson 1993). Continuous loading of phosphorus to the Florida Everglades has increased primary production as Typha invades at the expense of native plant communities (Noe et al. 2001). Higher atmospheric carbon dioxide concentrations can stimulate plant growth, although this effect differs by species and wetland type (Erickson et al. 2013).
Finally, wetlands are important sources of organic carbon, exporting leaf litter and dissolved organic carbon that supports downstream food webs (Elder et al. 2000). Organic carbon is also important because of its ability to attenuate light and absorb harmful UV-B radiation (Williamson et al. 1999), protecting amphibian and fish eggs from impacts such as DNA damage (Hader et al. 2007).
Wetlands are one of the most biologically productive ecosystems
Table 2.6Primary production, a measure of the accumulation of organic matter, for a range of wetland ecosystem types (Cronk & Fennessy 2001). Data for peatlands includes above and below ground (root) production.
Wetland Type Net Primary Production g dry weight m‑2 yr‑1
Salt Marsh 130 – 3700
Tidal Freshwater Marsh 780 – 2300
Freshwater Marsh 900 – 5500
Mangrove 1270 – 5400
Forested Northern Peatlands 260 – 2000
Non‑forested Northern Peatlands 100 – 2000
Ramsar | Global Wetland Outlook | 2018 37
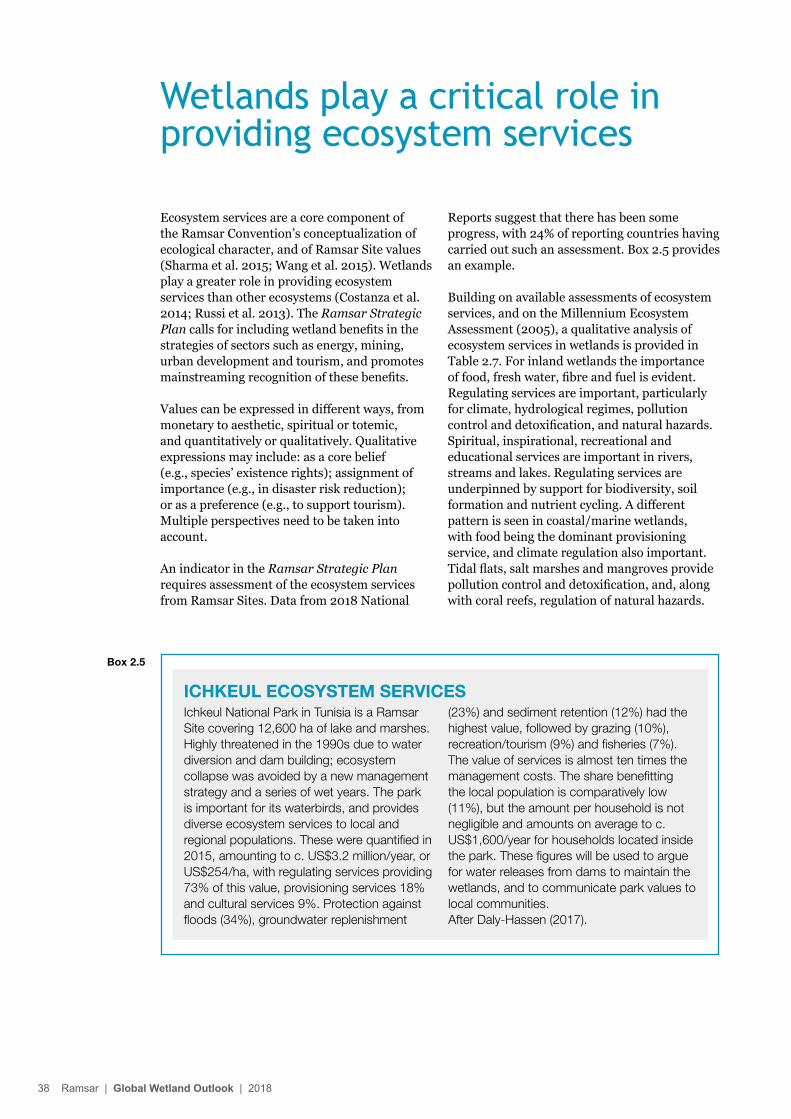
Ecosystem services are a core component of the Ramsar Convention’s conceptualization of ecological character, and of Ramsar Site values (Sharma et al. 2015; Wang et al. 2015). Wetlands play a greater role in providing ecosystem services than other ecosystems (Costanza et al. 2014; Russi et al. 2013). The Ramsar Strategic Plan calls for including wetland benefits in the strategies of sectors such as energy, mining, urban development and tourism, and promotes mainstreaming recognition of these benefits.
Values can be expressed in different ways, from monetary to aesthetic, spiritual or totemic, and quantitatively or qualitatively. Qualitative expressions may include: as a core belief (e.g., species’ existence rights); assignment of importance (e.g., in disaster risk reduction); or as a preference (e.g., to support tourism). Multiple perspectives need to be taken into account.
An indicator in the Ramsar Strategic Plan requires assessment of the ecosystem services from Ramsar Sites. Data from 2018 National
Reports suggest that there has been some progress, with 24% of reporting countries having carried out such an assessment. Box 2.5 provides an example.
Building on available assessments of ecosystem services, and on the Millennium Ecosystem Assessment (2005), a qualitative analysis of ecosystem services in wetlands is provided in Table 2.7. For inland wetlands the importance of food, fresh water, fibre and fuel is evident. Regulating services are important, particularly for climate, hydrological regimes, pollution control and detoxification, and natural hazards. Spiritual, inspirational, recreational and educational services are important in rivers, streams and lakes. Regulating services are underpinned by support for biodiversity, soil formation and nutrient cycling. A different pattern is seen in coastal/marine wetlands, with food being the dominant provisioning service, and climate regulation also important. Tidal flats, salt marshes and mangroves provide pollution control and detoxification, and, along with coral reefs, regulation of natural hazards.
Wetlands play a critical role in providing ecosystem services
ICHKEUL ECOSYSTEM SERVICESIchkeul National Park in Tunisia is a Ramsar Site covering 12,600 ha of lake and marshes. Highly threatened in the 1990s due to water diversion and dam building; ecosystem collapse was avoided by a new management strategy and a series of wet years. The park is important for its waterbirds, and provides diverse ecosystem services to local and regional populations. These were quantified in 2015, amounting to c. US$3.2 million/year, or US$254/ha, with regulating services providing 73% of this value, provisioning services 18% and cultural services 9%. Protection against floods (34%), groundwater replenishment
(23%) and sediment retention (12%) had the highest value, followed by grazing (10%), recreation/tourism (9%) and fisheries (7%). The value of services is almost ten times the management costs. The share benefitting the local population is comparatively low (11%), but the amount per household is not negligible and amounts on average to c. US$1,600/year for households located inside the park. These figures will be used to argue for water releases from dams to maintain the wetlands, and to communicate park values to local communities. After Daly-Hassen (2017).
Box 2.5
38 Ramsar | Global Wetland Outlook | 2018
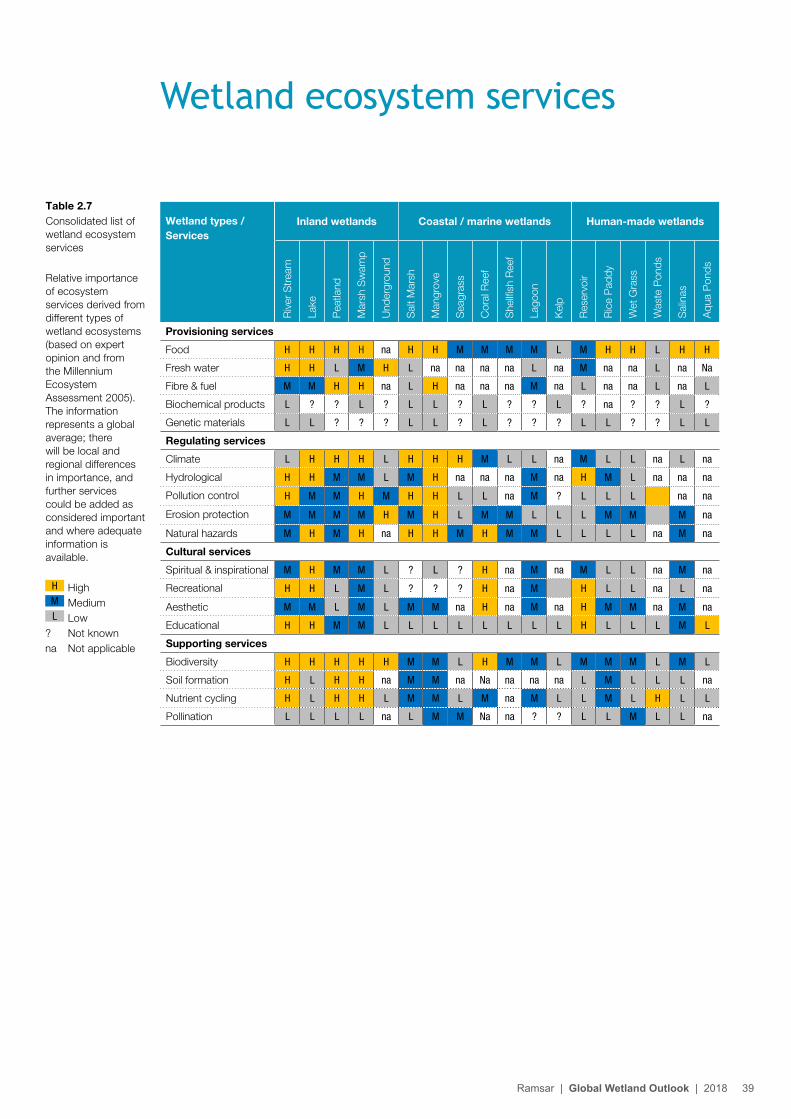
Wetland ecosystem services
Wetland types / Services
Inland wetlands Coastal / marine wetlands Human‑made wetlands
Riv
er S
trea
m
Lake
Pea
tland
Mar
sh S
wam
p
Und
ergr
ound
Sal
t Mar
sh
Man
grov
e
Sea
gras
s
Cor
al R
eef
She
llfish
Ree
f
Lago
on
Kel
p
Res
ervo
ir
Ric
e P
addy
Wet
Gra
ss
Was
te P
onds
Sal
inas
Aqu
a P
onds
Provisioning services
Food H H H H na H H M M M M L M H H L H H
Fresh water H H L M H L na na na na L na M na na L na Na
Fibre & fuel M M H H na L H na na na M na L na na L na L
Biochemical products L ? ? L ? L L ? L ? ? L ? na ? ? L ?
Genetic materials L L ? ? ? L L ? L ? ? ? L L ? ? L L
Regulating services
Climate L H H H L H H H M L L na M L L na L na
Hydrological H H M M L M H na na na M na H M L na na na
Pollution control H M M H M H H L L na M ? L L L na na
Erosion protection M M M M H M H L M M L L L M M M na
Natural hazards M H M H na H H M H M M L L L L na M na
Cultural services
Spiritual & inspirational M H M M L ? L ? H na M na M L L na M na
Recreational H H L M L ? ? ? H na M H L L na L na
Aesthetic M M L M L M M na H na M na H M M na M na
Educational H H M M L L L L L L L L H L L L M L
Supporting services
Biodiversity H H H H H M M L H M M L M M M L M L
Soil formation H L H H na M M na Na na na na L M L L L na
Nutrient cycling H L H H L M M L M na M L L M L H L L
Pollination L L L L na L M M Na na ? ? L L M L L na
Table 2.7Consolidated list of wetland ecosystem services
Relative importance of ecosystem services derived from different types of wetland ecosystems (based on expert opinion and from the Millennium Ecosystem Assessment 2005). The information represents a global average; there will be local and regional differences in importance, and further services could be added as considered important and where adequate information is available.
H High M MediumL Low
? Not knownna Not applicable
Ramsar | Global Wetland Outlook | 2018 39
WaterWetlands play crucial roles in providing fresh water for domestic uses, irrigation and industry. Global renewable water resources from rivers and aquifers total ~ 42,000 km3/year of which 3,900 km3/year is extracted for human use (FAO 2011). Agriculture accounts for 70% of water withdrawals, industry 19% and the municipal sector 11%. Global irrigated agriculture area has doubled in 50 years. Europe withdraws 6% of water resources (29% for agriculture), Asia 20% (80% for irrigation), and the Middle East, Central Asia and North Africa withdraw 80-90% for irrigation (FAO 2011). Groundwater demand has rapidly increased, particularly in South Asia where 40% of irrigated agriculture relies on groundwater alone or in conjunction with surface water (FAO 2011). It is estimated that around 60% of human water withdrawals flow back to local hydrological systems, with the rest representing consumptive use (FAO 2011). Impacts on water services are similar in countries with very different levels of wealth (Dodds et al. 2013).
FoodWetlands provide a wide diversity of food. Inland fisheries range from large-scale industrial operations to subsistence, with global annual harvest rising from 2 million tonnes in 1950 to over 11.6 million tonnes in 2012, likely even higher if small-scale subsistence fishing is included (FAO 2014). Bartley et al. (2015) report that 95% of the inland fisheries’ catch occurred in developing countries, where it often plays a vital nutritional role, but represents only 6% of global fish production. Estuarine and coastal fisheries have declined by 33% since industrialization, with fishery nursery habitats (e.g., oyster reefs, seagrass beds and other wetlands) declining by 69% (Barbier et al. 2011; Worm et al. 2006). Global aquaculture increased from less than 1 million tonnes in 1950 to 52.5 million tonnes in 2008, comprising 45.7% of the world’s food fish production. Rice fields are increasingly used for aquaculture (Edwards 2014). Aquaculture is commonest in Asia (especially China), significant in Europe and Africa, but still relatively low in the Americas (FAO 2011). Wetlands also provide grown and harvested wet crops, wildfowling and other hunting.
Water regulationWetlands retain, release and exchange water, influencing policies such as Natural Flood Management (Parliamentary Office of Science and Technology 2011). River channels, floodplains and large connected wetlands play significant roles in catchment hydrology, but the water-holding capacity of many “geographically isolated” wetlands can play important roles in hydrology (Marton et al. 2015) with effects on stream flows (Golden et al. 2016). Well-functioning wetlands can reduce disaster risk. Practical examples include the Charles River in Massachusetts, USA, where conservation of 3,800 ha of wetlands reduces flood damage by an estimated $17 million/year (Zedler & Kercher 2005). Conversely, wetland loss can increase flooding and storm damage (Barbier et al. 2011). There is a growing appreciation that maintaining wetland services is generally more economic than converting them to alternative uses (Garcia-Moreno et al. 2015).
Other natural hazardsWetlands play key roles in other types of natural hazard regulation. Moist wetland habitats can serve as a brake on natural and anthropogenic pressures contributing to salinization of soils and wildfire spread. However, the relationships between the various factors modulating the impacts of extreme events are complex and often poorly understood (de Guenni et al. 2005).
Climate regulationStorage and sequestration of carbon by wetlands plays an important role in regulation of the global climate. Peatlands and vegetated coastal wetlands contain large carbon sinks and sequester approximately as much carbon as do global forests, although freshwater wetlands also represent the largest natural source of methane (Moomaw et al. 2018). Salt marshes sequester millions of tonnes of carbon annually (Barbier et al. 2011), whilst deep tropical dams can be a substantial source of methane, offsetting or overwhelming the reported low-carbon benefits of hydropower generation (Lima et al. 2008). Natural processes in wetlands account for 25–30% of methane emissions, and wetlands are a significant contributor to the 90% of nitrous oxide emissions from ecosystems (House et
Types of ecosystem services provided by wetlands
40 Ramsar | Global Wetland Outlook | 2018
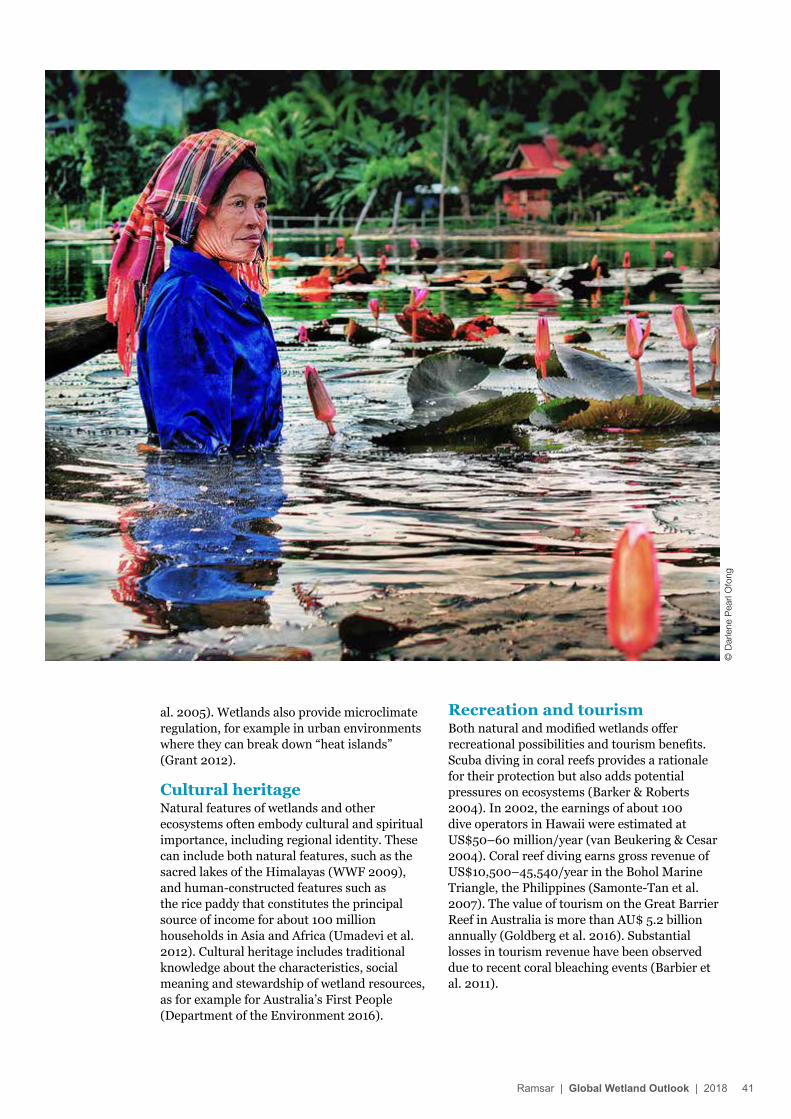
al. 2005). Wetlands also provide microclimate regulation, for example in urban environments where they can break down “heat islands” (Grant 2012).
Cultural heritageNatural features of wetlands and other ecosystems often embody cultural and spiritual importance, including regional identity. These can include both natural features, such as the sacred lakes of the Himalayas (WWF 2009), and human-constructed features such as the rice paddy that constitutes the principal source of income for about 100 million households in Asia and Africa (Umadevi et al. 2012). Cultural heritage includes traditional knowledge about the characteristics, social meaning and stewardship of wetland resources, as for example for Australia’s First People (Department of the Environment 2016).
Recreation and tourismBoth natural and modified wetlands offer recreational possibilities and tourism benefits. Scuba diving in coral reefs provides a rationale for their protection but also adds potential pressures on ecosystems (Barker & Roberts 2004). In 2002, the earnings of about 100 dive operators in Hawaii were estimated at US$50–60 million/year (van Beukering & Cesar 2004). Coral reef diving earns gross revenue of US$10,500–45,540/year in the Bohol Marine Triangle, the Philippines (Samonte-Tan et al. 2007). The value of tourism on the Great Barrier Reef in Australia is more than AU$ 5.2 billion annually (Goldberg et al. 2016). Substantial losses in tourism revenue have been observed due to recent coral bleaching events (Barbier et al. 2011).
© D
arle
ne P
earl
Ofo
ng
Ramsar | Global Wetland Outlook | 2018 41
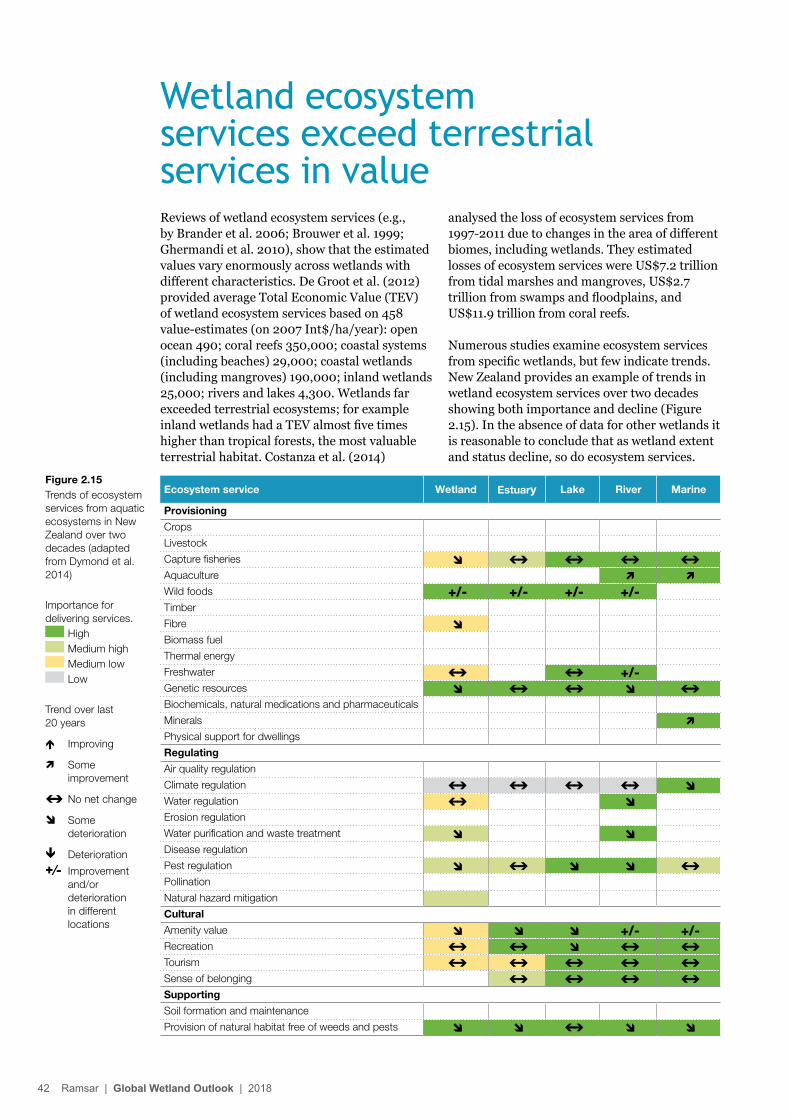
Reviews of wetland ecosystem services (e.g., by Brander et al. 2006; Brouwer et al. 1999; Ghermandi et al. 2010), show that the estimated values vary enormously across wetlands with different characteristics. De Groot et al. (2012) provided average Total Economic Value (TEV) of wetland ecosystem services based on 458 value-estimates (on 2007 Int$/ha/year): open ocean 490; coral reefs 350,000; coastal systems (including beaches) 29,000; coastal wetlands (including mangroves) 190,000; inland wetlands 25,000; rivers and lakes 4,300. Wetlands far exceeded terrestrial ecosystems; for example inland wetlands had a TEV almost five times higher than tropical forests, the most valuable terrestrial habitat. Costanza et al. (2014)
analysed the loss of ecosystem services from 1997-2011 due to changes in the area of different biomes, including wetlands. They estimated losses of ecosystem services were US$7.2 trillion from tidal marshes and mangroves, US$2.7 trillion from swamps and floodplains, and US$11.9 trillion from coral reefs.
Numerous studies examine ecosystem services from specific wetlands, but few indicate trends. New Zealand provides an example of trends in wetland ecosystem services over two decades showing both importance and decline (Figure 2.15). In the absence of data for other wetlands it is reasonable to conclude that as wetland extent and status decline, so do ecosystem services.
Wetland ecosystem services exceed terrestrial services in value
Figure 2.15Trends of ecosystem services from aquatic ecosystems in New Zealand over two decades (adapted from Dymond et al. 2014)
Importance for delivering services.
High Medium high Medium low Low
Trend over last 20 years
é Improving
Some improvement
è No net change
Some deterioration
ê Deterioration+⁄- Improvement
and/or deterioration in different locations
Ecosystem service Wetland Estuary Lake River Marine
Provisioning
Crops
Livestock
Capture fisheries è è è è
Aquaculture
Wild foods +/- +/- +/- +/-Timber
Fibre Biomass fuel
Thermal energy
Freshwater è è +/-Genetic resources è è è
Biochemicals, natural medications and pharmaceuticals
Minerals
Physical support for dwellings
Regulating
Air quality regulation
Climate regulation è è è è Water regulation è Erosion regulation
Water purification and waste treatment Disease regulation
Pest regulation è è
Pollination
Natural hazard mitigation
Cultural
Amenity value +/- +/-Recreation è è è è
Tourism è è è è è
Sense of belonging è è è è
Supporting
Soil formation and maintenance
Provision of natural habitat free of weeds and pests è
42 Ramsar | Global Wetland Outlook | 2018
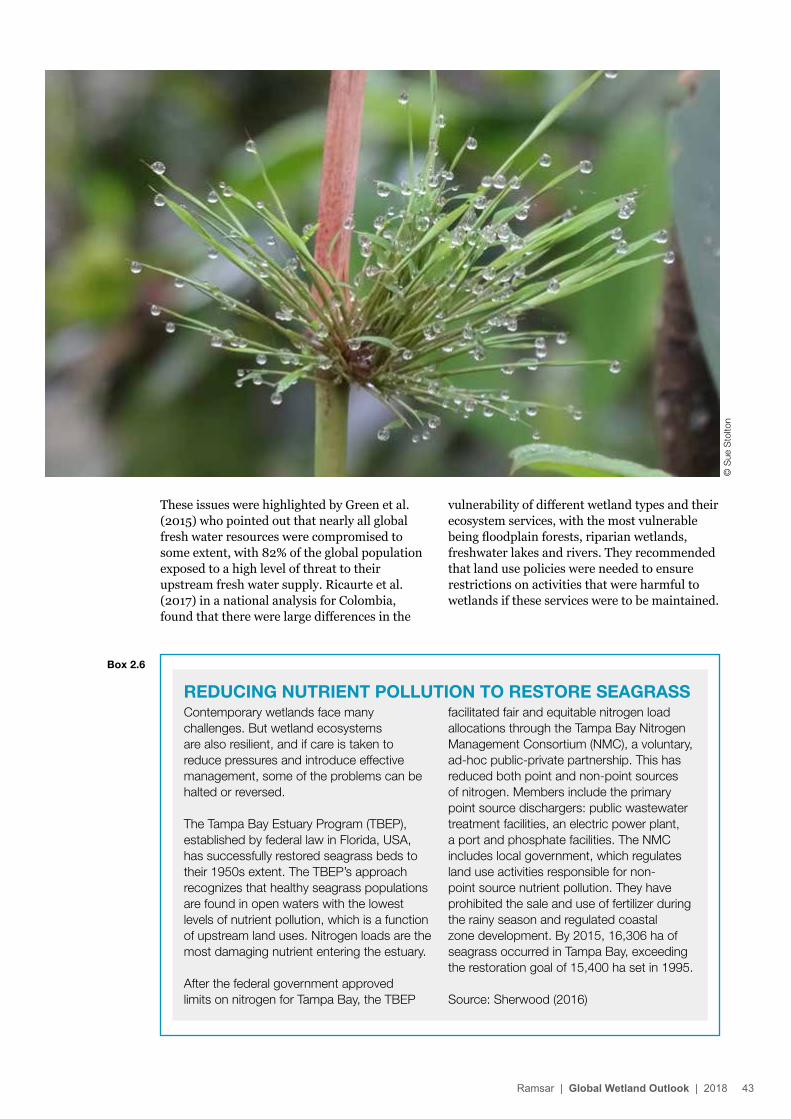
REDUCING NUTRIENT POLLUTION TO RESTORE SEAGRASSContemporary wetlands face many challenges. But wetland ecosystems are also resilient, and if care is taken to reduce pressures and introduce effective management, some of the problems can be halted or reversed.
The Tampa Bay Estuary Program (TBEP), established by federal law in Florida, USA, has successfully restored seagrass beds to their 1950s extent. The TBEP’s approach recognizes that healthy seagrass populations are found in open waters with the lowest levels of nutrient pollution, which is a function of upstream land uses. Nitrogen loads are the most damaging nutrient entering the estuary.
After the federal government approved limits on nitrogen for Tampa Bay, the TBEP
facilitated fair and equitable nitrogen load allocations through the Tampa Bay Nitrogen Management Consortium (NMC), a voluntary, ad-hoc public-private partnership. This has reduced both point and non-point sources of nitrogen. Members include the primary point source dischargers: public wastewater treatment facilities, an electric power plant, a port and phosphate facilities. The NMC includes local government, which regulates land use activities responsible for non-point source nutrient pollution. They have prohibited the sale and use of fertilizer during the rainy season and regulated coastal zone development. By 2015, 16,306 ha of seagrass occurred in Tampa Bay, exceeding the restoration goal of 15,400 ha set in 1995.
Source: Sherwood (2016)
Box 2.6
These issues were highlighted by Green et al. (2015) who pointed out that nearly all global fresh water resources were compromised to some extent, with 82% of the global population exposed to a high level of threat to their upstream fresh water supply. Ricaurte et al. (2017) in a national analysis for Colombia, found that there were large differences in the
vulnerability of different wetland types and their ecosystem services, with the most vulnerable being floodplain forests, riparian wetlands, freshwater lakes and rivers. They recommended that land use policies were needed to ensure restrictions on activities that were harmful to wetlands if these services were to be maintained.
© S
ue S
tolto
n
Ramsar | Global Wetland Outlook | 2018 43
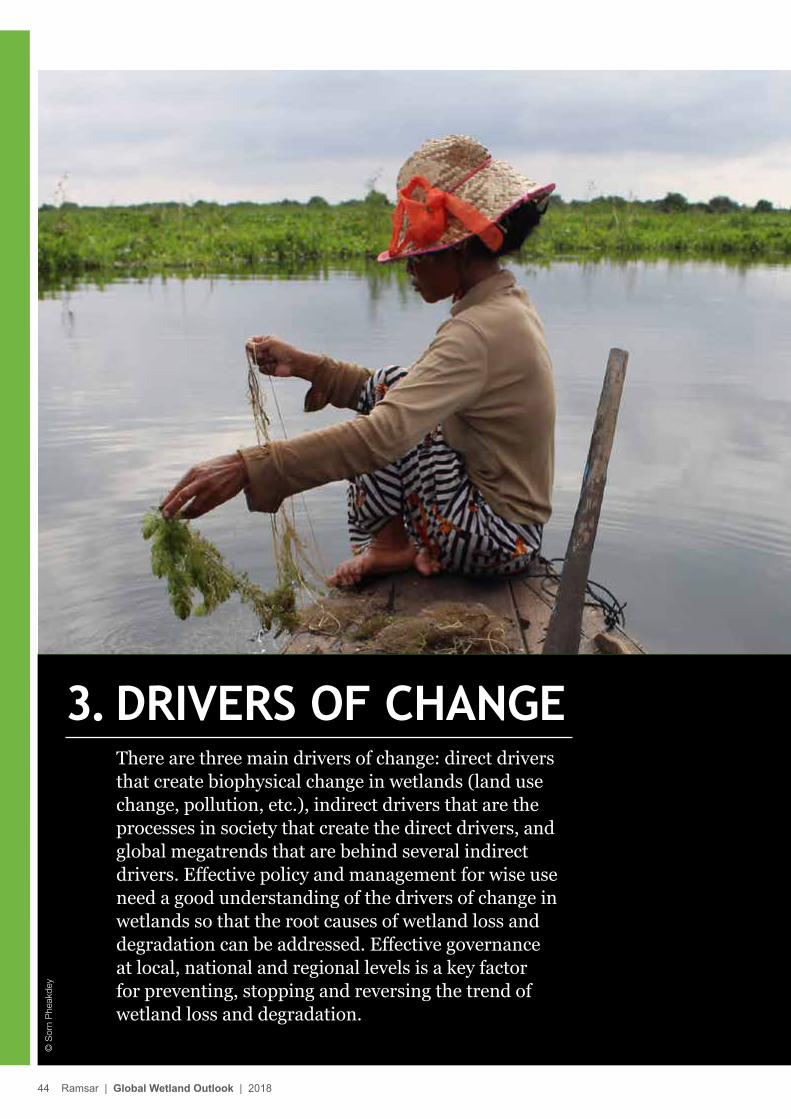
There are three main drivers of change: direct drivers that create biophysical change in wetlands (land use change, pollution, etc.), indirect drivers that are the processes in society that create the direct drivers, and global megatrends that are behind several indirect drivers. Effective policy and management for wise use need a good understanding of the drivers of change in wetlands so that the root causes of wetland loss and degradation can be addressed. Effective governance at local, national and regional levels is a key factor for preventing, stopping and reversing the trend of wetland loss and degradation.
3. DRIVERS OF CHANGE
© S
orn
Phe
akde
y
44 Ramsar | Global Wetland Outlook | 2018
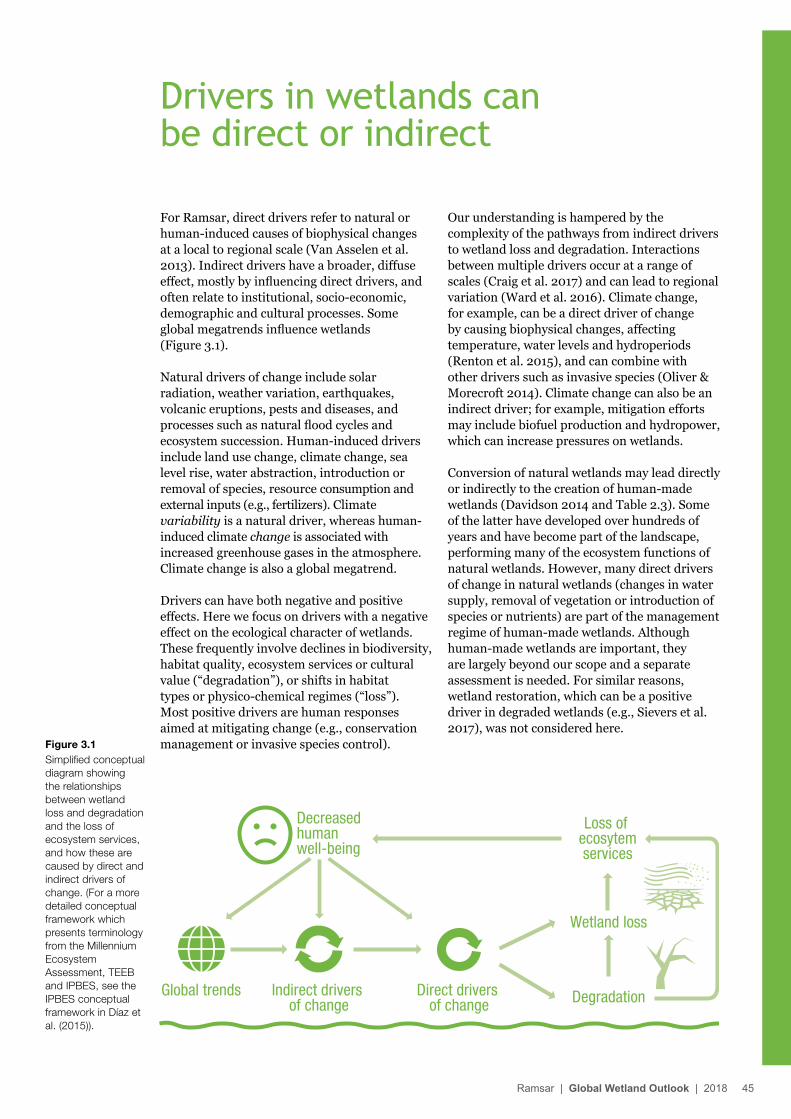
For Ramsar, direct drivers refer to natural or human-induced causes of biophysical changes at a local to regional scale (Van Asselen et al. 2013). Indirect drivers have a broader, diffuse effect, mostly by influencing direct drivers, and often relate to institutional, socio-economic, demographic and cultural processes. Some global megatrends influence wetlands (Figure 3.1).
Natural drivers of change include solar radiation, weather variation, earthquakes, volcanic eruptions, pests and diseases, and processes such as natural flood cycles and ecosystem succession. Human-induced drivers include land use change, climate change, sea level rise, water abstraction, introduction or removal of species, resource consumption and external inputs (e.g., fertilizers). Climate variability is a natural driver, whereas human-induced climate change is associated with increased greenhouse gases in the atmosphere. Climate change is also a global megatrend.
Drivers can have both negative and positive effects. Here we focus on drivers with a negative effect on the ecological character of wetlands. These frequently involve declines in biodiversity, habitat quality, ecosystem services or cultural value (“degradation”), or shifts in habitat types or physico-chemical regimes (“loss”). Most positive drivers are human responses aimed at mitigating change (e.g., conservation management or invasive species control).
Our understanding is hampered by the complexity of the pathways from indirect drivers to wetland loss and degradation. Interactions between multiple drivers occur at a range of scales (Craig et al. 2017) and can lead to regional variation (Ward et al. 2016). Climate change, for example, can be a direct driver of change by causing biophysical changes, affecting temperature, water levels and hydroperiods (Renton et al. 2015), and can combine with other drivers such as invasive species (Oliver & Morecroft 2014). Climate change can also be an indirect driver; for example, mitigation efforts may include biofuel production and hydropower, which can increase pressures on wetlands.
Conversion of natural wetlands may lead directly or indirectly to the creation of human-made wetlands (Davidson 2014 and Table 2.3). Some of the latter have developed over hundreds of years and have become part of the landscape, performing many of the ecosystem functions of natural wetlands. However, many direct drivers of change in natural wetlands (changes in water supply, removal of vegetation or introduction of species or nutrients) are part of the management regime of human-made wetlands. Although human-made wetlands are important, they are largely beyond our scope and a separate assessment is needed. For similar reasons, wetland restoration, which can be a positive driver in degraded wetlands (e.g., Sievers et al. 2017), was not considered here.
Drivers in wetlands can be direct or indirect
Global trends Degradation
Wetland loss
Loss of ecosytemservices
Decreased humanwell-being
Indirect drivers of change
Direct drivers of change
Figure 3.1Simplified conceptual diagram showing the relationships between wetland loss and degradation and the loss of ecosystem services, and how these are caused by direct and indirect drivers of change. (For a more detailed conceptual framework which presents terminology from the Millennium Ecosystem Assessment, TEEB and IPBES, see the IPBES conceptual framework in Díaz et al. (2015)).
Ramsar | Global Wetland Outlook | 2018 45
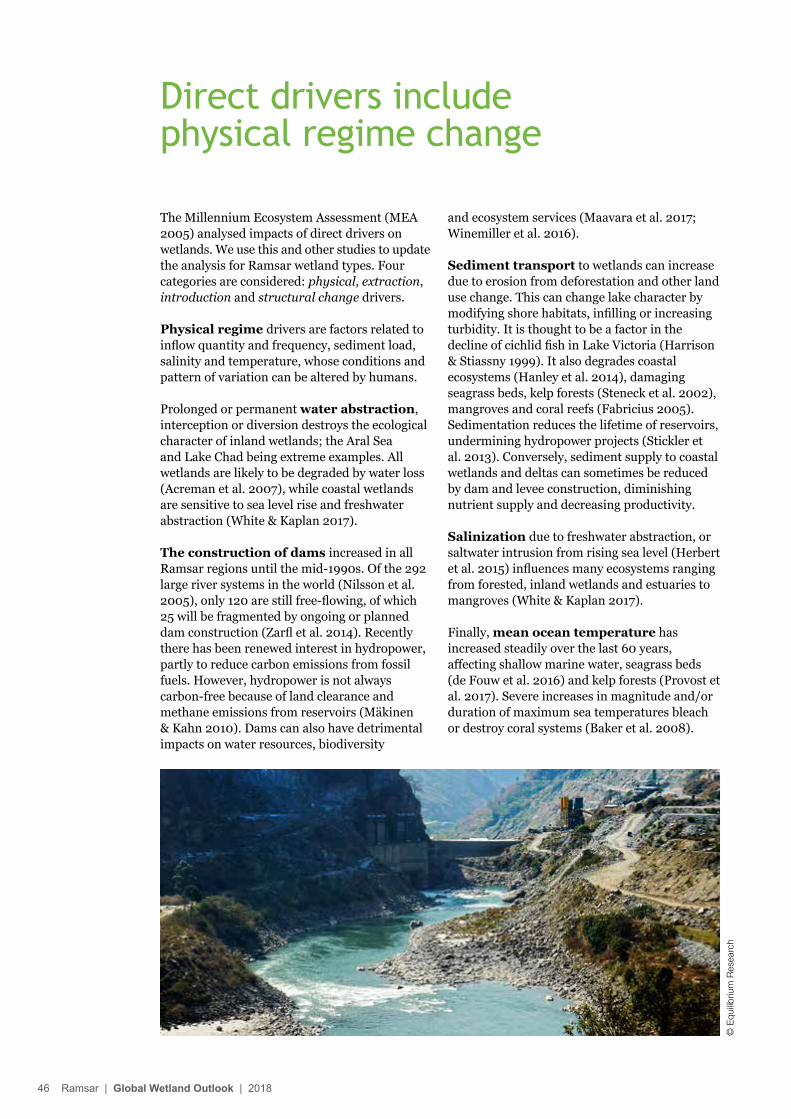
The Millennium Ecosystem Assessment (MEA 2005) analysed impacts of direct drivers on wetlands. We use this and other studies to update the analysis for Ramsar wetland types. Four categories are considered: physical, extraction, introduction and structural change drivers.
Physical regime drivers are factors related to inflow quantity and frequency, sediment load, salinity and temperature, whose conditions and pattern of variation can be altered by humans.
Prolonged or permanent water abstraction, interception or diversion destroys the ecological character of inland wetlands; the Aral Sea and Lake Chad being extreme examples. All wetlands are likely to be degraded by water loss (Acreman et al. 2007), while coastal wetlands are sensitive to sea level rise and freshwater abstraction (White & Kaplan 2017).
The construction of dams increased in all Ramsar regions until the mid-1990s. Of the 292 large river systems in the world (Nilsson et al. 2005), only 120 are still free-flowing, of which 25 will be fragmented by ongoing or planned dam construction (Zarfl et al. 2014). Recently there has been renewed interest in hydropower, partly to reduce carbon emissions from fossil fuels. However, hydropower is not always carbon-free because of land clearance and methane emissions from reservoirs (Mäkinen & Kahn 2010). Dams can also have detrimental impacts on water resources, biodiversity
and ecosystem services (Maavara et al. 2017; Winemiller et al. 2016).
Sediment transport to wetlands can increase due to erosion from deforestation and other land use change. This can change lake character by modifying shore habitats, infilling or increasing turbidity. It is thought to be a factor in the decline of cichlid fish in Lake Victoria (Harrison & Stiassny 1999). It also degrades coastal ecosystems (Hanley et al. 2014), damaging seagrass beds, kelp forests (Steneck et al. 2002), mangroves and coral reefs (Fabricius 2005). Sedimentation reduces the lifetime of reservoirs, undermining hydropower projects (Stickler et al. 2013). Conversely, sediment supply to coastal wetlands and deltas can sometimes be reduced by dam and levee construction, diminishing nutrient supply and decreasing productivity.
Salinization due to freshwater abstraction, or saltwater intrusion from rising sea level (Herbert et al. 2015) influences many ecosystems ranging from forested, inland wetlands and estuaries to mangroves (White & Kaplan 2017).
Finally, mean ocean temperature has increased steadily over the last 60 years, affecting shallow marine water, seagrass beds (de Fouw et al. 2016) and kelp forests (Provost et al. 2017). Severe increases in magnitude and/or duration of maximum sea temperatures bleach or destroy coral systems (Baker et al. 2008).
Direct drivers include physical regime change
© E
quilib
rium
Res
earc
h
46 Ramsar | Global Wetland Outlook | 2018
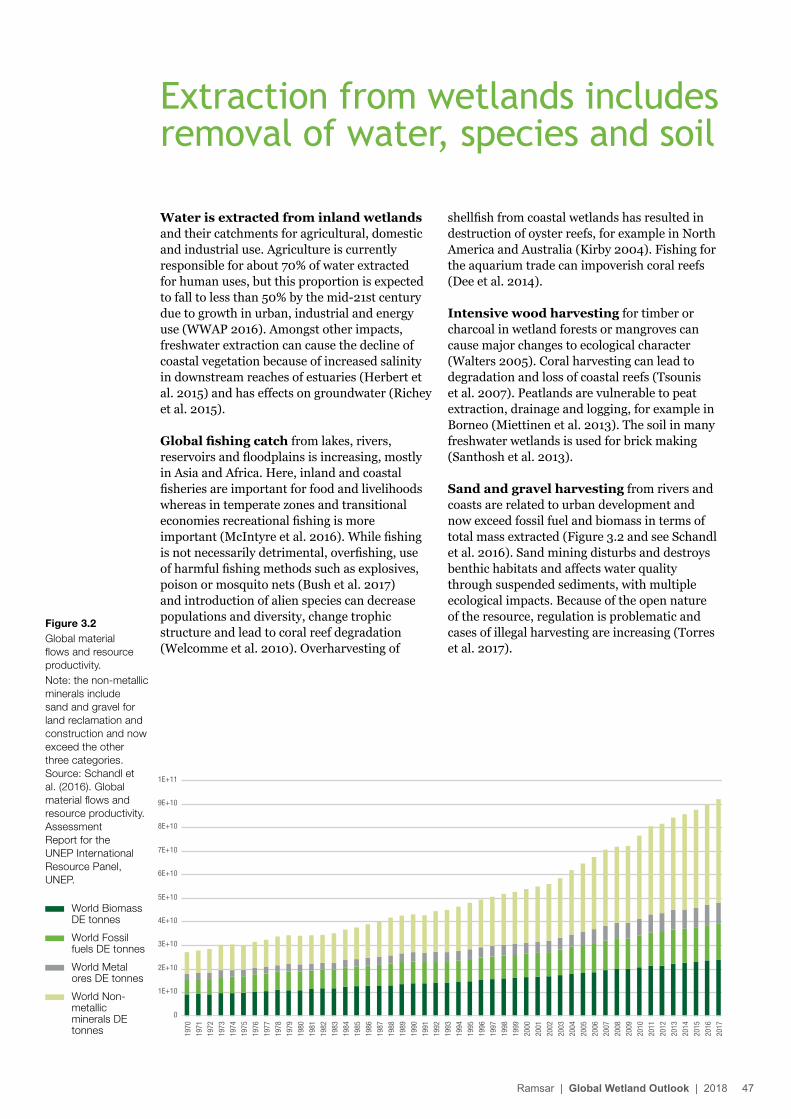
Water is extracted from inland wetlands and their catchments for agricultural, domestic and industrial use. Agriculture is currently responsible for about 70% of water extracted for human uses, but this proportion is expected to fall to less than 50% by the mid-21st century due to growth in urban, industrial and energy use (WWAP 2016). Amongst other impacts, freshwater extraction can cause the decline of coastal vegetation because of increased salinity in downstream reaches of estuaries (Herbert et al. 2015) and has effects on groundwater (Richey et al. 2015).
Global fishing catch from lakes, rivers, reservoirs and floodplains is increasing, mostly in Asia and Africa. Here, inland and coastal fisheries are important for food and livelihoods whereas in temperate zones and transitional economies recreational fishing is more important (McIntyre et al. 2016). While fishing is not necessarily detrimental, overfishing, use of harmful fishing methods such as explosives, poison or mosquito nets (Bush et al. 2017) and introduction of alien species can decrease populations and diversity, change trophic structure and lead to coral reef degradation (Welcomme et al. 2010). Overharvesting of
shellfish from coastal wetlands has resulted in destruction of oyster reefs, for example in North America and Australia (Kirby 2004). Fishing for the aquarium trade can impoverish coral reefs (Dee et al. 2014).
Intensive wood harvesting for timber or charcoal in wetland forests or mangroves can cause major changes to ecological character (Walters 2005). Coral harvesting can lead to degradation and loss of coastal reefs (Tsounis et al. 2007). Peatlands are vulnerable to peat extraction, drainage and logging, for example in Borneo (Miettinen et al. 2013). The soil in many freshwater wetlands is used for brick making (Santhosh et al. 2013).
Sand and gravel harvesting from rivers and coasts are related to urban development and now exceed fossil fuel and biomass in terms of total mass extracted (Figure 3.2 and see Schandl et al. 2016). Sand mining disturbs and destroys benthic habitats and affects water quality through suspended sediments, with multiple ecological impacts. Because of the open nature of the resource, regulation is problematic and cases of illegal harvesting are increasing (Torres et al. 2017).
Extraction from wetlands includes removal of water, species and soil
Figure 3.2Global material flows and resource productivity.Note: the non-metallic minerals include sand and gravel for land reclamation and construction and now exceed the other three categories. Source: Schandl et al. (2016). Global material flows and resource productivity. Assessment Report for the UNEP International Resource Panel, UNEP.
World Biomass DE tonnes
World Fossil fuels DE tonnes
World Metal ores DE tonnes
World Non-metallic minerals DE tonnes
0
1E+10
2E+10
3E+10
4E+10
5E+10
6E+10
7E+10
8E+10
9E+10
1E+11
1970
1971
1972
1973
1974
1975
1976
1977
1978
1979
1980
1981
1982
1983
1984
1985
1986
1987
1988
1989
1990
1991
1992
1993
1994
1995
1996
1997
1998
1999
2000
2001
2002
2003
2004
2005
2006
2007
2009
2010
2011
2012
2013
2014
2015
2016
2017
2008
Ramsar | Global Wetland Outlook | 2018 47
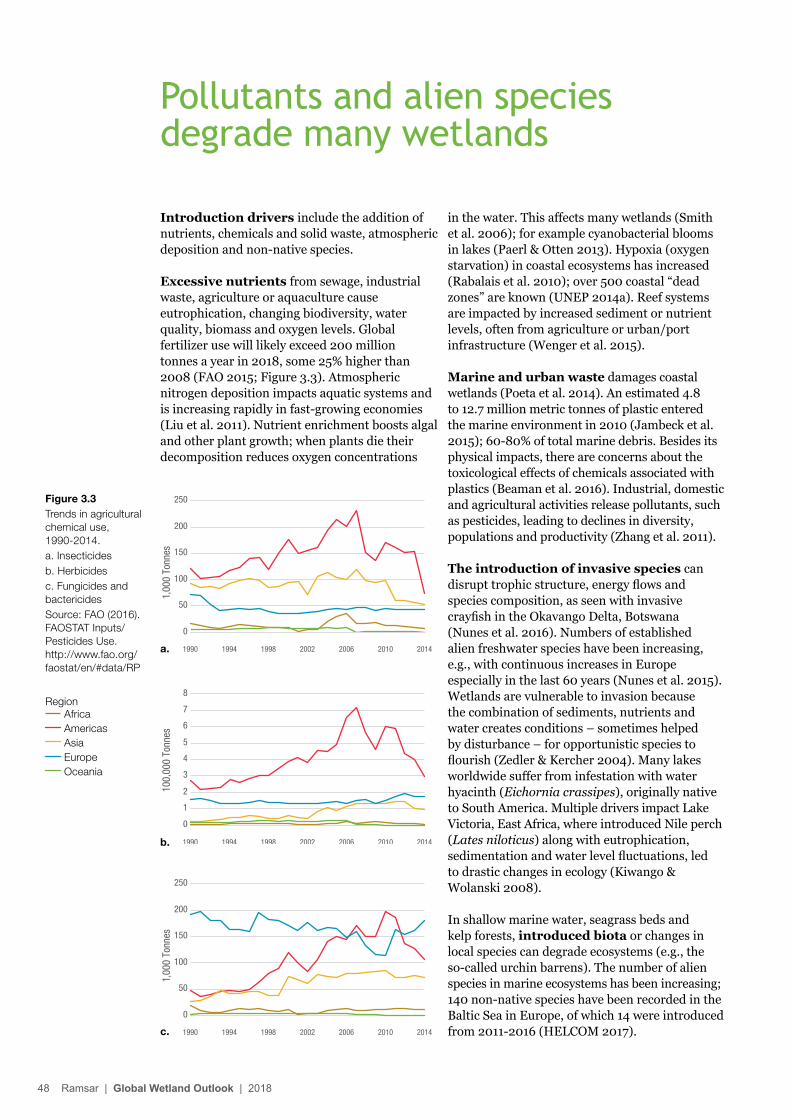
Introduction drivers include the addition of nutrients, chemicals and solid waste, atmospheric deposition and non-native species.
Excessive nutrients from sewage, industrial waste, agriculture or aquaculture cause eutrophication, changing biodiversity, water quality, biomass and oxygen levels. Global fertilizer use will likely exceed 200 million tonnes a year in 2018, some 25% higher than 2008 (FAO 2015; Figure 3.3). Atmospheric nitrogen deposition impacts aquatic systems and is increasing rapidly in fast-growing economies (Liu et al. 2011). Nutrient enrichment boosts algal and other plant growth; when plants die their decomposition reduces oxygen concentrations
in the water. This affects many wetlands (Smith et al. 2006); for example cyanobacterial blooms in lakes (Paerl & Otten 2013). Hypoxia (oxygen starvation) in coastal ecosystems has increased (Rabalais et al. 2010); over 500 coastal “dead zones” are known (UNEP 2014a). Reef systems are impacted by increased sediment or nutrient levels, often from agriculture or urban/port infrastructure (Wenger et al. 2015).
Marine and urban waste damages coastal wetlands (Poeta et al. 2014). An estimated 4.8 to 12.7 million metric tonnes of plastic entered the marine environment in 2010 (Jambeck et al. 2015); 60-80% of total marine debris. Besides its physical impacts, there are concerns about the toxicological effects of chemicals associated with plastics (Beaman et al. 2016). Industrial, domestic and agricultural activities release pollutants, such as pesticides, leading to declines in diversity, populations and productivity (Zhang et al. 2011).
The introduction of invasive species can disrupt trophic structure, energy flows and species composition, as seen with invasive crayfish in the Okavango Delta, Botswana (Nunes et al. 2016). Numbers of established alien freshwater species have been increasing, e.g., with continuous increases in Europe especially in the last 60 years (Nunes et al. 2015). Wetlands are vulnerable to invasion because the combination of sediments, nutrients and water creates conditions – sometimes helped by disturbance – for opportunistic species to flourish (Zedler & Kercher 2004). Many lakes worldwide suffer from infestation with water hyacinth (Eichornia crassipes), originally native to South America. Multiple drivers impact Lake Victoria, East Africa, where introduced Nile perch (Lates niloticus) along with eutrophication, sedimentation and water level fluctuations, led to drastic changes in ecology (Kiwango & Wolanski 2008).
In shallow marine water, seagrass beds and kelp forests, introduced biota or changes in local species can degrade ecosystems (e.g., the so-called urchin barrens). The number of alien species in marine ecosystems has been increasing; 140 non-native species have been recorded in the Baltic Sea in Europe, of which 14 were introduced from 2011-2016 (HELCOM 2017).
Pollutants and alien species degrade many wetlands
Figure 3.3Trends in agricultural chemical use, 1990-2014. a. Insecticidesb. Herbicidesc. Fungicides and bactericidesSource: FAO (2016). FAOSTAT Inputs/Pesticides Use. http://www.fao.org/faostat/en/#data/RP
1,00
0 To
nnes
0
50
100
150
200
250
1990 1994 1998 2002 2006 2010 2014
100,
000
Tonn
es
1990 1994 1998 2002 2006 2010 2014
0
1
2
3
4
5
6
7
8
1,00
0 To
nnes
0
50
100
150
200
250
1990 1994 1998 2002 2006 2010 2014
Region Africa Americas Asia Europe Oceania
a.
b.
c.
48 Ramsar | Global Wetland Outlook | 2018
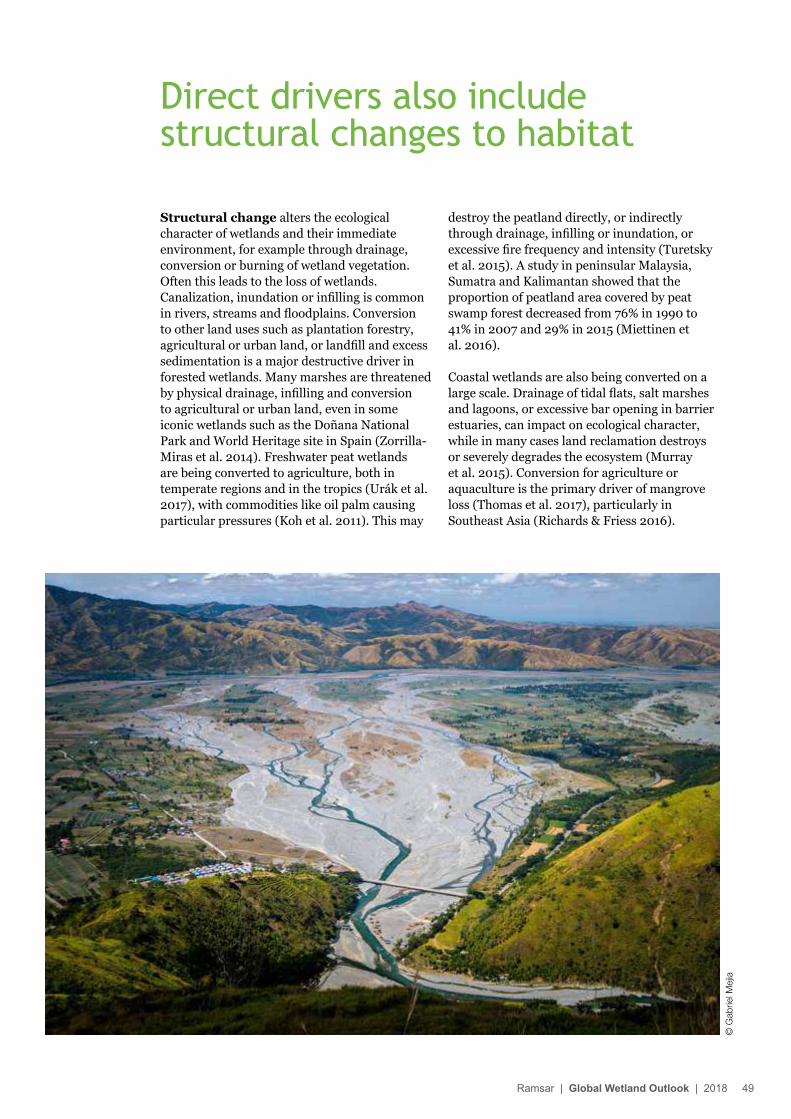
Structural change alters the ecological character of wetlands and their immediate environment, for example through drainage, conversion or burning of wetland vegetation. Often this leads to the loss of wetlands. Canalization, inundation or infilling is common in rivers, streams and floodplains. Conversion to other land uses such as plantation forestry, agricultural or urban land, or landfill and excess sedimentation is a major destructive driver in forested wetlands. Many marshes are threatened by physical drainage, infilling and conversion to agricultural or urban land, even in some iconic wetlands such as the Doñana National Park and World Heritage site in Spain (Zorrilla-Miras et al. 2014). Freshwater peat wetlands are being converted to agriculture, both in temperate regions and in the tropics (Urák et al. 2017), with commodities like oil palm causing particular pressures (Koh et al. 2011). This may
destroy the peatland directly, or indirectly through drainage, infilling or inundation, or excessive fire frequency and intensity (Turetsky et al. 2015). A study in peninsular Malaysia, Sumatra and Kalimantan showed that the proportion of peatland area covered by peat swamp forest decreased from 76% in 1990 to 41% in 2007 and 29% in 2015 (Miettinen et al. 2016).
Coastal wetlands are also being converted on a large scale. Drainage of tidal flats, salt marshes and lagoons, or excessive bar opening in barrier estuaries, can impact on ecological character, while in many cases land reclamation destroys or severely degrades the ecosystem (Murray et al. 2015). Conversion for agriculture or aquaculture is the primary driver of mangrove loss (Thomas et al. 2017), particularly in Southeast Asia (Richards & Friess 2016).
Direct drivers also include structural changes to habitat
© G
abrie
l Mej
ia
Ramsar | Global Wetland Outlook | 2018 49
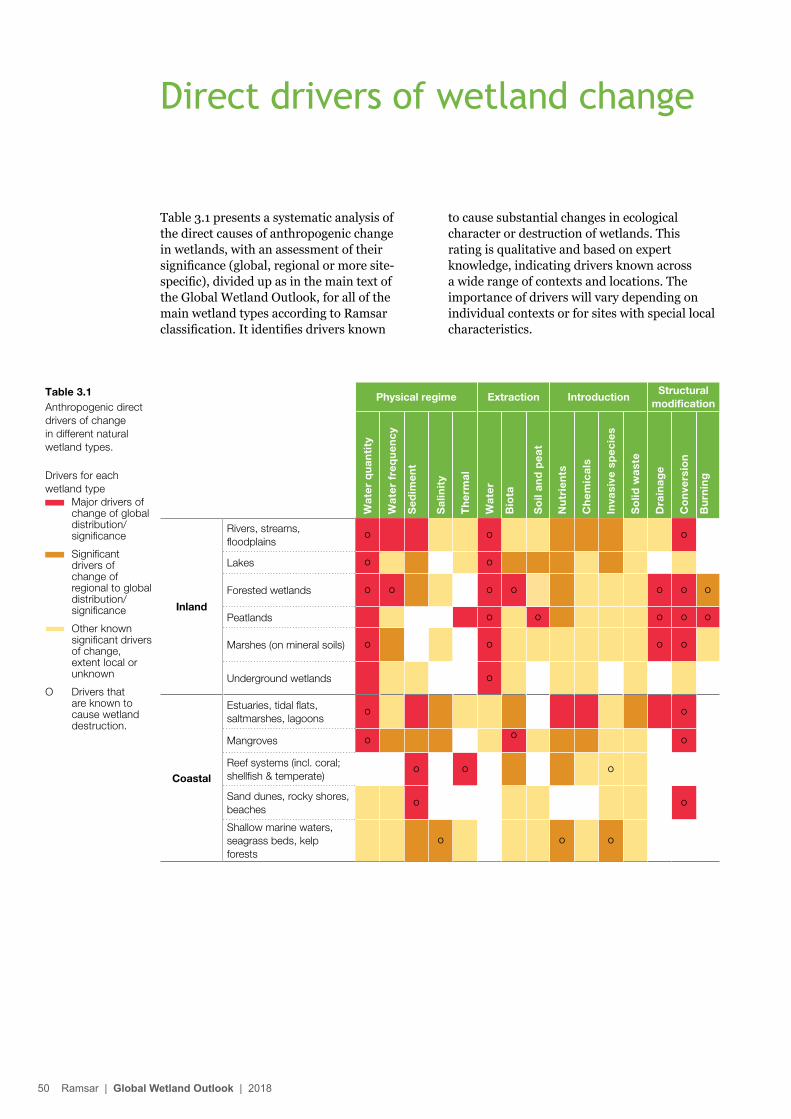
Table 3.1 presents a systematic analysis of the direct causes of anthropogenic change in wetlands, with an assessment of their significance (global, regional or more site-specific), divided up as in the main text of the Global Wetland Outlook, for all of the main wetland types according to Ramsar classification. It identifies drivers known
to cause substantial changes in ecological character or destruction of wetlands. This rating is qualitative and based on expert knowledge, indicating drivers known across a wide range of contexts and locations. The importance of drivers will vary depending on individual contexts or for sites with special local characteristics.
Physical regime Extraction IntroductionStructural
modification
Wat
er q
uan
tity
Wat
er f
req
uen
cy
Sed
imen
t
Sal
init
y
Th
erm
al
Wat
er
Bio
ta
So
il an
d p
eat
Nu
trie
nts
Ch
emic
als
Inva
sive
sp
ecie
s
So
lid w
aste
Dra
inag
e
Co
nve
rsio
n
Bu
rnin
g
Inland
Rivers, streams, floodplains
O O O
Lakes O O
Forested wetlands O O O O O O O
Peatlands O O O O O
Marshes (on mineral soils) O O O O
Underground wetlands O
Coastal
Estuaries, tidal flats, saltmarshes, lagoons
O O
Mangroves O O
O
Reef systems (incl. coral; shellfish & temperate)
O O O
Sand dunes, rocky shores, beaches
O O
Shallow marine waters, seagrass beds, kelp forests
O O O
Table 3.1Anthropogenic direct drivers of change in different natural wetland types.
Drivers for each wetland type
Major drivers of change of global distribution/significance
Significant drivers of change of regional to global distribution/significance
Other known significant drivers of change, extent local or unknown
O Drivers that are known to cause wetland destruction.
Direct drivers of wetland change
C 90M 0Y 50K 0
50 Ramsar | Global Wetland Outlook | 2018
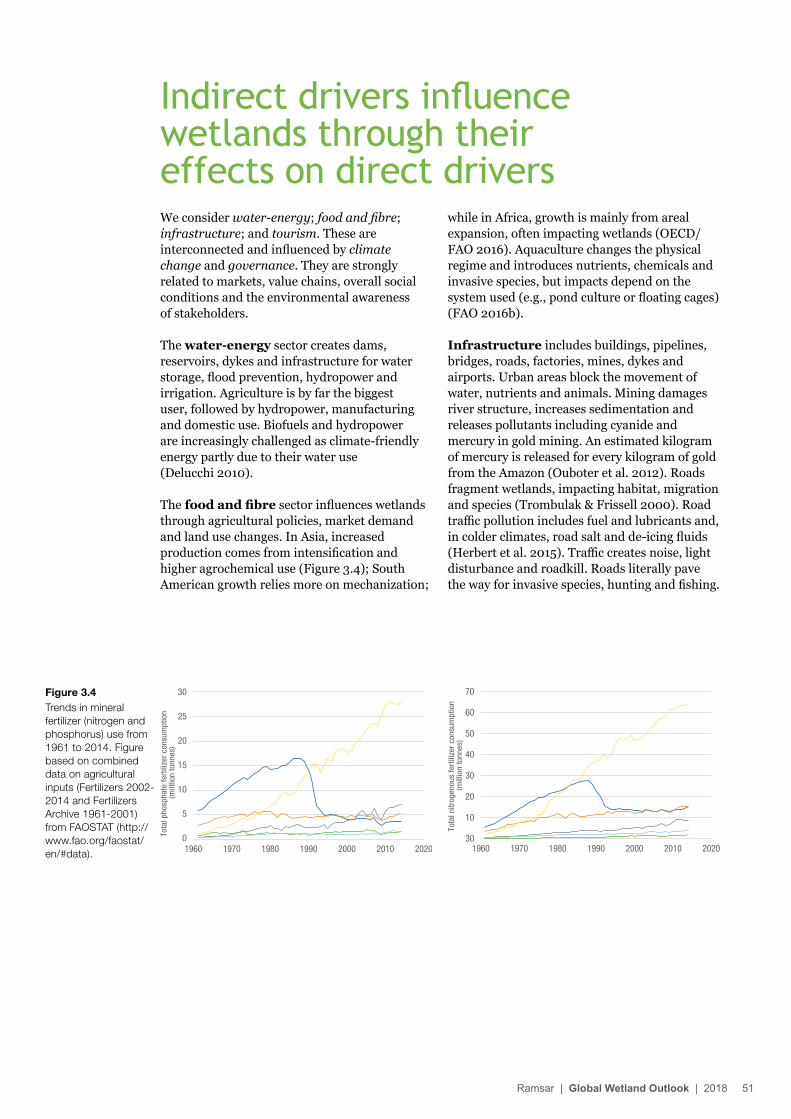
We consider water-energy; food and fibre; infrastructure; and tourism. These are interconnected and influenced by climate change and governance. They are strongly related to markets, value chains, overall social conditions and the environmental awareness of stakeholders.
The water-energy sector creates dams, reservoirs, dykes and infrastructure for water storage, flood prevention, hydropower and irrigation. Agriculture is by far the biggest user, followed by hydropower, manufacturing and domestic use. Biofuels and hydropower are increasingly challenged as climate-friendly energy partly due to their water use (Delucchi 2010).
The food and fibre sector influences wetlands through agricultural policies, market demand and land use changes. In Asia, increased production comes from intensification and higher agrochemical use (Figure 3.4); South American growth relies more on mechanization;
while in Africa, growth is mainly from areal expansion, often impacting wetlands (OECD/FAO 2016). Aquaculture changes the physical regime and introduces nutrients, chemicals and invasive species, but impacts depend on the system used (e.g., pond culture or floating cages) (FAO 2016b).
Infrastructure includes buildings, pipelines, bridges, roads, factories, mines, dykes and airports. Urban areas block the movement of water, nutrients and animals. Mining damages river structure, increases sedimentation and releases pollutants including cyanide and mercury in gold mining. An estimated kilogram of mercury is released for every kilogram of gold from the Amazon (Ouboter et al. 2012). Roads fragment wetlands, impacting habitat, migration and species (Trombulak & Frissell 2000). Road traffic pollution includes fuel and lubricants and, in colder climates, road salt and de-icing fluids (Herbert et al. 2015). Traffic creates noise, light disturbance and roadkill. Roads literally pave the way for invasive species, hunting and fishing.
Indirect drivers influence wetlands through their effects on direct drivers
30
10
20
30
40
50
60
70
Tota
l nitr
ogen
ous
fert
ilize
r co
nsum
ptio
n (m
illio
n to
nnes
)
1960 1970 1980 1990 2000 2010 20200
5
10
15
20
25
30
Tota
l pho
spha
te fe
rtili
zer
cons
umpt
ion
(mill
lion
tonn
es)
1960 1970 1980 1990 2000 2010 2020
Figure 3.4Trends in mineral fertilizer (nitrogen and phosphorus) use from 1961 to 2014. Figure based on combined data on agricultural inputs (Fertilizers 2002-2014 and Fertilizers Archive 1961-2001) from FAOSTAT (http://www.fao.org/faostat/en/#data).
Ramsar | Global Wetland Outlook | 2018 51
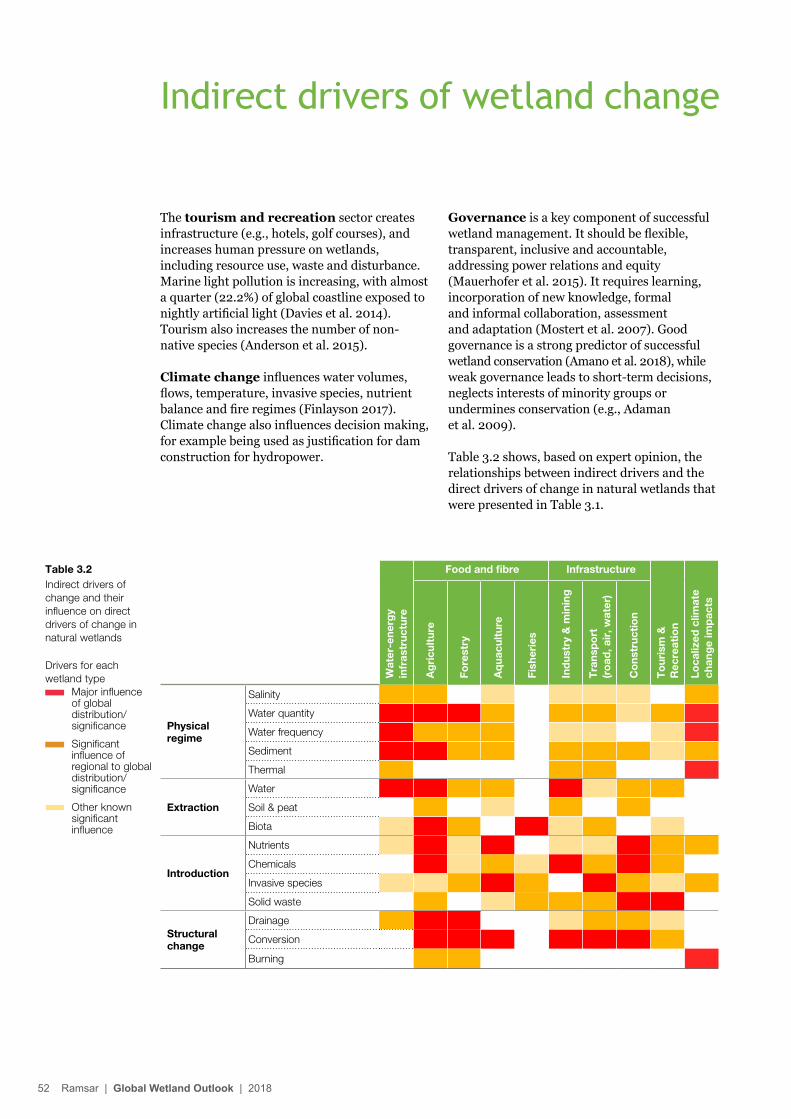
Table 3.2Indirect drivers of change and their influence on direct drivers of change in natural wetlands
Wat
er‑e
nerg
y
infr
astr
uctu
re
Food and fibre Infrastructure
To
uris
m &
R
ecre
atio
n
Loca
lized
clim
ate
chan
ge
imp
acts
Ag
ricu
ltur
e
Fore
stry
Aq
uacu
ltur
e
Fish
erie
s
Ind
ustr
y &
min
ing
Tra
nsp
ort
(r
oad
, air
, wat
er)
Co
nstr
ucti
on
Physical regime
Salinity
Water quantity
Water frequency
Sediment
Thermal
Extraction
Water
Soil & peat
Biota
Introduction
Nutrients
Chemicals
Invasive species
Solid waste
Structural change
Drainage
Conversion
Burning
The tourism and recreation sector creates infrastructure (e.g., hotels, golf courses), and increases human pressure on wetlands, including resource use, waste and disturbance. Marine light pollution is increasing, with almost a quarter (22.2%) of global coastline exposed to nightly artificial light (Davies et al. 2014). Tourism also increases the number of non-native species (Anderson et al. 2015).
Climate change influences water volumes, flows, temperature, invasive species, nutrient balance and fire regimes (Finlayson 2017). Climate change also influences decision making, for example being used as justification for dam construction for hydropower.
Governance is a key component of successful wetland management. It should be flexible, transparent, inclusive and accountable, addressing power relations and equity (Mauerhofer et al. 2015). It requires learning, incorporation of new knowledge, formal and informal collaboration, assessment and adaptation (Mostert et al. 2007). Good governance is a strong predictor of successful wetland conservation (Amano et al. 2018), while weak governance leads to short-term decisions, neglects interests of minority groups or undermines conservation (e.g., Adaman et al. 2009).
Table 3.2 shows, based on expert opinion, the relationships between indirect drivers and the direct drivers of change in natural wetlands that were presented in Table 3.1.
Indirect drivers of wetland change
Drivers for each wetland type
Major influence of global distribution/significance
Significant influence of regional to global distribution/significance
Other known significant influence
52 Ramsar | Global Wetland Outlook | 2018
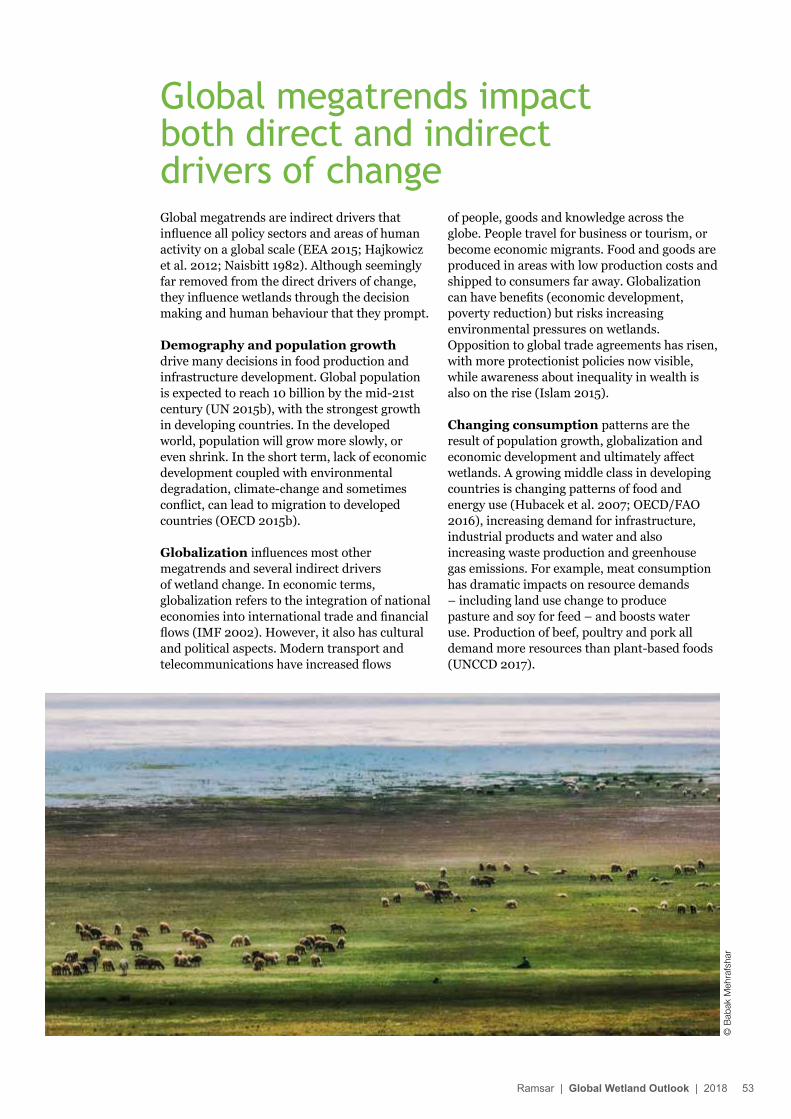
Global megatrends are indirect drivers that influence all policy sectors and areas of human activity on a global scale (EEA 2015; Hajkowicz et al. 2012; Naisbitt 1982). Although seemingly far removed from the direct drivers of change, they influence wetlands through the decision making and human behaviour that they prompt.
Demography and population growth drive many decisions in food production and infrastructure development. Global population is expected to reach 10 billion by the mid-21st century (UN 2015b), with the strongest growth in developing countries. In the developed world, population will grow more slowly, or even shrink. In the short term, lack of economic development coupled with environmental degradation, climate-change and sometimes conflict, can lead to migration to developed countries (OECD 2015b).
Globalization influences most other megatrends and several indirect drivers of wetland change. In economic terms, globalization refers to the integration of national economies into international trade and financial flows (IMF 2002). However, it also has cultural and political aspects. Modern transport and telecommunications have increased flows
of people, goods and knowledge across the globe. People travel for business or tourism, or become economic migrants. Food and goods are produced in areas with low production costs and shipped to consumers far away. Globalization can have benefits (economic development, poverty reduction) but risks increasing environmental pressures on wetlands. Opposition to global trade agreements has risen, with more protectionist policies now visible, while awareness about inequality in wealth is also on the rise (Islam 2015).
Changing consumption patterns are the result of population growth, globalization and economic development and ultimately affect wetlands. A growing middle class in developing countries is changing patterns of food and energy use (Hubacek et al. 2007; OECD/FAO 2016), increasing demand for infrastructure, industrial products and water and also increasing waste production and greenhouse gas emissions. For example, meat consumption has dramatic impacts on resource demands – including land use change to produce pasture and soy for feed – and boosts water use. Production of beef, poultry and pork all demand more resources than plant-based foods (UNCCD 2017).
Global megatrends impact both direct and indirect drivers of change
© B
abak
Meh
rafs
har
Ramsar | Global Wetland Outlook | 2018 53
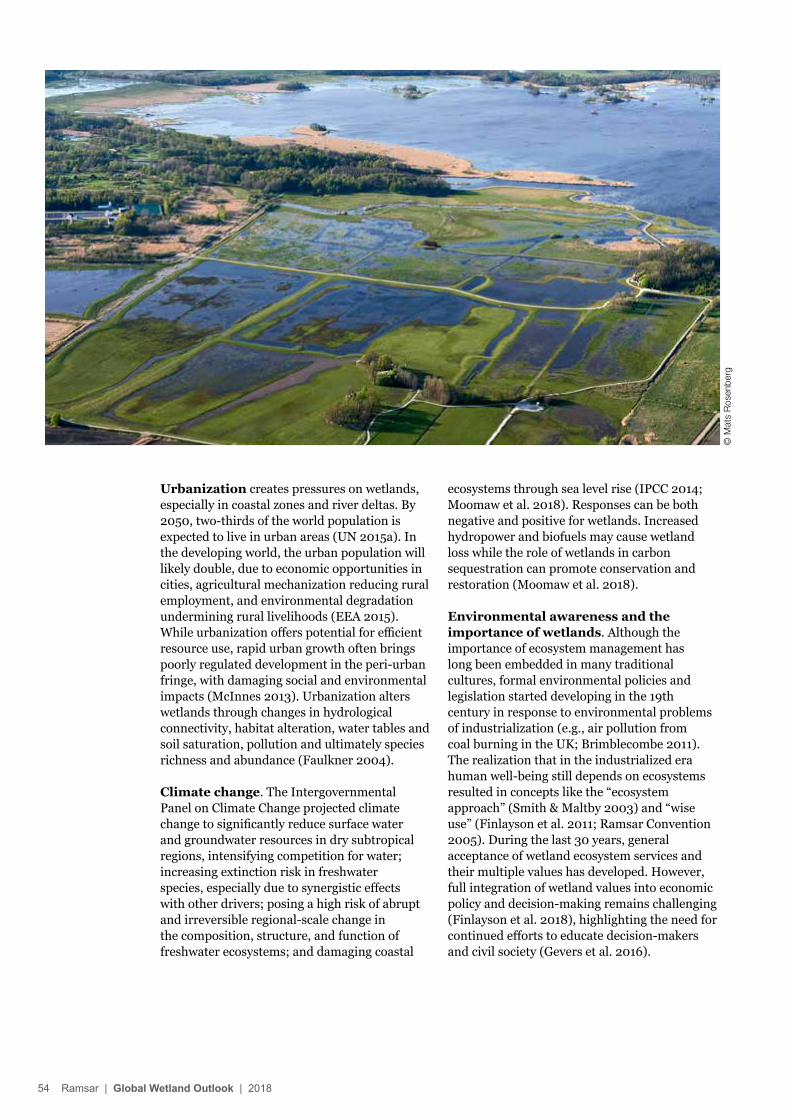
Urbanization creates pressures on wetlands, especially in coastal zones and river deltas. By 2050, two-thirds of the world population is expected to live in urban areas (UN 2015a). In the developing world, the urban population will likely double, due to economic opportunities in cities, agricultural mechanization reducing rural employment, and environmental degradation undermining rural livelihoods (EEA 2015). While urbanization offers potential for efficient resource use, rapid urban growth often brings poorly regulated development in the peri-urban fringe, with damaging social and environmental impacts (McInnes 2013). Urbanization alters wetlands through changes in hydrological connectivity, habitat alteration, water tables and soil saturation, pollution and ultimately species richness and abundance (Faulkner 2004).
Climate change. The Intergovernmental Panel on Climate Change projected climate change to significantly reduce surface water and groundwater resources in dry subtropical regions, intensifying competition for water; increasing extinction risk in freshwater species, especially due to synergistic effects with other drivers; posing a high risk of abrupt and irreversible regional-scale change in the composition, structure, and function of freshwater ecosystems; and damaging coastal
ecosystems through sea level rise (IPCC 2014; Moomaw et al. 2018). Responses can be both negative and positive for wetlands. Increased hydropower and biofuels may cause wetland loss while the role of wetlands in carbon sequestration can promote conservation and restoration (Moomaw et al. 2018).
Environmental awareness and the importance of wetlands. Although the importance of ecosystem management has long been embedded in many traditional cultures, formal environmental policies and legislation started developing in the 19th century in response to environmental problems of industrialization (e.g., air pollution from coal burning in the UK; Brimblecombe 2011). The realization that in the industrialized era human well-being still depends on ecosystems resulted in concepts like the “ecosystem approach” (Smith & Maltby 2003) and “wise use” (Finlayson et al. 2011; Ramsar Convention 2005). During the last 30 years, general acceptance of wetland ecosystem services and their multiple values has developed. However, full integration of wetland values into economic policy and decision-making remains challenging (Finlayson et al. 2018), highlighting the need for continued efforts to educate decision-makers and civil society (Gevers et al. 2016).
© M
ats
Ros
enbe
rg
54 Ramsar | Global Wetland Outlook | 2018
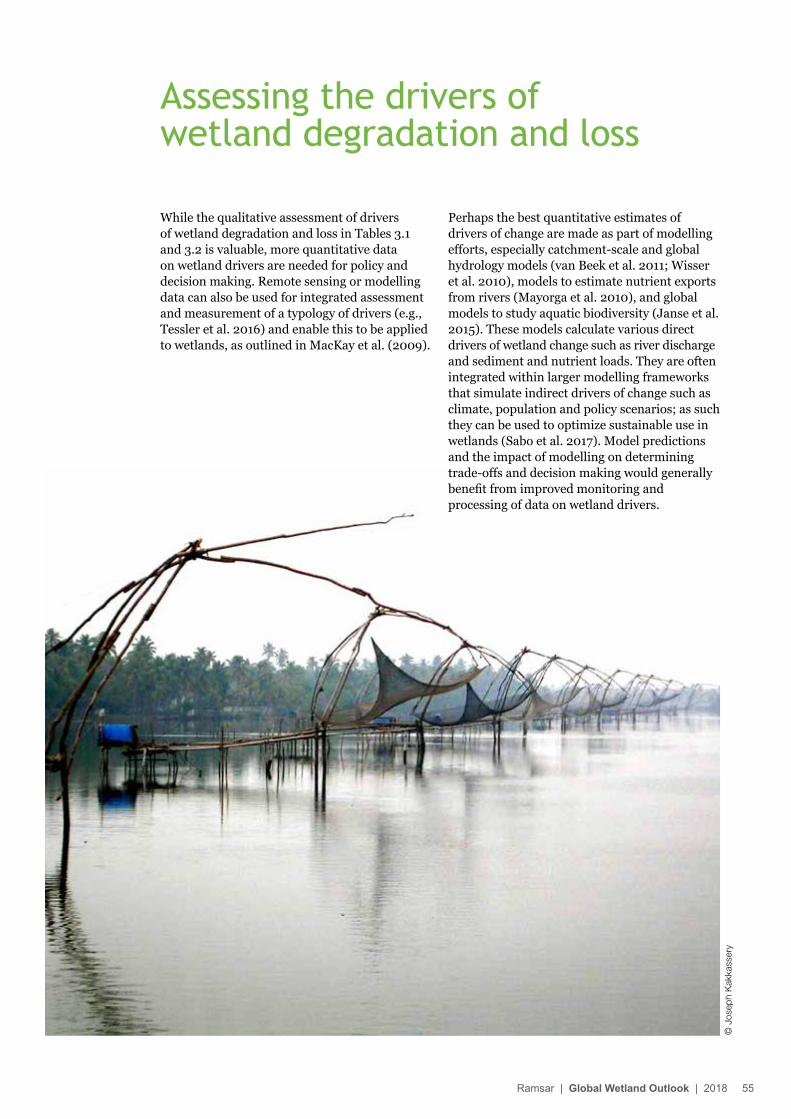
Assessing the drivers of wetland degradation and loss
While the qualitative assessment of drivers of wetland degradation and loss in Tables 3.1 and 3.2 is valuable, more quantitative data on wetland drivers are needed for policy and decision making. Remote sensing or modelling data can also be used for integrated assessment and measurement of a typology of drivers (e.g., Tessler et al. 2016) and enable this to be applied to wetlands, as outlined in MacKay et al. (2009).
Perhaps the best quantitative estimates of drivers of change are made as part of modelling efforts, especially catchment-scale and global hydrology models (van Beek et al. 2011; Wisser et al. 2010), models to estimate nutrient exports from rivers (Mayorga et al. 2010), and global models to study aquatic biodiversity (Janse et al. 2015). These models calculate various direct drivers of wetland change such as river discharge and sediment and nutrient loads. They are often integrated within larger modelling frameworks that simulate indirect drivers of change such as climate, population and policy scenarios; as such they can be used to optimize sustainable use in wetlands (Sabo et al. 2017). Model predictions and the impact of modelling on determining trade-offs and decision making would generally benefit from improved monitoring and processing of data on wetland drivers.
© J
osep
h K
akka
sser
y
Ramsar | Global Wetland Outlook | 2018 55
Responses must address many challenges simultaneously. Enhancing the network of Ramsar Sites, and of other protected and conserved areas, ensures a conservation framework. Integrating wetlands into the post-2015 development agenda, and the Sustainable Development Goals, will help achieve wise use. Ramsar has several mechanisms to respond to problems and to measure progress towards goals. Other tools are also needed: legal and policy instruments, economic and financial incentives and sustainable production. Capacity building and encouraging diverse perspectives are both critical to success.
4. RESPONSES
© C
harli
e W
aite
56 Ramsar | Global Wetland Outlook | 2018
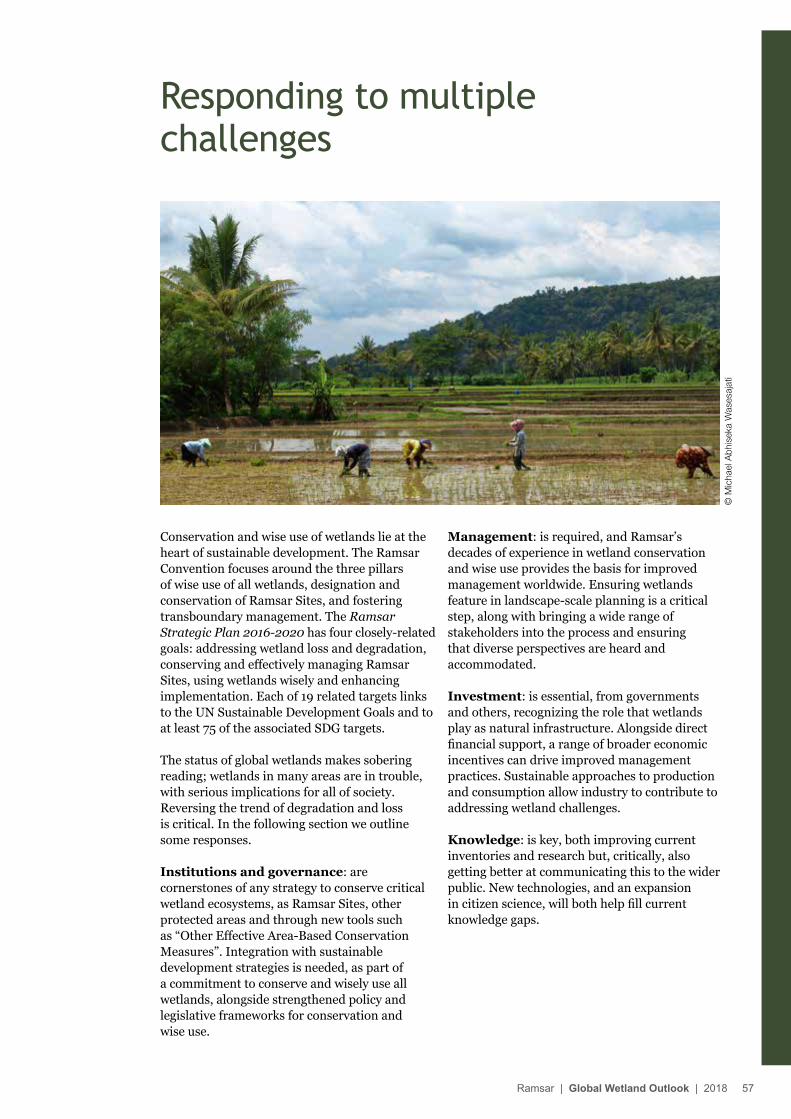
Responding to multiple challenges
Conservation and wise use of wetlands lie at the heart of sustainable development. The Ramsar Convention focuses around the three pillars of wise use of all wetlands, designation and conservation of Ramsar Sites, and fostering transboundary management. The Ramsar Strategic Plan 2016-2020 has four closely-related goals: addressing wetland loss and degradation, conserving and effectively managing Ramsar Sites, using wetlands wisely and enhancing implementation. Each of 19 related targets links to the UN Sustainable Development Goals and to at least 75 of the associated SDG targets.
The status of global wetlands makes sobering reading; wetlands in many areas are in trouble, with serious implications for all of society. Reversing the trend of degradation and loss is critical. In the following section we outline some responses.
Institutions and governance: are cornerstones of any strategy to conserve critical wetland ecosystems, as Ramsar Sites, other protected areas and through new tools such as “Other Effective Area-Based Conservation Measures”. Integration with sustainable development strategies is needed, as part of a commitment to conserve and wisely use all wetlands, alongside strengthened policy and legislative frameworks for conservation and wise use.
Management: is required, and Ramsar’s decades of experience in wetland conservation and wise use provides the basis for improved management worldwide. Ensuring wetlands feature in landscape-scale planning is a critical step, along with bringing a wide range of stakeholders into the process and ensuring that diverse perspectives are heard and accommodated.
Investment: is essential, from governments and others, recognizing the role that wetlands play as natural infrastructure. Alongside direct financial support, a range of broader economic incentives can drive improved management practices. Sustainable approaches to production and consumption allow industry to contribute to addressing wetland challenges.
Knowledge: is key, both improving current inventories and research but, critically, also getting better at communicating this to the wider public. New technologies, and an expansion in citizen science, will both help fill current knowledge gaps.
© M
icha
el A
bhis
eka
Was
esaj
ati
Ramsar | Global Wetland Outlook | 2018 57
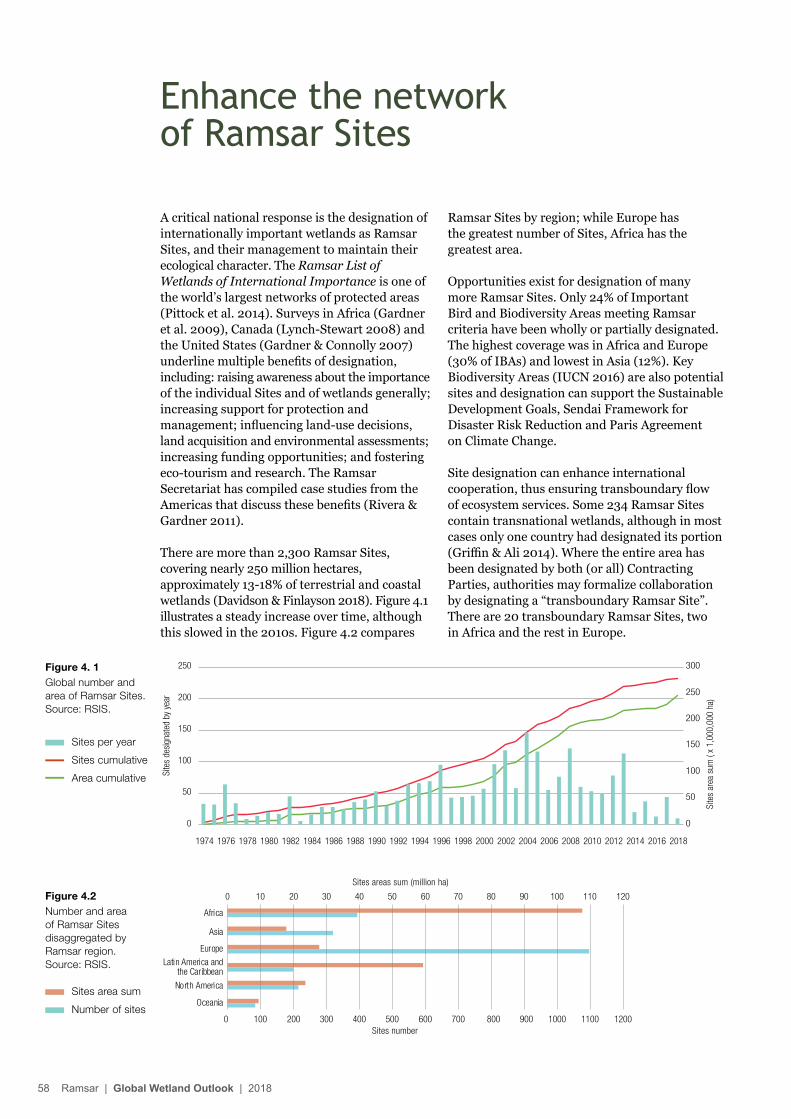
A critical national response is the designation of internationally important wetlands as Ramsar Sites, and their management to maintain their ecological character. The Ramsar List of Wetlands of International Importance is one of the world’s largest networks of protected areas (Pittock et al. 2014). Surveys in Africa (Gardner et al. 2009), Canada (Lynch-Stewart 2008) and the United States (Gardner & Connolly 2007) underline multiple benefits of designation, including: raising awareness about the importance of the individual Sites and of wetlands generally; increasing support for protection and management; influencing land-use decisions, land acquisition and environmental assessments; increasing funding opportunities; and fostering eco-tourism and research. The Ramsar Secretariat has compiled case studies from the Americas that discuss these benefits (Rivera & Gardner 2011).
There are more than 2,300 Ramsar Sites, covering nearly 250 million hectares, approximately 13-18% of terrestrial and coastal wetlands (Davidson & Finlayson 2018). Figure 4.1 illustrates a steady increase over time, although this slowed in the 2010s. Figure 4.2 compares
Enhance the network of Ramsar Sites
0
50
100
150150
200
250
300
0
50
100
150
Site
s de
sign
ated
by
year
Site
s ar
ea s
um (
x 1,
000,
000
ha)200
250
1974 1976 1978 1980 1982 1984 1986 1988 1990 1992 1994 1996 1998 2000 2002 2004 2006 2008 2010 2012 2014 2016 2018
Figure 4. 1Global number and area of Ramsar Sites. Source: RSIS.
Figure 4.2Number and area of Ramsar Sites disaggregated by Ramsar region. Source: RSIS.
Ramsar Sites by region; while Europe has the greatest number of Sites, Africa has the greatest area.
Opportunities exist for designation of many more Ramsar Sites. Only 24% of Important Bird and Biodiversity Areas meeting Ramsar criteria have been wholly or partially designated. The highest coverage was in Africa and Europe (30% of IBAs) and lowest in Asia (12%). Key Biodiversity Areas (IUCN 2016) are also potential sites and designation can support the Sustainable Development Goals, Sendai Framework for Disaster Risk Reduction and Paris Agreement on Climate Change.
Site designation can enhance international cooperation, thus ensuring transboundary flow of ecosystem services. Some 234 Ramsar Sites contain transnational wetlands, although in most cases only one country had designated its portion (Griffin & Ali 2014). Where the entire area has been designated by both (or all) Contracting Parties, authorities may formalize collaboration by designating a “transboundary Ramsar Site”. There are 20 transboundary Ramsar Sites, two in Africa and the rest in Europe.
0 200100 400 600 800 1000300 500 700 900 1100 1200
0 20 40 60 80 100 12010 30 50 70 90 110
Africa
Sites areas sum (million ha)
Sites number
Asia
Europe
Latin America andthe Caribbean
North America
Oceania Sites area sum
Number of sites
Sites per year
Sites cumulative
Area cumulative
58 Ramsar | Global Wetland Outlook | 2018
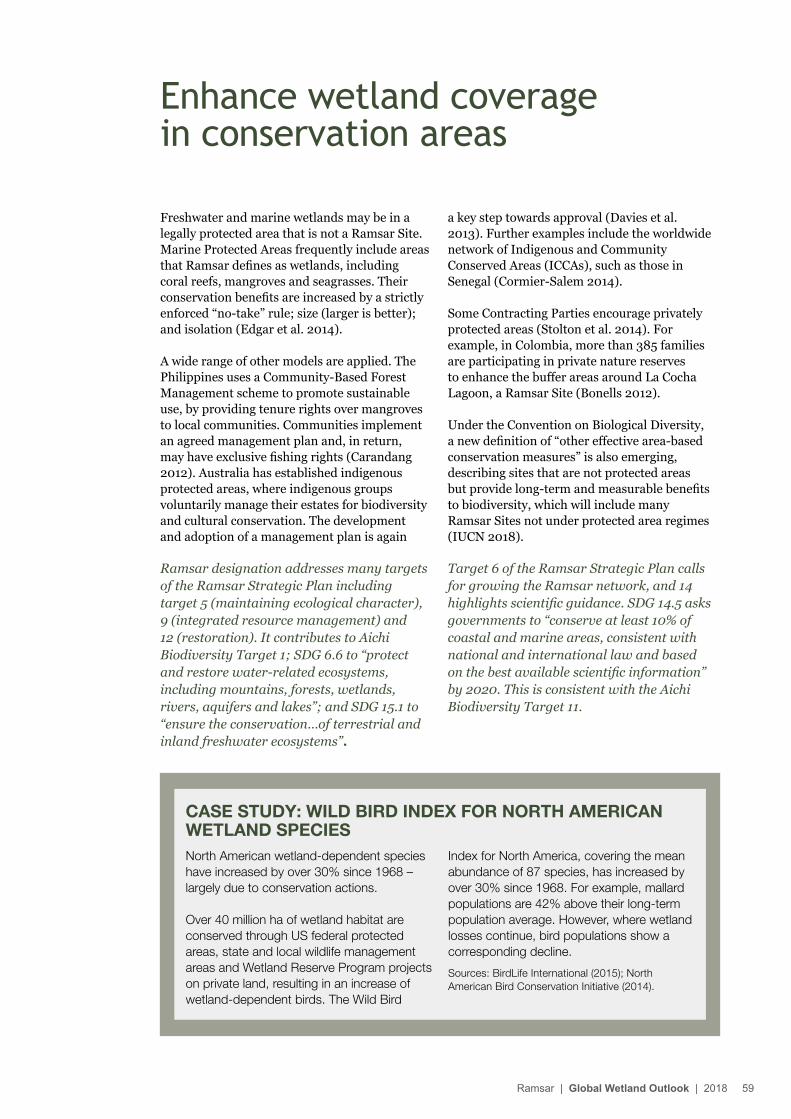
Freshwater and marine wetlands may be in a legally protected area that is not a Ramsar Site. Marine Protected Areas frequently include areas that Ramsar defines as wetlands, including coral reefs, mangroves and seagrasses. Their conservation benefits are increased by a strictly enforced “no-take” rule; size (larger is better); and isolation (Edgar et al. 2014).
A wide range of other models are applied. The Philippines uses a Community-Based Forest Management scheme to promote sustainable use, by providing tenure rights over mangroves to local communities. Communities implement an agreed management plan and, in return, may have exclusive fishing rights (Carandang 2012). Australia has established indigenous protected areas, where indigenous groups voluntarily manage their estates for biodiversity and cultural conservation. The development and adoption of a management plan is again
Ramsar designation addresses many targets of the Ramsar Strategic Plan including target 5 (maintaining ecological character), 9 (integrated resource management) and 12 (restoration). It contributes to Aichi Biodiversity Target 1; SDG 6.6 to “protect and restore water-related ecosystems, including mountains, forests, wetlands, rivers, aquifers and lakes”; and SDG 15.1 to “ensure the conservation…of terrestrial and inland freshwater ecosystems”.
Enhance wetland coverage in conservation areas
Target 6 of the Ramsar Strategic Plan calls for growing the Ramsar network, and 14 highlights scientific guidance. SDG 14.5 asks governments to “conserve at least 10% of coastal and marine areas, consistent with national and international law and based on the best available scientific information” by 2020. This is consistent with the Aichi Biodiversity Target 11.
a key step towards approval (Davies et al. 2013). Further examples include the worldwide network of Indigenous and Community Conserved Areas (ICCAs), such as those in Senegal (Cormier-Salem 2014).
Some Contracting Parties encourage privately protected areas (Stolton et al. 2014). For example, in Colombia, more than 385 families are participating in private nature reserves to enhance the buffer areas around La Cocha Lagoon, a Ramsar Site (Bonells 2012).
Under the Convention on Biological Diversity, a new definition of “other effective area-based conservation measures” is also emerging, describing sites that are not protected areas but provide long-term and measurable benefits to biodiversity, which will include many Ramsar Sites not under protected area regimes (IUCN 2018).
CASE STUDY: WILD BIRD INDEX FOR NORTH AMERICAN WETLAND SPECIES North American wetland-dependent species have increased by over 30% since 1968 – largely due to conservation actions.
Over 40 million ha of wetland habitat are conserved through US federal protected areas, state and local wildlife management areas and Wetland Reserve Program projects on private land, resulting in an increase of wetland-dependent birds. The Wild Bird
Index for North America, covering the mean abundance of 87 species, has increased by over 30% since 1968. For example, mallard populations are 42% above their long-term population average. However, where wetland losses continue, bird populations show a corresponding decline.
Sources: BirdLife International (2015); North American Bird Conservation Initiative (2014).
Ramsar | Global Wetland Outlook | 2018 59
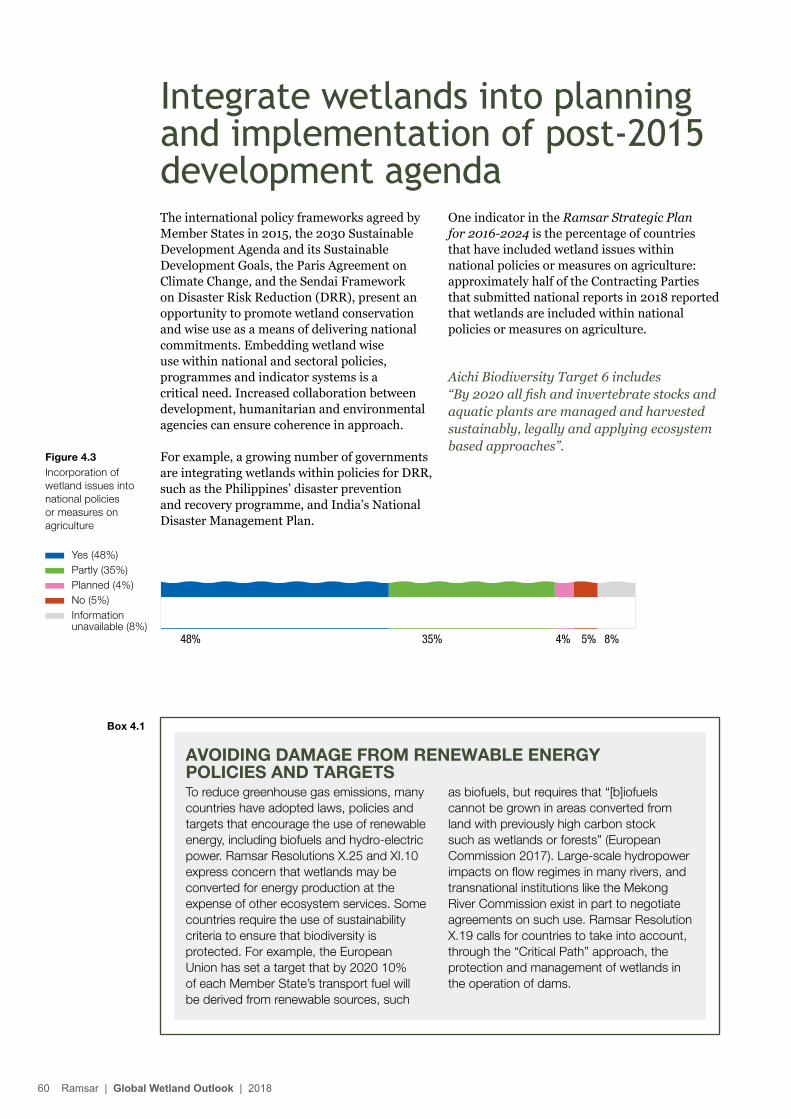
The international policy frameworks agreed by Member States in 2015, the 2030 Sustainable Development Agenda and its Sustainable Development Goals, the Paris Agreement on Climate Change, and the Sendai Framework on Disaster Risk Reduction (DRR), present an opportunity to promote wetland conservation and wise use as a means of delivering national commitments. Embedding wetland wise use within national and sectoral policies, programmes and indicator systems is a critical need. Increased collaboration between development, humanitarian and environmental agencies can ensure coherence in approach.
For example, a growing number of governments are integrating wetlands within policies for DRR, such as the Philippines’ disaster prevention and recovery programme, and India’s National Disaster Management Plan.
One indicator in the Ramsar Strategic Plan for 2016-2024 is the percentage of countries that have included wetland issues within national policies or measures on agriculture: approximately half of the Contracting Parties that submitted national reports in 2018 reported that wetlands are included within national policies or measures on agriculture.
Aichi Biodiversity Target 6 includes “By 2020 all fish and invertebrate stocks and aquatic plants are managed and harvested sustainably, legally and applying ecosystem based approaches”.
Integrate wetlands into planning and implementation of post-2015 development agenda
Figure 4.3Incorporation of wetland issues into national policies or measures on agriculture
48% 35% 4% 5% 8%
AVOIDING DAMAGE FROM RENEWABLE ENERGY POLICIES AND TARGETSTo reduce greenhouse gas emissions, many countries have adopted laws, policies and targets that encourage the use of renewable energy, including biofuels and hydro-electric power. Ramsar Resolutions X.25 and XI.10 express concern that wetlands may be converted for energy production at the expense of other ecosystem services. Some countries require the use of sustainability criteria to ensure that biodiversity is protected. For example, the European Union has set a target that by 2020 10% of each Member State’s transport fuel will be derived from renewable sources, such
as biofuels, but requires that “[b]iofuels cannot be grown in areas converted from land with previously high carbon stock such as wetlands or forests” (European Commission 2017). Large-scale hydropower impacts on flow regimes in many rivers, and transnational institutions like the Mekong River Commission exist in part to negotiate agreements on such use. Ramsar Resolution X.19 calls for countries to take into account, through the “Critical Path” approach, the protection and management of wetlands in the operation of dams.
Box 4.1
Yes (48%) Partly (35%) Planned (4%) No (5%) Information
unavailable (8%)
60 Ramsar | Global Wetland Outlook | 2018
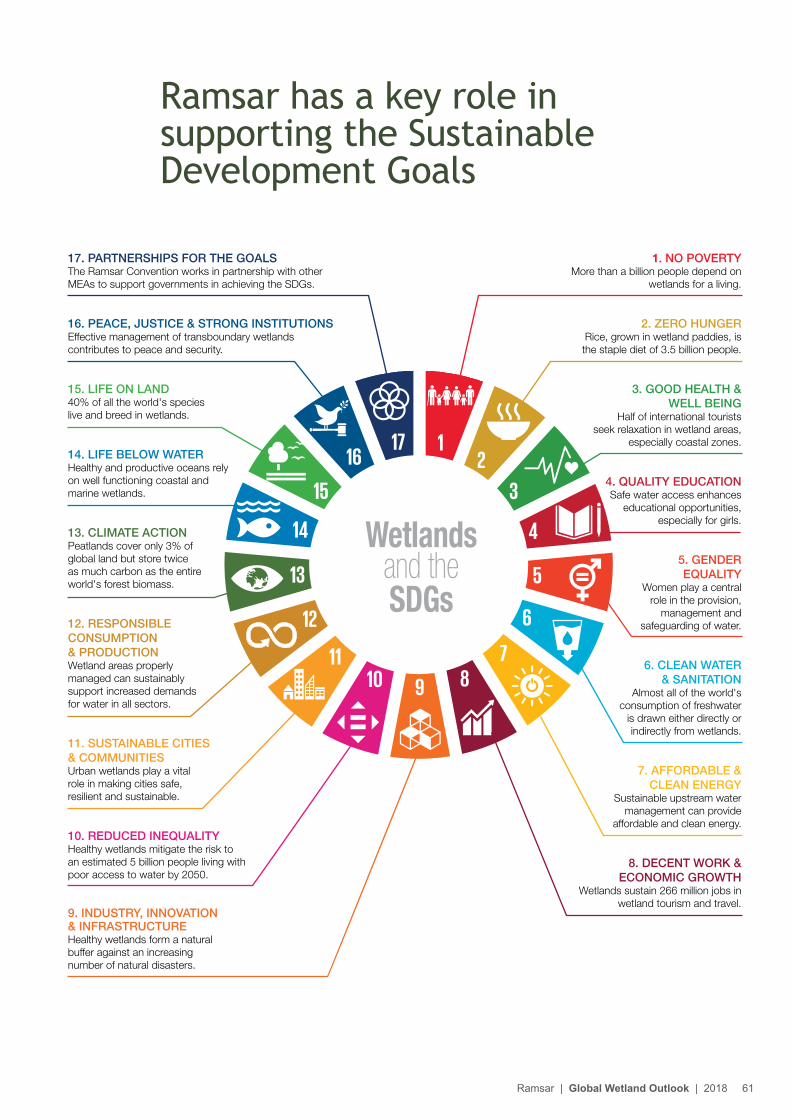
1. NO POVERTY More than a billion people depend on
wetlands for a living.
2. ZERO HUNGER Rice, grown in wetland paddies, is the staple diet of 3.5 billion people.
3. GOOD HEALTH & WELL BEING
Half of international tourists seek relaxation in wetland areas,
especially coastal zones.
4. QUALITY EDUCATION Safe water access enhances
educational opportunities, especially for girls.
5. GENDER EQUALITY
Women play a central role in the provision,
management and safeguarding of water.
6. CLEAN WATER & SANITATION
Almost all of the world's consumption of freshwater
is drawn either directly or indirectly from wetlands.
7. AFFORDABLE & CLEAN ENERGY
Sustainable upstream water management can provide
affordable and clean energy.
8. DECENT WORK & ECONOMIC GROWTH
Wetlands sustain 266 million jobs in wetland tourism and travel.
17. PARTNERSHIPS FOR THE GOALS The Ramsar Convention works in partnership with other MEAs to support governments in achieving the SDGs.
16. PEACE, JUSTICE & STRONG INSTITUTIONS Effective management of transboundary wetlands contributes to peace and security.
15. LIFE ON LAND40% of all the world's species live and breed in wetlands.
14. LIFE BELOW WATER Healthy and productive oceans rely on well functioning coastal and marine wetlands.
13. CLIMATE ACTION Peatlands cover only 3% of global land but store twice as much carbon as the entire world's forest biomass.
12. RESPONSIBLE CONSUMPTION & PRODUCTION Wetland areas properly managed can sustainably support increased demands for water in all sectors.
11. SUSTAINABLE CITIES & COMMUNITIES Urban wetlands play a vital role in making cities safe, resilient and sustainable.
10. REDUCED INEQUALITY Healthy wetlands mitigate the risk to an estimated 5 billion people living with poor access to water by 2050.
9. INDUSTRY, INNOVATION & INFRASTRUCTURE Healthy wetlands form a natural buffer against an increasing number of natural disasters.
Ramsar has a key role in supporting the Sustainable Development Goals
Ramsar | Global Wetland Outlook | 2018 61
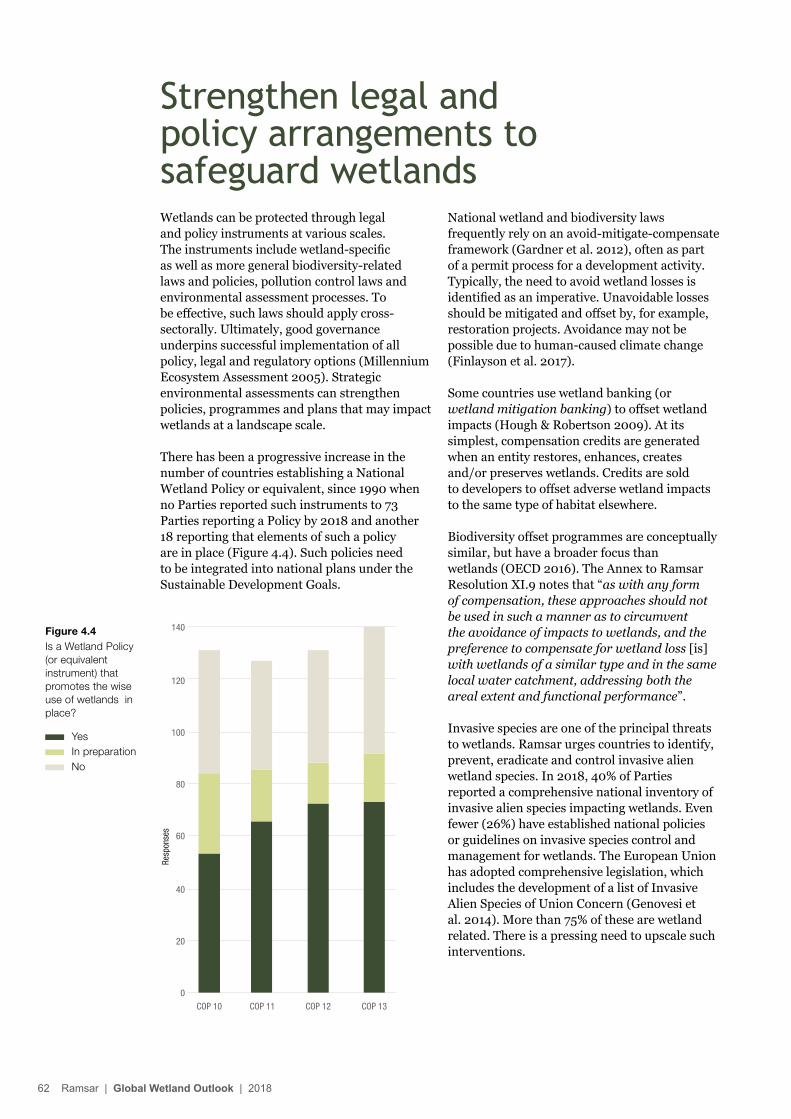
Wetlands can be protected through legal and policy instruments at various scales. The instruments include wetland-specific as well as more general biodiversity-related laws and policies, pollution control laws and environmental assessment processes. To be effective, such laws should apply cross-sectorally. Ultimately, good governance underpins successful implementation of all policy, legal and regulatory options (Millennium Ecosystem Assessment 2005). Strategic environmental assessments can strengthen policies, programmes and plans that may impact wetlands at a landscape scale.
There has been a progressive increase in the number of countries establishing a National Wetland Policy or equivalent, since 1990 when no Parties reported such instruments to 73 Parties reporting a Policy by 2018 and another 18 reporting that elements of such a policy are in place (Figure 4.4). Such policies need to be integrated into national plans under the Sustainable Development Goals.
Figure 4.4Is a Wetland Policy (or equivalent instrument) that promotes the wise use of wetlands in place?
0
20
40
60
80
100
120
140
COP 10 COP 11 COP 12 COP 13
Resp
onse
s
Strengthen legal and policy arrangements to safeguard wetlands
National wetland and biodiversity laws frequently rely on an avoid-mitigate-compensate framework (Gardner et al. 2012), often as part of a permit process for a development activity. Typically, the need to avoid wetland losses is identified as an imperative. Unavoidable losses should be mitigated and offset by, for example, restoration projects. Avoidance may not be possible due to human-caused climate change (Finlayson et al. 2017).
Some countries use wetland banking (or wetland mitigation banking) to offset wetland impacts (Hough & Robertson 2009). At its simplest, compensation credits are generated when an entity restores, enhances, creates and/or preserves wetlands. Credits are sold to developers to offset adverse wetland impacts to the same type of habitat elsewhere.
Biodiversity offset programmes are conceptually similar, but have a broader focus than wetlands (OECD 2016). The Annex to Ramsar Resolution XI.9 notes that “as with any form of compensation, these approaches should not be used in such a manner as to circumvent the avoidance of impacts to wetlands, and the preference to compensate for wetland loss [is] with wetlands of a similar type and in the same local water catchment, addressing both the areal extent and functional performance”.
Invasive species are one of the principal threats to wetlands. Ramsar urges countries to identify, prevent, eradicate and control invasive alien wetland species. In 2018, 40% of Parties reported a comprehensive national inventory of invasive alien species impacting wetlands. Even fewer (26%) have established national policies or guidelines on invasive species control and management for wetlands. The European Union has adopted comprehensive legislation, which includes the development of a list of Invasive Alien Species of Union Concern (Genovesi et al. 2014). More than 75% of these are wetland related. There is a pressing need to upscale such interventions.
Yes In preparation No
62 Ramsar | Global Wetland Outlook | 2018
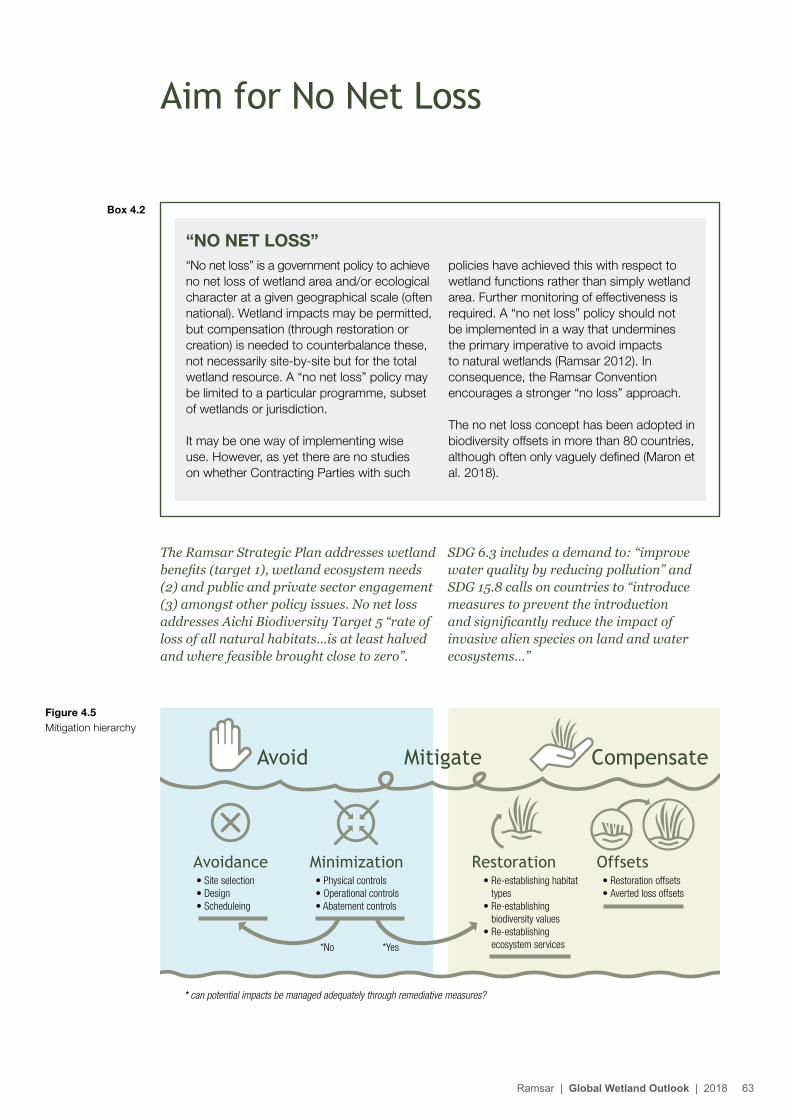
Figure 4.5Mitigation hierarchy
Aim for No Net Loss
SDG 6.3 includes a demand to: “improve water quality by reducing pollution” and SDG 15.8 calls on countries to “introduce measures to prevent the introduction and significantly reduce the impact of invasive alien species on land and water ecosystems…”
Box 4.2
The Ramsar Strategic Plan addresses wetland benefits (target 1), wetland ecosystem needs (2) and public and private sector engagement (3) amongst other policy issues. No net loss addresses Aichi Biodiversity Target 5 “rate of loss of all natural habitats…is at least halved and where feasible brought close to zero”.
“NO NET LOSS”“No net loss” is a government policy to achieve no net loss of wetland area and/or ecological character at a given geographical scale (often national). Wetland impacts may be permitted, but compensation (through restoration or creation) is needed to counterbalance these, not necessarily site-by-site but for the total wetland resource. A “no net loss” policy may be limited to a particular programme, subset of wetlands or jurisdiction.
It may be one way of implementing wise use. However, as yet there are no studies on whether Contracting Parties with such
policies have achieved this with respect to wetland functions rather than simply wetland area. Further monitoring of effectiveness is required. A “no net loss” policy should not be implemented in a way that undermines the primary imperative to avoid impacts to natural wetlands (Ramsar 2012). In consequence, the Ramsar Convention encourages a stronger “no loss” approach.
The no net loss concept has been adopted in biodiversity offsets in more than 80 countries, although often only vaguely defined (Maron et al. 2018).
• Site selection• Design• Scheduleing
• Physical controls• Operational controls• Abatement controls
• Re-establishing habitat types
• Re-establishing biodiversity values
• Re-establishing ecosystem services
• Restoration offsets• Averted loss offsets
Avoid Mitigate Compensate
Avoidance Minimization Restoration Offsets
* can potential impacts be managed adequately through remediative measures?
*No *Yes
Ramsar | Global Wetland Outlook | 2018 63
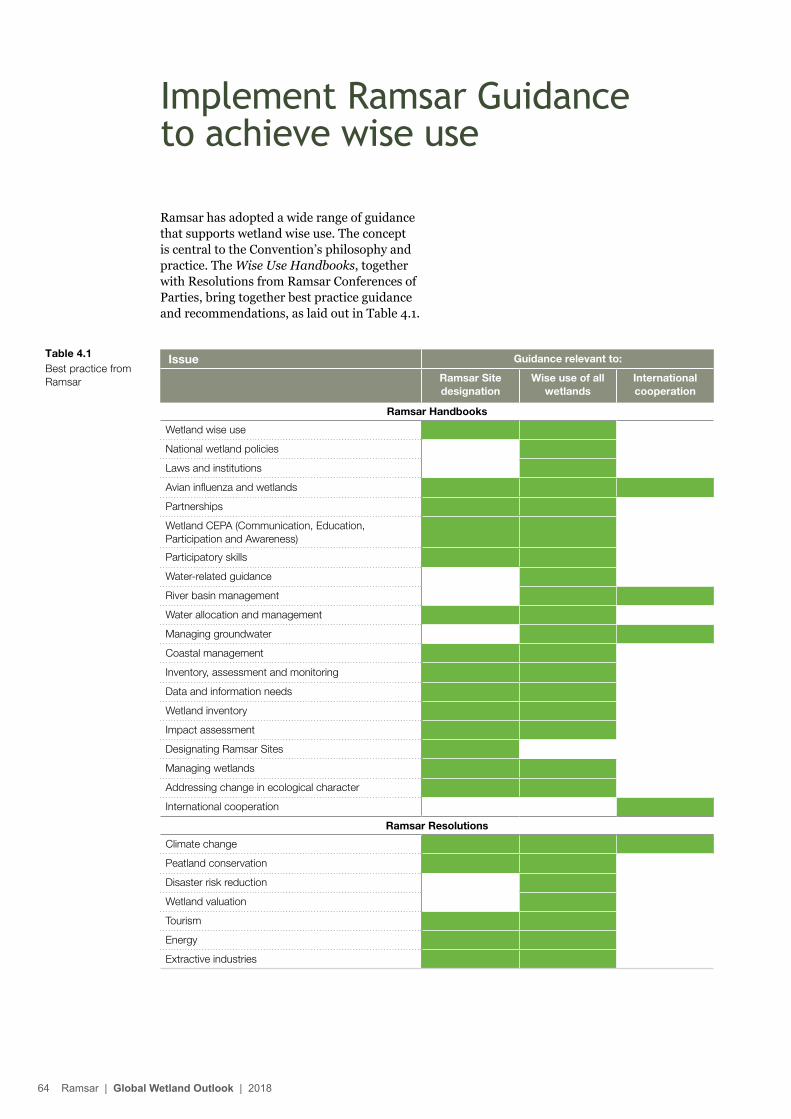
Ramsar has adopted a wide range of guidance that supports wetland wise use. The concept is central to the Convention’s philosophy and practice. The Wise Use Handbooks, together with Resolutions from Ramsar Conferences of Parties, bring together best practice guidance and recommendations, as laid out in Table 4.1.
Implement Ramsar Guidance to achieve wise use
Table 4.1Best practice from Ramsar
Issue Guidance relevant to:
Ramsar Site designation
Wise use of all wetlands
International cooperation
Ramsar Handbooks
Wetland wise use
National wetland policies
Laws and institutions
Avian influenza and wetlands
Partnerships
Wetland CEPA (Communication, Education, Participation and Awareness)
Participatory skills
Water-related guidance
River basin management
Water allocation and management
Managing groundwater
Coastal management
Inventory, assessment and monitoring
Data and information needs
Wetland inventory
Impact assessment
Designating Ramsar Sites
Managing wetlands
Addressing change in ecological character
International cooperation
Ramsar Resolutions
Climate change
Peatland conservation
Disaster risk reduction
Wetland valuation
Tourism
Energy
Extractive industries
64 Ramsar | Global Wetland Outlook | 2018
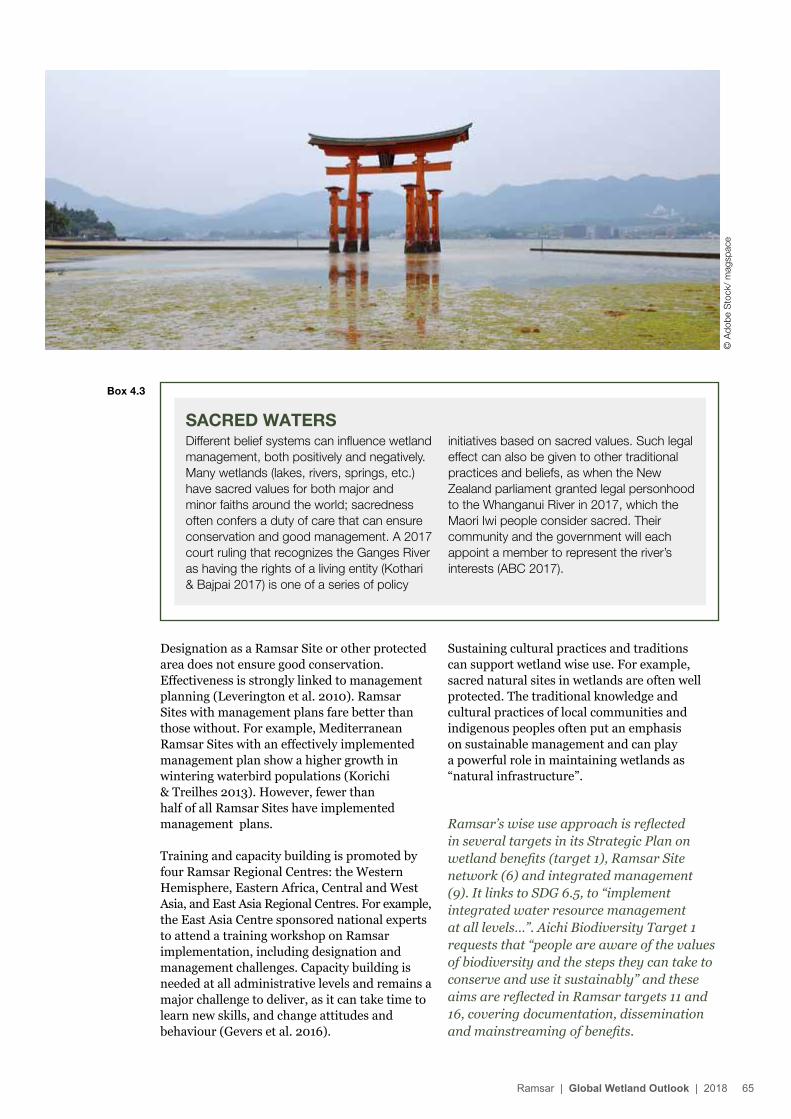
Designation as a Ramsar Site or other protected area does not ensure good conservation. Effectiveness is strongly linked to management planning (Leverington et al. 2010). Ramsar Sites with management plans fare better than those without. For example, Mediterranean Ramsar Sites with an effectively implemented management plan show a higher growth in wintering waterbird populations (Korichi & Treilhes 2013). However, fewer than half of all Ramsar Sites have implemented management plans.
Training and capacity building is promoted by four Ramsar Regional Centres: the Western Hemisphere, Eastern Africa, Central and West Asia, and East Asia Regional Centres. For example, the East Asia Centre sponsored national experts to attend a training workshop on Ramsar implementation, including designation and management challenges. Capacity building is needed at all administrative levels and remains a major challenge to deliver, as it can take time to learn new skills, and change attitudes and behaviour (Gevers et al. 2016).
Sustaining cultural practices and traditions can support wetland wise use. For example, sacred natural sites in wetlands are often well protected. The traditional knowledge and cultural practices of local communities and indigenous peoples often put an emphasis on sustainable management and can play a powerful role in maintaining wetlands as “natural infrastructure”.
Ramsar’s wise use approach is reflected in several targets in its Strategic Plan on wetland benefits (target 1), Ramsar Site network (6) and integrated management (9). It links to SDG 6.5, to “implement integrated water resource management at all levels…”. Aichi Biodiversity Target 1 requests that “people are aware of the values of biodiversity and the steps they can take to conserve and use it sustainably” and these aims are reflected in Ramsar targets 11 and 16, covering documentation, dissemination and mainstreaming of benefits.
SACRED WATERSDifferent belief systems can influence wetland management, both positively and negatively. Many wetlands (lakes, rivers, springs, etc.) have sacred values for both major and minor faiths around the world; sacredness often confers a duty of care that can ensure conservation and good management. A 2017 court ruling that recognizes the Ganges River as having the rights of a living entity (Kothari & Bajpai 2017) is one of a series of policy
initiatives based on sacred values. Such legal effect can also be given to other traditional practices and beliefs, as when the New Zealand parliament granted legal personhood to the Whanganui River in 2017, which the Maori Iwi people consider sacred. Their community and the government will each appoint a member to represent the river’s interests (ABC 2017).
Box 4.3
© A
dobe
Sto
ck/
mag
spac
e
Ramsar | Global Wetland Outlook | 2018 65
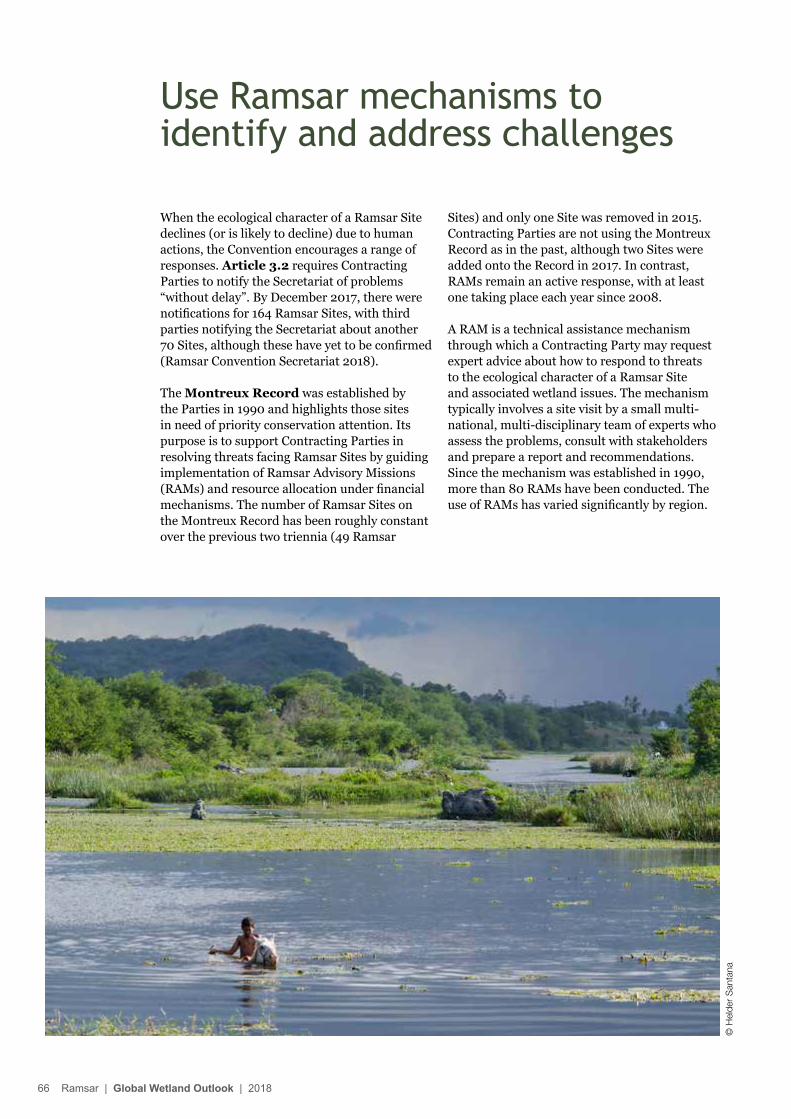
When the ecological character of a Ramsar Site declines (or is likely to decline) due to human actions, the Convention encourages a range of responses. Article 3.2 requires Contracting Parties to notify the Secretariat of problems “without delay”. By December 2017, there were notifications for 164 Ramsar Sites, with third parties notifying the Secretariat about another 70 Sites, although these have yet to be confirmed (Ramsar Convention Secretariat 2018).
The Montreux Record was established by the Parties in 1990 and highlights those sites in need of priority conservation attention. Its purpose is to support Contracting Parties in resolving threats facing Ramsar Sites by guiding implementation of Ramsar Advisory Missions (RAMs) and resource allocation under financial mechanisms. The number of Ramsar Sites on the Montreux Record has been roughly constant over the previous two triennia (49 Ramsar
Sites) and only one Site was removed in 2015. Contracting Parties are not using the Montreux Record as in the past, although two Sites were added onto the Record in 2017. In contrast, RAMs remain an active response, with at least one taking place each year since 2008.
A RAM is a technical assistance mechanism through which a Contracting Party may request expert advice about how to respond to threats to the ecological character of a Ramsar Site and associated wetland issues. The mechanism typically involves a site visit by a small multi-national, multi-disciplinary team of experts who assess the problems, consult with stakeholders and prepare a report and recommendations. Since the mechanism was established in 1990, more than 80 RAMs have been conducted. The use of RAMs has varied significantly by region.
Use Ramsar mechanisms to identify and address challenges
© H
elde
r S
anta
na
66 Ramsar | Global Wetland Outlook | 2018
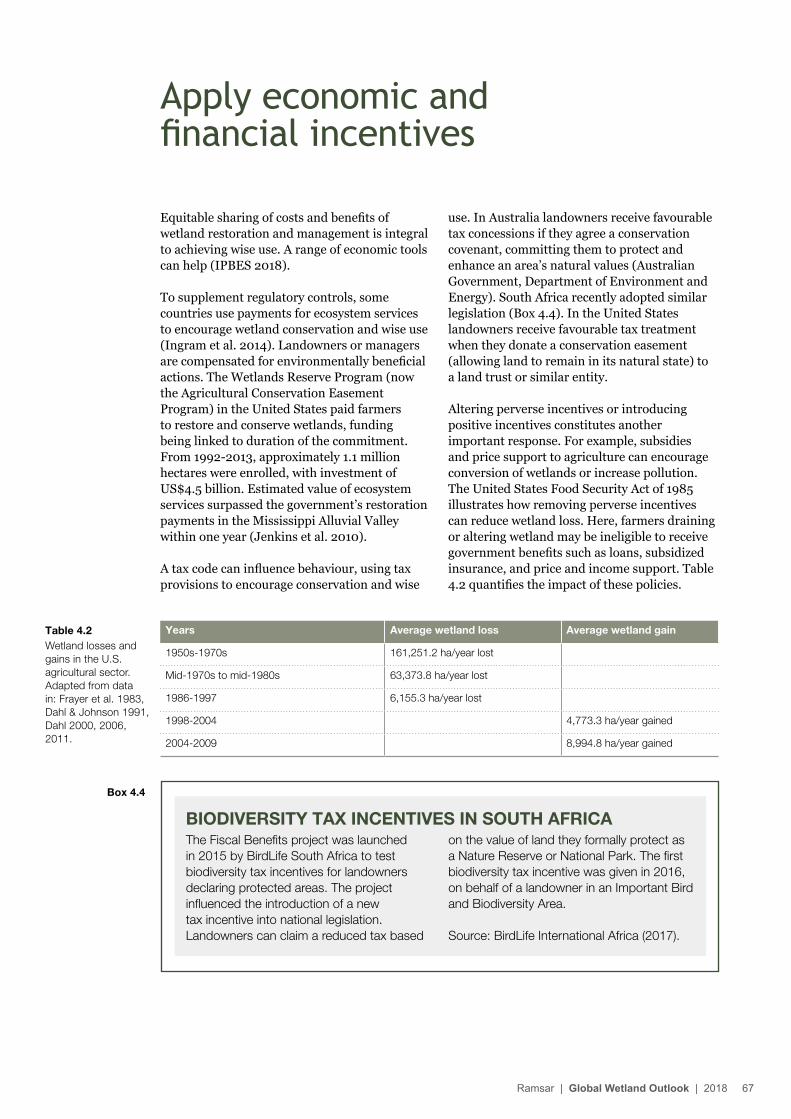
Equitable sharing of costs and benefits of wetland restoration and management is integral to achieving wise use. A range of economic tools can help (IPBES 2018).
To supplement regulatory controls, some countries use payments for ecosystem services to encourage wetland conservation and wise use (Ingram et al. 2014). Landowners or managers are compensated for environmentally beneficial actions. The Wetlands Reserve Program (now the Agricultural Conservation Easement Program) in the United States paid farmers to restore and conserve wetlands, funding being linked to duration of the commitment. From 1992-2013, approximately 1.1 million hectares were enrolled, with investment of US$4.5 billion. Estimated value of ecosystem services surpassed the government’s restoration payments in the Mississippi Alluvial Valley within one year (Jenkins et al. 2010).
A tax code can influence behaviour, using tax provisions to encourage conservation and wise
use. In Australia landowners receive favourable tax concessions if they agree a conservation covenant, committing them to protect and enhance an area’s natural values (Australian Government, Department of Environment and Energy). South Africa recently adopted similar legislation (Box 4.4). In the United States landowners receive favourable tax treatment when they donate a conservation easement (allowing land to remain in its natural state) to a land trust or similar entity.
Altering perverse incentives or introducing positive incentives constitutes another important response. For example, subsidies and price support to agriculture can encourage conversion of wetlands or increase pollution. The United States Food Security Act of 1985 illustrates how removing perverse incentives can reduce wetland loss. Here, farmers draining or altering wetland may be ineligible to receive government benefits such as loans, subsidized insurance, and price and income support. Table 4.2 quantifies the impact of these policies.
Apply economic and financial incentives
Table 4.2Wetland losses and gains in the U.S. agricultural sector. Adapted from data in: Frayer et al. 1983, Dahl & Johnson 1991, Dahl 2000, 2006, 2011.
Years Average wetland loss Average wetland gain
1950s-1970s 161,251.2 ha/year lost
Mid-1970s to mid-1980s 63,373.8 ha/year lost
1986-1997 6,155.3 ha/year lost
1998-2004 4,773.3 ha/year gained
2004-2009 8,994.8 ha/year gained
BIODIVERSITY TAX INCENTIVES IN SOUTH AFRICAThe Fiscal Benefits project was launched in 2015 by BirdLife South Africa to test biodiversity tax incentives for landowners declaring protected areas. The project influenced the introduction of a new tax incentive into national legislation. Landowners can claim a reduced tax based
on the value of land they formally protect as a Nature Reserve or National Park. The first biodiversity tax incentive was given in 2016, on behalf of a landowner in an Important Bird and Biodiversity Area.
Source: BirdLife International Africa (2017).
Box 4.4
Ramsar | Global Wetland Outlook | 2018 67
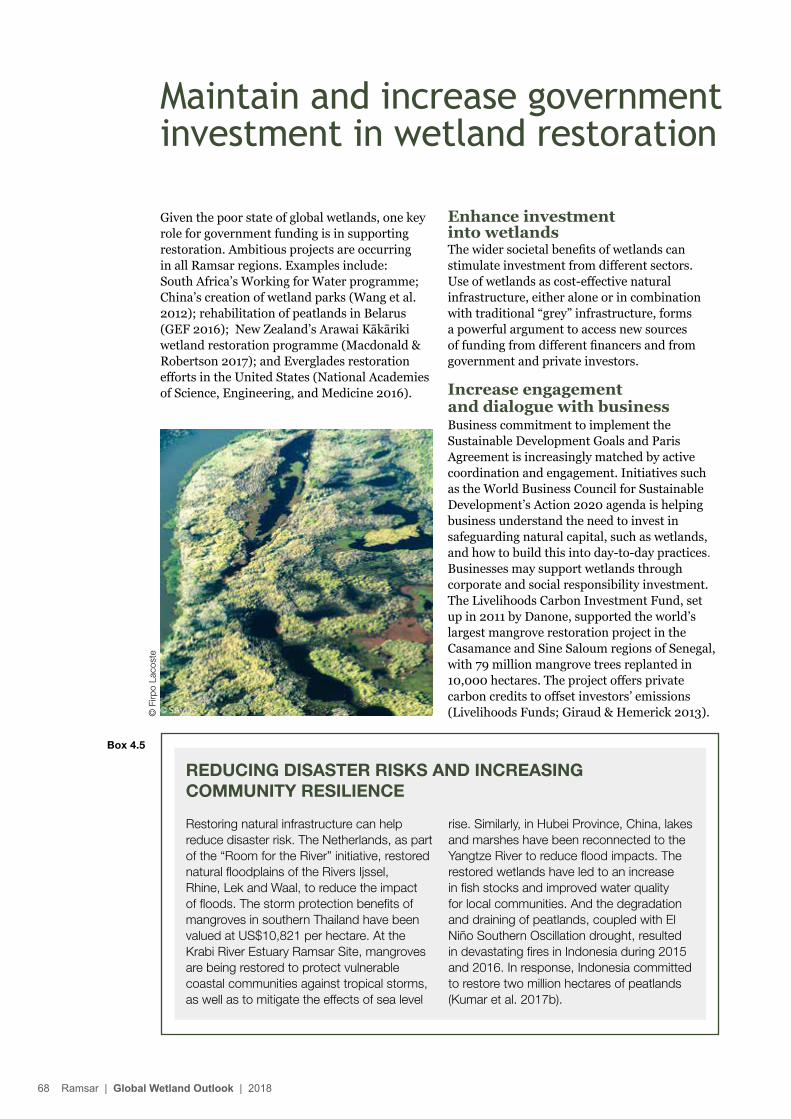
Given the poor state of global wetlands, one key role for government funding is in supporting restoration. Ambitious projects are occurring in all Ramsar regions. Examples include: South Africa’s Working for Water programme; China’s creation of wetland parks (Wang et al. 2012); rehabilitation of peatlands in Belarus (GEF 2016); New Zealand’s Arawai Kākāriki wetland restoration programme (Macdonald & Robertson 2017); and Everglades restoration efforts in the United States (National Academies of Science, Engineering, and Medicine 2016).
Enhance investment into wetlands The wider societal benefits of wetlands can stimulate investment from different sectors. Use of wetlands as cost-effective natural infrastructure, either alone or in combination with traditional “grey” infrastructure, forms a powerful argument to access new sources of funding from different financers and from government and private investors.
Increase engagement and dialogue with business Business commitment to implement the Sustainable Development Goals and Paris Agreement is increasingly matched by active coordination and engagement. Initiatives such as the World Business Council for Sustainable Development’s Action 2020 agenda is helping business understand the need to invest in safeguarding natural capital, such as wetlands, and how to build this into day-to-day practices. Businesses may support wetlands through corporate and social responsibility investment. The Livelihoods Carbon Investment Fund, set up in 2011 by Danone, supported the world’s largest mangrove restoration project in the Casamance and Sine Saloum regions of Senegal, with 79 million mangrove trees replanted in 10,000 hectares. The project offers private carbon credits to offset investors’ emissions (Livelihoods Funds; Giraud & Hemerick 2013).
Maintain and increase government investment in wetland restoration
REDUCING DISASTER RISKS AND INCREASING COMMUNITY RESILIENCE
Restoring natural infrastructure can help reduce disaster risk. The Netherlands, as part of the “Room for the River” initiative, restored natural floodplains of the Rivers Ijssel, Rhine, Lek and Waal, to reduce the impact of floods. The storm protection benefits of mangroves in southern Thailand have been valued at US$10,821 per hectare. At the Krabi River Estuary Ramsar Site, mangroves are being restored to protect vulnerable coastal communities against tropical storms, as well as to mitigate the effects of sea level
rise. Similarly, in Hubei Province, China, lakes and marshes have been reconnected to the Yangtze River to reduce flood impacts. The restored wetlands have led to an increase in fish stocks and improved water quality for local communities. And the degradation and draining of peatlands, coupled with El Niño Southern Oscillation drought, resulted in devastating fires in Indonesia during 2015 and 2016. In response, Indonesia committed to restore two million hectares of peatlands (Kumar et al. 2017b).
Box 4.5
© F
irpo
Laco
ste
68 Ramsar | Global Wetland Outlook | 2018
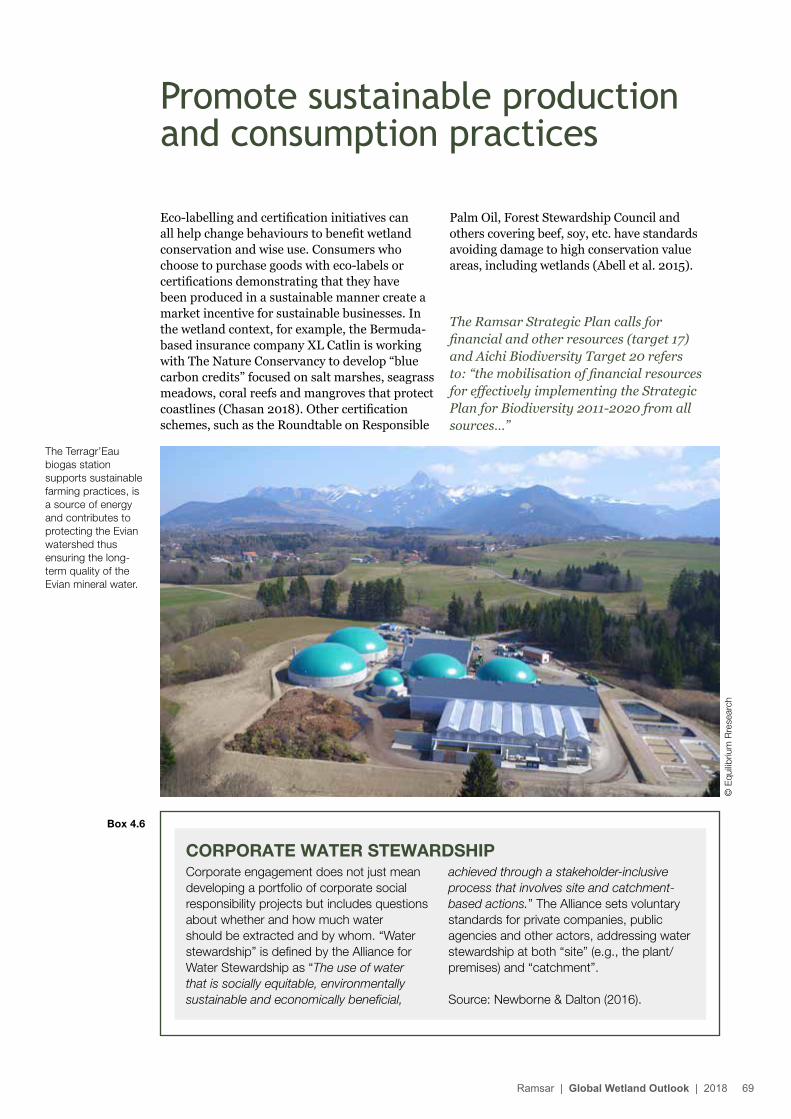
Eco-labelling and certification initiatives can all help change behaviours to benefit wetland conservation and wise use. Consumers who choose to purchase goods with eco-labels or certifications demonstrating that they have been produced in a sustainable manner create a market incentive for sustainable businesses. In the wetland context, for example, the Bermuda-based insurance company XL Catlin is working with The Nature Conservancy to develop “blue carbon credits” focused on salt marshes, seagrass meadows, coral reefs and mangroves that protect coastlines (Chasan 2018). Other certification schemes, such as the Roundtable on Responsible
Promote sustainable production and consumption practices
The Ramsar Strategic Plan calls for financial and other resources (target 17) and Aichi Biodiversity Target 20 refers to: “the mobilisation of financial resources for effectively implementing the Strategic Plan for Biodiversity 2011-2020 from all sources…”
CORPORATE WATER STEWARDSHIPCorporate engagement does not just mean developing a portfolio of corporate social responsibility projects but includes questions about whether and how much water should be extracted and by whom. “Water stewardship” is defined by the Alliance for Water Stewardship as “The use of water that is socially equitable, environmentally sustainable and economically beneficial,
achieved through a stakeholder-inclusive process that involves site and catchment-based actions.” The Alliance sets voluntary standards for private companies, public agencies and other actors, addressing water stewardship at both “site” (e.g., the plant/premises) and “catchment”.
Source: Newborne & Dalton (2016).
Box 4.6
The Terragr’Eau biogas station supports sustainable farming practices, is a source of energy and contributes to protecting the Evian watershed thus ensuring the long-term quality of the Evian mineral water.
Palm Oil, Forest Stewardship Council and others covering beef, soy, etc. have standards avoiding damage to high conservation value areas, including wetlands (Abell et al. 2015).
© E
quilib
rium
Rre
sear
ch
Ramsar | Global Wetland Outlook | 2018 69
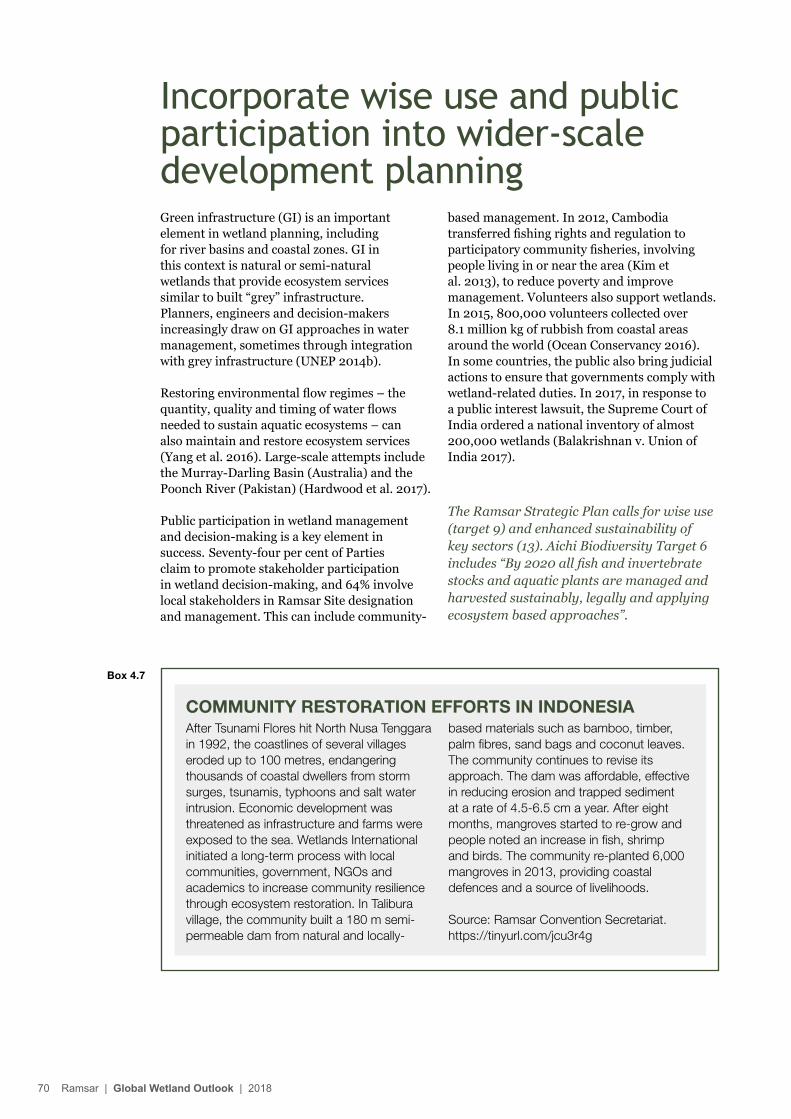
Green infrastructure (GI) is an important element in wetland planning, including for river basins and coastal zones. GI in this context is natural or semi-natural wetlands that provide ecosystem services similar to built “grey” infrastructure. Planners, engineers and decision-makers increasingly draw on GI approaches in water management, sometimes through integration with grey infrastructure (UNEP 2014b).
Restoring environmental flow regimes – the quantity, quality and timing of water flows needed to sustain aquatic ecosystems – can also maintain and restore ecosystem services (Yang et al. 2016). Large-scale attempts include the Murray-Darling Basin (Australia) and the Poonch River (Pakistan) (Hardwood et al. 2017).
Public participation in wetland management and decision-making is a key element in success. Seventy-four per cent of Parties claim to promote stakeholder participation in wetland decision-making, and 64% involve local stakeholders in Ramsar Site designation and management. This can include community-
based management. In 2012, Cambodia transferred fishing rights and regulation to participatory community fisheries, involving people living in or near the area (Kim et al. 2013), to reduce poverty and improve management. Volunteers also support wetlands. In 2015, 800,000 volunteers collected over 8.1 million kg of rubbish from coastal areas around the world (Ocean Conservancy 2016). In some countries, the public also bring judicial actions to ensure that governments comply with wetland-related duties. In 2017, in response to a public interest lawsuit, the Supreme Court of India ordered a national inventory of almost 200,000 wetlands (Balakrishnan v. Union of India 2017).
Incorporate wise use and public participation into wider-scale development planning
The Ramsar Strategic Plan calls for wise use (target 9) and enhanced sustainability of key sectors (13). Aichi Biodiversity Target 6 includes “By 2020 all fish and invertebrate stocks and aquatic plants are managed and harvested sustainably, legally and applying ecosystem based approaches”.
COMMUNITY RESTORATION EFFORTS IN INDONESIAAfter Tsunami Flores hit North Nusa Tenggara in 1992, the coastlines of several villages eroded up to 100 metres, endangering thousands of coastal dwellers from storm surges, tsunamis, typhoons and salt water intrusion. Economic development was threatened as infrastructure and farms were exposed to the sea. Wetlands International initiated a long-term process with local communities, government, NGOs and academics to increase community resilience through ecosystem restoration. In Talibura village, the community built a 180 m semi-permeable dam from natural and locally-
based materials such as bamboo, timber, palm fibres, sand bags and coconut leaves. The community continues to revise its approach. The dam was affordable, effective in reducing erosion and trapped sediment at a rate of 4.5-6.5 cm a year. After eight months, mangroves started to re-grow and people noted an increase in fish, shrimp and birds. The community re-planted 6,000 mangroves in 2013, providing coastal defences and a source of livelihoods.
Source: Ramsar Convention Secretariat. https://tinyurl.com/jcu3r4g
Box 4.7
70 Ramsar | Global Wetland Outlook | 2018
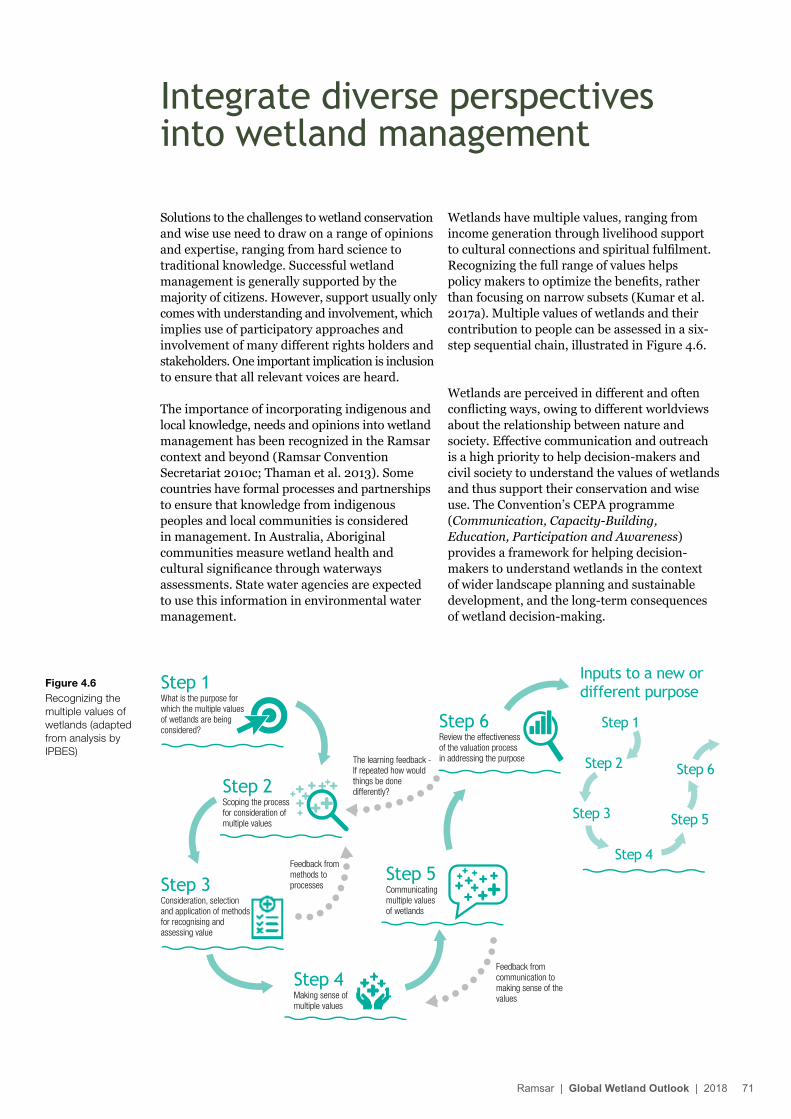
Solutions to the challenges to wetland conservation and wise use need to draw on a range of opinions and expertise, ranging from hard science to traditional knowledge. Successful wetland management is generally supported by the majority of citizens. However, support usually only comes with understanding and involvement, which implies use of participatory approaches and involvement of many different rights holders and stakeholders. One important implication is inclusion to ensure that all relevant voices are heard.
The importance of incorporating indigenous and local knowledge, needs and opinions into wetland management has been recognized in the Ramsar context and beyond (Ramsar Convention Secretariat 2010c; Thaman et al. 2013). Some countries have formal processes and partnerships to ensure that knowledge from indigenous peoples and local communities is considered in management. In Australia, Aboriginal communities measure wetland health and cultural significance through waterways assessments. State water agencies are expected to use this information in environmental water management.
Wetlands have multiple values, ranging from income generation through livelihood support to cultural connections and spiritual fulfilment. Recognizing the full range of values helps policy makers to optimize the benefits, rather than focusing on narrow subsets (Kumar et al. 2017a). Multiple values of wetlands and their contribution to people can be assessed in a six-step sequential chain, illustrated in Figure 4.6.
Wetlands are perceived in different and often conflicting ways, owing to different worldviews about the relationship between nature and society. Effective communication and outreach is a high priority to help decision-makers and civil society to understand the values of wetlands and thus support their conservation and wise use. The Convention’s CEPA programme (Communication, Capacity-Building, Education, Participation and Awareness) provides a framework for helping decision-makers to understand wetlands in the context of wider landscape planning and sustainable development, and the long-term consequences of wetland decision-making.
Integrate diverse perspectives into wetland management
Figure 4.6Recognizing the multiple values of wetlands (adapted from analysis by IPBES)
The learning feedback - If repeated how would things be done differently?Step 2
Scoping the process for consideration of multiple values
Feedback from methods to processes
Feedback from communication to making sense of the values
Step 3Consideration, selection and application of methods for recognising and assessing value
Step 4Making sense of multiple values
Step 5Communicating multiple values of wetlands
Step 6Review the effectiveness of the valuation process in addressing the purpose
Inputs to a new or different purposeStep 1
What is the purpose for which the multiple values of wetlands are being considered?
Step 1
Step 2
Step 3
Step 4
Step 5
Step 6
Ramsar | Global Wetland Outlook | 2018 71
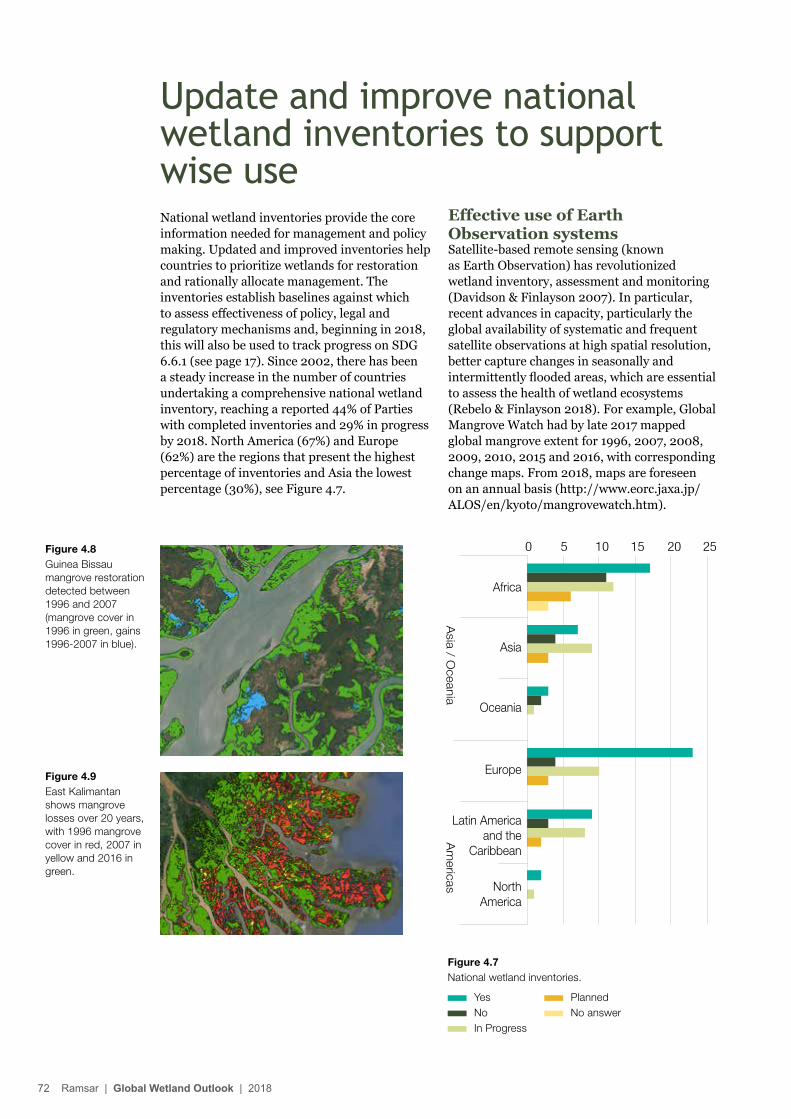
National wetland inventories provide the core information needed for management and policy making. Updated and improved inventories help countries to prioritize wetlands for restoration and rationally allocate management. The inventories establish baselines against which to assess effectiveness of policy, legal and regulatory mechanisms and, beginning in 2018, this will also be used to track progress on SDG 6.6.1 (see page 17). Since 2002, there has been a steady increase in the number of countries undertaking a comprehensive national wetland inventory, reaching a reported 44% of Parties with completed inventories and 29% in progress by 2018. North America (67%) and Europe (62%) are the regions that present the highest percentage of inventories and Asia the lowest percentage (30%), see Figure 4.7.
Effective use of Earth Observation systems Satellite-based remote sensing (known as Earth Observation) has revolutionized wetland inventory, assessment and monitoring (Davidson & Finlayson 2007). In particular, recent advances in capacity, particularly the global availability of systematic and frequent satellite observations at high spatial resolution, better capture changes in seasonally and intermittently flooded areas, which are essential to assess the health of wetland ecosystems (Rebelo & Finlayson 2018). For example, Global Mangrove Watch had by late 2017 mapped global mangrove extent for 1996, 2007, 2008, 2009, 2010, 2015 and 2016, with corresponding change maps. From 2018, maps are foreseen on an annual basis (http://www.eorc.jaxa.jp/ALOS/en/kyoto/mangrovewatch.htm).
0 5 10 15 20 25
Asia
Oceania
Latin America and the
Caribbean
North America
Africa
Asia / O
ceania
Europe
Am
ericas
Update and improve national wetland inventories to support wise use
Figure 4.7National wetland inventories.
Yes No In Progress
Planned No answer
Figure 4.9East Kalimantan shows mangrove losses over 20 years, with 1996 mangrove cover in red, 2007 in yellow and 2016 in green.
Figure 4.8Guinea Bissau mangrove restoration detected between 1996 and 2007 (mangrove cover in 1996 in green, gains 1996-2007 in blue).
72 Ramsar | Global Wetland Outlook | 2018
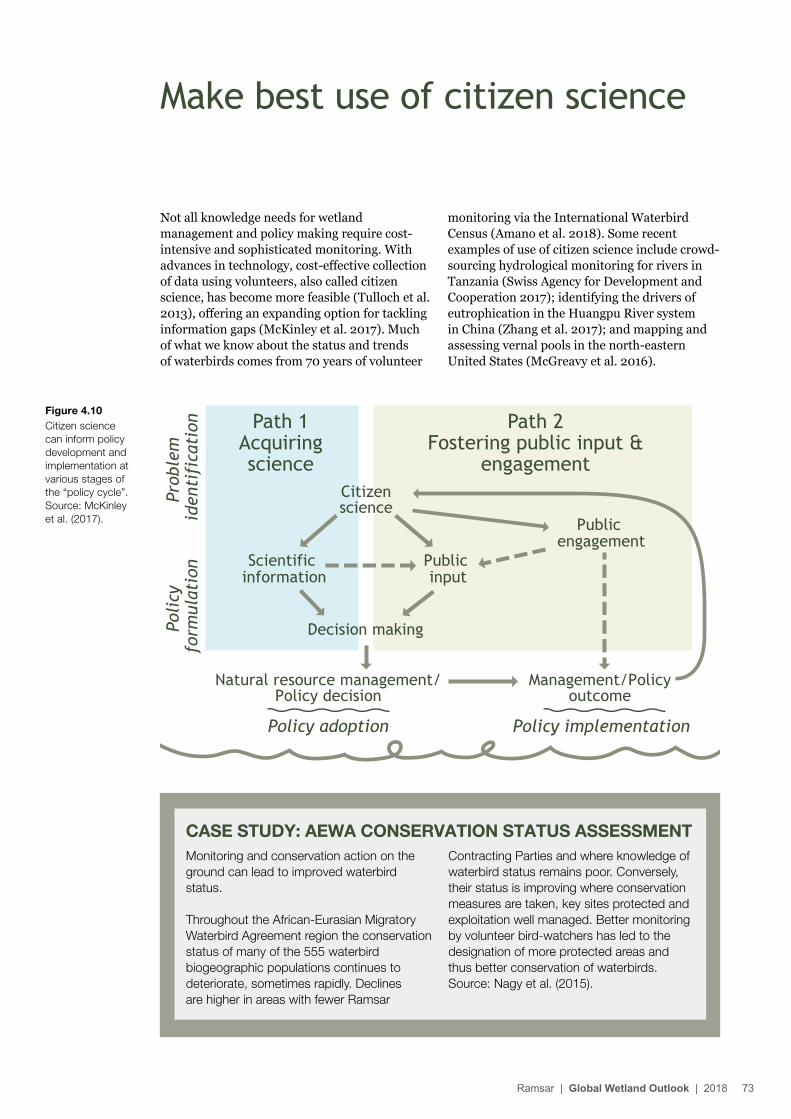
Not all knowledge needs for wetland management and policy making require cost-intensive and sophisticated monitoring. With advances in technology, cost-effective collection of data using volunteers, also called citizen science, has become more feasible (Tulloch et al. 2013), offering an expanding option for tackling information gaps (McKinley et al. 2017). Much of what we know about the status and trends of waterbirds comes from 70 years of volunteer
Make best use of citizen science
Figure 4.10Citizen science can inform policy development and implementation at various stages of the “policy cycle”. Source: McKinley et al. (2017).
monitoring via the International Waterbird Census (Amano et al. 2018). Some recent examples of use of citizen science include crowd-sourcing hydrological monitoring for rivers in Tanzania (Swiss Agency for Development and Cooperation 2017); identifying the drivers of eutrophication in the Huangpu River system in China (Zhang et al. 2017); and mapping and assessing vernal pools in the north-eastern United States (McGreavy et al. 2016).
Management/Policyoutcome
Scientific information
Citizenscience
Public input
Public engagement
Path 1Acquiring science
Path 2Fostering public input &
engagement
Prob
lem
id
enti
fica
tion
Poli
cy
form
ulat
ion
Policy implementation
Decision making
Natural resource management/Policy decision
Policy adoption
CASE STUDY: AEWA CONSERVATION STATUS ASSESSMENT Monitoring and conservation action on the ground can lead to improved waterbird status.
Throughout the African-Eurasian Migratory Waterbird Agreement region the conservation status of many of the 555 waterbird biogeographic populations continues to deteriorate, sometimes rapidly. Declines are higher in areas with fewer Ramsar
Contracting Parties and where knowledge of waterbird status remains poor. Conversely, their status is improving where conservation measures are taken, key sites protected and exploitation well managed. Better monitoring by volunteer bird-watchers has led to the designation of more protected areas and thus better conservation of waterbirds. Source: Nagy et al. (2015).
Ramsar | Global Wetland Outlook | 2018 73
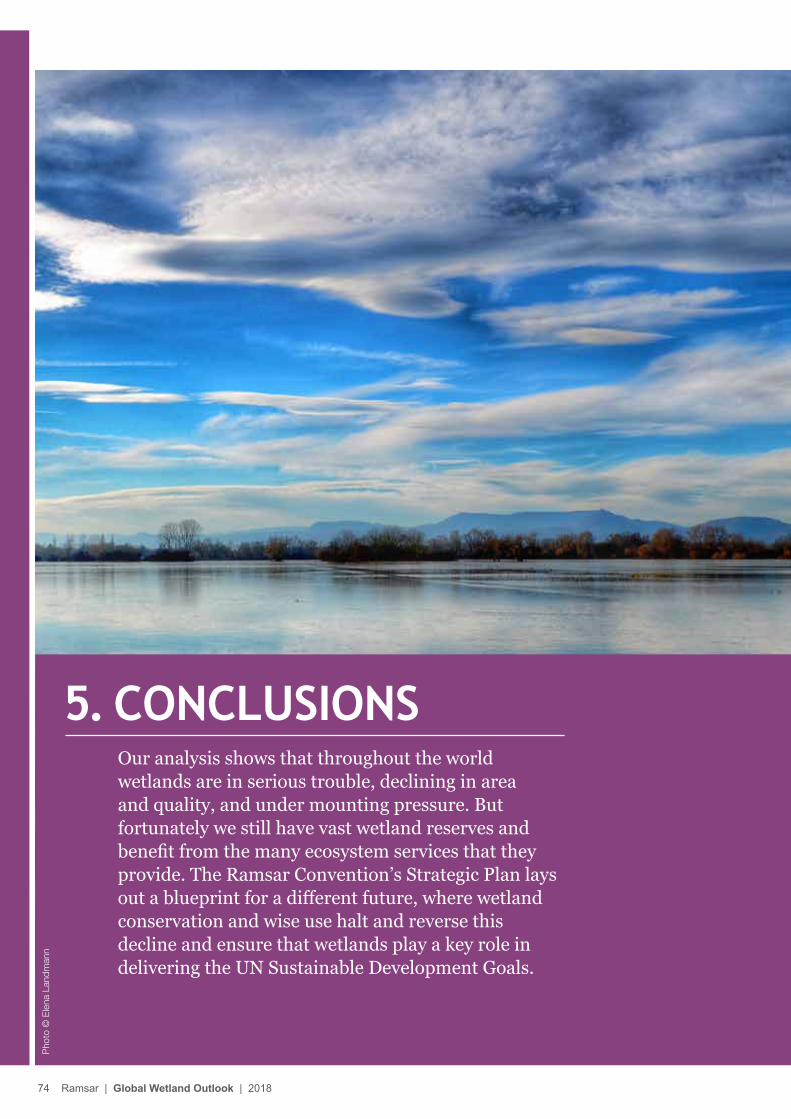
Our analysis shows that throughout the world wetlands are in serious trouble, declining in area and quality, and under mounting pressure. But fortunately we still have vast wetland reserves and benefit from the many ecosystem services that they provide. The Ramsar Convention’s Strategic Plan lays out a blueprint for a different future, where wetland conservation and wise use halt and reverse this decline and ensure that wetlands play a key role in delivering the UN Sustainable Development Goals.
5. CONCLUSIONS
Pho
to ©
Ele
na L
andm
ann
74 Ramsar | Global Wetland Outlook | 2018
Global declineWetland quality and quantity are continuing to decline, with immediate and long-term impacts on biodiversity, and reduction of ecosystem services with adverse outcomes for human livelihoods, such as through declining food and water security. The Ramsar Convention contains guidance and mechanisms for national efforts to halt and reverse the global decline.
Still a huge resourceDespite this, the world still contains an area of wetlands almost as large as Greenland – providing huge benefits to humanity in terms of ecosystem services, ranging from the provision of food and fresh water, to carbon sequestration and disaster reduction to more intangible aesthetic and spiritual values. Sustaining and extending these benefits through effective wetland management and restoration will have ongoing benefits for humankind.
But losing qualityIn parallel with widespread wetland degradation, and in part as a response, there is increasing recognition of these ecosystem services across the political spectrum and in all sectors of society. The Ramsar Convention has taken active steps to engage with wider sectors of society and to contribute to international initiatives to support sustainable development and prevent further decline of wetlands.
Role of the Sustainable Development GoalsThe Sustainable Development Goals provide a convenient and timely framework through which to address wetland security, supported by other global initiatives such as the CBD’s Aichi Biodiversity Targets, the UNFCCC Paris Agreement, and UNCCD’s Land Degradation Neutrality. Greater cooperation and co-custodianship of relevant processes through these initiatives provides a further way forward in achieving the Ramsar Convention’s goal and vision.
Ramsar’s missionThe Ramsar Convention’s Strategic Plan lays out a clear road map for attaining effective wetland conservation and wise use, including an official link into the Sustainable Development Goals through co-responsibility for monitoring indicator 6.6.1 on global wetland extent. The Global Wetland Outlook is an important step towards achieving this goal.
Working with partnersRamsar will continue to assist its Contracting Parties through Ramsar Advisory Missions, regional initiatives and a revitalized application of the Montreux Record, to highlight Ramsar Sites that are under serious pressure, and through the provision of technical guidance on the wise use of wetlands for maintaining their ecological character and ensuring humankind can benefit from the multiple ecosystem services they provide.
Into the future
Ramsar | Global Wetland Outlook | 2018 75
6.REFERENCES
© S
eoch
on-g
un c
ount
y
76 Ramsar | Global Wetland Outlook | 2018
ABC. (2017). New Zealand’s Whanganui River granted legal status as a person after 170-year battle. http://www.abc.net.au/news/2017-03-16/nz-whanganui-river-gets-legal-status-as-person-after-170-years/8358434Abell, R., Morgan, S.K. & Morgan, A.J. (2015). Taking high conservation value from forests to freshwaters. Environmental Management, 56(1), 1-10.Acreman, M.C., Fisher, J., Stratford, C.J., Mould, D.J. & Mountford, J.O. (2007). Hydrological science and wetland restoration: some case studies from Europe. Hydrology and Earth System Sciences Discussions, 11(1), 158-169.Adaman, F., Hakyemez, S. & Özkaynak, B. (2009). The political ecology of a Ramsar Site conservation failure: the case of Burdur Lake, Turkey. Environment and Planning C: Government and Policy, 27(5), 783-800. Airoldi, L. & Beck, M.W. (2007). Loss, status and trends for coastal marine habitats of Europe. Oceanography and Marine Biology: An Annual Review, 45, 345-405.Allen, D.J., Molur, S. & Daniel, B.A. (Compilers). (2010). The status and distribution of freshwater biodiversity in the Eastern Himalaya. Cambridge, UK & Gland, Switzerland: IUCN; Coimbatore, India: Zoo Outreach Organisation.Allen, D.J., Smith, K.G. & Darwall, W.R.T. (Compilers). (2012). The status and distribution of freshwater biodiversity in Indo-Burma. Cambridge, UK & Gland, Switzerland: IUCN.Amano, T., Székely, T., Sandel, B., Nagy, S., Mundkur, T., et al. (2018). Successful conservation of global waterbird populations depends on effective governance. Nature, 553, 199-202.Anderson, L.G., Rocliffe, S., Haddaway, N.R. & Dunn, A.M. (2015). The role of tourism and recreation in the spread of non-native species: A systematic review and meta-analysis. PLoS ONE, 10(10), e0140833.Arias-Estévez, M., López-Periago, E., Martínez-Carballo, E., Simal-Gándara, J., Mejuto, J.C. & García-Río, L. (2008). The mobility and degradation of pesticides in soils and the pollution of groundwater resources. Agriculture, Ecosystems & Environment, 123(4), 247-260.Australian Government, Department of Environment and Energy. Conservation covenants. https://www.environment.gov.au/topics/biodiversity/biodiversity-conservation/conservation-covenantsBaker, A.C., Glynn, P.W. & Riegl, B. (2008). Climate change and coral reef bleaching: An ecological assessment of long-term impacts, recovery trends and future outlook. Estuarine, Coastal and Shelf Science, 80(4), 435-471.Balakrishnan v. Union of India (2017). (Supreme Court of India).Barbier, E.B., Hacker, S.D., Kennedy, C., Koch, E.W., Stier, A.C. & Silliman, B.R. (2011). The value of estuarine and coastal ecosystem services. Ecological Monographs, 81(2), 169-193.Barker, N.H.L. & Roberts, C.M. (2004). Scuba diver behaviour and the management of diving impacts on coral reefs. Biological Conservation, 120(4), 481-489.Bartley, D.M., De Graaf, G.J., Valbo-Jørgensen, J. & Marmulla, G. (2015). Inland capture fisheries: status and data issues. Fisheries Management and Ecology, 22, 71-77.Batker, D., de la Torre, I., Costanza, R., Swedeen, P., Day, J., et al. (2010). Gaining ground. Wetlands, hurricanes and the economy: the value of restoring the Mississippi River Delta. Tacoma, Washington: Earth Economics.Beaman, J., Bergeron, C., Benson, R., Cook, A.M., Gallagher, K., et al. (2016). State of the Science White Paper. A summary of literature on the chemical toxicity of plastics pollution to aquatic life and aquatic-dependent wildlife. Report EPA-822-R-16-009. Washington, DC: Environmental Protection Agency.Bedford, B.L., Walbridge, M.R. & Aldous, A. (1999). Patterns in nutrient availability and plant diversity of temperate North American wetlands. Ecology, 80, 2151–2169.Bennett, S.J., Barrett-Lennard, E.G. & Colmer, T.D. (2009). Salinity and waterlogging as constraints to saltland pasture production: a review. Agriculture, Ecosystems and Environment, 123, 349-360.Bilz, M., Kell, S.P., Maxted, N. & Lansdown, R.V. (2011). European Red List of Vascular Plants. Luxembourg: Publications Office of the European Union.
BirdLife International. (2015). Report by BirdLife International to the Ramsar Convention on wetland indicators. Cambridge, UK.BirdLife International. (2015a). European Red List of Birds. Luxembourg: Office of Official Publications of the European Communities.BirdLife International Africa. (2017). South Africa gets first biodiversity tax incentive. http://www.birdlife.org/africa/news/south-africa-gets-first-biodiversity-tax-incentiveBirdLife International. (2018). State of the world’s birds: taking the pulse of the planet. Cambridge, UK: BirdLife International.Blann, K.L., Anderson, J., Sands, G.R. & Vondracek, B. (2009). Effects of agricultural drainage on aquatic ecosystems: a review. Critical Reviews in Environmental Science and Technology, 39, 909-1001.Bonells, M. (2012). Private nature reserves: an innovative wetland protection mechanism to fill in the gaps left by the SWANCC and Rapanos rulings. Environs, 36(3), 1-34.Brander, L.M., Florax, J.G.M. & Vermaat, J.E. (2006). The empirics of wetland valuation: a comprehensive summary and meta-analysis of the literature. Environmental and Resource Economics, 33, 223-250.Brimblecombe, P. (2011). The big smoke: a history of air pollution in London since medieval times. London: Routledge.Brouwer, R., Langford, I.H., Bateman, I.J. & Turner, R.K. (1999). A meta-analysis of wetland contingent valuation studies. Regional Environmental Change, 1, 47-57.Bullock, A. & Acreman, M. (2003). The role of wetlands in the hydrologic cycle. Hydrology and Earth System Science, 7, 358-389.Bundschuh, J., Litter, M.I., Parvez, F., Román-Ross, G., Nicolli, H.B., et al. (2012). One century of arsenic exposure in Latin America: a review of history and occurrence from 14 countries. Science of the Total Environment, 429, 2-35.Bünemann, E.K., Schwenke, G. & Van Zwieten, L. (2006). Impacts of agricultural impacts on soil organisms – a review. Australian Journal of Soil Research, 44(4), 379-406.Bush, E.R., Short, R.E., Milner-Gulland, E.J., Lennox, K., Samoilys, M. & Hill, N. (2017). Mosquito net use in an artisanal East African fishery. Conservation Letters, 10(4), 451-459.Butchart, S.H., Akçakaya, H.R., Chanson, J., Baillie, J.E.M., Collen, B., et al. (2007). Improvements to the Red List Index. PLoS ONE, 2(1), e140.Carandang, A.P. (2012). Assessment of the contribution of forestry to poverty alleviation in the Philippines. In Food and Agriculture Organization of the United Nations, Regional Office for Asia and the Pacific. Making forestry work for the poor: Assessment of the contribution of forestry to poverty alleviation in Asia and the Pacific. pp. 267-292. RAP Publication 2012/06. Bangkok: FAO. Carpenter, K.E., Abrar, M., Aeby, G., Aronson, R.B., Banks, S., et al. (2008). One-third of reef-building corals face elevated extinction risk from climate change and local impacts. Science, 321, 560-563.Carrizo, S.F., Jähnig, S.C, Bremerich, V., Freyhof, J., Harrison, I., et al. (2017). Freshwater megafauna: flagships for freshwater biodiversity under threat. Bioscience, 67 (10), 919-927.Chasan, E. (2018). Insurer to invest in coastal wetlands to mitigate storm damages. Bloomberg, https://www.bloomberg.com/news/articles/2018-05-11/insurer-to-invest-in-coastal-wetlands-to-mitigate-storm-damages Accessed 12 May 2018.Chuang, Y., Yang, H. & Lin, H. (2009). Effects of thermal discharge from a nuclear power plant on phytoplankton and periphyton in sub-tropical coastal waters. Journal of Sea Research, 61, 197-205.Clausnitzer, V., Kalkman, V.J., Ram, M., Collen, B., Baillie, J.E.M., et al. (2009). Odonata enter the biodiversity crisis debate: the first global assessment of an insect group. Biological Conservation, 142(8), 1864-1869.Collen, B., Whitton, F., Dyer, E.E., Baillie, J.E.M., Cumberlidge, N., et al. (2014). Global patterns of freshwater species diversity, threat and endemism. Global Ecology and Biogeography, 23, 40-51.Comeros-Raynal, M.T., Choat, J.H., Polidoro, B.A., Clements, K.D., Abesamis, R., et al. (2012). The likelihood of extinction of iconic and dominant herbivores and detritivores of coral reefs: the parrotfishes and surgeonfishes. PLoS ONE, 7(7): e39825.
Ramsar | Global Wetland Outlook | 2018 77
Convention on Biological Diversity (CBD) & Ramsar Convention. (2006). Guidelines for the rapid ecological assessment of biodiversity in inland water, coastal and marine areas. Montreal: CBD Technical Series no. 22 and Ramsar Technical Report no. 1. Convention on Biological Diversity (CBD). (2010). Decision X/2: The Strategic Plan for Biodiversity 2011-2020 and the Aichi Biodiversity Targets. Decision adopted by the Conference of the Parties to the Convention on Biological Diversity at its Tenth Meeting. UNEP/CBD/COP/DEC/X/2. Retrieved from https://www.cbd.int/sp/default.shtmlConvention on Biological Diversity (CBD). (2014). Global Biodiversity Outlook 4. Montreal.Cormier-Salem, M.-C. (2014). Participatory governance of Marine Protected Areas: a political challenge, an ethical imperative, different trajectories. S.A.P.I.EN.S, 7(2).Costanza, R., de Groot, R., Sutton, P., Van der Ploeg, S., Anderson, S.J., et al. (2014). Changes in the global value of ecosystem services. Global Environmental Change, 26, 152-158.Craft, C.B. & Richardson C.J. (1993). Peat accretion and N, P, and organic C accumulation in nutrient-enriched and unenriched Everglades peatlands. Ecological Applications, 3, 446-458.Craig, L.S., Olden, J.D., Arthington, A.H., Entrekin, S., Hawkins, C.P., et al. (2017). Meeting the challenge of interacting threats in freshwater systems: a call to scientists and managers. Elementa: Science of the Anthropocene, 5, 72. DOI http://doi.org/10.1525/elementa.256.Cronk, J.K. & Fennessy, M.S. (2001). Wetland Plants: Biology and Ecology. Boca Raton, FL: CRC Press/Lewis Publishers.Cuttelod, A., Seddon, M. & Neubert, E. (2011). European Red List of Non-marine Molluscs. Luxembourg: Publications Office of the European Union.Dahl, T.E. (2000). Status and trends of wetlands in the conterminous United States 1986 to 1997. Washington, DC: U.S. Department of the Interior, Fish and Wildlife Service. Dahl, T.E. (2006). Status and trends of wetlands in the conterminous United States 1998 to 2004. U.S. Washington, DC: U.S. Department of the Interior, Fish and Wildlife Service. Dahl, T.E. (2011). Status and trends of wetlands in the conterminous United States 2004 to 2009. U.S. Washington, DC: U.S. Department of the Interior, Fish and Wildlife Service. Dahl, T.E. & Johnson, C.E. (1991). Status and Trends of Wetlands in the Conterminous United States, Mid-1970s to Mid-1980s. Washington, DC: Department of the Interior, Fish and Wildlife Service. Daly-Hassen, H. (2017). Valeur economique des services ecosystemiques du Parc National de l’Ichkeul, Tunisie. Gland, Switzerland & Malaga, Spain: IUCN. Retrieved from http://www.ramsar.org/sites/default/files/documents/library/valeur_economique_ichkeul_f.pdfDarwall, W.R.T., Smith, K.G., Allen, D.J., Holland, R.A, Harrison, I.J. & Brooks, E.G.E. (eds). (2011). The Diversity of Life in African Freshwaters: Under Water, Under Threat. An analysis of the status and distribution of freshwater species throughout mainland Africa. Cambridge, United Kingdom & Gland, Switzerland: IUCN.Davidson, N.C. (2014). How much wetland has the world lost? Long-term and recent trends in global wetland area. Marine and Freshwater Research, 65(10), 934-941.Davidson, N.C. (2017). Wetland losses and the status of wetland-dependent species. In C.M. Finlayson, N. Davidson, G.R. Milton & C. Crawford (eds). The wetland book: distribution, description and conservation. Dordrecht: Springer.Davidson, N.C. & Finlayson, C.M. (2007). Earth Observation for wetland inventory, assessment and monitoring. Aquatic Conservation: Marine and Freshwater Systems, 17(3), 219-228. Davidson, N.C. & Finlayson, C.M. (2018). Extent, regional distribution and changes in area of different classes of wetland. Marine & Freshwater Research (in press). Davidson, N.C., Fluet-Chouinard, E. & Finlayson, C.M. (2018). Global extent and distribution of wetlands: trends and issues. Marine and Freshwater Research doi.org/10.1071/MF17019.Davidson, N.C., Laffoley, D. d’A., Doody, J.P., Way, L.S., Gordon, J., et al. (1991). Nature conservation and estuaries in Great Britain. Peterborough: Nature Conservancy Council.
Davies, J., Hill, R., Walsh, F.J., Sandford, M., Smyth, D. & Holmes, M.C. (2013). Innovation in management plans for community conserved areas: experiences from Australian indigenous protected areas. Ecology and Society, 18(2), 14.Davies, T.W., Duffy, J.P., Bennie, J. & Gaston, K.J. (2014). The nature, extent, and ecological implications of marine light pollution. Frontiers in Ecology and the Environment, 12(6), 347-355.De, A., Bose, R., Kumar, A. & Mozumdar, S. (2014). Targeted delivery of pesticides using biodegradable polymeric nanoparticles. Springer Briefs in Molecular Science, pp. 5-6.de Fouw, J., Govers, L. L., van de Koppel, J., van Belzen, J., Dorigo, W., et al. (2016). Drought, mutualism breakdown, and landscape-scale degradation of seagrass beds. Current Biology, 26(8), 1051-1056.de Grave, S., Smith, K., Adeler, N.A., Allen, D., Alvarez, F., et al. (2015). Dead shrimp blues: a global assessment of extinction risk in freshwater shrimps (Crustacea: Decapoda: Caridea. PLOS One doi.org/10.1371/journal.pone.0120198De Groot, R.S., Brander‚ L., van der Ploeg‚ S., Costanza‚ R., Bernard‚ F., et al. (2012). Global estimates of the value of ecosystems and their services in monetary units. Ecosystem Services, 1(1), 50-61.de Guenni, L.B., Cardoso, M., Goldammer, J., Hurtt, G., Mata, L.J., et al. (2005). Regulation of Natural Hazards: Floods and Fires. In: Millennium Ecosystem Assessment. Ecosystems and Human Well-being: Current State and Trends. pp.441-454. http://www.unep.org/maweb/documents/document.285.aspx.pdf.Dee, L.E., Horii, S.S. & Thornhill, D.J. (2014). Conservation and management of ornamental coral reef wildlife: successes, shortcomings, and future directions. Biological Conservation, 169, 225-237.Delucchi, M.A. (2010). Impacts of biofuels on climate change, water use, and land use. Annals of the New York Academy of Sciences, 1195(1), 28-45.Department of the Environment. (2016). Wetlands and Indigenous values. Australian Government, Department of the Environment. [Online.] https://www.environment.gov.au/system/files/resources/b04e5e2a-4256-4548-974e-00f7d84670a9/files/factsheet-wetlands-indigenous-values.pdf.Derraik, J.G.B. (2002). The pollution of the marine environment by plastic debris: a review. Marine Pollution Bulletin, 44, 842-852. Díaz, S., Demissew, S., Carabias, J., Joly, C., Lonsdale, M., et al. (2015). The IPBES Conceptual Framework—connecting nature and people. Current Opinion in Environmental Sustainability, 14, 1-16.Dixon, M.J.R., Loh, J., Davidson, N.C. & Walpole, M.J. (2016). Tracking global change in ecosystem area: The Wetland Extent Trends Index. Biological Conservation, 193, 27-35.Dodds, W.K., Perkin, J.S. & Gerken, J.E. (2013). Human impact on freshwater ecosystem services: a global perspective. Environmental Science and Technology, 47(16), DOI10.1021/es4021052.Dymond, J.R., Ausseil, A.E., Peltzer, D.A. & Herzig, A. (2014). Conditions and trends of ecosystem services in New Zealand—a synopsis. Solutions, 5(6), 38-45. Edgar, G.J., Stuart-Smith, R.D., Willis, T.J., Kininmonth, S., Baker, S.C., et al. (2014). Global conservation outcomes depend on marine protected areas with five key features. Nature, 506, 216-220.Edwards, P. (2014). Aquaculture environment interaction: past, present and likely future trends. Aquaculture, 447, 2-14.EEA. (2014). Progress in management of contaminated sites. Copenhagen: European Environment Agency. EEA. (2015). European environment — state and outlook 2015: Assessment of global megatrends. Copenhagen: European Environment Agency.Eherenfeld, J. (2003). Effects of exotic plant invasions on soil nutrient cycling processes. Ecosystems, 6, 503-513.Elder, J.F., Rybicki, N.B., Carter, V. & Weintraub, V. (2000). Sources and yields of dissolved carbon in Northern Wisconsin stream catchments with differing amounts of peatland. Wetlands, 20, 113-125. Erickson, J.E., Peresta, G. Montovan, K.J. & Drake, B.G. (2013). Direct and indirect effects of elevated atmospheric CO2 on net ecosystem production in a Chesapeake Bay tidal wetland. Global Change Biology, 19, 3368-3378.
78 Ramsar | Global Wetland Outlook | 2018
Eriksen, M., Mason, S., Wilson, S., Box, C., Zellers, A., et al. (2013). Microplastic pollution in the surface waters of the Laurentian Great Lakes. Marine Pollution Bulletin, 77, 177-182.Eriksen, M., Lebreton, L.C., Carson, H.S., Thiel, M., Moore, C.J., et al. (2014). Plastic pollution in the world’s oceans: more than 5 trillion plastic pieces weighing over 250,000 tons afloat at sea. PloS one, 9(12), p.e111913.Eriksson, B.K., van der Heide, T., van de Koppel, J., Piersma, T., van der Veer, H.W., & Olff, H. (2010). Major changes in the ecology of the Wadden Sea: human impacts, ecosystem engineering and sediment dynamics. Ecosystems, 13, 752-764.Erwin, K. (2009). Wetlands and global climate change: the role of wetland restoration in a changing world. Wetlands Ecology and Management, 17, 71–84.European Commission. (2012). Blueprint to Safeguard Europe’s Water Resources. Brussels, Belgium: European Commission. European Commission. (2013). Report of the Commission to the Council and the European Parliament on the Implementation of Council Directive 91/676/EEC concerning the protection of waters against pollution caused by nitrates from agricultural sources based on Member State reports for the period 2008-2011. Brussels, Belgium: European Commission.European Commission. (2017). Biofuels. https://ec.europa.eu/energy/en/topics/renewable-energy/biofuelsEwers Lewis, C.J., Carnell, P.E., Sanderman, J., Baldock, J.A. & Macreadie, P.I. (2018). Variability and vulnerability of coastal “blue carbon” stocks: A case study from Southeast Australia. Ecosystems, 21, 263–279.Fabricius, K.E. (2005). Effects of terrestrial runoff on the ecology of corals and coral reefs: review and synthesis. Marine Pollution Bulletin, 50(2), 125-146.Famiglietti, J.S. (2014). The global groundwater crisis. Nature Climate Change, 4, 945–948.FAO. (2011). The state of the world’s land and water resources for food and agriculture (SOLAW) – Managing systems at risk. Rome and London: Food and Agriculture Organization of the United Nations, and Earthscan. FAO. (2014). The state of world fisheries and aquaculture: opportunities and challenges. Rome: Food and Agriculture Organization of the United Nations.FAO. (2015). World fertilizer trends and outlooks to 2018. Rome: Food and Agriculture Organization of the United Nations.FAO. (2016a). Global Forest Resource Assessment (GFRA) summary 2015. Rome: Food & Agriculture Organisation.FAO. (2016b). The state of world fisheries and aquaculture 2016. Rome: Food and Agriculture Organization.FAO & ITPS. (2015). Status of the World’s Soil Resources (SWSR) – Main Report. Rome: Food and Agriculture Organization and Intergovernmental Technical Panel on Soils.FAO–AquaStat Dams Database. http://www.fao.org/nr/water/aquastat/dams/index.stmFAO Fishstat database. http://www.fao.org/fishery/statistics/global-capture-production/enFAOSTAT (http://www.fao.org/faostat/en/#data).Faulkner, S. (2004). Urbanization impacts on the structure and function of forested wetlands. Urban Ecosystems, 7(2), 89-106.Finlayson, C.M. (2017). Climate change and wetlands. In C.M. Finlayson, M. Everard, K. Irvine, R.J. McInnes, B.A. Middleton, et al. (eds) The Wetland Book. Springer.Finlayson, C.M., Capon, S.J., Rissik, D., Pittock, J., Fisk, G., et al. (2017). Adapting policy and management for the conservation of important wetlands under a changing climate. Marine and Freshwater Research, 68, 1803-1815.Finlayson, C.M., Clarke, S.J., Davidson, N.C. & Gell, P. (2016). Role of palaeoecology in describing the ecological character of wetlands. Marine and Freshwater Research, 67(6), 687-694.Finlayson, C.M., Davidson, N., Pritchard, D., Milton, G.R. & MacKay, H. (2011). The Ramsar Convention and ecosystem-based approaches to the wise use and sustainable development of wetlands. Journal of International Wildlife Law and Policy, 14, 176-198.
Finlayson, C.M., de Groot, R.S., Hughes, F.M.R. & Sullivan, C.A. (2018). Freshwater ecosystem services and functions. In J.M.R. Hughes (ed). Freshwater Ecology and Conservation: A Handbook of Techniques. Oxford: Oxford University Press. (in press).Flury, M. (1996). Experimental evidence of transport of pesticides through field soils—a review. Journal of Environmental Quality, 25(1), 25-45.Frayer, W.E., Monahan, T.J., Bowden, D.C. & Graybill, F.A. (1983). Status and trends of wetlands and deepwater habitats in the conterminous United States, 1950s to 1970s. Fort Collins: Colorado State University.Free, C.M., Jensen, O.P., Mason, S.A. Eriksen, M., Williamson, N.J. & Boldgiv, B. (2014). High-levels of microplastic pollution in a large, remote, mountain lake. Marine Pollution Bulletin, 85, 156-163. Freyhof, J. & Brooks, E. (2011). European Red List of Freshwater Fishes. Luxembourg: Publications Office of the European Union.Froend, R.H., Horwitz, P. & Sommer, B. (2016). Groundwater dependent Wetlands. In: Finlayson C.M., Milton G., Prentice R. & Davidson N. (eds.) The Wetland Book. Dordrecht, Springer.Garcia, N., Harrison, I., Cox, N. & Tognelli, M.F. (eds.) (2008). The Status and Distribution of Freshwater Biodiversity in the Arabian Peninsula. Gland, Switzerland, Cambridge, UK and Arlington, US: IUCNGarcía Criado, M., Väre, H., Nieto, A., Bento Elias, R., Dyer, R., et al. (2017). European Red List of lycopods and ferns. Brussels, Belgium: IUCN.Garcia-Moreno, J., Harrison, I.J., Dudgeon, D., Clausnitzer, V., Darwall, W., et al. (2015). Sustaining freshwater biodiversity in the Anthropocene. In: Bhaduri, A., Bogardi, J., Leentvaar, J. & Marx, S. (eds.) The Global Water System in the Anthropocene. Springer.Gardner, R.C., Bonells, M., Okuno, E. & Zarama, J.M. (2012). Avoiding, mitigating, and compensating for loss and degradation of wetlands in national laws and policies. Ramsar Scientific and Technical Briefing Note no. 3. Gland, Switzerland: Ramsar Convention Secretariat.Gardner, R.C. & Connolly, K.D. (2007). The Ramsar Convention on wetlands: assessment of international designations within the United States. Environmental Law Review, 37, 10089-10113.Gardner, R.C., Connolly, K.D. & Bamba, A. (2009). African Wetlands of International Importance: assessment of benefits associated with designations under the Ramsar Convention. Georgetown International Environmental Law Review, 21(2), 257-294.Gardner, R.C. & Davidson, N.C. (2011). The Ramsar Convention. In B.A. LePage (ed). Wetlands: integrating multidisciplinary concepts. pp. 189-203. Dordrecht: Springer. Gardner, R.C. & Grobicki, A. (2016). Synergies between the Convention on Wetlands of International Importance, especially as Waterfowl Habitat and other multilateral environmental agreements: possibilities and pitfalls. In UN Environment. Understanding synergies and mainstreaming among the biodiversity related conventions: A special contributory volume by key biodiversity convention secretariats and scientific bodies. pp. 54–67. Nairobi, Kenya: UN Environment.GEF. (2012). Impacts of marine debris on biodiversity: current status and potential solutions. Technical Series No. 67. Montreal: Secretariat of the Convention on Biological Diversity and Scientific and Technical Advisory Panel-GEF.GEF. (2016). Belarus’ degraded peatlands: a chance to become mires again. https://www.thegef.org/news/belarus’-degraded-peatlands-chance-become-mires-againGenovesi, P., Carboneras, C., Vilà, M. & Walton, P. (2014). EU adopts innovative legislation on invasive species: a step towards a global response to biological invasions? Biological Invasions, 17(5), 1307-1311.Gevers, G.J.M., Koopmanschap, E.M.J., Irvine, K., Finlayson, C.M. & van Dam, A. (2016). Capacity development for wetland management. In C.M. Finlayson, M. Everard, K. Irvine, R.J. McInnes, B.A. Middleton, et al. (eds.) The Wetland Book I: Structure and Function, Management and Methods. Dordrecht: Springer Publishers. Ghermandi, A., van den Bergh, J.C.J.M., Brander, L.M., de Groot, H.L.F. & Nunes, P.A.L.D. (2010). The values of natural and human-made wetlands: a meta-analysis. Water Resources Research, 46, W12516.Giosan, L., Syvitski, J., Constantinescu, S. & Day, J. (2014). Protect the world’s deltas. Nature, 516,31–33.Giraud, B. & Hemerick, R. (2013). What if carbon was much more than just a funding mechanism? Field Action Science Reports, Special Issue 7: Livelihoods. Retrieved from http://factsreports.revues.org/2106.
Ramsar | Global Wetland Outlook | 2018 79

Global Mangrove Watch [source for table 2.2, figures 4.8 and 4.9 and text above figures] www.globalmangrovewatch.orgGoldberg, J., Marshall, N., Birtles, A., Case, P., Bohensky, E., et al. (2016). Climate change, the Great Barrier Reef and the response of Australians, Palgrave Communications. DOI: 10.1057/palcomms.2015.46.Golden, H., Sander, H.A., Lane, C.R., Zhao, C., Price, K., et al. (2016). Relative effects of geographically isolated wetlands on streamflow: a watershed-scale analysis. Ecohydrology, 9, 21-38. Gorham E. (1991). Northern peatlands: Role in the carbon cycle and probable responses to climatic warming. Ecological Applications, 1, 182-195.Grant, G. (2012). Ecosystem services come to town: greening cities by working with nature. Chichester: John Wiley and Sons.Green, P.A., Vörösmarty, C.J., Harrison, I., Farrell, T., Sáenz, L. & Fekete, B.M. (2015). Freshwater ecosystem services supporting humans: pivoting from water crisis to water solutions. Global Environmental Change, 34, 108-118. doi:10.1016/j.gloenvcha.2015.06.007.Griffin, P.J. & Ali, S.H. (2014). Managing transboundary wetlands: the Ramsar Convention as a means of ecological diplomacy. Journal of Environmental Studies and Sciences, 4(3), 230-239.Groffman, P.M., Altabet, M.A., Böhlke, J.K., Butterbach-bahl, K., David, M.B., et al. (2012). Methods for measuring denitrification: diverse approaches to a difficult problem. Ecological Applications, 16, 2091–2122.Groffman, P.M., Butterbach-Bahl, K., Fulweiler, R.W., Gold, A.J., Morse, J.L., et al. (2009). Challenges to incorporating spatially and temporally explicit phenomena (hotspots and hot moments) in denitrification models. Biogeochemistry, 93, 49–77.Gupta, A. (2007). Large rivers’ geomorphology and management. Chichester, UK: J. Wiley and Sons. Hader, H., Kumar, D. Smith, R.C. & Worrest, R.C. (2007). Effects of solar UV radiation on aquatic ecosystems and interactions with climate change. Photochemical & Photobiological Sciences, 6, 267–285. Hajkowicz, S.A., Cook, H. & Littleboy, A. (2012). Our future world: global megatrends that will change the way we live. The 2012 Revision. Australia: CSIRO.Hanley, M.E., Hoggart, S.P.G., Simmonds, D.J., Bichot, A., Colangelo, M.A., et al. (2014). Shifting sands? Coastal protection by sand banks, beaches and dunes. Coastal Engineering, 87, 136-146.Hardwood, A., Johnson, S., Richter, B., Locke, A., Ye, X. & Tickner, D. (2017). Listen to the river: lessons from a global review of environmental flow success stories. Woking, UK: WWF-UK.Harrison, I.J. & Stiassny, M.L.J. (1999). The quiet crisis. In R.D.E. MacPhee and H.D. Sues (eds.). Extinctions in near time: causes, contexts and consequences. New York: Kluwer Academic/Plenum Publishers.HELCOM. (2017). First version of the ‘State of the Baltic Sea’ report – June 2017. Available at: http://stateofthebalticsea.helcom.fiHerbert, E.R., Boon, P., Burgin, A.J., Neubauer, S.C., Franklin, R.B., et al. (2015). A global perspective on wetland salinization: ecological consequences of a growing threat to freshwater wetlands. Ecosphere, 6(10), 1-43.Hertzman, T. & Larsson, T. (1999). Lake Hornborga, Sweden: the return of a bird lake. Wageningen, Netherlands: Wetlands International.Hipsey, M.R. & Arheimer, B. (2013). Challenges for water-quality research in the new IAHS decade on: Hydrology under societal and environmental change. In: Understanding Freshwater Quality Problems in a Changing World. Proceedings of H04, IAHS-IAPSO-IASPEI Assembly, Gothenburg, Sweden. IAHS Publ. 361: 17-30. Horwitz, P., Finlayson, M. & Weinstein, P. (2012). Healthy wetlands, healthy people: a review of wetlands and human health interactions. Ramsar Technical Report No. 6. Gland and Geneva, Switzerland: Secretariat of the Ramsar Convention on Wetlands & The World Health Organization. Hough, P. & Robertson, M. (2009). Mitigation under Section 404 of the Clean Water Act: where it comes from, what it means. Wetlands Ecology and Management, 17(1), 15-33. House, J., Brovkin, V., Betts, R., et al. (2005). Climate and air quality. In: Millennium Ecosystem Assessment. Ecosystems and human well-being: current state and trends. pp. 355-390. http://www.unep.org/maweb/documents/document.282.aspx.pdf
Hubacek, K., Guan, D. & Barua, A. (2007). Changing lifestyles and consumption patterns in developing countries: a scenario analysis for China and India. Futures, 39(9), 1084-1096.IMF. (2002). Globalization: threat or opportunity? IMF Issues Brief, International Monetary Fund, Washington DC. Available at: https://www.imf.org/external/np/exr/ib/2000/041200to.htm.Ingram, J.C., Wilkie, D., Clements, T., McNab, R.B., Nelson, F., et al. (2014). Evidence of payments for ecosystem services as a mechanism for supporting biodiversity conservation and rural livelihoods. Ecosystem Services, 7, 10-21.Intergovernmental Panel on Climate Change (2014). Impacts, adaptation and vulnerability. Top-level findings from the Working Group II AR5 summary for policymakers. IPBES (Intergovernmental Science-Policy Platform on Biodiversity and Ecosystem Services). (2018). Summary for policymakers of the thematic assessment report on land degradation and restoration of the Intergovernmental Science-Policy Platform on Biodiversity and Ecosystem Services. Bonn, Germany: IPBES Secretariat.Islam, S.N. (2015). Inequality and environmental sustainability. UN. DESA Working Paper No. 145, ST/ESA/2015/DWP/145. New York: Department of Economic & Social Affairs, United Nations.IUCN. (1965). List of European and North African Wetlands of International Importance. IUCN Publications new series No. 5. Morges, Switzerland: IUCN.IUCN. (2016). Global Standard for the Identification of Key Biodiversity Areas, Version 1.0. First edition. Gland, Switzerland: IUCN.IUCN. (2018). (Draft) Guidelines for recognising and reporting other effective area-based conservation measures. Version 1. Gland, Switzerland: IUCN.IUCN SSC Marine Turtle Specialist Group. https://iucn-mtsg.org/about/structure-role/red-list/Jambeck, J.R., Geyer, R., Wilcox, C., Siegler, T.R., Perryman, M., et al. (2015). Plastic waste inputs from land into the ocean. Science, 347(6223), 768-771.Janse, J.H., Kuiper, J.J., Weijters, M.J., Westerbeek, E.P., Jeuken, M.H.J.L., et al. (2015). GLOBIO-Aquatic, a global model of human impact on the biodiversity of inland aquatic ecosystems. Environmental Science & Policy, 48, 99-114.Jenkins, W.A., Murray, B.C., Kramer, R.A. & Faulkner, S.P. (2010). Valuing ecosystem services from wetlands restoration in the Mississippi Alluvial Valley. Ecological Economics, 69, 1051-1061.Jones, J.I., Murphy, J.F., Collins, A.L., Sear, D.A., Naden, P.S. & Armitage, P.D. (2012). The impact of fine sediment on macro-invertebrates. River Research and Applications, 28(8), 1055-1071.Joosten, H. (2010). The global peatland CO2 picture. Peatland status and drainage related emissions in all countries of the world. Ede, Netherlands: Wetlands International.Joosten, H., Sirin, A., Couwenberg, J., Laine, J. & Smith, P. (2016). The role of peatlands in climate regulation. In Bonn, A., Allott, T., Evans, M, Joosten, H. & Stoneman, R. (eds.) Peatland Restoration and Ecosystem Services. Cambridge UK: Cambridge University Press. Juffe-Bignoli, D., Harrison, I., Butchart, S.H.M., Flitcroft, R., Hermoso, V., et al. (2016). Achieving Aichi Biodiversity Target 11 to improve the performance of protected areas and conserve freshwater biodiversity. Aquatic Conservation: Marine and Freshwater Ecosystems, 26(S1), 133-151.Kadlec, R.H. & Wallace, S.E. (2008). Treatment Wetlands. London, CRC Press.Kalkman, V.J., Boudot, J.-P., Bernard, R., Conze, K.-J., De Knijf, G., et al. (2010). European Red List of dragonflies. Luxembourg: Publications Office of the European Union.Keddy, P.A. (2010). Wetland Ecology: Principles and Conservation. Cambridge UK, Cambridge University Press. Keddy, P.A., Fraser, L., Solomesch, A., Junk, W.J., Campbell, D.R., et al. (2009). Wet and wonderful: The world’s largest wetlands are conservation priorities. BioScience, 59, 39-51. Keenan, L.W. & Lowe, E. (2001). Determining ecologically acceptable nutrient loads to natural wetlands for water quality improvement. Water Science and Technology, 44, 289-294.
80 Ramsar | Global Wetland Outlook | 2018
Kemp, P., Sear, D., Collins, A., Naden, P. & Jones, I. (2011). The impacts of fine sediment on riverine fish. Hydrological Processes, 25(11), 1800-1821.Kim, S., Mam, K., Oeur, I., So, S. & Ratner, B. (2013). Fishery reforms on the Tonle Sap Lake: risks and opportunities for innovation. Cambodia Development Review, 17(2), 1-4.Kirby, M.X. (2004). Fishing down the coast: historical expansion and collapse of oyster fisheries along continental margins. Proceedings of the National Academy of Sciences of the United States of America, 101(35), 13096-13099.Kiwango, Y.A. & Wolanski, E. (2008). Papyrus wetlands, nutrients balance, fisheries collapse, food security, and Lake Victoria level decline in 2000–2006. Wetlands Ecology and Management, 16(2), 89-96.Koh, L.P., Miettinen, J., Liew, S.C. & Ghazoul, J. (2011). Remotely sensed evidence of tropical peatland conversion to oil palm. Proceedings of the National Academy of Sciences, 108(12), 5127-5132.Korichi, N. & Treilhes, C. (2013). Les sites Ramsar assurent leur rôle de protection quand ils sont gérés. Espaces Naturels, 43, 14-15.Kothari, A. & Bajpai, S. (2017). We are the river, the river is us. Economic & Political Weekly, 52(37). http://www.epw.in/journal/2017/37/special-articles/we-are-river-river-us.htmlKumar, R., McInnes, R.J., Everard, M., Gardner, R.C., Kulindwa, K.A.A., et al. (2017a). Integrating multiple wetland values into decision-making. Ramsar Policy Brief No. 2. Gland, Switzerland: Ramsar Convention Secretariat.Kumar, R., Tol, S., McInnes, R.J., Everard, M. & Kulindwa, A.A. (2017b). Wetlands for disaster risk reduction: effective choices for resilient communities. Gland, Switzerland: Ramsar Convention Secretariat.Leverington, F., Costa, K.L., Pavese, H., Lisle, A. & Hockings, M. (2010). A global analysis of protected area management effectiveness. Environmental Management, 46(5), 685-698.Lima, I.B.T., Ramos, F.M., Bambace, L.A.W. & Rosa, R.R. (2008). Methane emissions from large dams as renewable energy resources: a developing nation perspective. Mitigation and Adaptation Strategies for Global Change, 13(2), 193-206.Liu, X., Duan, L., Mo, J., Du, E., Shen, J., et al. (2011). Nitrogen deposition and its ecological impact in China: an overview. Environmental Pollution, 159(10), 2251-2264.Livelihoods Funds. Our projects. http://www.livelihoods.eu/portfolio/Lotze, H.K. (2007). Rise and fall of fishing and marine resource use in the Wadden Sea, southern North Sea. Fisheries Research, 87, 208-218.Lotze, H.K., Reise, K., Worm, B., van Beusekom, J., Busch, M., et al. (2005). Human transformations of the Wadden Sea ecosystem through time: a synthesis. Helgoland Marine Research, 559, 84-95.Luo, Y., Wu, L., Liu, L., Han, C. & Li, Z. (2009). Heavy metal contamination and remediation in Asian agricultural land. National Institute of Agro-Environmental Sciences. Japan: MARCO Symposium.Lynch-Stewart, P. (2008). Wetlands of International Importance (Ramsar Sites) in Canada: Survey of Ramsar Site managers 2007. Final Report.Maavara, T., Lauerwald, R., Regnier, P. & Van Cappellen, P. (2017). Global perturbation of organic carbon cycling by river damming. Nature Communications, 8, 15347.Macdonald, A. & Robertson, H. (2017). Arawai Kakariki Wetland Restoration Programme, Science Outputs 2007–2016. Wellington: New Zealand Department of Conservation.MacKay, H., Finlayson, C.M., Fernandez-Prieto, D., Davidson, N., Pritchard, D. & Rebelo, L.M. (2009). The role of Earth Observation (EO) technologies in supporting implementation of the Ramsar Convention on Wetlands. Journal of Environmental Management, 90(7), 2234-2242.Macreadie, P.I., Nielsen, D.A., Kelleway, J.J., Atwood, T.B., Seymour, J.R., et al. (2017). Can we manage coastal ecosystems to sequester more blue carbon? Frontiers in Ecology and the Environment, 15(4), 206-213.Máiz-Tomé, L., Sayer, C. & Darwall, W. (eds) (2018). The status and distribution of freshwater biodiversity in Madagascar and the Indian Ocean Islands hotspot. Gland, Switzerland: IUCN. Mäkinen, K. & Khan, S. (2010). Policy considerations for greenhouse gas emissions from freshwater reservoirs. Water Alternatives, 3(2), 91.
Maron, M., Brownlie, S., Bull, J.W., Evans, M.C., von Hase, A., et al. (2018). The many meanings of no net loss in environmental policy. Nature Sustainability, 1, 19-27.Marton, J.M., Creed, I.F., Lewis, D.B., Lane, C.R., Basu, N.B., et al. (2015). Geographically isolated wetlands are important biogeochemical reactors on the landscape. Bioscience, 65(4), 408-418.Mauerhofer, V., Kim, R.E. & Stevens, C. (2015). When implementation works: a comparison of Ramsar Convention implementation in different continents. Environmental Science & Policy, 51, 95-105.Mayorga, E., Seitzinger, S.P., Harrison, J.A., Dumont, E., Beusen, A.H., et al. (2010). Global nutrient export from WaterSheds 2 (NEWS 2): model development and implementation. Environmental Modelling & Software, 25(7), 837-853.Mazaris, A.D., Schofield, G., Gkazinou, C., Almpanidou, V. & Hays, G.C. (2017). Global sea turtle conservation successes. Science Advances, 3, e1600730.McGreavy, B., Calhoun, A.J.K., Jansujwicz, J. & Levesque, V. (2016). Citizen science and natural resource governance: program design for vernal pool policy innovation. Ecology and Society, 21(2), 48.McInnes, R.J. (2013). Towards the wise use of urban and peri-urban wetlands. Ramsar Scientific and Technical Briefing Note no. 6. Gland, Switzerland: Ramsar Convention Secretariat.McIntyre, P., Reidy Liermann, C.A. & Revenga, C. (2016). Linking freshwater fishery management to global food security and biodiversity conservation. Proceedings of the National Academy of Sciences, http://www.pnas.org/cgi/doi/10.1073/pnas.1521540113.McKinley, D.C, Miller-Rushing, A.J., Ballard, H.L., Bonney, R., Brown, H., et al. (2017). Citizen science can improve conservation science, natural resource management, and environmental protection. Biological Conservation, 208, 15-28. Mcleod, E., Chmura, G.L., Bouillon, S., Salm, R., Björk, M., et al. (2011). A blueprint for blue carbon: toward an improved understanding of the role of vegetated coastal habitats in sequestering CO2. Frontiers in Ecology and the Environment, 9, 552-560.Mediterranean Wetland Observatory. (2018). Mediterranean Wetland Outlook 2. Le Sambuc, France: MWO.Mekonnen, M.M. & Hoekstra, A.Y. (2011). National water footprint accounts: The green, blue and grey water footprint of production and consumption. Value of Water Research Report Series No. 50. Delft, Netherlands: UNESCO-IHE.Michalak, A.M., Anderson, E.J., Beletsky, D., Boland, S., Bosch, N.S., et al. (2013). Record-setting algal bloom in Lake Erie caused by agricultural and meteorological trends consistent with expected future conditions. Proceedings of the National Academy of Sciences, 110, 6449-6452.Miettinen, J., Shi, C. & Liew, S.C. (2016). Land cover distribution in the peatlands of Peninsular Malaysia, Sumatra and Borneo in 2015 with changes since 1990. Global Ecology and Conservation, 6, 67-78.Miettinen, J., Wang, J., Hooijer, A. & Liew, S. (2013). Peatland conversion and degradation processes in insular Southeast Asia: a case study in Jambi, Indonesia. Land Degradation & Development, 24(4), 334-341.Millennium Ecosystem Assessment. (2005). Ecosystems and human well-being: wetlands and water: synthesis. Washington, DC: World Resources Institute.Mitsch, W. & Gosselink, J. 2015. Wetlands, 5th ed. Hoboken, New Jersey, USA: John Wiley and Sons.Molur, S., Smith, K.G., Daniel, B.A. & Darwall, W.R.T. (Compilers). (2011). The status and distribution of freshwater biodiversity in the Western Ghats, India. Cambridge, UK & Gland, Switzerland: IUCN; Coimbatore, India: Zoo Outreach Organisation.Moomaw, W.R., Chmura, G.L., Davies, G.T., Finlayson, C.M., Middleton, B.A., et al. (2018). The relationship between wetlands and a changing climate: science, policy and management. Wetlands 10.1007/s13157-018-1023-8Mostert, E., Pahl-Wostl, C., Rees, Y., Searle, B., Tàbara, D. & Tippett, J. (2007). Social learning in European river-basin management: barriers and fostering mechanisms from 10 river basins. Ecology and Society, 12(1), 19.Murray, N.J., Ma, Z. & Fuller, R.A. (2015). Tidal flats of the Yellow Sea: a review of ecosystem status and anthropogenic threats. Australian Journal of Ecology, 40(4), 472-481.
Ramsar | Global Wetland Outlook | 2018 81
Nagy, S., Flink, S. & Langendoen, T. (2015). Report on the Conservation Status of Migratory Waterbirds in the Agreement Area. Sixth Edition. 134 pp. AEWA/MOP Doc. 6.14. http://www.unep-aewa.org/sites/default/files/document/mop6_14_csr6_including%20annexes.pdfNaisbitt, J. (1982). Megatrends. New York: Warner Books.National Academies of Sciences, Engineering, and Medicine. (2016). Progress toward restoring the everglades: the sixth biennial review - 2016. Washington, DC: The National Academies Press.Newborne, P. & Dalton, J. (2016). Water management and stewardship: taking stock of corporate water behaviour. Gland, Switzerland: IUCN; London, UK: ODI. Nicola, G.G., Elvira, B. & Almodovar, A. (1996). Dams and fish passage facilities in the large rivers of Spain: effects on migratory species. Archiv für Hydrobiologie Supplement, 113, 375-379.Nilsson, C., Reidy, C.A., Dynesius, M. & Revenga, C. (2005). Fragmentation and flow regulation of the world’s large river systems. Science, 308(5720), 405-408.Noe, G., Childers, D. & Jones, R. (2001). Phosphorus biogeochemistry and the impact of phosphorus enrichment: Why Is the Everglades so unique? Ecosystems, 4, 603-624. North American Bird Conservation Initiative, US Committee. (2014). The State of the Birds 2014: United States of America. Washington, DC: US Department of the Interior. Retrieved fromhttp://www.stateofthebirds.org/2014 %20SotB_FINAL_low-res.pdfNunes, A.L., Douthwaite, R.J., Tyser, B., Measey, G.J. & Weyl, O.L.F. (2016). Invasive crayfish threaten Okavango Delta. Frontiers in Ecology and the Environment. doi:10.1002/fee.1287Nunes, A.L., Triearico, E., Panov, V.E., Cardoso, A.C. & Katsanevakis, S. (2015). Pathways and gateways of freshwater invasions in Europe. Aquatic Invasions, 10(4), 359-370.Ocean Conservancy. (2016). 30th anniversary international coastal cleanup: Annual Report. Retrieved from http://www.oceanconservancy.org/our-work/marine-debris/2016-data-release/2016-data-release-1.pdfOckenden, M.C., Hiscock, K.M., Kahana, R., Macleod, C.J.A., Tych, W., et al. (2017). Major agricultural changes required to mitigate phosphorus losses under climate change. Nature Communications, 8(8),161.OECD. (2012a). OECD environmental outlook to 2050: The consequences of inaction. Paris: OECD Publishing. OECD. (2012b). Water quality and agriculture: meeting the policy challenge. OECD Studies on Water. Paris: OECD Publishing. OECD. (2015a). Drying wells, rising stakes: towards sustainable agricultural groundwater use. OECD Studies on Water. Paris: OECD Publishing. OECD. (2015b). International migration outlook 2015. Paris: OECD Publishing.OECD/FAO. (2016). Agriculture in Sub-Saharan Africa: prospects and challenges for the next decade. In OECD-FAO Agricultural Outlook 2016-2025. Paris: OECD Publishing.OECD. (2016). Biodiversity offsets: effective design and implementation. Paris: OECD Publishing. Retrieved from http://www.oecd.org/environment/resources/Policy-Highlights-Biodiversity-Offsets-web.pdf.OECD. (2017). Diffuse pollution, degraded waters: emerging policy solutions. Paris: OECD Publishing. Oliver, T.H. & Morecroft, M.D. (2014). Interactions between climate change and land use change on biodiversity: attribution problems, risks, and opportunities. WIREs Climate Change, 5, 317-335.Ouboter, P.E., Landburg, G.A., Quik, J.H.M., Mol, J.H.A. & van der Lugt, F. (2012). Mercury levels in pristine and gold mining impacted aquatic systems in Suriname, South America. Ambio, 41, 873-882.Paerl, H.W. & Otten, T.G. (2013). Harmful cyanobacterial blooms: causes, consequences, and controls. Microbial Ecology, 65(4), 995-1010.Paerl, H.W., Scott, J.T., McCarthy, M.J., Newell, S.E., Gardner, W.S., et al. (2016). It takes two to tango: when and where dual nutrient (N & P) reductions are needed to protect lakes and downstream ecosystems. Environmental Science and Technology, 50, 10805-10813.Parish, F., Sirin, A.A., Charman, D., Joosten, H., Minaeva, T.Y., et al. (2008). Assessment on peatlands, biodiversity and climate change. Kuala Lumpur and Wageningen, Netherlands: Global Environment Centre and Wetlands International.
Parliamentary Office of Science and Technology. (2011). Natural flood management. POSTNOTE 396 (December 2011). The Parliamentary Office of Science and Technology, London: HM Government.Pekel, J.-F., Cottam, A., Gorelick, N. & Belward, A.S. (2016). High-resolution mapping of global surface water and its long-term changes. Nature, 540, 418-422.Pippard, H. (2012). The current status and distribution of freshwater fishes, land snails and reptiles in the Pacific Islands of Oceania. Gland, Switzerland: IUCN.Pittock, J., Finlayson, C.M., Roux, D., Arthington, A., Matthews, J., et al. (2014). Chapter 19: Managing fresh water, river, wetland and estuarine protected areas. In G.L. Worboys, M. Lockwood, A. Kothari, S. Feary, & I. Pulsford (eds). Protected area governance and management. Canberra: ANU Press.Poeta, G., Battisti, C. & Acosta, A.T.R. (2014). Marine litter in Mediterranean sandy littorals: spatial distribution patterns along central Italy coastal dunes. Marine Pollution Bulletin, 89(1-2), 168-173.Poffenbarger, H.J., Needelman, B.A. & Megonigal, J.P. (2011). Salinity influence on methane emissions from tidal marshes. Wetlands, 31, 831–842.Polidoro, B.A., Carpenter, K.E., Collins, L., Duke, N.C., Ellison, A.M., et al. (2010). The loss of species: mangrove extinction risk and geographic areas of global concern. PLoS ONE, 5(4), e10095.Postel, S. (2000). Entering an era of water scarcity: the challenges ahead. Ecological Applications, 10, 941-948. Prigent, C., Papa, F., Aires, F., Jimenez, C., Rossow, W.B. & Matthews, E. (2012). Changes in land surface water dynamics since the 1990s and relation to population pressure. Geophysical Research Letters, 39(8), L08403.Provost, E.J., Kelaher, B.P., Dworjanyn, S.A., Russel, B.D., Connell, S.D., et al. (2017). Climate-driven disparities among ecological interactions threaten kelp forest persistence. Global Change Biology, 23(1), 353-361.Rabalais, N.N., Diaz, R.J., Levin, L.A., Turner, R.E., Gilbert, D. & Zhang, J. (2010). Dynamics and distribution of natural and human-caused hypoxia. Biogeosciences, 7(2), 585-619.Rabalais, N.N., Turner, R.E. & Scavia, D. (2002). Beyond science into policy: Gulf of Mexico hypoxia and the Mississippi River. BioScience, 52, 129-142.Ramsar Convention. (2005). Resolution IX.1 Annex A: A conceptual framework for the wise use of wetlands and the maintenance of their ecological character. 9th Meeting of the Conference of the Parties to the Convention on Wetlands (Ramsar, Iran, 1971), Kampala, Uganda, 8-15 November 2005.Ramsar Convention Secretariat. (2010a). Designating Ramsar Sites: strategic framework and guidelines for the future development of the List of Wetlands of International Importance. Ramsar handbooks for the wise use of wetlands, 4th edition, vol. 17. Gland, Switzerland: Ramsar Convention Secretariat. Ramsar Convention Secretariat. (2010b). International cooperation: guidelines and other support for international cooperation under the Ramsar Convention on Wetlands. Ramsar handbooks for the wise use of wetlands, 4th edition, vol. 20. Gland, Switzerland: Ramsar Convention Secretariat. Ramsar Convention Secretariat. (2010c). Participatory skills: establishing and strengthening local communities’ and indigenous people’s participation in the management of wetlands. Ramsar handbooks for the wise use of wetlands, 4th edition, vol. 7,. Gland, Switzerland: Ramsar Convention Secretariat.Ramsar Convention Secretariat. (2018). Update on the status of Sites on the List of Wetlands of International Importance. Doc. SC54-19, 54th Meeting of the Standing Committee, Gland, Switzerland, 23-27 April 2018.Ramsar Convention and UNCCD. (2014). Statement at World Parks Congress.Rebelo, L. & Finlayson, C.M. (coordinating authors) (2018). The use of Earth Observation for wetland inventory, assessment and monitoring: an information source for the Ramsar Convention for Wetlands. Ramsar Technical Report. Gland, Switzerland: Ramsar Convention.
82 Ramsar | Global Wetland Outlook | 2018
Renton, D.A., Mushet, D.M. & DeKeyser, E.S. (2015). Climate change and prairie pothole wetlands—mitigating water-level and hydroperiod effects through upland management. U.S. Geological Survey Scientific Investigations Report 2015–5004.Ricaurte, L.F., Olaya-Rodrígueza, M.H., Cepeda-Valenciaa, J., Lara, D., Arroyave-Suárez, J., et al. (2017). Future impacts of drivers of change on wetland ecosystem services in Colombia. Global Environmental Change, 44, 158-169. http://dx.doi.org/10.1016/j.gloenvcha.2017.04.001 RRichards, D.R. & Friess, D.A. (2016). Rates and drivers of mangrove deforestation in Southeast Asia, 2000–2012. Proceedings of the National Academy of Sciences, 113(2), 344-349.Richey, A.S., Thomas, B.F., Lo, M.H., Famiglietti, J.S., Swenson, S. & Rodell, M. (2015). Uncertainty in global groundwater storage estimates in a total groundwater stress framework. Water Resources Research, 51(7), 5198-5216.Richman, N.I., Böhm, M., Adams, S.B., Alvarez, F., Bergey, E.A., et al. (2015). Multiple drivers of decline in the global status of freshwater crayfish (Decapoda: Astacidea). Philosophical Transactions of the Royal Society B, 370(1662), 20140060.Rivera, M. & Gardner, R.C. (eds). (2011). Wetlands in the Americas: The role of the Ramsar Convention on Wetlands and the benefits of Ramsar Site designation. Gland, Switzerland: Secretariat of the Ramsar Convention.Romeo, T., Pietro, B., Pedà, C., Consoli, P., Andaloro, F. & Fossi, M.C. (2015). First evidence of presence of plastic debris in stomach of large pelagic fish in the Mediterranean Sea. Marine Pollution Bulletin, 95(1), 358-361.Russi, D., ten Brink, P., Farmer, A., Badura, T., Coates, D., et al. (2013). The economics of ecosystems and biodiversity for water and wetlands. London and Brussels: IEEP; Gland: Ramsar Secretariat. Sabo, J.K., Ruhi, A., Holtgrieve, G.W., Elliott, V., Arias, M.E., et al. (2017). Designing river flows to improve food security futures in the Lower Mekong Basin. Science, 358, 1-11.Samonte-Tan, G.P.B., White, A.T., Tercero, M.A., Diviva, J., Tabara, E. & Caballes, C. (2007). Economic valuation of coastal and marine resources: Bohol marine triangle, Philippines. Coastal Management, 35, 319-338.Santhosh, V., Padmalal, D., Baijulal, B. & Maya, K. (2013). Brick and tile clay mining from the paddy lands of Central Kerala (southwest coast of India) and emerging environmental issues. Environmental Earth Sciences, 68(7), 2111-2121.Santo Domingo, J.W., Bambic, D.G., Edge, T.A. & Wuertz, S. (2007). Quo vadis source tracking? Towards a strategic framework for environmental monitoring of fecal pollution. Water Research, 41(16), 3539-3552.Sato, T., Qadir, M., Yamamoto, S., Endo, T. & Zahoor, A. (2013). Global, regional, and country level need for data on wastewater generation, treatment, and use. Agricultural Water Management, 130, 1-13.Sauvé, S. & Desrosiers, M. (2014). A review of what is an emerging contaminant. Chemistry Central Journal, 8(15) http://journal.chemistrycentral.com/content/8/1/15.Scavia, D., Allan, J.D., Arend, K.K., Bartell, S., Beletsky, D., et al. (2014). Assessing and addressing the re-eutrophication of Lake Erie: Central basin hypoxia. Journal of Great Lakes Research, 40, 226-246.Schandl, H., Fischer-Kowalski, M., West, J., Giljum, S., Dittrich, M., et al. (2016). Global material flows and resource productivity. Assessment Report for the UNEP International Resource Panel. Nairobi: UNEP.Schroeder, R., McDonald, K.C., Chapman, B.D., Jensen, K., Podest, E., et al. (2015). Development and evaluation of a multi-year fractional surface water data set derived from active/passive microwave remote sensing data. Remote Sensing, 7, 16688-16732.Sharma, B., Rasul, G. & Chettri, N. (2015). The economic value of wetland ecosystem services: evidence from the Koshi Tappu Wildlife Reserve, Nepal. Ecosystem Services, 12, 84-93. Sherwood, E.T. (2016). 2015 Tampa Bay Water Quality Assessment. Tampa Bay Estuary Program Technical Report #01-16. St. Petersburg, FL: TBEP.Short, F.T., Polidoro, B., Livingstone, S.R., Carpenter, K.E., Bandeira, S., et al. (2011). Extinction risk assessment of the world’s seagrass species. Biological Conservation, 144(7), 1961-1971.
Sievers, M., Hale, R., Parris, K.M. & Swearer, S.E. (2017). Impacts of human-induced environmental change in wetlands on aquatic animals. Biological Reviews,93(1), 529-554.Simate, G.S. & Ndlovu, S. (2014). Acid mine drainage: challenges and opportunities. Journal of Environmental Chemical Engineering, 2, 1785-1803.Smith, K.G., Barrios, V., Darwall, W.R.T. & Numa, C. (eds). (2014). The status and distribution of freshwater biodiversity in the Eastern Mediterranean. Cambridge, UK, Malaga, Spain and Gland, Switzerland: IUCN.Smith, R.D. & Maltby, E. (2003). Using the ecosystem approach to implement the Convention on Biological Diversity: key issues and case studies. Gland, Switzerland & Cambridge, UK: IUCN.Smith, V.H., Joye, S.B. & Howarth, R.W. (2006). Eutrophication of freshwater and marine ecosystems. Limnology and Oceanography, 51, 351-355.Steneck, R., Graham, M.H., Bourque, B.J., Corbett, D. & Erlandson, J.M. (2002). Kelp forest ecosystems: biodiversity, stability, resilience and future. Environmental Conservation, 29, 436-459.Stickler, C.M., Coe, M.T., Costa, M.H., Nepstad, D.C., McGrath, D.G., et al. (2013). Dependence of hydropower energy generation on forests in the Amazon Basin at local and regional scales, Proceedings of the National Academy of Sciences, 110(23), 9601-9606.Stolton, S., Redford, K.H. & Dudley, N. (2014). The futures of privately protected areas. Gland, Switzerland: IUCN.Stuart, S.N., Chanson, J.S., Cox, N.A., Young, B.E., Rodrigues, A.S.L., et al. (2014). Status and trends of amphibian declines and extinctions worldwide. Science: 1103538.Swiss Agency for Development and Cooperation. (2017). Innovative and community-based sustainable water management. https://public.wmo.int/en/resources/bulletin/innovative-and-community-based-sustainable-water-managementTeixeira, T.P., Neves, L.M. & Araujo, F.G. (2009). Effects of nuclear power plant thermal discharge on habitat complexity and fish community structure in Ilha Grande Bay, Brazil. Marine Environmental Research, 68, 188-195.Temple, H.J. & Cox, N.A. (2009). European Red List of amphibians. Luxembourg: Office for Official Publications of the European Communities.Tessler, Z.D., Vörösmarty, C.J., Grossberg, M., Gladkova, I. & Aizenman, H. (2016). A global empirical typology of anthropogenic drivers of environmental change in deltas. Sustainability Science, 11(4), 525-537, doi: 10.1007/s11625-016-0357-5.Thaman, R., Lyver, P., Mpande, R., Perez, E., Cariño, J. & Takeuchi, K. (eds). (2013). The contribution of indigenous and local knowledge systems to IPBES: building synergies with science. IPBES Expert Meeting Report. Paris: UNESCO/UNU. Thomas, N., Lucas, R., Bunting, P., Hardy, A., Rosenqvist, A. & Simard, M. (2017). Distribution and drivers of global mangrove forest change, 1996–2010. PloS ONE, 12(6), p.e0179302.Tognelli, M.F., Lasso, C.A., Bota-Sierra, C.A., Jimenez-Segura, L.F. & Cox, N.A. (eds). (2016). Estado de Conservación y Distribución de la Biodiversidad de Agua Dulce en los Andes Tropicales. Gland, Switzerland, Cambridge, UK & Arlington, USA: IUCN.Torres, A., Brandt, J., Lear, K. & Liu, J. (2017). A looming tragedy of the sand commons. Science, 357(6355), 970-971.Trombulak, S.C. & Frissell, C.A. (2000). Review of ecological effects of roads on terrestrial and aquatic communities. Conservation Biology, 14(1), 18-30.Tsounis, G., Rossi, S., Gili, J.M. & Arntz, W.E. (2007). Red coral fishery at the Costa Brava (NW Mediterranean): case study of an overharvested precious coral. Ecosystems, 10(6), 975-986.Tulloch, A.I.T., Possingham, H.P., Joseph, L.N., Szabo, J. & Martin, T.G. (2013). Realising the full potential of citizen science monitoring programs. Biological Conservation, 165, 128-138.Turetsky, M.R., Benscoter, B., Page, S., Rein, G., Van Der Werf, G.R. & Watts, A. (2015). Global vulnerability of peatlands to fire and carbon loss. Nature Geoscience, 8(1), 11.Umadevi, M., Pushpa, R., Samapathkumar, K.P. & Bhowmik, D. (2012). Rice – traditional medicinal plant in India. Journal of Pharmacognosy and Phytochemistry, 1(1), 6-12.
Ramsar | Global Wetland Outlook | 2018 83

UN. (2015a). World Urbanization Prospects: The 2014 Revision. ST/ESA/SER.A/366. United Nations, Department of Economic and Social Affairs, Population Division. Retrieved from https://esa.un.org/unpd/wup/UN. (2015b). World population prospects: the 2015 revision, key findings and advance tables. Working Paper No. ESA/P/WP.241. United Nations, Department of Economic and Social Affairs, Population Division. Retrieved from https://esa.un.org/unpd/wpp/publications/files/key_findings_wpp_2015.pdfUN-Water. (2015). Wastewater management: a UN-water analytical brief. UN-Water. UN World Conservation Monitoring Centre. (2017). Wetland Extent Trends [WET] Index. Cambridge, UK.UNCCD (United Nations Convention to Combat Desertification). (2017). Global land outlook. Bonn, Germany.UNEP (United Nations Environment Program). (2014a). UNEP Year Book 2014: Emerging issues in our global environment. Nairobi: United Nations Environment Programme.UNEP (United Nations Environment Program). (2014b). Green infrastructure guide for water management: ecosystem-based management approaches for water-related infrastructure projects. Retrieved from http://www.medspring.eu/sites/default/files/Green-infrastructure-Guide-UNEP.pdfUNEP. (2016). A snapshot of the world’s water quality: towards a global assessment. Nairobi: UNEP.Urák, I., Hartel, T., Gallé, R. & Balog, A. (2017). Worldwide peatland degradations and the related carbon dioxide emissions: the importance of policy regulations. Environmental Science & Policy, 69, 57-64.Van Asselen, S., Verburg, P.H., Vermaat, J.E. & Janse, J.H. (2013). Drivers of wetland conversion: a global meta-analysis. PloS ONE, 8(11), p.e81292.Van Beek, L.P.H., Wada, Y. & Bierkens, M.F. (2011). Global monthly water stress: 1. Water balance and water availability. Water Resources Research, 47(7). https://doi.org/10.1029/2010WR009791Van Beukering, P.J.H. & Cesar, H.S.J. (2004). Ecological economic modeling of coral reefs: evaluating tourist overuse at Hanauma Bay and algae blooms at the Kihei Coast, Hawai’i, Pacific Science. 58, 243-260.Veolia and IFPRI. (2015). The murky future of global water quality. A white paper by Veolia and the International Food Policy Research Institute. Vitousek P., Aber, J., Howarth,R. Likens, G., Matson, P., et al. (1997). Human alteration of the global nitrogen cycle: sources and consequences. Ecological Applications, 7, 737-750. Voldseth, R.A., Johnson, W.C., Gilmanov, T., Guntenspergen, G.R. & Millett, B. (2007). Model estimation of land-use effects on water levels of northern prairie wetlands. Ecological Applications, 17, 527-540Walters, B.B. (2005). Ecological effects of small-scale cutting of Philippine mangrove forests. Forest Ecology and Management, 206(1-3), 331-348.Wang, Z., Mao, D., Li, L., Jia, M., Dong, Z., et al. (2015). Quantifying changes in multiple ecosystem services during 1992–2012 in the Sanjiang Plain of China. Science of the Total Environment, 514, 119-130. Wang, Z., Wu, J., Madden, M. & Mao, D. (2012). China’s wetlands: conservation plans and policy impacts. Ambio, 41(7), 782-786.Ward, R.D., Friess, D.A., Day, R.H. & MacKenzie, R.A. (2016). Impacts of climate change on mangrove ecosystems: a region by region overview. Ecosystem Health and Sustainability, 2(4).Welcomme, R.L., Cowx, I.G., Coates, D., Béné, C., Funge-Smith, S., et al. (2010). Inland capture fisheries. Philosophical Transactions of the Royal Society B: Biological Sciences, 365(1554), 2881-2896.Wenger, A.S., Fabricius, K.E., Jones, G.P. & Brodie, J.E. (2015). Effects of sedimentation, eutrophication, and chemical pollution on coral reef fishes. In C. Mora (ed). Ecology of Fishes on Coral Reefs. pp. 145–153. Cambridge, UK: Cambridge University Press.Werner, A.D., Bakker, M., Post, V.E., Vandenbohede, A., Lu, C., et al. (2013). Seawater intrusion processes, investigation and management: recent advances and future challenges. Advances in Water Resources, 51, 3-26.Wetlands International. (2010). State of the World’s Waterbirds 2010. Wageningen, Netherlands.Wetlands International. Landscape scale Disaster Risk Reduction. Retrieved from https://www.preventionweb.net/files/53060_53060buronivwileafleta4case1javaweb.pdf
White, E. & Kaplan, D. (2017). Restore or retreat? Saltwater intrusion and water management in coastal wetlands. Ecosystem Health and Sustainability 3(1), e01258. doi: 10.1002/ehs2.1258WHO/UNICEF. (2015). Joint Monitoring Program (JMP). Progress in Sanitation and Drinking Water: 2015 update and MDG assessment. Geneva: WHO/INICEF.Williams, P. (2008). World heritage caves and karst. Gland, Switzerland: IUCN. Williamson, C.E., Morris, D.P., Pace, M.L., Olson, O.G. (1999). Dissolved organic carbon and nutrients as regulators of lake ecosystems: Resurrection of a more integrated paradigm. Limnology and Oceanography 44, 795–803.Winemiller, K.O., McIntyre, P.B., Castello, L., Fluet-Chouinard, E., Giarrizzo, T., et al. (2016). Balancing hydropower and biodiversity in the Amazon, Congo, and Mekong. Science, 351(6269), 128-129.Wisser, D., Fekete, B.M., Vörösmartym, C.J. & Schumann, A.H. (2010). Reconstructing 20th century global hydrography: a contribution to the Global Terrestrial Network-Hydrology (GTN-H). Hydrology and Earth System Sciences, 14(1), 1-24.World Business Council for Sustainable Development. Action 2020 Overview. http://m.action2020.org/Action2020-24_03.pdf accessed 14th May 2018.Worm, B., Barbier, E.B., Beaumont, N., Duffy, J.E., Folke, C., et al. (2006). Impacts of biodiversity loss on ocean ecosystem services. Science, 314(5800), 787-790.WWAP. (United Nations World Water Assessment Programme) (2012). The United Nations World Water Development Report 2012: managing water under uncertainty and risk. Paris: UNESCO. WWAP. (2016). The United Nations World Water Development Report 2016: water and jobs. Paris: UNESCO.WWAP. (2017). The United Nations World Water Development Report 2017. Wastewater: the untapped resource. Paris: UNESCO.WWF. (2009). Sacred Waters – Cultural Values of Himalayan Wetlands. Kathmandu: WWF Nepal.WWF. (2012). Living Planet Report 2012: Biodiversity, biocapacity and better choices. Gland, Switzerland: WWF.WWF. (2016). Living Planet Report 2016. Risk and resilience in a new era. Gland, Switzerland: WWF International. Yang, W., Sun, T. & Yang, Z. (2016). Does the implementation of environmental flows improve wetland ecosystem services and biodiversity? A literature review. Restoration Ecology, 24(6), 731-742.Zarfl, C., Lumsdon, A.E., Berlekamp, J., Tydecks, L. & Tockner, K. (2014). A global boom in hydropower dam construction. Aquatic Sciences, 77(1), 161-170.Zedler, J.B. & Kercher, S. (2004). Causes and consequences of invasive plants in wetlands: opportunities, opportunists, and outcomes. Critical Reviews in Plant Sciences, 23(5), 431-452.Zedler, J.B. & Kercher, S. (2005). Wetland resources: status, trends, ecosystem services and restorability. Annual Review of Environmental Resources, 30, 39-74.Zhang, W., Jiang, F. & Ou, J. (2011). Global pesticide consumption and pollution: with China as a focus. Proceedings of the International Academy of Ecology and Environmental Sciences, 1(2), 125.Zhang, Y., Ma, R., Hu, M., Luo, J., Li, J. & Liang, Q. (2017). Combining citizen science and land use data to identify drivers of eutrophication in the Huangpu River system. Science of the Total Environment, 584-585, 651-664.Zorrilla-Miras, P., Palomo, I., Gómez-Baggethun, E., Martín-López, B., Lomas, P. L. & Montes, C. (2014). Effects of land-use change on wetland ecosystem services: A case study in the Doñana marshes (SW Spain). Landscape and Urban Planning, 122, 160-174.
84 Ramsar | Global Wetland Outlook | 2018
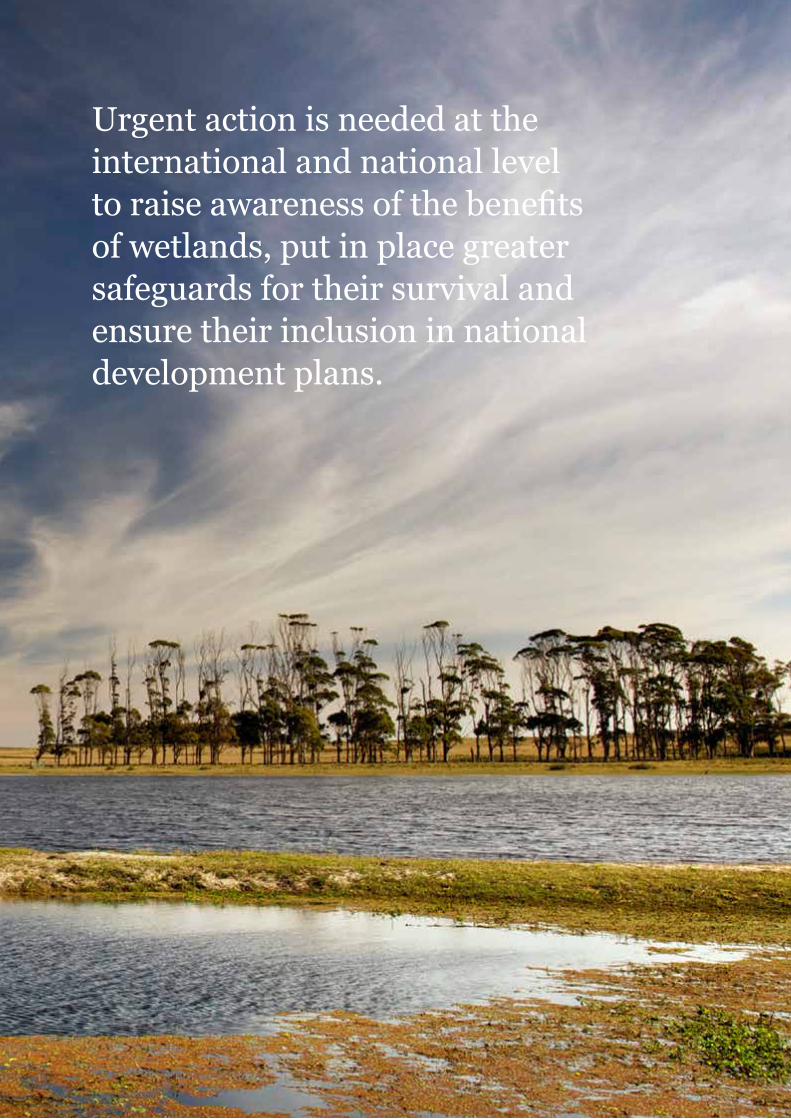
Ramsar | Global Wetland Outlook | 2018 85
Urgent action is needed at the international and national level to raise awareness of the benefits of wetlands, put in place greater safeguards for their survival and ensure their inclusion in national development plans.
Conservation and wise use of wetlands are vital for human livelihoods. The wide range of ecosystem services wetlands provide means that they lie at the heart of sustainable development. Yet policy and decision-makers often underestimate the value of their benefits to nature and humankind
Understanding these values and what is happening to wetlands is critical to ensuring their conservation and wise use. The Global Wetland Outlook summarizes wetland extent, trends, drivers of change and the steps needed to maintain or restore their ecological character.
Ramsar Convention Secretariat 28 rue Mauverney, CH-1196 Gland SwitzerlandTel. +41 22 999 01 82 www.ramsar.org


