Global X Social Media ETF (ticker: SOCL) Global X Lithium & Battery Tech ETF (ticker: LIT) Global X E-commerce ETF (ticker: EBIZ) Global X Emerging Markets Internet & E-commerce ETF (ticker: EWEB) Global X SuperDividend ® ETF (ticker: SDIV) Global X SuperDividend ® U.S. ETF (ticker: DIV) Global X MSCI SuperDividend ® EAFE ETF (ticker: EFAS) Global X MSCI SuperDividend ® Emerging Markets ETF (ticker: SDEM) Global X SuperDividend ® REIT ETF (ticker: SRET) Global X NASDAQ 100 ® Covered Call ETF (ticker: QYLD) Global X S&P 500 ® Covered Call ETF (ticker: XYLD) Global X Russell 2000 Covered Call ETF (ticker: RYLD) Global X Nasdaq 100 ® Covered Call & Growth ETF (ticker: QYLG) Global X S&P 500 ® Covered Call & Growth ETF (ticker: XYLG) Global X SuperIncome™ Preferred ETF (ticker: SPFF) Global X Renewable Energy Producers ETF (ticker: RNRG) Global X S&P 500 ® Catholic Values ETF (ticker: CATH) Global X S&P Catholic Values Developed ex-U.S. ETF (ticker: CEFA) Global X Guru ® Index ETF (ticker: GURU) Semi-Annual Report April 30, 2021 As permitted by regulations adopted by the Securities and Exchange Commission, paper copies of the Funds’ (defined below) shareholder reports will no longer be sent by mail, unless you specifically request paper copies of the reports from your financial intermediary (such as a broker-dealer or bank). Instead, shareholder reports will be available on the Funds’ website (www.globalxetfs.com/explore), and you will be notified by mail each time a report is posted and provided with a website link to access the report. If you already elected to receive shareholder reports electronically, you will not be affected by this change and you need not take any action. You may elect to receive shareholder reports and other communications from the Funds electronically anytime by contacting your financial intermediary. You may elect to receive all future Fund shareholder reports in paper free of charge. Please contact your financial intermediary to inform them that you wish to continue receiving paper copies of Fund shareholder reports and for details about whether your election to receive reports in paper will apply to all funds held with your financial intermediary.
Transcript
Global X Social Media ETF (ticker: SOCL)
Global X Lithium & Battery Tech ETF (ticker: LIT) Global X E-commerce ETF (ticker: EBIZ)
Global X Emerging Markets Internet & E-commerce ETF (ticker: EWEB) Global X SuperDividend® ETF (ticker: SDIV)
Global X SuperDividend® U.S. ETF (ticker: DIV) Global X MSCI SuperDividend® EAFE ETF (ticker: EFAS)
Global X MSCI SuperDividend® Emerging Markets ETF (ticker: SDEM) Global X SuperDividend® REIT ETF (ticker: SRET)
Global X NASDAQ 100® Covered Call ETF (ticker: QYLD) Global X S&P 500® Covered Call ETF (ticker: XYLD)
Global X Russell 2000 Covered Call ETF (ticker: RYLD) Global X Nasdaq 100® Covered Call & Growth ETF (ticker: QYLG)
Global X S&P 500® Covered Call & Growth ETF (ticker: XYLG) Global X SuperIncome™ Preferred ETF (ticker: SPFF)
Global X Renewable Energy Producers ETF (ticker: RNRG) Global X S&P 500® Catholic Values ETF (ticker: CATH)
Global X S&P Catholic Values Developed ex-U.S. ETF (ticker: CEFA) Global X Guru® Index ETF (ticker: GURU)
Semi-Annual Report
April 30, 2021 As permitted by regulations adopted by the Securities and Exchange Commission, paper copies of the Funds’ (defined below) shareholder reports will no longer be sent by mail, unless you specifically request paper copies of the reports from your financial intermediary (such as a broker-dealer or bank). Instead, shareholder reports will be available on the Funds’ website (www.globalxetfs.com/explore), and you will be notified by mail each time a report is posted and provided with a website link to access the report. If you already elected to receive shareholder reports electronically, you will not be affected by this change and you need not take any action. You may elect to receive shareholder reports and other communications from the Funds electronically anytime by contacting your financial intermediary. You may elect to receive all future Fund shareholder reports in paper free of charge. Please contact your financial intermediary to inform them that you wish to continue receiving paper copies of Fund shareholder reports and for details about whether your election to receive reports in paper will apply to all funds held with your financial intermediary.
TABLE OF CONTENTS
Schedules of Investments Global X Social Media ETF ...................................................................................... 1 Global X Lithium & Battery Tech ETF ..................................................................... 5 Global X E-commerce ETF ..................................................................................... 10 Global X Emerging Markets Internet & E-commerce ETF ..................................... 14 Global X SuperDividend® ETF ............................................................................... 18 Global X SuperDividend® U.S. ETF ....................................................................... 27 Global X MSCI SuperDividend® EAFE ETF ......................................................... 32 Global X MSCI SuperDividend® Emerging Markets ETF ...................................... 37 Global X SuperDividend® REIT ETF ..................................................................... 42 Global X NASDAQ 100® Covered Call ETF.......................................................... 45 Global X S&P 500® Covered Call ETF .................................................................. 51 Global X Russell 2000 Covered Call ETF .............................................................. 69 Global X Nasdaq 100® Covered Call & Growth ETF ............................................. 71 Global X S&P 500® Covered Call & Growth ETF ................................................. 77 Global X SuperIncome™ Preferred ETF ................................................................ 95 Global X Renewable Energy Producers ETF ........................................................ 100 Global X S&P 500® Catholic Values ETF ............................................................ 105 Global X S&P Catholic Values Developed ex-US ETF ........................................ 121 Global X Guru® Index ETF ................................................................................... 146
Statements of Assets and Liabilities ........................................................................... 151 Statements of Operations ............................................................................................ 156 Statements of Changes in Net Assets.......................................................................... 161 Financial Highlights ................................................................................................... 171 Notes To Financials .................................................................................................... 187 Disclosure of Fund Expenses ...................................................................................... 211 Approval of Investment Advisory Agreement ............................................................ 214 Supplemental Information .......................................................................................... 223
Shares are bought and sold at market price (not NAV) and are not individually redeemed from a Fund. Shares may only be redeemed directly from a Fund by Authorized Participants, in very large creation/redemption units. Brokerage commissions will reduce returns.
The Funds file their complete schedules of Fund holdings with the Securities and Exchange Commission (the “SEC” or “Commission”) for the first and third quarters of each fiscal year as an exhibit to its reports on Form N-PORT. The Funds’ Forms N-PORT are available on the Commission’s website at https://www.sec.gov/, and may be reviewed and copied at the Commission's Public Reference Room in Washington, DC. Information on the operation of the Public Reference Room may be obtained by calling 1-800-SEC-0330.
A description of the policies and procedures that the Global X Funds use to determine how to vote proxies relating to Fund securities, as well as information relating to how the Funds voted proxies relating to Fund securities during the most recent 12-month period ended June 30, is available (i) without charge, upon request, by calling 1-888-493-8631; and (ii) on the Commission’s website at https://www.sec.gov/.
Schedule of Investments April 30, 2021 (Unaudited)
Global X Social Media ETF
The accompanying notes are an integral part of the financial statements. 1
Sector Weightings †:
† Sector weightings percentages are based on the total market value of investments. Repurchaseagreements purchased from cash collateral received for securities lending activity are included in total investments. Please see Note 2 and 7 in Notes to Financial Statements for more detailedinformation.
Shares Value
COMMON STOCK — 99.8%
CANADA— 0.0% Energy — 0.0%
Hello Pal International * ......................... 173,934
BNP Paribas 0.000%, dated 04/30/21, to be repurchased on 05/03/21, repurchase price $1,489,945 (collateralized by U.S. Treasury Obligations, ranging in par value $36,402 - $213,863, 1.500%, 02/15/2030, with a total market value of $1,520,156) (Cost $1,489,945) ............................ $ 1,489,945
Schedule of Investments April 30, 2021 (Unaudited)
Global X Social Media ETF
The accompanying notes are an integral part of the financial statements. 4
Percentages are based on Net Assets of $487,575,766.
* Non-income producing security. (A) This security or a partial position of this security is on loan at April 30, 2021. The
total value of securities on loan at April 30, 2021 was $1,132,561. (B) Security was purchased with cash collateral held from securities on loan. The total
value of such securities as of April 30, 2021 was $1,627,506. (C) The rate reported on the Schedule of Investments is the 7-day effective yield as of
April 30, 2021.
ADR — American Depositary Receipt Cl — Class GDR — Global Depositary Receipt
The following is a summary of the level of inputs used as of April 30, 2021, in valuing the Fund's investments carried at value:
Investments in Securities Level 1 Level 2 Level 3 Total Common Stock $ 486,280,215
$ 329,691
$ —
$ 486,609,906
Short-Term Investment 137,561
—
—
137,561
Repurchase Agreement —
1,489,945
—
1,489,945
Total Investments in Securities $ 486,417,776
$ 1,819,636
$ —
$ 488,237,412
For the period ended April 30, 2021, there have been no transfers in or out of Level 3. Amounts designated as “—“ are $0 or have been rounded to $0.
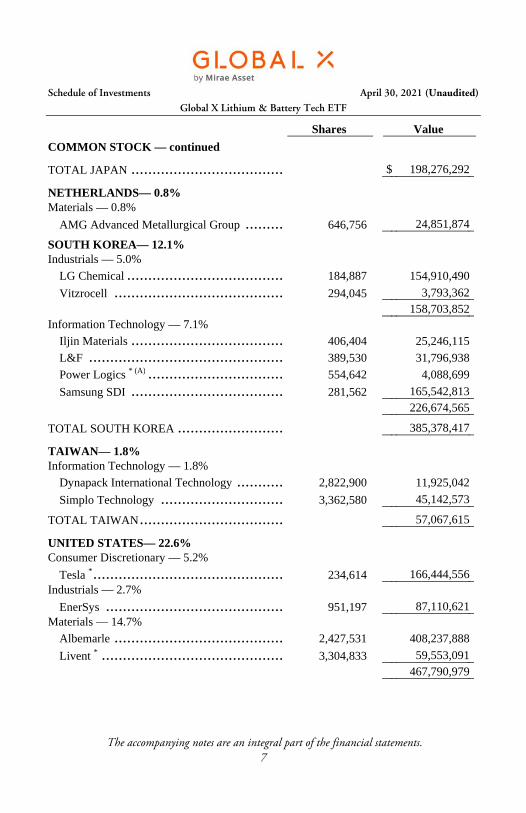
Schedule of Investments April 30, 2021 (Unaudited)
Global X Lithium & Battery Tech ETF
The accompanying notes are an integral part of the financial statements. 5
Sector Weightings †:
† Sector weightings percentages are based on the total market value of investments. Repurchaseagreements purchased from cash collateral received for securities lending activity are included intotal investments. Please see Note 2 and 7 in Notes to Financial Statements for more detailedinformation.
BNP Paribas 0.000%, dated 04/30/21, to be repurchased on 05/03/21, repurchase price $56,205,362 (collateralized by U.S. Treasury Obligations, ranging in par value $1,373,214 - $8,067,576, 1.500%, 02/15/2030, with a total market value of $57,345,025) (Cost $56,205,362) .......................... $ 56,205,362
Percentages are based on Net Assets of $3,177,651,256.
* Non-income producing security. (A) This security or a partial position of this security is on loan at April 30, 2021. The
total value of securities on loan at April 30, 2021 was $86,507,954. (B) Level 3 security in accordance with fair value hierarchy. (C) Security considered illiquid. The total value of such securities as of April 30,
2021 was $98 and represented 0.0% of Net Assets of the Fund. (D) Security was purchased with cash collateral held from securities on loan. The total
value of such securities as of April 30, 2021 was $90,683,598. (E) The rate reported on the Schedule of Investments is the 7-day effective yield as of
April 30, 2021.
Schedule of Investments April 30, 2021 (Unaudited)
Global X Lithium & Battery Tech ETF
The accompanying notes are an integral part of the financial statements. 9
(F) Security is fair valued using methods determined in good faith by the Fair Value
Committee of the Fund. The total value of such securities as of April 30, 2021 was $98 and represents 0.0% of Net Assets of the Fund.
ADR — American Depositary Receipt Cl — Class
The following is a summary of the level of inputs used as of April 30, 2021, in valuing the Fund's investments carried at value:
Investments in Securities Level 1 Level 2 Level 3(1) Total Common Stock $ 3,118,283,855
$ 57,067,615
$ 98
$ 3,175,351,568
Short-Term Investment 34,478,236
—
—
34,478,236
Repurchase Agreement —
56,205,362
—
56,205,362
Total Investments in Securities $ 3,152,762,091
$ 113,272,977
$ 98
$ 3,266,035,166
(1) A reconciliation of Level 3 investments and disclosures of significant unobservable inputs are presented when the Fund has a significant amount of Level 3 investments at the beginning and/or end of the period in relation to Net Assets. Management has concluded that Level 3 investments are not material in relation to Net Assets. For the period ended April 30, 2021, there have been no transfers in or out of Level 3.
Amounts designated as “—“ are $0 or have been rounded to $0.
Schedule of Investments April 30, 2021 (Unaudited)
Global X E-commerce ETF
The accompanying notes are an integral part of the financial statements. 10
Sector Weightings †:
† Sector weightings percentages are based on the total market value of investments. Repurchaseagreements purchased from cash collateral received for securities lending activity are included intotal investments. Please see Note 2 and 7 in Notes to Financial Statements for more detailedinformation.
Schedule of Investments April 30, 2021 (Unaudited)
Global X E-commerce ETF
The accompanying notes are an integral part of the financial statements. 13
Face Amount Value
REPURCHASE AGREEMENT(B) — 1.0%
BNP Paribas 0.000%, dated 04/30/21, to be repurchased on 05/03/21, repurchase price $2,290,989 (collateralized by U.S. Treasury Obligations, ranging in par value $55,974 - $328,843, 1.500%, 02/15/2030, with a total market value of $2,337,445) (Cost $2,290,989) ............................ $ 2,290,989
Percentages are based on Net Assets of $240,485,101.
* Non-income producing security. (A) This security or a partial position of this security is on loan at April 30, 2021. The
total value of securities on loan at April 30, 2021 was $3,932,277. (B) Security was purchased with cash collateral held from securities on loan. The total
value of such securities as of April 30, 2021 was $3,932,994. (C) The rate reported on the Schedule of Investments is the 7-day effective yield as of
April 30, 2021.
ADR — American Depositary Receipt Cl — Class Ser — Series
The following is a summary of the level of inputs used as of April 30, 2021, in valuing the Fund's investments carried at value:
Investments in Securities Level 1 Level 2 Level 3 Total Common Stock $ 240,110,896
$ —
$ —
$ 240,110,896
Short-Term Investment 1,642,005
—
—
1,642,005
Repurchase Agreement —
2,290,989
—
2,290,989
Total Investments in Securities $ 241,752,901
$ 2,290,989
$ —
$ 244,043,890
For the period ended April 30, 2021, there have been no transfers in or out of Level 3. Amounts designated as “—“ are $0 or have been rounded to $0.
Schedule of Investments April 30, 2021 (Unaudited)
Global X Emerging Markets Internet & E-commerce ETF
The accompanying notes are an integral part of the financial statements. 14
Sector Weightings †:
† Sector weightings percentages are based on the total market value of investments.
Percentages are based on Net Assets of $7,100,475.
* Non-income producing security.
Schedule of Investments April 30, 2021 (Unaudited)
Global X Emerging Markets Internet & E-commerce ETF
The accompanying notes are an integral part of the financial statements. 17
ADR — American Depositary Receipt Cl — Class
As of April 30, 2021, all of the Fund's investments were considered Level 1, inaccordance with authoritative guidance on fair value measurements and disclosure underU.S. GAAP.
For the period ended April 30, 2021, there have been no transfers in or out of Level 3.
Schedule of Investments April 30, 2021 (Unaudited)
Global X SuperDividend® ETF
The accompanying notes are an integral part of the financial statements. 18
Sector Weightings †:
† Sector weightings percentages are based on the total market value of investments. Repurchaseagreements purchased from cash collateral received for securities lending activity are included intotal investments. Please see Note 2 and 7 in Notes to Financial Statements for more detailedinformation.
BNP Paribas 0.000%, dated 04/30/21, to be repurchased on 05/03/21, repurchase price $8,170,388 (collateralized by U.S. Treasury Obligations, ranging in par value $199,620 - $1,172,757, 1.500%, 02/15/2030, with a total market value of $8,336,058) (Cost $8,170,388) ............................. $ 8,170,388
Percentages are based on Net Assets of $927,948,597.
‡ Real Estate Investment Trust * Non-income producing security. (A) This security or a partial position of this security is on loan at April 30, 2021. The
total value of securities on loan at April 30, 2021 was $12,448,370. (B) Level 3 security in accordance with fair value hierarchy. (C) Security considered illiquid. The total value of such securities as of April 30,
2021 was $9,102,433 and represented 1.0% of Net Assets of the Fund. (D) There is currently no stated interest rate.
Schedule of Investments April 30, 2021 (Unaudited)
Global X SuperDividend® ETF
The accompanying notes are an integral part of the financial statements. 26
(E) Security was purchased with cash collateral held from securities on loan. The total
value of such securities as of April 30, 2021 was $14,026,294. (F) The rate reported on the Schedule of Investments is the 7-day effective yield as of
April 30, 2021. (G) Security is fair valued using methods determined in good faith by the Fair Value
Committee of the Fund. The total value of such securities as of April 30, 2021, was $9,102,433 and represents 1.0% of Net Assets of the Fund.
ADR — American Depositary Receipt Cl — Class GDR — Global Depositary Receipt JSC — Joint Stock Company NVDR — Non-Voting Depositary Receipt PJSC — Public Joint Stock Company REIT — Real Estate Investment Trust
The following is a summary of the level of inputs used as of April 30, 2021, in valuing the Fund's investments carried at value:
Total Investments in Securities $ 874,669,963 $ 53,735,692 $9,102,433 $ 937,508,088
(1) A reconciliation of Level 3 investments and disclosures of significant unobservable inputs are presented when the Fund has a significant amount of Level 3 investments at the beginning and/or end of the period in relation to Net Assets. Management has concluded that Level 3 investments are not material in relation to Net Assets. For the period ended April 30, 2021, there were transfers into Level 3 in the amount of $9,102,433. Amounts designated as “—“ are $0 or have been rounded to $0.
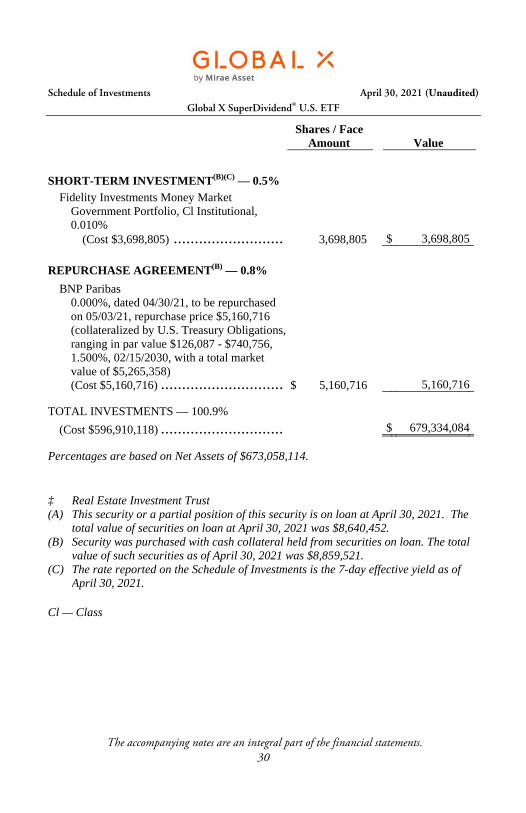
Schedule of Investments April 30, 2021 (Unaudited)
Global X SuperDividend® U.S. ETF
The accompanying notes are an integral part of the financial statements. 27
Sector Weightings †:
† Sector weightings percentages are based on the total market value of investments. Repurchaseagreements purchased from cash collateral received for securities lending activity are included in total investments. Please see Note 2 and 7 in Notes to Financial Statements for more detailedinformation.
Shares Value
COMMON STOCK — 85.2%
UNITED STATES— 85.2% Communication Services — 6.2%
BNP Paribas 0.000%, dated 04/30/21, to be repurchased on 05/03/21, repurchase price $5,160,716 (collateralized by U.S. Treasury Obligations, ranging in par value $126,087 - $740,756, 1.500%, 02/15/2030, with a total market value of $5,265,358) (Cost $5,160,716) ............................. $ 5,160,716
Percentages are based on Net Assets of $673,058,114.
‡ Real Estate Investment Trust (A) This security or a partial position of this security is on loan at April 30, 2021. The
total value of securities on loan at April 30, 2021 was $8,640,452. (B) Security was purchased with cash collateral held from securities on loan. The total
value of such securities as of April 30, 2021 was $8,859,521. (C) The rate reported on the Schedule of Investments is the 7-day effective yield as of
April 30, 2021.
Cl — Class
Schedule of Investments April 30, 2021 (Unaudited)
Global X SuperDividend® U.S. ETF
The accompanying notes are an integral part of the financial statements. 31
The following is a summary of the level of inputs used as of April 30, 2021, in valuing the Fund's investments carried at value:
Investments in Securities Level 1 Level 2 Level 3 Total Common Stock $ 573,490,460
$ —
$ —
$ 573,490,460
Master Limited Partnerships 96,984,103
—
—
96,984,103
Short-Term Investment 3,698,805
—
—
3,698,805
Repurchase Agreement —
5,160,716
—
5,160,716
Total Investments in Securities $ 674,173,368
$ 5,160,716
$ —
$ 679,334,084
For the period ended April 30, 2021, there have been no transfers in or out of Level 3. Amounts designated as “—“ are $0 or have been rounded to $0.
Schedule of Investments April 30, 2021 (Unaudited)
Global X MSCI SuperDividend® EAFE ETF
The accompanying notes are an integral part of the financial statements. 32
Sector Weightings †:
† Sector weightings percentages are based on the total market value of investments.
Asia Cement ................................... 496,800 888,382
TOTAL TAIWAN ................................ 1,733,908
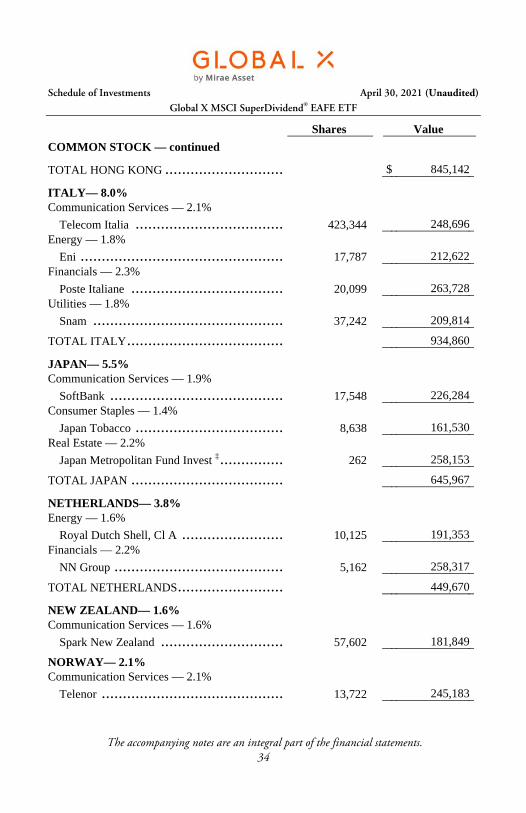
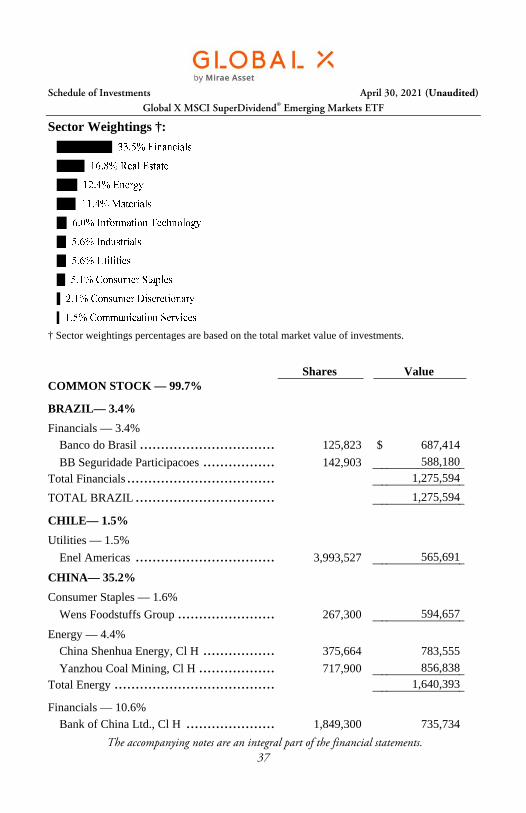
Schedule of Investments April 30, 2021 (Unaudited)
Global X MSCI SuperDividend® Emerging Markets ETF
The accompanying notes are an integral part of the financial statements. 41
Shares Value COMMON STOCK — continued
THAILAND— 3.9%
Communication Services — 1.5%
Total Access Communication NVDR ....... 537,739 $ 565,587
Financials — 2.4%
Siam Commercial Bank NVDR .............. 269,427 908,545
TOTAL THAILAND ............................. 1,474,132
UNITED ARAB EMIRATES— 5.1%
Financials — 2.0%
Dubai Islamic Bank PJSC .................... 625,512 757,804
Real Estate — 3.1%
Aldar Properties PJSC ........................ 1,214,260 1,160,326
TOTAL UNITED ARAB EMIRATES ......... 1,918,130
TOTAL INVESTMENTS — 99.7% (Cost $33,107,866) ............................. $ 37,356,434
Percentages are based on Net Assets of $37,469,468.
* Non-income producing security.
Cl — Class GDR — Global Depositary Receipt Ltd. — Limited NVDR — Non-Voting Depositary Receipt PJSC — Public Joint Stock Company
The following is a summary of the level of inputs used as of April 30, 2021, in valuing the Fund's investments carried at value:
Investments in Securities Level 1 Level 2 Level 3 Total Common Stock $ 32,473,996
$ 4,882,438
$ —
$ 37,356,434
Total Investments in Securities $ 32,473,996
$ 4,882,438
$ —
$ 37,356,434
For the period ended April 30, 2021, there have been no transfers in or out of Level 3. Amounts designated as “—“ are $0 or have been rounded to $0.
Schedule of Investments April 30, 2021 (Unaudited)
Global X SuperDividend® REIT ETF
The accompanying notes are an integral part of the financial statements. 42
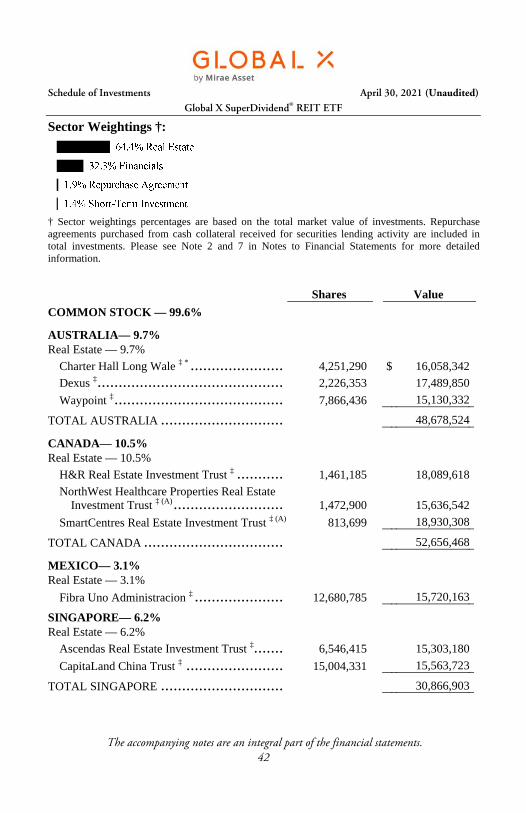
Sector Weightings †:
† Sector weightings percentages are based on the total market value of investments. Repurchaseagreements purchased from cash collateral received for securities lending activity are included in total investments. Please see Note 2 and 7 in Notes to Financial Statements for more detailedinformation.
Shares Value
COMMON STOCK — 99.6%
AUSTRALIA— 9.7% Real Estate — 9.7%
Charter Hall Long Wale ‡ * ...................... 4,251,290
Schedule of Investments April 30, 2021 (Unaudited)
Global X SuperDividend® REIT ETF
The accompanying notes are an integral part of the financial statements. 44
Face Amount Value
REPURCHASE AGREEMENT(B) — 1.9%
BNP Paribas 0.000%, dated 04/30/21, to be repurchased on 05/03/21, repurchase price $9,583,417 (collateralized by U.S. Treasury Obligations, ranging in par value $234,143 - $1,375,579, 1.500%, 02/15/2030, with a total market value of $9,777,735) (Cost $9,583,417) .... $ 9,583,417
Percentages are based on Net Assets of $501,837,307.
* Non-income producing security. ‡ Real Estate Investment Trust (A) This security or a partial position of this security is on loan at April 30, 2021. The
total value of securities on loan at April 30, 2021 was $15,966,518. (B) Security was purchased with cash collateral held from securities on loan. The total
value of such securities as of April 30, 2021 was $16,719,149. (C) The rate reported on the Schedule of Investments is the 7-day effective yield as of
April 30, 2021.
Cl — Class
The following is a summary of the level of inputs used as of April 30, 2021, in valuing the Fund's investments carried at value:
Investments in Securities Level 1 Level 2 Level 3 Total Common Stock $ 499,793,056
$ —
$ —
$ 499,793,056
Short-Term Investment 7,135,732
—
—
7,135,732
Repurchase Agreement —
9,583,417
—
9,583,417
Total Investments in Securities $ 506,928,788
$ 9,583,417
$ —
$ 516,512,205
For the period ended April 30, 2021, there have been no transfers in or out of Level 3. Amounts designated as “—“ are $0 or have been rounded to $0.
Schedule of Investments April 30, 2021 (Unaudited)
Global X NASDAQ 100® Covered Call ETF
The accompanying notes are an integral part of the financial statements. 45
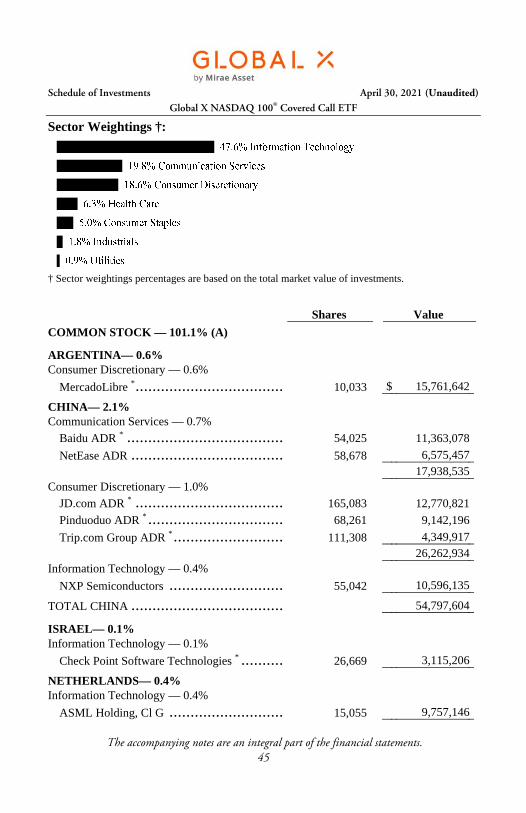
Sector Weightings †:
† Sector weightings percentages are based on the total market value of investments.
Schedule of Investments April 30, 2021 (Unaudited)
Global X NASDAQ 100® Covered Call ETF
The accompanying notes are an integral part of the financial statements. 50
* Non-income producing security. + Notional amount for all options totals $(2,632,158,324). (1) Refer to table below for details on Options Contracts. (A) All or a portion of these securities has been segregated as collateral for written
options contracts. The aggregate market value of collateral at April 30, 2021 was $2,633,464,372.
ADR — American Depositary Receipt Cl — Class NDX —Nasdaq 100 Index
The following is a summary of the level of inputs used as of April 30, 2021, in valuing the Fund's investments carried at value:
Investments in Securities Level 1 Level 2 Level 3 Total Common Stock $ 2,633,464,372
$ —
$ —
$ 2,633,464,372
Total Investments in Securities $ 2,633,464,372
$ —
$ —
$ 2,633,464,372
Liabilities Level 1 Level 2 Level 3 Total Written Options $ (30,963,195)
$ —
$ —
$ (30,963,195)
Total Liabilities $ (30,963,195)
$ —
$ —
$ (30,963,195)
For the period ended April 30, 2021, there have been no transfers in or out of Level 3. Amounts designated as “—“ are $0 or have been rounded to $0.
Schedule of Investments April 30, 2021 (Unaudited)
Global X S&P 500® Covered Call ETF
The accompanying notes are an integral part of the financial statements. 51
Sector Weightings †:
† Sector weightings percentages are based on the total market value of investments.
* Non-income producing security. + Notional amount for all options totals $(220,765,776). ‡ Real Estate Investment Trust (1) Refer to table below for details on Options Contracts. (A) All or a portion of these securities has been segregated as collateral for written
options contracts. The aggregate market value of collateral at April 30, 2021 was $221,155,850.
Cl — Class S&P — Standard & Poor's
The following is a summary of the level of inputs used as of April 30, 2021, in valuing the Fund's investments carried at value:
Investments in Securities Level 1 Level 2 Level 3 Total Common Stock $ 221,155,850
$ —
$ —
$ 221,155,850
Total Investments in Securities $ 221,155,850
$ —
$ —
$ 221,155,850
Liabilities Level 1 Level 2 Level 3 Total Written Option $ (2,951,520)
$ —
$ —
$ (2,951,520)
Total Liabilities $ (2,951,520)
$ —
$ —
$ (2,951,520)
For the period ended April 30, 2021, there have been no transfers in or out of Level 3. Amounts designated as “—“ are $0 or have been rounded to $0.
Schedule of Investments April 30, 2021 (Unaudited)
Global X Russell 2000 Covered Call ETF
The accompanying notes are an integral part of the financial statements. 69
Sector Weightings †:
† Sector weightings percentages are based on the total market value of investments.
Shares/Number
of Contracts Value
EXCHANGE TRADED FUND — 102.3%‡(A) Vanguard Russell 2000 ETF (Cost $114,230,264) ............................. 1,401,992 $ 127,356,953
WRITTEN OPTION— (2.4)%(1)
UNITED STATES— (2.4)% (Premiums Received $3,436,819) .............. (561)
$ (2,953,665)
Percentages are based on Net Assets of $124,516,471.
A list of the exchange traded option contracts held by the Fund at April 30, 2021, is as follows:
‡ For financial information on the Vanguard Russell 2000 ETF, please go to the Securities Exchange Commission’s website at http://www.sec.gov.
* Non-Income producing security. + Notional amount for all options totals $(127,147,789). (1) Refer to table below for details on Options Contracts. (A) All or a portion of these securities has been segregated as collateral for written
options contracts. The aggregate market value of collateral at April 30, 2021 was $127,356,953.
ETF — Exchange Traded Fund
Schedule of Investments April 30, 2021 (Unaudited)
Global X Russell 2000 Covered Call ETF
The accompanying notes are an integral part of the financial statements. 70
The following is a summary of the level of inputs used as of April 30, 2021, in valuing the Fund's investments carried at value:
Investments in Securities Level 1 Level 2 Level 3 Total Exchange Traded Fund $ 127,356,953
$ —
$ —
$ 127,356,953
Total Investments in Securities $ 127,356,953
$ —
$ —
$ 127,356,953
Liabilities Level 1 Level 2 Level 3 Total Written Option $ (2,953,665)
$ —
$ —
$ (2,953,665)
Total Liabilities $ (2,953,665)
$ —
$ —
$ (2,953,665)
For the period ended April 30, 2021, there have been no transfers in or out of Level 3. Amounts designated as “—“ are $0 or have been rounded to $0.
Schedule of Investments April 30, 2021 (Unaudited)
Global X Nasdaq 100® Covered Call & Growth ETF
The accompanying notes are an integral part of the financial statements. 71
Sector Weightings †:
† Sector weightings percentages are based on the total market value of investments.
* Non-income producing security. + Notional amount for all options totals $(5,267,089). (1) Refer to table below for details on Options Contracts. (A) All or a portion of these securities has been segregated as collateral for written
options contracts. The aggregate market value of collateral at April 30, 2021 was $10,820,957.
Schedule of Investments April 30, 2021 (Unaudited)
Global X Nasdaq 100® Covered Call & Growth ETF
The accompanying notes are an integral part of the financial statements. 76
ADR — American Depositary Receipt Cl — Class NQX — Nasdaq 100 Index
The following is a summary of the level of inputs used as of April 30, 2021, in valuing the Fund's investments carried at value:
Investments in Securities Level 1 Level 2 Level 3 Total Common Stock $ 10,820,957
$ —
$ —
$ 10,820,957
Total Investments in Securities $ 10,820,957
$ —
$ —
$ 10,820,957
Liabilities Level 1 Level 2 Level 3 Total Written Option $ (68,970)
$ —
$ —
$ (68,970)
Total Liabilities $ (68,970)
$ —
$ —
$ (68,970)
For the period ended April 30, 2021, there have been no transfers in or out of Level 3. Amounts designated as “—“ are $0 or have been rounded to $0.
Schedule of Investments April 30, 2021 (Unaudited)
Global X S&P 500® Covered Call & Growth ETF
The accompanying notes are an integral part of the financial statements. 77
Sector Weightings †:
† Sector weightings percentages are based on the total market value of investments.
* Non-income producing security. ‡ Real Estate Investment Trust + Notional amount for all options totals $(1,630,668). (1) Refer to table below for details on Options Contracts. (A) All or a portion of these securities has been segregated as collateral for written
options contracts. The aggregate market value of collateral at April 30, 2021 was $3,259,908.
Cl — Class S&P — Standard & Poor's
The following is a summary of the level of inputs used as of April 30, 2021, in valuing the Fund's investments carried at value:
Investments in Securities Level 1 Level 2 Level 3 Total Common Stock $ 3,259,908
$ —
$ —
$ 3,259,908
Total Investments in Securities $ 3,259,908
$ —
$ —
$ 3,259,908
Liabilities Level 1 Level 2 Level 3 Total Written Option $ (22,269)
$ —
$ —
$ (22,269)
Total Liabilities $ (22,269)
$ —
$ —
$ (22,269)
For the period ended April 30, 2021, there have been no transfers in or out of Level 3. Amounts designated as “—“ are $0 or have been rounded to $0.
Schedule of Investments April 30, 2021 (Unaudited)
Global X SuperIncome™ Preferred ETF
The accompanying notes are an integral part of the financial statements. 95
Sector Weightings †:
† Sector weightings percentages are based on the total market value of investments. Repurchaseagreements purchased from cash collateral received for securities lending activity are included intotal investments. Please see Note 2 and 7 in Notes to Financial Statements for more detailed information.
Schedule of Investments April 30, 2021 (Unaudited)
Global X SuperIncome™ Preferred ETF
The accompanying notes are an integral part of the financial statements. 99
Face Amount Value
REPURCHASE AGREEMENT(B) — 0.1%
BNP Paribas 0.000%, dated 04/30/21, to be repurchased on 05/03/21, repurchase price $5,160,716 (collateralized by U.S. Treasury Obligations, ranging in par value $7,643 - $44,905, 1.500%, 02/15/2030, with a total market value of $319,188) (Cost $312,842) ............................... $ 312,842
Percentages are based on Net Assets of $210,974,564.
‡ Real Estate Investment Trust * Non-income producing security. (A) This security or a partial position of this security is on loan at April 30, 2021. The
total value of securities on loan at April 30, 2021 was $507,034. (B) Security was purchased with cash collateral held from securities on loan. The total
value of such securities as of April 30, 2021 was $543,400. (C) The rate reported on the Schedule of Investments is the 7-day effective yield as of
April 30, 2021.
Cl — Class ICE — Intercontinental Exchange LIBOR — London Interbank Offered Rate Ser — Series USD — U.S. Dollar VAR – Variable Rate
The following is a summary of the level of inputs used as of April 30, 2021, in valuing the Fund's investments carried at value:
Investments in Securities Level 1 Level 2 Level 3 Total Preferred Stock $ 211,129,319
$ —
$ —
$ 211,129,319
Short-Term Investment 230,558
—
—
230,558
Repurchase Agreement —
312,842
—
312,842
Total Investments in Securities $ 211,359,877
$ 312,842
$ —
$ 211,672,719
For the period ended April 30, 2021, there have been no transfers in or out of Level 3.
Amounts designated as “—“ are $0 or have been rounded to $0.
Schedule of Investments April 30, 2021 (Unaudited)
Global X Renewable Energy Producers ETF†
The accompanying notes are an integral part of the financial statements. 100
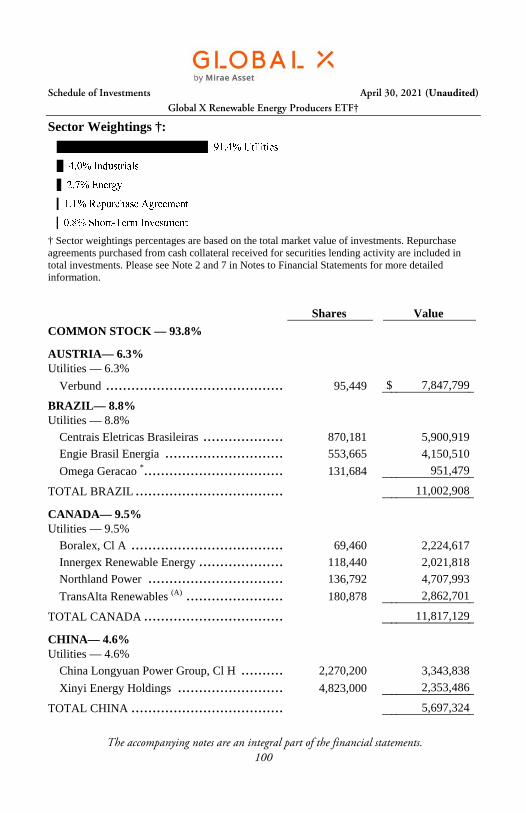
Sector Weightings †:
† Sector weightings percentages are based on the total market value of investments. Repurchase agreements purchased from cash collateral received for securities lending activity are included in total investments. Please see Note 2 and 7 in Notes to Financial Statements for more detailed information.
Schedule of Investments April 30, 2021 (Unaudited)
Global X Renewable Energy Producers ETF†
The accompanying notes are an integral part of the financial statements. 104
Face Amount Value
REPURCHASE AGREEMENT(B) — 1.1%
BNP Paribas 0.000%, dated 04/30/21, to be repurchased on 05/01/21 , repurchase price $1,381,641 (collateralized by U.S. Treasury Obligations, ranging in par value $33,756 - $198,317, 1.500%, 02/15/2030, with a total market value of $1,409,654) (Cost $1,381,641) ............................. $ 1,381,641
Percentages are based on Net Assets of $124,236,858.
† Formerly Global X YieldCo & Renewable Energy Income ETF (see Note 1). * Non-income producing security. (A) This security or a partial position of this security is on loan at April 30, 2021. The
total value of securities on loan at April 30, 2021 was $2,223,515. (B) Security was purchased with cash collateral held from securities on loan. The total
value of such securities as of April 30, 2021 was $2,371,895. (C) The rate reported on the Schedule of Investments is the 7-day effective yield as of
April 30, 2021.
Cl — Class NVDR — Non-Voting Depositary Receipt PJSC — Public Joint Stock Company
The following is a summary of the level of inputs used as of April 30, 2021, in valuing the Fund's investments carried at value:
Investments in Securities Level 1 Level 2 Level 3 Total Common Stock $ 116,583,896
$ —
$ —
$ 116,583,896
Master Limited Partnership 7,296,958
—
—
7,296,958
Short-Term Investment 990,254
—
—
990,254
Repurchase Agreement —
1,381,641
—
1,381,641
Total Investments in Securities $ 124,871,108
$ 1,381,641
$ —
$ 126,252,749
For the period ended April 30, 2021, there have been no transfers in or out of Level 3.
Amounts designated as “—“ are $0 or have been rounded to $0.
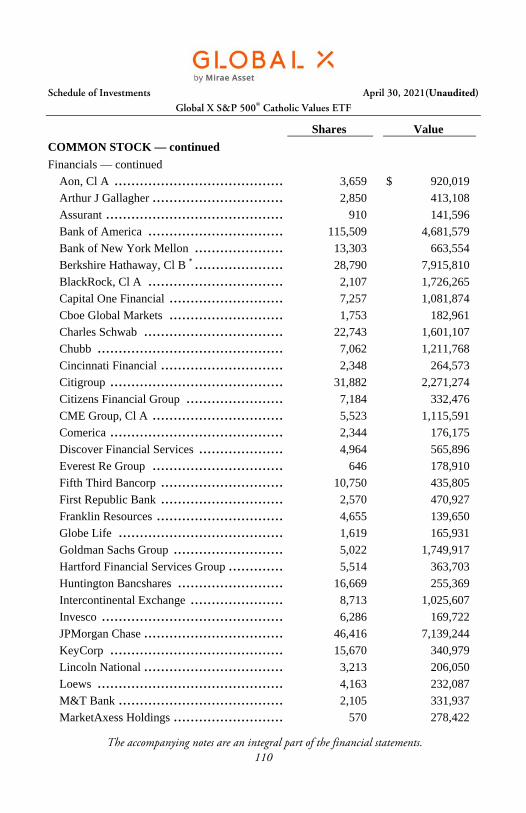
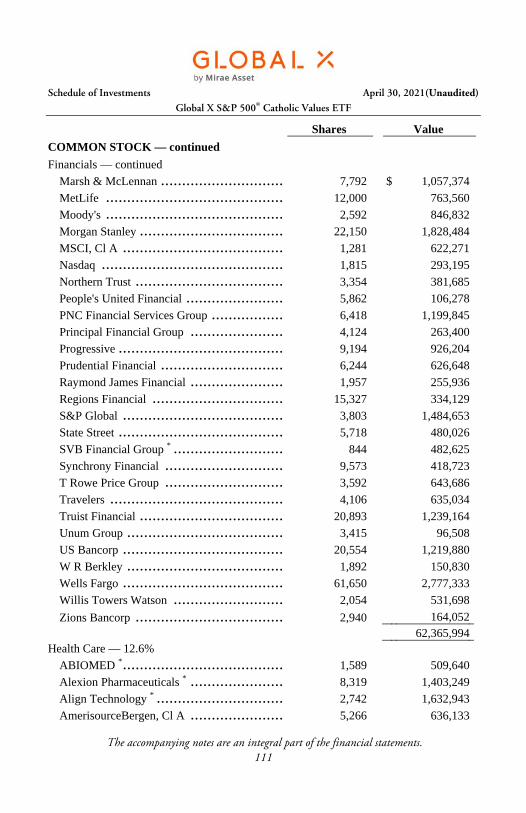
Schedule of Investments April 30, 2021(Unaudited)
Global X S&P 500® Catholic Values ETF
The accompanying notes are an integral part of the financial statements. 105
Sector Weightings †:
† Sector weightings percentages are based on the total market value of investments.
Percentages are based on Net Assets of $537,795,826.
* Non-income producing security. ‡ Real Estate Investment Trust
Cl — Class S&P — Standard & Poor's
As of April 30, 2021, all of the Fund's investments were considered Level 1, inaccordance with authoritative guidance on fair value measurements and disclosure underU.S. GAAP. For the period ended April 30, 2021, there have been no transfers in or out of Level 3.
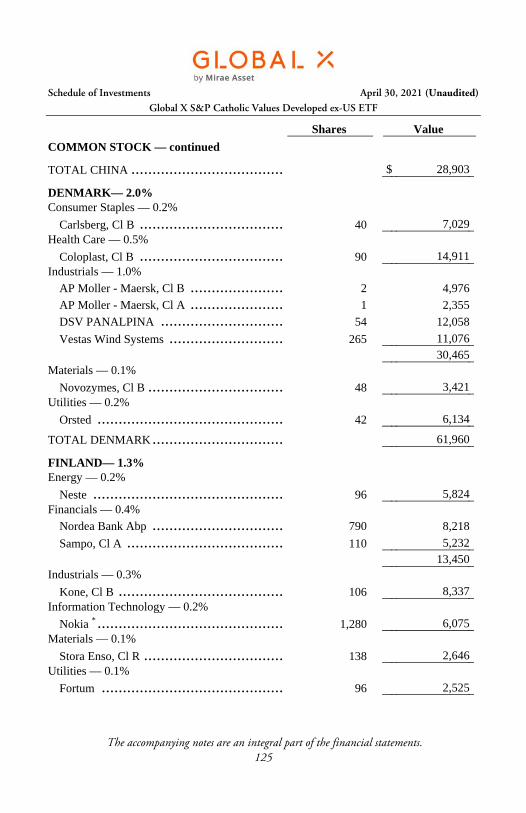
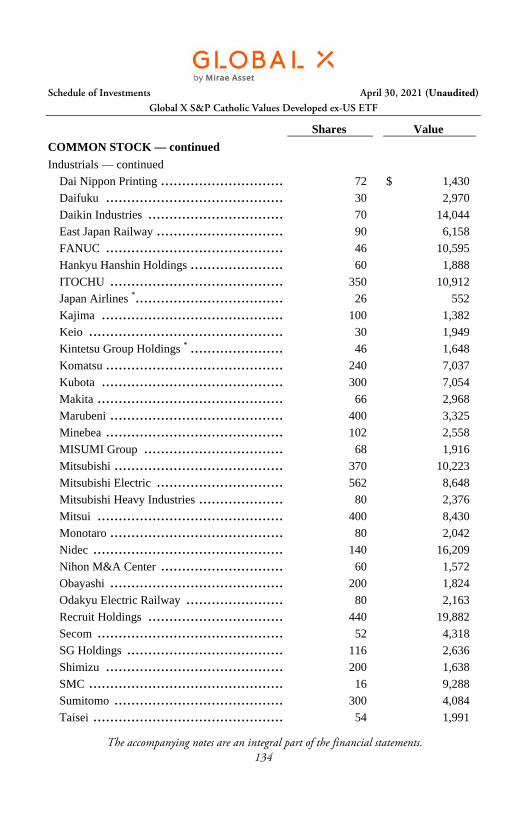
Schedule of Investments April 30, 2021 (Unaudited)
Global X S&P Catholic Values Developed ex-US ETF
The accompanying notes are an integral part of the financial statements. 121
Sector Weightings †:
† Sector weightings percentages are based on the total market value of investments.
Shares Value
COMMON STOCK — 99.2%
AUSTRALIA— 10.8% Communication Services — 0.1%
REA Group ...................................... 9
Percentages are based on Net Assets of $3,189,052.
* Non-income producing security. ‡ Real Estate Investment Trust (A) There is currently no stated interest rate.
The following is a summary of the level of inputs used as of April 30, 2021, in valuing the Fund's investments carried at value:
Investments in Securities Level 1 Level 2 Level 3 Total Common Stock $ 3,091,080
$ 73,549
$ —
$ 3,164,629
Preferred Stock 8,808
—
—
8,808
Total Investments in Securities $ 3,099,888
$ 73,549
$ —
$ 3,173,437
For the period ended April 30, 2021, there have been no transfers in or out of Level 3 Amounts designated as “—“ are $0 or have been rounded to $0.
Schedule of Investments April 30, 2021 (Unaudited)
Global X Guru® Index ETF
The accompanying notes are an integral part of the financial statements. 146
Sector Weightings †:
† Sector weightings percentages are based on the total market value of investments. Repurchase agreements purchased from cash collateral received for securities lending activity are included in total investments. Please see Note 2 and 7 in Notes to Financial Statements for more detailed information.
Shares Value
COMMON STOCK — 100.0%
CANADA— 1.2% Information Technology — 1.2%
Shopify, Cl A * ................................... 765
Schedule of Investments April 30, 2021 (Unaudited)
Global X Guru® Index ETF
The accompanying notes are an integral part of the financial statements. 150
Face Amount Value
REPURCHASE AGREEMENT(B) — 1.6%
BNP Paribas 0.000%, dated 04/30/21, to be repurchased on 05/03/21, repurchase price $1,209,062 (collateralized by U.S. Treasury Obligations, ranging in par value $29,540 - $173,546, 1.500%, 02/15/2030, with a total market value of $1,233,580) (Cost $1,209,062) ............................. $ 1,209,062
Percentages are based on Net Assets of $73,318,056.
ADR — American Depositary Receipt Cl — Class S&P — Standard & Poor's
* Non-income producing security. ‡ Real Estate Investment Trust (A) This security or a partial position of this security is on loan at April 30, 2021. The
total value of securities on loan at April 30, 2021 was $1,971,114. (B) Security was purchased with cash collateral held from securities on loan. The total
value of such securities as of April 30, 2021 was $2,075,625. (C) The rate reported on the Schedule of Investments is the 7-day effective yield as of
April 30, 2021.
The following is a summary of the level of inputs used as of April 30, 2021, in valuing the Fund's investments carried at value:
Investments in Securities Level 1 Level 2 Level 3 Total Common Stock $ 73,281,580
$ —
$ —
$ 73,281,580
Short-Term Investment 866,563
—
—
866,563
Repurchase Agreement —
1,209,062
—
1,209,062
Total Investments in Securities $ 74,148,143
$ 1,209,062
$ —
$ 75,357,205
For the period ended April 30, 2021, there have been no transfers in or out of Level 3. Amounts designated as “—“ are $0 or have been rounded to $0.
STATEMENTS OF ASSETS AND LIABILITIES
April 30, 2021 (Unaudited)
The accompanying notes are an integral part of the financial statements. 151
Global X Social
Media ETF
Global X Lithium & Battery Tech
ETF Global X E-
commerce ETF
Global X Emerging Markets
Internet & E-commerce ETF
Assets: Cost of Investments $ 417,228,434
$ 2,570,352,320
$ 218,240,742
$ 7,146,935
Cost of Repurchase Agreement 1,489,945
56,205,362
2,290,989
—
Cost of Foreign Currency —
386,146
—
—
Investments, at Value $ 486,747,467*
$ 3,209,829,804*
$ 241,752,901*
$ 7,091,075
Repurchase Agreement, at Value 1,489,945
56,205,362
2,290,989
—
Cash 2,352,380
2,698,184
424,802
13,085
Foreign Currency, at Value —
386,146
—
2
Receivable for Investment Securities Sold 38,603,859
—
—
—
Dividend and Interest Receivable 51,217
1,742,139
46,529
160
Receivable for Capital Shares Sold —
17,177,985
—
—
Total Assets 529,244,868
3,288,039,620
244,515,221
7,104,322
Liabilities: Obligation to Return Securities
Lending Collateral 1,627,506
90,683,598
3,932,994
—
Payable for Investment Securities Purchased 39,797,401
17,883,517
—
—
Payable due to Investment Adviser 243,847
1,814,653
97,126
3,847
Unrealized Depreciation on Spot Contracts 348
6,596
—
—
Total Liabilities 41,669,102
110,388,364
4,030,120
3,847
Net Assets $ 487,575,766
$ 3,177,651,256
$ 240,485,101
$ 7,100,475
Net Assets Consist of: Paid-in Capital $ 362,456,677
$ 2,695,487,375
$ 208,716,973
$ 7,266,712
Total Distributable Earnings/(Loss) 125,119,089
482,163,881
31,768,128
(166,237)
Net Assets $ 487,575,766
$ 3,177,651,256
$ 240,485,101
$ 7,100,475
Outstanding Shares of Beneficial Interest
(unlimited authorization — no par value) 7,050,000
49,954,628
6,940,002
450,000
Net Asset Value, Offering and Redemption Price Per Share $69.16
$63.61
$34.65
$15.78
*Includes Market Value of Securities on Loan $ 1,132,561
$ 86,507,954
$ 3,932,277
$ —
STATEMENTS OF ASSETS AND LIABILITIES
April 30, 2021 (Unaudited)
The accompanying notes are an integral part of the financial statements. 152
Global X SuperDividend®
ETF
Global X SuperDividend®
U.S. ETF
Global X MSCI SuperDividend®
EAFE ETF
Global X MSCI SuperDividend®
Emerging Markets ETF
Assets: Cost of Investments $ 852,051,649
$ 591,749,402
$ 9,991,956
$ 33,107,866
Cost of Repurchase Agreement 8,170,388
5,160,716
—
—
Cost of Foreign Currency 6,575,082
—
—
117,428
Investments, at Value $ 929,337,700*
$ 674,173,368*
$ 11,651,505
$ 37,356,434
Repurchase Agreement, at Value 8,170,388
5,160,716
—
—
Cash —
420,925
5,646
118,953
Foreign Currency, at Value 6,546,834
—
8,262
117,975
Dividend and Interest Receivable 5,040,213
2,398,717
61,952
128,559
Receivable for Capital Shares Sold 4,238,510
—
—
—
Reclaim Receivable 543,375
8,115
23,288
6,604
Unrealized Appreciation on Spot Contracts —
—
41
37
Total Assets 953,877,020
682,161,841
11,750,694
37,728,562
Liabilities: Obligation to Return Securities
Lending Collateral 14,026,294
8,859,521
—
—
Cash Overdraft 7,475,304
—
—
—
Payable for Investment Securities Purchased 3,994,267
—
—
239,852
Payable due to Investment Adviser 431,647
244,206
5,179
19,242
Unrealized Depreciation on Spot Contracts 911
—
—
—
Total Liabilities 25,928,423
9,103,727
5,179
259,094
Net Assets $ 927,948,597
$ 673,058,114
$ 11,745,515
$ 37,469,468
Net Assets Consist of: Paid-in Capital $ 1,394,000,839
$ 785,000,875
$ 12,331,518
$ 41,461,861
Total Distributable Loss (466,052,242)
(111,942,761)
(586,003)
(3,992,393)
Net Assets $ 927,948,597
$ 673,058,114
$ 11,745,515
$ 37,469,468
Outstanding Shares of Beneficial Interest
(unlimited authorization — no par value) 65,680,000
34,150,000
740,000
3,130,000
Net Asset Value, Offering and Redemption Price Per Share $14.13
$19.71
$15.87
$11.97
*Includes Market Value of Securities on Loan $ 12,448,370
$ 8,640,452
$ —
$ —
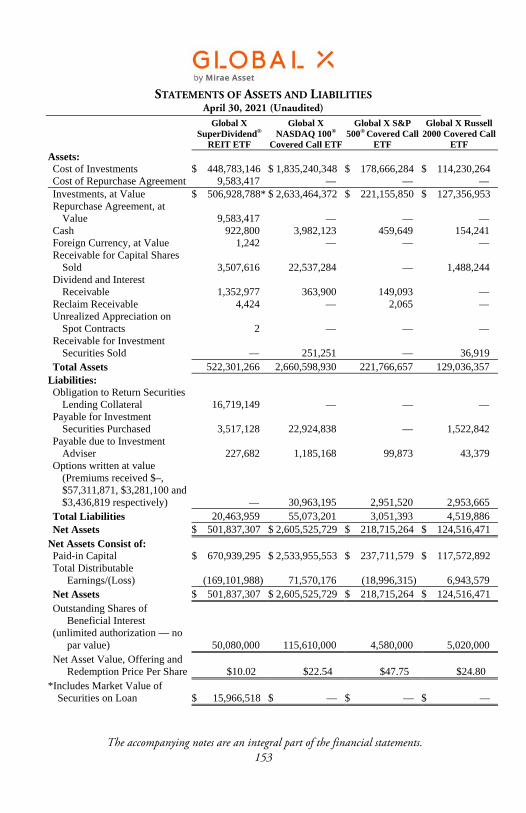
STATEMENTS OF ASSETS AND LIABILITIES
April 30, 2021 (Unaudited)
The accompanying notes are an integral part of the financial statements. 153
Global X SuperDividend®
REIT ETF
Global X NASDAQ 100®
Covered Call ETF
Global X S&P 500® Covered Call
ETF
Global X Russell 2000 Covered Call
ETF Assets: Cost of Investments $ 448,783,146
$ 1,835,240,348
$ 178,666,284
$ 114,230,264
Cost of Repurchase Agreement 9,583,417
—
—
—
Investments, at Value $ 506,928,788*
$ 2,633,464,372
$ 221,155,850
$ 127,356,953
Repurchase Agreement, at Value 9,583,417
—
—
—
Cash 922,800
3,982,123
459,649
154,241
Foreign Currency, at Value 1,242
—
—
—
Receivable for Capital Shares Sold 3,507,616
22,537,284
—
1,488,244
Dividend and Interest Receivable 1,352,977
363,900
149,093
—
Reclaim Receivable 4,424
—
2,065
—
Unrealized Appreciation on Spot Contracts 2
—
—
—
Receivable for Investment Securities Sold —
251,251
—
36,919
Total Assets 522,301,266
2,660,598,930
221,766,657
129,036,357
Liabilities: Obligation to Return Securities
Lending Collateral 16,719,149
—
—
—
Payable for Investment Securities Purchased 3,517,128
22,924,838
—
1,522,842
Payable due to Investment Adviser 227,682
1,185,168
99,873
43,379
Options written at value (Premiums received $–, $57,311,871, $3,281,100 and $3,436,819 respectively) —
30,963,195
2,951,520
2,953,665
Total Liabilities 20,463,959
55,073,201
3,051,393
4,519,886
Net Assets $ 501,837,307
$ 2,605,525,729
$ 218,715,264
$ 124,516,471
Net Assets Consist of: Paid-in Capital $ 670,939,295
$ 2,533,955,553
$ 237,711,579
$ 117,572,892
Total Distributable Earnings/(Loss) (169,101,988)
71,570,176
(18,996,315)
6,943,579
Net Assets $ 501,837,307
$ 2,605,525,729
$ 218,715,264
$ 124,516,471
Outstanding Shares of Beneficial Interest
(unlimited authorization — no par value) 50,080,000
115,610,000
4,580,000
5,020,000
Net Asset Value, Offering and Redemption Price Per Share $10.02
$22.54
$47.75
$24.80
*Includes Market Value of Securities on Loan $ 15,966,518
$ —
$ —
$ —
STATEMENTS OF ASSETS AND LIABILITIES
April 30, 2021 (Unaudited)
The accompanying notes are an integral part of the financial statements. 154
Global X Nasdaq 100® Covered Call
& Growth ETF
Global X S&P 500® Covered Call
& Growth ETF
Global X SuperIncome™ Preferred ETF
Global X Renewable Energy
Producers ETF Assets: Cost of Investments $ 9,782,015
$ 2,919,159
$ 202,876,205
$ 131,562,240
Cost of Repurchase Agreement —
—
312,842
1,381,641
Cost of Foreign Currency —
—
—
54,638
Investments, at Value $ 10,820,957
$ 3,259,908
$ 211,359,877*
$ 124,871,108*
Repurchase Agreement, at Value —
—
312,842
1,381,641
Cash 14,248
14,200
1,270,322
36,964
Foreign Currency, at Value —
—
—
54,753
Dividend and Interest Receivable 1,515
2,195
694,753
272,895
Unrealized Appreciation on Spot Contracts —
—
—
4
Receivable for Capital Shares Sold —
—
356,578
1,576,611
Receivable for Investment Securities Sold —
—
—
80
Reclaim Receivable —
12
—
51,197
Total Assets 10,836,720
3,276,315
213,994,372
128,245,253
Liabilities: Obligation to Return Securities
Lending Collateral —
—
543,400
2,371,895
Options written at value (Premiums received $123,637, $24,789, $– and $– respectively) 68,970
22,269
—
—
Payable due to Investment Adviser 5,305
1,518
99,749
63,273
Payable for Investment Securities Purchased —
—
2,376,659
1,573,227
Total Liabilities 74,275
23,787
3,019,808
4,008,395
Net Assets $ 10,762,445
$ 3,252,528
$ 210,974,564
$ 124,236,858
Net Assets Consist of: Paid-in Capital $ 9,950,117
$ 2,701,317
$ 264,363,602
$ 124,893,079
Total Distributable Earnings/(Loss) 812,328
551,211
(53,389,038)
(656,221)
Net Assets $ 10,762,445
$ 3,252,528
$ 210,974,564
$ 124,236,858
Outstanding Shares of Beneficial Interest
(unlimited authorization — no par value) 350,000
110,000
17,750,000
7,880,000
Net Asset Value, Offering and Redemption Price Per Share $30.75
$29.57
$11.89
$15.77
*Includes Market Value of Securities on Loan $ —
$ —
$ 507,034
$ 2,223,515
STATEMENTS OF ASSETS AND LIABILITIES
April 30, 2021 (Unaudited)
The accompanying notes are an integral part of the financial statements. 155
Global X S&P 500® Catholic Values ETF
Global X S&P Catholic Values
Developed ex-U.S. ETF
Global X Guru® Index ETF
Assets: Cost of Investments $ 377,662,063
$ 2,552,762
$ 62,429,621
Cost of Repurchase Agreement —
—
1,209,062
Cost of Foreign Currency —
1,460
—
Investments, at Value $ 536,505,511
$ 3,173,437
$ 74,148,143*
Repurchase Agreement, at Value —
—
1,209,062
Cash 1,099,342
4,827
47,628
Foreign Currency, at Value —
1,457
—
Dividend and Interest Receivable 313,955
11,534
31,239
Reclaim Receivable 2,698
552
—
Receivable for Capital Shares Sold —
—
476,091
Total Assets 537,921,506
3,191,807
75,912,163
Liabilities: Obligation to Return Securities
Lending Collateral —
—
2,075,625
Payable due to Investment Adviser 125,680
918
44,188
Payable for Investment Securities Purchased —
1,830
474,294
Unrealized Depreciation on Spot Contracts —
7
—
Total Liabilities 125,680
2,755
2,594,107
Net Assets $ 537,795,826
$ 3,189,052
$ 73,318,056
Net Assets Consist of: Paid-in Capital $ 373,001,471
$ 2,505,028
$ 69,845,427
Total Distributable Earnings 164,794,355
684,024
3,472,629
Net Assets $ 537,795,826
$ 3,189,052
$ 73,318,056
Outstanding Shares of Beneficial Interest
(unlimited authorization — no par value) 10,330,000
100,000
1,540,000
Net Asset Value, Offering and Redemption Price Per Share $52.06
$31.89
$47.61
*Includes Market Value of Securities on Loan $ —
$ —
$ 1,971,114
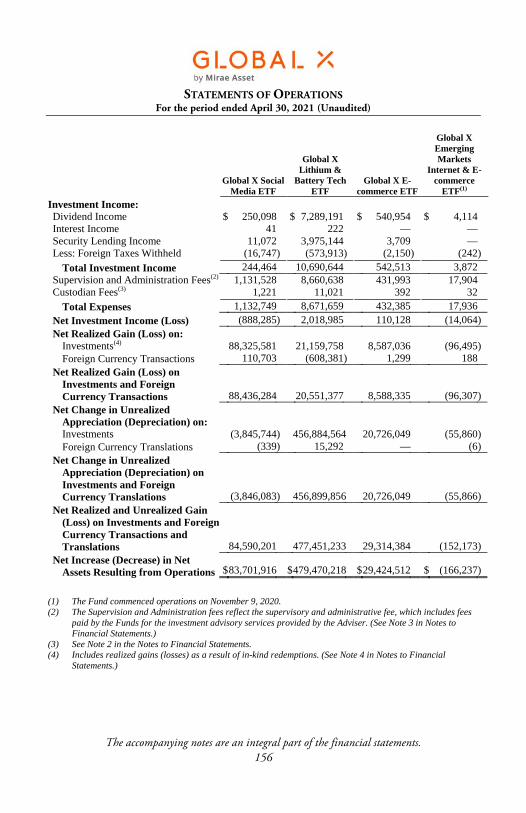
STATEMENTS OF OPERATIONS
For the period ended April 30, 2021 (Unaudited)
The accompanying notes are an integral part of the financial statements. 156
Global X Social
Media ETF
Global X Lithium &
Battery Tech ETF
Global X E-commerce ETF
Global X Emerging Markets
Internet & E-commerce
ETF(1)
Investment Income: Dividend Income $ 250,098
$ 7,289,191
$ 540,954
$ 4,114
Interest Income 41
222
—
—
Security Lending Income 11,072
3,975,144
3,709
—
Less: Foreign Taxes Withheld (16,747)
(573,913 )
(2,150 )
(242 )
Total Investment Income 244,464
10,690,644
542,513
3,872
Supervision and Administration Fees(2) 1,131,528
8,660,638
431,993
17,904
Custodian Fees(3) 1,221
11,021
392
32
Total Expenses 1,132,749
8,671,659
432,385
17,936
Net Investment Income (Loss) (888,285)
2,018,985
110,128
(14,064 )
Net Realized Gain (Loss) on: Investments(4) 88,325,581
21,159,758
8,587,036
(96,495 )
Foreign Currency Transactions 110,703
(608,381 )
1,299
188
Net Realized Gain (Loss) on Investments and Foreign Currency Transactions 88,436,284
20,551,377
8,588,335
(96,307 )
Net Change in Unrealized Appreciation (Depreciation) on: Investments (3,845,744)
456,884,564
20,726,049
(55,860 )
Foreign Currency Translations (339)
15,292
—
(6 )
Net Change in Unrealized Appreciation (Depreciation) on Investments and Foreign Currency Translations (3,846,083)
456,899,856
20,726,049
(55,866 )
Net Realized and Unrealized Gain (Loss) on Investments and Foreign Currency Transactions and Translations 84,590,201
477,451,233
29,314,384
(152,173 )
Net Increase (Decrease) in Net Assets Resulting from Operations $83,701,916
$479,470,218
$29,424,512
$ (166,237 )
(1) The Fund commenced operations on November 9, 2020. (2) The Supervision and Administration fees reflect the supervisory and administrative fee, which includes fees
paid by the Funds for the investment advisory services provided by the Adviser. (See Note 3 in Notes to Financial Statements.)
(3) See Note 2 in the Notes to Financial Statements. (4) Includes realized gains (losses) as a result of in-kind redemptions. (See Note 4 in Notes to Financial
Statements.)
STATEMENTS OF OPERATIONS
For the period ended April 30, 2021 (Unaudited)
The accompanying notes are an integral part of the financial statements. 157
Global X SuperDividend®
ETF
Global X SuperDividend®
U.S. ETF
Global X MSCI SuperDividend®
EAFE ETF
Global X MSCI SuperDividend®
Emerging Markets ETF
Investment Income: Dividend Income $21,730,857
$10,615,732
$ 278,548
$ 679,689
Interest Income —
14
—
25
Security Lending Income 1,058,730
1,421,990
—
—
Less: Foreign Taxes Withheld (890,284)
—
(23,862 )
(76,966 )
Total Investment Income 21,899,303
12,037,736
254,686
602,748
Supervision and Administration Fees(1) 2,300,829
1,225,109
26,966
91,800
Custodian Fees(2) 60,641
4,828
173
564
Total Expenses 2,361,470
1,229,937
27,139
92,364
Net Investment Income 19,537,833
10,807,799
227,547
510,384
Net Realized Gain (Loss) on: Investments(3) 76,954,559
46,570,117
352,692
91,867
Foreign Currency Transactions (168,640)
—
(8,945 )
(14,477 )
Net Realized Gain on Investments and Foreign Currency Transactions 76,785,919
46,570,117
343,747
77,390
Net Change in Unrealized Appreciation (Depreciation) on: Investments 144,096,149
100,386,005
2,549,170
5,530,066
Foreign Capital Gains Tax on Appreciated Securities —
—
—
(26,703 )
Foreign Currency Translations 29,616
—
211
1,537
Net Change in Unrealized Appreciation on Investments and Foreign Currency Translations 144,125,765
100,386,005
2,549,381
5,504,900
Net Realized and Unrealized Gain on Investments and Foreign Currency Transactions and Translations 220,911,684
146,956,122
2,893,128
5,582,290
Net Increase in Net Assets Resulting from Operations $240,449,517
$157,763,921
$ 3,120,675
$ 6,092,674
(1) The Supervision and Administration fees reflect the supervisory and administrative fee, which includes fees paid by the Funds for the investment advisory services provided by the Adviser. (See Note 3 in Notes to Financial Statements.)
(2) See Note 2 in the Notes to Financial Statements. (3) Includes realized gains (losses) as a result of in-kind redemptions. (See Note 4 in Notes to Financial
Statements.)
STATEMENTS OF OPERATIONS
For the period ended April 30, 2021 (Unaudited)
The accompanying notes are an integral part of the financial statements. 158
Global X SuperDividend®
REIT ETF
Global X NASDAQ 100® Covered Call
ETF
Global X S&P 500® Covered
Call ETF
Global X Russell 2000 Covered Call
ETF
Investment Income: Dividend Income $10,513,854
$ 7,323,755
$ 1,141,786
$ 298,548
Interest Income 8
—
9
—
Security Lending Income 1,336,006
—
—
—
Less: Foreign Taxes Withheld —
(7,921 )
(59 )
—
Total Investment Income 11,849,868
7,315,834
1,141,736
298,548
Supervision and Administration Fees(1) 1,163,296
5,473,714
433,400
156,526
Custodian Fees(2) 12,360
44,422
2,283
734
Broker Fees —
72
16
—
Total Expenses 1,175,656
5,518,208
435,699
157,260
Waiver of Supervision and Administration Fees –
(40 )
(16 )
(26,087 )
Net Expenses 1,175,656
5,518,168
435,683
131,173
Net Investment Income 10,674,212
1,797,666
706,053
167,375
Net Realized Gain (Loss) on: Investments(3) (21,458,288)
16,443,655
1,362,560
71,274
Written Options —
(153,482,097)
(12,634,505)
(945,129 )
Foreign Currency Transactions (98,631)
—
—
—
Net Realized Loss on Investments and Foreign Currency Transactions (21,556,919)
(137,038,442)
(11,271,945)
(873,855 )
Net Change in Unrealized Appreciation (Depreciation) on: Investments 132,724,158
379,109,706
33,721,861
12,466,513
Written Options —
(17,045,261)
(1,268,428 )
(56,931 )
Foreign Currency Translations (922)
—
—
—
Net Change in Unrealized Appreciation on Investments, Written Options and Foreign Currency Translations 132,723,236
362,064,445
32,453,433
12,409,582
Net Realized and Unrealized Gain on Investments, Written Options and Foreign Currency Transactions and Translations 111,166,317
225,026,003
21,181,488
11,535,727
Net Increase in Net Assets Resulting from Operations $121,840,529
$226,823,669
$21,887,541
$11,703,102
(1) The Supervision and Administration fees reflect the supervisory and administrative fee, which includes fees paid by the Funds for the investment advisory services provided by the Adviser. (See Note 3 in Notes to Financial Statements.)
(2) See Note 2 in the Notes to Financial Statements. (3) Includes realized gains (losses) as a result of in-kind redemptions. (See Note 4 in Notes to Financial
Statements.)
STATEMENTS OF OPERATIONS
For the period ended April 30, 2021 (Unaudited)
The accompanying notes are an integral part of the financial statements. 159
Global X Nasdaq 100®
Covered Call & Growth ETF
Global X S&P 500® Covered
Call & Growth ETF
Global X SuperIncome™ Preferred ETF
Global X Renewable
Energy Producers
ETF~
Investment Income: Dividend Income $ 25,943
$ 27,364
$ 5,610,131
$ 1,328,890
Interest Income —
—
21
101
Security Lending Income —
—
9,148
6,171
Less: Foreign Taxes Withheld (35)
—
—
(140,770 )
Total Investment Income 25,908
27,364
5,619,300
1,194,392
Supervision and Administration Fees(1) 20,269
9,863
573,015
317,099
Custodian Fees(2) 28
88
840
1,204
Broker Fees —
11
—
—
Total Expenses 20,297
9,962
573,855
318,303
Net Investment Income 5,611
17,402
5,045,445
876,089
Net Realized Gain (Loss) on: Investments(3) 296,046
432,319
5,094,535
7,330,559
Written Options (296,724)
(109,537 )
—
—
Foreign Currency Transactions —
—
—
(8,750 )
Net Realized Gain (Loss) on Investments and Foreign Currency Transactions (678)
322,782
5,094,535
7,321,809
Net Change in Unrealized Appreciation (Depreciation) on: Investments 1,150,528
401,776
8,430,496
(9,686,727 )
Written Options (25,972)
(40,606 )
—
—
Foreign Currency Translations —
—
—
2,830
Net Change in Unrealized Appreciation (Depreciation) on Investments, Written Options and Foreign Currency Translations 1,124,556
361,170
8,430,496
(9,683,897 )
Net Realized and Unrealized Gain (Loss) on Investments, Written Options and Foreign Currency Transactions and Translations 1,123,878
683,952
13,525,031
(2,362,088 )
Net Increase (Decrease) in Net Assets Resulting from Operations $ 1,129,489
$ 701,354
$18,570,476
$ (1,485,999 )
~ Formerly Global X YieldCo & Renewable Energy Income ETF (see Note 1). (1) The Supervision and Administration fees reflect the supervisory and administrative fee, which includes fees
paid by the Funds for the investment advisory services provided by the Adviser. (See Note 3 in Notes to Financial Statements.)
(2) See Note 2 in the Notes to Financial Statements. (3) Includes realized gains (losses) as a result of in-kind redemptions. (See Note 4 in Notes to Financial
Statements.)
STATEMENTS OF OPERATIONS
For the period ended April 30, 2021 (Unaudited)
The accompanying notes are an integral part of the financial statements. 160
Global X S&P 500® Catholic Values ETF
Global X S&P Catholic Values Developed ex-
U.S. ETF Global X Guru®
Index ETF
Investment Income: Dividend Income $ 3,567,033
$ 41,667
$ 1,318,038
Interest Income 32
—
4
Security Lending Income —
—
2,453
Less: Foreign Taxes Withheld —
(4,748 )
(744 )
Total Investment Income 3,567,065
36,919
1,319,751
Supervision and Administration Fees(1) 675,086
5,266
254,825
Custodian Fees(2) 207
1
433
Total Expenses 675,293
5,267
255,258
Net Investment Income 2,891,772
31,652
1,064,493
Net Realized Gain on: Investments(3) 6,368,946
41,357
8,995,652
Foreign Currency Transactions —
69
—
Net Realized Gain on Investments and Foreign Currency Transactions 6,368,946
41,426
8,995,652
Net Change in Unrealized Appreciation (Depreciation) on: Investments 109,284,413
643,996
6,901,517
Foreign Currency Translations —
(9 )
—
Net Change in Unrealized Appreciation on Investments and Foreign Currency Translations 109,284,413
643,987
6,901,517
Net Realized and Unrealized Gain on Investments and Foreign Currency Transactions and Translations 115,653,359
685,413
15,897,169
Net Increase in Net Assets Resulting from Operations $118,545,131
$ 717,065
$16,961,662
(1) The Supervision and Administration fees reflect the supervisory and administrative fee, which includes fees paid by the Funds for the investment advisory services provided by the Adviser. (See Note 3 in Notes to Financial Statements.)
(2) See Note 2 in the Notes to Financial Statements. (3) Includes realized gains (losses) as a result of in-kind redemptions. (See Note 4 in Notes to Financial
Statements.)
STATEMENTS OF CHANGES IN NET ASSETS
The accompanying notes are an integral part of the financial statements. 161
Global X Social Media ETF Global X Lithium & Battery Tech
ETF
Period Ended April 30, 2021 (Unaudited)
Year Ended October 31, 2020
Period Ended April 30, 2021 (Unaudited)
Year Ended October 31, 2020
Operations: Net Investment Income (Loss) $ (888,285)
$ (419,184)
$ 2,018,985
$ 7,436,786
Net Realized Gain (Loss) on Investments and Foreign Currency Transactions(1) 88,436,284
2,388,309
20,551,377
(70,959,626)
Net Change in Unrealized Appreciation (Depreciation) on Investments and Foreign Currency Translations (3,846,083)
72,141,710
456,899,856
380,703,549
Net Increase in Net Assets Resulting from Operations 83,701,916
74,110,835
479,470,218
317,180,709
Distributions —
—
(2,827,506)
(7,964,116)
Capital Share Transactions: Issued 310,857,095
42,396,781
1,894,571,182
192,232,822
Redeemed (132,982,602)
(11,797,388)
(62,456,493)
(87,679,225)
Increase in Net Assets from Capital Share Transactions 177,874,493
30,599,393
1,832,114,689
104,553,597
Total Increase in Net Assets 261,576,409
104,710,228
2,308,757,401
413,770,190
Net Assets: Beginning of Year/Period 225,999,357
121,289,129
868,893,855
455,123,665
End of Year/Period $ 487,575,766
$ 225,999,357
$3,177,651,256
$ 868,893,855
Share Transactions: Issued 4,450,000
900,000
30,730,000
5,500,000
Redeemed (1,750,000)
(350,000)
(1,050,000)
(3,400,000)
Net Increase in Shares Outstanding from Share Transactions 2,700,000
550,000
29,680,000
2,100,000
(1) Includes realized gains (losses) as a result of in-kind redemptions. (See Note 4 in Notes to Financial Statements.)
STATEMENTS OF CHANGES IN NET ASSETS
The accompanying notes are an integral part of the financial statements. 162
Global X E-commerce ETF
Global X Emerging
Markets Internet & E-commerce
ETF
Period Ended April 30, 2021 (Unaudited)
Year Ended October 31, 2020
Period Ended April 30, 2021(1)
Operations: Net Investment Income (Loss) $ 110,128
$ 236,091
$ (14,064)
Net Realized Gain (Loss) on Investments and Foreign Currency Transactions(2) 8,588,335
5,004,215
(96,307)
Net Change in Unrealized Appreciation (Depreciation) on Investments and Foreign Currency Translations 20,726,049
2,848,383
(55,866)
Net Increase (Decrease) in Net Assets Resulting from Operations 29,424,512
8,088,689
(166,237)
Distributions (1,105,636)
(11,908)
—
Capital Share Transactions: Issued 139,579,473 92,365,190 7,266,712 Redeemed (18,496,116)
(12,875,911)
—
Increase in Net Assets from Capital Share Transactions 121,083,357
79,489,279
7,266,712
Total Increase in Net Assets 149,402,233
87,566,060
7,100,475
Net Assets: Beginning of Year/Period 91,082,868
3,516,808
—
End of Year/Period $ 240,485,101
$ 91,082,868
$ 7,100,475
Share Transactions: Issued 4,090,000
3,700,000
450,000
Redeemed (550,000)
(500,000)
—
Net Increase in Shares Outstanding from Share Transactions 3,540,000
3,200,000
450,000
(1) The Fund commenced operations on November 9, 2020 (2) Includes realized gains (losses) as a result of in-kind redemptions. (See Note 4 in Notes to Financial
Statements.)
STATEMENTS OF CHANGES IN NET ASSETS
The accompanying notes are an integral part of the financial statements. 163
Global X SuperDividend® ETF Global X SuperDividend® U.S. ETF
Period Ended April 30, 2021 (Unaudited)
Year Ended October 31, 2020
Period Ended April 30, 2021 (Unaudited)
Year Ended October 31, 2020
Operations: Net Investment Income $ 19,537,833
$ 47,853,557
$ 10,807,799
$ 16,034,317
Net Realized Gain (Loss) on Investments and Foreign Currency Transactions(1) 76,785,919
(332,000,940)
46,570,117
(164,403,700)
Net Change in Unrealized Appreciation (Depreciation) on Investments and Foreign Currency Translations 144,125,765
(31,232,599)
100,386,005
(30,409,532)
Net Increase (Decrease) in Net Assets Resulting from Operations 240,449,517
(315,379,982)
157,763,921
(178,778,915)
Distributions (28,324,450)
(57,676,007)
(17,365,295)
(28,896,892)
Return of Capital —
(6,836,903)
—
(9,790,983)
Capital Share Transactions: Issued 94,224,174
103,937,093
125,361,484
126,598,315
Redeemed (5,271,538)
(29,283,816)
(4,811,564)
(41,906,406)
Increase in Net Assets from Capital Share Transactions 88,952,636
74,653,277
120,549,920
84,691,909
Total Increase (Decrease) in Net Assets 301,077,703
(305,239,615)
260,948,546
(132,774,881)
Net Assets: Beginning of Year/Period 626,870,894
932,110,509
412,109,568
544,884,449
End of Year/Period $ 927,948,597
$ 626,870,894
$ 673,058,114
$ 412,109,568
Share Transactions: Issued 6,980,000
7,900,000
6,950,000
6,850,000
Redeemed (400,000)
(2,850,000)
(300,000)
(2,700,000)
Net Increase in Shares Outstanding from Share Transactions 6,580,000
5,050,000
6,650,000
4,150,000
(1) Includes realized gains (losses) as a result of in-kind redemptions. (See Note 4 in Notes to Financial Statements.)
STATEMENTS OF CHANGES IN NET ASSETS
The accompanying notes are an integral part of the financial statements. 164
Global X MSCI SuperDividend®
EAFE ETF Global X MSCI SuperDividend®
Emerging Markets ETF
Period Ended April 30, 2021 (Unaudited)
Year Ended October 31, 2020
Period Ended April 30, 2021 (Unaudited)
Year Ended October 31, 2020
Operations: Net Investment Income $ 227,547
$ 420,436
$ 510,384
$ 937,936
Net Realized Gain (Loss) on Investments and Foreign Currency Transactions(1) 343,747
(2,850,672)
77,390
(4,240,074)
Net Change in Unrealized Appreciation (Depreciation) on Investments and Foreign Currency Translations 2,549,381
(1,397,681)
5,504,900
(1,273,762)
Net Increase (Decrease) in Net Assets Resulting from Operations 3,120,675
(3,827,917)
6,092,674
(4,575,900)
Distributions (217,100)
(454,057)
(822,350)
(1,074,084)
Return of Capital —
(119,148)
—
(222,316)
Capital Share Transactions: Issued 1,405,824
1,244,166
12,191,919
8,390,747
Redeemed —
(7,934,045)
—
—
Increase (Decrease) in Net Assets from Capital Share Transactions 1,405,824
(6,689,879)
12,191,919
8,390,747
Total Increase (Decrease) in Net Assets 4,309,399
(11,091,001)
17,462,243
2,518,447
Net Assets: Beginning of Year/Period 7,436,116
18,527,117
20,007,225
17,488,778
End of Year/Period $ 11,745,515
$ 7,436,116
$ 37,469,468
$ 20,007,225
Share Transactions: Issued 90,000
100,000
1,030,000
750,000
Redeemed —
(600,000)
—
—
Net Increase (Decrease) in Shares Outstanding from Share Transactions 90,000
(500,000)
1,030,000
750,000
(1) Includes realized gains (losses) as a result of in-kind redemptions. (See Note 4 in Notes to Financial Statements.)
STATEMENTS OF CHANGES IN NET ASSETS
The accompanying notes are an integral part of the financial statements. 165
Global X SuperDividend® REIT
ETF Global X NASDAQ 100® Covered
Call ETF
Period Ended April 30, 2021 (Unaudited)
Year Ended October 31, 2020
Period Ended April 30, 2021 (Unaudited)
Year Ended October 31, 2020
Operations: Net Investment Income $ 10,674,212
$ 20,875,910
$ 1,797,666
$ 2,834,579
Net Realized Loss on Investments, Written Options and Foreign Currency Transactions(1) (21,556,919)
(189,607,476)
(137,038,442)
(362,054,221)
Net Change in Unrealized Appreciation (Depreciation) on Investments, Written Options and Foreign Currency Translations 132,723,236
(86,948,832)
362,064,445
350,742,699
Net Increase (Decrease) in Net Assets Resulting from Operations 121,840,529
(255,680,398)
226,823,669
(8,476,943)
Distributions (13,988,750)
(30,276,922)
(114,189,480)
(2,834,579)
Return of Capital —
(2,127,168)
—
(117,268,361)
Capital Share Transactions: Issued 85,055,668
353,909,646
1,185,504,954
751,004,959
Redeemed (2,695,315)
(118,989,550)
(18,255,741)
(64,819,105)
Increase in Net Assets from Capital Share Transactions 82,360,353
234,920,096
1,167,249,213
686,185,854
Total Increase (Decrease) in Net Assets 190,212,132
(53,164,392)
1,279,883,402
557,605,971
Net Assets: Beginning of Year/Period 311,625,175
364,789,567
1,325,642,327
768,036,356
End of Year/Period $ 501,837,307
$ 311,625,175
$2,605,525,729
$1,325,642,327
Share Transactions: Issued 9,180,000
27,700,000
52,220,000
34,200,000
Redeemed (300,000)
(10,300,000)
(810,000)
(3,250,000)
Net Increase in Shares Outstanding from Share Transactions 8,880,000
17,400,000
51,410,000
30,950,000
(1) Includes realized gains (losses) as a result of in-kind redemptions. (See Note 4 in Notes to Financial Statements.)
STATEMENTS OF CHANGES IN NET ASSETS
The accompanying notes are an integral part of the financial statements. 166
Global X S&P 500® Covered Call
ETF Global X Russell 2000 Covered Call
ETF
Period Ended April 30, 2021 (Unaudited)
Year Ended October 31, 2020
Period Ended April 30, 2021 (Unaudited)
Year Ended October 31, 2020
Operations: Net Investment Income $ 706,053
$ 1,494,418
$ 167,375
$ 82,683
Net Realized Loss on Investments and Written Options (1) (11,271,945)
(8,346,049)
(873,855)
(2,140,737)
Net Change in Unrealized Appreciation (Depreciation) on Investments and Written Options 32,453,433
(7,125,377)
12,409,582
1,139,858
Net Increase (Decrease) in Net Assets Resulting from Operations 21,887,541
(13,977,008)
11,703,102
(918,196)
Distributions (7,795,071)
(1,539,799)
(3,391,530)
(157,338)
Return of Capital —
(7,321,411)
—
(1,449,526)
Capital Share Transactions: Issued 107,648,619
59,320,432
94,730,145
16,222,704
Redeemed (7,017,545)
(65,843,588)
—
(1,056,273)
Increase (Decrease) in Net Assets from Capital Share Transactions 100,631,074
(6,523,156)
94,730,145
15,166,431
Total Increase (Decrease) in Net Assets 114,723,544
(29,361,374)
103,041,717
12,641,371
Net Assets: Beginning of Year/Period 103,991,720
133,353,094
21,474,754
8,833,383
End of Year/Period $ 218,715,264
$ 103,991,720
$ 124,516,471
$ 21,474,754
Share Transactions: Issued 2,280,000
1,250,000
3,970,000
750,000
Redeemed (150,000)
(1,500,000)
—
(50,000)
Net Increase (Decrease) in Shares Outstanding from Share Transactions 2,130,000
(250,000)
3,970,000
700,000
(1) Includes realized gains (losses) as a result of in-kind redemptions. (See Note 4 in Notes to Financial Statements.)
STATEMENTS OF CHANGES IN NET ASSETS
The accompanying notes are an integral part of the financial statements. 167
Global X Nasdaq 100® Covered
Call & Growth ETF Global X S&P 500® Covered Call &
Growth ETF
Period Ended April 30, 2021 (Unaudited)
Period Ended October 31,
2020(1)
Period Ended April 30, 2021 (Unaudited)
Period Ended October 31,
2020(1)
Operations: Net Investment Income (Loss) $ 5,611
$ (468)
$ 17,402
$ 2,911
Net Realized Gain (Loss) on Investments and Written Options(2) (678)
(83,188)
322,782
(52,329)
Net Change in Unrealized Appreciation (Depreciation) on Investments and Written Options 1,124,556
(30,947)
361,170
(17,901)
Net Increase (Decrease) in Net Assets Resulting from Operations 1,129,489
(114,603)
701,354
(67,319)
Distributions (203,026)
—
(79,893)
(2,931)
Return of Capital —
(20,955)
—
(16,682)
Capital Share Transactions: Issued 6,070,090
6,703,114
3,024,772
3,790,823
Redeemed (2,801,664)
—
(4,097,596)
—
Increase (Decrease) in Net Assets from Capital Share Transactions 3,268,426
6,703,114
(1,072,824)
3,790,823
Total Increase (Decrease) in Net Assets 4,194,889
6,567,556
(451,363)
3,703,891
Net Assets: Beginning of Year/Period 6,567,556
—
3,703,891
—
End of Year/Period $ 10,762,445
$ 6,567,556
$ 3,252,528
$ 3,703,891
Share Transactions: Issued 200,000
249,999
110,000
149,999
Redeemed (100,000)
—
(150,000)
—
Net Increase (Decrease) in Shares Outstanding from Share Transactions 100,000
249,999
(40,000)
149,999
(1) The Fund commenced operations on September 18, 2020 (2) Includes realized gains (losses) as a result of in-kind redemptions. (See Note 4 in Notes to Financial
Statements.)
STATEMENTS OF CHANGES IN NET ASSETS
The accompanying notes are an integral part of the financial statements. 168
Global X SuperIncome™ Preferred
ETF Global X Renewable Energy
Producers ETF~
Period Ended April 30, 2021 (Unaudited)
Year Ended October 31, 2020
Period Ended April 30, 2021 (Unaudited)
Year Ended October 31, 2020
Operations: Net Investment Income $ 5,045,445
$ 10,122,981
$ 876,089
$ 1,290,726
Net Realized Gain (Loss) on Investments and Foreign Currency Transactions(1) 5,094,535
(9,284,388)
7,321,809
1,497,337
Net Change in Unrealized Appreciation (Depreciation) on Investments and Foreign Currency Translations 8,430,496
(2,761,284)
(9,683,897)
(96,682)
Net Increase (Decrease) in Net Assets Resulting from Operations 18,570,476
(1,922,691)
(1,485,999)
2,691,381
Distributions (5,740,400)
(10,818,268)
(1,038,633)
(1,352,385)
Return of Capital —
(549,532)
—
—
Capital Share Transactions: Issued 18,519,762
24,650,476
112,171,343
43,544,055
Redeemed (4,390,618)
(28,436,633)
(51,601,863)
(4,895,974)
Increase (Decrease) in Net Assets from Capital Share Transactions 14,129,144
(3,786,157)
60,569,480
38,648,081
Total Increase (Decrease) in Net Assets 26,959,220
(17,076,648)
58,044,848
39,987,077
Net Assets: Beginning of Year/Period 184,015,344
201,091,992
66,192,010
26,204,933
End of Year/Period $ 210,974,564
$ 184,015,344
$ 124,236,858
$ 66,192,010
Share Transactions: Issued 1,570,000
2,200,000
6,390,000
2,900,000
Redeemed (370,000)
(2,800,000)
(2,960,000)
(350,000)
Net Increase (Decrease) in Shares Outstanding from Share Transactions 1,200,000
(600,000)
3,430,000
2,550,000
~ Formerly Global X YieldCo & Renewable Energy Income ETF (see Note 1). (1) Includes realized gains (losses) as a result of in-kind redemptions. (See Note 4 in Notes to Financial
Statements.)
STATEMENTS OF CHANGES IN NET ASSETS
The accompanying notes are an integral part of the financial statements. 169
Global X S&P 500® Catholic
Values ETF Global X S&P Catholic Values
Developed ex-U.S. ETF
Period Ended April 30, 2021 (Unaudited)
Year Ended October 31, 2020
Period Ended April 30, 2021 (Unaudited)
Period Ended October 31,
2020(1)
Operations: Net Investment Income $ 2,891,772
$ 4,980,263
$ 31,652
$ 18,647
Net Realized Gain (Loss) on Investments and Foreign Currency Transactions(2) 6,368,946
16,852,821
41,426
(2,816)
Net Change in Unrealized Appreciation (Depreciation) on Investments and Foreign Currency Translations 109,284,413
13,850,451
643,987
(23,250)
Net Increase (Decrease) in Net Assets Resulting from Operations 118,545,131
35,683,535
717,065
(7,419)
Distributions (3,237,872)
(4,642,650)
(25,622)
—
Capital Share Transactions: Issued 57,665,218
118,264,481
—
2,505,028
Redeemed (14,229,380)
(45,763,409)
—
—
Increase in Net Assets from Capital Share Transactions 43,435,838
72,501,072
—
2,505,028
Total Increase in Net Assets 158,743,097
103,541,957
691,443
2,497,609
Net Assets: Beginning of Year/Period 379,052,729
275,510,772
2,497,609
—
End of Year/Period $ 537,795,826
$ 379,052,729
$ 3,189,052
$ 2,497,609
Share Transactions: Issued 1,230,000
3,150,000
—
99,999
Redeemed (300,000)
(1,150,000)
—
—
Net Increase in Shares Outstanding from Share Transactions 930,000
2,000,000
—
99,999
(1) The Fund commenced operations on June 22, 2020 (2) Includes realized gains (losses) as a result of in-kind redemptions. (See Note 4 in Notes to Financial
Statements.)
STATEMENTS OF CHANGES IN NET ASSETS
The accompanying notes are an integral part of the financial statements. 170
Global X Guru® Index ETF
Period Ended April 30, 2021 (Unaudited)
Year Ended October 31, 2020
Operations: Net Investment Income $ 1,064,493
$ 532,416
Net Realized Gain on Investments (1) 8,995,652
5,774,378
Net Change in Unrealized Appreciation (Depreciation) on Investments 6,901,517
(1,127,648)
Net Increase in Net Assets Resulting from Operations 16,961,662
5,179,146
Distributions (1,352,859)
(538,248)
Return of Capital —
(28,732)
Capital Share Transactions: Issued 4,089,851
—
Redeemed (2,342,097)
(4,784,665)
Increase (Decrease) in Net Assets from Capital Share Transactions 1,747,754
(4,784,665)
Total Increase (Decrease) in Net Assets 17,356,557
(172,499)
Net Assets: Beginning of Year/Period 55,961,499
56,133,998
End of Year/Period $ 73,318,056
$ 55,961,499
Share Transactions: Issued 90,000
—
Redeemed (50,000)
(150,000)
Net Increase (Decrease) in Shares Outstanding from Share Transactions 40,000
(150,000)
(1) Includes realized gains (losses) as a result of in-kind redemptions. (See Note 4 in Notes to Financial Statements.)
FINANCIAL HIGHLIGHTS
The accompanying notes are an integral part of the financial statements. 171
Selected Per Share Data & Ratios For a Share Outstanding Throughout the Period
Net Asset Value, Beginning of Period
($)
Net Investment Income (Loss)
($)*
Net Realized and Unrealized Gain
(Loss) on Investments
($)
Total from Operations
($)
Distribution from Net Investment
Income ($)
Distribution from Capital
Gains ($)
Global X Social Media ETF
2021(Unaudited) 51.95
(0.17)
17 .38
17.21
—
—
2020 31.92
(0.11)
20 .14
20.03
—
—
2019 29.10
(0.10)
2 .92
2.82
—
—
2018 32.67
(0.06)
(3 .02)
(3.08)
(0 .49)
—
2017 23.53
0.10
9 .08
9.18
(0 .04)
—
2016 19.29
0.02
4 .22
4.24
—
Global X Lithium & Battery Tech ETF
2021(Unaudited) 42.86
0.05
20 .79
20.84
(0 .09)
—
2020 25.04
0.40
17 .86
18.26
(0 .44)
—
2019 30.32
0.48
(4 .86)
(4.38)
(0 .90)
—
2018 39.14
0.33
(7 .89)
(7.56)
(1 .26)
—
2017 24.02
0.33
15 .31
15.64
(0 .52)
—
2016 20.62
0.27
3 .18
3.45
(0 .05)
—
Global X E-commerce ETF
2021(Unaudited) 26.79
0.02
8 .10
8.12
(0 .13)
(0.13)
2020 17.58
0.19
9 .05
9.24
(0 .03)
—
2019(1) 15.00
(0.05)
2 .63
2.58
—
—
Global X Emerging Markets Internet & E-commerce ETF
2021(2)(Unaudited) 14.79
(0.04)
1 .03
0.99
—
—
FINANCIAL HIGHLIGHTS
The accompanying notes are an integral part of the financial statements. 172
Total from Distributions ($)
Net Asset Value,
End of Period ($)
Total Return (%)**
Net Assets End of Period ($)(000)
Ratio of Expenses to Average Net Assets (%)
Ratio of Net Investment Income (Loss) to Average
Net Assets (%) Portfolio Turnover (%)††
—
69.16
33 .13
487,576
0.65†
(0.51)†
23.46
—
51.95
62 .75
225,999
0.65
(0.28)
19.23
—
31.92
9 .69
121,289
0.65
(0.33)
16.92
(0.49)
29.10
(9 .61)
129,496
0.65
(0.16)
21.36
(0.04)
32.67
39 .09
164,998
0.65
0.35
41.40
***
23.53
21 .99
134,111
0.65
0.12
39.89
(0.09)
63.61
48 .63
3,177,651
0.75†
0.17†
4.01
(0.44) 42.86 73 .82 868,894 0.75 1.30 65.14
(0.90)
25.04
(14 .61)
455,124
0.75
1.75
35.28
(1.26)
30.32
(20 .01)
739,153
0.75
0.96
16.48
(0.52)
39.14
66 .46
950,071
0.75
1.02
68.13
(0.05)
24.02
16 .76
112,304
0.76
1.21
44.90
(0.26)
34.65
29 .94
240,485
0.50†
0.13†
5.69
(0.03)
26.79
52 .67
91,083
0.50
0.75
42.01
—
17.58
17 .20
3,517
0.68†
(0.32)†
23.50
—
15.78
6 .69
7,100
0.67†
(0.52)†
12.45
* Per share data calculated using average shares method. ** Total Return is for the period indicated and has not been annualized. The return shown does not
reflect the deduction of taxes that a shareholder would pay on Fund distributions or the redemption of Fund shares.
*** Amount rounds to less than $0.005. † Annualized. †† Portfolio turnover rate is for the period indicated and periods of less than one year have not been
annualized. Excludes effect of in-kind transfers. (1) The Fund commenced operations on November 27, 2018. (2) The Fund commenced operations on November 9, 2020. Amounts designated as “—” are $0 or have been rounded to $0.
FINANCIAL HIGHLIGHTS
The accompanying notes are an integral part of the financial statements. 173
Selected Per Share Data & Ratios For a Share Outstanding Throughout the Period
Net Asset Value, Beginning of Period
($)
Net Investment
Income ($)*
Net Realized and Unrealized Gain
(Loss) on Investments
($)
Total from Operations
($)
Distribution from Net
Investment Income ($)
Distribution from Capital
Gains ($) Return of Capital ($)
Global X SuperDividend® ETF
2021(Unaudited) 10.61
0.32
3 .67
3.99
(0.47)
—
—
2020 17.25
0.86
(6 .34)
(5.48)
(1.04)
—
(0.12)
2019 19.06
1.24
(1 .47)
(0.23)
(1.38)
—
(0.20)
2018 21.51
1.35
(2 .26)
(0.91)
(1.43)
—
(0.11)
2017 20.43
1.08
1 .45
2.53
(1.22)
—
(0.23)
2016 20.65
1.15
0 .08
1.23
(1.30)
—
(0.15)
Global X SuperDividend® U.S. ETF
2021(Unaudited) 14.99
0.35
4 .95
5.30
(0.58)
—
—
2020 23.34
0.62
(7 .45)
(6.83)
(1.14)
—
(0.38)
2019 24.53
1.12
(0 .56)
0.56
(1.49)
—
(0.26)
2018 25.18 1.07 (0 .17) 0.90 (1.35) — (0.20)
2017 24.00
0.79
1 .94
2.73
(0.96)
—
(0.59)
2016 25.23
0.92#
(0 .40)
0.52
(1.07)
—
(0.68)
Global X MSCI SuperDividend® EAFE ETF
2021(Unaudited) 11.44
0.34
4 .42
4.76
(0.33)
—
—
2020 16.11
0.56
(4 .53)
(3.97)
(0.55)
—
(0.15)
2019 15.96
0.82
0 .36
1.18
(1.03)
—
—
2018 18.13
1.12
(2 .04)
(0.92)
(1.10)
(0.15)
—
2017(1) 14.87
0.81
3 .04
3.85
(0.59)
—
—
FINANCIAL HIGHLIGHTS
The accompanying notes are an integral part of the financial statements. 174
Total from Distributions ($)
Net Asset Value,
End of Period ($)
Total Return (%)**
Net Assets End of Period ($)(000)
Ratio of Expenses to Average Net Assets (%)
Ratio of Net Investment Income
to Average Net Assets (%) Portfolio Turnover (%)††
(0.47)
14.13
38 .13
927,949
0.59†
4.92†
61.77
(1.16)
10.61
(32 .80)
626,871
0.59
6.62
124.55
(1.58)
17.25
(1 .02)
932,111
0.59
7.03
56.85
(1.54)
19.06
(4 .65)
912,968
0.59
6.48
59.48
(1.45)
21.51
12 .69
992,893
0.58
5.07
67.38
(1.45)
20.43
6 .23
801,816
0.58
5.67
39.06
(0.58)
19.71
35 .98
673,058
0.45†
3.97†
63.62
(1.52)
14.99
(30 .12)
412,110
0.45
3.50
93.44
(1.75)
23.34
2 .61
544,884
0.46
4.83
60.00
(1.55)
24.53
3 .66
413,311
0.46
4.31
33.25
(1.55)
25.18
11 .64
425,579
0.45
3.15
53.01
(1.75)
24.00
2 .13
338,397
0.45
3.77#
53.45
(0.33)
15.87
41 .92
11,746
0.55†
4.64†
30.61
(0.70)
11.44
(25 .24)
7,436
0.56
4.07
59.28
(1.03)
16.11
7 .81
18,527
0.56
5.23
29.81
(1.25)
15.96
(5 .59)
4,788
0.56
6.36
52.96
(0.59)
18.13
26 .19
1,813
0.56†
4.97†
45.40
* Per share data calculated using average shares method. ** Total Return is for the period indicated and has not been annualized. The return shown does not
reflect the deduction of taxes that a shareholder would pay on Fund distributions or the redemption of Fund shares.
# Effective November 1, 2015, the Fund changed its method for estimating the characterization of amounts distributed by master limited partnerships, which correspondingly impacted the financial highlight ratios and per share disclosures to the extent that the fund recorded investment income that differed from amounts previously estimated.
† Annualized. †† Portfolio turnover rate is for the period indicated and periods of less than one year have not been
annualized. Excludes effect of in-kind transfers. (1) The Fund commenced operations on November 14, 2016.
FINANCIAL HIGHLIGHTS
The accompanying notes are an integral part of the financial statements. 175
Selected Per Share Data & Ratios
For a Share Outstanding Throughout the Period
Net Asset Value, Beginning of Period
($)
Net Investment Income
($)*
Net Realized and Unrealized Gain
(Loss) on Investments
($)
Total from Operations
($)
Distribution from Net Investment
Income ($) Return of Capital ($)
Global X MSCI SuperDividend® Emerging Markets ETF
2021(Unaudited) 9 .53
0.21
2.57
2.78
(0.34)
—
2020 12 .95
0.55
(3.17)
(2.62)
(0.66)
(0 .14)
2019 12 .91
0.87
0.05
0.92
(0.88)
—
2018 15 .94
0.90
(3.02)
(2.12)
(0.91)
—
2017 14 .96
0.83
0.91
1.74
(0.76)
—
2016 13 .73
0.59
1.41
2.00
(0.77)
—
Global X SuperDividend® REIT ETF
2021(Unaudited) 7 .56
0.24
3.14
3.38
(0.92)
—
2020 15 .33
0.56
(7.41)
(6.85)
(0.86)
(0 .06)
2019 14 .62
0.99
0.91
1.90
(1.19)
—
2018 15 .29
0.92
(0.28)
0.64
(1.31)
—
2017 14 .60
0.86
0.96
1.82
(1.13)
—
2016 13 .18
0.91
1.72
2.63
(1.21)
—
FINANCIAL HIGHLIGHTS
The accompanying notes are an integral part of the financial statements. 176
Total from Distributions ($)
Net Asset Value,
End of Period ($)
Total Return (%)**
Net Assets End of Period ($)(000)
Ratio of Expenses to Average Net Assets (%)
Ratio of Net Investment Income
to Average Net Assets (%) Portfolio Turnover (%)††
(0.34)
11.97
29 .46
37,469
0.65†
3.61†
28.37
(0.80)
9.53
(21 .01)
20,007
0.67
5.04
93.04
(0.88)
12.95
7 .14
17,489
0.66
6.51
66.65
(0.91)
12.91
(14 .10)
12,260
0.67
5.89
79.52
(0.76)
15.94
11 .95
12,748
0.66
5.25
122.32
(0.77)
14.96
15 .58
3,740
0.65
4.49
64.83
(0.92)
10.02
37 .42
501,837
0.59†
5.32†
62.37
(0.92)
7.56
(45 .94)
311,625
0.58
5.74
106.23
(1.19)
15.33
13 .68
364,790
0.59
6.71
34.16
(1.31)
14.62
4 .30
118,408
0.59
6.15
41.61
(1.13)
15.29
13 .00
51,986
0.58
5.74
54.96
(1.21)
14.60
21 .01
34,302
0.56
6.23
16.87
* Per share data calculated using average shares method. ** Total Return is for the period indicated and has not been annualized. The return shown does not
reflect the deduction of taxes that a shareholder would pay on Fund distributions or the redemption of Fund shares.
† Annualized. †† Portfolio turnover rate is for the period indicated and periods of less than one year have not been
annualized. Excludes effect of in-kind transfers.
FINANCIAL HIGHLIGHTS
The accompanying notes are an integral part of the financial statements. 177
Selected Per Share Data & Ratios For a Share Outstanding Throughout the Period
Net Asset Value, Beginning of Period
($)
Net Investment Income
($)*
Net Realized and Unrealized Gain (Loss) on
Investments ($)
Total from Operations
($)
Distribution from Net
Investment Income ($)
Distribution from Capital
Gains ($)
Return of Capital
($)
Global X NASDAQ 100® Covered Call ETF(6)
2021(Unaudited) 20.65
0.02
3.24
3.26
(1.37)
—
—
2020 23.10
0.06
(0.06)
—
(0.06)
—
(2 .39)
2019 23.45
0.06
1.95
2.01
(1.83)
—
(0 .53)
2018 24.30
0.07
1.71
1.78
(0.87)
(0.11)
(1 .65)
2017 22.06
0.12
3.93
4.05
(1.81)
—
—
2016 23.51
0.15
0.53
0.68
(1.06)
—
(1 .07)
Global X S&P 500® Covered Call ETF(6)
2021(Unaudited) 42.45
0.23
7.54
7.77
(2.47)
—
—
2020 49.39
0.56
(4.17)
(3.61)
(0.58)
—
(2 .75)
2019 48.56
0.56
3.30
3.86
(2.27)
(0.39)
(0 .37)
2018 50.10
0.62
1.88
2.50
(0.22)
(1.22)
(2 .60)
2017(4) 47.62
0.34
2.67
3.01
(0.53)
—
—
2017(5) 43.11
0.66
5.39
6.05
(1.54)
—
—
2016(5) 45.39
0.70
(0.90)
(0.20)
(1.50)
—
(0 .58)
FINANCIAL HIGHLIGHTS
The accompanying notes are an integral part of the financial statements. 178
Total from Distributions ($)
Net Asset Value,
End of Period ($)
Total Return (%)**
Net Assets End of Period ($)(000)
Ratio of Expenses to Average Net Assets (%)
Ratio of Net Investment Income
to Average Net Assets (%) Portfolio Turnover (%)††
(1.37)
22.54
15 .93
2,605,526
0.60†
0.20†
15.19
(2.45)
20.65
0 .21
1,325,642
0.67(1)
0.27
27.87
(2.36)
23.10
9 .39
768,036
0.85(1)
0.26
11.82
(2.63)
23.45
7 .44
395,202
0.68(2)
0.30
15.00
(1.81)
24.30
19 .04
157,980
0.60
0.53
4.00
(2.13)
22.06
3 .32
52,952
0.60
0.69
9.00
(2.47)
47.75
18 .57
218,715
0.60†
0.98†
2.95
(3.33)
42.45
(7 .42)
103,992
0.71(3)
1.22
7.29
(3.03)
49.39
8 .40
133,353
0.87(3)
1.16
3.92
(4.04)
48.56
4 .97
77,701
0.65
1.22
4.00
(0.53)
50.10
6 .35
62,628
0.65†
1.39†
8.00
(1.54)
47.62
14 .29
64,413
0.65
1.46
21.00
(2.08)
43.11
(0 .29)
60,459
0.65
1.61
7.00
* Per share data calculated using average shares method. ** Total Return is for the period indicated and has not been annualized. The return shown does not reflect the deduction
of taxes that a shareholder would pay on Fund distributions or the redemption of Fund shares. † Annualized. †† Portfolio turnover rate is for the period indicated and periods of less than one year have not been annualized.
Excludes effect of in-kind transfers. (1) Excluding broker fees on written options, the ratio of expenses to average net assets would have been 0.60% and
0.60% for the year ended October 31, 2020 and October 31, 2019, respectively. The ratio of Expenses to Average Net Assets includes the effect of a waiver. If these offsets were excluded, the ratio would have been 0.60 and 0.60% for the year ended October 31, 2020 and year ended October 31, 2019.
(2) Includes excise tax. If this excise expense was not included, the ratio would have been 0.60%. (3) Excluding broker fees on written options, the ratio of expenses to average net assets would have been 0.64% and
0.65% for the year ended October 31, 2020 and year ended October 31, 2019, respectively. The ratio of Expenses to Average Net Assets includes the effect of a waiver. If these offsets were excluded, the ratio would have been 0.64% and 0.65% for the year ended October 31, 2020 and year ended October 31, 2019.
(4) Effective October 31, 2017, the Predecessor Fund changed its fiscal year end from April 30 to October 31. The information presented is from May 1, 2017 through October 31, 2017.
(5) For the year or period ended April 30. (6) The financial statements include the financial information of the Predecessor Funds through December 21, 2018 (See
Note 1 in Notes to Financial Statements). As a result of the Reorganization, the Fund assumed the performance and accounting history of the Predecessor Fund. Accordingly, performance figures for the Fund for periods prior to the date of the Reorganization represent the performance of the Predecessor Fund.
Amounts designated as “—” are $0 or have been rounded to $0.
FINANCIAL HIGHLIGHTS
The accompanying notes are an integral part of the financial statements. 179
Selected Per Share Data & Ratios For a Share Outstanding Throughout the Period
Net Asset Value, Beginning of Period
($)
Net Investment Income
($)*
Net Realized and Unrealized Gain
(Loss) on Investments
($)
Total from Operations
($)
Distribution from Net
Investment Income ($)
Distribution from
Capital Gains ($)
Return of Capital ($)
Global X Russell 2000 Covered Call ETF
2021(Unaudited) 20.45
0.08
5.68
5 .76
(1.41)
—
—
2020 25.24
0.12
(2.51)
(2 .39)
(0.11)
(0.17)
(2 .12)
2019(3) 25.00
0.09
1.37
1 .46
(1.22)
—
—
Global X Nasdaq 100® Covered Call & Growth ETF
2021(Unaudited) 26.27
0.02
5.36
5 .38
(0.90)
—
—
2020(4) 26.30
—
0.11
0 .11
—
(0 .14)
Global X S&P 500® Covered Call & Growth ETF
2021(Unaudited) 24.69
0.15
5.46
5 .61
(0.73)
—
—
2020(4) 25.22
0.02
(0.41)
(0 .39)
(0.02)
—
(0 .12)
FINANCIAL HIGHLIGHTS
The accompanying notes are an integral part of the financial statements. 180
Total from Distributions ($)
Net Asset Value,
End of Period ($)
Total Return (%)**
Net Assets End of Period ($)(000)
Ratio of Expenses to Average Net Assets (%)
Ratio of Net Investment Income (Loss) to Average
Net Assets (%) Portfolio Turnover (%)††
(1.41)
24.80
28 .78
124,516
0.50†(2)
0.64†
6.69
(2.40)
20.45
(9 .18)
21,475
0.56(1)(2)
0.68
11.16
(1.22)
25.24
5 .99
8,833
0.82†(1)(2)
0.68†
5.82
(0.90)
30.75
20 .63
10,762
0.60†
0.17†
8.03
(0.14)
26.27
0 .40
6,568
0.60†
(0.10)†
1.65
(0.73)
29.57
22 .94
3,253
0.61†
1.06†
2.59
(0.14)
24.69
(1 .60)
3,704
0.60†
0.75†
0.75
* Per share data calculated using average shares method. ** Total Return is for the period indicated and has not been annualized. The return shown does not reflect the
deduction of taxes that a shareholder would pay on Fund distributions or the redemption of Fund shares. † Annualized. †† Portfolio turnover rate is for the period indicated and periods of less than one year have not been
annualized. Excludes effect of in-kind transfers. (1) Excluding broker fees on written options, the ratio of expenses to average net assets would have been 0.60%
and 0.60% for the year ended October 31, 2020 and period ended October 31, 2019, respectively. (2) The ratio of Expenses to Average Net Assets includes the effect of a waiver. If these offsets were excluded,
the ratio would have been 0.60%, 0.68% and 0.97% for the period ended April 30, 2021, year ended October 31, 2020 and period ended October 31, 2019, respectively.
(3) The Fund commenced operations on April 17, 2019. (4) The Fund commenced operations on September 18, 2020.
Amounts designated as “—” are $0 or have been rounded to $0.
FINANCIAL HIGHLIGHTS
The accompanying notes are an integral part of the financial statements. 181
Selected Per Share Data & Ratios
For a Share Outstanding Throughout the Period
Net Asset Value, Beginning of Period
($)
Net Investment Income
($)*
Net Realized and Unrealized Gain
(Loss) on Investments
($)
Total from Operations
($)
Distribution from Net Investment
Income ($) Return of Capital ($)
Global X SuperIncome™ Preferred ETF
2021(Unaudited) 11 .12
0.30
0.81
1.11
(0.34)
—
2020 11 .73
0.60
(0.53)
0.07
(0.65)
(0 .03)
2019 11 .49
0.66
0.32
0.98
(0.73)
(0 .01)
2018 12 .44
0.78
(0.88)
(0.10)
(0.85)
—
2017 13 .16
0.82
(0.65)
0.17
(0.85)
(0 .04)
2016 13 .49
0.91
(0.33)
0.58
(0.91)
—
Global X Renewable Energy Producers ETF~
2021(Unaudited) 14 .87
0.15
0.95
1.10
(0.20)
—
2020 13 .79
0.41
1.13
1.54
(0.46)
—
2019 11 .52
0.13
2.61
2.74
(0.47)
—
2018 12 .53
0.37
(0.80)
(0.43)
(0.50)
(0 .08)
2017 11 .16
0.28
1.59
1.87
(0.50)
—
2016 11 .06
0.41#
0.35
0.76
(0.48)
(0 .18)
FINANCIAL HIGHLIGHTS
The accompanying notes are an integral part of the financial statements. 182
Total from Distributions ($)
Net Asset Value,
End of Period ($)
Total Return (%)**
Net Assets End of Period ($)(000)
Ratio of Expenses to Average Net Assets (%)
Ratio of Net Investment Income
to Average Net Assets (%) Portfolio Turnover (%)††
(0.34)
11.89
10 .07
210,975
0.58†
5.10†
43.38
(0.68)
11.12
0 .81
184,015
0.58
5.47
67.65
(0.74)
11.73
8 .87
201,092
0.58
5.72
55.98
(0.85)
11.49
(0 .87)
186,154
0.58
6.48
105.48
(0.89)
12.44
1 .31
236,331
0.58
6.39
45.12
(0.91)
13.16
4 .44
232,206
0.58
6.81
47.62
(0.20)
15.77
7 .50
124,237
0.65†
1.79†
60.10
(0.46) 14.87 11 .39 66,192 0.65 2.89 29.27
(0.47)
13.79
24 .34
26,205
0.65
1.01
87.06
(0.58)
11.52
(3 .50)
15,556
0.65
3.07
33.50
(0.50)
12.53
17 .30
20,046
0.65
2.37
25.99
(0.66)
11.16
7 .25
6,695
0.66
3.78#
40.25
~ Formerly Global X YieldCo & Renewable Energy Income ETF (see Note 1).
* Per share data calculated using average shares method. ** Total Return is for the period indicated and has not been annualized. The return shown does not reflect the
deduction of taxes that a shareholder would pay on Fund distributions or the redemption of Fund shares. # Effective November 1, 2015, the Fund changed its method for estimating the characterization of amounts
distributed by master limited partnerships, which correspondingly impacted the financial highlight ratios and per share disclosures to the extent that the fund recorded investment income that differed from amounts previously estimated.
† Annualized. †† Portfolio turnover rate is for the period indicated and periods of less than one year have not been
annualized. Excludes effect of in-kind transfers.
FINANCIAL HIGHLIGHTS
The accompanying notes are an integral part of the financial statements. 183
Selected Per Share Data & Ratios For a Share Outstanding Throughout the Period
Net Asset Value, Beginning of Period
($)
Net Investment Income
($)*
Net Realized and Unrealized Gain
(Loss) on Investments
($)
Total from Operations
($)
Distribution from Net Investment
Income ($)
Distribution from Capital
Gains ($)
Global X S&P 500® Catholic Values ETF
2021(Unaudited) 40.32
0.29
11.78
12.07
(0.33)
—
2020 37.23
0.58
3.08
3.66
(0.55)
(0.02)
2019 33.59
0.58
3.92
4.50
(0.81)
(0.05)
2018 31.83
0.58
1.60
2.18
(0.41)
(0.01)
2017 25.74
0.48
5.74
6.22
(0.13)
***
2016(1) 25.14
0.24
0.36
0.60
—
—
Global X S&P Catholic Values Developed ex-U.S. ETF
2021(Unaudited) 24.98
0.32
6.59
6.91
—
—
2020(2) 25.05
0.19
(0.26)
(0.07)
—
—
FINANCIAL HIGHLIGHTS
The accompanying notes are an integral part of the financial statements. 184
Total from Distributions ($)
Net Asset Value,
End of Period ($)
Total Return (%)**
Net Assets End of Period ($)(000)
Ratio of Expenses to Average Net Assets (%)
Ratio of Net Investment Income
to Average Net Assets (%) Portfolio Turnover (%)††
(0.33)
52.06
30 .04
537,796
0.29†
1.24†
2.48
(0.57)
40.32
9 .89
379,053
0.29
1.51
5.55
(0.86)
37.23
13 .86
275,511
0.29
1.66
8.54
(0.42)
33.59
6 .86
147,789
0.29@
1.72
4.33
(0.13)
31.83
24 .27
114,581
0.29@
1.64
6.09
—
25.74
2 .39
39,899
0.29@†
1.75†
2.80
—
31.89
28 .74
3,189
0.35†
2.10†
9.62
—
24.98
(0 .28)
2,498
0.35†
2.02†
4.04
@ The ratio of Expenses to Average Net Assets includes the effect of a waiver. If these offsets were excluded, the ratio would have been 0.39% for the Global X S&P 500® Catholic Values ETF.
* Per share data calculated using average shares method. ** Total Return is for the period indicated and has not been annualized. The return shown does not reflect the
deduction of taxes that a shareholder would pay on Fund distributions or the redemption of Fund shares. *** Amount rounds to less than $0.005. † Annualized. †† Portfolio turnover rate is for the period indicated and periods of less than one year have not been
annualized. Excludes effect of in-kind transfers. (1) The Fund commenced operations April 18, 2016. (2) The Fund commenced operations on June 22, 2020
Amounts designated as “—” are $0 or have been rounded to $0.
FINANCIAL HIGHLIGHTS
The accompanying notes are an integral part of the financial statements. 185
Net Asset Value, Beginning of Period
($)
Net Investment Income
($)*
Net Realized and Unrealized Gain
(Loss) on Investments
($)
Total from Operations
($)
Distribution from Net Investment
Income ($) Return of Capital ($)
Global X Guru® Index ETF
2021(Unaudited) 37 .31
0.70
10.50
11.20
(0.90)
—
2020 34 .02
0.33
3.32
3.65
(0.34)
(0 .02)
2019 30 .09
0.12
4.02
4.14
(0.17)
(0 .04)
2018 28 .70
0.11
1.44
1.55
(0.16)
—
2017 23 .14
0.14
5.47
5.61
(0.05)
—
2016 23 .96
0.12#
(0.83)
(0.71)
(0.09)
(0 .02)
FINANCIAL HIGHLIGHTS
The accompanying notes are an integral part of the financial statements. 186
Total from Distributions ($)
Net Asset Value,
End of Period ($)
Total Return (%)**
Net Assets End of Period ($)(000)
Ratio of Expenses to Average Net Assets (%)
Ratio of Net Investment Income
to Average Net Assets (%) Portfolio Turnover (%)††
(0.90)
47.61
30 .23
73,318
0.75†
3.13†
67.59
(0.36)
37.31
10 .84
55,961
0.75
0.96
124.90
(0.21)
34.02
13 .90
56,134
0.75
0.38
126.44
(0.16)
30.09
5 .40
57,180
0.75
0.36
112.64
(0.05)
28.70
24 .30
55,956
0.75
0.54
94.71
(0.11)
23.14
(2 .97)
59,013
0.75
0.52#
102.07
* Per share data calculated using average shares method. ** Total Return is for the period indicated and has not been annualized. The return shown does not reflect the
deduction of taxes that a shareholder would pay on Fund distributions or the redemption of Fund shares. # Effective November 1, 2015, the Fund changed its method for estimating the characterization of amounts
distributed by master limited partnerships, which correspondingly impacted the financial highlight ratios and per share disclosures to the extent that the fund recorded investment income that differed from amounts previously estimated.
† Annualized. †† Portfolio turnover rate is for the period indicated and periods of less than one year have not been
annualized. Excludes effect of in-kind transfers. Amounts designated as “—” are $0 or have been rounded to $0.
NOTES TO FINANCIAL STATEMENTS (UNAUDITED)
April 30, 2021
187
1. ORGANIZATION The Global X Funds (the "Trust") is a Delaware statutory trust formed on March 6, 2008. The Trust is registered under the Investment Company Act of 1940, as amended, as an open-end management investment company. As of April 30, 2021, the Trust had eighty-eight portfolios, eighty-one of which were operational. The financial statements herein and the related notes pertain to the Global X Social Media ETF, Global X Lithium & Battery Tech ETF, Global X E-commerce ETF, Global X Emerging Markets Internet & E-commerce ETF, Global X SuperDividend® ETF, Global X SuperDividend® U.S. ETF, Global X MSCI SuperDividend® EAFE ETF, Global X MSCI SuperDividend® Emerging Markets ETF, Global X SuperDividend® REIT ETF, Global X NASDAQ 100® Covered Call ETF, Global X S&P 500® Covered Call ETF, Global X Russell 2000 Covered Call ETF, Global X Nasdaq 100 Covered Call & Growth ETF, Global X S&P 500® Covered Call & Growth ETF, Global X SuperIncome™ Preferred ETF, Global X Renewable Energy Producers ETF, Global X S&P 500® Catholic Values ETF, Global X S&P Catholic Values Developed ex-U.S. ETF, and Global X Guru® Index ETF (each a “Fund”, collectively, the “Funds”).
Effective on February 1, 2021, the Global X YieldCo & Renewable Energy Income ETF changed its name to Global X Renewable Energy Producers ETF.
Each Fund (except the Global X SuperDividend® ETF, Global X SuperDividend® U.S. ETF, Global X MSCI SuperDividend® Emerging Markets ETF, Global X MSCI SuperDividend® EAFE ETF, Global X SuperDividend® REIT ETF, Global X SuperIncomeTM Preferred ETF, Global X Guru® Index ETF, Global X S&P 500® Catholic Values ETF, Global X Russell 2000 Covered Call ETF, Global X S&P 500® Covered Call ETF, and Global X S&P 500® Covered Call & Growth ETF) has elected non-diversified status. On December 24, 2018, the shareholders of the Horizons NASDAQ 100® Covered Call ETF and Horizons S&P 500® Covered Call ETF (together, the "Predecessor Funds") approved a proposed agreement and plan of reorganization (the "Reorganization") that provided for (a) the transfer of all the assets and assumption of certain of the liabilities of each Predecessor Fund to the Global X NASDAQ 100®
Covered Call ETF and the Global X S&P 500® Covered Call ETF (together, the “Successor Funds”), respectively; (b) the issuance of shares of the Successor Fund to the shareholders of the corresponding Predecessor Fund; and (c) the liquidation and termination of the Predecessor Fund. The effective date of the Reorganization of each Predecessor Fund was December 24, 2018. The Successor Funds had no operations prior to the Reorganization. The Predecessor Funds had substantially similar investment objectives, investment strategies, policies and restrictions as those of the Successor Funds. The financial statements and financial highlights include the financial information of the Predecessor Funds through December 21, 2018.
NOTES TO FINANCIAL STATEMENTS (UNAUDITED) (CONTINUED)
April 30, 2021
188
2. SIGNIFICANT ACCOUNTING POLICIES
The following is a summary of the significant accounting policies followed by the Funds:
USE OF ESTIMATES – The Funds are investment companies that apply the accounting and reporting guidance issued in Topic 946 by the U.S. Financial Accounting Standards Board. The preparation of financial statements in conformity with U.S. generally accepted accounting principles ("U.S. GAAP") requires management to make estimates and assumptions that affect the reported amounts of assets and liabilities and disclosure of contingent assets and liabilities at the date of the financial statements and the reported amounts of increases and decreases in net assets from operations during the reporting period. Actual results could materially differ from those estimates.
RETURN OF CAPITAL ESTIMATES – Distributions received by the Funds from underlying master limited partnership (“MLP”) and real estate investment trust (“REIT”) investments generally are comprised of income and return of capital. The Funds record investment income and return of capital based on estimates made at the time such distributions are received. Such estimates are based on historical information available from the MLPs, REITs and other industry sources. These estimates may subsequently be revised based on information received from the MLPs and REITs after their tax reporting periods are concluded.
MLPs – Certain Funds may invest in MLPs. MLPs are publicly traded partnerships engaged in the transportation, storage and processing of minerals and natural resources. By confining their operations to these specific activities, their interests, or units, are able to trade on public securities exchanges exactly like the shares of a corporation, without entity level taxation. To qualify as an MLP and to not be taxed as a corporation, a partnership must receive at least 90% of its income from qualifying sources as set forth in Section 7704(d) of the Internal Revenue Code of 1986, as amended (the “Code”). These qualifying sources include natural resource-based activities such as the processing, transportation and storage of mineral or natural resources. MLPs generally have two classes of owners: the general partner and limited partners. The general partner of an MLP is typically owned by a major energy company, an investment fund, the direct management of the MLP, or is an entity owned by one or more of such parties. The general partner may be structured as a private or publicly traded corporation or other entity.
NOTES TO FINANCIAL STATEMENTS (UNAUDITED) (CONTINUED)
April 30, 2021
189
2. SIGNIFICANT ACCOUNTING POLICIES (continued)
The general partner typically controls the operations and management of the MLP through an up to 2% equity interest in the MLP plus, in many cases, ownership of common units and subordinated units.
Limited partners typically own the remainder of the partnership through ownership of common units, and have a limited role in the partnership’s operations and management. MLPs are typically structured such that common units and general partner interests have first priority to receive quarterly cash distributions up to an established minimum amount (“minimum quarterly distributions” or “MQD”). Common and general partner interests also accrue arrearages in distributions to the extent the MQD is not paid. Once common and general partner interests have been paid, subordinated units receive distributions of up to the MQD; however, subordinated units do not accrue arrearages. Distributable cash in excess of the MQD is paid to both common and subordinated units and is distributed to both common and subordinated units generally on a pro rata basis. The general partner is also eligible to receive incentive distributions if the general partner operates the business in a manner which results in distributions paid per common unit surpassing specified target levels. As the general partner increases cash distributions to the limited partners, the general partner receives an increasingly higher percentage of the incremental cash distributions.
SECURITY VALUATION - Securities listed on a securities exchange, market or automated quotation system for which quotations are readily available (except for securities traded on NASDAQ), including securities traded over the counter, are valued at the last quoted sale price on the primary exchange or market (foreign or domestic) on which they are traded (or at approximately 4:00 pm EST if a security’s primary exchange is normally open at that time), or, if there is no such reported sale, at the most recent mean between the quoted bid and asked prices, which approximates fair value (absent both bid and asked prices on such exchange, the bid price may be used).
For securities traded on NASDAQ, the NASDAQ official closing price will be used. If available, debt securities are priced based upon valuations provided by independent, third-party pricing agents. Such values generally reflect the last reported sales price if the security is actively traded. The third-party pricing agents may also value debt securities at an evaluated bid price by employing methodologies that utilize actual market transactions, broker-supplied valuations, or other methodologies designed to identify the market value for such securities. Debt obligations with remaining maturities of sixty days or less may be valued at their amortized cost, which approximates market value. The prices for foreign securities are reported in local currency and converted to U.S. dollars using currency exchange rates as of the reporting date. The exchange rates used by the Trust for valuation are captured as of the New York or London close each day. Prices for most securities held in the Funds are provided daily by recognized independent pricing agents. If a security price cannot be obtained from an independent, third-party pricing agent, the Funds seek to obtain a bid price from at least one independent broker.
NOTES TO FINANCIAL STATEMENTS (UNAUDITED) (CONTINUED)
April 30, 2021
190
2. SIGNIFICANT ACCOUNTING POLICIES (continued)
Securities for which market prices are not "readily available" are valued in accordance with fair value procedures (the “Fair Value Procedures”) established by the Board of Trustees (the “Board”) of the Trust. The Funds’ Fair Value Procedures are implemented through a fair value committee (the “Committee”) designated by the Board. Some of the more common reasons that may necessitate that a security be valued using the Fair Value Procedures include: the security's trading has been halted or suspended; the security has been de-listed from its primary trading exchange; the security's primary trading market is temporarily closed at a time when, under normal conditions, it would be open; the security has not been traded for an extended period of time; the security's primary pricing source is not able or willing to provide a price; the security's primary pricing source is not able or willing to provide a price; or trading of the security is subject to local government-imposed restrictions. In addition, the Funds may fair value a security if an event that may materially affect the value of the Funds’ security that is traded outside the United States (a “Significant Event”) has occurred between the time of the security's last close and the time that the Funds calculate their net asset values. A Significant Event may relate to a single issuer or to an entire market sector. Events that may be Significant Events include: government actions, natural disasters, armed conflict, acts of terrorism and significant market fluctuations. If Global X Management Company LLC, the Funds’ investment advisor (the “Adviser”), becomes aware of a Significant Event that has occurred with respect to a security or group of securities after the closing of the exchange or market on which the security or securities principally trade, but before the time at which the Funds calculate their net asset values, it may request that a Committee meeting be called. When a security is valued in accordance with the Fair Value Procedures, the Committee will determine the value after taking into consideration all relevant information reasonably available to the Committee. As of April 30, 2021, Global X Super Dividend® ETF and Global X Lithium & Battery Tech ETF had fair valued securities valued at $9,102,433 and $98. There were no other securities priced using the Fair Value Procedures.
In accordance with the authoritative guidance on fair value measurements and disclosure under U.S. GAAP, the Funds disclose the fair value of their investments in a hierarchy that prioritizes the inputs to valuation techniques used to measure the fair value. The objective of a fair value measurement is to determine the price that would be received to sell an asset or paid to transfer a liability in an orderly transaction between market participants at the measurement date (an exit price). Accordingly, the fair value hierarchy gives the highest priority to quoted prices (unadjusted) in active markets for identical assets or liabilities (Level 1) and the lowest priority to unobservable inputs (Level 3). The three levels of the fair value hierarchy are described below:
Level 1 – Unadjusted quoted prices in active markets for identical, unrestricted assets or liabilities that the Funds have the ability to access at the measurement date
NOTES TO FINANCIAL STATEMENTS (UNAUDITED) (CONTINUED)
April 30, 2021
191
2. SIGNIFICANT ACCOUNTING POLICIES (continued)
Level 2 – Other significant observable inputs (including quoted prices in non-active markets, quoted prices for similar investments, fair value of investments for which the Funds have the ability to fully redeem tranches at net asset value as of the measurement date or within the near term, and short-term investments valued at amortized cost)
Level 3 – Significant unobservable inputs (including the Funds’ own assumptions in determining the fair value of investments, and fair value of investments for which the Funds do not have the ability to fully redeem tranches at net asset value as of the measurement date or within the near term)
Investments are classified within the level of the lowest significant input considered in determining fair value. Investments classified within Level 3 whose fair value measurement considers several inputs may include Level 1 or Level 2 inputs as components of the overall fair value measurement.
For the period ended April 30, 2021, there have been no significant changes to the Funds’ fair valuation methodologies.
The unobservable inputs used to determine fair value of Level 3 assets may have similar or diverging impacts on valuation. Significant increases and decreases in these inputs in isolation and interrelationships between those inputs could result in significantly higher or lower fair value measurement.
DUE TO/FROM BROKERS – Due to/from brokers includes cash and collateral balances with the Funds’ clearing brokers or counterparties at April 30, 2021. The Funds continuously monitor the credit standing of each broker or counterparty with whom they conduct business. In the event a broker or counterparty is unable to fulfill its obligations, the Funds would be subject to counterparty credit risk.
REPURCHASE AGREEMENTS - Securities pledged as collateral for repurchase agreements by BNP Paribas are held by Brown Brothers Harriman & Co. (“BBH”), the Funds’ Custodian (“Custodian”), and are designated as being held on each Fund’s behalf by its Custodian under a book-entry system. Each Fund monitors the adequacy of the collateral on a daily basis and can require the seller to provide additional collateral in the event the market value of the securities pledged falls below the carrying value of the repurchase agreement, including accrued interest.
It is the Funds’ policy to only enter into repurchase agreements with banks and other financial institutions which are deemed by the Adviser to be creditworthy. The Funds bear the risk of loss in the event that the counterparty to a repurchase agreement defaults on its obligations, and the Funds are prevented from exercising their rights to dispose of the underlying securities received as collateral and the risk of a possible decline in the value of the underlying securities during the period. For financial statement purposes, the
NOTES TO FINANCIAL STATEMENTS (UNAUDITED) (CONTINUED)
April 30, 2021
192
2. SIGNIFICANT ACCOUNTING POLICIES (continued)
Funds record the securities lending collateral (included in repurchase agreements, at value or restricted cash) as an asset and the obligation to return securities lending collateral as a liability on the Statements of Assets and Liabilities.
Repurchase agreements are entered into by the Funds under Master Repurchase Agreements (“MRA”) which permit the Funds, under certain circumstances, including an event of default (such as bankruptcy or insolvency), to offset payables and/or receivables under an MRA with collateral held and/or posted to the counterparty and create one single net payment due to or from the Funds.
As of April 30, 2021, the open repurchase agreements by counterparty which are subject to an MRA on a net payment basis are as follows:
FEDERAL INCOME TAXES – It is each Fund’s intention to qualify, or continue to qualify, as a regulated investment company for Federal income tax purposes by complying with the appropriate provisions of Subchapter M of the Internal Revenue Code of 1986, as amended. Accordingly, no provisions for Federal income taxes have been made in the financial statements except as described below.
The Funds evaluate tax positions taken or expected to be taken in the course of preparing the Funds’ tax returns to determine whether it is "more-likely-than-not" (i.e., greater than
Repurchase Agreements
Fair Value of Non-cash Collateral
Received(1)
Cash Collateral Received
Net
Amount(2)
Global X Social Media ETF
BNP Paribas 1,489,945$ 1,489,945$ -$ -$
Global X Lithium & Battery Tech ETF
BNP Paribas 56,205,362 56,205,362 - -
Global X E-commerce ETF
BNP Paribas 2,290,989 2,290,989 - -
Global X SuperDividend®
ETF
BNP Paribas 8,170,388 8,170,388 - -
Global X SuperDividend®
U.S . ETF
BNP Paribas 5,160,716 5,160,716 - -
Global X SuperDividend®
REIT ETF
BNP Paribas 9,583,417 9,583,417 - -
Global X SuperIncome™ Preferred ETF
BNP Paribas 312,842 312,842 - -
Global X Renewable Energy Producers ETF
BNP Paribas 1,381,641 1,381,641 - -
Global X Guru®
Index ETF
BNP Paribas 1,209,062 1,209,062 - -
(2)Net Amount represents the net amount receivable due from the counterparty in the event of default.
(1)Excess collateral received is not presented in the table above. Please refer to the Schedules of Investments for the market value of the collateral received for each Fund.
NOTES TO FINANCIAL STATEMENTS (UNAUDITED) (CONTINUED)
April 30, 2021
193
2. SIGNIFICANT ACCOUNTING POLICIES (continued)
50 percent) that each tax position will be sustained upon examination by a taxing authority based on the technical merits of the position. Tax positions not deemed to meet the more-likely-than-not threshold are recorded as a tax benefit or expense in the current year. The Funds did not record any tax positions in the current period; however, management’s conclusions regarding tax positions may be subject to review and adjustment at a later date based on factors including, but not limited to, examination by tax authorities (i.e., the last three tax year ends, as applicable), and on-going analysis of and changes to tax laws and regulations, and interpretations thereof.
If a Fund has foreign tax filings that have not been made, the tax years that remain subject to examination may date back to the inception of the Fund.
As of and during the reporting period ended April 30, 2021, the Funds did not have a liability for any unrecognized tax benefits. The Funds recognize interest and penalties, if any, related to unrecognized tax benefits as income tax expense on the Statements of Operations. During the reporting period, the Funds did not incur any interest or penalties.
SECURITY TRANSACTIONS AND INVESTMENT INCOME – Security transactions are accounted for on the trade date for financial reporting purposes. Costs used in determining realized gains and losses on the sale of investment securities are based on specific identification. Dividend income is recorded on the ex-dividend date. Interest income is recognized on the accrual basis from the settlement date.
FOREIGN CURRENCY TRANSACTIONS AND TRANSLATION – The books and records of the Funds are maintained in U.S. dollars. Investment securities and other assets and liabilities denominated in a foreign currency are translated into U.S. dollars on the date of valuation. Purchases and sales of investment securities, income and expenses are translated into U.S. dollars at the relevant rates of exchange prevailing on the respective dates of such transactions. The Funds do not isolate that portion of realized or unrealized gains and losses resulting from changes in the foreign exchange rate from fluctuations arising from changes in the market prices of the securities. These gains and losses are included in net realized and unrealized gains and losses on investments on the Statement of Operations. Net realized and unrealized gains and losses on foreign currency transactions and translations represent net foreign exchange gains or losses from foreign currency spot contracts, disposition of foreign currencies, currency gains or losses realized between trade and settlement dates on securities transactions and the difference between the amount of the investment income and foreign withholding taxes recorded on the Funds’ books and the U.S. dollar equivalent amounts actually received or paid.
DIVIDENDS AND DISTRIBUTIONS TO SHAREHOLDERS – The Funds distribute their net investment income on a pro rata basis. Any net investment income and net realized capital gains are distributed at least annually. All distributions are recorded on ex-dividend date.
NOTES TO FINANCIAL STATEMENTS (UNAUDITED) (CONTINUED)
April 30, 2021
194
2. SIGNIFICANT ACCOUNTING POLICIES (continued)
INVESTMENTS IN REITs – With respect to the Funds, dividend income is recorded based on the income included in distributions received from REIT investments using published REIT reclassifications, including some management estimates when actual amounts are not available. Distributions received in excess of these estimated amounts are recorded as a reduction of the cost of investments or reclassified to capital gains. The actual amounts of income, return of capital, and capital gains are only determined by each REIT after its fiscal year end, and may differ from the estimated amounts.
CREATION UNITS – The Funds issue and redeem their shares (“Shares”) on a continuous basis at net asset value (“NAV”) and only in large blocks of 10,000 Shares, referred to as “Creation Units”. Purchasers of Creation Units (“Authorized Participants”) at NAV must pay a standard creation transaction fee per transaction. The fee is a single charge and will be the same regardless of the number of Creation Units purchased by an Authorized Participant on the same day.
An Authorized Participant who holds Creation Units and wishes to redeem at NAV would also pay a standard redemption fee per transaction to BBH, on the date of such redemption, regardless of the number of Creation Units redeemed that day.
If a Creation Unit is purchased or redeemed for cash, an additional variable fee may be charged. The following table discloses Creation Unit breakdown:
Creation Unit Shares
Creation Fee
Value at April 30, 2021
Redemption Fee
Global X Social Media ETF 10,000 300$ 691,600$ 300$
Global X Lithium & Battery Tech ETF 10,000 1,000 636,100 1,000
Global X E-commerce ETF 10,000 500 346,500 500
Global X Emerging Markets Internet & E-commerce ETF 10,000 800 157,800 800
Global X SuperDividend®
ETF 10,000 2,000 141,300 2,000
Global X SuperDividend®
U.S. ETF 10,000 150 197,100 150
Global X MSCI SuperDividend®
EAFE ETF 10,000 1,000 158,700 1,000
Global X MSCI SuperDividend®
Emerging Markets ETF 10,000 3,000 119,700 3,000
Global X SuperDividend®
REIT ETF 10,000 250 100,200 250
Global X NASDAQ 100®
Covered Call ETF 10,000 500 225,400 500
Global X S&P 500®
Covered Call ETF 10,000 2,000 477,500 2,000
Global X Russell 2000®
Covered Call ETF 10,000 250 248,000 250
Global X Nasdaq 100 Covered Call & Growth ETF 10,000 500 307,500 500
Global X S&P 500 Covered Call & Growth ETF 10,000 2,000 295,700 2,000
Global X SuperIncome™ Preferred ETF 10,000 300 118,900 300
Global X Renewable Energy Producers ETF 10,000 500 157,700 500
Global X S&P 500®
Catholic Values ETF 10,000 1,300 520,600 1,300
Global X S&P Catholic Values Developed ex-U.S. ETF 10,000 8,900 318,900 8,900
Global X Guru®
Index ETF 10,000 250 476,100 250
NOTES TO FINANCIAL STATEMENTS (UNAUDITED) (CONTINUED)
April 30, 2021
195
2. SIGNIFICANT ACCOUNTING POLICIES (continued)
CASH OVERDRAFT CHARGES – Per the terms of an agreement with BBH, if a Fund has a cash overdraft on a given day, it will be assessed an overdraft charge of LIBOR plus 2.00%. Cash overdraft charges are included in custodian fees on the Statements of Operations.
3. RELATED PARTY TRANSACTIONS AND SERVICE PROVIDER TRANSACTIONS
On July 2, 2018, the Adviser consummated a transaction pursuant to which it became an indirect, wholly-owned subsidiary of Mirae Asset Global Investments Co., Ltd. (“Mirae”). In this manner, the Adviser is ultimately controlled by Mirae, which is a leading financial services company in Korea and is the headquarters for the Mirae Asset Global Investments Group.
The Adviser serves as the investment adviser and the administrator for the Funds. Subject to the supervision of the Board, the Adviser is responsible for managing the investment activities of the Funds and the Funds’ business affairs and other administrative matters and provides, or causes to be furnished, all supervisory, administrative and other services reasonably necessary for the operation of the Funds, including certain distribution services (provided pursuant to a separate Distribution Agreement), certain shareholder and distribution-related services (provided pursuant to a separate Rule 12b-1 Plan and related agreements) and investment advisory services (provided pursuant to a separate Investment Advisory Agreement), under what is essentially an "all-in" fee structure. For the Adviser’s service to the Funds, under the Supervision and Administration Agreement, each Fund pays a monthly fee to the Adviser at the annual rate below (stated as a percentage of the average daily net assets of the Fund). In addition, the Funds bear other expenses, directly and indirectly, that are not covered by the Supervision and Administration Agreement, which may vary and affect the total expense ratios of the Funds, such as taxes, brokerage fees, commissions, custodian fees, acquired fund fees, and other transaction expenses, interest expenses and extraordinary expenses (such as litigation and indemnification expenses).
The following table discloses supervision and administration fees payable pursuant to the Supervision and Administration Agreement:
Supervision andAdministration Fee
Global X Social Media ETF 0.65%
Global X Lithium & Battery Tech ETF 0.75%
Global X E-commerce ETF 0.50%
Global X Emerging Markets Internet & E-commerce ETF 0.65%
Global X SuperDividend®
ETF 0.58%
Global X SuperDividend®
U.S. ETF 0.45%
NOTES TO FINANCIAL STATEMENTS (UNAUDITED) (CONTINUED)
April 30, 2021
196
3. RELATED PARTY TRANSACTIONS AND SERVICE PROVIDER TRANSACTIONS (continued)
*Pursuant to an expense limitation agreement in existence between the Global X NASDAQ 100® Covered Call ETF (the "Fund") and the Adviser prior to March 1, 2021, the Adviser agreed to waive or reimburse fees and/or limit Fund expenses to the extent necessary to assure that the operating expenses of the Fund, exclusive of taxes, commissions, and other transaction expenses, interest, and extraordinary expenses (such as litigation and indemnification expenses) would not exceed 0.60% of the Fund’s average daily net assets per year, until at least March 1, 2021.
**Pursuant to an expense limitation agreement in existence between the Global X S&P 500® Covered Call ETF (the “Fund”) and the Adviser, the Adviser agreed to reimburse or waive fees and/or limit Fund expenses to the extent necessary to assure that the operating expenses of the Fund (exclusive of taxes, commissions, and other transaction expenses, interest, and extraordinary expenses (such as litigation and indemnification expenses) will not exceed 0.60% of the Fund’s average daily net assets per year, effective August 21, 2020, until at least March 1, 2022. Effective August 21, 2020, the Supervision and Administration Fee of the Fund was reduced to 0.60%. ***Pursuant to an Expense Limitation Agreement, the Adviser has contractually agreed to reimburse or waive fees and/or limit expenses for the Global X Russell 2000 Covered Call ETF to the extent necessary to assure that the operating expenses of the Global X Russell 2000 Covered Call ETF (exclusive of taxes, brokerage fees, commissions, and other transaction expenses, interest, and extraordinary expenses (such as litigation and indemnification expenses)) will not exceed 0.60% of the average daily net assets of the Global X Russell 2000 Covered Call ETF per year, effective March 1, 2021 until at least March 1, 2022.
****Pursuant to an expense limitation agreement in existence between the Global X S&P 500® Catholic Values ETF (the “Fund”) and the Adviser prior to March 1, 2018, the Adviser agreed to waive or reimburse fees and/or limit fund expenses to the extent necessary to assure that the operating expenses of the Fund (exclusive of taxes, brokerage fees, commissions, and other transaction expenses and extraordinary expenses (such as litigation and indemnification expenses)
Supervision andAdministration Fee
Global X MSCI SuperDividend®
EAFE ETF 0.55%
Global X MSCI SuperDividend®
Emerging Markets ETF 0.65%
Global X SuperDividend®
REIT ETF 0.58%
Global X NASDAQ 100®
Covered Call ETF* 0.60%
Global X S&P 500®
Covered Call ETF** 0.60%
Global X Russell 2000®
Covered Call ETF*** 0.60%
Global X Nasdaq 100 Covered Call & Growth ETF 0.60%
Global X S&P 500 Covered Call & Growth ETF 0.60%
Global X SuperIncomeTM
Preferred ETF 0.58%
Global X Renewable Energy Producers ETF 0.65%
Global X S&P 500®
Catholic Values ETF**** 0.29%Global X S&P Catholic Values Developed ex-U.S. ETF 0.35%
Global X Guru®
Index ETF 0.75%
NOTES TO FINANCIAL STATEMENTS (UNAUDITED) (CONTINUED)
April 30, 2021
197
3. RELATED PARTY TRANSACTIONS AND SERVICE PROVIDER TRANSACTIONS (continued)
(“Total Annual Fund Operating Expenses”) would not exceed 0.29% of the Fund’s average daily net assets per year until at least March 1, 2018. Pursuant to the expense limitation agreement, the Fund (at a later date) could reimburse the Adviser for the fees and expenses it waived or reimbursed and/or limited during any of the prior three fiscal years, provided that, among other things, any reimbursement made to the Adviser would not cause Total Annual Fund Operating Expenses to exceed the maximum permitted rate during the period in which it is paid and the Board had approved such reimbursement to the Adviser. Although the Board voted on December 19, 2017, to permanently reduce the Fund’s fees to 0.29% and end the expense limitation agreement as of March 1, 2018, prior waived or reimbursed fees were still subject to recoupment. As of April 30, 2021 the recoupment period had expired and there had been no recoupment of previously waived and reimbursed fees for the semi-annual period ended on April 30, 2021.
SEI Investments Global Funds Services (“SEIGFS”) serves as sub-administrator to the Funds. As sub-administrator, SEIGFS provides the Funds with required general administrative services, including, without limitation: office space, equipment, and personnel; clerical and general back office services; bookkeeping, internal accounting and secretarial services; the calculation of NAV; and assistance with the preparation and filing of reports, registration statements, proxy statements, and other materials required to be filed or furnished by the Funds under federal and state securities laws. As compensation for these services, SEIGFS receives certain out-of-pocket costs, transaction fees, and asset-based fees which are accrued daily and paid monthly by the Adviser.
SEI Investments Distribution Co. (“SIDCO”) serves as each Fund’s underwriter and distributor of Creation Units pursuant to a distribution agreement. SIDCO has no obligation to sell any specific quantity of Fund Shares.
SIDCO bears the following costs and expenses relating to the distribution of Shares: (1) the costs of processing and maintaining records of creations of Creation Units; (2) all costs of maintaining the records required of a registered broker/dealer; (3) the expenses of maintaining its registration or qualification as a dealer or broker under Federal or state laws; (4) filing fees; and (5) all other expenses incurred in connection with the distribution services as contemplated in the distribution agreement. SIDCO receives no fee from the Funds for its distribution services under the distribution agreement, rather, the Adviser compensates SIDCO for certain expenses, out-of-pocket costs, and transaction fees.
NOTES TO FINANCIAL STATEMENTS (UNAUDITED) (CONTINUED)
April 30, 2021
198
3. RELATED PARTY TRANSACTIONS AND SERVICE PROVIDER TRANSACTIONS (continued)
BBH serves as Custodian and transfer agent of the Funds’ assets. As Custodian, BBH has agreed to (1) make receipts and disbursements of money on behalf of the Funds, (2) collect and receive all income and other payments and distributions on account of the Funds’ portfolio investments, (3) respond to correspondence from shareholders, security brokers and others relating to its duties; and (4) make periodic reports to the Funds concerning the Funds’ operations. BBH does not exercise any supervisory function over the purchase and sale of securities. As transfer agent, BBH has agreed to (1) issue and redeem Shares of each Fund, (2) make dividend and other distributions to shareholders of each Fund, (3) respond to correspondence by shareholders and others relating to its duties; (4) maintain shareholder accounts, and (5) make periodic reports to the Funds. As compensation for these services, BBH receives certain out-of-pocket costs, transaction fees and asset-based fees which are accrued daily and paid monthly by the Adviser from its fees.
4. INVESTMENT TRANSACTIONS
For the period ended April 30, 2021, the purchases and sales of investments in securities, excluding in-kind transactions, long-term U.S. Government and short-term securities, were:
PurchasesSales and Maturities
Global X Social Media ETF $ 139,819,996 $ 81,953,644 Global X Lithium & Battery Tech ETF 1,122,157,016 89,926,281 Global X E-commerce ETF 10,943,759 9,638,917 Global X Emerging Markets Internet & E-commerce ETF 2,467,971 749,380
Global X SuperDividend®
ETF 505,412,234 485,605,577
Global X SuperDividend®
U.S. ETF 345,213,525 351,544,411
Global X MSCI SuperDividend®
EAFE ETF 2,974,634 2,992,874
Global X MSCI SuperDividend®
Emerging Markets ETF 15,955,401 8,030,244
Global X SuperDividend®
REIT ETF 249,079,564 248,697,154
Global X NASDAQ 100®
Covered Call ETF 287,515,175 579,083,039
Global X S&P 500®
Covered Call ETF 4,381,671 26,437,986
Global X Russell 2000®
Covered Call ETF 3,794,475 7,800,567 Global X Nasdaq 100 Covered Call & Growth ETF 594,136 1,105,787 Global X S&P 500 Covered Call & Growth ETF 87,705 302,128 Global X SuperIncome™ Preferred ETF 86,344,459 85,995,934 Global X Renewable Energy Producers ETF 74,956,604 58,388,481
Global X S&P 500®
Catholic Values ETF 11,480,354 12,323,714 Global X S&P Catholic Values Developed ex-U.S. ETF 284,863 284,031
Global X Guru®
Index ETF 45,548,697 45,315,742
NOTES TO FINANCIAL STATEMENTS (UNAUDITED) (CONTINUED)
April 30, 2021
199
4. INVESTMENT TRANSACTIONS (continued)
For the period ended April 30, 2021, there were no purchases and sales of long-term U.S. Government securities. For the period ended April 30, 2021, in-kind transactions associated with creations and redemptions were:
For the year ended October 31, 2020, in-kind transactions associated with creations and redemptions were:
PurchasesSales and Maturities
Realized Gain/(Loss)
Global X Social Media ETF $ 248,206,883 $ 130,793,420 $ 89,719,892 Global X Lithium & Battery Tech ETF 825,396,582 31,381,254 17,924,094 Global X E-commerce ETF 137,172,025 18,612,891 9,294,340 Global X Emerging Markets Internet & E-commerce ETF 5,524,406 - -
Covered Call ETF 97,199,084 - - Global X Nasdaq 100 Covered Call & Growth ETF 6,131,380 2,820,576 245,511 Global X S&P 500 Covered Call & Growth ETF 3,060,552 4,125,677 427,939 Global X SuperIncome™ Preferred ETF 18,497,566 4,381,875 538,481 Global X Renewable Energy Producers ETF 91,180,732 47,431,921 10,704,000
Global X S&P 500®
Catholic Values ETF 57,535,321 14,187,389 6,619,023 Global X S&P Catholic Values Developed ex-U.S. ETF - - -
Global X Guru®
Index ETF 4,082,373 2,333,393 421,666
PurchasesSales and Maturities
Realized Gain/(Loss)
Global X Social Media ETF $ 33,340,357 $ 10,559,714 $ 1,966,522
Global X Lithium & Battery Tech ETF 104,208,945 62,679,799 3,955,066
Global X E-commerce ETF 92,096,000 12,844,433 4,549,847
Global X SuperDividend® ETF 90,730,215 27,787,216 (9,224,904)
Global X SuperDividend® U.S. ETF 126,117,688 34,059,155 2,165,771
Global X MSCI SuperDividend® EAFE ETF 1,217,335 7,923,306 (707,578)
Global X MSCI SuperDividend® Emerging Markets ETF 3,714,194 - -
Global X SuperDividend® REIT ETF 353,613,219 118,682,903 19,269,208
Global X NASDAQ 100® Covered Call ETF 778,575,756 66,199,151 29,752,498
Global X S&P 500® Covered Call ETF 60,812,072 66,922,435 17,587,784
Global X Russell 2000® Covered Call ETF 16,843,643 1,088,385 335,463
Global X Nasdaq 100 Covered Call & Growth ETF 6,753,905 - -
Global X S&P 500 Covered Call & Growth ETF 3,799,913 - -
Global X SuperIncome™ Preferred ETF 24,579,689 28,420,360 (2,327,435)
Global X YieldCo & Renewable Energy Income ETF 35,307,456 5,003,213 1,265,475
Global X S&P 500® Catholic Values ETF 117,889,845 45,730,969 17,772,932
Global X S&P Catholic Values Developed ex-U.S. ETF 2,501,921 - -
Global X Guru® Index ETF - 4,796,655 428,411
NOTES TO FINANCIAL STATEMENTS (UNAUDITED) (CONTINUED)
April 30, 2021
200
4. INVESTMENT TRANSACTIONS (continued)
To the extent consistent with their investment policies, certain Funds may either purchase or write options.
When a Fund purchases an option, the premium paid by it is recorded as an asset of the Fund. When a Fund writes an option, an amount equal to the net premium (the premium less the commission) received by the Fund is included in the liability section of the Fund’s Statement of Assets and Liabilities as a deferred credit. The amount of this asset or deferred credit will be subsequently marked-to-market to reflect the current value of the option purchased or written. The current value of the traded option is the last sale price or, in the absence of a sale, the current bid price. If an option purchased by a Fund expires unexercised, the Fund realizes a loss equal to the premium paid. If a Fund enters into a closing sale transaction on an option purchased by it, the Fund will realize a gain if the premium received by the Fund on the closing transaction is more than the premium paid to purchase the option, or a loss if it is less. If an option written by a Fund expires on the stipulated expiration date or if a Fund enters into a closing purchase transaction, it will realize a gain (or loss if the cost of a closing purchase transaction exceeds the net premium received when the option is sold) and the deferred credit related to such option will be eliminated. If an option written by a Fund is exercised, the proceeds of the sale will be increased by the net premium originally received and the Fund will realize a gain or loss.
Risks may arise from an imperfect correlation between the change in market value of the securities held and the prices of options relating to the securities purchased or sold and from possible lack of a liquid secondary market for an option. The maximum exposure to loss for any purchased option is limited to the premium initially paid for the option. Written uncovered call options subject a Fund to unlimited risk of loss. Written covered call options limit the upside potential of a security above the strike price. Put options written expose a Fund to risk of loss if the value of the security declines below the strike price.
Global X NASDAQ 100® Covered Call ETF, Global X S&P 500® Covered Call ETF, Global X Russell 2000 Covered Call ETF, Global X Nasdaq 100 Covered Call & Growth ETF, and Global X S&P 500 Covered Call & Growth ETF may write covered call and/or put options that correspond to their respective reference index. By writing a covered call option, a Fund, in exchange for the premium, foregoes the opportunity for capital appreciation above the strike price should the market price of the underlying security increase. Conversely, by writing a put option, the Fund, in exchange for the premium, accepts the risk of having to purchase a security at a fixed strike price even should the price of the underlying security decrease, exposing the Fund to downside risk in the underlying security.
When the written option expires, is terminated or is sold, a Fund will record a gain or loss. The net realized gain or loss on options contracts is reflected in the Statements of
NOTES TO FINANCIAL STATEMENTS (UNAUDITED) (CONTINUED)
April 30, 2021
201
4. INVESTMENT TRANSACTIONS (continued)
Operations and the net unrealized gains/(losses) are included as a component of the net change in unrealized appreciation/(depreciation) on options contracts in the Statement of Operations.
For the period ended April 30, 2021, the monthly average cost of the written options contracts held by the Global X NASDAQ 100® Covered Call ETF, Global X S&P 500® Covered Call ETF, Global X Russell 2000 Covered Call ETF, Global X Nasdaq 100 Covered Call & Growth ETF, and Global X S&P 500 Covered Call & Growth ETF were $57,311,871, $3,281,100, $3,436,819, $123,637, and $24,789, respectively.
5. TAX INFORMATION
The Global X SuperDividend® REIT ETF has a tax year that ends on December 31. The following tax disclosures are representative as of October 31, 2020. Accordingly, the disclosures are for informational use by shareholders and are subject to change attributable to activity through the end of the tax year ending December 31, 2020.
The amount and character of income and capital gain distributions to be paid, if any, are determined in accordance with Federal income tax regulations, which may differ from U.S. GAAP. As a result, net investment income (loss) and net realized gain (loss) on investment transactions for a reporting period may differ significantly from distributions during such period. These book/tax differences may be temporary or permanent. To the extent these differences are permanent in nature, they are charged or credited to undistributed net investment income (loss), accumulated net realized gain (loss) or paid-in capital, as appropriate, in the period that the differences arise.
The tax character of dividends and distributions declared during the years or periods ended October 31, 2020 and October 31, 2019 were as follows:
Global X Funds Ordinary Income Long-Term
Capital Gain Return of Capital Totals 7625 Global X Social Media ETF
2020 $ –
$ –
$ –
$ –
2019 –
–
–
–
7500 Global X Lithium & Battery Tech ETF 2020 $ 7,964,116
$ –
$ –
$ 7,964,116
2019 19,555,528
–
–
19,555,528
7991 Global X E-commerce ETF 2020 $ 11,908
$ –
$ –
$ 11,908
2019 –
–
–
–
7610 Global X SuperDividend® ETF 2020 $ 57,676,007
$ –
$ 6,836,903
$ 64,512,910
2019 71,080,700
–
10,387,010
81,467,710
NOTES TO FINANCIAL STATEMENTS (UNAUDITED) (CONTINUED)
April 30, 2021
202
5. TAX INFORMATION (continued)
Global X Funds Ordinary Income Long-Term
Capital Gain Return of Capital Totals 7675 Global X SuperDividend® U.S. ETF
2020 $ 28,896,892
$ –
$ 9,790,983
$ 38,687,875
2019 29,513,428
–
5,156,842
34,670,270
7935 Global X MSCI SuperDividend® EAFE ETF 2020 $ 454,057
$ –
$ 119,148
$ 573,205
2019 547,298
–
–
547,298
7730 Global X MSCI SuperDividend® Emerging Markets ETF 2020 $ 1,074,084
$ –
$ 222,316
$ 1,296,400
2019 1,146,140
–
–
1,146,140
7735 Global X SuperDividend® REIT ETF 2020 $ 17,057,314
$ 482,944
$ 2,127,168
$ 19,667,426
2019 7,369,085
–
–
7,369,085
8009 Global X NASDAQ 100® Covered Call ETF 2020 $ 2,834,579
$ –
$ 117,268,361
$ 120,102,940
2019 40,380,150
2,101,875
12,331,150
54,813,715
8010 Global X S&P 500® Covered Call ETF 2020 $ 1,539,799
$ –
$ 7,321,411
$ 8,861,210
2019 4,867,892
582,508
780,262
6,230,662
8013 Global X Russell 2000 Covered Call ETF 2020 $ 82,683
$ 74,655
$ 1,449,526
$ 1,606,864
2019 158,257
99,323
–
257,580
8023 Global X Nasdaq 100® Covered Call & Growth ETF 2020 $ –
$ –
$ 20,955
$ 20,955
8024 Global X S&P 500® Covered Call & Growth ETF 2020 $ 2,931
$ –
$ 16,682
$ 19,613
7665 Global X SuperIncome™ Preferred ETF 2020 $ 10,818,268
$ –
$ 549,532
$ 11,367,800
2019 11,905,843
–
83,858
11,821,985
7785 Global X Renewable Energy Producers ETF 2020 $ 1,352,385
$ –
$ –
$ 1,352,385
2019 644,590
–
–
644,590
7795 Global X S&P 500® Catholic Values ETF 2020 $ 4,513,893
$ 128,757
$ –
$ 4,642,650
2019 4,530,407
187,691
–
4,718,098
8020 Global X S&P Catholic Values Developed ex-U.S. ETF 2020 $ –
$ –
$ –
$ –
7660 Global X Guru® Index ETF 2020 $ 538,248
$ –
$ 28,732
$ 566,980
2019 310,767
–
82,434
393,201
NOTES TO FINANCIAL STATEMENTS (UNAUDITED) (CONTINUED)
April 30, 2021
203
5. TAX INFORMATION (continued)
Global X Funds
Global X Social Media
ETF
Global X Lithium &
Battery Tech ETF
Global X E-commerce
ETF
Global X SuperDividend®
ETF Undistributed Ordinary Income $ –
$ 1,972,573
$ 775,965
$ –
Capital Loss Carryforwards (29,959,090)
(154,643,834)
–
(605,281,502)
Unrealized Appreciation (Depreciation) on Investments and Foreign Currency 71,760,681
158,192,435
2,673,286
(72,895,790)
Late Year Loss Deferral (384,418)
–
–
–
Other Temporary Differences –
(5)
1
(17)
Total Distributable Earnings (Accumulated Losses) $ 41,417,173
$ 5,521,169
$ 3,449,252
$ (678,177,309)
Global X Funds
Global X SuperDividend®
U.S. ETF
Global X MSCI SuperDividend®
EAFE ETF
Global X MSCI SuperDividend®
Emerging Markets ETF
Global X SuperDividend®
REIT ETF(1) Capital Loss
Carryforwards (223,775,721)
(2,560,856)
(7,800,767)
–
Unrealized Appreciation (Depreciation) on Investments and Foreign Currency (28,565,675)
(928,720)
(1,461,950)
15,417,641
Other Temporary Differences 8
(1)
–
(2,927,460)
Total Accumulated Losses $ (252,341,387)
$ (3,489,577)
$ (9,262,717)
$ (12,490,181)
(1) The Global X SuperDividend® REIT ETF has a tax year that ends on December 31.
Global X Funds
Global X NASDAQ
100® Covered Call ETF
Global X S&P 500® Covered
Call ETF
Global X Russell 2000 Covered Call
ETF
Global X Nasdaq 100® Covered Call
& Growth ETF
Capital Loss Carryforwards (41,064,020)
(33,094,168 )
(1,368,001)
(114,135)
Unrealized Appreciation on Investments and Foreign Currency –
–
–
–
Late Year Loss Deferral –
–
–
(468)
Other Temporary Differences 7
5,383
8
–
Total Accumulated Losses $ (41,064,012)
$ (33,088,785)
$ (1,367,993)
$ (114,603 )
NOTES TO FINANCIAL STATEMENTS (UNAUDITED) (CONTINUED)
April 30, 2021
204
5. TAX INFORMATION (continued)
Global X Funds
Global X S&P 500® Covered
Call & Growth ETF
Global X SuperIncome™ Preferred ETF
Global X Renewable
Energy Producers
ETF
Global X S&P 500® Catholic Values ETF
Undistributed Ordinary Income $ –
$ –
$ 351,607
$ 1,994,632
Undistributed Long-Term Capital Gain –
–
132,994
–
Capital Loss Carryforwards (70,250)
(64,726,594)
–
(276,628)
Unrealized Appreciation (Depreciation) on Investments and Foreign Currency –
(1,467,791)
1,383,810
47,769,089
Other Temporary Differences –
(24,728)
–
3
Total Distributable Earnings (Accumulated Losses) $ (70,250)
$ (66,219,113)
$ 1,868,411
$ 49,487,096
Global X Funds
Global X S&P Catholic Values
Developed ex-U.S. ETF
Global X Guru® Index
ETF Undistributed Ordinary Income $ 21,138
$ –
Capital Loss Carryforwards (3,244)
(16,828,294 )
Unrealized Appreciation (Depreciation) on Investments and Foreign Currency (25,314)
4,692,123
Other Temporary Differences (70)
(3 )
Total Accumulated Losses $ (7,490)
$ (12,136,175)
For taxable years beginning after December 22, 2010, a RIC is permitted to carry forward net capital losses to offset capital gains realized in later years, and the losses carried forward retain their original character as either long-term or short-term losses. Losses carried forward under these provisions are as follows:
Short-Term
LossLong-Term
Loss Total Global X Social Media ETF $ 9,425,030
$ 20,534,060
$ 29,959,090
Global X Lithium & Battery Tech ETF 26,035,130
128,608,704
154,643,834
Global X SuperDividend® ETF 246,119,326
359,162,176
605,281,502
Global X SuperDividend® U.S. ETF 169,742,093
54,033,628
223,775,721
Global X MSCI SuperDividend® EAFE ETF 817,164
1,743,692
2,560,856
Global X MSCI SuperDividend® Emerging Markets ETF 4,271,755
3,529,012
7,800,767
NOTES TO FINANCIAL STATEMENTS (UNAUDITED) (CONTINUED)
April 30, 2021
205
5. TAX INFORMATION (continued)
Short-Term
LossLong-Term
Loss Total 8009 Global X NASDAQ 100® Covered Call ETF $16,425,608
$24,638,412
$41,064,020
8010 Global X S&P 500® Covered Call ETF 13,230,874
19,863,293
33,094,168
8013 Global X Russell 2000 Covered Call ETF 566,196
801,805
1,368,001
8023 Global X Nasdaq 100® Covered Call & Growth ETF 45,654
68,481
114,135
8024 Global X S&P 500® Covered Call & Growth ETF 28,100
42,150
70,250
7665 Global X SuperIncome™ Preferred ETF 18,332,399
46,394,195
64,726,594
7795 Global X S&P 500® Catholic Values ETF –
276,628
276,628
8020 Global X S&P Catholic Values Developed ex-U.S. ETF 3,244
–
3,244
7660 Global X Guru® Index ETF 16,828,294
–
16,828,294
During the year ended October 31, 2020, the following Funds utilized capital loss carryforwards to offset capital gains amounting to:
Short-Term
LossLong-Term
Loss Total 7730 Global X Social Media ETF $ 479,691
$ 41,962
$ 521,653
8009 Global X Lithium & Battery Tech ETF 125,159
–
125,159
8010 Global X E-commerce ETF 956
–
956
8013 Global X Renewable Energy Producers ETF 157,958 691,145 849,103 80 Global X Guru® Index ETF 5,401,794
–
5,401,794
The Federal tax cost and aggregate gross unrealized appreciation and depreciation on investments held by the Funds at April 30, 2021 were as follows:
Global X Funds Federal Tax
Cost
Aggregated Gross
Unrealized Appreciation
Aggregated Gross
Unrealized Depreciation
Net Unrealized
Appreciation (Depreciation)
Global X Social Media ETF $418,718,379 $83,557,427 $(14,038,394) $69,519,033Global X Lithium & Battery Tech ETF 2,626,557,682 670,447,191 (30,969,707) 639,477,484Global X E-commerce ETF 220,531,731 30,252,498 (6,740,339) 23,512,159Global X Emerging Markets Internet & E-commerce ETF 7,146,935 367,927 (423,787) (55,860)Global X SuperDividend® ETF 860,222,037 100,263,440 (22,977,389) 77,286,051Global X SuperDividend® U.S. ETF 596,910,118 90,574,486 (8,150,520) 82,423,966Global X MSCI SuperDividend® EAFE ETF 9,991,956 1,892,976 (233,427) 1,659,549Global X MSCI SuperDividend® Emerging Markets ETF 33,107,866 5,559,412 (1,310,844) 4,248,568Global X SuperDividend® REIT ETF 458,366,563 64,008,421 (5,862,779) 58,145,642Global X NASDAQ 100® Covered Call ETF 1,835,240,348 801,311,793 (3,087,769) 798,224,024Global X S&P 500® Covered Call ETF 178,666,284 44,220,969 (1,731,403) 42,489,566Global X Russell 2000 Covered Call ETF 114,230,264 13,126,689 – 13,126,689Global X Nasdaq 100® Covered Call & Growth ETF 9,782,015 1,114,017 (75,075) 1,038,942Global X S&P 500® Covered Call & Growth ETF 2,919,159 365,199 (24,450) 340,749Global X SuperIncome™ Preferred ETF 203,189,047 10,681,280 (2,197,608) 8,483,672Global X Renewable Energy Producers ETF 132,943,881 7,182,476 (13,873,608) (6,691,132)Global X S&P 500® Catholic Values ETF 377,662,063 164,573,036 (5,729,588) 158,843,448
NOTES TO FINANCIAL STATEMENTS (UNAUDITED) (CONTINUED)
April 30, 2021
206
Global X Funds Federal Tax
Cost
Aggregated Gross
Unrealized Appreciation
Aggregated Gross
Unrealized Depreciation
Net Unrealized
Appreciation (Depreciation)
Global X S&P Catholic Values Developed ex-U.S. ETF $ 2,552,762 $ 659,001 $(38,326) $620,675Global X Guru® Index ETF 63,638,683 14,085,666 (2,367,144) 11,718,522
The preceding differences between book and tax cost are primarily due to mark-to-market treatment of passive foreign investment companies, mixed straddles, MLP adjustments and wash sales.
The Funds invest in securities of foreign issuers in various countries. These investments may involve certain considerations and risks not typically associated with investments in the United States as a result of, among other factors, the possibility of future political and economic developments, the level of governmental supervision and regulation of securities markets in the respective countries.
6. CONCENTRATION OF RISKS
The securities markets of emerging countries are less liquid, subject to greater price volatility, and have a smaller market capitalization than those of United States securities markets. In certain countries, there may be fewer publicly traded securities and the market may be dominated by a few issuers or sectors. Issuers and securities markets in such countries are not subject to as extensive and frequent accounting, financial and other reporting requirements or as comprehensive government regulations as are issuers and securities markets in the U.S. In particular, the assets and profits appearing on the financial statements of emerging country issuers may not reflect their financial position or results of operations in the same manner as financial statements for U.S. issuers. Substantially less information may be publicly available about emerging country issuers than is available about issuers in the United States.
The Funds may be subject to taxes imposed by countries in which they invest. Such taxes are generally based on either income or gains earned or repatriated. The Funds accrue and apply such taxes to net investment income, net realized gains and net unrealized gains as income and/or capital gains are earned.
Except for the Global X Russell 2000® Covered Call Fund, which uses a representative sampling strategy, the Funds use a replication strategy. A replication strategy is an indexing strategy that involves investing in the securities of an underlying index in approximately the same proportions as in the underlying index. A representative sampling strategy is an indexing strategy that involves investing in a representative sample of securities (including indirect investments through underlying ETFs) that collectively has an investment profile similar to an underlying index in terms of key risk factors, performance attributes and other characteristics. Each Fund may utilize a representative sampling strategy with respect to its underlying indices when a replication strategy might be detrimental to its shareholders, such as when there are practical
NOTES TO FINANCIAL STATEMENTS (UNAUDITED) (CONTINUED)
April 30, 2021
207
6. CONCENTRATION OF RISKS (continued)
difficulties or substantial costs involved in compiling a portfolio of equity securities to follow their underlying indices, or, in certain instances, when securities in the underlying indices become temporarily illiquid, unavailable or less liquid, or due to legal restrictions (such as diversification requirements that apply to a Fund but not the underlying index).
The London Interbank Offered Rate, or “LIBOR,” the offered rate for short-term Eurodollar deposits between major international banks, is used extensively in the United States and globally as a reference rate in various financing and commercial transactions. Plans are underway to phase out the use of LIBOR by the end of 2021. There remains uncertainty regarding the nature of any replacement rate and the impact of the transition from LIBOR on the financial markets generally, transactions that use LIBOR as a reference rate and financial institutions that engage in such transactions, including issuers of securities in which the Funds may invest. As such, the potential effect of a transition away from LIBOR on Fund investments cannot yet be determined.
Please refer to each Fund’s prospectus and statement of additional information (“SAI”) for a more complete description of risks.
7. LOANS OF PORTFOLIO SECURITIES
The Funds may lend portfolio securities having a market value up to one-third of the Funds’ total assets. Security loans made pursuant to a securities lending agreement with BBH are initially required to be secured by collateral equal to at least 102% of the value of domestic equity securities and American Depositary Receipts (“ADRs”) and 105% of the value of foreign equity securities (other than ADRs). Such collateral received in connection with these loans will be cash and can be invested in repurchase agreements, short term investments or U.S. Treasury obligations and is recognized in the Schedules of Investments and Statements of Assets and Liabilities. The obligation to return securities lending collateral is also recognized as a liability in the Statements of Assets and Liabilities. It is the Funds’ policy to obtain additional collateral from or return excess collateral to the borrower by the end of the next business day, following the valuation date of the securities loaned. Therefore, the value of the collateral held may be temporarily less than the value of the securities on loan.
Lending securities entails a risk of loss to the Funds if and to the extent that the market value of the securities loans were to increase and the borrower did not increase the collateral accordingly, and the borrower fails to return the securities. In the event the borrower may not provide additional collateral when required or may not return the securities when due, the securities lending agency agreement requires the lending agent to indemnify the Funds by replacing either the security or the security’s current market value to the Funds. The Funds could suffer a loss if the value of an investment purchased with cash collateral falls below the market value of loaned securities or if the value of an investment purchased with cash collateral falls below the value of the original cash
NOTES TO FINANCIAL STATEMENTS (UNAUDITED) (CONTINUED)
April 30, 2021
208
7. LOANS OF PORTFOLIO SECURITIES (continued)
collateral received. The Funds could also experience delays and costs in gaining access to the collateral. The Funds bear the risk of any deficiency in the amount of the collateral available for return to the borrower due to any loss on the collateral invested.
As of April 30, 2021, the value of securities on loan was $1,132,561, $86,507,954, $3,932,277, $12,448,370, $8,640,452, $15,966,518, $507,034, $2,223,515, and $1,971,114 for the Global X Social Media ETF, Global X Lithium & Battery Tech ETF, Global X E-commerce ETF, Global X SuperDividend® ETF, Global X SuperDividend® U.S. ETF, Global X SuperDividend® REIT ETF, Global X SuperIncome™ Preferred ETF, Global X Renewable Energy Producers ETF, and Global X Guru® Index ETF, respectively, and the cash collateral received from securities on loan was $1,627,506, $90,683,598, $3,932,994, $14,026,294, $8,859,521, $16,719,149, $543,400, $2,371,895, and $2,075,625 for Global X Social Media ETF, Global X Lithium & Battery Tech ETF, Global X E-commerce ETF, Global X SuperDividend® ETF, Global X SuperDividend® U.S. ETF, Global X SuperDividend® REIT ETF, Global X SuperIncome™ Preferred ETF, Global X Renewable Energy Producers ETF, and Global X Guru® Index ETF, respectively.
As of April 30, 2021, the following Funds had securities on loan, by counterparty:
Market Value Cash Collateral
Global X Social Media ETF
Citigroup 78,427$ 79,228$ (1)
Goldman Sachs & Co. 1,832 1,845 (1)
JPMorgan 451,460 939,453
Morgan Stanley 560,316 566,040 (1)
National Financial Services 40,526 40,940 (1)
Global X Lithium & Battery Tech ETF
Barclays Capital 7,397,934 7,704,000
BofA Securities, Inc. 7,457,965 7,768,734
Citigroup 7,304,081 7,602,000
Goldman Sachs & Co. 25,529,664 26,652,035
JPMorgan 24,050,263 25,432,752
Morgan Stanley 14,768,047 15,524,077
NOTES TO FINANCIAL STATEMENTS (UNAUDITED) (CONTINUED)
April 30, 2021
209
7. LOANS OF PORTFOLIO SECURITIES (continued)
Cash Collateral Market Value
Global X E-commerce ETF
Citigroup 212,205$ 204,450$ (1)
Goldman Sachs & Co. 3,182,087 3,179,219 (1)
National Financial Services 494,340 505,680
UBS Securities LLC 43,645 43,645 (1)
Global X SuperDividend®
ETF
BofA Securities, Inc. 3,959,327 4,179,417
Citigroup 99,081 100,861
Goldman Sachs & Co. 1,568,199 2,436,846
JPMorgan 3,533,029 3,803,456
Morgan Stanley 2,820,346 3,014,914
National Financial Services 77,220 79,200
UBS Securities LLC 391,168 411,600
Global X SuperDividend®
U.S . ETF
Goldman Sachs & Co. 214,802 219,584
Morgan Stanley 5,935,854 6,093,025
National Financial Services 2,489,796 2,546,912
Global X SuperDividend®
REIT ETF
Citigroup 953,331 1,003,964
Goldman Sachs & Co. 131,026 137,083
Scotia Capital 14,882,161 15,578,102
Global X SuperIncome™ Preferred ETF
Wells Fargo 507,034 543,400
Global X Renewable Energy Producers ETF
BofA Securities, Inc. 933,958 991,349
Citigroup 962,103 1,031,846
UBS Securities LLC 327,454 348,700
Global X Guru® Index ETF
BofA Securities, Inc. 503,971 535,995
JPMorgan 877,333 936,300
Morgan Stanley 589,810 603,330
(1) It is the Funds' policy to obtain additional collateral from or return excess collateral to the borrowerby the end of the next business day, following the valuation date of the securities loaned. Therefore, thevalue of the collateral held may be temporarily less than the value of the securities on loan.
NOTES TO FINANCIAL STATEMENTS (UNAUDITED) (CONCLUDED)
April 30, 2021
210
8. CONTRACTUAL OBLIGATIONS
The Funds enter into contracts in the normal course of business that contain a variety of indemnifications. The Funds’ maximum exposure under these contracts is unknown; however, the Funds have not had prior gains or losses pursuant to these contracts. Management has reviewed the Funds’ existing contracts and expects the risk of loss to be remote.
Pursuant to the Trust’s organizational documents, the Trustees of the Trust and the Trust’s officers are indemnified against certain liabilities that may arise out of the performance of their duties.
9. SUBSEQUENT EVENTS
The Funds have been evaluated by management regarding the need for additional disclosures and/or adjustments resulting from subsequent events. Based on this evaluation, no additional adjustments were required to the financial statements.
10. OTHER MATTER
The rapid and global spread of a highly contagious novel coronavirus respiratory disease, designated COVID-19, has resulted in extreme volatility in the financial markets and severe losses; reduced liquidity of many instruments; restrictions on international and, in some cases, local travel; significant disruptions to business operations (including business closures); strained healthcare systems; disruptions to supply chains, consumer demand and employee availability; and widespread uncertainty regarding the duration and long-term effects of this pandemic. Some sectors of the economy and individual issuers have experienced particularly large losses. In addition, the COVID-19 pandemic may result in a sustained economic downturn or a global recession, domestic and foreign political and social instability, damage to diplomatic and international trade relations and increased volatility and/or decreased liquidity in the securities markets. The COVID-19 pandemic could adversely affect the value and liquidity of the Funds’ investments and negatively impact Fund performance. In addition, the outbreak of COVID-19, and measures taken to mitigate its effects, could result in disruptions to the services provided to the Funds by their service providers.
DISCLOSURE OF FUND EXPENSES (UNAUDITED)
211
All ETFs (such as the Funds) have operating expenses. As a shareholder of an ETF, your investment is affected by these ongoing costs, which include (among others) costs for ETF management, administrative services, commissions, and shareholder reports like this one. It is important for you to understand the impact of these costs on your investment returns. In addition, a shareholder is responsible for brokerage fees as a result of the shareholder’s investment in a Fund. Operating expenses such as these are deducted from a Fund’s gross income and directly reduce their final investment returns. These expenses are expressed as a percentage of the Fund’s average net assets; this percentage is known as the Fund’s expense ratio. The following examples use the expense ratio and are intended to help you understand the ongoing costs (in dollars) of investing in a Fund and to compare these costs with those of other funds. The examples are based on an investment of $1,000 made at the beginning of the period shown and held for the entire period (November 1, 2020 through April 30, 2021). The table on the next page illustrates the Funds’ costs in two ways: Actual Fund Return. This section helps you to estimate the actual expenses that your Fund incurred over the period. The “Expenses Paid During Period” column shows the actual dollar expense cost incurred by a $1,000 investment in the Fund, and the “Ending Account Value” number is derived from deducting that expense cost from the Fund’s gross investment return. You can use this information, together with the actual amount you invested in the Fund, to estimate the expenses you paid over that period. Simply divide your actual account value by $1,000 to arrive at a ratio (for example, an $8,600 account value divided by $1,000 = 8.6), then multiply that ratio by the number shown for your Fund under “Expenses Paid During Period.” Hypothetical 5% Return. This section helps you compare your Fund’s costs with those of other funds. It assumes that the Fund had an annual 5% return before expenses during the year, but that the expense ratio (Column 3) for the period is unchanged. This example is useful in making comparisons because the Securities and Exchange Commission requires all funds to make this 5% calculation. You can assess your Fund’s comparative cost by comparing the hypothetical result for your Fund in the “Expenses Paid During Period” column with those that appear in the same charts in the shareholder reports for other funds. NOTE: Because the return is set at 5% for comparison purposes — NOT your Fund’s actual return — the account values shown may not apply to your specific investment.
DISCLOSURE OF FUND EXPENSES (UNAUDITED) (CONCLUDED)
212
Beginning Account Value
11/1/2020
Ending Account
Value 4/30/2021
Annualized Expense Ratios
Expenses Paid During
Period(1) Global X Social Media ETF
Actual Fund Return $1,000.00 $1,331.30 0.65%
$3.76
Hypothetical 5% Return 1,000.00 1,021.57 0.65
3.26
Global X Lithium & Battery Tech ETF
Actual Fund Return $1,000.00 $1,486.30 0.75%
$4.62
Hypothetical 5% Return 1,000.00 1,021.08 0.75
3.76
Global X E-commerce ETF
Actual Fund Return $1,000.00 $1,304.10 0.50%
$2.86
Hypothetical 5% Return 1,000.00 1,022.32 0.50
2.51
Global X Emerging Markets Internet & E-commerce ETF*
Actual Fund Return $1,000.00 $1,000.00 0.67%
$3.16(2)
Hypothetical 5% Return 1,000.00 1,020.40 0.67
3.19
Global X SuperDividend® ETF
Actual Fund Return $1,000.00 $1,381.30 0.59%
$3.48
Hypothetical 5% Return 1,000.00 1,021.87 0.59
2.96
Global X SuperDividend® U.S. ETF
Actual Fund Return $1,000.00 $1,359.80 0.45%
$2.63
Hypothetical 5% Return 1,000.00 1,022.56 0.45
2.26
Global X MSCI SuperDividend® EAFE ETF
Actual Fund Return $1,000.00 $1,419.20 0.55%
$3.30
Hypothetical 5% Return 1,000.00 1,022.07 0.55
2.76
Global X MSCI SuperDividend® Emerging Markets ETF
Actual Fund Return $1,000.00 $1,294.60 0.65%
$3.70
Hypothetical 5% Return 1,000.00 1,021.57 0.65
3.26
Global X SuperDividend® REIT ETF
Actual Fund Return $1,000.00 $1,374.20 0.59%
$3.47
Hypothetical 5% Return 1,000.00 1,021.87 0.59
2.96
Global X NASDAQ 100® Covered Call ETF
Actual Fund Return $1,000.00 $1,159.30 0.60%
$3.21
Hypothetical 5% Return 1,000.00 1,021.82 0.60
3.01
Global X S&P 500® Covered Call ETF
Actual Fund Return $1,000.00 $1,185.70 0.60%
$3.25
Hypothetical 5% Return 1,000.00 1,021.82 0.60
3.01
DISCLOSURE OF FUND EXPENSES (UNAUDITED) (CONCLUDED)
213
Beginning Account Value
11/1/2020
Ending Account
Value 4/30/2021
Annualized Expense Ratios
Expenses Paid During
Period(1) Global X Russell 2000 Covered Call ETF
Actual Fund Return $1,000.00 $1,287.80 0.60%
$3.40
Hypothetical 5% Return 1,000.00 1,022.32 0.60
3.01
Global X Nasdaq 100® Covered Call & Growth ETF
Actual Fund Return $1,000.00 $1,206.30 0.60%
$3.28
Hypothetical 5% Return 1,000.00 1,021.82 0.60
3.01
Global X S&P 500® Covered Call & Growth ETF
Actual Fund Return $1,000.00 $1,229.40 0.61%
$3.37
Hypothetical 5% Return 1,000.00 1,021.77 0.61
3.06
Global X SuperIncome™ Preferred ETF
Actual Fund Return $1,000.00 $1,100.70 0.58%
$3.02
Hypothetical 5% Return 1,000.00 1,021.92 0.58
2.91
Global X Renewable Energy Producers ETF
Actual Fund Return $1,000.00 $1,000.00 0.65%
$3.22
Hypothetical 5% Return 1,000.00 1,021.57 0.65
3.26
Global X S&P 500® Catholic Values ETF
Actual Fund Return $1,000.00 $1,300.40 0.29%
$1.65
Hypothetical 5% Return 1,000.00 1,023.36 0.29
1.45
Global X S&P Catholic Values Developed ex-U.S. ETF
Actual Fund Return $1,000.00 $1,287.40 0.35%
$1.99
Hypothetical 5% Return 1,000.00 1,023.06 0.35
1.76
Global X Guru® Index ETF
Actual Fund Return $1,000.00 $1,302.30 0.75%
$4.28
Hypothetical 5% Return 1,000.00 1,021.08 0.75
3.76
(1) Expenses are equal to the Fund’s annualized expense ratio multiplied by the average account value over the period, multiplied 181/365 (to reflect the one-half year period), unless otherwise noted.
(2) Expenses are equal to the Fund’s annualized expense ratio multiplied by the average account value over the period, multiplied 171/365 (to reflect the period from inception to date).
* The Fund commenced operations on November 9, 2020.
APPROVAL OF INVESTMENT ADVISORY AGREEMENT (UNAUDITED)
214
Section 15(c) of the Investment Company Act of 1940, as amended (“1940 Act”), requires that the board of trustees of an exchange-traded fund (“ETF”), including a majority of those trustees who are not “interested persons” of the ETF, as defined in the 1940 Act (“Independent Trustees”), consider on an initial basis and periodically thereafter (as required by the 1940 Act), at an in person meeting called for such purpose, the terms of each ETF’s investment advisory agreement and whether to approve entering into, or renewing, each agreement.
At a Board meeting of the Global X Funds (the “Trust”) held by videoconference on July 30, 20201 (the “New Fund Board Meeting”), the Board of Trustees (the “Board”) (including the Trust’s Independent Trustees, voting separately) also considered and unanimously approved (i) the initial Investment Advisory Agreement (“New Investment Advisory Agreement”) for the Global X Emerging Markets Internet & E-commerce ETF (“New Fund”) and (ii) the initial Supervision and Administration Agreement between the Trust (“New Supervision and Administration Agreement”), on behalf of the New Fund, and Global X Management. The New Advisory Agreement and New Supervision and Administration Agreement are referred to collectively as the “New Fund Agreements.”
At a Board meeting of the Trust held via videoconference November 11, 20201, called for such purpose, the Board (including the Trust’s Independent Trustees, voting separately) considered and unanimously approved the continuation of (i) the Investment Advisory Agreement (“Renewal Investment Advisory Agreement”) for each Fund included in this Annual Report (each, a “Renewal Fund”); and (ii) the Supervision and Administration Agreement between the Trust (“Renewal Supervision and Administration Agreement”), on behalf of each Renewal Fund, and Global X Management Company LLC (“Global X Management”). The Renewal Investment Advisory Agreement and the Renewal Supervision and Administration Agreement are referred to herein as the “Renewal Agreements.”
1 This meeting was held via videoconference in reliance on an exemptive order issued by the Securities and Exchange Commission on March 25, 2020. Reliance on the exemptive order is necessary and appropriate due to circumstances related to current or potential effects of COVID-19. All Trustees participating in the telephonic meeting were able to hear each other simultaneously during the meeting. Reliance on the exemptive order requires Trustees, including a majority of the Independent Trustees, to ratify actions taken pursuant to the exemptive order by vote cast at the next in-person meeting.
APPROVAL OF INVESTMENT ADVISORY AGREEMENT (UNAUDITED)
215
In advance of the Board meetings, the Board (including the Trust’s Independent Trustees) and the Independent Trustees’ independent legal counsel requested (in writing) detailed information from Global X Management in connection with the Board’s consideration of the Renewal Agreements and New Fund Agreements and received and reviewed written responses from Global X Management and supporting materials relating to those requests for information. In the course of their consideration of the Renewal Agreements and New Fund Agreements, the Trust’s Independent Trustees were advised by their independent legal counsel and, in addition to meetings with management of Global X Management, the Independent Trustees met separately in executive sessions with their counsel.
NEW FUND AGREEMENTS
In determining to approve the New Fund Agreements for the New Fund the Board considered a variety of factors, including the factors discussed in greater detail below.
Nature, Extent and Quality of Services
With respect to this factor, the Board considered:
• the terms of the New Fund Agreements and the range of services proposed to be provided to the New Fund in accordance with the New Fund Agreements;
• Global X Management’s key personnel and the portfolio managers who would provide investment advisory, supervision and administrative services to the New Fund;
• Global X Management’s responsibilities under the New Fund Agreements to, among other things, (i) manage the investment operations of the New Fund and the composition of the New Funds’ assets, including the purchase, retention and disposition of its holdings, (ii) provide quarterly reports to the Trust’s officers and the Board and other reports as the Board deems necessary or appropriate, (iii) vote proxies, exercise consents, and exercise all other rights appertaining to securities and assets held by the New Fund, (iv) select broker-dealers to execute portfolio transactions for the New Fund when necessary, (v) assist in the preparation and filing of reports and proxy statements (if any) to the shareholders of the New Fund, and the periodic updating of the registration statements, prospectuses, statements of additional information, and other reports and documents for the New Fund that are required to be filed by the Trust with the U.S. Securities and Exchange Commission (“SEC”) and other regulatory or governmental bodies, and (vi) monitor anticipated purchases and redemptions of the shares (including Creation Units) of the New Fund by shareholders and new investors;
• the nature, extent and quality of all of the services (including advisory, administrative and compliance services) that are proposed to be provided by Global X Management or made available to the New Fund; and
APPROVAL OF INVESTMENT ADVISORY AGREEMENT (UNAUDITED)
216
• the quality of Global X Management’s resources and personnel that would be made available to the New Fund, including Global X Management’s experience and the professional qualifications of Global X Management’s key personnel.
Based on these considerations, the Board concluded, at the New Fund Board Meeting, that it was satisfied with the nature, extent and quality of the services proposed to be provided to the New Fund by Global X Management.
Performance
The Board determined that, because the New Fund had not yet begun investment operations as of the dates of the New Fund Board Meetings, meaningful data relating to the investment performance of the New Fund was not available and, therefore, could not be a factor in approving the New Fund Agreements.
Cost of Services and Profitability
With respect to this factor, the Board considered:
• Global X Management’s expected costs to provide investment management, supervision and administrative and related services to the New Fund;
• The management fee (including the proposed investment advisory fee) (“Management Fee”) that was proposed to be borne by the New Fund under the respective New Fund Agreement for the various investment advisory, supervisory and administrative services that the New Fund requires under a unitary fee structure (including the types of fees and expenses that are not included within the unitary fee and would be borne by the New Fund); and
• the expected profitability to Global X Management, if any, from all of the services proposed to be provided to the New Fund by Global X Management and all aspects of the relationship between Global X Management and the New Fund.
Based on these considerations, the Board concluded that the proposed Management Fee to be paid by the New Fund to Global X Management, in light of the nature, extent and quality of the services to be provided, was reasonable and in the best interests of the New Fund’s shareholders.
Comparison of Fees and Services
With respect to this factor, the Board considered:
• comparative information with respect to the proposed Management Fee to be paid to Global X Management by the New Fund. In connection with this consideration,
APPROVAL OF INVESTMENT ADVISORY AGREEMENT (UNAUDITED)
217
Global X Management provided the Board with comparative expense data for the New Fund, including fees and expenses paid by unaffiliated similar specialized and/or focused ETFs, and/or other similar registered funds. The Board considered Global X Management’s detailed explanation of the proposed fee structures of any New Fund that was above the average or median for the New Fund’s peer group;
• the structure of the proposed unitary Management Fee (which includes as one component the proposed investment advisory fee for the New Fund) and the expected total expense ratios for the New Fund. In this regard, the Board took into consideration that the purpose of adopting a unitary Management Fee structure for the New Fund was to create a simple, all-inclusive fee that would provide a level of predictability with respect to the overall expense ratio (i.e., the total fee) of the New Fund and that the proposed Management Fee for the New Fund was set at a competitive level to make the New Fund viable in the marketplace; and
• that, under the proposed unified Management Fee structure, Global X Management would be responsible for most ordinary expenses of the New Fund, including the costs of various third-party services required by the New Fund, including investment advisory, administrative, audit, certain custody, portfolio accounting, legal, transfer agency and printing costs, but that the New Fund would bear other expenses not covered under the proposed all-inclusive Management Fee, such as taxes, brokerage fees, commissions, and other transaction expenses, interest expenses, and extraordinary expenses.
Based on these considerations, the Board concluded, at the New Fund Board Meeting, that the services to be received and the fees to be charged under the applicable New Fund Agreements were reasonable on a comparative basis.
Economies of Scale
With respect to this factor, the Board considered:
• the extent to which economies of scale would be realized as the New Fund grows and whether the proposed unitary Management Fees for the New Fund reflected these economies of scale;
• the significant investment of time, personnel and other resources that Global X Management intends to make in the New Fund in order to seek to assure that the New Fund is attractive to investors; and
• that the proposed unitary Management Fee would provide a high level of certainty as to the total level of expenses for the New Fund and its shareholders.
APPROVAL OF INVESTMENT ADVISORY AGREEMENT (UNAUDITED)
218
Based on these considerations, the Board concluded, at the New Fund Board Meeting, that the proposed unitary Management Fees for the New Fund appropriately addressed economies of scale.
Other Benefits
In considering each New Fund Agreement, in addition to the factors discussed above, the Board considered other benefits that may be realized by Global X Management as a result of its relationships with the New Fund. As a result, the Board concluded that, in the case of New Fund, in the exercise of the Board’s business judgement, all information the Board considered supported approval of the applicable New Fund Agreements.
Conclusion
After full consideration of the factors above, as well as other factors that were instructive in their consideration, the Board, including all of the Trust’s Independent Trustees voting separately, concluded, in the exercise of its business judgement, that the New Fund Agreements were fair and reasonable and in the best interest of the New Fund.
In reaching this decision, the Board did not assign relative weights to the factors above nor did the Board deem any one factor or group of them to be controlling in and of themselves. Each member of the Board may have assigned different weights to the various factors.
RENEWAL AGREEMENTS
In determining to approve the continuation of the Renewal Agreements for the Renewal Funds, the Board considered a variety of factors, including the factors discussed in greater detail below.
Nature, Extent and Quality of Services
With respect to this factor, the Board considered:
• the terms of the Renewal Agreements and the range of services that would continue to be provided to each Renewal Fund in accordance with the Renewal Agreements;
• Global X Management’s key personnel and the portfolio managers who would continue to provide investment advisory, supervision and administrative services to each Renewal Fund;
• Global X Management’s responsibilities under the Renewal Agreements, among other things, to: (i) manage the investment operations of the Renewal Funds and
APPROVAL OF INVESTMENT ADVISORY AGREEMENT (UNAUDITED)
219
the composition of the Renewal Funds’ assets, including the purchase, retention and disposition of their holdings, (ii) provide quarterly reports to the Trust’s officers and the Board and other reports as the Board deems necessary or appropriate, (iii) vote proxies, exercise consents, and exercise all other rights relating to securities and assets held by the Renewal Funds, (iv) select broker-dealers to execute portfolio transactions for the Renewal Funds when necessary, (v) assist in the preparation and filing of reports and proxy statements (if any) to the shareholders of the Renewal Funds, and the periodic updating of the registration statement, prospectuses, statements of additional information, and other reports and documents for the Renewal Funds that are required to be filed by the Trust with the SEC and other regulatory and governmental bodies, and (vi) monitor anticipated purchases and redemptions of the shares (including Creation Units) of the Renewal Funds by shareholders and new investors;
• the nature, extent and quality of all of the services (including advisory, administrative and compliance services) that have been provided by Global X Management or made available to the Renewal Funds; and
• the quality of Global X Management’s resources and personnel that would continue to be made available to the Renewal Funds, including Global X Management’s experience and the professional qualifications of Global X Management’s key personnel.
Based on these considerations, the Board concluded that it was satisfied with the nature, extent and quality of the services provided to the Renewal Funds by Global X Management.
Performance
The Board considered the performance of each Renewal Fund. They examined the performance of the Renewal Funds for the one-year, three-year, five-year and since-inception periods, as applicable. Also, the Board considered the total return and investments performance of the Renewal Funds relative to (i) the performance of unaffiliated comparable ETFs and/or other registered funds, which performance information is publicly available from such registered funds, as well as other third party sources; and (ii) the performance of pertinent indexes. The Board considered instances of under-performance and over-performance with respect to the competitor funds. The Board also considered the Renewal Funds’ tracking against their underlying indexes in absolute terms.
Based on these considerations and comparisons, the Board concluded that the investment performance of the Renewal Funds did not adversely affect the Board’s approval of the continuance of the Renewal Agreements.
APPROVAL OF INVESTMENT ADVISORY AGREEMENT (UNAUDITED)
220
Cost of Services and Profitability
The Board considered Global X Management’s cost to provide investment management, supervision and administrative and related services to the Renewal Funds. In this regard, the Board considered the management fee (“Management Fee”) that has been borne or is expected to be borne by the Renewal Funds under the Renewal Agreements for the various investment advisory, supervisory and administrative services that the Renewal Funds require under a unitary fee structure (including the types of fees and expenses that are not included within the unitary fee and would be borne by the Renewal Funds).
In addition, the Board considered expected profitability to Global X Management, as applicable, from all services provided or expected to be provided to the Renewal Funds and all aspects of Global X Management’s relationship with the Renewal Funds. In connection with these considerations, Global X Management provided the Board with financial information regarding its operations and the services provided to the Renewal Funds and discussed with the Board its current and expected, as applicable, profitability with respect to the Renewal Funds.
Based on these considerations, the Board concluded that the Management Fee rate paid by the Renewal Funds to Global X Management, in light of the nature, extent and quality of the services provided, was reasonable and in the best interests of the Renewal Funds’ shareholders.
Comparison of Fees and Services
With respect to this factor, the Board considered:
• comparative information with respect to the Management Fee paid to Global X Management by the Renewal Funds. In connection with this consideration, Global X Management provided the Board with comparative expense data for the Renewal Funds, including fees and expenses paid by unaffiliated similar specialized and/or focused ETFs and/or other comparable registered funds. The Board considered the Global X Management’s detailed explanation of the fee structures of any Renewal Fund that was above the average or median for its peer group;
• the structure of the unitary Management Fee (which includes as one component the investment advisory fee for the Renewal Funds) and the current total expense ratios for the Renewal Funds. In this regard, the Board took into consideration that the purpose of adopting a unitary Management Fee structure for the Renewal Funds was to create a simple, all-inclusive fee that would provide a level of predictability with respect to the overall expense ratio (i.e., the total fees) of the Renewal Funds and that the proposed Management Fees for the Renewal Funds were set at a competitive levels to make the Renewal Funds viable in the marketplace; and
APPROVAL OF INVESTMENT ADVISORY AGREEMENT (UNAUDITED)
221
• that, under the unified Management Fee structure, Global X Management is responsible for most ordinary expenses of the Renewal Funds, including the costs of various third-party services required by the Renewal Funds, including investment advisory, administrative, audit, certain custody, portfolio accounting, legal, transfer agency and printing costs, but that the Renewal Funds would bear other expenses not covered under the proposed all-inclusive Management Fee, such as taxes, brokerage fees, commissions, and other transaction expenses, interest expenses, and extraordinary expenses.
Based on these considerations, the Board concluded that the services received and the fees charged under the Renewal Agreements were reasonable on a comparative basis.
Economies of Scale
With respect to this factor, the Board considered:
• the extent to which economies of scale would be realized as the Renewal Funds grow and whether the unitary Management Fee for the Renewal Funds reflected these economies of scale;
• the significant investment of time, personnel and other resources that Global X Management has made and intends to continue to make in the Renewal Funds in order to seek to assure that the Renewal Funds are attractive to investors; and
• that the unitary Management Fee would provide a high level of certainty as to the total level of expenses for the Renewal Funds and their shareholders.
Based on these considerations, the Board concluded that the unitary Management Fee for the Renewal Funds appropriately addressed economies of scale.
Other Benefits
In considering the Renewal Agreements, in addition to the factors above, the Board considered any other benefits realized by Global X Management as a result of its relationships with the Renewal Funds and concluded that, in the exercise of the Board’s business judgement, all information the Board considered supported approval of the continuation of the Renewal Agreements.
Conclusion
After full consideration of the factors above, as well as other factors that were instructive in its consideration, the Board, including all of the Trust’s Independent Trustees voting separately, concluded, in the exercise of its business judgement, that the Renewal Agreements were fair and reasonable and in the best interest of each Renewal Fund.
APPROVAL OF INVESTMENT ADVISORY AGREEMENT (UNAUDITED)
222
In reaching this decision, the Board did not assign relative weights to the factors above nor did the Board deem any one factor or group of them to be controlling in and of themselves. Each member of the Board may have assigned different weights to the various factors.
SUPPLEMENTAL INFORMATION (UNAUDITED)
223
NAV is the price per Share at which a Fund issues and redeems Shares. It is calculated in accordance with the standard formula for valuing mutual fund shares. The “Market Price” of a Fund generally is determined using the midpoint between the highest bid and the lowest offer on the stock exchange on which the Shares of the Fund are listed for trading, as of the time that the Fund’s NAV is calculated. The Fund’s Market Price may be at, above or below its NAV. The NAV of a Fund will fluctuate with changes in the market value of the Fund’s holdings. The Market Price of a Fund will fluctuate in accordance with changes in its NAV, as well as market supply and demand. Premiums or discounts are the differences (expressed as a percentage) between the NAV and Market Price of a Fund on a given day, generally at the time NAV is calculated. A premium is the amount that a Fund is trading above the reported NAV, expressed as a percentage of the NAV. A discount is the amount that a Fund is trading below the reported NAV, expressed as a percentage of the NAV. Further information regarding premiums and discounts is available on the Funds’ website at www.globalxetfs.com
NOTES
224
605 Third Avenue, 43rd Floor New York, NY 10158
1-888-493-8631 www.globalxetfs.com
Investment Adviser and Administrator: Global X Management Company LLC
605 Third Avenue, 43rd Floor New York, NY 10158
Distributor:
SEI Investments Distribution Co. One Freedom Valley Drive
Oaks, PA 19456
Sub-Administrator: SEI Investments Global Funds Services
One Freedom Valley Drive Oaks, PA 19456
Counsel for Global X Funds and the Independent Trustees:
Stradley Ronon Stevens & Young, LLP 2000 K Street, N.W.
Suite 700 Washington, DC 20006-1871
Custodian and Transfer Agent: Brown Brothers Harriman & Co.
40 Water Street Boston, MA 02109
Independent Registered Public Accounting Firm:
PricewaterhouseCoopers LLP Two Commerce Square
Suite 1800 2001 Market Street
Philadelphia, PA 19103
This information must be preceded or accompanied by a current prospectus for the Funds described.