Globalisation and inequality. Year 2, Lecture 1 Douglas McWilliams Mercers School Memorial Professor of Commerce Gresham College. C entre for economics and business research ltd Unit 1, 4 Bath Street, London EC1V 9DX - PowerPoint PPT Presentation
Globalisation and inequality Year 2, Lecture 1 Douglas McWilliams Mercers School Memorial Professor of Commerce Gresham College Centre for economics and business research ltd Unit 1, 4 Bath Street, London EC1V 9DX t: 020 7324 2850 f: 020 7324 2855 e: [email protected]w: www.cebr.com
Transcript
Globalisation and inequality
Year 2, Lecture 1Douglas McWilliams
Mercers School Memorial Professor of Commerce Gresham College
Centre for economics and business research ltd
Unit 1, 4 Bath Street, London EC1V 9DXt: 020 7324 2850 f: 020 7324 2855 e: [email protected] w: www.cebr.com
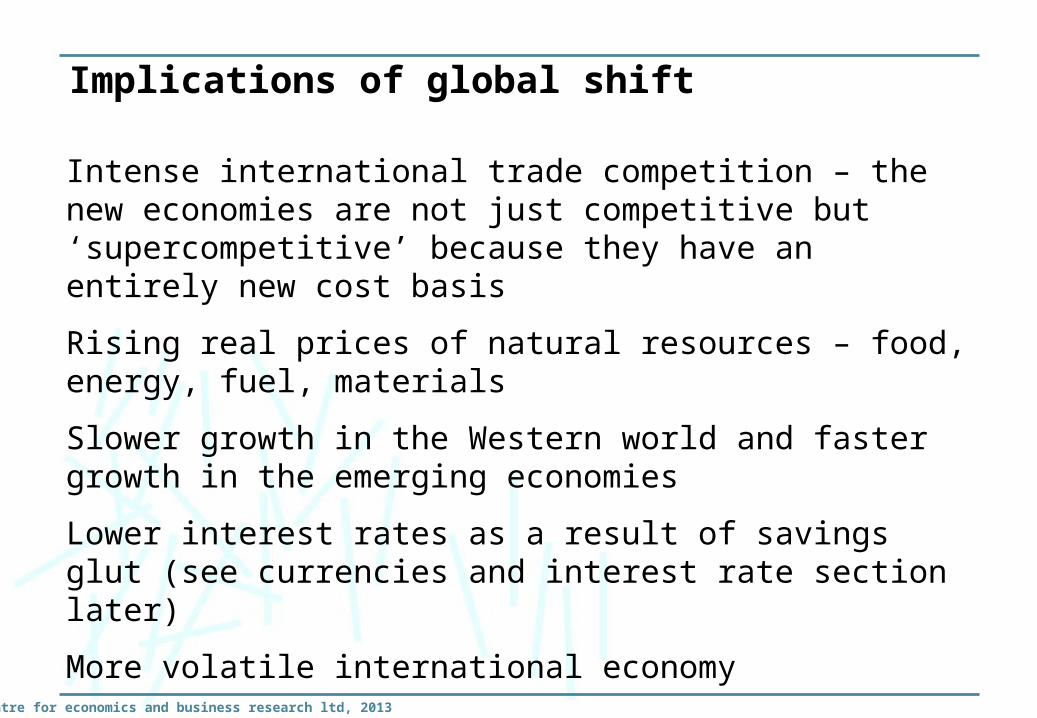
Intense international trade competition – the new economies are not just competitive but ‘supercompetitive’ because they have an entirely new cost basis
Rising real prices of natural resources – food, energy, fuel, materials
Slower growth in the Western world and faster growth in the emerging economies
Lower interest rates as a result of savings glut (see currencies and interest rate section later)
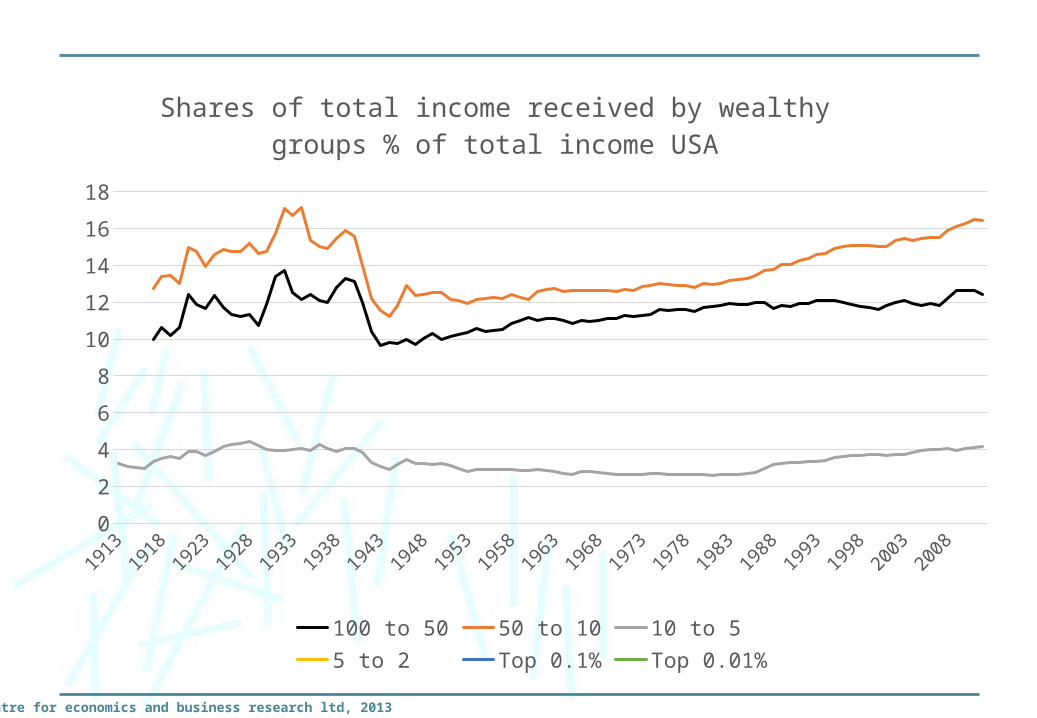
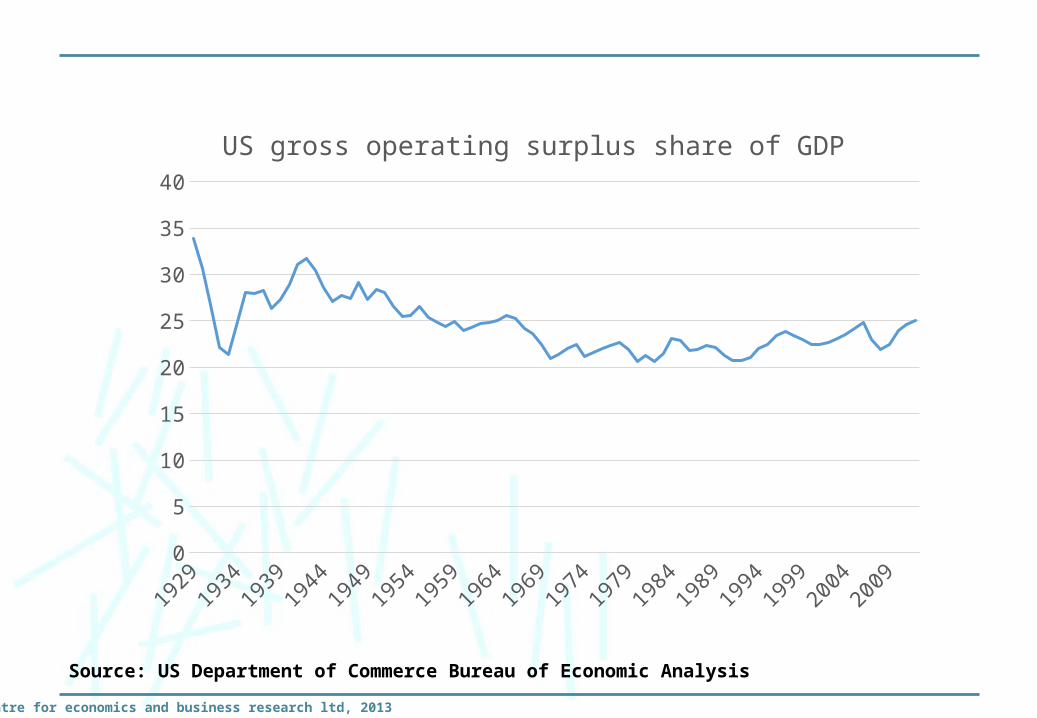
Source: US Department of Commerce Bureau of Economic Analysis
the prospects service
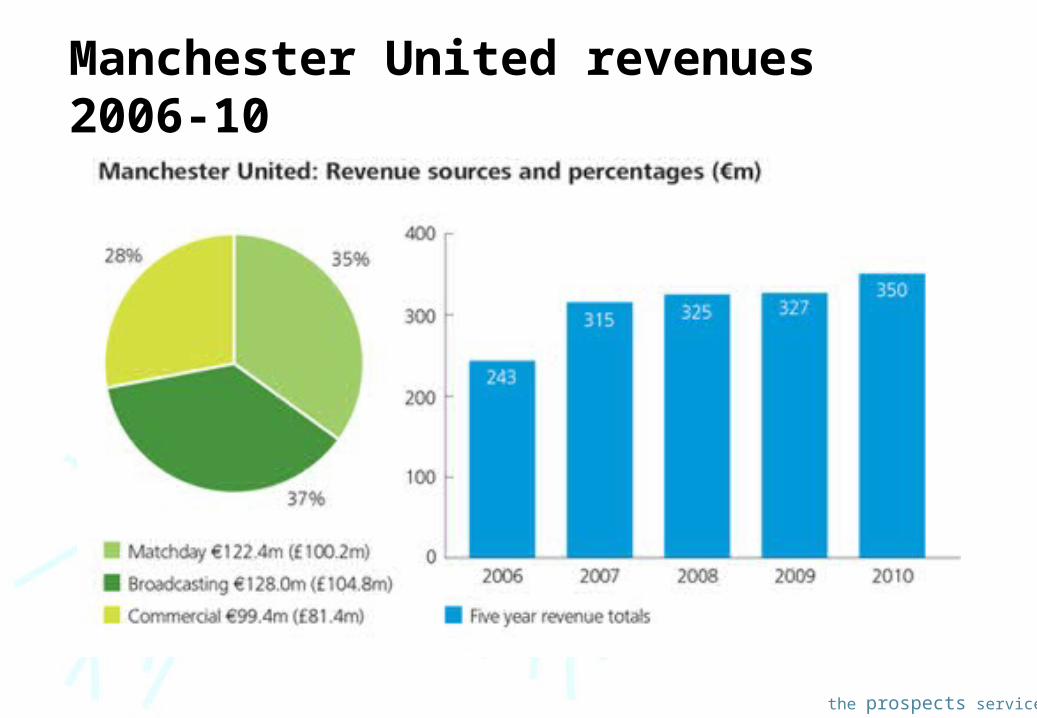
Manchester United revenues 2006-10
the prospects service
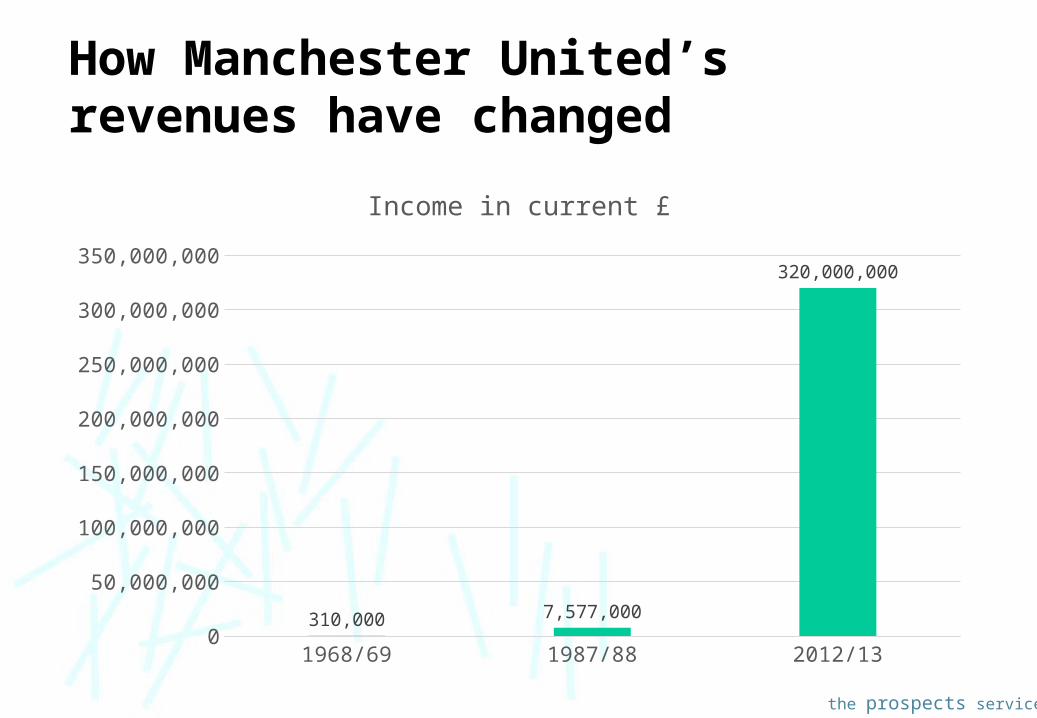
How Manchester United’s revenues have changed
1968/69 1987/88 2012/130
50,000,000
100,000,000
150,000,000
200,000,000
250,000,000
300,000,000
350,000,000
310,000 7,577,000
320,000,000
Income in current £
the prospects service
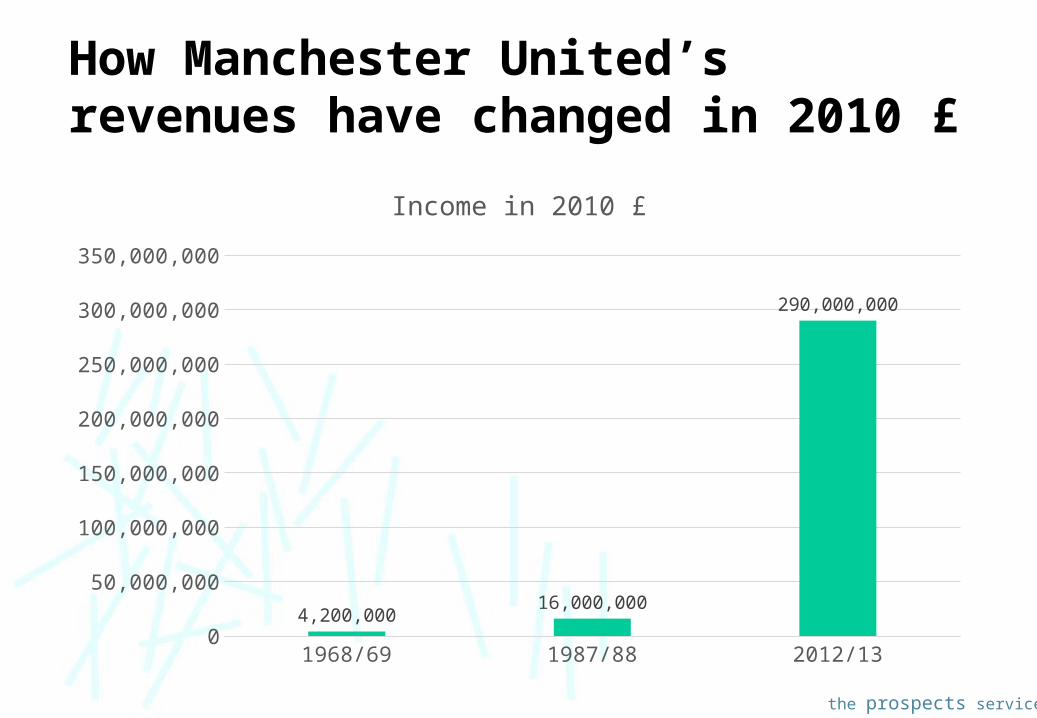
How Manchester United’s revenues have changed in 2010 £
1968/69 1987/88 2012/130
50,000,000
100,000,000
150,000,000
200,000,000
250,000,000
300,000,000
350,000,000
4,200,00016,000,000
290,000,000
Income in 2010 £
the prospects service
0
5,000
10,000
15,000
20,000
25,000
30,000
35,000
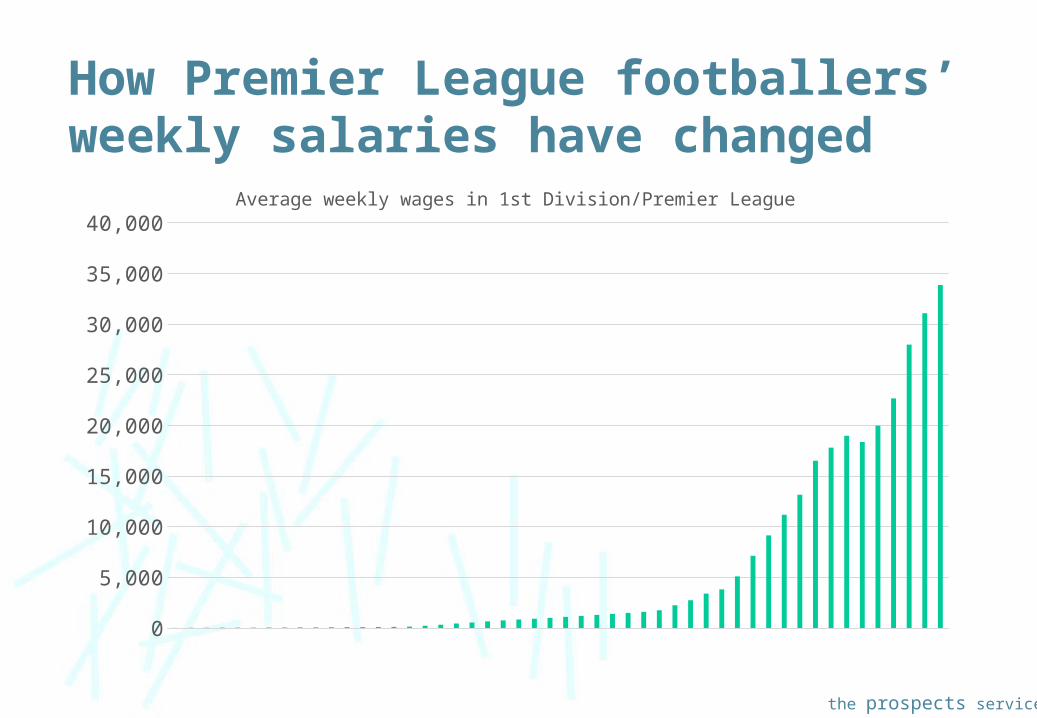
40,000Average weekly wages in 1st Division/Premier League
How Premier League footballers’ weekly salaries have changed
the prospects service
Average earnings Lower league Top league0
1,000
2,000
3,000
4,000
5,000
6,000
7,000
8,000
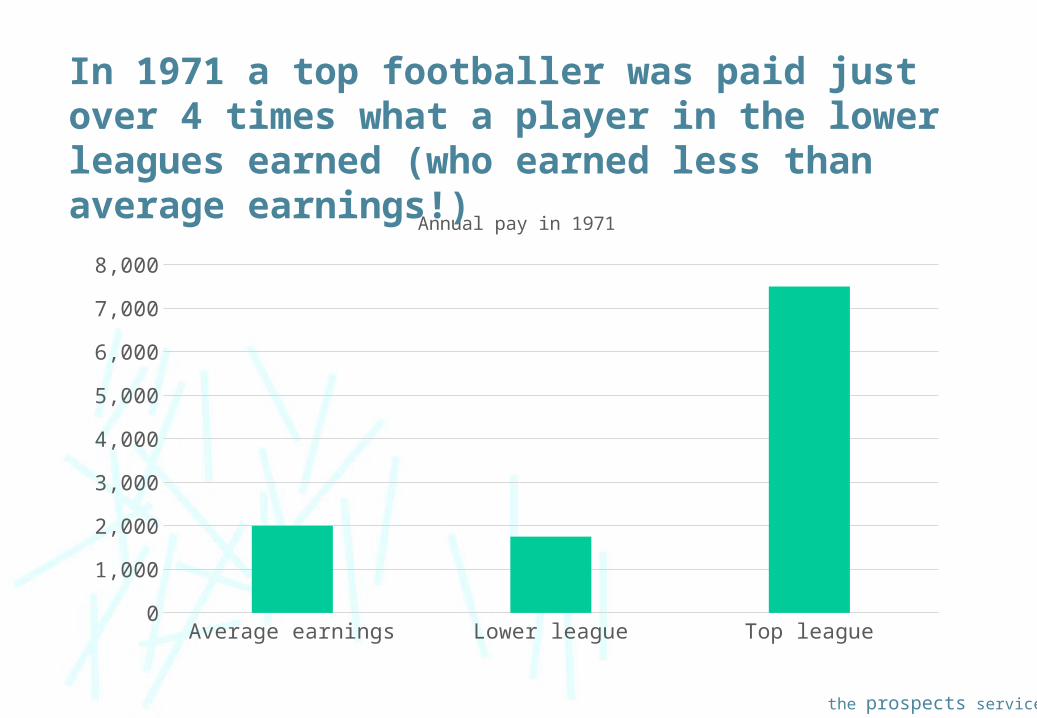
Annual pay in 1971
In 1971 a top footballer was paid just over 4 times what a player in the lower leagues earned (who earned less than average earnings!)
the prospects service
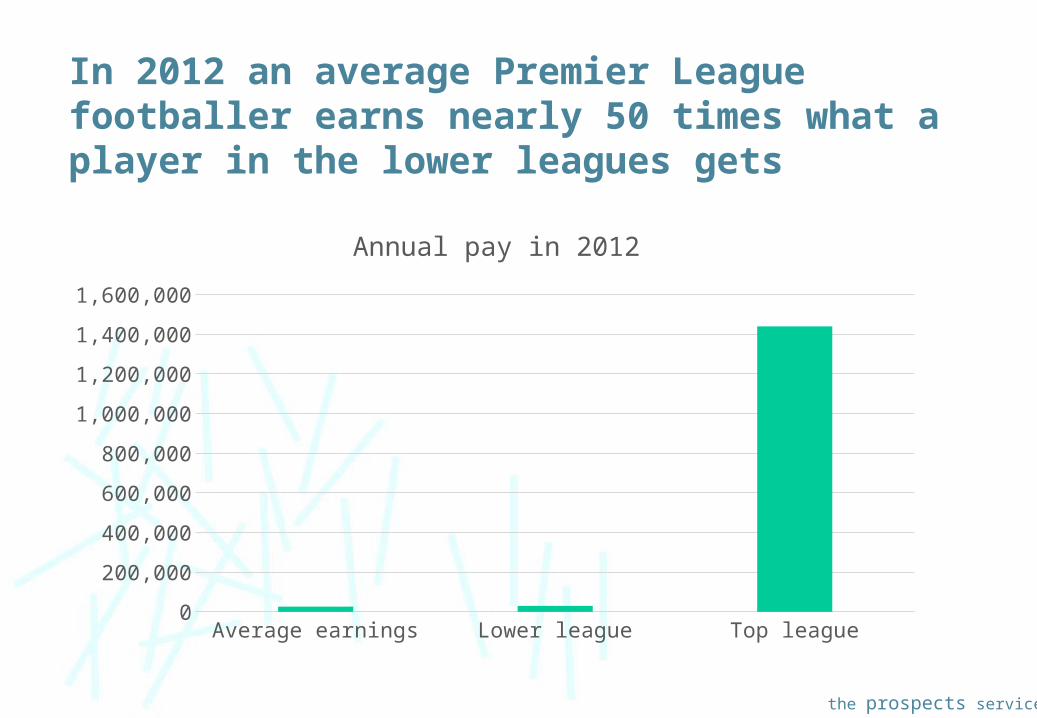
In 2012 an average Premier League footballer earns nearly 50 times what a player in the lower leagues gets
Average earnings Lower league Top league0
200,000
400,000
600,000
800,000
1,000,000
1,200,000
1,400,000
1,600,000
Annual pay in 2012
the prospects service
the prospects service
According to Brookings, the millennium anti-poverty goal may already have been achieved
Source: ‘Poverty in Numbers: The Changing State of Global Poverty from 2005 to 2015’
Laurence Chandy and Geoffrey Gertz, The Brookings Institution, January 2011
the prospects service
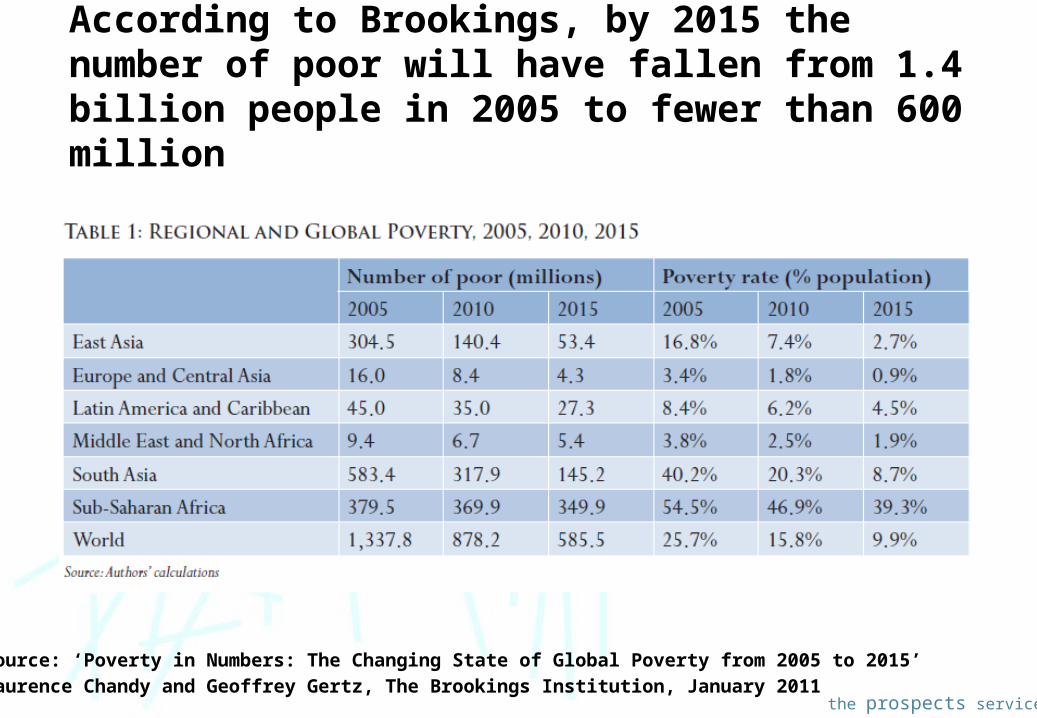
According to Brookings, by 2015 the number of poor will have fallen from 1.4 billion people in 2005 to fewer than 600 million
Source: ‘Poverty in Numbers: The Changing State of Global Poverty from 2005 to 2015’
Laurence Chandy and Geoffrey Gertz, The Brookings Institution, January 2011
the prospects service
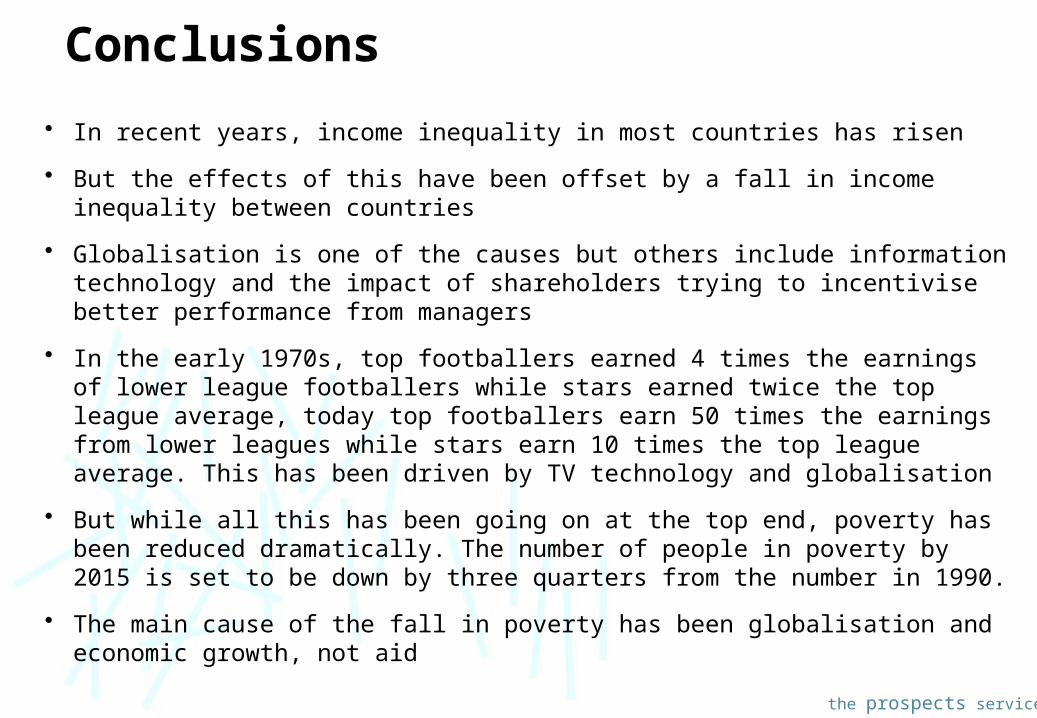
Conclusions
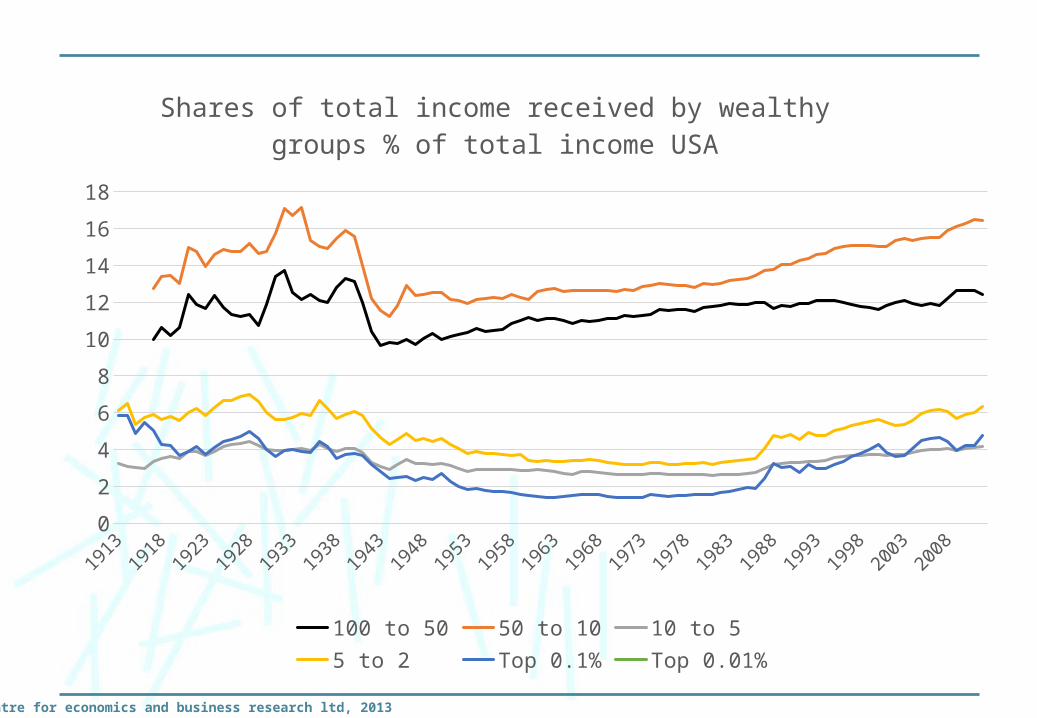
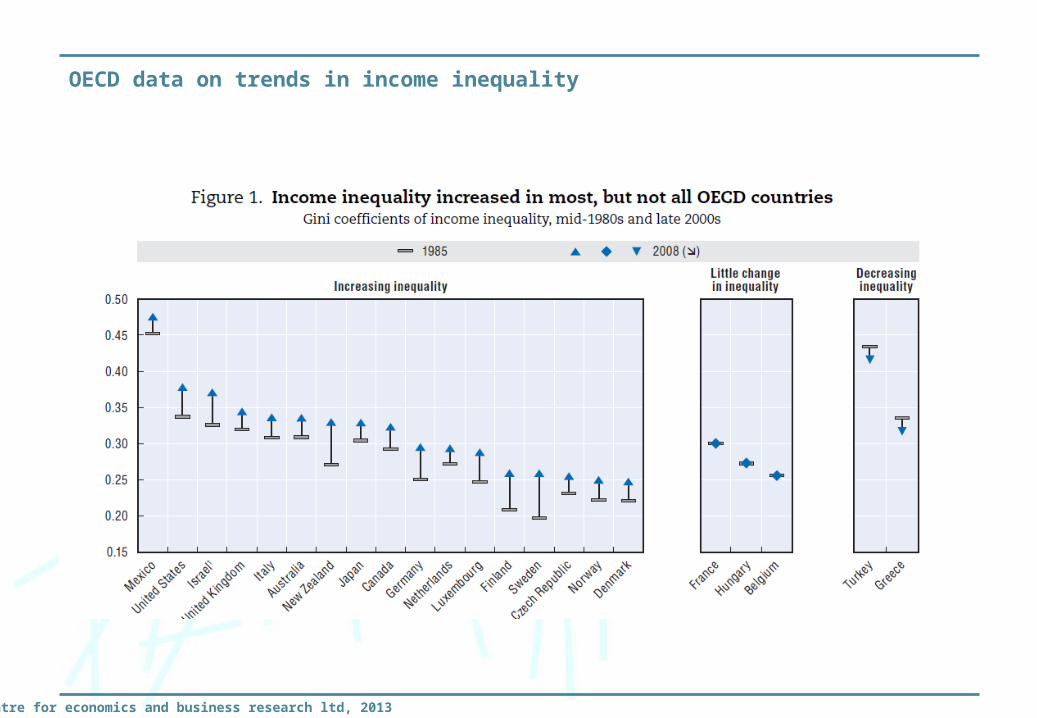
• In recent years, income inequality in most countries has risen
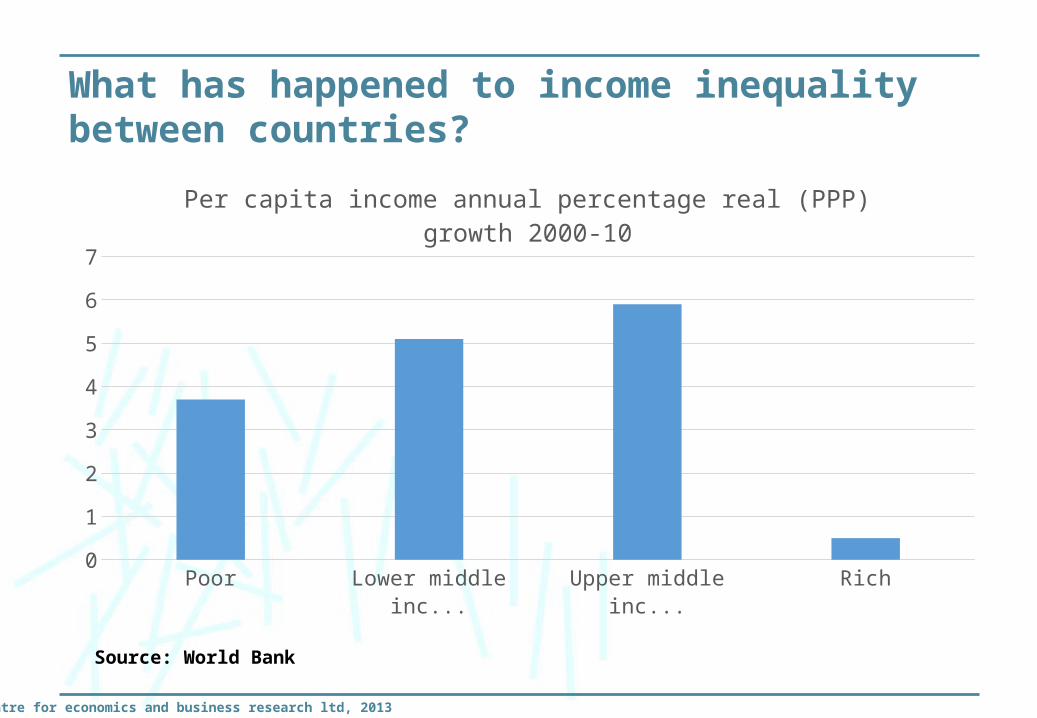
• But the effects of this have been offset by a fall in income inequality between countries
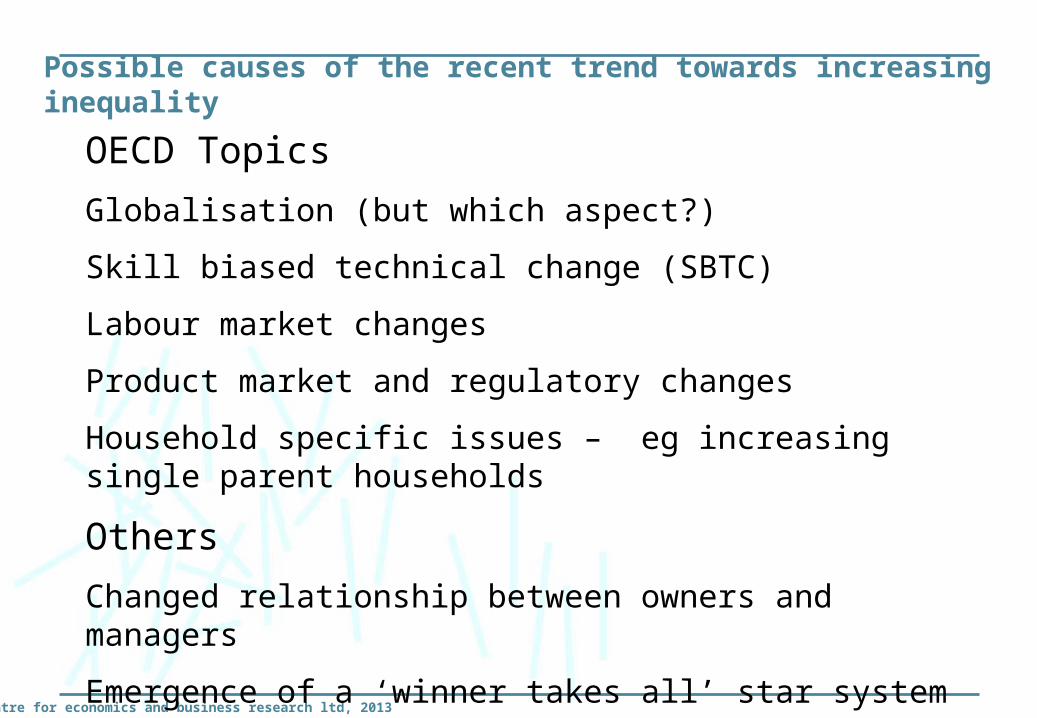
• Globalisation is one of the causes but others include information technology and the impact of shareholders trying to incentivise better performance from managers
• In the early 1970s, top footballers earned 4 times the earnings of lower league footballers while stars earned twice the top league average, today top footballers earn 50 times the earnings from lower leagues while stars earn 10 times the top league average. This has been driven by TV technology and globalisation
• But while all this has been going on at the top end, poverty has been reduced dramatically. The number of people in poverty by 2015 is set to be down by three quarters from the number in 1990.
• The main cause of the fall in poverty has been globalisation and economic growth, not aid
the prospects service
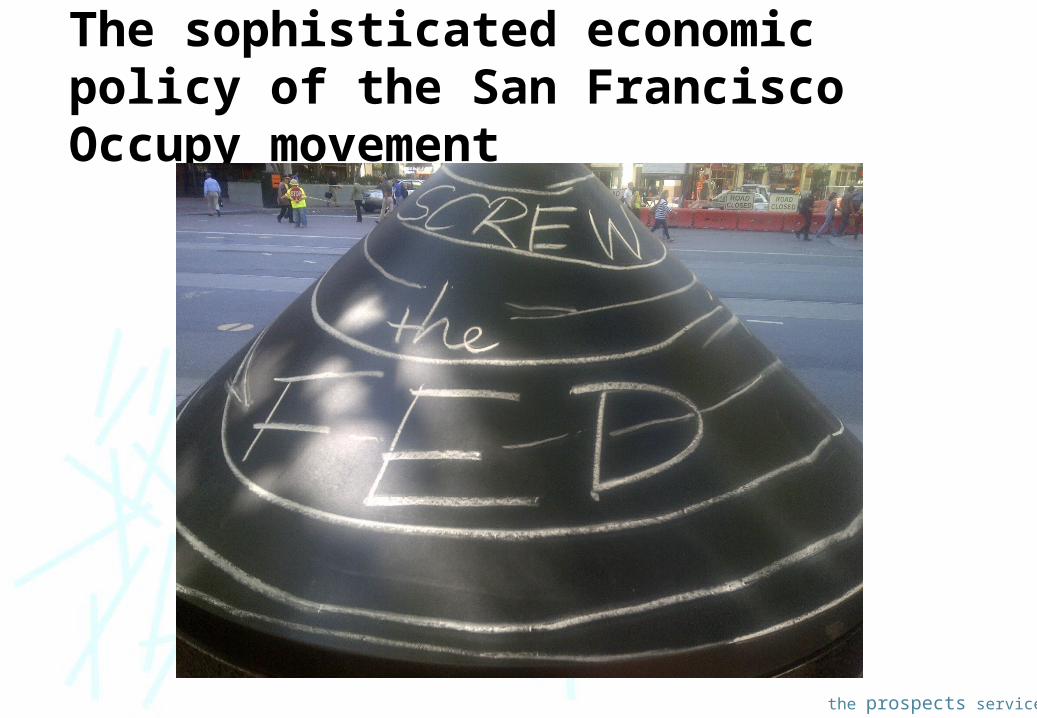
The sophisticated economic policy of the San Francisco Occupy movement
the prospects service
Globalisation and inequality
Douglas McWilliams, Mercers’ School Memorial Professor of Commerce at Gresham College and Chief Executive of Cebr