Globalisation, EU Enlargement and Income Distribution Published in : International Journal of Public Policy (IJPP), Vol. 6, Issue 1/2, 2010, pp. 16-34. Fritz Breuss Europainstitut and Department of Economics at the Vienna University of Economics and Business Administration (WU-Wien), Vienna, Austria Austrian Institute of Economic Research (WIFO), Vienna, Austria E-mail: [email protected]Abstract: Advanced industrial countries have been exhibiting a steady decline of the labor income shares in the last two decades. We explain this phenomenon by resorting to the old Stolper-Samuelson theorem. The conclusions concerning the impact of free trade on the income distribution are unambiguous in a Heckscher-Ohlin world with two countries, two goods and two factors of production (capital and labor). In contrast, the consequences of FDI from the capital abundant country (EU) to the labor abundant CEEC are ambiguous. Both scenarios are investigated theoretically and then simulated with a hypothetical two country CGE model, including the EU and the CEEC. A panel regression for both regions separately, helps to decide empirically which influences on the development of the labor income shares are at work. Globalization, measured by revealed comparative advantage (increase in global net trade) has contributed to a decline in the labor income shares in the EU. Additionally, those countries which are engaged more in trade with the CEEC can expect a sharper decline in the wage share. Global net FDI outflow also exerts a negative influence on the labor income share in the EU. In the CEEC the increase in global net trade had a positive influence on the labor income share, trade with the EU, however, dampened the labor income share. FDI inflow increased the labor income share in the CEEC. Keywords: Globalization; EU Enlargement; Income distribution. Reference to this paper should be made as follows: Breuss, F. (2008) ‘Globalization, EU Enlargement and Income Distribution’, Int. J. Public Policy, Vol. xxx, pp. xxx. Biographical notes: Fritz Breuss is Jean Monnet Professor for Economics of European Integration at the Vienna University of Economics and Business Administration (WU-Wien). He teaches international economics and international finance as well as European Integration. In teaching as well as in research, the major field of interest is European Integration. Numerous articles and books deal with the issue of the economic effects of EU integration.
Transcript
Globalisation, EU Enlargement and Income Distribution
Published in :
International Journal of Public Policy (IJPP), Vol. 6, Issue 1/2, 2010, pp. 16-34.
Fritz Breuss Europainstitut and Department of Economics at the Vienna University of Economics
and Business Administration (WU-Wien), Vienna, Austria Austrian Institute of Economic Research (WIFO), Vienna, Austria E-mail: [email protected] Abstract: Advanced industrial countries have been exhibiting a steady decline of the
labor income shares in the last two decades. We explain this phenomenon by resorting to the old Stolper-Samuelson theorem. The conclusions concerning the impact of free trade on the income distribution are unambiguous in a Heckscher-Ohlin world with two countries, two goods and two factors of production (capital and labor). In contrast, the consequences of FDI from the capital abundant country (EU) to the labor abundant CEEC are ambiguous. Both scenarios are investigated theoretically and then simulated with a hypothetical two country CGE model, including the EU and the CEEC. A panel regression for both regions separately, helps to decide empirically which influences on the development of the labor income shares are at work. Globalization, measured by revealed comparative advantage (increase in global net trade) has contributed to a decline in the labor income shares in the EU. Additionally, those countries which are engaged more in trade with the CEEC can expect a sharper decline in the wage share. Global net FDI outflow also exerts a negative influence on the labor income share in the EU. In the CEEC the increase in global net trade had a positive influence on the labor income share, trade with the EU, however, dampened the labor income share. FDI inflow increased the labor income share in the CEEC.
Keywords: Globalization; EU Enlargement; Income distribution.
Reference to this paper should be made as follows: Breuss, F. (2008) ‘Globalization, EU Enlargement and Income Distribution’, Int. J. Public Policy, Vol. xxx, pp. xxx.
Biographical notes: Fritz Breuss is Jean Monnet Professor for Economics of
European Integration at the Vienna University of Economics and Business Administration (WU-Wien). He teaches international economics and international finance as well as European Integration. In teaching as well as in research, the major field of interest is European Integration. Numerous articles and books deal with the issue of the economic effects of EU integration.
1
1 Introduction
‘Globalization and Inequality’ stands high on the agenda of research of many international
institutions in their world economic outlooks. Recently, the International Monetary Fund (IMF,
2007A, 2007B) dealt with this topic repeatedly in its World Economic Outlooks. In the April
2007 issue of the World Economic Outlook (IMF, 2007A, chapter 5), the International Monetary
Fund states that, “over the past two decades, there has been a continued decline in the share of
income that accrues to labor, especially in Europe and Japan. The income share of workers in
unskilled sectors has dropped strongly while that of workers in skilled sectors has generally
made small gains.” The IMF (2007A) is primarily focusing on the question how the ongoing
globalization of the labor market has affected compensation and employment in the advanced
economies. The effective global labor force has risen fourfold over the past two decades. This
growing pool of global labor is being accessed by advanced economies through various channels,
including imports of final goods, off shoring of the production of intermediates, and immigration.
The ongoing globalization of labor has contributed to rising labor compensation in advanced
economies by boosting productivity and output, while emerging market countries have also
benefited from rising wages. Nevertheless, globalization is one of several factors that have acted
to reduce the share of income accruing to labor in advanced economies, although rapid
technological change has had a bigger impact, especially on workers in unskilled sectors. The
analysis finds that countries that have enacted reforms to lower the cost of labor to business and
improve labor market flexibility have generally experienced a smaller decline in the labor income
share.
The IMF (2007A) in its chapter on “The Globalization of Labor” is particularly interested in
the following questions in a broad approach, considering a large sample of advanced economies
and a full range of transmission channels (competing imports of final products, off shoring of
intermediate products, and immigration): (i) How rapidly has the global labor supply grown, and
which channels of labor globalization have been most important? (ii) To what extent can recent
trends in labor shares and labor compensation in advanced economies be explained by the
changing global labor supply relative to other factors such as technological change and labor
market reform? Has the impact been different in skilled and unskilled sectors? (iii) Which
2
policies can help the advanced economies meet the challenges of further labor market
globalization?
We focus on one stylized fact of this overall picture of globalization, namely the continued
decline in the labor income shares in the European countries over the past two decades. In
contrast to the IMF study, we concentrate more on trade and FDI and not on labor migration. The
reason is that labor migration within the enlarged EU is handicapped by transitional
arrangements. After outlining some stylized facts on the income distribution in Western and
Eastern European countries, we start with theoretical explanations for these phenomena by
resorting to the traditional Heckscher-Ohlin framework and in particular to the Stolper-
Samuelson theorem. Within this theoretical context we also make simulations with a two-country
CGE model, considering the EU as a capital abundant country and the Central and Eastern
European countries (CEEC) as the labor abundant country. We simulate the consequences of free
trade on the income distribution as well as those of FDI from the EU in the CEEC. As even the
simple theoretical H-O framework not always results in unambiguous conclusions, we test our
hypotheses with a panel-econometric approach.
2 Stylized facts of income distribution
In the last two decades the advanced economies experienced a steady decline in the labor income
shares (see the documentation in IMF (2007A) and OECD (2007)). However, there are
differences. The decline in the labor income shares have been more pronounced in some Western
European countries (Austria, Germany, Finland, Italy, the Netherlands, Spain and Sweden) with a
decline from 1970 to 2006 by 3 to 11 percentage points, with EU-15 at 3.2 and the USA at 4.5
percentage points (see Figure 1a). The other advanced countries (see Figure 1b) exhibited
declines smaller than 3 percentage points; some countries even increased their wage shares (e.g.
Belgium, Japan, Portugal and Luxembourg).
In Eastern Europe or the new EU member states, there are available only shorter time series to
measure the functional income distribution. Even in the CEEC - contrary to the expectation for a
region which is primarily labor abundant - the labor income shares did not increase, but in many
occasions we also find a similar picture as that in the advanced economies (see Figure 2).
Between 1995 and 2006, the largest decline exhibited Latvia (-12 ½ percentage points, followed
3
by Slovenia (-9.2 pp), Bulgaria (-8.4 pp), Poland (-7.8 pp) and Estonia (-7.3 pp). In the other
countries there were only minimal declines or some increases (e.g. Cyprus, Lithuania and Malta).
< Figure 1a about here >
< Figure 1b about here >
< Figure 2 about here >
3 Free trade and income distribution in the Stolper-Samuelson context
In order to explain the phenomenon of declining labor income shares – primarily in the advanced
economies – we refer to the Stolper-Samuelson theorem (Stolper and Samuelson, 1941),
henceforth abbreviated with S-S. This paper was the first to demonstrate the Heckscher-Ohlin (H-
O) theorem in a two goods, two countries, two factors (capital and labor) model. The H-O
theorem shows that with identical technologies at home and abroad, the country with the larger
endowment of capital relative to labor should export the capital intensive good. By the same
reasoning, the country with the larger endowment of labor relative to capital should export the
labor intensive good. Although we know from the many attempts to test the H-O theory,
demonstrating that the Heckscher-Ohlin theorem holds empirically has proven a lot trickier than
anyone expected, but the bottom line is that it is extremely helpful for thinking about trade
between countries with widely different capital labor ratios. The major result of the S-S theorem
was to confirm the intuitive analysis of Ohlin about who wins and who loses when a country
opens up to trade. The answer is that the relatively abundant factor gains and the relatively scarce
factor lose, not only in nominal terms but also in real terms. Thus if capital is the relatively
abundant factor (compared to the trading partner), then the liberalization of trade will result in an
increase in the return on capital more than proportionately compared to the price of either good,
whereas the wage rate will fall relative to the price of either good. Admittedly, many of the
simple 2x2x2 results do not generalize so easily where there are more factors and more goods but
they do typically go through in a weaker sense, and the broad intuition remains critical in helping
us understand how trade affects welfare.
We study the S-S effects of European’s mini globalization in two steps, namely the income
distributional effects of trade liberalization and those of factor movements.
4
(i) First we study the consequences of the liberalization of trade between the EU and the
CEEC since 1989. In the frame work of the asymmetrical tariff reductions with the Europe
Agreements (EAs) the bilateral trade between the EU and the CEEC was liberalized, starting in
1997. Via EU enlargement in 2004 and 2007 the former CEECs were integrated fully into the
enlarged customs union of the EU.
(ii) Second we study the possible consequences of the ongoing process of direct investments
from the old to the new EU member states.
Whereas the distributional effects of the trade liberalization are a clear-cut result of the S-S
theorem, the implications of FDIs are not so simple.
In order to demonstrate the S-S theorem we start with the following assumptions. There are
two regions – EU15 (EU) and 12 new EU member states (CEEC). The EU is capital abundant,
the CEEC is labor abundant. Two goods are produced in both countries – good 1 (cars, produced
capital intensively), good 2 (textiles, produced labor intensively). The EU as the capital abundant
country has a comparative advantage in the production (and export) of the capital intensive good
1(cars = C); the CEEC as the labor abundant country has a comparative advantage in the
production (and export) of the labor intensive good 2 (textiles = T). The assumptions concerning
the different factor abundance in the EU and CEE are not only fictitious, but real. Although there
are no reliable and comparable data on the capital stocks in CEEC, the relative labor abundance
in CEEC is manifested in the low wage levels relative to those in the EU, a relationship
sometimes in the order of 1:10 (see Eurostat, 2007, p. 180).
Zero profit conditions in each industry imply the following price equations,
waraP LCKCC += (1)
waraP LTKTT += , (2)
where CP and TP are the prices of cars and textiles respectively, w is the wage rate paid on labor
and r is the rental rate on capital. ija are the unit input coefficients, denoting the amount of
factor i (capital, K and labor, L ) required for unit output of good j (cars, C and textiles, T ).
< Figure 3 about here >
From the price equations (1) and (2) one can derive the wage-rental combinations for both
industries (see Figure 3). Assuming that car industry is capital intensive and the textile industry is
5
labor intensive ( LTKTLCKC aaaa // > ) the wage-rental curve generating zero profits in the car
industry is flatter (thick line) than those in the textile industry (broken line). The only wage-rental
combination that can simultaneously support zero profit in both industries is found at the
intersection of the two zero-profit lines, in point E. This point represents the equilibrium wage
and rental rates that would arise in an H-O model when the price of cars is CP and the price of
textiles is TP .
We assume unchanged input coefficients ija . Then, a move from autarky (tariff-ridden
scenario) to free trade raises the (relative) price of the capital intensive good (C, cars). The price
increase causes an outward parallel shift in the thick zero-profit line for cars as shown in Figure
1. The equilibrium point will shift from E to F causing an increase in the equilibrium rental rate
from 1r to 2r , and a decrease in the equilibrium wage rate from 1w to 2w .
This gives the Stolper-Samuelson theorem: An increase in the price of a good will cause an
increase in the price of the factor used intensively in that industry and a decrease in the price of
the other factor.
For the mathematical derivation we proceed as follows: When CP alone changes, we have by
differentiating equation (1)
1=∂∂+
∂∂
CLC
CKC P
wa
P
ra (3)
and by differentiating equation (2)
0=∂∂+
∂∂
CLT
CKT P
wa
P
ra . (4)
Putting both together, we have
=
∂∂∂∂
0
1
C
C
LTKT
LCKC
P
wP
r
aa
aa. (5)
Assuming that at the initial equilibrium, good C is relatively more capital intensive, i.e.
LTKTLCKC aaaa // > . Then we get
0>−
=∂∂
LCKTLTKC
LT
C aaaa
a
P
r (6)
and
6
0<−
−=∂∂
LCKTLTKC
KT
C aaaa
a
P
w. (7)
These results are the mathematical statement of the Stolper-Samuelson theorem.
As Dixit-Norman (1980, p 54) point out, an even stronger conclusion is possible using the
elasticity of r with respect to CP . By Euler’s Theorem from equation (1) we have raP KCC > ,
and using (6), we get for the capital intensive good in the capital abundant country EU
1>−
=∂∂
LCKTLTKC
LTKC
C
Caaaa
aa
P
r
r
P. (8)
As a mirror image one can derive the equivalent elasticity result for the Stolper-Samuelson
Theorem in the case of a change of TP for the labor abundant country CEEC. As assumed the
CEEC has a comparative advantage in the labor intensive good. The elasticity of w with respect
to the price of good T, TP is higher than one.
The Stolper-Samuelson theorem was originally derived to analyze the effects of a tariff on
factor prices in the context of the H-O model. More generally, however, the theorem tells us the
effects on factor prices for any change in the price of an output good for whatever reason. Such
price changes can occur as a country opens up to free trade, as growth and investment affect a
country’s endowments, and many other things.
4 FDI and income distribution in theory
After opening-up of Eastern Europe following the break-down of Communism in 1989 and also
after the EU enlargement in 2004 and 2007 the old EU member states protected their labor
markets (with a few exceptions like Ireland, Sweden and UK) with seven years transitional
arrangements concerning the free movement of labor. Therefore the case of migration of labor is
not of interest in our analysis. We concentrate on the other part of the factor movements. Since
1989 direct investments (FDIs) of Western companies in the CEECs experienced a boom. The
CEEC abolished existing barriers for capital imports in order to open up for fresh capital to renew
its capital stock.
There are at least two possibilities to analyze the effects of FDI abroad. The simple approach
implicitly assumes that the income accruing to the capital invested stays in the country where it
7
was invested. Normally, the income accruing to direct investment will be received in the
investing country. In practice this may not happen at once, but over time. The theoretical analysis
in the context of a Heckscher-Ohlini framework of the effects of FDI follows closely Dixit and
Norman (1980, pp. 142-146) in his duality approach, i.e. modeling consumer behavior by means
of expenditure or indirect utility functions, and producer behavior by means of cost, revenue or
profit functions.
Suppose the home country (in our case the EU) starts with a vector 0v of factor endowments,
and the foreign country (in our case the CEEC) starts with 0V . Then the EU invests a vector ξ in
the CEEC, yielding factor inputs to production ξ−= 0vv and ξ+= 0VV in the two countries.
EU’s income is the value of its own output, represented by the revenue function ),,1( vpr plus the
income ξW earned by its direct investment in the CEEC, ),,1( VPRW v= being the vector of
factor prices there. The income of the foreign country is the value of its output, ),,1( VPR , minus
the amount ξW paid for the services of factors ξ . Both revenue functions depend on the product
price vectors p ( P ) and the factor input vectors v (V ) in both countries. Both expenditure
functions - e ( E ) – depend on the product price vectors p ( P ) and on utility u (U ) in both
countries. Taking all together, this yields the international equilibrium conditions
International equilibrium is characterized by a national income identity for each country
(equations (9) and (10)), and market-clearing equations for the goods for the two countries taken
together, in equation (11). The equation (9) and (10) equate expenditures - e ( E ) - on the left
hand side with incomes - r ( R) plus/minus income from investing in CEEC - on the right hand
side, in both countries. Equation (11) clears all goods market, in home and abroad, by equating
the demand for goods pe ( PE ) with their supplies - pr ( PR ).
Consider a slight change ξd in ξ . Taking total differentials,
dWWddvrdprduedpe vpup ξξ +++=+ (12)
dWdWdVRdPRdUEdPE VPUP ξξ −−+=+ (13)
8
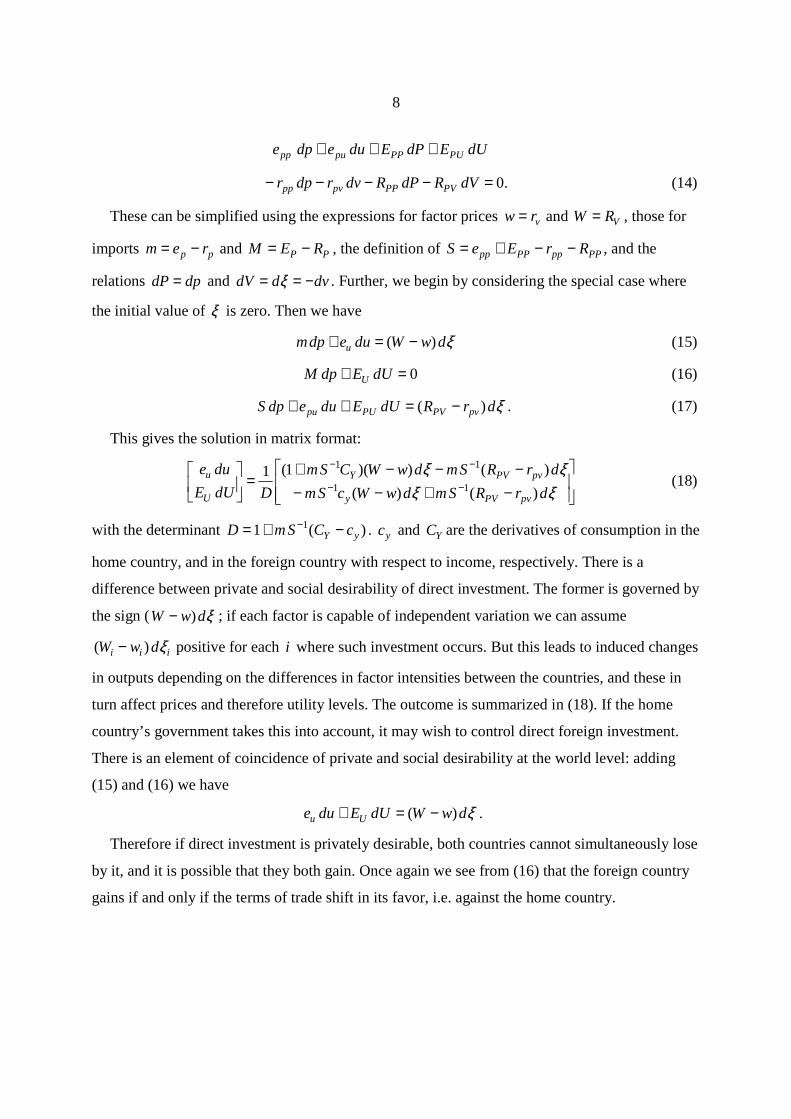
dUEdPEduedpe PUPPpupp +++
.0=−−−− dVRdPRdvrdpr PVPPpvpp (14)
These can be simplified using the expressions for factor prices vrw = and VRW = , those for
imports pp rem −= and PP REM −= , the definition of PPppPPpp RrEeS −−+= , and the
relations dpdP = and dvddV −== ξ . Further, we begin by considering the special case where
the initial value of ξ is zero. Then we have
ξdwWduedpm u )( −=+ (15)
0=+ dUEdpM U (16)
ξdrRdUEduedpS pvPVPUpu )( −=++ . (17)
This gives the solution in matrix format:
−+−−−−−+
=
−−
−−
ξξξξ
drRSmdwWcSm
drRSmdwWCSm
DdUE
due
pvPVy
pvPVY
U
u
)()(
)())(1(111
11
(18)
with the determinant )(1 1yY cCSmD −+= − . yc and YC are the derivatives of consumption in the
home country, and in the foreign country with respect to income, respectively. There is a
difference between private and social desirability of direct investment. The former is governed by
the sign ( ξdwW )− ; if each factor is capable of independent variation we can assume
iii dwW ξ)( − positive for each i where such investment occurs. But this leads to induced changes
in outputs depending on the differences in factor intensities between the countries, and these in
turn affect prices and therefore utility levels. The outcome is summarized in (18). If the home
country’s government takes this into account, it may wish to control direct foreign investment.
There is an element of coincidence of private and social desirability at the world level: adding
(15) and (16) we have
ξdwWdUEdue Uu )( −=+ .
Therefore if direct investment is privately desirable, both countries cannot simultaneously lose
by it, and it is possible that they both gain. Once again we see from (16) that the foreign country
gains if and only if the terms of trade shift in its favor, i.e. against the home country.
9
Equation (18) is illustrated in the case where there are only two goods, and only one factor is
moving from the home country to the foreign country. Assuming 0>D , and private desirability,
i.e. ( 0) >− wW , we have the condition for the home country to benefit
0)( <
∂−∂
−−+
p
wW
wW
ppcmS y , (C home)
while for the foreign country to benefit we need
0)( >
∂−∂
−−
p
wW
wW
ppCm Y . (C abroad)
The interpretation is not simple. Dixit-Norman (1980, p. 144-145) work out the results for
special cases. But these cases do not generalize. Lastly one is left without clear qualitative
conclusions. Calculations of effects of direct investment would have to be made for specific case,
using the formula (18).
We did a numerical calculation for reasonable parameter settings and get the following results
for one special case with the following parameterization: 1=p ; 7.0=W ; 5.0=w ; 0.1=yc ;
4.0=YC ; 5.1−=m ; 5.0=S ; the elasticity of the wage rate differential with respect to prices is
0.5. It follows that the condition for home (C home) to benefit from FDI outflows is -0.25 and
that for abroad (C abroad) to benefit from FDI inflow is 0.15. From the assumed pararmeter
constellation the value for the determinant is 8.2=D , equation (18) results in the following
changes of utility: 32.2=du in home and 68.2=dU in foreign. Hence, both countries would
benefit from the factor movements of capital from home (EU) to foreign (CEEC), given that the
earnings of this direct investment are repatriated to the investing country (EU). However, each
other parameterization could lead to other outcomes.
Because of this theoretical ambiguity we first make simulations with a two country
computable general equilibrium (CGE) model with fictitious parameterization and then we test
the theoretical predictions with a panel econometric approach.
5 Free trade, FDI and income distribution in a two-country CGE model
In order to quantify the effects of free trade and FDI on income distribution we apply a fictitious
symmetric two country, two factors of production and two goods computable general equilibrium
(CGE) model. The basic set-up of calibration is taken from Breuss (2003, appendix 4.1:
10
Heckscher-Ohlin model). We interpret this symmetric CGE world as existing of two countries,
the EU and the CEEC. The former is relatively capital abundant (capital is 150 units; labor 100
units) and the latter is relatively labor abundant (capital 100 units; labor 150 units), leading to a
mirror-inverted two country world. In the baseline both countries are tariff-ridden, i.e. both
countries impose a 10 percent ad valorum tariff on their imported goods. One could also start
with an autarky scenario. This, however, is not very realistic when portraying the situation of the
opening up of Eastern Europe since 1989. The tariff-ridden scenario results in the following
factor price relation: wages are higher in the EU ( CEECEU ww > ), whereas the rates for renting
capital are lower in the EU ( CEECEU rr < ). The differential in the capital rental rates inspires EU
firms to invest directly in the CEEC. We do not only look at the factor prices but on the
consequences for the labor income shares in particular. The labor income (or wage) share is
calculated as the wage sum (wage rate multiplied by the number of workers) relative to GNI
(including factor income from FDI from abroad), which is the most common indicator of
functional income distribution.
We consider on the one hand the change from a tariff-ridden situation to free trade. On the
other hand we consider FDI flows out of the EU to the CEEC because of the differential in
capital rents. FDI outflows from the CEEC are – for the time being – negligible and, hence are
not considered here. We assume that 25 units of capital are invested by EU firms in the CEEC.
This reduces the capital stock in EU down to 125 and increases capital in CEEC up to 125. As in
the theoretical specification in the previous chapters, we assume that the income of the capital
invested in the CEEC is repatriated to the EU.
Overall, we consider four scenarios.
S1) Baseline is the tariff-ridden economies in EU and CEEC;
S2) Tariff-ridden plus FDI from EU to CEEC;
S3) Free trade (without FDI);
S4) Free trade plus FDI from EU to CEEC.
The results are collected in Table 1 and can be summarized as follows:
1) The free trade scenario yields the Stolper-Samuelson (S-S) results: Comparing the free trade
scenario (S3) with the tariff-ridden scenario (S1), in the capital abundant EU nominal and real
rental prices increase. The labor income share goes down by 5.8 percentage points, utility
11
increases. In the labor abundant CEEC we also get the Stolper-Samuelson effects: nominal and
real wage rates increase and utility improves; the labor income share goes up by 5.8 percentage
points. Overall, in this symmetric two-country world the change from protectionism to free trade
leads to total factor price equalization. Wage rates decrease (increase) in the EU (CEEC) to
0.543. Rental rates of capital increase (decrease) in the EU (CEEC) to 0.543, respectively. The
assumed symmetry of the CGE model is reflected in the mirror-inverted results concerning the
changes of factor prices and utility.
2) The FDI scenarios are – as expected theoretically - not so clear-cut, as far as the S-S effects
are concerned and also concerning the performance of utility.
2a) Comparing the tariff-ridden plus FDI scenario (S2) with the tariff-ridden scenario (S1) we get
as a net result the FDI effects in a tariff ridden environment. In this scenario one receives clear S-
S effects in the EU, but not in the CEECs. In the EU, nominal and real rental rates of capital
increase (S-S effect), but the labor income share and also utility decline considerably. In the
CEEC, surprisingly nominal and real wages decline and also the labor income share goes down.
However, utility improves.
2b) Comparing the free trade plus FDI scenario (S4) with the tariff-ridden plus FDI scenario (S2),
in the EU we get the theoretically plausible S-S effects and a decline of the labor income share by
5.5 percentage points and a deterioration of utility. In the CEEC we also get the S-S effects in
factor prices, an increase in the labor income share and an improvement in utility.
2c) Comparing the scenarios (S4) with (S3) we get as a net result the FDI effects under free trade.
In the EU, again we get the S-S effects on factor prices as well as the expected decline in the
labor income share; also utility declines considerably. In the CEEC, the S-S effects are
implausibly negative and also the labor income share declines. However, utility improves
strongly.
< Table 1 about here >
6 Econometric evidence on the implications of free trade and FDI on income distribution
The theory – at least in the framework of Heckscher-Ohlin – is unambiguous concerning the
effects of free trade on factor prices. The resulting labor income share is usually the consequence
12
of a complicated general equilibrium process. In countries which have comparative advantages in
capital intensive goods (in our case we subsume the whole block of the EU countries to be
relatively capital abundant) under free trade their rental price of capital will increase. That means
that the labor income share in GNI declines. In countries with comparative advantages in labor
intensive goods (in our case we assume that the country block of the CEEC is relatively labor
abundant) when opening up to free trade their wages will increase. Usually, this implies that also
the labor income share in GNI increases. These factor changes in relation to price changes are the
classical Stolper-Samuelson effect described above. Whereas the S-S results are clear-cut in the
case of free trade, the effect of direct investment on the income distribution is not so clear. So we
try to decide empirically which forces are working behind in determining the labor income share
in the EU and in the CEEC, respectively.
We know that the Heckscher-Ohlin world is nicer in theory than in praxis. Therefore we test
the theoretically derived predictions. Accordingly, the capital abundant EU should have suffered
a decline in the labor income share (as a result of the S-S effect), whereas the labor abundant
CEEC should have increased its labor income share. The hypothesis is tested by a panel
regression separately for the member states of the EU and for some of the CEEC over the period
1992-2005 and 1995-2005, respectively.
We estimate the following equations:
For the EU: itititit FDINETEETCNTEcLSE γβα +++= (19)
For the CEEC: itititit FDINETCCTENTCbLSC µηδ +++= , (20)
where )(LSCLSE are the labor income shares of EU and CEEC respectively; )(ti are the
country and time sample included (see Tables 2 and 3). )(NTCNTE are the variables for total
net trade of the EU and CEEC respectively, implying revealed comparative advantages after the
multilateral trade liberalization of the Uruguay Round since 1995. Both net trade variables are
interpreted as “globalization” variables because they relate to trade of both regions with the rest
of the world. )(CTEETC represent the trade shares of the EU with CEEC and the CEEC with
the EU respectively. These variables represent the “mini-globalization” in Europe as a
consequences of the opening-up of Eastern Europe since 1989 and the continuing liberalization of
bilateral trade via the Europe Agreements (EAs) and later via the EU enlargement in 2004 and
13
2007. )(FDINETCFDINETE are the variables for net FDI of the EU with the rest of the world
and the FDI inflow of CEEC respectively. As the FDI outflow of CEEC is negligible we look
only on FDI inflow of CEEC. )(bc are the constants (inclusive the fixed country effects). The
theoretically expected signs of the parameters are as follows: 0<α ; 0>δ ; 0<β ; 0>η ; 0<γ ;
0>µ .
Our test is not only restricted to the hypothetical two-country H-O world as typified in chapter
5. The EU trades primarily with itself (most of its trade is intra-area trade) and with the other
industrial countries and only to a minor degree with the CEEC. Most of the intra-EU trade is
intra-industrial trade, for which – as we know – the H-O model is not the proper explanation.
Therefore we also capture the trade involvement with the CEEC as an extra variable.
< Table 2 about here >
1) The results for the EU: The labor income share decreases – as expected – as a consequence
of globalization in general (see Table 2, first column). The influence is measured by total net
trade of the EUii with the rest of the world (including intra-EU trade). An increase of total net
trade of the EU of one percentage points of GDP decreases the labor income share in the EU by
0.28 percentage points. Also the mini-globalization (the involvement in trade with the CEEC)
results in a decrease of the labor income share. An increase of the share of EU’s trade with the
CEEC by one percentage point decreases the labor income share by 0.14 percentage points.
Globalization in the form of net FDI net outflow also depresses the labor income share in EU. An
increase of the FDI net outflow of the EU of one percentage point of GDP decreases the labor
income share on average by 0.08 percentage points. These results nicely confirm the theoretical
expectations for the EU countries.
2) The results for the CEEC: Here we expect that the labor income share is influenced
positively by overall net trade and also positively by trade with the EU. From Table 2 (second
column) we see that the former is confirmed, whereas the latter is not. Trade with the EU leads to
a decline of the labor income share in the CEEC. We saw that the theory is ambiguous as far as
the effects of income distribution of the FDI inflow into CEEC are concerned. Here, FDI inflow
has a (weak) positive impact on the labor income share in the CEEC.
14
Digression: When testing the short-term changes of the labor income share, depending on
business cycle indicators, like annual GDP growth and the change in the unemployment rate, we
get the following results for our two country blocs EU and CEEE (see Table 3). In our panel for
the EU we get similar results as Marterbauer and Walterskirchen (2003) received for a single
times series analysis for Austria. However, one should admit that the variables GDP growth and
unemployment rate are linked via Okun’s law, and therefore one should expect multicollinearity
when regressing changes in the labor income shares on both variables together. Nevertheless,
both variables have a negative influence on the change in the labor income share (see Table 3,
first column). The negative sign on real GDP growth is interpreted by Marterbauer and
Walterskirchen (2003) as a lagged adjustment of real wages to productivity improvements. And
unemployment exerts a pressure on wage bargaining (like in the Phillips curve); therefore they
get a negative influence also from the change in the unemployment rate. In addition, OECD
(2007, chapter 3) argues that workers became increasingly vulnerable due to the impact of
globalization. That means globalization leads to an erosion of the power of national trade unions.
Whereas these relations hold quite well in the advanced economies of the West (EU), in the case
of the transformation economies of the CEEC all relevant variables are insignificant (see Table 3,
second column). This is not easy to interpret: on the one hand, the time period is shorter as in the
case of the EU. On the other hand wage bargaining may be less influenced by trade unions, which
are probably not yet as strong as in the old EU member states. Rather then the wage level seems
to be set by foreign investors more according to their international performance and less so
depending on the general business cycle considerations in a specific CEEC.
< Table 3 about here >
Besides the mere focus on overall labor income shares in two categories of economies, as we
did so far, there is a large literature on wage inequalities in the context of globalization. Wood
(2002) tries to find a synthesis of at least three theories, explaining the wage inequalities (the
wage gap between skilled and unskilled workers) resulting from globalization: (i) Heckscher and
Ohlin; (ii) Feenstra and Hanson; and (iii) Tang and Wood. Wood (2002, p. 79) summarizes the
main insights of the three theories: Heckscher and Ohlin show how the reduction of barriers to
trade, by causing production in both regions to become more specialized, tends to increase wage
15
inequality in the North and to reduce wage inequality in the South. Feenstra and Hanson show
how the transfer of production activities from the North to the South, by increasing the skill
intensity of output in both regions, tends to widen wage gaps between skilled and unskilled
workers both in the North and in the South. Tang and Wood show how cheaper travel and
communication, by enabling highly skilled Northern workers to co-operate more extensively with
Southern workers, widen the wage gap between highly skilled workers and other Northern
workers.
If one substitutes “North” with “EU” and “South” with “CEEC” we can apply the same
conclusions for the trade relations between East and Western Europe, hence we should expect
similar effects as a result of Europe’s mini-globalization scenario. Some empirical studies have
already dealt with such questions.
Egger and Egger (2002) investigate the effects of outsourcing (measured by intermediate goods
trade in CEEC manufacturing) on real wages in CEEC over the period 1993-1998. In the wage
regressions for a panel of NACE two-digit industries in seven CEEC (Bulgaria, Czech Republic,
Hungary, Poland, Romania, Slovakia and Slovenia) the authors distinguish between final goods trade
and intermediate goods trade at the industry level and find a significantly negative impact of
intermediate goods exports on wages in CEEC manufacturing. In contrast, the effect of intermediate
goods imports is significantly positive.
Onaran and Stockhammer (2006) test the influence of FDI and trade openness on wages in the
CEEC in the post-transition era with a one-digit level panel data for manufacturing industry for five
transitional economies (Czech Republic, Hungary, Poland, Slovakia, Slovenia) over the period 2000-
2004. The results suggest that the increases in productivity are reflected in wages only to a modest
extent, even in the long-term, leading to a steady decline in the share of labor in manufacturing
industry in almost all sub sectors in all countries. Meanwhile, the high significant and negative effect
of unemployment on wages shows that the labor market is characterized by wage flexibility. FDI has
a positive effect on wages only in the capital and skill intensive sectors. The results also show that the
increase in trade with EU did not lead to positive prospects for wages in manufacturing industry,
contrary to the expectations of pro-market policies and traditional trade theory. The long-term net
effect of exports and imports on manufacturing wages is negative, suggesting that integration of
CEEC to EU via trade liberalization have worked at the expense of labor.
16
7 Conclusions
The advanced industrial countries have been exhibiting a steady decline of the labor income
shares in the last two decades. We try to explain this phenomenon by resorting to the old Stolper-
Samuelson theorem. The conclusions of the impact of free trade on the income distribution are
unambiguous. In a Heckscher-Ohlin world the capital abundant EU gains by specializing on
capital intensive goods. As a consequence the factor prices for capital increases and those for
labor decreases, and hence also the labor income share declines. As a mirror image the labor
abundant CEEC should have a comparative advantage in labor intensive goods. The liberalization
of trade between the EU and the CEEC since 1989 should have led to wage increases and capital
rental decreases, and hence to an increase in the labor income share. Both countries gain in terms
of utility by free trade. The consequences of FDI are ambiguous. In the country investing in the
CEEC, the labor income share might decline, whereas it might increase in the CEEC. Utility must
not necessarily increase in both countries; most probably it increases in the CEEC. In order to
decide which channels are working in praxis, panel regressions are undertaken to explain the
declining tendency of labor income shares in the EU and their possible increase in the CEEC.
Globalization, measured by an increase in global net trade (a simple measure of revealed
comparative advantages) has contributed to a decline in the labor income shares in the EU.
Additionally, those countries which are engaged more in trade with the CEEC can expect a
sharper decline in the labor income share. Global net FDI outflow also exerts a negative influence
on the labor income share in the EU. In the CEEC global net trade exerted a positive influence on
the labor income share, trade with the EU, however, decreased it. FDI inflow contributed to an
increase in the labor income share in the CEEC.
17
References Breuss, F. (2003) Reale Außenwirtschaft und Europäische Integration, Frankfurt am Main-
Berlin-New York: Peter Lang Verlag. Dixit, A. and Norman, V. (1980) Theory of International Trade: A dual, general equilibrium
approach, Welwyn-Cambridge: James Nisbet & Co. Ltd. and Cambridge University Press. Egger, H. and Egger, P. (2002), ‘How International Outsourcing Drives Up Eastern European
Wages’, Review of World Economics (Weltwirtschaftliches Archiv), Vol. 138, No. 1, pp. 83-96.
Egger, P., Larch, M. and Pfaffermayr, M. (2007A) ‘On the welfare effects of trade and investment liberalization’, European Economic Review, Vol. 51, Issue 3, April, pp. 669-694.
Egger, P., Larch, M. and Pfaffermayr, M. (2007B) ‘Bilateral versus Multilateral Trade and Investment Liberalisation’, The World Economy, Vol. 30, Issue 4, April, pp. 567-596.
Eurostat (2007) Europe in figures: Eurostat yearbook 2006-2007, Luxembourg. IMF (2007A) World Economic Outlook April 2007: Spillovers and Cycles in the Global
Economy, World Economic and Financial Surveys, International Monetary Fund: Washington, D.C., April.
IMF (2007B) World Economic Outlook October 2007: Globalization and Inequality, World Economic and Financial Surveys, International Monetary Fund: Washington, D.C., October.
Markusen, J. R. (2002) Multinational Firms and the Theory of International Trade, Cambridge, Massachusetts-London: The MIT Press.
Marterbauer, M. and Walterskirchen, E. (2003) ‚Bestimmungsgründe der Lohnquote und der realen Lohnstückkosten’, WIFO-Monatsberichte 2/2003, pp. 151-159.
OECD (2007) OECD Employment Outlook 2007, Paris. Onaran, Ö. and Stockhammer, E. (2006) ‘The effect of FDI and foreign trade on wages in the
Central and Eastern European Countries in the post-transition era: A sectoral analysis’, Vienna University of Economics & B.A. (WU-Wien), Working Paper No. 94, June.
Stolper, W.F. and Samuelson, P.A. (1941) ‘Protection and Real Wages’, The Review of Economic Studies, Vol. 9, November, pp. 58-73.
Wood, A. (2002) ‘Globalization and Wage Inequalities: A Synthesis of Three Theories’, Review of World Economics (Weltwirtschaftliches Archiv), Vol. 138, No. 1, pp. 54-82.
18
Figure 1a Labor income shares1) in advanced economies, 1970-2006 (relatively strong decline)
50
55
60
65
70
75
80
85
1970
1972
1974
1976
1978
1980
1982
1984
1986
1988
1990
1992
1994
1996
1998
2000
2002
2004
2006
EU-15Austria
FinlandSweden
Spain
Italy
USA
Germany
Netherlands
1) Measured as a percent of gross national income (GNI), corrected for the income of other (non employee)
categories of workers in the year 1970. Source: WIFO
19
Figure 1b Labor income shares1) in advanced economies, 1970-2006 (relatively mild decline)
50
55
60
65
70
75
80
85
90
1970
1972
1974
1976
1978
1980
1982
1984
1986
1988
1990
1992
1994
1996
1998
2000
2002
2004
2006
0.0
5.0
10.0
15.0
20.0
25.0
30.0
35.0
Greece
EU-15
UK
Denmark
Belgium
France
Ireland
Japan
Luxembourg Portugal
1) Measured as a percent of gross national income (GNI), corrected for the income of other (non employee)
categories of workers in the year 1970. Source: WIFO
20
Figure 2 Labor income shares1) in transition economies, 1970-2006
40.0
45.0
50.0
55.0
60.0
65.0
70.0
75.0
80.0
85.0
J199
2
J199
3
J199
4
J199
5
J199
6
J199
7
J199
8
J199
9
J200
0
J200
1
J200
2
J200
3
J200
4
J200
5
J200
6
Slovenia
Latvia
Estonia
Slovakia
Cyprus
Poland
Malta
Romania
Hungary
Lithuania
Bulgaria
Czech Republic
1) Measured as a percent of gross national income (GNI), corrected for the income of other (non employee)
categories of workers in the year 1995. Source: WIFO
Figure 3 Wage-rental combinations in the 2 sectors, 2 factors of production Heckscher-Ohlin model in the capital abundant country EU.
E
F
r1
r2
w2 w1
r
. .
PT/aKT
PC/aKC
PC/aLC PT/aLT w
21
Table 1 Free trade and FDI – Stolper-Samuelson effects and implications for income distribution and utility (Simulation results in a stylized two country CGE model) EU CEEC S3–S1 S2-S1 S4-S2 S4-S3 S3–S1 S2-S1 S4-S2 S4-S3 Changes between scenarios Wage rate (w) -0.0985 -0.0006 -0.1035 -0.0055 0.0375 -0.0005 0.0324 -0.0055 Rental rate of capital (r)
Utility 0.48 -11.51 -0.46 -12.45 0.48 6.72 0.43 6.68 Scenarios: S1 =baseline is the tariff-ridden economies in EU and CEEC; S2 = tariff-ridden plus FDI from EU to CEEC; S3 = free trade (without FDI); S4 = free trade plus FDI from EU to CEEC. 1) Deflated in both countries with its export prices (where they have comparative advantages). 2) Labor income (or wage) share, calculated as a percent of gross national income (GNI), including factor income from FDI in CEEC. Source: Own simulations with the CGE-Heckscher-Ohlin model by Breuss (2003, appendix 4.1)
22
Table 2 The determinants of labor income shares in the EU and in the CEEC
R2 (unweighted) Number of observations: Time Countries Total pool observations
0.97 14 16 224
0.89 11 10 110
t-statistic in parenthesis; panel estimation with fixed country effects and with cross-section weights 1) Includes Austria, Belgium, Denmark, Finland, France, Germany, Greece, Ireland, Italy, Netherlands, Portugal,
Spain, Sweden, United Kingdom, and two non-EU industrial counties, like Japan and the USA. Period: 1992-2005; estimates without Japan and USA do alter the coefficients only marginally. 2) Includes Bulgaria, Czech Republic, Estonia, Latvia, Lithuania, Hungary, Poland, Romania, Slovakia and Slovenia. Period: 1995-2005 3) General constant has to be corrected with the country-specific fixed effects (not reported here). 4) Net trade refers to total commodity exports minus total imports in % of GDP. 5) Commondity exports to CEEC or to EU, respectively in % of total exports. 6) FDI net means FDI outflow minus FDI inflow; in the case of CEEC it only refers to FDI inflow. Data sources: (1) Labor income shares: wages as a percent of gross national income (GNI), corrected for the income of other
(nonemployee) categories of workers in the year 1970 (in the case of EU) and in the year 1995 (in the case of CEEC); calculations by Wifo based on data from the AMECO database of the European Commission
(2) Net trade: OECD: Foreign trade monthly statistics (FTMS). (3) Trade with CEEC (with EU): OECD: Foreign trade monthly statistics (FTMS). (4) FDI net: SourceOECD, OECD Factbook 2007 and National Accounts statistics (interactive).
23
Table 3 The determinants of the change in labor income shares in the EU and in the CEEC
Dependent variable: Change in labor income shares EU1) CEEC2) Constant3) 0.43
(2.89) -0.27 (-0.59)
GDP growth in %4) -0.29 (-5.51)
-0.04 (-0.37)
Change in unemployment rate -0.47 (-4.78)
-0.11 (-0.74)
R2 (unweighted) Observations: Time Countries Total pool observations
0.17 13 16 208
0.04 11 10 104
t-statistic in parenthesis; panel estimation with fixed country effects and with cross-section weights 1) Includes Austria, Belgium, Denmark, Finland, France, Germany, Greece, Ireland, Italy, Netherlands, Portugal,
Spain, Sweden, United Kingdom, and two non-EU industrial counties, like Japan and the USA. Period: 1992-2005; estimates without Japan and USA do alter the coefficients only marginally. 2) Includes Bulgaria, Czech Republic, Estonia, Latvia, Lithuania, Hungary, Poland, Romania, Slovakia and Slovenia. Period: 1995-2005 3) General constant has to be corrected with the country-specific fixed effects (not reported here). Data source: AMECO database of the European Commission.
Notes i Departing from general equilibrium with full competition on gets even more complex results. This is demonstrated by Markusen (2002) with a variety of capital knowledge models with imperfect competition and the distinction between skilled and unskilled labor. The implications for income distribution depend on the configuration of the models (vertical or horizontal type multinational companies) and can vary considerably. When extending the Markusen-type models on tree countries and three factors of production the palette of results concerning the income distribution is even larger (see such exercises for the three-factors knowledge and physical capital model of trade and multinational activity by Egger, Larch and Pfaffermayr (2007A, 2007B). ii The results are nearly unchanged when excluding Japan and the USA from the sample.