The ‘center of excellence’ FIW (http://www.fiw.ac.at/), is a project of WIFO, wiiw, WSR and Vienna University of Economics and Business, University of Vienna, Johannes Kepler University Linz on behalf of the BMWFW FIW – Working Paper Globalisation, Structural Change and Labour Productivity Growth in BRICS Economy Jagannath Mallick 1 Globalisation, has intensified the demand preference for quality labour, that embodies more knowledge and competency/skill to maximise the production in one hand, and it has also changed the life style and consumption behavior of the society on the other. As a consequence, this has led to significant changes in the composition and structure of the economy, and also, the reallocation of labour. The study examines the reallocation effect (or structural change) and the direct effect of globalization on labour productivity growth in BRICS countries. The study also examines the relative role of consumption factors and other factors for the structural development during globalization. The study uses shift–share analysis, dynamic panel data method and input-output tables for the empirical analysis during 1990-91 to 2011-12. The findings show that the contribution of structural change is relatively significant in China and India. The globalization measures including international trade and FDI are found to have significant impact on the upsurge of labour productivity growth in BRICS, where the consumption demand predominates among the factors of structural development. JEL : F1, J01, J08, J34, R1 Keywords: Globalisation, FDI, Trade, Labour productivity, Structural Change, BRICS 1 University of Pardubice, Czech Republic, E-Mail: [email protected]Abstract The authors FIW Working Paper N° 141 February 2015
Transcript
The ‘center of excellence’ FIW (http://www.fiw.ac.at/), is a project of WIFO, wiiw, WSR and Vienna University of Economics and Business, University of Vienna, Johannes Kepler University Linz on behalf of the BMWFW
FIW – Working Paper
Globalisation, Structural Change and Labour Productivity Growth in BRICS
Economy
Jagannath Mallick1
Globalisation, has intensified the demand preference for quality labour, that embodies more knowledge and competency/skill to maximise the production in one hand, and it has also changed the life style and consumption behavior of the society on the other. As a consequence, this has led to significant changes in the composition and structure of the economy, and also, the reallocation of labour. The study examines the reallocation effect (or structural change) and the direct effect of globalization on labour productivity growth in BRICS countries. The study also examines the relative role of consumption factors and other factors for the structural development during globalization. The study uses shift–share analysis, dynamic panel data method and input-output tables for the empirical analysis during 1990-91 to 2011-12. The findings show that the contribution of structural change is relatively significant in China and India. The globalization measures including international trade and FDI are found to have significant impact on the upsurge of labour productivity growth in BRICS, where the consumption demand predominates among the factors of structural development. JEL : F1, J01, J08, J34, R1 Keywords: Globalisation, FDI, Trade, Labour productivity, Structural Change,
BRICS
1 University of Pardubice, Czech Republic, E-Mail: [email protected]
Abstract
The authors
FIW Working Paper N° 141 February 2015
Globalisation, Structural Change and Labour Productivity Growth in BRICS Economy
Jagannath Mallick
Senior Researcher University of Pardubice, Czech Republic
Abstract: Globalisation, has intensified the demand preference for quality labour, that embodies more knowledge and competency/skill to maximise the production in one hand, and it has also changed the life style and consumption behavior of the society on the other. As a consequence, this has led significant changes in the composition and structure of the economy, and also, the reallocation of labour. The study examines the reallocation effect (or structural change) and the direct effect of globalization on labour productivity growth in BRICS countries. The study also examines the relative role of consumption factors and other factors for the structural development during globalization. The study uses shift–share analysis, dynamic panel data method and input output tables for the empirical analysis during 1990-91 to 2011-12. The findings show that the contribution of structural change is relatively significant in China and India. The globalization measures including international trade and FDI are found to have significant impact on the upsurge of labour productivity growth in BRICS, where the consumption demand predominates among the factors of structural development. JEL Classifications: F1, J01, J08, J24, R1 Keywords: Globalisation, FDI, Trade, Labour productivity, Structural Change, BRICS
I. Introduction The emerging economies have embarked on various globalization measures, since early 1990’s in order to integrate with the rest of the world (OECD, 2009). There is a substantial reduction of trade barriers in the recent decades, for instance a drastic decline in the average applied tariffs on non-agricultural products. Globalisation influences the economy directly and indirectly. The globalization has facilitated technology transfer, contributed to efficiencies in the production and also increased FDI flows and trade substantially. For instance, the inflow of FDI brings advanced technology to host economies, which enhances labour productivity growth as a measure of competitiveness in the modern sectors, in one hand. On the other hand, the globalization changes the life style of society, which affects the consumption pattern and preference of consumers. As a result the demand for output of modern economic activities has been increased over the periods. Hence, the productivity differentials across the industries, and also changing pattern of consumption demand, make the labour to relocate from low productivity sectors or industries to high productivity sectors, which is called structural change in the economic development literature.
Developing economies are characterized by large productivity gaps between different sectors of the economy, which is emphaised by W. Arthur Lewis (1954) in the dual economy model. This gaps are expected to be much larger in developing countries than in advanced economies, and reduce the overall labor productivity. The movement of labor and other resources from agriculture to modern economic activities pushes overall productivity and expands income. The hypothesis that structural change is an important source of growth and productivity improvement is a central tenet of the growth accounting literature (Maddison, 1987). In this context, Kuznets (1979) states that “it is impossible to attain high rates of growth of per capita or per worker product without commensurate substantial shift in the shares of various sectors”. Hence, the structural change could be a measure component of high growth, particularly in case of the emerging countries.
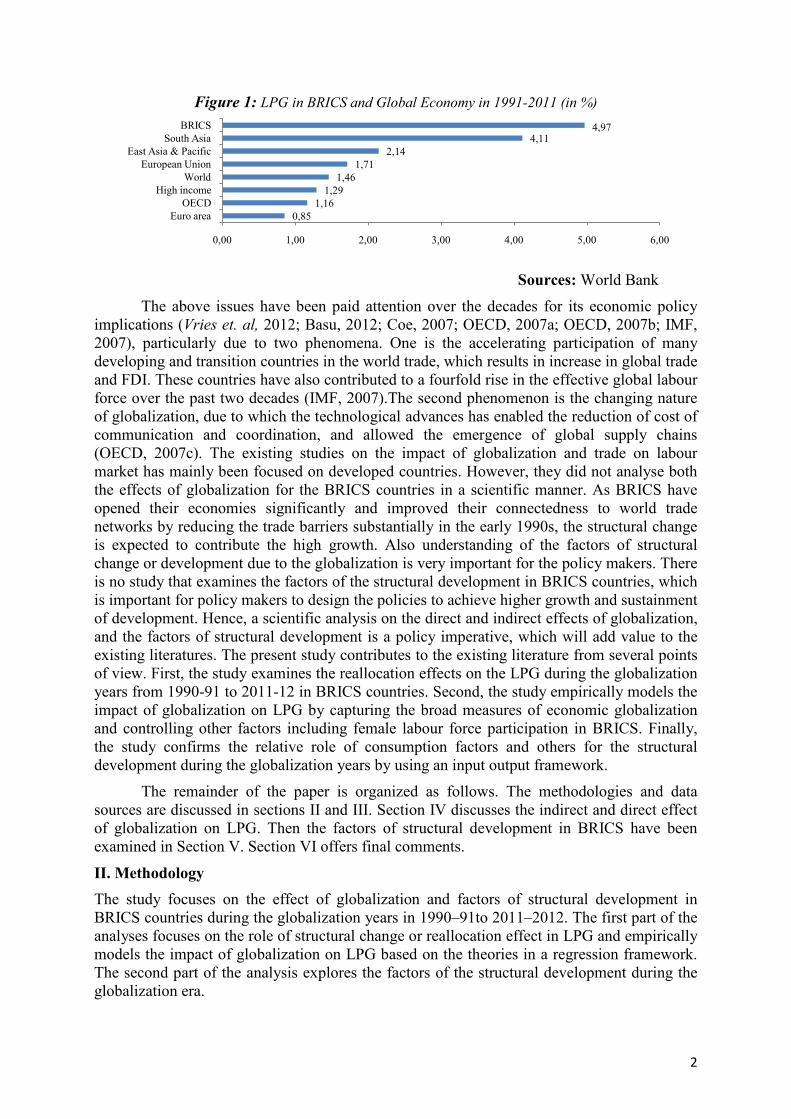
The World Bank data shows, there is a huge gap in the level of labour productivity between BRICS (Brazil, Russia, India, China and South Africa) countries and the major group of countries such as OECD, high income, Euro area and European union. The most importantly, the labour productivity starts rising in BRICS, since they integrated with the global economy in early 1990s (see, appendix figure A1). The figure 1 shows that the annual average of labour productivity growth (LPG) in BRICS (5 percent) is higher than the major group of countries during 1991-92 to 2011-12. Such high growth of productivity in BRICS countries could be attributed to the pressure of globalization, economic integration and changing pattern of consumption, which has changed the production patterns, and led to the change in the pattern of allocation of production factors and increase in the demand for labour in higher productivity sectors. Hence, labour moves from lower productivity sector to higher productivity sectors. The activities of developing countries are initially concentrated in agriculture sector, which is low productive in nature. Due to globalisation, labour has relocated to non-agricultural sector i.e., industrial and service sector activities, which is evidenced in terms of the employment share (see, appendix table A1). This is to be noted that, the advanced countries experience different patterns of allocation of production factors as they are in the stage of post-industrial phases. The labour in the advanced countries reallocates to the most productive sector of the economy, mostly the service sector. Hence the employment share in the service sector increases at the cost of both agricultural and industrial sector employment in the advanced countries. This structural change has effect on the productivity growth, which is called between effects on productivity. Hence, it is crucial to understand how the productivity growth is influenced directly and indirectly by globalization in the emerging countries.
2
Figure 1: LPG in BRICS and Global Economy in 1991-2011 (in %)
Sources: World Bank
The above issues have been paid attention over the decades for its economic policy implications (Vries et. al, 2012; Basu, 2012; Coe, 2007; OECD, 2007a; OECD, 2007b; IMF, 2007), particularly due to two phenomena. One is the accelerating participation of many developing and transition countries in the world trade, which results in increase in global trade and FDI. These countries have also contributed to a fourfold rise in the effective global labour force over the past two decades (IMF, 2007).The second phenomenon is the changing nature of globalization, due to which the technological advances has enabled the reduction of cost of communication and coordination, and allowed the emergence of global supply chains (OECD, 2007c). The existing studies on the impact of globalization and trade on labour market has mainly been focused on developed countries. However, they did not analyse both the effects of globalization for the BRICS countries in a scientific manner. As BRICS have opened their economies significantly and improved their connectedness to world trade networks by reducing the trade barriers substantially in the early 1990s, the structural change is expected to contribute the high growth. Also understanding of the factors of structural change or development due to the globalization is very important for the policy makers. There is no study that examines the factors of the structural development in BRICS countries, which is important for policy makers to design the policies to achieve higher growth and sustainment of development. Hence, a scientific analysis on the direct and indirect effects of globalization, and the factors of structural development is a policy imperative, which will add value to the existing literatures. The present study contributes to the existing literature from several points of view. First, the study examines the reallocation effects on the LPG during the globalization years from 1990-91 to 2011-12 in BRICS countries. Second, the study empirically models the impact of globalization on LPG by capturing the broad measures of economic globalization and controlling other factors including female labour force participation in BRICS. Finally, the study confirms the relative role of consumption factors and others for the structural development during the globalization years by using an input output framework.
The remainder of the paper is organized as follows. The methodologies and data sources are discussed in sections II and III. Section IV discusses the indirect and direct effect of globalization on LPG. Then the factors of structural development in BRICS have been examined in Section V. Section VI offers final comments.
II. Methodology The study focuses on the effect of globalization and factors of structural development in BRICS countries during the globalization years in 1990–91to 2011–2012. The first part of the analyses focuses on the role of structural change or reallocation effect in LPG and empirically models the impact of globalization on LPG based on the theories in a regression framework. The second part of the analysis explores the factors of the structural development during the globalization era.
0,851,16
1,291,46
1,712,14
4,114,97
0,00 1,00 2,00 3,00 4,00 5,00 6,00
Euro areaOECD
High incomeWorld
European UnionEast Asia & Pacific
South AsiaBRICS
3
Industrial development literature perceives structural change as one of the sources of productivity growth. The reason behind this perception is the fact that there can be gains from factor reallocation if factors returns differ across industries (Syrquin, 1984). The contribution of the structural change to LPG can be measured by using shift-share analysis, which decomposes the growth of productivity by its sources (Vries et. al, 2012). The first is the one resulting from productivity growth within industries, called the within-effect, and the second being the effect resulting from the reallocation of labour between industries, called the between-effect. There are many ways of measuring the structural change. One of the methods of measuring the structural change is the change in the industrial shares of output or employment in the whole economy. The advantage of using change in employment for the measurement of structural change is that, it also measures industries’ technological intensity (Syrquin, 1988).
Let Vt nd Lt be total value added and employment of a country, subscript t denotes time. Then, labour productivity of a given country at time t, LPt, may be defined as follows:
𝐿𝐿𝐿𝐿𝑡𝑡 = 𝑉𝑉𝐿𝐿
= ∑ 𝑣𝑣𝑡𝑡𝑖𝑖𝑖𝑖=3
𝑖𝑖=1∑ 𝑙𝑙𝑡𝑡
𝑖𝑖𝑖𝑖=3𝑖𝑖=1
= ∑𝑆𝑆𝑡𝑡𝑖𝑖 ∗𝑣𝑣𝑡𝑡𝑖𝑖
𝑙𝑙𝑡𝑡𝑖𝑖 (1)
where, 𝑆𝑆𝑡𝑡𝑖𝑖 = 𝑙𝑙𝑡𝑡𝑖𝑖
𝐿𝐿𝑡𝑡is the share of industry iin the total employment.
The change in the level of labour productivity can be represented by: 𝐿𝐿𝐿𝐿𝑡𝑡 − 𝐿𝐿𝐿𝐿𝑡𝑡−1 = ∑ (𝐿𝐿𝐿𝐿𝑡𝑡𝑖𝑖𝑖𝑖=3
𝑖𝑖=1 − 𝐿𝐿𝐿𝐿𝑡𝑡−1𝑖𝑖 ) ∗ 𝑆𝑆𝑡𝑡
𝑖𝑖+ ∑ (𝑆𝑆𝑡𝑡𝑖𝑖𝑖𝑖=3
𝑖𝑖=1 − 𝑆𝑆𝑡𝑡−1𝑖𝑖 ) ∗ 𝐿𝐿𝐿𝐿𝑡𝑡
𝑖𝑖 (2)
where, 𝑆𝑆𝑡𝑡𝑖𝑖 and 𝐿𝐿𝐿𝐿𝑡𝑡𝑖𝑖 are the average of the employment share and labour productivity of sector i, respectively at the time t-1 and t. Equation (2) can be modified as follws so as to reflect growth rates by dividing the whole equation by labour productivity: 𝐿𝐿𝐿𝐿𝑡𝑡−𝐿𝐿𝐿𝐿𝑡𝑡−1𝐿𝐿𝐿𝐿𝑡𝑡−1
= ∑ (𝐿𝐿𝐿𝐿𝑡𝑡𝑖𝑖𝑖𝑖=3
𝑖𝑖=1 −𝐿𝐿𝐿𝐿𝑡𝑡−1𝑖𝑖 )∗𝑆𝑆𝑡𝑡
𝑖𝑖
𝐿𝐿𝐿𝐿𝑡𝑡−1+ ∑ (𝑆𝑆𝑡𝑡
𝑖𝑖𝑖𝑖=3𝑖𝑖=1 −𝑆𝑆𝑡𝑡−1
𝑖𝑖 )∗𝐿𝐿𝐿𝐿𝑡𝑡𝑖𝑖
𝐿𝐿𝐿𝐿𝑡𝑡−1 (3)
Equation (3) implies that aggregate productivity growth can be decomposed into two parts. The first term on the right hand side of the equation is the within effect, and gives the contribution of within-sector productivity changes (also known as “intra-effect”). The second term is the between-effect, and this measures the magnitude of productivity growth resulting from the movement of labour from low-productivity industries to high productivity industries, i.e., structural change effect (shift-effect). The within-effect is positive (negative) when the weighted change in labour productivity levels in sectors is positive (negative). The reallocation-effect is a residual term, which measures the contribution of labour reallocation across sectors. This contribution is positive (negative), when labour moves from less (more) to more (less) productive sectors. This term is expected to be positive if there is a contribution of structural change on productivity growth. On the other hand, a negative estimate of this term implies that the structural change in the economy deteriorates the productivity growth.
Further, the study empirically evaluates the impact of globalization on LPG by capturing the measures of globalization along with other factors. In the recent literature, the panel data analysis has become popular as it controls the individual heterogeneity of the countries and has more degree of freedom and efficiency (Baltagi, 2001). In the panel data econometrics, in addition to those unobservable individual factors absorbed by the independent variables, the error term (εit) can be decomposed into εit = µi+ uit, where µi denotes unobserved country-specific effects and uit is the random error component with distribution N(0, σ2). Nevertheless, the conventional cross-country methods neglect the error terms of µi, which makes the parameter biased. The estimable equation in panel data method framework can be written as follows.
where; i=1, ……………,5 and t = 1990-91, 1991-92 ………………………….., 2011 - 12. LPGit is labour productivity growth of country‘i', Xit is the vector of globalization variables, Zit is the vector of other explanatory variables. And α, β and θ are the parameters of the model. Some of the regressors are expected to be endogenously determined in the system. Furthermore, time-invariant country characteristics (fixed effects) may be correlated with the explanatory variables. Due to these features of the estimation, the analysis on the impact of globalization on labour productivity uses dynamic Generalized Method of Moments (GMM) panel estimator, which has the following structure.
𝐿𝐿𝐿𝐿𝐿𝐿𝑖𝑖𝑡𝑡 = 𝛾𝛾𝐿𝐿𝐿𝐿𝐿𝐿𝑖𝑖𝑡𝑡−1 + 𝛿𝛿𝐷𝐷𝑖𝑖𝑡𝑡 + 𝜆𝜆𝐸𝐸𝑖𝑖𝑡𝑡 + µ𝑖𝑖 + 𝜀𝜀𝑖𝑖𝑡𝑡 (5) Where, LPGit-1 is one year lag of labour productivity growth, Dit is the vector of strictly exogenous variables and Eit is the vector of predetermined and endogenous variables1. Where, 𝛾𝛾, 𝛿𝛿 and λ are the parameters. μi is the time invariant country specific effect that captures various characteristics of the country, which are not observable but have a significant role on LPG. Ɛit is the error term, with the assumption that μi and Ɛit are independent for each i over all t, and that there is no autocorrelation in the Ɛ it .The dynamic panel GMM has been widely employed in empirical literature on Development Economics due to its advantages2. The methodology of GMM for panel data analysis proposed by Arellano and Bond (1991) and then further developed by Blundell and Bond (1998).3
The second part of the study examines the factors of structural development by using the input output analysis, and decomposing the growth of gross output into their constituent components as described in Swiecki (2013), Sonis et al. (1996) and Peneder et al. (2001). The first component is changes in technology coefficients, which relate to intermediary inputs required per unit of output. The other two components are related to the growth of domestic demand comprising of public and private consumption, and investment expenditures. The final component is the impact of changes in net exports, reflecting shifts in demand affected through foreign trade.
Arellano-Bond estimation starts by transforming all regressors, usually by differencing, and uses the Generalized Method of Moments (Hansen 1982), and so is called Differences GMM. The Arellano-Bover/Blundell-Bond estimator augments Arellano-Bond by making an additional assumption that the first differences of instrument variables are uncorrelated with the fixed effects. This allows the introduction of more instruments and builds up a system of two equations—the original equation as well as the transformed one– together constitute System GMM.
III. Data Sources We compiled published annual data obtained from World Development Indicators (WDI) of World Bank and World Input-Output Table (WIOT) data during the period from 1990-91 to 2011-12. The first part of the study measures the contribution of structural change to LPG by using the shift share analysis. The study utilizes the data on employment share by three major economic activities i.e. agriculture, industrial and service sector from WDI data. The LPG has been calculated by using the raw data on GDP (constant 2000 USD) and employment by sector from WDI. Then, the study moves further to examine the direct effect of globalization on LPG. The indicators on the globalization variables and other factors of LPG have been taken from WDI as well. The analysis include the following variables for BRICS countries: total number of employment, GDP (constant 2000 USD), expenditure in education in constant
1Predetermined variables and endogenous variables are assumed to be correlated with only past errors, and both the past and present errors, respectively. 2 The GMM estimator is good in exploiting the time-series variation in the data, accounting for unobserved individual specific effects, and therefore providing better control for endogeneity of the explanatory variables (Beck et al., 2000). 3For a detailed explanation on the GMM estimator, see, Green (2000, Chapter 11), Wooldridge (2002, Chapter 8 and Chapter 14), and Roodman (2009).
5
USD, investment in fixed asset in constant USD, total industry value (IND), FDI net inflows, exports in constant USD, imports in constant USD, female labour force participation rate and employment. We transform the raw data and redefine the variables used in the estimation. This includes growth of investment, growth of education expenditure, growth of FDI (GFDI), growth of trade (GTR) growth of industrial sector (GIND) and growth of female labor force (GFLF).
The second part of the study examines the factors of structural development by using data from input-output tables of WIOT. The WIOT provides annual time series data from 1995-2011 for Brazil, Russia, India and China (BRIC), where South Africa is dropped from this analysis due to data issues.
IV. Impact of globalization on productivity growth This section deals with the analysis of direct impact of globalistion on LPG and the reallocation of factors of production or structural change effects.
IV. A. Structural Change and Labour Productivity Growth The study measures contribution of the structural change to labour productivity growth by using shift share analysis. The advantage of this approach is that it accounts for the aggregate effects. For example, a high rate of productivity growth can have ambiguous implications for the overall economic performance if the share of industrial sector in employment shrinks rather than expands. If the displaced labour ends up in activities with lower productivity, economy-wide growth will suffer. This reallocation term is only a static measure of the allocation effect as it depends on the differences in productivity levels across the sectors. The reallocation term is often used as an indicator for the success of structural transformation (e.g. Bosworth and Collins, 2008; McMillan and Rodrik, 2011)4
Figure 2: Contribution of Structural Change to LPG in 1991 to 2011 (in %) in BRICS and Global Economy
.This approach for the analysis of structural change is widely used in the empirical literature (Swiecki, 2013; Vries et al., 2012; Peneder 2003; McMillan and Rodrik, 2011; Baily, 1995; Havlik, 2005).
Sources: World Bank
The equation (3) is used to decompose the annual productivity growth of labour into between effects and within effects during 1991-92 to 2011-12. The annual average of contribution of structural change to LPG in the aggregate of BRICS and other major group of economies are presented in figure 2. The figure shows that, the contribution of structural change is 1.17 % in BRICS economy, which suggests that the structural change positively 4Initial-year, mid-year, or end-year shares can be used, with the former giving a greater weight to the reallocation-effect as compared to the latter. Following, Balk (2001), mid-year average employment shares have been used to minimize the index number problem. Alternatively, value added shares can be used as weights instead of employment, as in Bosworth and Collins (2008), which does not deal with reallocation of inputs but of outputs.
0,100,170,18
0,300,67
0,891,17
0,00 0,20 0,40 0,60 0,80 1,00 1,20 1,40
High incomeEuro area
OECDEuropean Union
South AsiaWorld
BRICS
6
affects or contributes to the growth of labour productivity. Also this contribution is found to be higher in BRICS than the other major group of economies, which is as expected. In contrast, there are some countries, where the structural change negatively contributes to the growth of productivity (see, appendix tables A2 and A3). This indicates that, globalization appears to have fostered an undesirable structural change, which is suggesting that the labour might have moved in the wrong direction, from more productive to less productive activities.
There are variations within the members of BRICS economies as regards to the economic structure and levels of labour productivity. The economic activities during 1990s in BRICS economy as a whole are mainly concentrated in the agriculture (see, appendix table A1). Gradually they shifted towards non-agriculture sector during the globalization years. However, different country individually responds differently as regards to the reallocation of employment (see, appendix table A4). China, India and Brazil follow the same pattern as for the aggregate of BRICS economy. In case of the other two countries, while there is major gain in the service sector and a minor loss of employment share in the industrial sector. As regards to the levels of labour productivity, South Africa has been at the top, followed by Brazil, Russia, China and India during 1990-91 to 2011-12 (see, appendix figure A.2).
Figure 3: LPG in BRICS (in %)
Sources: World Bank
Figure 4: Contribution of Structural Change to LPG (in growth rates)
Sources: World Bank
Three is also variations in terms of patterns of LPG within the members of BRICS economy as seen in figure 3. The China is found to be dominating over others and growing at the rate of annual average of 9.3 per cent, followed by India, South Africa, Russia and Brazil (9.3 per cent, 4.7 per cent, 1.4 per cent, 1.1 per cent and 0.5 per cent) during the entire period in 1991-2012. If we classify the entire periods into two sub-periods i.e., 1991-92 to 2000-01, 2001-02 to 2011-12, the labour productivity growth performance in China has been consistent during the two sub-periods. Hence, China has performed very well in terms of LPG during the last two decades. The labour productivity growth in India is almost half of China during the entire periods. Nevertheless, there is consistent growth of labour productivity in India in the two sub-periods. This is observed that, LPG has been increased from the first period to the
-0,66-2,16
1,413,81
9,21
1,644,03
1,41
5,56
9,44
0,55 1,08 1,414,73
9,33
-5,00
0,00
5,00
10,00
15,00
B R S I C
1991-2000 2001-2011 1991-2011
-0,001 -0,001
0,003
0,013
-0,002
0,0050,003
0,009
0,018
-0,0005
0,0020,001
0,006
0,015
-0,001
-0,010
0,000
0,010
0,020
B R I C S
1991-2000 2001-2011 1991-2011
7
second period in four countries, where South Africa experiences no change in LPG. Even though, Brazil and Russia experience negative growth in the first period, but they achieved positive growth in the second period. Hence, as a whole, the labour productivity growth performance for BRICS economies is relatively better in the second period compare to the first period. All the countries record a positive growth in the second period, which is the driver of overall economic growth in the recent period in BRICS economy.
The contribution of structural change to LPG in those two sub-periods are presented in figure 4 to understand the patterns of sources of LPG among the members of BRICS economy (detailed result is provided in appendix table A5). The figure shows that, China and India are dominating in terms of the contribution of structural change to LPG. The annual average of between effects is positive for China and India and negative for Brazil, Russia and South Africa in 1990s. As the globalization proceeds attributed to the liberal policies of global trade and investment measures, the reallocation effects increases by which the Brazil and Russia along with the India and China has gained from the structural change in 2000s. South Africa although experiences a negative contribution of structural change in 1990s, however this gradually improves in the second period. The increase in the contribution of the structural change and hence, labour productivity growth could be due to the globalization and integration of these economies with the world economy. The contribution of structural change is more crucial in China and India than others in the BRICS economy.
IV.B. Direct effect of Globalisation on Labour Productivity Growth The globalization, a broad concept, which is well defined in OECD (2010; 2005), and Eurostat (2007), and is measured by FDI and international trade in the major studies of the empirical literatures. This section discusses about the theories related to the linkage of productivity growth through international trade and FDI. Then, based on the theoretical arguments, the impact of globalization on LPG is modelled.
IV.B.1. Globalisation and Factors of Labour Productivity Growth: A Discussion The productivity growth is not only affected by the indicators of globalization, but also affected by other factors. Hence, linkage of productivity growth with the globalization and other possible factors are discusses as follow.
International Trade: There are mainly two theoretical approaches as regards to the channels through which international trade might impact on labour productivity. The first is neoclassical Hecksher-Ohlin (H-O) model which provides predictions about the impact of trade between countries with different resource endowments as is the case of trade between developed and developing countries. The H-O model predicts that comparative advantage arises from the differences in relative endowments of factors of production. Nations will therefore specialize in the production of goods that employs more of their relatively abundant factors. For instance, developed countries which have relatively more abundant capital would export capital-intensive goods and services and import labour-intensive goods and services from the developing countries where labour is relatively more abundant and available at cheaper prices. Such prediction is reflected from the actual pattern of trade between developed and developing countries (OECD, 1994). Thus, under the assumption of two factors and two goods version of the model, the movement from autarky to trade is associated in both countries with an increase in the relative price of goods which uses the relatively abundant factor more intensively. Assuming each country produces both the two goods, the increase in the relative price of two goods, will make the firms to increase the production of labour intensive good in the labour abundant country. The opposite will happen in the capital abundant country. Such a change will lead to increase in demand for labour in the labour-abundant country and capital in capital abundant country. The second approach is “new trade
8
theories” which describes trade between countries with similar resource endowments and characterised by intra-industry trade of similar (but differentiated) products. The gains from trade occur, because production cost falls as the scale of output increases, which leads to increases in productivity.
Further, the proponents of liberalization argue that opening up the domestic market will improve the productivity of the economy diverting resources from less efficient sectors to more efficient ones. But, gain from openness may be different for different countries depending on the status of the economy, human capital stock and many other things. Mere inflows of cheap inputs and better technology will not automatically lead to corresponding increases in productivity. The technology has to be absorbed by the domestic labour force as well. And if the domestic labour force does not have the skill to adapt with the foreign technology, then fruits of trade may not translate into productivity rise. Similarly, it may happen that given the availability of other things, different sectors may not gain from the same due to insufficient credit facilities. In this context, Grossman and Helpman (1991) and Barro, Sala-i-Martin (1995), and Edwards (1997) among others, have argued that countries that are more open have a greater ability to benefit from technology diffusion and productivity growth. Dollar and Kraay (2004) also find evidence that greater openness to trade can generate economies of scale and productivity gains. However, there has been an increasing recognition in recent years about the importance of complementary policies in enhancing the benefits of a more open trade regime. Such policies include sound macroeconomic policies, market supporting institutions, infrastructures, appropriate business regulations, well-functioning credit markets, and flexible labor markets (Chang et al., 2005).
FDI: FDI stimulates economic growth by improving technology and productivity (Borensztein et al., 1998). Generally, the FDI inflows in one of two ways: either by establishing a new enterprise or by modifying an existing enterprise’s ownership status. Changing an existing enterprise’s ownership status is done through mergers and acquisitions that consists of buying or selling existing shares, which represent the majority of global inward FDI. Mergers and acquisitions are carried out largely by multinational enterprises. The foreign firms have considerable advantages over local enterprises, because they bring with them their capital and modern technologies, their marketing skills and their ability to exploit the comparative advantages of different countries in which they do business (Blomstrom and Kokko, 2000). Hence, the foreign firms generally have higher productivity than local firms (Blomstrom and Kokko, 2000 and 1998; Globerman and Ries, 1994; Baldwin and Dhaliwal, 2001; Rao and Tang, 2005; Baldwin and Gu, 2005). The foreign firms play role in an economy as a result of FDI flows, which helps to increase the productivity in the industries in which they operate.
Further, the presence of foreign firms can also contribute directly to improving local firms’ productivity through the “horizontal” and “vertical” spill–over effects. Horizontal (intra-industry) spillovers are created within an industry in which local and foreign firms compete with each other. Vertical (inter-industry) spillovers occur right on the production line and can thus affect different industries. They derive from the supplier or customer relationships that connect local enterprises to multinationals. On the one hand, spillovers can result from “backward linkages,” which relate to multinationals’ relationships with their local suppliers. The quality standards required by multinationals for the inputs they buy can lead local enterprises to improve their production processes and help to improve their productivity. What’s more, as suppliers, local enterprises can benefit from the skills and technical assistance of multinationals (Blomström and Kokko, 1998). Alternatively, spillovers can also come from “forward linkages” emerging from interactions between multinationals and local clients who among other things, can benefit from superior quality inputs. Furthermore, this
9
business relationship exposes them to new technologies and innovations brought in by multinationals (Driffield and Munday, 2002). However, horizontal and vertical spillovers can occur via four key mechanisms: imitation, competition, skills transfers and access to new markets (Görg and Greenaway, 2004; Blomstrom and Kokko, 2000; OECD, 2002).
Hence, the inflows of FDI directly increases the productivity, where it operates and through the spillovers effect on the host economies. However, Alfaro et al. (2009) suggests that the overall impact of FDI on productivity is somewhat mixed.5
Other Factors: In addition to globalization, there are some other factors that influence productivity growth. The economic factors such as fixed investment and the growth of capital intensive industries can determine the productivity of labour. Fixed investment is a key factor for the production and regional development under both capitalist and socialist systems. The increase in labor productivity is mainly a result of investment in the fixed capital and capital formation. There are number studies, which empirically verified the importance of fixed capital on labour productivity growth and economic growth in the context of both developing and developed countries (Wei, 2000; Demurger, 2001; Oulton, 1990).
The majority of the studies find that the impact of FDI on productivity and growth depend on other factors, such as the level of human capital (Borensztein et al., 1998) and the development of the domestic financial market (Alfaro et al., 2003) also.
The industrial sector is an important factor of competitiveness, productivity and overall capability of nations (Su and Heshmati, 2011). BRICS constitutes a smaller group of emerging economies which have gradually transited from agriculture-based to industrial-intensive economy. In recent years, the service sector is also growing in parallel to the industrial sector and this indicates growth in the domestic market and growing support of the industrial sector. The industrial sector is capital intensive in nature. Hence, high growth of industrial sector is expected to push up the labour productivity growth in these emerging countries. A number of empirical studies have found that a transition of economic activity from agriculture to non-agricultural sectors would lead to stronger productivity growth, as it implies a shift from lower- to higher-productivity sectors (Poirson, 2000; Jaumotte and Spatafora, 2007). These studies also found that countries with a higher value-added share of high-productivity growth sectors also have higher aggregate productivity growth.
The education levels are linked to productivity growth (Schultz, (1975; Welch, 1975; Romer, 1990; Benhabib et al.,1992). In general, an educated, motivated and flexible labour force will be able to adapt more easily to new processes and new industries, and hence allow productivity to rise. There also may be positive externalities from human capital. Where the average level of human capital is high, the incidence of learning from others will be higher, and it is likely that there will be greater productivity gains to be derived from exchanging ideas (Lucas, 1988). Human capital often flows to countries that already have large amounts of such capital, suggesting that the return to such human capital is negatively related to its scarcity rather than positively related to scarcity. Moreover, Kremer and Thompson (1993) suggests that there may be some intergenerational complementarities in human capital -for example, the productivity of a young doctor may be raised by the presence of more experienced doctors – so that the returns to increasing human capital investment may be relatively high in already well-endowed countries. Apergis et al. (2008) also evidenced that human capital along with research and development (R&D) and international trade have significant effects on the labour productivity through innovations and spread-out of 5Alvaro et al., (2009) find evidence that factor accumulation (physical and human capital) does not seem to be the main channel through which countries benefit from FDI. Countries with well-developed financial markets gain significantly from FDI via productivity improvements.
10
technology in the case of services industry in six selected countries of Europe. They could accelerate innovation process and facilitate transfer of technology.
The promotion of women’s education and the integration of women into the labor force may increase productivity and growth. In development economics, it is now fully acknowledged that educated women allocate a higher share of households’ resources to education and healthcare— the two key factors that are expected to boost productivity and growth in the long-run. A few studies have attempted to examine the impact of increased female participation on productivity growth in advanced economies.6
IV.B.2. Empirical Analysis
These studies provide mixed empirical evidences about the importance of female labor participation in productivity growth. McGuckin and Van Ark (2005) find that higher female participation may lead to productivity losses when the new entrants are older women reintegrating into the work force on a part-time basis and after a period of inactivity. However, these effects are likely to disappear over time. De Jong and Tsiachristas (2008) argue that higher female participation may lead to productivity growth if workers can adapt to innovations.
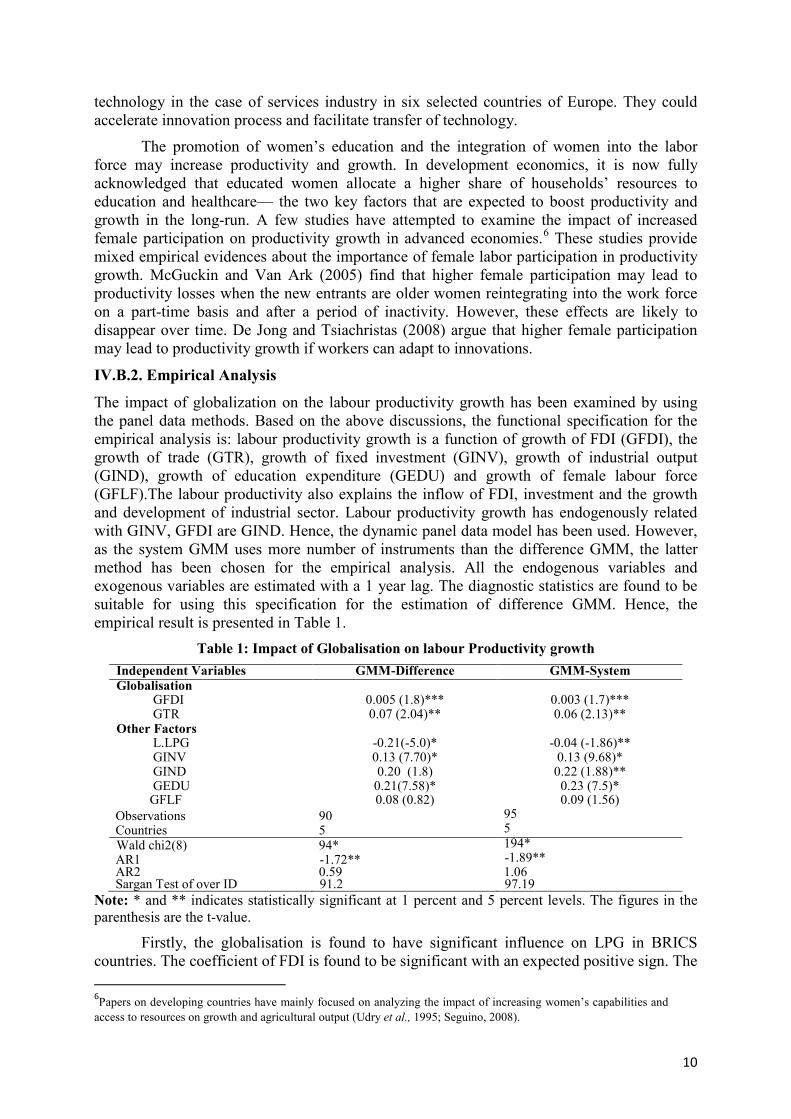
The impact of globalization on the labour productivity growth has been examined by using the panel data methods. Based on the above discussions, the functional specification for the empirical analysis is: labour productivity growth is a function of growth of FDI (GFDI), the growth of trade (GTR), growth of fixed investment (GINV), growth of industrial output (GIND), growth of education expenditure (GEDU) and growth of female labour force (GFLF).The labour productivity also explains the inflow of FDI, investment and the growth and development of industrial sector. Labour productivity growth has endogenously related with GINV, GFDI are GIND. Hence, the dynamic panel data model has been used. However, as the system GMM uses more number of instruments than the difference GMM, the latter method has been chosen for the empirical analysis. All the endogenous variables and exogenous variables are estimated with a 1 year lag. The diagnostic statistics are found to be suitable for using this specification for the estimation of difference GMM. Hence, the empirical result is presented in Table 1.
Table 1: Impact of Globalisation on labour Productivity growth Independent Variables GMM-Difference GMM-System Globalisation GFDI 0.005 (1.8)*** 0.003 (1.7)*** GTR 0.07 (2.04)** 0.06 (2.13)** Other Factors L.LPG -0.21(-5.0)* -0.04 (-1.86)** GINV 0.13 (7.70)* 0.13 (9.68)* GIND 0.20 (1.8) 0.22 (1.88)** GEDU 0.21(7.58)* 0.23 (7.5)* GFLF 0.08 (0.82) 0.09 (1.56) Observations 90 95 Countries 5 5 Wald chi2(8) 94* 194* AR1 -1.72** -1.89** AR2 0.59 1.06 Sargan Test of over ID 91.2 97.19
Note: * and ** indicates statistically significant at 1 percent and 5 percent levels. The figures in the parenthesis are the t-value.
Firstly, the globalisation is found to have significant influence on LPG in BRICS countries. The coefficient of FDI is found to be significant with an expected positive sign. The 6Papers on developing countries have mainly focused on analyzing the impact of increasing women’s capabilities and access to resources on growth and agricultural output (Udry et al., 1995; Seguino, 2008).
11
inflow of FDI pushes up the productivity growth, by bringing new advanced technologies and managerial skills to the host economies of BRICS during the last two decades. The international trade, as the other measures of globalization, exerts significant influence on the labour productivity in the BRICS countries. As presented in Table 1, the result shows that the regression coefficient on growth of international trade (GTR) is statistically significant at 5 percent level explaining the labour productivity growth over the period 1990-91 to 2011-12. The findings of the study are in line with the findings of Muendller (2001) for Brazil, Saha (2012), Xu et al. (2008) for India, Austria (1998) for Philippines, Lee (2004) for Republic of Korea, Nachega and Thomson (2006) for Niger, Jajri (2007) for Malaysia and so on. Thus, it could be argued that although some of the BRICS economy, particularly India and China adopted very restrictive trade policies initially but with the gradual removal of tariff barriers and other restrictions, fruits of trade have gradually percolated into different sectors of the economy which has helped in improving the labour productivity significantly.
Secondly, the study includes the other possible factors such as investment, public expenditure on education, industrial output and female labour force in explaining LPG .The regression coefficients on investment and industrial output are statistically significant at 1 percent with an expected positive sign. Also the regression coefficient on education expenditure is statistically significant at 1 percent in explaining the productivity growth in BRICS. The findings of the study is in line with Xu et al. (2008), which finds that human capital, trade openness and FDI are positively related with the productivity growth, through knowledge spillovers within the Chinese economy. However, our study includes the female labour force participation in addition to government expenditure on education in the analysis to understand the importance of human capital in a broader manner. The result shows that the coefficient of female labour force participation is although positive, but is statistically not significant. Hence, it needs some policy treatment to improve the female labour force participation in the BRICS economies.
Table 2: Impact of Globalisation on Sectoral labour Productivity growth
Note: * and ** indicates statistically significant at 1 percent and 5 percent levels. The figures in the parenthesis are the t-value.
However, the LPG has two components, as analysed in the previous sections. Those are contributions due to the structural change (SC) or between effect and the actual productivity growth or the sectoral productivity growth (SPG) or within effect. The same functional specification is used for estimating the impact of globalisation on the actual or sectoral labour productivity growth, without accounting contributions due to the structural change. The estimates from the dynamic panel data model are presented in Table 2. The diagnostic test values reported in the table shows the validity of the model estimates, which
12
justifies the validity of instruments and functional specifications used in our estimation. The result also confirms the significant effect of globalisation on the sectoral labour productivity growth for the BRICS economies. This is important to notice that, one year lag of labour productivity growth is statistically significant, which indicates that the labour productivity growth in BRICS economy is converging during the last two decades.
In sum, globalisation exerts significant impact on LPG in BRICS economy. In particular, there is a positive significant impact of FDI inflows and trade on the growth of labour productivity in BRICS economy during the period of study. Education expenditure, fixed investment and growth of the industrial sector are also significantly explaining LPG. As regards to female labour force participation, which is contributing to the global economic growth and development has been increased, but they do not exert the significant influence on LPG in case of BRICS economies during the recent years. Even, these female labour force have significant role in pushing the labour productivity for the high advanced countries as empirically verified in Mallick (2013). Hence this needs a special policy attention and treatments by the governments of the BRICS countries. Further, trade and FDI inflows are observed to be the major drivers of the world economic growth and development, which keep on an increasing momentum in their shares in the world income. This perhaps needs to be liberalized further, in order to catch up with the advanced countries.
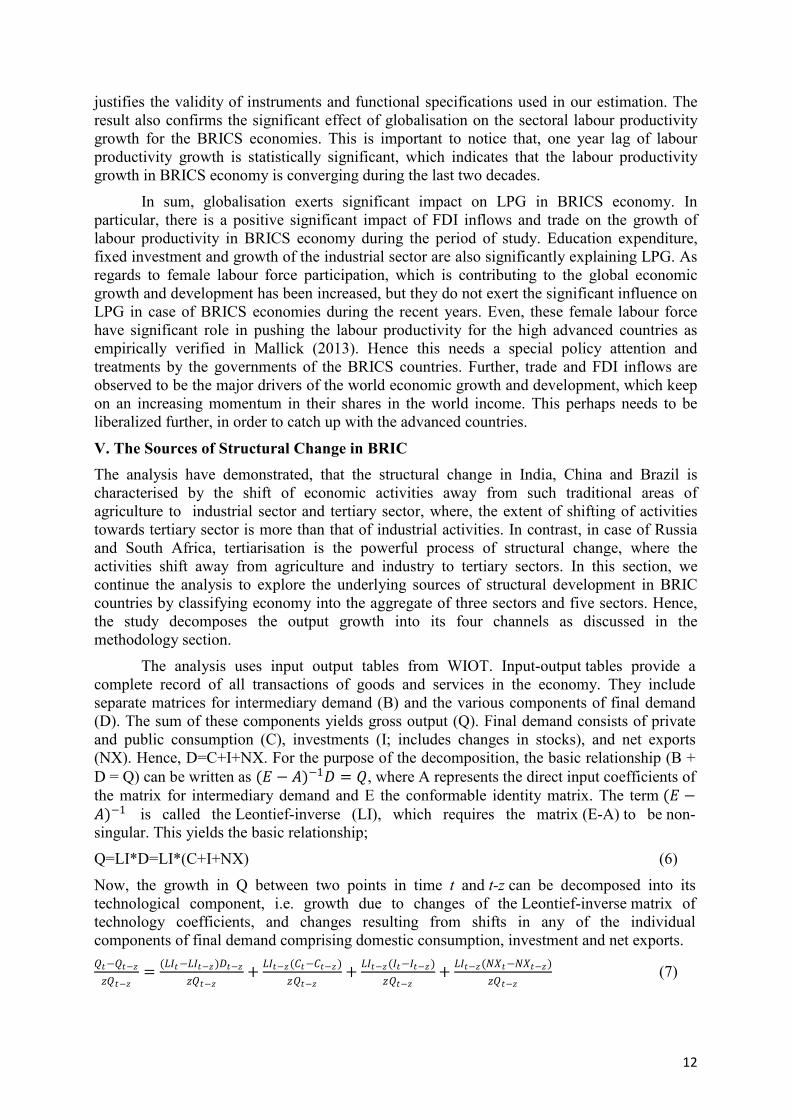
V. The Sources of Structural Change in BRIC The analysis have demonstrated, that the structural change in India, China and Brazil is characterised by the shift of economic activities away from such traditional areas of agriculture to industrial sector and tertiary sector, where, the extent of shifting of activities towards tertiary sector is more than that of industrial activities. In contrast, in case of Russia and South Africa, tertiarisation is the powerful process of structural change, where the activities shift away from agriculture and industry to tertiary sectors. In this section, we continue the analysis to explore the underlying sources of structural development in BRIC countries by classifying economy into the aggregate of three sectors and five sectors. Hence, the study decomposes the output growth into its four channels as discussed in the methodology section.
The analysis uses input output tables from WIOT. Input-output tables provide a complete record of all transactions of goods and services in the economy. They include separate matrices for intermediary demand (B) and the various components of final demand (D). The sum of these components yields gross output (Q). Final demand consists of private and public consumption (C), investments (I; includes changes in stocks), and net exports (NX). Hence, D=C+I+NX. For the purpose of the decomposition, the basic relationship (B + D = Q) can be written as (𝐸𝐸 − 𝐴𝐴)−1𝐷𝐷 = 𝑄𝑄, where A represents the direct input coefficients of the matrix for intermediary demand and E the conformable identity matrix. The term (𝐸𝐸 −𝐴𝐴)−1 is called the Leontief-inverse (LI), which requires the matrix (E-A) to be non-singular. This yields the basic relationship;
Q=LI*D=LI*(C+I+NX) (6)
Now, the growth in Q between two points in time t and t-z can be decomposed into its technological component, i.e. growth due to changes of the Leontief-inverse matrix of technology coefficients, and changes resulting from shifts in any of the individual components of final demand comprising domestic consumption, investment and net exports. 𝑄𝑄𝑡𝑡−𝑄𝑄𝑡𝑡−𝑧𝑧𝑧𝑧𝑄𝑄𝑡𝑡−𝑧𝑧
= (𝐿𝐿𝐿𝐿𝑡𝑡−𝐿𝐿𝐿𝐿𝑡𝑡−𝑧𝑧)𝐷𝐷𝑡𝑡−𝑧𝑧𝑧𝑧𝑄𝑄𝑡𝑡−𝑧𝑧
+ 𝐿𝐿𝐿𝐿𝑡𝑡−𝑧𝑧(𝐶𝐶𝑡𝑡−𝐶𝐶𝑡𝑡−𝑧𝑧)𝑧𝑧𝑄𝑄𝑡𝑡−𝑧𝑧
+ 𝐿𝐿𝐿𝐿𝑡𝑡−𝑧𝑧(𝐿𝐿𝑡𝑡−𝐿𝐿𝑡𝑡−𝑧𝑧)𝑧𝑧𝑄𝑄𝑡𝑡−𝑧𝑧
+ 𝐿𝐿𝐿𝐿𝑡𝑡−𝑧𝑧(𝑁𝑁𝑋𝑋𝑡𝑡−𝑁𝑁𝑋𝑋𝑡𝑡−𝑧𝑧)𝑧𝑧𝑄𝑄𝑡𝑡−𝑧𝑧
(7)
13
The right hand side of the above equation is the differential shifts in the level of intermediary and final demand per unit of output. It should be noted that organizational and technological change form strongly intertwined aspects of corporate activities. As such, they cannot be separated in this decomposition analysis, because both result in changes of the coefficients in the matrix of intermediary inputs.
Table 3: Decomposition of Economic Growth in 1995-2010(in percentage)
Factors Agriculture Industrial Service Agriculture Industrial Service India China
The equation (7) is used decompose the growth of output into its four components. The result of decomposition for three sector classification of economy is presented in Table 3. The numbers in the tables refer to the average annual growth of output expressed in percentage points, which is the addition of its individual components. The result shows that, the process of structural change has been driven primarily by the growth of consumption demand. Among the sources of structural development, the increase of domestic demand has had the most pronounced impact on growth in the three broad sectors. The service sector benefited most from this rise in consumption in all the BRIC countries. In India, the major contributor was the consumption demand followed by investment and trade. There is no contribution from the technology change in India. In contrast, technology contributes positively to the growth of output in China. Among the BRIC countries, China has the larger contribution due to the growth of technology.
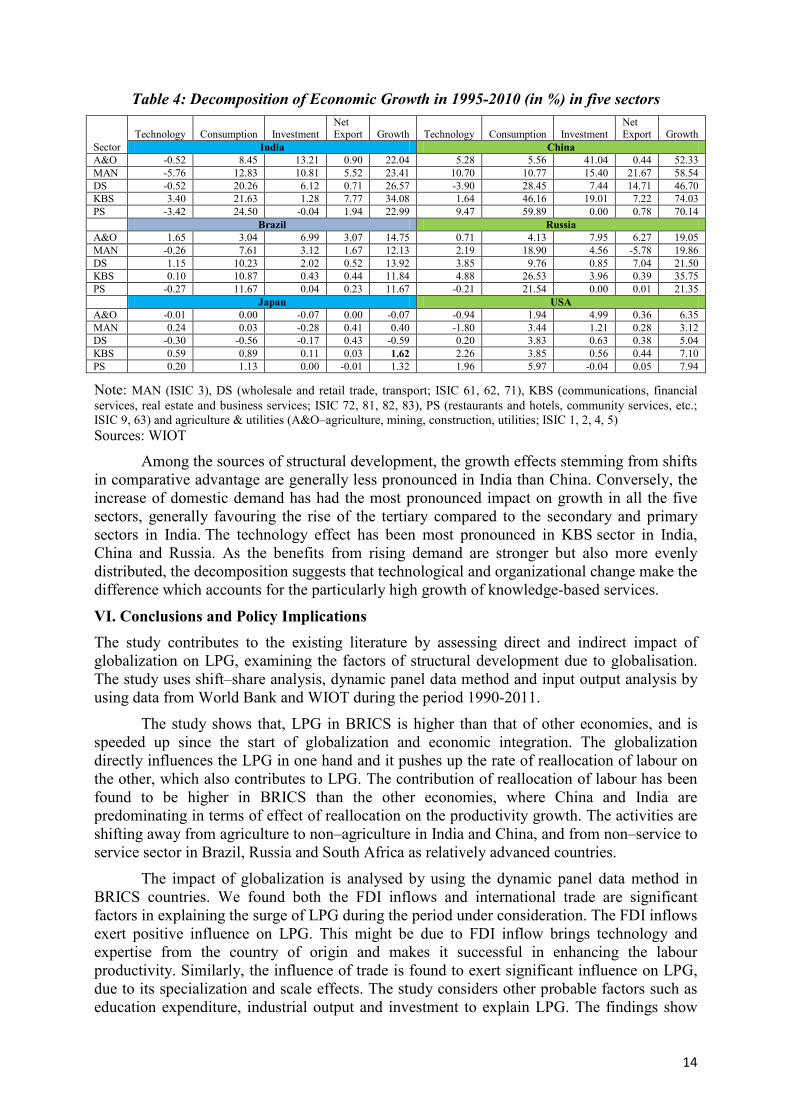
However, the broad classification of three activities gives little scope to understand the process of structural change. Now, the economy is classified into five sub-sectors i.e., manufacturing (MAN), distributive services (DS), Knowledge-based services (KBS), Personal and social services (PS) and agriculture & utilities (A&O) in table 4, as classified in Peneder et al. (2000; 2001). The result is also compared with the experience of developed countries such as Japan and USA. The process of tertiarisation has been driven primarily by the growth of KBS. KBS has been the fastest growing activities among all five aggregates in RIC countries excluding Brazil. However, among the sources of structural development, the increase of domestic demand has had the most pronounced impact on growth in the five broad sectors. Besides personal & social services, knowledge based services benefited most from this rise in consumption. The technology effect (as revealed by the change of coefficients in the matrix of intermediary inputs) has been most pronounced in knowledge-based services except few. The technological component in BRIC is relatively lower than the developed countries as in Japan and the USA. The growth of KBS sector appears to have been driven more strongly by domestic demand in BRIC. Knowledge-based services have become increasingly important sources of innovation, product differentiation and productivity growth. These services not only contribute directly to economic development through their own growth in employment and income, they additionally have the potential to improve performance in the economic system via knowledge transfer and increasing specialisation.
14
Table 4: Decomposition of Economic Growth in 1995-2010 (in %) in five sectors
Sector Technology Consumption Investment
Net Export Growth Technology Consumption Investment
Note: MAN (ISIC 3), DS (wholesale and retail trade, transport; ISIC 61, 62, 71), KBS (communications, financial services, real estate and business services; ISIC 72, 81, 82, 83), PS (restaurants and hotels, community services, etc.; ISIC 9, 63) and agriculture & utilities (A&O–agriculture, mining, construction, utilities; ISIC 1, 2, 4, 5) Sources: WIOT
Among the sources of structural development, the growth effects stemming from shifts in comparative advantage are generally less pronounced in India than China. Conversely, the increase of domestic demand has had the most pronounced impact on growth in all the five sectors, generally favouring the rise of the tertiary compared to the secondary and primary sectors in India. The technology effect has been most pronounced in KBS sector in India, China and Russia. As the benefits from rising demand are stronger but also more evenly distributed, the decomposition suggests that technological and organizational change make the difference which accounts for the particularly high growth of knowledge-based services.
VI. Conclusions and Policy Implications The study contributes to the existing literature by assessing direct and indirect impact of globalization on LPG, examining the factors of structural development due to globalisation. The study uses shift–share analysis, dynamic panel data method and input output analysis by using data from World Bank and WIOT during the period 1990-2011.
The study shows that, LPG in BRICS is higher than that of other economies, and is speeded up since the start of globalization and economic integration. The globalization directly influences the LPG in one hand and it pushes up the rate of reallocation of labour on the other, which also contributes to LPG. The contribution of reallocation of labour has been found to be higher in BRICS than the other economies, where China and India are predominating in terms of effect of reallocation on the productivity growth. The activities are shifting away from agriculture to non–agriculture in India and China, and from non–service to service sector in Brazil, Russia and South Africa as relatively advanced countries.
The impact of globalization is analysed by using the dynamic panel data method in BRICS countries. We found both the FDI inflows and international trade are significant factors in explaining the surge of LPG during the period under consideration. The FDI inflows exert positive influence on LPG. This might be due to FDI inflow brings technology and expertise from the country of origin and makes it successful in enhancing the labour productivity. Similarly, the influence of trade is found to exert significant influence on LPG, due to its specialization and scale effects. The study considers other probable factors such as education expenditure, industrial output and investment to explain LPG. The findings show
15
that they are significant in explaining LPG as well. However, the female labour force participation displays no effect on labor productivity growth.
The input output analysis shows that the consumption demand is the crucial factor for the structural development during globalisation in BRIC countries. The growth of service sector is particularly driven by KBS, mainly due to the consumption growth also. However, the component of technical change is relatively higher in KBS than other sectors.
In sum, the overall productivity has been increased considerably after BRICS are opened to the globalization since early 1990s. Particularly India and China have been experiencing continuous rise in the labour productivity during these periods. The globalization has affected LPG positively and significantly through direct and reallocation effects. As higher labor productivity enhances the competitiveness of the products at the national and international markets, therefore, the study suggests that formulation of more and more outward oriented policies would further enhance the productivity. The study also found the importance of human capital which is represented by the education expenditure, plays a crucial role in raising the productivity. To ensure and achieve higher labour productivity, the relevant policies related to knowledge must be pursued in direction of incentiving and encouraging investments in human capital, technology and innovations. Hence, in this context, a policy of female labour force participation is also crucial.
Acknowledgement: This work is financially supported by the Ministry of Education, Youth and Sports of the
Czech Republic, Project CZ.1.07/2.3.00/30.0021 “Strengthening of Research and Development Teams at the
University of Pardubice“.
References
Alfaro L., S. Kalemni-Ozcan, and S. Sayek, 2009, “FDI, Productivity and Financial Development.” The World Economy (U.K.); Vol. 32, No. 1 pp. 111–35, January 2009
Apergis, N., Economidou, C., and Filippidis, I.(2008), “Innovation technology transfer and labor productivity linkages: evidence from a panel of manufacturing industries”, Review of World Economics, 144 (3) : 491-508.
Arellano, M., and S. Bond (1991), “Some Tests of Specification for Panel Data: Monte Carlo Evidence and an Application to Employment Equations,” Review of Economic Studies, 58, 277-297
Austria, M.S. (1998). Productivity Growth in the Philippines after the Industrial Reforms.Philippine Institute for Development Studies-Discussion Paper Series 98:26.
Balk, B. (2001). The residual: On monitoring and benchmarking firms, industries, and economies with respect to productivity. Journal of Productivity Analysis, 20 (1), 5-47.
Baldwin, J. R. and N. Dhaliwal (2001).“Heterogeneity in Labour Productivity Growth in Manufacturing: Differences between Domestic and Foreign-Controlled Establishments.”Productivity Growth in Canada. Ottawa: Statistics Canada.
Baldwin, J. R. and W. Gu (2005). Global Links: Multinationals, Foreign Ownership and Productivity Growth in Canadian Manufacturing. Statistics Canada, Micro Economic studies and Analysis Division.
Baltagi, B.H. (2001).Econometric Analysis of Panel Data.John Wiley & Sons, Ltd, U.S. Barro R.J., and X. Sala-i-Martin, 1995, Economic growth, (New York: McGraw-Hill). Basu, S. (2012), Productivity, Efficiency and Reallocation, 32nd General Conference of IARIW at
Boston, USA in August 5-11, 2012. Beck T., Levine, R., and N. Loayza (2000), “Finance and the Sources of Growth,” Journal of Financial
Economics, 58, 261-310.
16
Benhabib, J. and M.M. Speigel, “The role of human capital in economic development: evidence from aggregate cross-country and regional US. data”, Department of Economics, New York University, 1992
Blomström, M. and A. Kokko (1998).“Multinational Corporations and Spillovers.”Journal of Economic Surveys 12(2).
Blundell, R., and S. Bond (1998), “Initial Conditions and Moment Restrictions in Dynamic Panel Data Models,” Journal of Econometrics, 87, 115-43.
Borensztein E., J. De Gregorio, and J.-W. Lee, 1998, “How does Foreign Direct Investment Affect Economic Growth?” Journal of International Economics, Vol. 45, pp. 115–35.
Bosworth, B., & Collins, S. M. (2008). Accounting for growth: Comparing China and India. Journal of Economic Perspectives, 22 (1), 45-66.
Chang, R., L. Kaltani, and N. Loayza, 2005, “Openness Can Be Good for Growth: The Role of Policy Complementarities,” National Bureau of Economic Research (NBER), Working Paper No. 11787, (Cambridge, Massachusetts: MIT Press).
Coe, D. T (2007), Globalisation And Labour Markets: Policy Issues Arising From The Emergence Of China and India, OECD social, employment and migration Working papers, DELSA/ELSA/WD/SEM(2007)18OECD, Paris.
De Jong, A., and A. Tsiachristas, 2008, “Can labor force participation growth and productivity growth be combined?” Spring review by the SYSDEM correspondent for the Netherlands, European Employment Observatory.
Demurger, S. (2001).Infrastructure Development and Economic Growth: An Explanation for Regional Disparities in China, Journal of Comparative Economics 29, 95-117.
Dollar D., and A. Kraay, 2004, “Trade, Growth, and Poverty.” Economic Journal 114(493): F22–49. Driffield, N., M. Munday, (2002). “Foreign Direct Investment, Transactions Linkages and the
Performance of the Domestic Sector.”International Journal of the Economics of Business 9(3): 335-351.
Edwards, S., 1997, “Openness, Productivity, and Growth: What Do We Really Know.” National Bureau of Economic Research, (NBER) Working Paper No. 5978, (Cambridge, Massachusetts: MIT Press).
Eurostat (2007) Euro Indicators: Selected Readings-Focus on Measuring Globalisation Globerman, S., J. Ries, (1994).“The Economic Performance of Foreign Affiliates in
Canada.”Canadian Journal of Economics 27: 143-156. Görg, H. and D. Greenaway (2004). “Much ado about Nothing? Do Domestic Firms Really Benefit
from Foreign Direct Investment?” The World Bank Research Observer19(2): 171-197. Grossman G., and E. Helpman, 1991, Innovation and Growth in the Global Economy, (Cambridge,
Massachusetts: MIT Press). Hansen, L. 1982. Large sample properties of generalized method of moments estimators.
Econometrica 50(3): 1029-1054. IMF (2007), World Economic Outlook, April. Jajri, I. (2007). Determinants of Total Factor Productivity Growth in Malaysia.Journal of Economic
Cooperation 283, 41-58. Jaumotte F., and N. Spatafora, 2007, “Asia Rising: A Sectoral Perspective.” IMF Working Paper No.
07/130 (Washington: International Monetary Fund). Kuznets, S. (1979). Growth and Structural Shifts, Economic Growth and Structural Change in
Taiwan: The Postwar Experience of the Republic of China, Cornell University Press, US. Kremer, Michael and Jim Thompson, “Why isn’t convergence instantaneous?”, mimeo, Harvard
University, 1993 Lee, B. (2004). Measuring Total Factor Productivity: Survey Report. Asian Productivity Organization,
Tokyo. Lewis, W. A. (1954). ‘Economic Development with Unlimited Supplies of Labour’, The Manchester
School, Vol. 22, pp. 139–191. Lucas, Robert, “On the mechanics of economic development”, Journal of Monetary Economics, No.
22, July 1988. Mallick J (2013), “Globalisation and Labour Productivity in OECD Economy” Regional Development
between Theory and Practice, University of Pardubice, Czech Republic. (Accessible at
McMillan, M., &Rodrik, D. (2011).Globalization, structural change, and productivity growth (NBER working paper 17143). Cambridge: NBER.
McGuckin, R. and van Ark, B. (2005). Productivity and participation: an international comparison, Groningen Growth and Development Centre, Research Memorandum GD-78
Nachega, J.C., Thomson, F. (2006).Economic Growth and Total Factor Productivity in Niger.IMF Working Paper 06:208.
OECD (2010) Measuring globalization-OECD EconomicGlobalisationIndicators, OECD, Paris. OECD (2009) Globalisation and emerging economies, PolicyBrief, OECD, Paris. OECD (2007a), OECD Employment Outlook, OECD, Paris. OECD (2007b), .Making the Most of Globalisation, OECD Economic Outlook, No. 81, June, OECD,
Paris. OECD (2007c), .Moving Up the Value Chain: Staying Competitive in the Global Economy,. Main
Findings of a study presented to the OECD.s 2007 Ministerial Council meeting, OECD, Paris. OECD (2005) Measuring globalization-OECD Handbook on Economic Globalisation Indicators,
OECD, Paris. Oulton.N. (1990), “Labor productivity in UK manufacturing in the 1970s and in the 1980s”, National
Institute Economic Review, 132(1): 71-91 Poirson H., 2000, “ Factor Reallocation and Growth in Developing Countries.” IMF Working Paper
No. 00/94 (Washington: International Monetary Fund). Rao, S. and J. Tang (2005).“Foreign Ownership and Total Factor Productivity.”
Governance,ultinationals and Growth. L. Eden and W. Dobson, Edward Elgar: 100-121. Roodman, D. 2009. "How to do xtabond2: An introduction to difference and system GMM in Stata,"
Stata Journal, Stata Corp LP, vol. 9(1), pages 86-136. Romer, Paul M. (1990), “Endogenous technical change”, Journal of Political Economy, Vol. 48. Sonis, M., GJD.Hewings, J. Guo. 1996. Sources of Structural Change in Input-Output Systems: A
Field of Influence Approach, Economic Systems Research, 8:15-32 Syrquin, Moshe. 1984. "Resource Reallocation and Productivity Growth." In Moshe Syrquin, Lance
Taylor, and Larry E. Westphal, eds., Economic Structure and Perfor-mance. New York: Academic Press.
Syrquin M (1988), “Patterns of Structural Change,” in Hollis B. Chenery and T. N. Srinivasan, eds., Handbook of Development Economics, Vol. I, Amsterdam: North-Holland, 203-273.
Su, Biwei and A. Heshmati (2011). Development and Sources of labour productivity in Chinese provinces, IZA Discussion papers, 6263, Institute for the study of labour (IZA).
Xu, H., Lai, M., Qi, P. (2008).Openness, Human Capital and Total Factor Productivity Evidence from China.Journal of Chinese Economic and Business Studies 63, 279-289.
Vries, G.J., A. A. Erumban, M. P. Timmer, I. Voskoboynikov, H. X. Wua (2012), Deconstructing the BRICs: Structural transformation and aggregate productivity growth, Journal of Comparative Economics, 40 (2012) 211–227
Wei, Y.H. (2000). Investment and Regional Development in Post-Mao China, GeoJournal 51(3), 169-79.
Welch, Finis, (1975) “Education in production”, Journal of Political Economy, January/February. Wooldridge, J.M. (2002), Econometric Analysis of Cross Section and Panel Data, Cambridge,
Massachusetts, The MIT Press
18
Appendices Figure A1: Labour Productivity in BRICS and Other Regions (in ‘000’ USD, constant prices 2000)
Sources: World Bank
Figure A.2: Labour Productivity in BRICS (in ‘000’ USD at constant prices 2000)