1 GLOBALISING GAS MARKETS — IS CONVERGENCE IN PROSPECT? Howard V Rogers Director of Natural Gas Research Oxford Institute for Energy Studies KEYWORDS: convergence, arbitrage, hubs, JCC, contracts, Black Swans, antifragile ABSTRACT While globalisation of natural gas has been much generated much speculation and interest, in practical terms there are still barriers to be overcome. The driving force for globalisation is the profit motive of those in a position to arbitrage between disparately priced markets with flexible supply. Barriers to achieving the connectivity between markets which arbitrage inevitably fosters are sufficient flexible supply, infrastructure physical and contractual accessibility and market contractual structures. This paper examines the potential for such barriers to be overcome in the period to 2025. Given some of the key uncertainties underlying the global supply and demand fundamentals for natural gas the paper will also examine scenarios which are more likely to lead to globalisation and price convergence. Such uncertainties include Asian natural gas and LNG demand, US future production levels and global LNG supply growth. Relevant scenarios will be the subject of quantitative analysis based on data available just prior to the submission date of the paper. Of particular interest will be the implications for North America producers, European consumers, Russian suppliers and Asian LNG markets. INTRODUCTION Despite its inherent advantages as a clean-burning, convenient fuel with low carbon intensity, natural gas suffers from a lower volumetric energy density compared with oil products and coal. Gas markets historically grew around producing gas basins until the growth of long distance pipeline networks in North America and Europe allowed for greater ‘market reach’. The advent of LNG further connected gas resource-rich countries with distant growing economies, creating further ‘connectivity’ between the major gas regions of the world. A key overlay here is the different regional price formation mechanisms which developed as natural gas became established in the energy mix. As connectivity, in the form of physical gas trade increases, might we expect a ‘Darwinian’ struggle between disparate price formation mechanisms? The paper examines the formation of the ‘global gas system’ over the past 20 years and looks forward to 2025 to examine the likely dynamics. OBJECTIVES OF THE PAPER The paper seeks to explore these questions: • What are the characteristics of the three major gas consuming regions of the world (North America, Europe and Asian LNG Importers), including their supply sources ? • With LNG connecting the three regions, what are the dynamics of the ‘system’ so created ? • As supply and demand are influenced by the development of new gas basins and/or unconventional gas development and economic cycles, how might we expect the system to respond in terms of physical flows and price linkages?
Transcript
1
GLOBALISING GAS MARKETS — IS CONVERGENCE IN PROSPECT?
Howard V Rogers Director of Natural Gas Research Oxford Institute for Energy Studies
KEYWORDS: convergence, arbitrage, hubs, JCC, contracts, Black Swans, antifragile
ABSTRACT
While globalisation of natural gas has been much generated much speculation and interest, in practical terms there are still barriers to be overcome. The driving force for globalisation is the profit motive of those in a position to arbitrage between disparately priced markets with flexible supply. Barriers to achieving the connectivity between markets which arbitrage inevitably fosters are sufficient flexible supply, infrastructure physical and contractual accessibility and market contractual structures. This paper examines the potential for such barriers to be overcome in the period to 2025. Given some of the key uncertainties underlying the global supply and demand fundamentals for natural gas the paper will also examine scenarios which are more likely to lead to globalisation and price convergence. Such uncertainties include Asian natural gas and LNG demand, US future production levels and global LNG supply growth. Relevant scenarios will be the subject of quantitative analysis based on data available just prior to the submission date of the paper. Of particular interest will be the implications for North America producers, European consumers, Russian suppliers and Asian LNG markets.
INTRODUCTION
Despite its inherent advantages as a clean-burning, convenient fuel with low carbon intensity, natural gas suffers from a lower volumetric energy density compared with oil products and coal. Gas markets historically grew around producing gas basins until the growth of long distance pipeline networks in North America and Europe allowed for greater ‘market reach’. The advent of LNG further connected gas resource-rich countries with distant growing economies, creating further ‘connectivity’ between the major gas regions of the world. A key overlay here is the different regional price formation mechanisms which developed as natural gas became established in the energy mix. As connectivity, in the form of physical gas trade increases, might we expect a ‘Darwinian’ struggle between disparate price formation mechanisms? The paper examines the formation of the ‘global gas system’ over the past 20 years and looks forward to 2025 to examine the likely dynamics.
OBJECTIVES OF THE PAPER
The paper seeks to explore these questions:
• What are the characteristics of the three major gas consuming regions of the world (North America, Europe and Asian LNG Importers), including their supply sources ?
• With LNG connecting the three regions, what are the dynamics of the ‘system’ so created ?
• As supply and demand are influenced by the development of new gas basins and/or unconventional gas development and economic cycles, how might we expect the system to respond in terms of physical flows and price linkages?
2
KEY DEVELOPMENTS OF THE PAST TWENTY YEARS
Global natural gas consumption for the period 1995 to 2011 has grown on average by 2.6% per annum. As figure 1 shows, LNG and Long Distance Gas1, have increased in importance in this period to represent 17% of global gas consumption. Figure 1 also shows the more pronounced growth in LNG compared with that of ‘long distance’ pipeline gas as defined here. While this serves to describe aggregate global trends, what was happening within the three regions of North America, Europe and Asia?
In North America the gas supply ‘bubble’ of the 1990’s became a ‘sausage’. From a policy and industrial consumer perspective the 1990’s experience gave rise to a view that natural gas was a plentiful, competitively priced resource, as evidenced by the surge in investment in Combined Cycle Gas Turbine (CCGT) generation. Between 1998 and 2003 some 220 GW of new CCGT capacity was built in the US, boosting total generation capacity (all fuel and technology types) by 28%2. Although it was not widely appreciated at the time, the gas bubble/sausage was eroded in the second half of the 1990s, manifesting itself as a narrowing gap between gas production capacity and actual production. By 2000 this ‘buffer’ had been virtually eliminated3.
0.0%
2.0%
4.0%
6.0%
8.0%
10.0%
12.0%
14.0%
16.0%
18.0%
20.0%
0
500
1,000
1,500
2,000
2,500
3,000
3,500
1995 2000 2005 2010
% o
f Tot
al S
uppl
y
bcm
a
Production Consumed Within Region Long Distance Pipeline
LNG Long Distance Pipeline % of Total
LNG % of Total
Source: BP Statistical Review of World Energy
Figure 1 LNG and Long-Distance Pipeline supplies compared with World Total Consumption
1 This excludes pipeline gas flows between reasonably well integrated ‘trading blocs’, i.e. countries within the European region and between the US, Canada and Mexico.
2 ‘LNG Trade Flows in the Atlantic Basin; Trends and Discontinuities’, H.V. Rogers, NG 41, OIES, March 2010, http://www.oxfordenergy.org/2010/03/lng-trade-flows-in-the-atlantic-basin-trends-and-discontinuities/, P. 4
3 ‘Balancing Natural Gas Policy’, National Petroleum Council, September 2003. http://www.npc.org/, P.20
Despite a rising trend in both gas price and rig count, US domestic production fell by 2.1% per year on average between 2001 and 20054. As this trend of falling production became evident, two almost independent supply-side responses were set in motion.
The oil and gas majors began developing large gas discoveries in the international arena to form integrated LNG supply chain projects with a peak of new project approvals reached in 2005. The most notable of these were the Qatari LNG projects but in the same ‘wave’ can be included projects in Russia (Sakhalin), Yemen and Indonesia (Tangguh). The intention with much of the LNG associated with these projects was to keep it ‘destination flexible’ however the investment in North American LNG import regasification terminals is testament to the expectation of the need for significant LNG imports into the US By the end of the 2000s. Total North American LNG import capacity stands at 200 bcma, of which 170 bcma is in the US5.
The US independents had been experimenting with combining horizontal drilling technology with hydraulic fracking to improve the well flowrate of natural gas in shale rocks, whose presence they had long been aware of through exploring for conventional gas. By 2006 shale gas production volumes were becoming significant, by 2010 they accounted for 23% of total US natural gas production6.
As shale gas production boomed the need to for LNG and Canadian pipeline gas imports waned. With Mexico as the only export outlet for US production, supply rapidly outstripped US demand, despite a significant increase in power sector consumption. Falling natural gas prices allowed gas to out-compete coal during 2012 (resulting in increased US coal exports, lowering coal prices in European markets where coal, in turn, undercut gas in the power sector).
US natural gas production during most of 2012 was flat despite a reduction in rigs targeting dry shale plays. Waning dry shale interest in established plays was offset by co-production of gas on wet (NGL-prone) gas plays and shale oil plays with associated gas production. The Marcellus ‘bonanza’ also resulted in a rush to hold leases by drilling despite having to wait for gas gathering, processing and transmission infrastructure to ‘catch-up’. With estimates of the Henry Hub price required for US dry shale gas to ‘break even’ on a full cycle basis at between $5 and $7/mmbtu, clearly one might expect an upward price adjustment as demand rises to meet languishing supply over the next 2 to 3 years.
The ‘light at the end of the tunnel’ for dry shale gas producers is clearly the prospect of converting underutilised LNG regas terminals to export facilities. The first mover in this has clearly been Cheniere’s Sabine Pass facility which has gained all approvals including the much coveted ‘Non-FTA’ permit. Although several terminals have been granted FTA export permits, the only notable LNG importer on the list of FTA countries is South Korea which already holds many long term LNG contracts with non-US suppliers. Although there is considerable uncertainty as to the number of non-FTA permits the US authorities may ultimately grant, the prospects were improved by the publication of the DOE-commissioned report by NERA in December 20127 which was strongly supportive of US LNG exports.
Canada, faced with lowered expectations for pipeline exports to the US market, is also supportive of west coast LNG export projects with Asian markets in mind. These would be ‘greenfield’ projects rather than
4 Based on EIA data.
5 ‘The LNG Industry in 2011’, GIIGNL, http://www.giignl.org/fileadmin/user_upload/pdf/A_PUBLIC_INFORMATION/LNG_Industry/GIIGNL_The_LNG_Industry_2011.pdf, P 24
liquefaction add-ons and to date sponsors have been keen to seek oil-indexed LNG pricing formulae within a long-term contract framework. This price formation mechanism is becoming less attractive for prospective Asian LNG buyers.
Despite the development of the highly prospective gas resources offshore the UK, Norway and onshore in the Netherlands from the 1960s onwards, the European region8 has been a net importing natural gas market from the 1970s onwards. Pipeline imports from Russia, Algeria, Libya, Azerbaijan and Iran in 2011 constituted 33% of Europe’s requirements and LNG, from a range of suppliers, 17%. The development of the Netherland Groningen field in the 1960’s posed the problem of ‘what basis to set the gas sales price at?’ The solution arrived at was to price gas at just below that of gasoil and fuel oil in the competing space heating and power generation sectors determined by a formula in long-term sales contracts9. This approach was subsequently adopted for Russian, Norwegian and North African pipeline supplies imported into continental Europe as well as for LNG prior to the mid 2000s. In contrast to continental Europe, in the 1970s the UK developed its natural gas resources initially under a ‘cost plus’ inflation-linked contractual pricing basis through the then state monopoly British Gas. During the 1980s and early 1990s the creation of a traded market for gas proceeded in parallel with a reduction in the role of the state monopoly through acts of Parliament. From 1996 the UK market, traded at the National Balancing Point (NBP) became the only traded gas market of significance outside of North America. The construction of the UK to Belgium Interconnector in 1998 created the ability for traders to arbitrage between UK traded gas and oil-indexed long-term contract gas on the European Continent, resulting in pattern of seasonal convergence between the two pricing sets in the period 2000 to 2008.
In Asia, lacking material domestic natural gas resources, Japan, Korea and Taiwan became LNG importers in 1969, 1986 and 1990 respectively with supplies from regional producers Alaska, Indonesia, Malaysia, Brunei and Australia but also supplemented by Middle East suppliers Abu Dhabi, Qatar and Oman and from Africa Nigeria, Egypt and Algeria. The long term contract price formation for Asian LNG supplies was based on a relationship to Japan Custom Cleared (JCC)10 crude prices. The key correlation between LNG price and oil price (the ‘slope’) is the key focus of discussion in relation to recent contractual agreements. Historically however the contract price has been bounded by ‘floors’ and ‘ceilings’ and in a more sophisticated form, formulaic breakpoints at specified oil prices such that the LNG price – oil price relationship under some contracts could be described as an ‘S’ curve. The demand for natural gas in the countries of Japan, Korea, Taiwan, India and China has been growing at a CAGR of 10% over the 2005 to 2011 period and 9% for LNG. The consensus view of the industry is that demand for LNG in these countries will continue on a robust growth path for the foreseeable future.
EVOLUTIONARY DEVELOPMENTS 2005 TO 2010 – STEPS TOWARDS ANTI-FRAGILITY?
Nassim Taleb in 2007 published ‘The Black Swan’ – which presciently anticipated the 2008 financial crisis – focussing on the potentially devastating impact of low probability events on interconnected vulnerable systems. His most recent book published in November 2012 is ‘Antifragile: Things That Gain from Disorder’. Taleb describes the central thesis as follows: ‘Some things benefit from shocks; they thrive and grow when exposed to volatility, randomness, disorder, and stressors…’ The remainder of this paper will explore the idea that the global gas system is already on a path of evolutionary adaptation in response to unforeseen events in market fundamentals.
8 Including Turkey and the Balkans
9 The gas price being linked to a 6 to 9 month rolling average of gasoil and fuel oil prices.
10 Otherwise known in the vernacular as Japanese Crude Cocktail
Certainly in the recent past we can list several events which if debatably ‘Black Swans’ were certainly events which were unforeseen and which elicited an adaptive response from the industry:
• Against a background of rapid gas demand growth, the 2000s witnessed the largely unforeseen decline in LNG output from Indonesia’s Arun and Bontang liquefaction facilities as natural gas feedstock availability deteriorated. This, coupled with Japan’s nuclear reliability issues including the shutdown of the 8.2GW Kashiwazaki Kariwa plant following earthquake damage in 2007, resulted in a tightening LNG market and high spot prices. The response from a well-supplied European market was to hurriedly negotiate diversion clauses into previously inflexible long term LNG supply contracts in order to share the Asian spot price ‘upside’ between buyer and seller.
• The ‘triple coincidence’ of surging US shale gas production, the post 2008 recessionary gas demand decline in Europe and the ‘wave’ of new LNG supply from Qatar, Yemen, Russia and others from 2009. This together with a liberalising downstream market landscape in North West continental Europe resulted in midstream utilities ‘buying high’ on long term oil indexed pipeline gas contracts with Russia, and ‘selling lower’ to customers demanding hub based prices. Unsustainable losses triggered the renegotiation and arbitration of the long term oil indexed contract paradigm. The reduction in demand for LNG in Asia in 2009 may have resulted in some buyers exercising ‘downward tolerance’ within long term LNG contracts, with the volumes not nominated ending up as spot cargoes also seeking markets in Europe.
• The Fukushima disaster has since mid-2011 led to a surge in LNG demand to compensate for the loss of nuclear generation capacity (at a time of slow growth in global LNG supply). This has resulted in a re-direction of LNG supplies (contracted and flexible) away from Europe and towards Asia. Although this could be expected to lead to a major shift in European gas supply patterns this has not occurred due to a continued slump in European natural gas demand through a combination of the economic recession, and increased power generation by coal and renewables at the expense of gas. In Japan the loss of nuclear generation capacity and the consequent increase in the use of LNG at oil-indexed prices has resulted in the power generation utility companies being unable to pass on the full costs of generation to end-consumers. As a consequence most are either losing money or at best barely breaking even. Not surprisingly this has led to increasing discontent with continuing with LNG pricing mechanisms based on a linkage to crude oil prices.
• A ‘prospective’ Black Swan which is exercising minds from Moscow to Tokyo is the increasingly probability of the export of significant volumes of LNG from the US. In part this builds on the second bullet whereby the emergence of shale gas growth post 2008 in the US rendered the 200 bcma of regas facilities constructed in North America almost redundant. These stranded assets however serve to provide a base for conversion to LNG export facilities at a lower incremental investment costs than greenfield LNG projects in the rest of the world. We will return to this development and its possible consequences later in the paper.
What can be learned from the developments of the last 20 years in terms of regional gas markets and the impact of unforeseen changes? We observed that due to the low energy density of natural gas, regional markets historically tended to develop in isolation. LNG in its early (pre 2005) era tended to follow a ‘tramline’ model with rigid long term contracts defining specific supplier to consuming country supply routes. Absent the ‘Black Swan’ events bulleted above we might reasonably have expected the status quo to have continued – with the key natural gas consuming regions existing in ‘parallel universes’ with their own specific contracting and price formation mechanisms.
What these events did however, was to offer individual players the option to a) stick with established behaviours and incur lower financial rewards or even losses, or, b) take advantage of unforeseen opportunities, even where this may require contract renegotiation or infrastructure investment. Enlightened self-interest generally tends towards option b) and as in the wider history of commerce, inter-regional trade
6
exerts a powerful influence on its participants as they adapt to changing circumstances. The evolutionary adaptation in response to the gas world Black Swans has set in motion a ‘Darwinian’ dynamic, currently playing out in Europe and potentially to be catalysed in Asia through US LNG exports.
What we can conclude from this can be summed up the following simple statements:
• The ‘old’ systems based on separate regional contracting structures and price formation mechanisms were/are ‘fragile’ when faced with Black Swan events.
• Things change when buyer and seller both see value through inter-regional new trade opportunities.
• Things change when big players lose big money.
• Because evolutionary changes generally result in greater system flexibility this may be expected to greater system resilience to future unforseen events.
THE SYSTEM AS IT STANDS IN 2013 AND THE OUTLOOK TO 2015
Figure 2 is a depiction of the current three region gas system connected by LNG.
Source: Author Figure 2. World System – Present Day Situation
The tap (faucet) represents global LNG supply. The established Asian LNG importing markets have the first call on this supply (Japan, Korea, Taiwan, China and India). Also recognised are the new and niche markets whose consumption is relatively small. The LNG supply remaining after Asia has taken its requirement is available for the North America and Europe. In North America currently only small volumes of LNG are
7
imported11. These comprise volumes to Canada Mexico and to parts of the US East coast which are not well served by gas pipeline supply. With domestic production continuing to outpace demand, US storage inventories exceed ‘normal’ historic levels, certainly in terms of the inventories required to see the US comfortably through a ‘severe’ winter heating season.
In Europe consumption requirements are met by a combination of domestic production (in long term decline), pipeline imports (mainly from Russia but also from North Africa, Azerbaijan and Iran) and LNG. Pipeline imports have historically been the subject of long term oil indexed contracts. As mentioned earlier, since 2008 buyers have struggled to meet Take or Pay levels under these contracts in face of LNG supply available on rapidly developing trading hubs in North West Europe at prices lower than oil indexed contract prices. This is depicted in Figure 2 by pipeline imports being around what is termed the ‘Minimum Supply Floor’ with the pink ‘Additional Capacity’ area representing production available at short notice but not required by Europe due to the availability of flexible LNG supplies and a low demand growth environment.
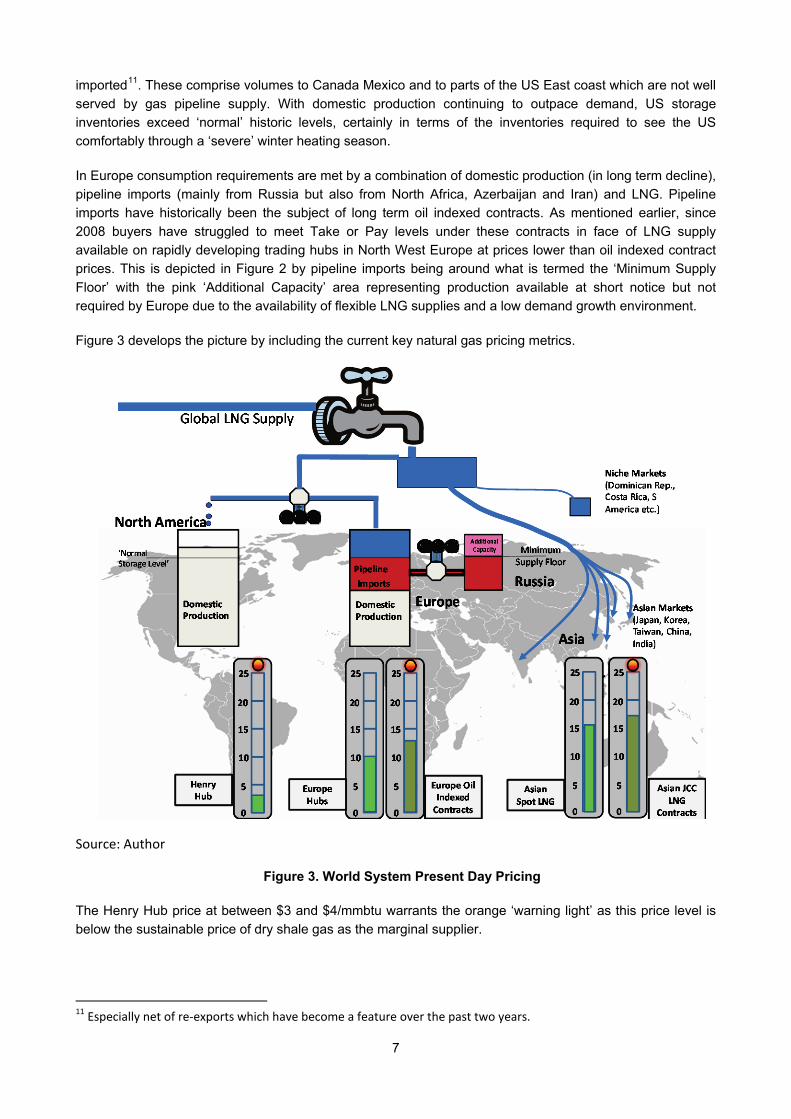
Figure 3 develops the picture by including the current key natural gas pricing metrics.
Source: Author
Figure 3. World System Present Day Pricing
The Henry Hub price at between $3 and $4/mmbtu warrants the orange ‘warning light’ as this price level is below the sustainable price of dry shale gas as the marginal supplier.
11 Especially net of re-exports which have become a feature over the past two years.
8
In Europe current hub prices are around $10/mmbtu however the price of gas from oil-indexed pipeline contracts is between $13 and $14/mmbtu. The orange warning light is shown as for midstream utilities in the position of buying gas at these contract prices and selling to end customers on a hub-related price level, this is not a financially sustainable situation. In fact during 2011 and 2012 a number of negotiated concessions have taken place (under threat of arbitration) to reduce contract prices to levels closer to hub prices. This is viewed as an intermediate step towards the transition to basing long term contracts on hub indices in the future.
In Asia, post Fukushima, spot LNG prices have oscillated12 but have exhibited a higher spread with European hub prices than was the case historically (prior to Fukushima). In part this is explained by the slow pace at which LNG has been redirected from Europe towards Asia and in part possibly due to sellers insisting on prices benchmarked to JCC contract prices in a tight market. The Asian JCC price is shown as around $17/mmbtu with an alarm light due to the aforementioned financial plight of Japanese buyers unable to pass through these costs to end customers.
The outlook to 2015 is bounded by a lack of significant new LNG supply coming on-stream. With North America remaining as a self-sufficient market requiring only minimal quantities of LNG imports, the outlook is currently something of a ‘Tug-of-War’ for available volumes between Europe and Asia. This would imply a requirement for Europe to import higher levels of Russian gas and, if this occurs prior to the full transition to hub-based pricing probably at a slightly higher price than that currently prevailing. However uncertainty is introduced by the following factors:
• The extent to which European demand is further eroded by economic recession and the growth of renewables in power generation. Demand for gas could be increased however by the retiral of significant coal fired capacity in the UK and elsewhere as a consequence of the EU-wide Large Combustion Plant Directive.
• The extent and timing of Japanese nuclear re-starts from mid-2013 onwards.
• The rate at which China’s LNG imports ramp-up once currently under construction re-gas facilities come online.
In the period to 2015 there is no compelling reason to expect the situation in Figure 3 to change markedly, apart from slightly higher volumes of pipeline gas into Europe, possibly slightly higher European Hub prices and possibly lower Asian LNG spot prices relative to European prices if significant Japanese nuclear capacity is brought back online.
THE SITUATION BEYOND 2015 ― UNCERTAINTIES
2015 is a key year for key elements of the world gas system in that significant trends which become key drivers of global fundamentals begin at or around this point:
Asian LNG Demand:
Japan: By 2015 it should be clear what level of post Fukushima LNG imports Japan will stabilize at. The residential, commercial and industrialised demand growth trends are in themselves likely to be modest so a step-down from 120 bcma of LNG imports to say 105 bcma would be a significant and lasting change.
12 In August 2012 the Asian LNG price was around $13/mmbtu.
9
South Korea: Although the 2010 rebound in LNG imports from the post-crisis year of 2009 was impressive, Korean LNG import growth slowed noticeably in 2011 and 2012. There is no obvious reason why stronger growth should resume in future.
China: It is not clear what the future upside to Turkmenistan pipeline gas imports to China will be. 2015 may mark the stage at which these reach a plateau for a while. Absent any agreement on Russian pipeline imports (on-stream 2020 at the earliest) a continuous growth trend in China’s natural gas demand could result in an acceleration in LNG imports from around 2015 onwards. Given the number of ‘moving parts’ however this is difficult to firm up and will likely be a continuing uncertainty.
North American US LNG Exports:
Assuming that the US Administration develops policy in line with the NERA report which concluded that US LNG exports were beneficial to the US in a macroeconomic sense it is expected that other projects will join Sabine Pass in achieving the Non – Free Trade Agreement export permit. The pace at which approvals will be granted is unknown; but there is no shortage of candidates. As of Jan 4th 2013, in addition to Sabine Pass (2.2 bcfd/23 bcma) which had already gained its non-FTA approval, there were 18 projects which had gained FTA approval and were awaiting non-FTA approval, representing in aggregate a total of 22.6 bcfd (234 bcma) of potential LNG export capacity13. In addition, projects representing a further 4.4 bcfd (45.5 bcma) of potential capacity had yet to apply for non-FTA approval. To put this into perspective, total world LNG supply in 2012 was around 31.5 bcfd (326 bcma). Approval of only a portion of the projects on the list would have a significant impact on global LNG tradeflows.
While the level and pace of LNG export project approvals are a key factor, (and it should be borne in mind that construction of each would likely take around three to four years), this LNG supply source will have very different dynamics to existing and planned LNG projects in other parts of the world. Typically a conventional project would have dedicated fields providing feedgas to the liquefaction plant with liquefaction output maximised given the high up-front capital investment requirements and very low variable operating costs. If output is not taken by customer nominations under long term contracts these ‘spare’ volumes are sold as spot cargoes. The one exception to this general modus operandi is the situation where feedgas is unavailable due to poor upstream planning vis a vis domestic market demand growth. Examples are Algeria, Nigeria and Egypt. Such diversions to the domestic market are invariably short-term expedients and are economically sub-optimal given the low regulated prices generally pertaining there.
The US regas conversion LNG export projects involve lower unit capital cost compared to greenfield LNG projects (as storage tanks and jetties are sunk costs). Feed gas will be sourced from the US transmission system (and hence its cost related to US hub prices) and the continued rationale for exports will depend on the margin between the destination market sales price and the US hub price exceeding the sum of the liquefaction plant tolling fee, the LNG shipping cost and the destination market re-gas fee. If exported US LNG is sold on the European gas trading hubs or the Asian LNG spot market clearly it could influence the prices in those markets in addition to the prices on US hubs. The range of price spread viability is shown in Table 1.
Note: Full Cost Asian figures assume the widening of the Panama Canal to admit LNG vessels.
Setting to one side for the moment the question of the volume of US LNG which could be absorbed by destination markets at the ‘Full Cost Europe’ or ‘Asian’ price levels in Table 1, there is also the question of the US production potential to supply both LNG export volumes and meet US domestic demand at the corresponding Henry Hub prices. I would contend that despite the considerable resources devoted to modelling US production trends over the past few decades, the answer to this latter question is unknowable. What can be deduced however, is that the specific dynamics of US LNG exports are such that export volumes will be limited by the impact of arbitrage between US and destination market prices even if substantial levels of LNG export capacity are built.
In mid 2012 there were four Canadian west coast LNG projects under consideration, in aggregate amounting to 4 bcfd (41 bcma) of potential capacity. Whilst Canadian Authorities are likely to be supportive of the prospect of LNG exports to Asian markets (especially given the decline in pipeline exports to the US in recent years), these are greenfield projects with higher ‘money forward’ unit capital requirements. At present the outcome for these projects is uncertain.
NON NORTH AMERICAN LNG PROJECTS
Figure 4 shows past and future estimates for non-North American LNG supply. The post 2014 increase is primarily driven by the start-up of new Australian projects but there is considerable uncertainty as to the timing of projects which have not yet achieved FID and also on the ultimate scale and timing of East African potential (Mozambique and Tanzania), shown here as starting from 2019.
11
0
100
200
300
400
500
600
700
800
900
1000
2004 2009 2014 2019 2024
BCM
A
Further East Africa &OtherTanzania
Mozambique
Russia
Australia
Nigeria
Yemen
USA - Kenai
Trinidad
Qatar
Peru
Papua New Guinea
Oman
Norway
Malaysia
Libya
Israel
Iran
Indonesia
Eq. Guinea
Egypt
Cameroon
Brunei
Brazil
Abu Dhabi
Angola
Algeria
Risked
Un-risked
Risked at 50%
Firm only
Source: Waterborne LNG, D Ledesma OIES, Author’s Estimates
Figure 4. Non-North American LNG Supply
Even where projects are under construction there is scope for schedules to slip and production start delayed. This is especially the case in Australia where the industry is building several projects in parallel. A simplistic but effective approach is to assume a probability factor of 50% for projects not yet sanctioned, bearing in mind that these could be deferred in response to large volumes of US LNG exports competing for the same markets. In this context it should be noted that the $12.40/mmbtu break-even figure for US LNG exports to Asia at a 6/mmbtu Henry Hub price is lower than consensus breakeven figures for some of the more expensive Australian future projects, some or which are of the order of $14/mmbtu.
SHALE GAS DEVELOPMENT OUTSIDE NORTH AMERICA
The success of shale gas in North America has understandably raised hopes and expectations that other regions of the world, with identified shale hydrocarbon source rocks might similarly exploit this potential. Studies on the outlook for shale gas in Europe and China14 conclude that material volumes of shale gas production are unlikely before 2020. The two main reasons are the lack of resource evaluation to date (compared with the US where 100-plus years on onshore drilling for conventional hydrocarbons has established a comprehensive database), and the lack of an innovative and dynamic onshore upstream service sector compared with North America. Accepting that these barriers can be overcome through time, the overriding uncertainty is whether shale plays, with the appropriate fracking approach will, on average, 14 Can Unconventional Gas be a Game Changer in European Gas Markets?’, Florence Geny, 2010, http://www.oxfordenergy.org/2010/12/can-unconventional-gas-be-a-game-changer-in-european-gas-markets/ ‘Will there be a Shale Gas Revolution in China by 2020 ?’, Fan Gao, 2012, http://www.oxfordenergy.org/2012/04/will-there-be-a-shale-gas-revolution-in-china-by-2020/
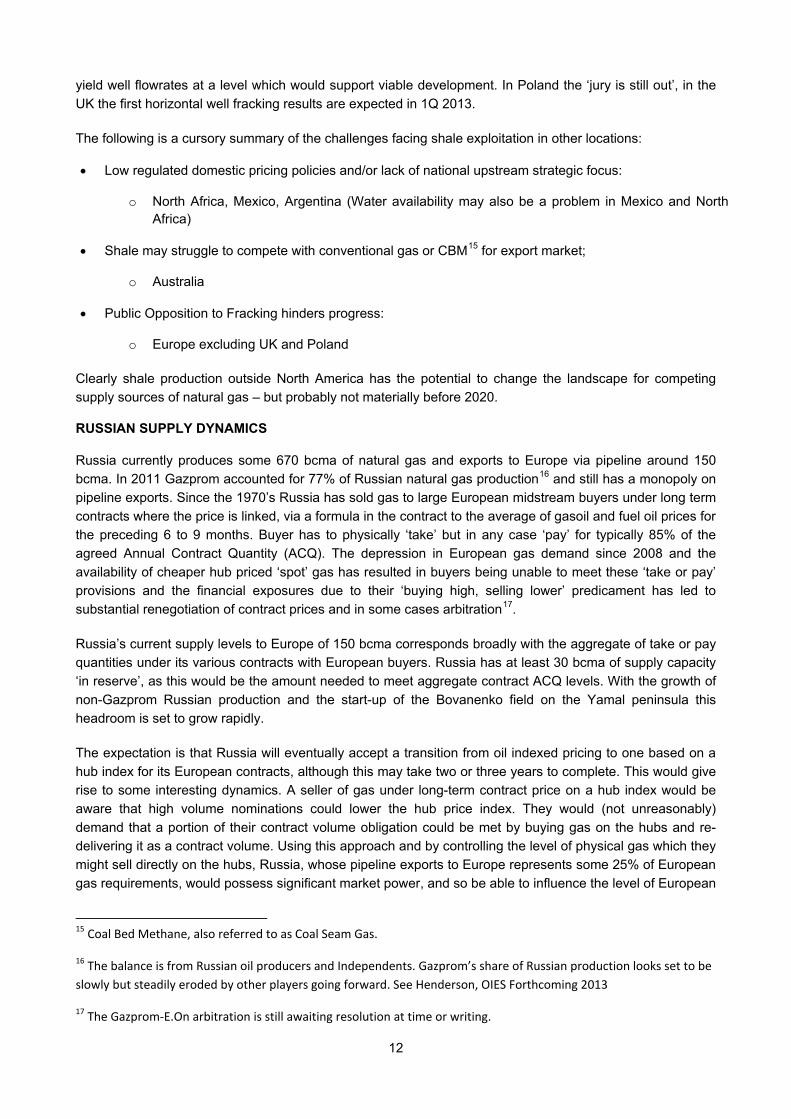
yield well flowrates at a level which would support viable development. In Poland the ‘jury is still out’, in the UK the first horizontal well fracking results are expected in 1Q 2013.
The following is a cursory summary of the challenges facing shale exploitation in other locations:
• Low regulated domestic pricing policies and/or lack of national upstream strategic focus:
o North Africa, Mexico, Argentina (Water availability may also be a problem in Mexico and North Africa)
• Shale may struggle to compete with conventional gas or CBM15 for export market;
o Australia
• Public Opposition to Fracking hinders progress:
o Europe excluding UK and Poland
Clearly shale production outside North America has the potential to change the landscape for competing supply sources of natural gas – but probably not materially before 2020.
RUSSIAN SUPPLY DYNAMICS
Russia currently produces some 670 bcma of natural gas and exports to Europe via pipeline around 150 bcma. In 2011 Gazprom accounted for 77% of Russian natural gas production16 and still has a monopoly on pipeline exports. Since the 1970’s Russia has sold gas to large European midstream buyers under long term contracts where the price is linked, via a formula in the contract to the average of gasoil and fuel oil prices for the preceding 6 to 9 months. Buyer has to physically ‘take’ but in any case ‘pay’ for typically 85% of the agreed Annual Contract Quantity (ACQ). The depression in European gas demand since 2008 and the availability of cheaper hub priced ‘spot’ gas has resulted in buyers being unable to meet these ‘take or pay’ provisions and the financial exposures due to their ‘buying high, selling lower’ predicament has led to substantial renegotiation of contract prices and in some cases arbitration17.
Russia’s current supply levels to Europe of 150 bcma corresponds broadly with the aggregate of take or pay quantities under its various contracts with European buyers. Russia has at least 30 bcma of supply capacity ‘in reserve’, as this would be the amount needed to meet aggregate contract ACQ levels. With the growth of non-Gazprom Russian production and the start-up of the Bovanenko field on the Yamal peninsula this headroom is set to grow rapidly.
The expectation is that Russia will eventually accept a transition from oil indexed pricing to one based on a hub index for its European contracts, although this may take two or three years to complete. This would give rise to some interesting dynamics. A seller of gas under long-term contract price on a hub index would be aware that high volume nominations could lower the hub price index. They would (not unreasonably) demand that a portion of their contract volume obligation could be met by buying gas on the hubs and re-delivering it as a contract volume. Using this approach and by controlling the level of physical gas which they might sell directly on the hubs, Russia, whose pipeline exports to Europe represents some 25% of European gas requirements, would possess significant market power, and so be able to influence the level of European
15 Coal Bed Methane, also referred to as Coal Seam Gas.
16 The balance is from Russian oil producers and Independents. Gazprom’s share of Russian production looks set to be slowly but steadily eroded by other players going forward. See Henderson, OIES Forthcoming 2013
17 The Gazprom-E.On arbitration is still awaiting resolution at time or writing.
13
hub prices. With growing supplies of production for the Russian domestic market from non-Gazprom producers while Gazprom continues to bring on large new production projects based on pre-recession demand forecasts –Russia is emerging as the key provider of short-term swing production in a changing gas world. The strategic dilemmas Russia will face between price and market share target for its European pipeline exports are a key focus of the next section of the paper.
GLOBAL GAS SYSTEM DYNAMICS BEYOND 2015
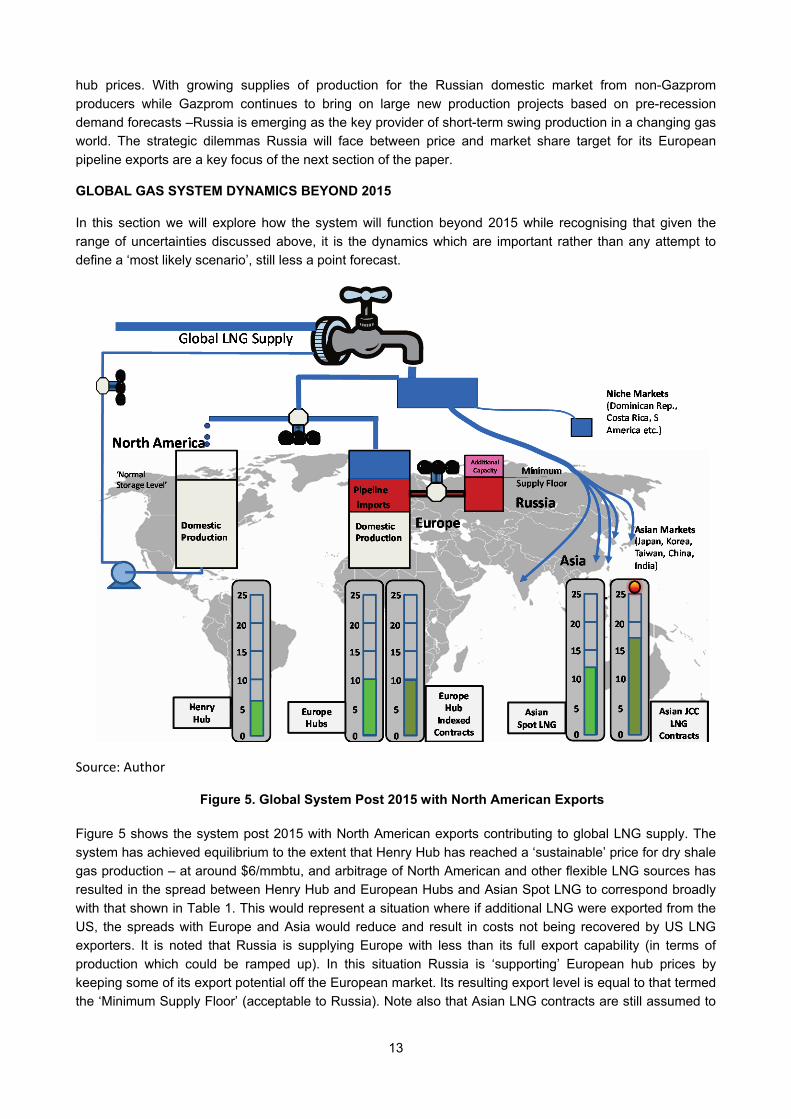
In this section we will explore how the system will function beyond 2015 while recognising that given the range of uncertainties discussed above, it is the dynamics which are important rather than any attempt to define a ‘most likely scenario’, still less a point forecast.
Source: Author
Figure 5. Global System Post 2015 with North American Exports
Figure 5 shows the system post 2015 with North American exports contributing to global LNG supply. The system has achieved equilibrium to the extent that Henry Hub has reached a ‘sustainable’ price for dry shale gas production – at around $6/mmbtu, and arbitrage of North American and other flexible LNG sources has resulted in the spread between Henry Hub and European Hubs and Asian Spot LNG to correspond broadly with that shown in Table 1. This would represent a situation where if additional LNG were exported from the US, the spreads with Europe and Asia would reduce and result in costs not being recovered by US LNG exporters. It is noted that Russia is supplying Europe with less than its full export capability (in terms of production which could be ramped up). In this situation Russia is ‘supporting’ European hub prices by keeping some of its export potential off the European market. Its resulting export level is equal to that termed the ‘Minimum Supply Floor’ (acceptable to Russia). Note also that Asian LNG contracts are still assumed to
14
be priced off JCC – resulting in the wide price range with spot prices (assuming crude price broadly at around $110/bbl).
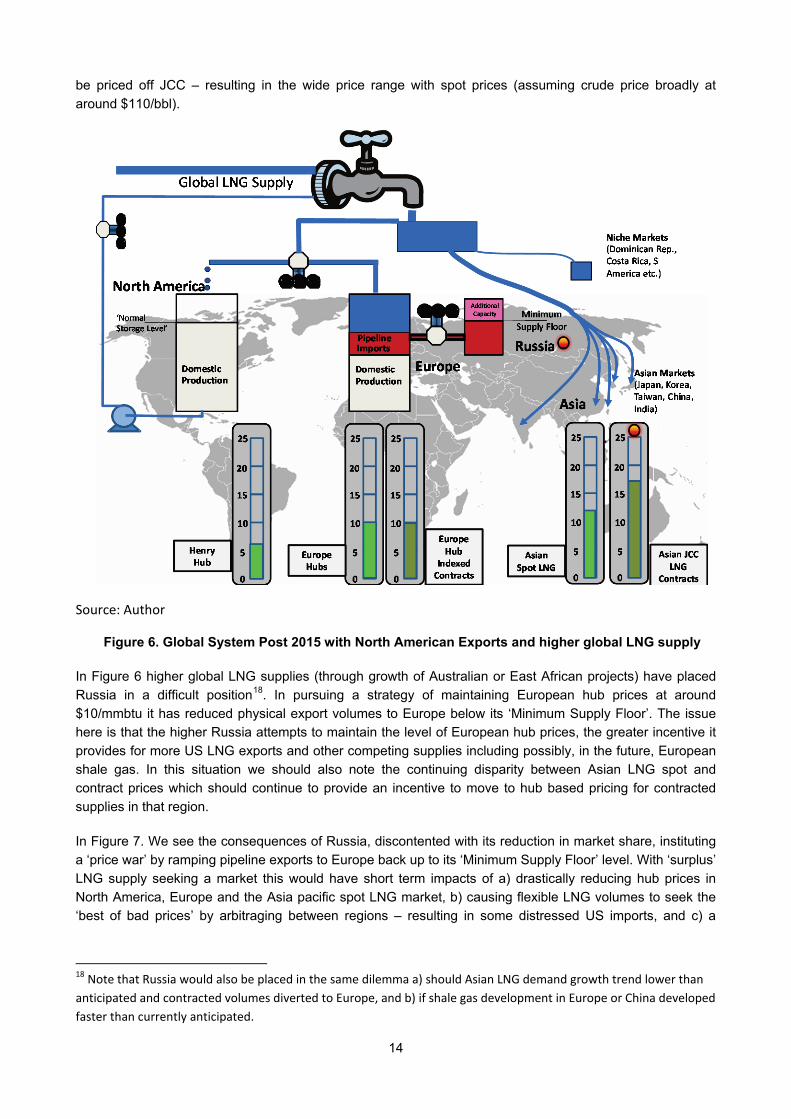
Source: Author
Figure 6. Global System Post 2015 with North American Exports and higher global LNG supply
In Figure 6 higher global LNG supplies (through growth of Australian or East African projects) have placed Russia in a difficult position18. In pursuing a strategy of maintaining European hub prices at around $10/mmbtu it has reduced physical export volumes to Europe below its ‘Minimum Supply Floor’. The issue here is that the higher Russia attempts to maintain the level of European hub prices, the greater incentive it provides for more US LNG exports and other competing supplies including possibly, in the future, European shale gas. In this situation we should also note the continuing disparity between Asian LNG spot and contract prices which should continue to provide an incentive to move to hub based pricing for contracted supplies in that region.
In Figure 7. We see the consequences of Russia, discontented with its reduction in market share, instituting a ‘price war’ by ramping pipeline exports to Europe back up to its ‘Minimum Supply Floor’ level. With ‘surplus’ LNG supply seeking a market this would have short term impacts of a) drastically reducing hub prices in North America, Europe and the Asia pacific spot LNG market, b) causing flexible LNG volumes to seek the ‘best of bad prices’ by arbitraging between regions – resulting in some distressed US imports, and c) a
18 Note that Russia would also be placed in the same dilemma a) should Asian LNG demand growth trend lower than anticipated and contracted volumes diverted to Europe, and b) if shale gas development in Europe or China developed faster than currently anticipated.
15
cessation of US LNG exports which would otherwise destined for European or Asian on a flexible or spot basis (as liquefaction tolling fees and transport and regas costs would not be covered).
Source: Author
Figure 7. Global System Post 2015 with North American Exports and higher global LNG supply & Russia asserting European Market Share
The situation shown in Figure 7 would be relatively short lived however since:
• Natural gas demand would be stimulated – mainly in the power sectors of North America and parts of Europe while gas is more competitive than coal. In the residential & commercial and industrial sectors additional demand might be created in response to low prices, but more gradually over time given past observed behaviour.
• Investment in alternative supplies (LNG, pipeline exports and domestic production) in Europe and Asia would be deferred for the duration of the low price episode.
• US upstream investment in natural gas would slow until prices rose to more sustainable levels.
In this context it is worth noting the indicative response times of key suppliers into this system:
• Greenfield LNG Projects: 4 – 5 years from FID
• US LNG Projects adding liquefaction to existing re-gas: 3 to 4 years from FID
• US shale production: 1 – 2 years from FID.
• Russian ramp-up of existing headroom production capacity: days
16
PROSPECTS FOR CONVERGENCE?
The outlook for the global gas system at present is generally supportive of a trend towards if not convergence between regional hub prices, at least a relationship between these prices – through the dynamics of flexible LNG arbitrage. The prospect of virtually all natural gas to move to hub-based pricing in Europe is likely given the transition underway since 2008. In Asia, we might expect a closer relationship between the LNG spot price and Atlantic Basin hub prices once the period of market tightness, caused in the main by the aftermath of the Fukushima disaster, eases.
The ‘stand-off’ between Asian LNG buyers (desiring a price related to Henry Hub) and non-North American Asian LNG suppliers (insisting on a continuation of a JCC-linked price) is the most obvious barrier to achieving more widespread price relationships through the LNG-connected world. This has the potential to become an entrenched debate. The buyers (especially Japanese mid-stream companies losing money while nuclear generation is shutdown or operating at low load factors) are unlikely to capitulate while there is a prospect of higher volumes of North American LNG exports at delivered prices lower than those perceived under future JCC contracts. It remains to be seen however whether Asian buyers will seek to challenge the pricing terms of existing JCC contracts, and on what grounds.
For the sellers, the background of rising oil price since 2000 (albeit its dip in 2008/2009 but subsequent rapid recovery) has led to a conviction that only JCC-indexation will provide a high enough price to remunerate an adequate return for high cost-base LNG projects (particularly the case for Australia). This is understandable for the individual project sponsors, however it could be argued that it perpetuates what Taleb might term a ‘fragile’ system when the full value chain is considered. Producers may be under the illusion that they have mitigated LNG price/volume risk when all they have really succeeded in doing is to place it all on the buyer. When the buyer is unable to pass on this risk (as has been the case in Europe and as is the case currently in Japan) the system becomes unstable.
The conceptual attraction of a hub-based system for natural gas pricing is that a) it provides a means by which price encapsulates supply and demand fundamentals to provide a signal for more or less supply. Although this sounds urbane, the counterfactual is instructive. With oil and gas market end-use sectors increasingly divergent, a fall in the oil price at a time of tight gas market fundamentals would, absurdly, under the present Asian JCC paradigm, signal a reduction in new LNG project development.
What of the challenge from LNG suppliers that without JCC linked pricing, LNG projects would ‘become impossible to finance’? Certainly if the Asian buyers introduced an effective ‘embargo’ on any new JCC contracts it would result in a slowdown in the progression of the more expensive (on a unit cost basis) LNG projects. What might be the consequences flowing from this?
• It would provide an even higher market volume potential for US LNG export projects whose off-takers were comfortable selling volumes on a Henry Hub related basis.
• It would give a clear competitive advantage to strong upstream players whose needs for financing were moderate.
• It would require the banks, fearing a loss of major revenue, to revert to a ‘first principles’ approach to project assessment i.e. an in-depth market assessment followed by assurance that the project in question had the attributes and metrics of an intra-marginal supplier.
The logic of this approach of course is that high-cost projects do not get developed, if they can be substituted by lower cost supplies. This ultimately improves the health of the sector by increasing the competitiveness of gas compared with other fuels and by definition the viability of end-user businesses consuming natural gas.
17
This is unlikely to be a popular conclusion in many quarters but it does feel like an evolutionary adaptation towards a more stable or ‘antifragile’ system – in aggregate, though at the expense of high cost base projects which would not attract funding.
SUMMARY AND CONCLUSIONS
This paper examined the key distinguishing features of the key regional gas markets of North America, Europe and Asia as they developed in relative isolation from the 1970s onwards. Whilst it is possible to construct a narrative of how such systems might have continued a ‘parallel universe’ existence with separate contractual and pricing paradigms, we noted that several real world Black Swan’s in the period since 2005 offered the possibility of added value (or at least mitigated losses) through inter-regional trade at the cost of either infrastructure investment or contractual renegotiation and compromise on price formation mechanisms.
The transition to a more interlinked global system in which regional gas prices reflect supply and demand fundamentals and are linked by arbitrage does not necessarily guarantee a smooth ride however; there some key uncertainties. Will Asian LNG demand continue on its current trajectory or slow to a more moderate pace? Will the new LNG supplies from the US, Canada, Australia and East Africa coincide and create a new supply glut? Will shale gas development outside of North America make a significant contribution, and in what timeframe ?
The ‘shock absorber’ in this system is Russia with its rapidly growing production headroom over current supply levels to Europe. At times of high Asian LNG uptake, Russia could easily supply more pipeline gas to Europe. In the face of an LNG supply glut, Russia could reduce its supply. Despite the temptation to exploit market power, Russia would be mindful that this would merely encourage additional LNG exports from North America and elsewhere and provide a greater incentive to develop European shale resources if such potential is proven.
With the likelihood that a material volume of US LNG exports can be expected post 2015, there are good prospects for a world in which natural gas prices in North America, Europe and the Asian LNG spot market are related, with the transport cost differential of the marginal flexible LNG producer determining price spreads.
In time this relationship may also apply to Asian LNG when sufficient volumes transfer to a hub-based contract price formation mechanism. This is the next focus for evolutionary adaptation although if existing contracts are unchallenged such a transition could take place over an extended timescale compared to that which is happening in European pipeline gas.