24
GLOBALIZATION Issue: Just how new and different??? Key components of a position on this issue.
| Date post: | 21-Dec-2015 |
| Category: |
Documents |
| View: | 215 times |
| Download: | 1 times |

GLOBALIZATION
Issue: Just how new and different???
Key components of a position on this issue.

1. Rooted in ‘long 16th C’ changes
Trade pattern changesfoundations for industrializationnew international division of
labor Core vs. Periphery

2. Growth of international investment
Transnational Corporation (TNC) as one product
gradual shift from trade to production

3. Late 20th C distinctiveness
Internationalization processes create SHALLOW INTEGRATION
Globalization processes create functional integration and DEEP INTEGRATION

4. Need to examine Production Chains
TNCs coordinate and reorganize

5. Role of groundwork laid post WWII
Bretton Woods system adoption of free trade tieing of currencies to $US to
provide financial lubricant creation of an international
institutional frameworkInternational Monetary FundWorld BankGATT-------> WTO

6. No diminishment of geographic clustering

Useful Sources
Michael Webber and David Rigby. 1996. The Golden Age Illusion
Dean Baker, Gerald Epstein and Robert Pollin, eds. 1998. Globalization and Progressive Economic Policy.

Production
Economic growth six times from 1950 to 1990 just under 3 times per capita
unevenness of growth

Average annual growth rate of real GDP, 1951-1992.

Pre - vs. Post -1974
GDP GrowthRate
OECD USA JAPAN CANADA AUSTRALIA
1954-74 av. rate 4.65 3.00 8.88 5.04 4.791975-91 av. rate 2.61 2.63 4.31 2.85 2.82

Why the break in 1970s???
OPEC quadruples oil prices in 1973
other commodity prices had been rising steeply
acceleration of labor costs in industrialized countries
increasing instability of international monetary system

Economic Growth over the Longer Run
1870-1913 1950-73 1973-92 1991-96World 1.3 2.9 1.2 1.9Western Europe 1.3 3.9 1.8 1.1U.S., Canada, Australia 1.8 2.4 1.4 1.7Southern Europe 1.1 4.9 1.7 n.a.Eastern Europe 1.0 3.5 -1.1 -6.5Latin America 1.5 2.5 0.5 1.3Asia 0.6 3.8 3.2 7.5Africa 0.4 2.0 -0.1 -0.6

Global Shifts in Production

Other shifts
Decline in US sharerise of Japanrapid decline in shares of
Eastern Europe since 1990most of developing country
growth shown by Asian NIEs and ASEAN4

International Economic Integration
Trade

1820 1870 1913 1929 1950 1973 1992
World 1.0 5.0 8.7 9.0 7.0 11.2 13.5Western Europe --- 10.0 16.3 13.3 9.4 20.9 29.7Eastern Europe --- 2.1 3.5 4.9 3.6 7.1 0.5U.S. 2.0 2.5 3.7 3.6 3.0 5.0 8.2Asia --- 1.3 2.6 2.8 2.3 4.4 7.2Latin America --- 9.0 9.5 9.7 6.2 4.6 6.2Selected Africa:---Egypt --- 14.0 32.0 --- 29.0 10.0 3.0---Ghana --- 2.6 25.2 --- 25.5 16.5 6.0---S. Africa --- --- 49.2 --- 22.7 20.4 18.7
Merchandise exports as Percent of GDP

1820-70 1870-1913 1913-29 1929-50 1950-73 1973-92
World +8.0 +1.7 +0.2 -1.1 +1.7 +1.1WesternEurope
--- +1.5 -1.1 -1.1 +5.3 +2.2
EasternEurope
--- +1.5 +8.8 -1.3 +4.3 -4.8
U.S. +0.5 +1.2 -1.2 -0.8 +2.9 +3.4Asia --- +2.3 +0.5 _0.8 +4.0 +3.3Latin America --- +0.1 +0.1 -1.8 -1.1 +1.8SelectedAfrica:---Egypt --- +3.0 --- --- -2.8 -3.7---Ghana --- +20.2 --- +0.1 -1.5 -3.3---S. Africa --- --- --- --- -0.4 -0.4
Rate of Change in Merchandise Exports/GDP

A. 1970-94 period 1970 1980 1990 1994World 60.9 64.2 71.1 74.7Industrialized countries 72.0 70.2 78.0 79.2Eastern Europe 59.1 50.2 43.9 53.0Developing countries 18.5 17.7 54.3 66.1---Asia 22.4 23.5 65.5 73.4---Latin America 10.6 14.7 30.8 48.7---Africa 7.0 4.0 15.1 17.8
B. 1913-53 period 1913 1928 1937 1953U.S. & Canada 25.8 38.5 44.7 60.7U.K. 70.0 74.8 72.0 73.7Asia, excl. China & N. Korea 21.2 30.9 28.1 35.3Latin America 3.2 2.1 1.7 2.3Africa 3.7 2.5 3.7 8.5
Manufacturing exports as percent of total exports

Export area Textiles Chemicals Machinery &transport
Metals Other
1980 1995 1980 1995 1980 1995 1980 1995 1980 1995developed 61.7 42.0 87.2 79.3 86.1 76.4 78.9 63.1 68.8 70.0transitional 4.3 4.2 5.0 4.2 8.2 1.6 6.2 13.5 14.0 3.2developing 34.0 53.8 7.8 16.4 5.8 22.0 14.9 23.4 17.2 26.8LatinAmerica
2.3 3.0 2.0 2.6 1.0 2.9 5.0 7.6 1.5 2.9
Africa 1.5 1.9 0.9 1.1 0.1 0.2 3.8 2.7 1.5 2.9Asia 30.1 48.9 4.8 12.6 4.6 18.9 6.0 13.1 10.0 22.3
Shares of World Manufacturing Exports by region, 1980-1995
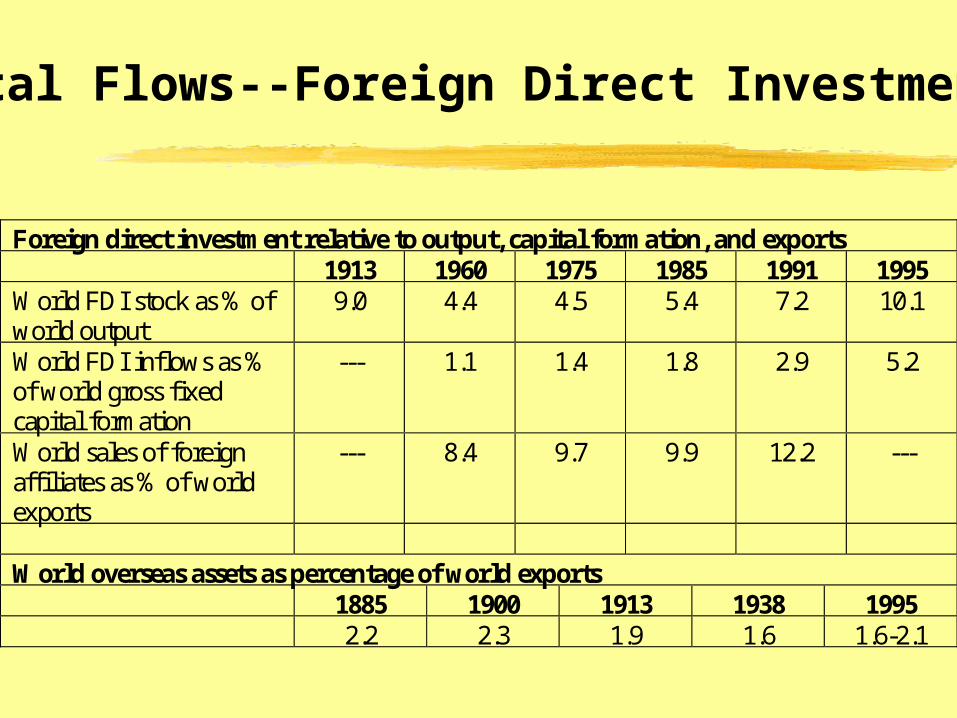
Capital Flows--Foreign Direct Investment
Foreign direct investment relative to output, capital formation, and exports1913 1960 1975 1985 1991 1995
World FDI stock as % ofworld output
9.0 4.4 4.5 5.4 7.2 10.1
World FDI inflows as %of world gross fixedcapital formation
--- 1.1 1.4 1.8 2.9 5.2
World sales of foreignaffiliates as % of worldexports
--- 8.4 9.7 9.9 12.2 ---
World overseas assets as percentage of world exports1885 1900 1913 1938 19952.2 2.3 1.9 1.6 1.6-2.1

The Patterning of FDI


![Globalization Globalization - The External Pressures.[2001.ISBN0471499382]](https://static.documents.pub/doc/80x56/54e9c2e54a795910478b4905/globalization-globalization-the-external-pressures2001isbn0471499382.jpg)


