Page 1
Page 1 of 20 This marketing communication cannot be deemed as being impartial. This means that RI can act or may have acted on the
information contained therein. Please see last page for important information.
14 January 2014
Financial Markets Research
Monthly Outlook January 2014
Beginning of the end / Jan Lambregts +44 207 664 9669 An increasingly positive macro backdrop and a bit more cooperation between Democrats and Republicans, finally saw
the Fed confident enough to commence tapering last month. It was a cautious first reduction of only USD 10 billion, so
the Fed’s still pushing USD 75 billion a month into the market, but it was a beginning nevertheless.
The market’s reaction, including emerging markets, has been rather subdued. In particular when compared to the fall-
out earlier last year. That will have a lot to do with the extensive campaign the Fed’s been waging to explain the
difference between tapering and tightening, as well as the firm forward guidance that rates are to remain low for the
foreseeable future. Even the tapering itself is likely to be a very gradual affair. Indeed, working off the base of an
ongoing moderate recovery, we think the Fed will not conclude tapering until year-end 2014.
It’s hard to see the Fed easily diverge from this gradual path. Various Fed speakers have begun to talk about economic
growth hitting 3% or higher in 2014 (Rabobank forecast: 2.8%), so if that’s the basic scenario in their mind, growth
would have to overshoot/undershoot considerably to speed things up/slow things down.
The good news for the ECB is that policymakers can finally emerge from the shadows of Fed tapering speculation and
find it easier to differentiate themselves in the eyes of the market as the central bank that hasn’t embarked on a
“tightening” course, mostly using beefed up forward guidance. We saw a first start of that at the January press
conference and it could be more successful this time around, in particular if the ECB is able to juxtapose it with an
improving economic backdrop.
Page 2
Page 2 of 20 This marketing communication cannot be deemed as being impartial. This means that RI can act or may have acted on the
information contained therein. Please see last page for important information.
Monthly Outlook 14 January 2014 www.rabotransact.com
Contents United States 3
Cautious taper steps 3 Well past the time… 3
Eurozone 4
Beefed-up forward guidance… 4 … as the domestic economy shows more signs of
recovery 4 Further disinflation remains a risk 4
Japan 5
12 months of Abenomics and what do we get? 5 ...another year older and further in debt? 5 2014 is likely to be a critical year for Japan 5
United Kingdom 6
Gaining momentum 6 Housing market remains strong 6 Bank of England outlook 6
Switzerland 7
A good year for the Swiss economy 7 SNB still struggling with internal and external
factors 7
The Netherlands 8
A strong start of 2014 8 Household consumption keeps falling 8 Manufacturing production declines 8
Poland 9
Non-inflationary economic recovery continues 9 Zloty at risk at New Year opening, medium-term
prospects remaining upbeat 9
Hungary 10
Back on the growth path 10 Forint remains under pressure at the year opening 10
Russia 11
Economic slowdown may continue in 2014 11 Ruble ends the year with annual losses although
with a more optimistic outlook at 2014 opening 11
China 12
Debt data suggest hangover to follow the party 12 The provinces are in the red even despite huge
fiscal transfers 12 When the music stops, so will a lot of investment
spending 12
Australia 13
RBA putting the house on a recovery... 13 ...and it may well need to... 13 ...as The Year of the Horse presents its hurdles 13
Brazil 14
Why Ms Rousseff will probably be re-elected 14
Foreign Exchange 15
EUR/USD: battle of the Titans 15 EUR/JPY: further gains in store 15 EUR/GBP: Carney confidence 15
Fixed Income 16
Significant peripheral spread narrowing... 16 ...but how far could this move go? 16 And a trade? 16
Credit Markets 17
The temptation to follow the herd 17
Financial Forecasts 18
Page 3
Page 3 of 20 This marketing communication cannot be deemed as being impartial. This means that RI can act or may have acted on the
information contained therein. Please see last page for important information.
Monthly Outlook 14 January 2014 www.rabotransact.com
United States
Cautious taper steps
Now that the impact of the fiscal cliff and the sequester is fading and
the two main political parties appear to have signed a truce, at least
until the November elections, the economic outlook has improved.
Employment growth shifted into higher gear, unemployment fell
substantially, and that induced the Fed to announce the first taper of
USD 10bn at the December meeting. At the same time, the central bank
stressed that it is in no hurry to terminate QE3 altogether or to hike the
fed funds target rate. Bernanke said that the FOMC expects similar
moderate taper steps at further meetings. What’s more, if economic
data are disappointing, the Committee may skip a meeting or two.
However, the tapering process could also be speeded up on the back of
stronger-than-expected data. Currently, Bernanke expects QE3 to end
late in the year. Our baseline forecast is that the FOMC will decide to
end QE3 in December 2014, after tapering by USD 10bn at each
meeting (except for a final USD 5bn at the December meeting). Last
Friday’s disappointing nonfarm payrolls may have raised the risk of a
slower taper schedule, but we think that one data point is not sufficient
to throw the FOMC off course. What’s more, it is also a rather unclear
data point, because the exact impact of the bad weather remains
uncertain.
Well past the time…
Meanwhile, the Fed seems to have been successful in convincing the
markets that the decision to start tapering does not mean that the first
policy rate hike is around the corner of 2014, dampening the upward
impact on longer-term rates of its December decision. In fact, the
forward guidance on the federal funds target rate was strengthened:
the FOMC now expects to start hiking well past the time the
unemployment rate declines below 6.5%, especially if inflation remains
below the 2.0% target. In fact, the Committee discussed lowering the
unemployment threshold to 6.0%, but the majority decided against it
because that would hurt the Fed’s credibility. But in practice, we should
probably pay more attention to the 6.0% level than the 6.5%. Our
forecast is that the unemployment rate will drop below 6.0% in 2015Q3
and that the FOMC will decide to announce its first hike in December
2015. The next FOMC meeting on 28-29 January will be Ben Bernanke’s
last. His term expires at the end of the month and in February his
number two, Janet Yellen, will take over. While Bernanke has managed
to launch the taper before his departure, the actual exit strategy will be
left for Yellen. A major challenge is to keep the markets convinced that
there will be a substantial delay between the end of QE3 and the start
of the hiking trail. This may require further strengthening of forward
guidance.
Chart 1: Inflation
Source: Macrobond
Chart 2: Unemployment
Source: Macrobond
Table 1: Economic forecasts
2012 2013 2014 Q2/13 Q3/13 Q4/13 Q1/14
GDP 2.8 1.9 2.8 2.5 4.1 2.6 2.9
Consumption 2.2 2.0 2.2 1.8 2.0 2.5 2.0
Business inv. 7.3 2.7 5.2 4.7 4.8 4.9 5.0
Residential inv. 12.9 13.6 10.9 14.2 10.3 12.0 11.0
Government -1.0 -2.2 -0.6 -0.4 0.4 -4.0 2.0
Trade 0.1 0.2 0.2 -0.1 0.1 0.9 0.1
Inventories 0.2 0.1 0.2 0.4 1.7 -0.2 0.1
CPI (% YoY) 2.1 1.5 1.6
Unemp. %rate 8.1 7.4 6.6
Yearly ("in") Quarterly (ar)
Source: Rabobank
/ Philip Marey +31 30 216 9721
Page 4
Page 4 of 20 This marketing communication cannot be deemed as being impartial. This means that RI can act or may have acted on the
information contained therein. Please see last page for important information.
Monthly Outlook 14 January 2014 www.rabotransact.com
Eurozone
Beefed-up forward guidance… In the January press conference, ECB President Draghi firmed up the
forward guidance language: “[…] the Governing Council strongly
emphasises that it will maintain an accommodative stance of monetary
policy for as long as necessary […] Accordingly, we firmly reiterate our
forward guidance that we continue to expect the key ECB interest rates to
remain at present or lower levels for an extended period of time.” He then
underscored that the Governing Council “remain[s] determined to
maintain the high degree of monetary accommodation and to take further
decisive action if required.” The timing for this change in language did
not come entirely unexpected. Now that the Fed has initiated a
tapering cycle and economic data are slowly improving, a firming up of
its language is likely to be more successful than during much of 2013
when it was ill striving against the stream for the ECB. This is largely
because the ECB’s forward guidance is conditional and asymmetric in
nature. By talking dovish amidst improving conditions the ECB can
finally distinguish itself from other central banks, the Federal Reserve in
particular, even as the latter has retained a dovish stance. Overall, we
expect the ECB to maintain policy in the coming months. But it is likely
to act quickly if there is any discernible deterioration in either the
growth, inflation or money market outlook. The March meeting (when
it publishes fresh staff projections) is likely to be our next reality check.
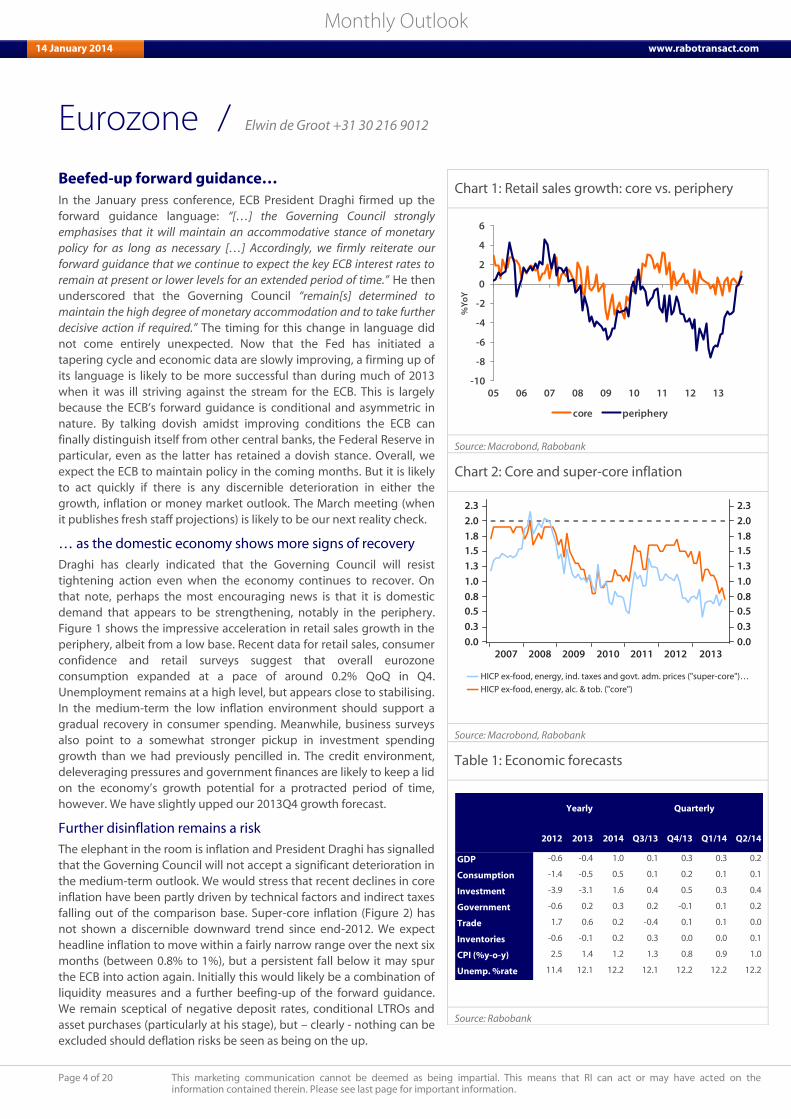
… as the domestic economy shows more signs of recovery
Draghi has clearly indicated that the Governing Council will resist
tightening action even when the economy continues to recover. On
that note, perhaps the most encouraging news is that it is domestic
demand that appears to be strengthening, notably in the periphery.
Figure 1 shows the impressive acceleration in retail sales growth in the
periphery, albeit from a low base. Recent data for retail sales, consumer
confidence and retail surveys suggest that overall eurozone
consumption expanded at a pace of around 0.2% QoQ in Q4.
Unemployment remains at a high level, but appears close to stabilising.
In the medium-term the low inflation environment should support a
gradual recovery in consumer spending. Meanwhile, business surveys
also point to a somewhat stronger pickup in investment spending
growth than we had previously pencilled in. The credit environment,
deleveraging pressures and government finances are likely to keep a lid
on the economy’s growth potential for a protracted period of time,
however. We have slightly upped our 2013Q4 growth forecast.
Further disinflation remains a risk
The elephant in the room is inflation and President Draghi has signalled
that the Governing Council will not accept a significant deterioration in
the medium-term outlook. We would stress that recent declines in core
inflation have been partly driven by technical factors and indirect taxes
falling out of the comparison base. Super-core inflation (Figure 2) has
not shown a discernible downward trend since end-2012. We expect
headline inflation to move within a fairly narrow range over the next six
months (between 0.8% to 1%), but a persistent fall below it may spur
the ECB into action again. Initially this would likely be a combination of
liquidity measures and a further beefing-up of the forward guidance.
We remain sceptical of negative deposit rates, conditional LTROs and
asset purchases (particularly at his stage), but – clearly - nothing can be
excluded should deflation risks be seen as being on the up.
Chart 1: Retail sales growth: core vs. periphery
-10
-8
-6
-4
-2
0
2
4
6
05 06 07 08 09 10 11 12 13
%Y
oY
core periphery
Source: Macrobond, Rabobank
Chart 2: Core and super-core inflation
Source: Macrobond, Rabobank
Table 1: Economic forecasts
2012 2013 2014 Q3/13 Q4/13 Q1/14 Q2/14
GDP -0.6 -0.4 1.0 0.1 0.3 0.3 0.2
Consumption -1.4 -0.5 0.5 0.1 0.2 0.1 0.1
Investment -3.9 -3.1 1.6 0.4 0.5 0.3 0.4
Government -0.6 0.2 0.3 0.2 -0.1 0.1 0.2
Trade 1.7 0.6 0.2 -0.4 0.1 0.1 0.0
Inventories -0.6 -0.1 0.2 0.3 0.0 0.0 0.1
CPI (%y-o-y) 2.5 1.4 1.2 1.3 0.8 0.9 1.0
Unemp. %rate 11.4 12.1 12.2 12.1 12.2 12.2 12.2
Yearly Quarterly
Source: Rabobank
/ Elwin de Groot +31 30 216 9012
Page 5
Page 5 of 20 This marketing communication cannot be deemed as being impartial. This means that RI can act or may have acted on the
information contained therein. Please see last page for important information.
Monthly Outlook 14 January 2014 www.rabotransact.com
Japan
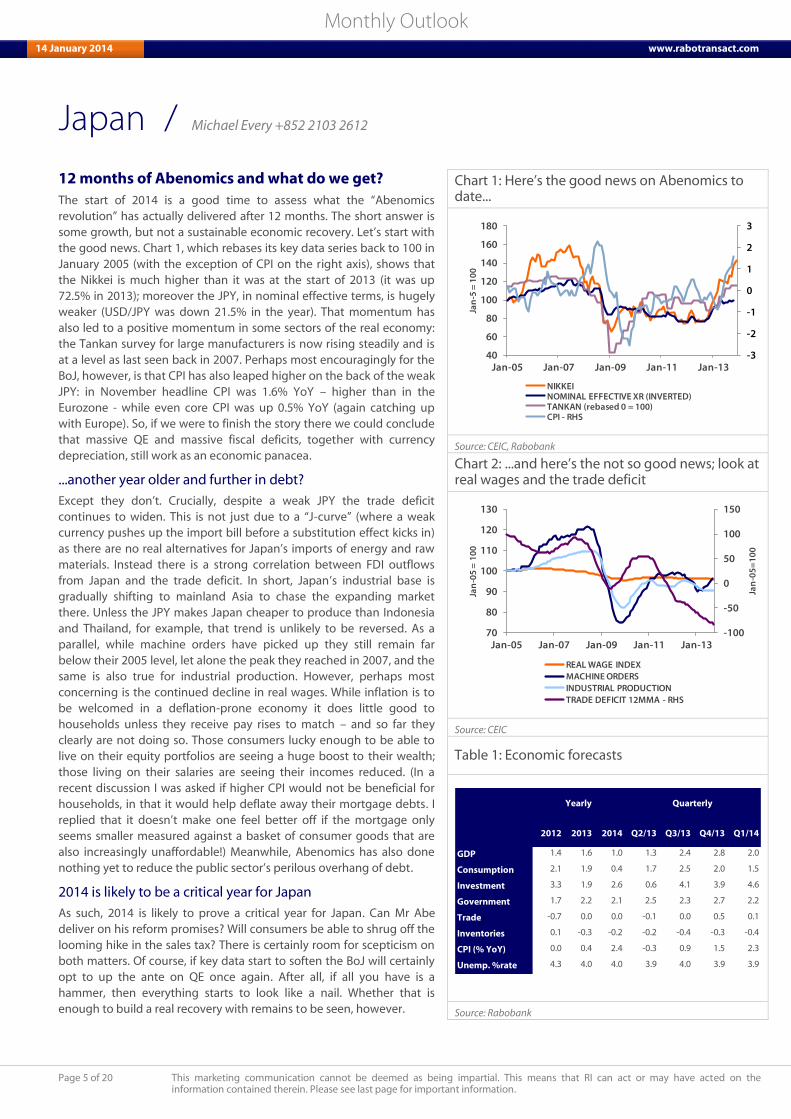
12 months of Abenomics and what do we get? The start of 2014 is a good time to assess what the “Abenomics
revolution” has actually delivered after 12 months. The short answer is
some growth, but not a sustainable economic recovery. Let’s start with
the good news. Chart 1, which rebases its key data series back to 100 in
January 2005 (with the exception of CPI on the right axis), shows that
the Nikkei is much higher than it was at the start of 2013 (it was up
72.5% in 2013); moreover the JPY, in nominal effective terms, is hugely
weaker (USD/JPY was down 21.5% in the year). That momentum has
also led to a positive momentum in some sectors of the real economy:
the Tankan survey for large manufacturers is now rising steadily and is
at a level as last seen back in 2007. Perhaps most encouragingly for the
BoJ, however, is that CPI has also leaped higher on the back of the weak
JPY: in November headline CPI was 1.6% YoY – higher than in the
Eurozone - while even core CPI was up 0.5% YoY (again catching up
with Europe). So, if we were to finish the story there we could conclude
that massive QE and massive fiscal deficits, together with currency
depreciation, still work as an economic panacea.
...another year older and further in debt?
Except they don’t. Crucially, despite a weak JPY the trade deficit
continues to widen. This is not just due to a “J-curve” (where a weak
currency pushes up the import bill before a substitution effect kicks in)
as there are no real alternatives for Japan’s imports of energy and raw
materials. Instead there is a strong correlation between FDI outflows
from Japan and the trade deficit. In short, Japan’s industrial base is
gradually shifting to mainland Asia to chase the expanding market
there. Unless the JPY makes Japan cheaper to produce than Indonesia
and Thailand, for example, that trend is unlikely to be reversed. As a
parallel, while machine orders have picked up they still remain far
below their 2005 level, let alone the peak they reached in 2007, and the
same is also true for industrial production. However, perhaps most
concerning is the continued decline in real wages. While inflation is to
be welcomed in a deflation-prone economy it does little good to
households unless they receive pay rises to match – and so far they
clearly are not doing so. Those consumers lucky enough to be able to
live on their equity portfolios are seeing a huge boost to their wealth;
those living on their salaries are seeing their incomes reduced. (In a
recent discussion I was asked if higher CPI would not be beneficial for
households, in that it would help deflate away their mortgage debts. I
replied that it doesn’t make one feel better off if the mortgage only
seems smaller measured against a basket of consumer goods that are
also increasingly unaffordable!) Meanwhile, Abenomics has also done
nothing yet to reduce the public sector’s perilous overhang of debt.
2014 is likely to be a critical year for Japan
As such, 2014 is likely to prove a critical year for Japan. Can Mr Abe
deliver on his reform promises? Will consumers be able to shrug off the
looming hike in the sales tax? There is certainly room for scepticism on
both matters. Of course, if key data start to soften the BoJ will certainly
opt to up the ante on QE once again. After all, if all you have is a
hammer, then everything starts to look like a nail. Whether that is
enough to build a real recovery with remains to be seen, however.
Chart 1: Here’s the good news on Abenomics to date...
-3
-2
-1
0
1
2
3
40
60
80
100
120
140
160
180
Jan-05 Jan-07 Jan-09 Jan-11 Jan-13
Jan
-5 =
10
0
NIKKEINOMINAL EFFECTIVE XR (INVERTED)TANKAN (rebased 0 = 100)CPI - RHS
Source: CEIC, Rabobank
Chart 2: ...and here’s the not so good news; look at real wages and the trade deficit
-100
-50
0
50
100
150
70
80
90
100
110
120
130
Jan-05 Jan-07 Jan-09 Jan-11 Jan-13
Jan
-05
=1
00
Jan
-05
= 1
00
REAL WAGE INDEXMACHINE ORDERSINDUSTRIAL PRODUCTIONTRADE DEFICIT 12MMA - RHS
Source: CEIC
Table 1: Economic forecasts
2012 2013 2014 Q2/13 Q3/13 Q4/13 Q1/14
GDP 1.4 1.6 1.0 1.3 2.4 2.8 2.0
Consumption 2.1 1.9 0.4 1.7 2.5 2.0 1.5
Investment 3.3 1.9 2.6 0.6 4.1 3.9 4.6
Government 1.7 2.2 2.1 2.5 2.3 2.7 2.2
Trade -0.7 0.0 0.0 -0.1 0.0 0.5 0.1
Inventories 0.1 -0.3 -0.2 -0.2 -0.4 -0.3 -0.4
CPI (% YoY) 0.0 0.4 2.4 -0.3 0.9 1.5 2.3
Unemp. %rate 4.3 4.0 4.0 3.9 4.0 3.9 3.9
Yearly Quarterly
Source: Rabobank
/ Michael Every +852 2103 2612
Page 6
Page 6 of 20 This marketing communication cannot be deemed as being impartial. This means that RI can act or may have acted on the
information contained therein. Please see last page for important information.
Monthly Outlook 14 January 2014 www.rabotransact.com
United Kingdom
Gaining momentum
In the revision of the quarterly national accounts, economic growth in
the third quarter of 2013 remained the same (0.8% QoQ). On a positive
note, the GDP growth figures of past quarters of 2012 and 2013 have
been revised up (in total 0.5%). The expenditure break-down of GDP,
again, indicated that the recovery is domestically driven. Especially
private consumption got a strong upward revision. However, with real
income growth still being negative, it is questionable whether
consumption can remain the primary growth driver. Moreover, exports
were revised negatively (from -2.4% to -3.0%). Together with the
disappointing latest trade figures, this indicates that the recovery is not
broad based. Going forward, leading indicators keep pointing at a
strong economic expansion in the fourth quarter. The manufacturing
PMI eased back to 57.3 in December, and the services PMI went down
to 58.8. Both are however far above the neutral, no-change level (50.0).
Housing market remains strong
Private consumption growth seems to be partially fuelled by the still
buoyant housing market. According to the Nationwide lender, house
prices rose 1.4% MoM (8.4% YoY) in December. What’s more, the BoE
reported that mortgage approvals in the same month increased to a
70-month high, though the level (70,759 in November 2013) is still
below the long-term average (84,511 approvals a month since 1993).
The housing market developments seem to be partially caused by the
government support through the Help-to-Buy scheme. Together with
low mortgage rates, lower unemployment and an improved economic
outlook, the housing market is expected to remain strong in 2014.
However, the risk of a housing market bubble is growing, with the BoE
commenting that they are watching the developments closely. The end
of Funding for Lending (FLS) support for home loans as per January 1st
will probably not hamper the housing market much, since take-up of
FLS funds has been low so far. The refocus of FLS support towards
business lending is sensible, since in November, lending to non-
financial corporates had their biggest drop since the start of the data
series in 2011. With the improving economic outlook, it is expected that
credit demand from companies will increase. Hopefully, FLS can
support banks in servicing these credit demands.
Bank of England outlook
Although the UK economy has shifted up a gear, at the end of Q3 2013,
it was still smaller than its 2007 high. An improvement in exports,
investment and consumer confidence would be welcome to ensure the
recovery is broad based. The BoE is set to retain dovish tone in the
months ahead particularly given its greater confidence that CPI
inflation can refrain from returning to elevated levels. To prevent the
market from speculating about a rate hike in 2014 we expect the MPC
to alter its forward guidance. The unemployment rate has fallen at a
faster rate than anticipated in recent months to 7.4%. We expect the
Bank to indicate that it will not start to consider a rate hike until the
unemployment rate has dropped to a much lower level, potentially
6.4%. This could be announced as part of the February Inflation Report.
Chart 1: Past GDP growth revised upwards
-0.6
-0.4
-0.2
0.0
0.2
0.4
0.6
0.8
1.0
-0.6
-0.4
-0.2
0.0
0.2
0.4
0.6
0.8
1.0
12 Q1 12 Q2 12 Q3 12 Q4 13 Q1 13 Q2 13 Q3
Latest estimate 2nd estimate
% Q-o-Q % Q-o-Q
Source: Office for National Statistics (ONS)
Chart 2: PMIs point at a continued expansion
-3
-2
-1
0
1
2
3
30
35
40
45
50
55
60
65
70
97 98 99 00 01 02 03 04 05 06 07 08 09 10 11 12 13
Manufacturing sector (l) Services sector (l) GDP (r)
Index % Q-o-QPurchasing Managers' Indices* (PMI) vs GDP growth
* Above 50 denotes expansion and below 50 denotes contraction.
Source: Reuters EcoWin
Table 1: Economic forecasts
2012 2013 2014 Q2/13 Q3/13 Q4/13 Q1/14
GDP 0.3 1.8 2.0 0.8 0.8 0.6 0.4
Consumption 1.5 2.3 1.7 0.4 0.8 0.4 0.4
Investment 1.2 -0.9 5.1 -1.3 2.1 2.2 1.1
Government 1.5 -0.4 0.6 2.4 0.6 0.1 0.0
Trade 1.2 -0.7 -0.2 0.2 -1.2 0.0 0.0
Inventories 0.4 -0.2 0.8 -0.1 1.0 0.0 0.0
CPI (%y-o-y) 2.8 2.7 2.4
Unemp. %rate 8.1 7.8 7.3
Yearly Quarterly
Source: Rabobank
/ Marcel Weernink +31 30 216 0973 & Jane Foley +44 20 7809 4776
Page 7
Page 7 of 20 This marketing communication cannot be deemed as being impartial. This means that RI can act or may have acted on the
information contained therein. Please see last page for important information.
Monthly Outlook 14 January 2014 www.rabotransact.com
Switzerland
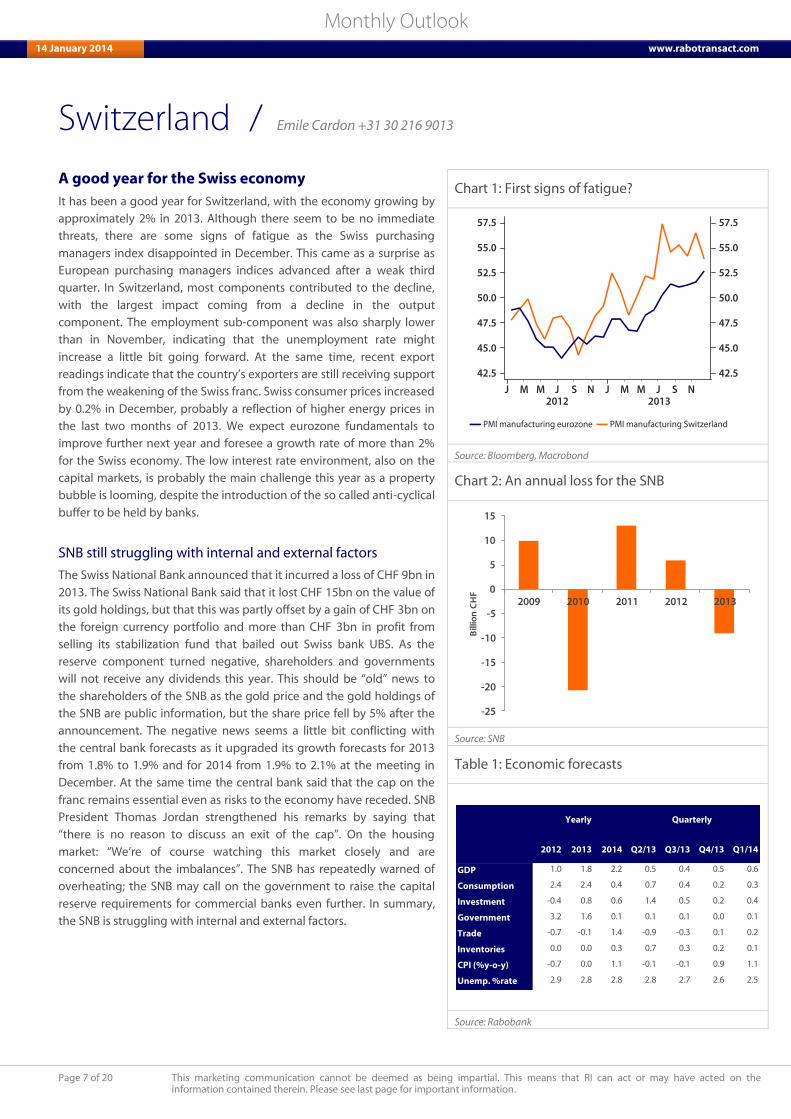
A good year for the Swiss economy
It has been a good year for Switzerland, with the economy growing by
approximately 2% in 2013. Although there seem to be no immediate
threats, there are some signs of fatigue as the Swiss purchasing
managers index disappointed in December. This came as a surprise as
European purchasing managers indices advanced after a weak third
quarter. In Switzerland, most components contributed to the decline,
with the largest impact coming from a decline in the output
component. The employment sub-component was also sharply lower
than in November, indicating that the unemployment rate might
increase a little bit going forward. At the same time, recent export
readings indicate that the country’s exporters are still receiving support
from the weakening of the Swiss franc. Swiss consumer prices increased
by 0.2% in December, probably a reflection of higher energy prices in
the last two months of 2013. We expect eurozone fundamentals to
improve further next year and foresee a growth rate of more than 2%
for the Swiss economy. The low interest rate environment, also on the
capital markets, is probably the main challenge this year as a property
bubble is looming, despite the introduction of the so called anti-cyclical
buffer to be held by banks.
SNB still struggling with internal and external factors
The Swiss National Bank announced that it incurred a loss of CHF 9bn in
2013. The Swiss National Bank said that it lost CHF 15bn on the value of
its gold holdings, but that this was partly offset by a gain of CHF 3bn on
the foreign currency portfolio and more than CHF 3bn in profit from
selling its stabilization fund that bailed out Swiss bank UBS. As the
reserve component turned negative, shareholders and governments
will not receive any dividends this year. This should be “old” news to
the shareholders of the SNB as the gold price and the gold holdings of
the SNB are public information, but the share price fell by 5% after the
announcement. The negative news seems a little bit conflicting with
the central bank forecasts as it upgraded its growth forecasts for 2013
from 1.8% to 1.9% and for 2014 from 1.9% to 2.1% at the meeting in
December. At the same time the central bank said that the cap on the
franc remains essential even as risks to the economy have receded. SNB
President Thomas Jordan strengthened his remarks by saying that
“there is no reason to discuss an exit of the cap”. On the housing
market: “We’re of course watching this market closely and are
concerned about the imbalances”. The SNB has repeatedly warned of
overheating; the SNB may call on the government to raise the capital
reserve requirements for commercial banks even further. In summary,
the SNB is struggling with internal and external factors.
Chart 1: First signs of fatigue?
Source: Bloomberg, Macrobond
Chart 2: An annual loss for the SNB
-25
-20
-15
-10
-5
0
5
10
15
2009 2010 2011 2012 2013
Bill
ion
CH
F
Source: SNB
Table 1: Economic forecasts
2012 2013 2014 Q2/13 Q3/13 Q4/13 Q1/14
GDP 1.0 1.8 2.2 0.5 0.4 0.5 0.6
Consumption 2.4 2.4 0.4 0.7 0.4 0.2 0.3
Investment -0.4 0.8 0.6 1.4 0.5 0.2 0.4
Government 3.2 1.6 0.1 0.1 0.1 0.0 0.1
Trade -0.7 -0.1 1.4 -0.9 -0.3 0.1 0.2
Inventories 0.0 0.0 0.3 0.7 0.3 0.2 0.1
CPI (%y-o-y) -0.7 0.0 1.1 -0.1 -0.1 0.9 1.1
Unemp. %rate 2.9 2.8 2.8 2.8 2.7 2.6 2.5
Yearly Quarterly
Source: Rabobank
/ Emile Cardon +31 30 216 9013
Page 8
Page 8 of 20 This marketing communication cannot be deemed as being impartial. This means that RI can act or may have acted on the
information contained therein. Please see last page for important information.
Monthly Outlook 14 January 2014 www.rabotransact.com
The Netherlands
A strong start of 2014
Statistics Netherlands (CBS) has upwardly revised third quarter GDP
growth from 0.1% QoQ to 0.2% in its second estimate. Furthermore,
recent economic indicators are pointing towards an acceleration of
growth in 13Q4. The positive carry-over from last year is making for a
relatively strong start of the Dutch economy in 2014. Considering this,
we have upwardly revised our 2014 GDP growth forecast to 0.5%.
Throughout the year, however, quarterly growth is expected to be
limited owing to a continuing decline in domestic spending.
Household consumption keeps falling
Real household consumption declined by 0.5% 3m/3m in October
(based on our own seasonal adjustment), after an equal decline in the
month before. With the exception of January 2012, the consumption
momentum has declined for almost three years now. Durable goods
have been particularly hard-hit (Chart 1). Consumption of durable
goods contracted strongly in 2012 and 2013 in YoY terms, although in
recent months the magnitude of the decline has moderated somewhat.
Consumer confidence improved substantially in recent months. In
December the confidence level equalled -16, a 2 point increase from
November. There are a number of reasons behind the more benign
consumer mood. There will be fewer pension cuts this year compared
to 2013. A temporary tax break in the first tax bracket of income taxes
will increase purchasing power in 2014. The same holds true for the
expected decline in the inflation rate in 2014, which is largely because a
number of indirect tax hikes have fallen out the YoY CPI comparison.
Furthermore, the unemployment rate dropped in November and on
the housing market the number of transactions have increased in
recent quarters. Yet consumers remain cautious when it comes to
making large purchases. The balance of consumers who think it is a
favourable time for large purchases is still at a low level. Moreover, we
expect the previous declines in disposable income and house prices to
lead to a further decline in private consumption volume in 2014.
Manufacturing production declines
Manufacturing production fell 0.6% MoM in November after a 0.6%
increase in October (Chart 2). The 3m/3m growth of production was
1.1% in November, but this was mostly the result of the strong
production growth in September. The drop in manufacturing
production does not match the much stronger rise in sentiment that is
visible in recent months. Producer confidence in the manufacturing
industry improved to -0.1 in December from -0.4 in November, largely
owing to a more favourable stock position. Employment expectations,
however, deteriorated. The balance of employers who expect an
increase in the workforce declined from -12.4 in November to -14.8 in
December. In the manufacturing industry, but also in the overall
economy, we expect employment to decline further in 2014.
Chart 1: Low demand for durable goods
-10
-8
-6
-4
-2
0
2
4
6
8
10
-15
-10
-5
0
5
10
03 04 05 06 07 08 09 10 11 12 13
Total Food, beverages & tobaccoDurables Other, including energyServices
% %
Household consumption, trading-day corrected,
volumes, year on year change, 3-month average
Source: Statistics Netherlands (CBS)
Chart 2: Manufacturing production disappoints
-15
-10
-5
0
5
10
15
-15
-10
-5
0
5
10
15
03 04 05 06 07 08 09 10 11 12 13
Manufacturing 3m/3m IP 3m/3m Manufacturing y-o-y
%%
Dutch Manufacturing production and Industrial
Production, seasonally adjusted
Source: Statistics Netherlands (CBS)
Table 1: Economic forecasts
2012 2013 2014 Q3/13 Q4/13 Q1/14 Q2/14
GDP -1.3 -0.9 0.5 0.2 0.4 0.0 0.1
Consumption -1.6 -2.2 -1.4 -0.8 -0.3 -0.2 -0.4
Investment -4.6 -7.2 1.2 0.0 -0.1 -0.1 -0.1
Government -0.8 -1.2 -0.3 1.3 2.2 -2.3 0.6
Trade 0.2 1.8 0.8 0.0 0.3 0.4 0.2
Inventories 0.2 -0.4 0.0 -0.3 0.0 0.0 0.0
CPI (% YoY) 2.8 2.6 1.0 2.8 1.3 1.0 1.0
Unemp. %rate 5.3 6.7 7.4 7.0 7.0 7.1 7.3
Yearly Quarterly
Source: Rabobank
/ Theo Smid +31 30 216 7599
Page 9
Page 9 of 20 This marketing communication cannot be deemed as being impartial. This means that RI can act or may have acted on the
information contained therein. Please see last page for important information.
Monthly Outlook 14 January 2014 www.rabotransact.com
Poland
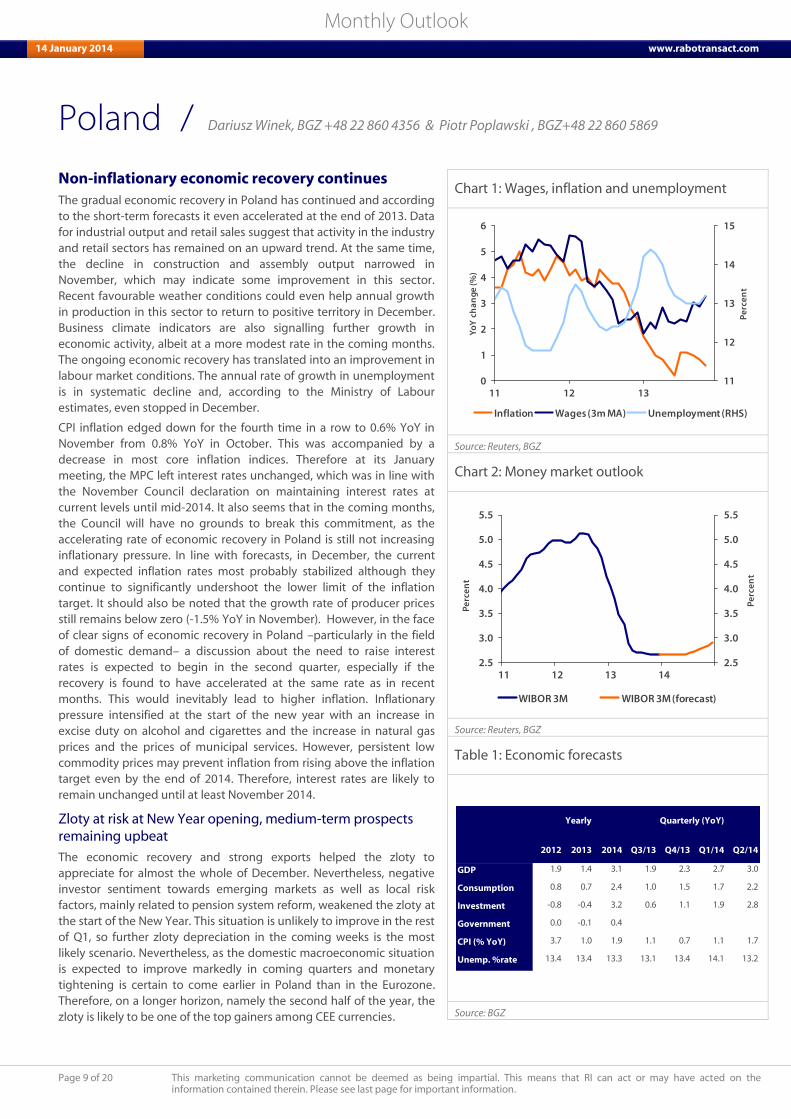
Non-inflationary economic recovery continues The gradual economic recovery in Poland has continued and according
to the short-term forecasts it even accelerated at the end of 2013. Data
for industrial output and retail sales suggest that activity in the industry
and retail sectors has remained on an upward trend. At the same time,
the decline in construction and assembly output narrowed in
November, which may indicate some improvement in this sector.
Recent favourable weather conditions could even help annual growth
in production in this sector to return to positive territory in December.
Business climate indicators are also signalling further growth in
economic activity, albeit at a more modest rate in the coming months.
The ongoing economic recovery has translated into an improvement in
labour market conditions. The annual rate of growth in unemployment
is in systematic decline and, according to the Ministry of Labour
estimates, even stopped in December.
CPI inflation edged down for the fourth time in a row to 0.6% YoY in
November from 0.8% YoY in October. This was accompanied by a
decrease in most core inflation indices. Therefore at its January
meeting, the MPC left interest rates unchanged, which was in line with
the November Council declaration on maintaining interest rates at
current levels until mid-2014. It also seems that in the coming months,
the Council will have no grounds to break this commitment, as the
accelerating rate of economic recovery in Poland is still not increasing
inflationary pressure. In line with forecasts, in December, the current
and expected inflation rates most probably stabilized although they
continue to significantly undershoot the lower limit of the inflation
target. It should also be noted that the growth rate of producer prices
still remains below zero (-1.5% YoY in November). However, in the face
of clear signs of economic recovery in Poland –particularly in the field
of domestic demand– a discussion about the need to raise interest
rates is expected to begin in the second quarter, especially if the
recovery is found to have accelerated at the same rate as in recent
months. This would inevitably lead to higher inflation. Inflationary
pressure intensified at the start of the new year with an increase in
excise duty on alcohol and cigarettes and the increase in natural gas
prices and the prices of municipal services. However, persistent low
commodity prices may prevent inflation from rising above the inflation
target even by the end of 2014. Therefore, interest rates are likely to
remain unchanged until at least November 2014.
Zloty at risk at New Year opening, medium-term prospects
remaining upbeat
The economic recovery and strong exports helped the zloty to
appreciate for almost the whole of December. Nevertheless, negative
investor sentiment towards emerging markets as well as local risk
factors, mainly related to pension system reform, weakened the zloty at
the start of the New Year. This situation is unlikely to improve in the rest
of Q1, so further zloty depreciation in the coming weeks is the most
likely scenario. Nevertheless, as the domestic macroeconomic situation
is expected to improve markedly in coming quarters and monetary
tightening is certain to come earlier in Poland than in the Eurozone.
Therefore, on a longer horizon, namely the second half of the year, the
zloty is likely to be one of the top gainers among CEE currencies.
Chart 1: Wages, inflation and unemployment
11
12
13
14
15
0
1
2
3
4
5
6
11 12 13
Pe
rce
nt
Yo
Y c
ha
ng
e (%
)
Inflation Wages (3m MA) Unemployment (RHS)
Source: Reuters, BGZ
Chart 2: Money market outlook
2.5
3.0
3.5
4.0
4.5
5.0
5.5
2.5
3.0
3.5
4.0
4.5
5.0
5.5
11 12 13 14
Pe
rce
nt
Pe
rce
nt
WIBOR 3M WIBOR 3M (forecast)
Source: Reuters, BGZ
Table 1: Economic forecasts
2012 2013 2014 Q3/13 Q4/13 Q1/14 Q2/14
GDP 1.9 1.4 3.1 1.9 2.3 2.7 3.0
Consumption 0.8 0.7 2.4 1.0 1.5 1.7 2.2
Investment -0.8 -0.4 3.2 0.6 1.1 1.9 2.8
Government 0.0 -0.1 0.4
CPI (% YoY) 3.7 1.0 1.9 1.1 0.7 1.1 1.7
Unemp. %rate 13.4 13.4 13.3 13.1 13.4 14.1 13.2
Yearly Quarterly (YoY)
Source: BGZ
/ Dariusz Winek, BGZ +48 22 860 4356 & Piotr Poplawski , BGZ+48 22 860 5869
Page 10
Page 10 of 20 This marketing communication cannot be deemed as being impartial. This means that RI can act or may have acted on the
information contained therein. Please see last page for important information.
Monthly Outlook 14 January 2014 www.rabotransact.com
Hungary
Back on the growth path
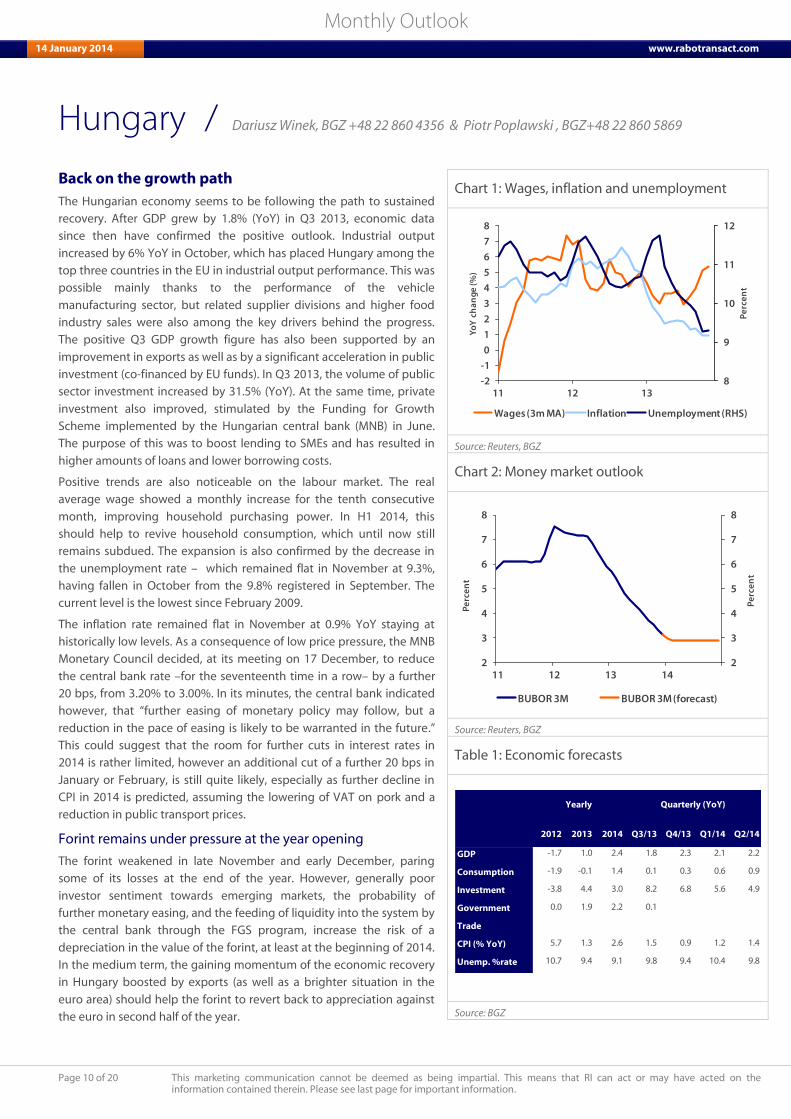
The Hungarian economy seems to be following the path to sustained
recovery. After GDP grew by 1.8% (YoY) in Q3 2013, economic data
since then have confirmed the positive outlook. Industrial output
increased by 6% YoY in October, which has placed Hungary among the
top three countries in the EU in industrial output performance. This was
possible mainly thanks to the performance of the vehicle
manufacturing sector, but related supplier divisions and higher food
industry sales were also among the key drivers behind the progress.
The positive Q3 GDP growth figure has also been supported by an
improvement in exports as well as by a significant acceleration in public
investment (co-financed by EU funds). In Q3 2013, the volume of public
sector investment increased by 31.5% (YoY). At the same time, private
investment also improved, stimulated by the Funding for Growth
Scheme implemented by the Hungarian central bank (MNB) in June.
The purpose of this was to boost lending to SMEs and has resulted in
higher amounts of loans and lower borrowing costs.
Positive trends are also noticeable on the labour market. The real
average wage showed a monthly increase for the tenth consecutive
month, improving household purchasing power. In H1 2014, this
should help to revive household consumption, which until now still
remains subdued. The expansion is also confirmed by the decrease in
the unemployment rate – which remained flat in November at 9.3%,
having fallen in October from the 9.8% registered in September. The
current level is the lowest since February 2009.
The inflation rate remained flat in November at 0.9% YoY staying at
historically low levels. As a consequence of low price pressure, the MNB
Monetary Council decided, at its meeting on 17 December, to reduce
the central bank rate –for the seventeenth time in a row– by a further
20 bps, from 3.20% to 3.00%. In its minutes, the central bank indicated
however, that “further easing of monetary policy may follow, but a
reduction in the pace of easing is likely to be warranted in the future.”
This could suggest that the room for further cuts in interest rates in
2014 is rather limited, however an additional cut of a further 20 bps in
January or February, is still quite likely, especially as further decline in
CPI in 2014 is predicted, assuming the lowering of VAT on pork and a
reduction in public transport prices.
Forint remains under pressure at the year opening
The forint weakened in late November and early December, paring
some of its losses at the end of the year. However, generally poor
investor sentiment towards emerging markets, the probability of
further monetary easing, and the feeding of liquidity into the system by
the central bank through the FGS program, increase the risk of a
depreciation in the value of the forint, at least at the beginning of 2014.
In the medium term, the gaining momentum of the economic recovery
in Hungary boosted by exports (as well as a brighter situation in the
euro area) should help the forint to revert back to appreciation against
the euro in second half of the year.
Chart 1: Wages, inflation and unemployment
8
9
10
11
12
-2
-1
0
1
2
3
4
5
6
7
8
11 12 13
Pe
rce
nt
Yo
Y c
ha
ng
e (%
)
Wages (3m MA) Inflation Unemployment (RHS)
Source: Reuters, BGZ
Chart 2: Money market outlook
2
3
4
5
6
7
8
2
3
4
5
6
7
8
11 12 13 14
Pe
rce
nt
Pe
rce
nt
BUBOR 3M BUBOR 3M (forecast)
Source: Reuters, BGZ
Table 1: Economic forecasts
2012 2013 2014 Q3/13 Q4/13 Q1/14 Q2/14
GDP -1.7 1.0 2.4 1.8 2.3 2.1 2.2
Consumption -1.9 -0.1 1.4 0.1 0.3 0.6 0.9
Investment -3.8 4.4 3.0 8.2 6.8 5.6 4.9
Government 0.0 1.9 2.2 0.1
Trade
CPI (% YoY) 5.7 1.3 2.6 1.5 0.9 1.2 1.4
Unemp. %rate 10.7 9.4 9.1 9.8 9.4 10.4 9.8
Yearly Quarterly (YoY)
Source: BGZ
/ Dariusz Winek, BGZ +48 22 860 4356 & Piotr Poplawski , BGZ+48 22 860 5869
Page 11
Page 11 of 20 This marketing communication cannot be deemed as being impartial. This means that RI can act or may have acted on the
information contained therein. Please see last page for important information.
Monthly Outlook 14 January 2014 www.rabotransact.com
Russia
Economic slowdown may continue in 2014
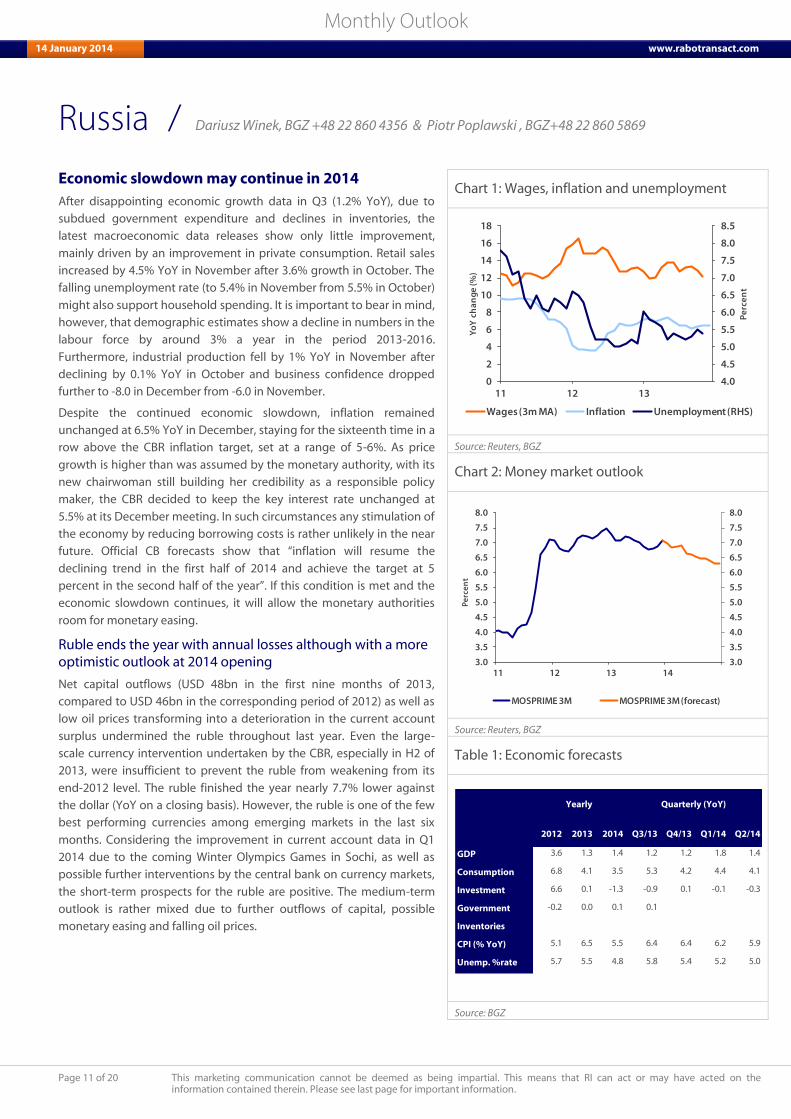
After disappointing economic growth data in Q3 (1.2% YoY), due to
subdued government expenditure and declines in inventories, the
latest macroeconomic data releases show only little improvement,
mainly driven by an improvement in private consumption. Retail sales
increased by 4.5% YoY in November after 3.6% growth in October. The
falling unemployment rate (to 5.4% in November from 5.5% in October)
might also support household spending. It is important to bear in mind,
however, that demographic estimates show a decline in numbers in the
labour force by around 3% a year in the period 2013-2016.
Furthermore, industrial production fell by 1% YoY in November after
declining by 0.1% YoY in October and business confidence dropped
further to -8.0 in December from -6.0 in November.
Despite the continued economic slowdown, inflation remained
unchanged at 6.5% YoY in December, staying for the sixteenth time in a
row above the CBR inflation target, set at a range of 5-6%. As price
growth is higher than was assumed by the monetary authority, with its
new chairwoman still building her credibility as a responsible policy
maker, the CBR decided to keep the key interest rate unchanged at
5.5% at its December meeting. In such circumstances any stimulation of
the economy by reducing borrowing costs is rather unlikely in the near
future. Official CB forecasts show that “inflation will resume the
declining trend in the first half of 2014 and achieve the target at 5
percent in the second half of the year”. If this condition is met and the
economic slowdown continues, it will allow the monetary authorities
room for monetary easing.
Ruble ends the year with annual losses although with a more
optimistic outlook at 2014 opening
Net capital outflows (USD 48bn in the first nine months of 2013,
compared to USD 46bn in the corresponding period of 2012) as well as
low oil prices transforming into a deterioration in the current account
surplus undermined the ruble throughout last year. Even the large-
scale currency intervention undertaken by the CBR, especially in H2 of
2013, were insufficient to prevent the ruble from weakening from its
end-2012 level. The ruble finished the year nearly 7.7% lower against
the dollar (YoY on a closing basis). However, the ruble is one of the few
best performing currencies among emerging markets in the last six
months. Considering the improvement in current account data in Q1
2014 due to the coming Winter Olympics Games in Sochi, as well as
possible further interventions by the central bank on currency markets,
the short-term prospects for the ruble are positive. The medium-term
outlook is rather mixed due to further outflows of capital, possible
monetary easing and falling oil prices.
Chart 1: Wages, inflation and unemployment
4.0
4.5
5.0
5.5
6.0
6.5
7.0
7.5
8.0
8.5
0
2
4
6
8
10
12
14
16
18
11 12 13
Pe
rce
nt
Yo
Y c
ha
ng
e (%
)
Wages (3m MA) Inflation Unemployment (RHS)
Source: Reuters, BGZ
Chart 2: Money market outlook
3.0
3.5
4.0
4.5
5.0
5.5
6.0
6.5
7.0
7.5
8.0
3.0
3.5
4.0
4.5
5.0
5.5
6.0
6.5
7.0
7.5
8.0
11 12 13 14
Pe
rce
nt
MOSPRIME 3M MOSPRIME 3M (forecast)
Source: Reuters, BGZ
Table 1: Economic forecasts
2012 2013 2014 Q3/13 Q4/13 Q1/14 Q2/14
GDP 3.6 1.3 1.4 1.2 1.2 1.8 1.4
Consumption 6.8 4.1 3.5 5.3 4.2 4.4 4.1
Investment 6.6 0.1 -1.3 -0.9 0.1 -0.1 -0.3
Government -0.2 0.0 0.1 0.1
Inventories
CPI (% YoY) 5.1 6.5 5.5 6.4 6.4 6.2 5.9
Unemp. %rate 5.7 5.5 4.8 5.8 5.4 5.2 5.0
Yearly Quarterly (YoY)
Source: BGZ
/ Dariusz Winek, BGZ +48 22 860 4356 & Piotr Poplawski , BGZ+48 22 860 5869
Page 12
Page 12 of 20 This marketing communication cannot be deemed as being impartial. This means that RI can act or may have acted on the
information contained therein. Please see last page for important information.
Monthly Outlook 14 January 2014 www.rabotransact.com
China
Debt data suggest hangover to follow the party On 30 December China finally released local government debt data.
The last official estimates of such liabilities for 2010 stood at CNY
10.7trn (USD 1.7trn); as of end-Q2 2013 these had multiplied to CNY
17.9trn (USD 2.9 trn) including contingent debt guarantees. In short,
debt has jumped 67% in just 10 quarters, an average rise of CNY 600bn
(nearly USD 100bn) per quarter. Indeed, China’s local government debt
is now close to the sum of its central government debt and total public-
sector debt, including contingent liabilities, were CNY 30.3trn (USD
5trn), equivalent to 55.9% of GDP vs. 34% in 2005. Moreover, if we
include Policy Bank bonds as liabilities too, which we should, then
public-sector debt was 72% of GDP, up from 44% in 2005. Of course,
China’s debt is still lower than in most OECD economies. Moreover,
with a 10-year government bond yield of around 4.6% and nominal
GDP growth over 9%, China can effectively deflate away its debt ratio
simply by growing the denominator in the equation. Conversely,
however, it needs to be recalled that exactly because China has been
growing so fast it should have allowed for lower debt ratios rather than
higher. Yet worryingly, the ratio has pushed upwards even despite
nominal GDP growth of 9-10% YoY: were we to see lower nominal GDP
growth and/or higher borrowing costs – both of which are probable
ahead – then the debt ratio would look even worse.
The provinces are in the red even despite huge fiscal transfers
What is even more remarkable about the rise in local government debt
is that on paper it shouldn’t be necessary at all. True, China’s provinces
mostly run huge structural fiscal deficits. Qinghai has a deficit equal to
51.4% of its own local GDP, while even economically dynamic regions
such as Shanghai and Guangdong run deficits of 2.0% and 2.2%,
respectively. However, these shortfalls are compensated for by fiscal
transfers from the central government: once these are included then
total local expenditures only slightly exceed the total revenue stream,
obviating the need to borrow at the kind of levels that could result in a
USD2.9 trillion debt mountain. Clearly there must be vast off-book
spending going on by local governments: but why and how? The
answers to those respective questions are: “To invest in construction
projects to maintain rapid provincial GDP growth”; and “However they
can” – often via opaque Local Government Financing Vehicles (LGFVs).
We can estimate the impact of this off-book expenditure as follows: the
central government fiscal deficit in 2012 was 1.5% of GDP; if we include
the tiny deficits run by the provinces that increases to 1.8% of GDP;
however, if we also suppose the yearly increase in off-book local
government debt is another form of state spending we end up with a fiscal
deficit of nearly 12% of GDP! Of course, not all of that debt went into the
economy: some of it was used to roll over maturing loans, while we are
looking at the total debts including contingent liabilities.
When the music stops, so will a lot of investment spending
Nonetheless, it seems clear that if/when local government borrowing
slows there is likely to be a significant negative impact on investment,
and hence GDP growth. Even in true market economies in Europe
recent government austerity programmes have revealed the extent to
which the private sector often relies on the public sector for its orders –
in China that problem is now greater by orders of magnitude. It is
telling that as aggregate credit expansion has slowed (in November
total system financing was down 12.6% YoY 3MMA), the manufacturing
and services PMIs have also turned down – the HSBC/Markit series were
just 50.5 and 50.9 respectively in December, only just in expansionary
territory.
Chart 1: Local government debt is now close to total central government liabilities
0
10
20
30
40
50
60
70
80
% G
DP
CNY FX Policy bank bonds Railways Local
05 06 07 08 09 10 11 12 13Q3
Source: CEIC
Chart 2: The actual fiscal deficit is much larger than the official figure if we include LGFVs
-14-12
-10
-8
-6
-4
-2
02
42
00
2
20
03
20
04
20
05
20
06
20
07
20
08
20
09
20
10
20
11
20
12
% G
DP
Total public-sector deficit (official)
Plus change in total local-government debt
Source: CEIC, Rabobank
Table 1: Economic forecasts
2012 2013 2014 Q2/13 Q3/13 Q4/13 Q1/14
GDP 7.7 7.6 7.3 7.6 7.7 7.6 7.4
- Primary 4.5 4.3 4.1 3.0 3.4 3.2 2.7
- Secondary 7.9 8.0 7.9 7.6 7.8 7.6 7.6
- Tertiary 8.1 8.0 8.0 8.3 8.4 8.3 8.0
Retail sales 14.2 12.7 11.8 13.0 13.2 12.2 12.0
Exports USD
YoY%
8.3 7.7 4.6 4.1 3.9 4.0 4.2
Imports USD
YoY%
5.3 6.9 4.5 5.2 8.4 4.6 4.7
CPI (% YoY) 2.7 2.5 2.2 2.4 2.8 2.5 2.4
Yearly Quarterly (%, YoY)
Source: Rabobank
/ Michael Every +852 2103 2614
Page 13
Page 13 of 20 This marketing communication cannot be deemed as being impartial. This means that RI can act or may have acted on the
information contained therein. Please see last page for important information.
Monthly Outlook 14 January 2014 www.rabotransact.com
Australia
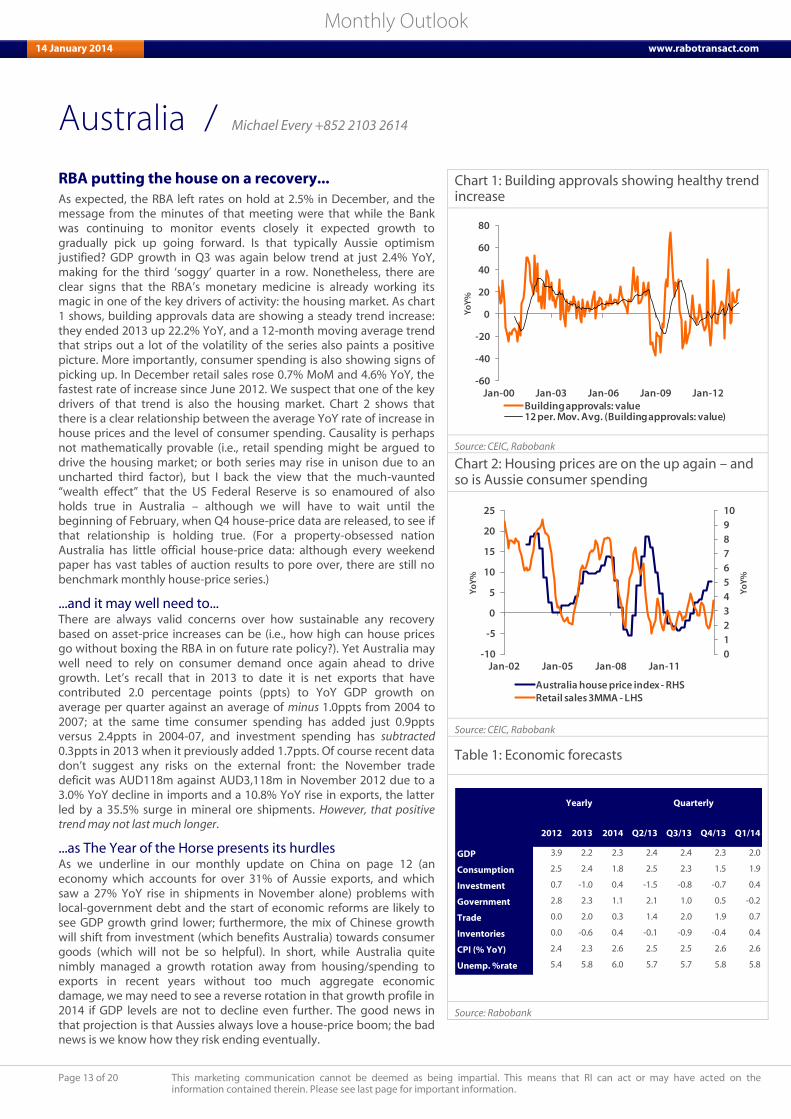
RBA putting the house on a recovery... As expected, the RBA left rates on hold at 2.5% in December, and the
message from the minutes of that meeting were that while the Bank
was continuing to monitor events closely it expected growth to
gradually pick up going forward. Is that typically Aussie optimism
justified? GDP growth in Q3 was again below trend at just 2.4% YoY,
making for the third ‘soggy’ quarter in a row. Nonetheless, there are
clear signs that the RBA’s monetary medicine is already working its
magic in one of the key drivers of activity: the housing market. As chart
1 shows, building approvals data are showing a steady trend increase:
they ended 2013 up 22.2% YoY, and a 12-month moving average trend
that strips out a lot of the volatility of the series also paints a positive
picture. More importantly, consumer spending is also showing signs of
picking up. In December retail sales rose 0.7% MoM and 4.6% YoY, the
fastest rate of increase since June 2012. We suspect that one of the key
drivers of that trend is also the housing market. Chart 2 shows that
there is a clear relationship between the average YoY rate of increase in
house prices and the level of consumer spending. Causality is perhaps
not mathematically provable (i.e., retail spending might be argued to
drive the housing market; or both series may rise in unison due to an
uncharted third factor), but I back the view that the much-vaunted
“wealth effect” that the US Federal Reserve is so enamoured of also
holds true in Australia – although we will have to wait until the
beginning of February, when Q4 house-price data are released, to see if
that relationship is holding true. (For a property-obsessed nation
Australia has little official house-price data: although every weekend
paper has vast tables of auction results to pore over, there are still no
benchmark monthly house-price series.)
...and it may well need to... There are always valid concerns over how sustainable any recovery
based on asset-price increases can be (i.e., how high can house prices
go without boxing the RBA in on future rate policy?). Yet Australia may
well need to rely on consumer demand once again ahead to drive
growth. Let’s recall that in 2013 to date it is net exports that have
contributed 2.0 percentage points (ppts) to YoY GDP growth on
average per quarter against an average of minus 1.0ppts from 2004 to
2007; at the same time consumer spending has added just 0.9ppts
versus 2.4ppts in 2004-07, and investment spending has subtracted
0.3ppts in 2013 when it previously added 1.7ppts. Of course recent data
don’t suggest any risks on the external front: the November trade
deficit was AUD118m against AUD3,118m in November 2012 due to a
3.0% YoY decline in imports and a 10.8% YoY rise in exports, the latter
led by a 35.5% surge in mineral ore shipments. However, that positive
trend may not last much longer.
...as The Year of the Horse presents its hurdles
As we underline in our monthly update on China on page 12 (an
economy which accounts for over 31% of Aussie exports, and which
saw a 27% YoY rise in shipments in November alone) problems with
local-government debt and the start of economic reforms are likely to
see GDP growth grind lower; furthermore, the mix of Chinese growth
will shift from investment (which benefits Australia) towards consumer
goods (which will not be so helpful). In short, while Australia quite
nimbly managed a growth rotation away from housing/spending to
exports in recent years without too much aggregate economic
damage, we may need to see a reverse rotation in that growth profile in
2014 if GDP levels are not to decline even further. The good news in
that projection is that Aussies always love a house-price boom; the bad
news is we know how they risk ending eventually.
Chart 1: Building approvals showing healthy trend increase
-60
-40
-20
0
20
40
60
80
Jan-00 Jan-03 Jan-06 Jan-09 Jan-12
Yo
Y%
Building approvals: value12 per. Mov. Avg. (Building approvals: value)
Source: CEIC, Rabobank
Chart 2: Housing prices are on the up again – and so is Aussie consumer spending
0
1
2
3
4
5
6
7
8
9
10
-10
-5
0
5
10
15
20
25
Jan-02 Jan-05 Jan-08 Jan-11
Yo
Y%
Yo
Y%
Australia house price index - RHSRetail sales 3MMA - LHS
Source: CEIC, Rabobank
Table 1: Economic forecasts
2012 2013 2014 Q2/13 Q3/13 Q4/13 Q1/14
GDP 3.9 2.2 2.3 2.4 2.4 2.3 2.0
Consumption 2.5 2.4 1.8 2.5 2.3 1.5 1.9
Investment 0.7 -1.0 0.4 -1.5 -0.8 -0.7 0.4
Government 2.8 2.3 1.1 2.1 1.0 0.5 -0.2
Trade 0.0 2.0 0.3 1.4 2.0 1.9 0.7
Inventories 0.0 -0.6 0.4 -0.1 -0.9 -0.4 0.4
CPI (% YoY) 2.4 2.3 2.6 2.5 2.5 2.6 2.6
Unemp. %rate 5.4 5.8 6.0 5.7 5.7 5.8 5.8
Yearly Quarterly
Source: Rabobank
/ Michael Every +852 2103 2614
Page 14
Page 14 of 20 This marketing communication cannot be deemed as being impartial. This means that RI can act or may have acted on the
information contained therein. Please see last page for important information.
Monthly Outlook 14 January 2014 www.rabotransact.com
Brazil
Why Ms Rousseff will probably be re-elected Since Mr Luis Inacio Lula da Silva (popularly known as Lula) was first
inaugurated as president in 2003, the importance of politics to the
markets has declined, as a consensus on basic policy has been
consolidated. This consensus has included agreements on fiscal
responsibility, an inflation target and a floating BRL. As his pupil, Ms
Rousseff has imposed her interventionist style since 2011 and markets
are now anticipating the debate about the 2014 general elections.
Here we point to ten reasons why, in our opinion, Ms Rousseff is
favorite to win the forthcoming Presidential election:
(1) The incumbent always starts ahead; (2) The republican system in
Brazil is very concentrated. States and municipalities, and their
representatives, are financially dependent on Central Government; (3)
Upgrades in social policy in recent years are still yielding political
dividends in the form of votes for the PT (Labour Party); (4) Recent
public expenses directed at consumers have further raised the short-
term welfare perception; (5) The unemployment rate is at its lowest
ever level; (6) Party alliances should give Ms Rousseff’s coalition some
50% of free time on open TV; (7) The opposition has been unable to
exploit the government’s weaknesses; (8) Only two candidates are
viable opponents, reducing the chances of a second round; (9) The
most likely scenario, in case of a second round, is that a slice of
opposition support will migrate to Ms Rousseff; (10) All the polls predict
a victory for Ms Rousseff.
Of course, many things could happen to change this reasoning and
alter the eventual outcome, but all of them would lie at the thin end of
the Bell curve. What is for sure today is that, statistically, Ms Rousseff
has a higher chance of winning the elections than Brazil has of winning
the World Cup.
The implications of the outcome of this election are crucial for the
country. Supposing that Ms Rousseff remains in office until 2018, we
should expect minor changes in her policy agenda. In infrastructure
auctions, for instance, some adjustment in the contracts could be
considered to boost their attractiveness to the private sector.
Unfortunately, we have to acknowledge that major changes in
economic policy are unlikely to happen. Monetary policy tends to avoid
direct confrontation with Government guidelines and usually reacts to
the outcomes of such policies. The Central Bank (CB) complies only
artificially with inflation target limits, even taking repressed publicly
monitored prices into account. Finally, the BRL is entering into
dangerous territory. After touching 4% of GDP last year, the current
account deficit should continue to grow. If that turns out to be the case,
the pressure on the BRL should complicate inflation control even
further. All in all, that would require courageous action, such as higher
interest rates, lower economic growth or higher unemployment to curb
inflation and adjust the currency in real terms. If the economy gets
close to the edge of the cliff, Ms Rousseff may give up some of her
ideological convictions. A better global economy, including a recovery
in commodity prices, could reduce the rate of the deterioration in her
probable second term. But the opposite is also true. A frustrated
recovery across the globe should require a quick return to basic
policies. Would Ms Rousseff be pragmatic enough to do that?
Chart 1: Voter intention polls, after Marina Silva and Eduardo Campos’ political alliance
Source: Datafolha
Chart 2: Current account deficit
-6
-4
-2
0
2
4
-100-80-60-40-20
020 20
03
200
4
200
5
200
6
200
7
200
8
200
9
2010
2011
2012
2013(e)
2014(f)
(%)
Current Account (USD billion)
CAD / GDP (%)
Source: Central Bank
Table 1: Brazil basic rate and inflation (IPCA)
Source: IBGE, Rabobank (f)
/ Robério Costa +55 11 5503 7315
Page 15
Page 15 of 20 This marketing communication cannot be deemed as being impartial. This means that RI can act or may have acted on the
information contained therein. Please see last page for important information.
Monthly Outlook 14 January 2014 www.rabotransact.com
Foreign Exchange
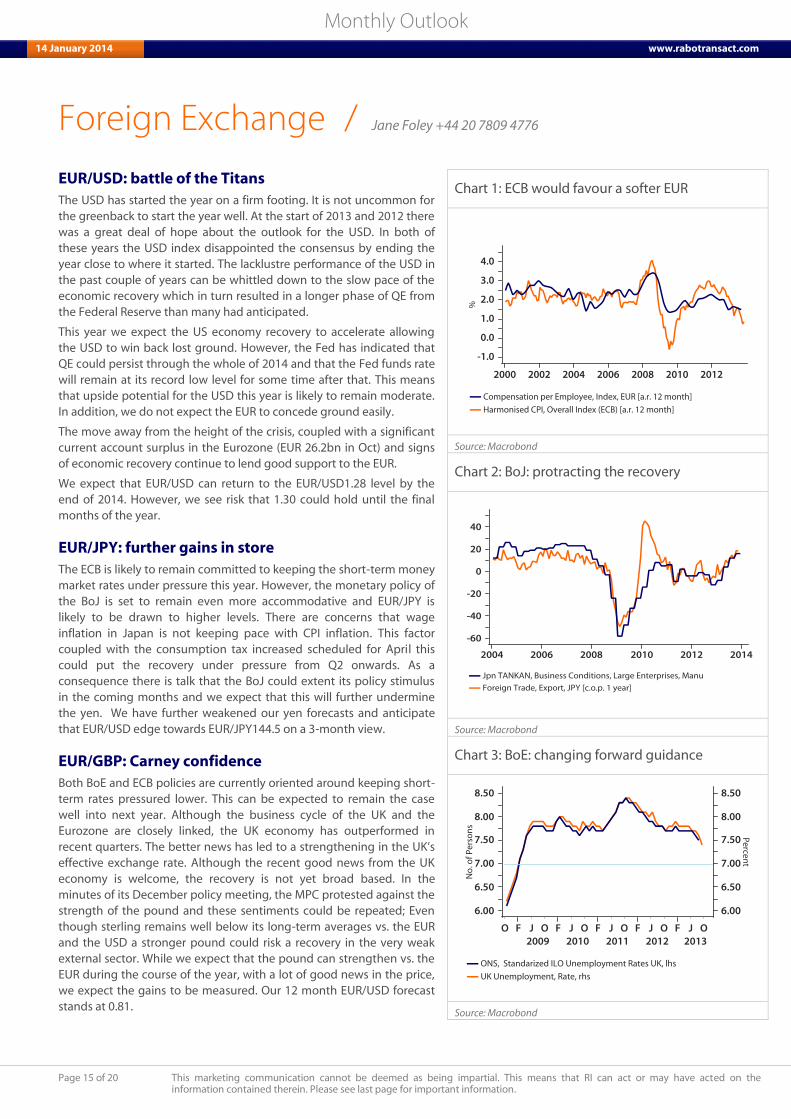
EUR/USD: battle of the Titans The USD has started the year on a firm footing. It is not uncommon for
the greenback to start the year well. At the start of 2013 and 2012 there
was a great deal of hope about the outlook for the USD. In both of
these years the USD index disappointed the consensus by ending the
year close to where it started. The lacklustre performance of the USD in
the past couple of years can be whittled down to the slow pace of the
economic recovery which in turn resulted in a longer phase of QE from
the Federal Reserve than many had anticipated.
This year we expect the US economy recovery to accelerate allowing
the USD to win back lost ground. However, the Fed has indicated that
QE could persist through the whole of 2014 and that the Fed funds rate
will remain at its record low level for some time after that. This means
that upside potential for the USD this year is likely to remain moderate.
In addition, we do not expect the EUR to concede ground easily.
The move away from the height of the crisis, coupled with a significant
current account surplus in the Eurozone (EUR 26.2bn in Oct) and signs
of economic recovery continue to lend good support to the EUR.
We expect that EUR/USD can return to the EUR/USD1.28 level by the
end of 2014. However, we see risk that 1.30 could hold until the final
months of the year.
EUR/JPY: further gains in store The ECB is likely to remain committed to keeping the short-term money
market rates under pressure this year. However, the monetary policy of
the BoJ is set to remain even more accommodative and EUR/JPY is
likely to be drawn to higher levels. There are concerns that wage
inflation in Japan is not keeping pace with CPI inflation. This factor
coupled with the consumption tax increased scheduled for April this
could put the recovery under pressure from Q2 onwards. As a
consequence there is talk that the BoJ could extent its policy stimulus
in the coming months and we expect that this will further undermine
the yen. We have further weakened our yen forecasts and anticipate
that EUR/USD edge towards EUR/JPY144.5 on a 3-month view.
EUR/GBP: Carney confidence Both BoE and ECB policies are currently oriented around keeping short-
term rates pressured lower. This can be expected to remain the case
well into next year. Although the business cycle of the UK and the
Eurozone are closely linked, the UK economy has outperformed in
recent quarters. The better news has led to a strengthening in the UK’s
effective exchange rate. Although the recent good news from the UK
economy is welcome, the recovery is not yet broad based. In the
minutes of its December policy meeting, the MPC protested against the
strength of the pound and these sentiments could be repeated; Even
though sterling remains well below its long-term averages vs. the EUR
and the USD a stronger pound could risk a recovery in the very weak
external sector. While we expect that the pound can strengthen vs. the
EUR during the course of the year, with a lot of good news in the price,
we expect the gains to be measured. Our 12 month EUR/USD forecast
stands at 0.81.
Chart 1: ECB would favour a softer EUR
Source: Macrobond
Chart 2: BoJ: protracting the recovery
Source: Macrobond
Chart 3: BoE: changing forward guidance
Source: Macrobond
/ Jane Foley +44 20 7809 4776
Page 16
Page 16 of 20 This marketing communication cannot be deemed as being impartial. This means that RI can act or may have acted on the
information contained therein. Please see last page for important information.
Monthly Outlook 14 January 2014 www.rabotransact.com
Fixed Income
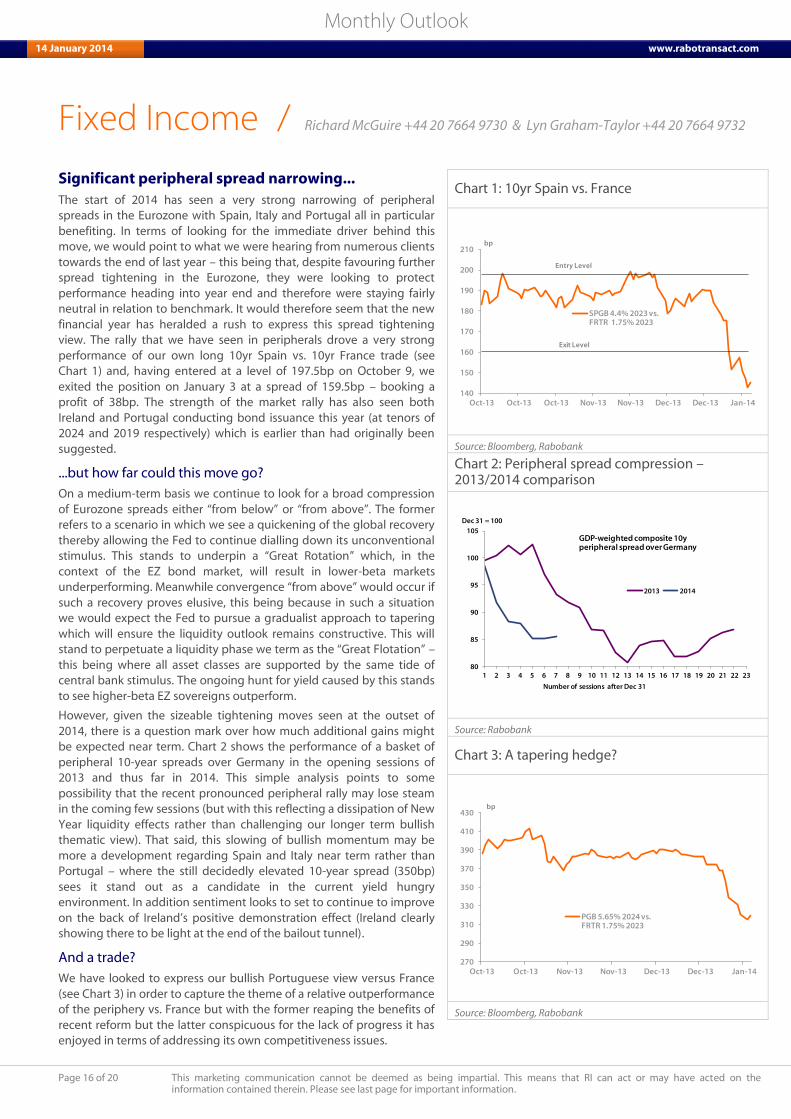
Significant peripheral spread narrowing... The start of 2014 has seen a very strong narrowing of peripheral
spreads in the Eurozone with Spain, Italy and Portugal all in particular
benefiting. In terms of looking for the immediate driver behind this
move, we would point to what we were hearing from numerous clients
towards the end of last year – this being that, despite favouring further
spread tightening in the Eurozone, they were looking to protect
performance heading into year end and therefore were staying fairly
neutral in relation to benchmark. It would therefore seem that the new
financial year has heralded a rush to express this spread tightening
view. The rally that we have seen in peripherals drove a very strong
performance of our own long 10yr Spain vs. 10yr France trade (see
Chart 1) and, having entered at a level of 197.5bp on October 9, we
exited the position on January 3 at a spread of 159.5bp – booking a
profit of 38bp. The strength of the market rally has also seen both
Ireland and Portugal conducting bond issuance this year (at tenors of
2024 and 2019 respectively) which is earlier than had originally been
suggested.
...but how far could this move go?
On a medium-term basis we continue to look for a broad compression
of Eurozone spreads either “from below” or “from above”. The former
refers to a scenario in which we see a quickening of the global recovery
thereby allowing the Fed to continue dialling down its unconventional
stimulus. This stands to underpin a “Great Rotation” which, in the
context of the EZ bond market, will result in lower-beta markets
underperforming. Meanwhile convergence “from above” would occur if
such a recovery proves elusive, this being because in such a situation
we would expect the Fed to pursue a gradualist approach to tapering
which will ensure the liquidity outlook remains constructive. This will
stand to perpetuate a liquidity phase we term as the “Great Flotation” –
this being where all asset classes are supported by the same tide of
central bank stimulus. The ongoing hunt for yield caused by this stands
to see higher-beta EZ sovereigns outperform.
However, given the sizeable tightening moves seen at the outset of
2014, there is a question mark over how much additional gains might
be expected near term. Chart 2 shows the performance of a basket of
peripheral 10-year spreads over Germany in the opening sessions of
2013 and thus far in 2014. This simple analysis points to some
possibility that the recent pronounced peripheral rally may lose steam
in the coming few sessions (but with this reflecting a dissipation of New
Year liquidity effects rather than challenging our longer term bullish
thematic view). That said, this slowing of bullish momentum may be
more a development regarding Spain and Italy near term rather than
Portugal – where the still decidedly elevated 10-year spread (350bp)
sees it stand out as a candidate in the current yield hungry
environment. In addition sentiment looks to set to continue to improve
on the back of Ireland’s positive demonstration effect (Ireland clearly
showing there to be light at the end of the bailout tunnel).
And a trade?
We have looked to express our bullish Portuguese view versus France
(see Chart 3) in order to capture the theme of a relative outperformance
of the periphery vs. France but with the former reaping the benefits of
recent reform but the latter conspicuous for the lack of progress it has
enjoyed in terms of addressing its own competitiveness issues.
Chart 1: 10yr Spain vs. France
140
150
160
170
180
190
200
210
Oct-13 Oct-13 Oct-13 Nov-13 Nov-13 Dec-13 Dec-13 Jan-14
SPGB 4.4% 2023 vs. FRTR 1.75% 2023
bp
Entry Level
Exit Level
Source: Bloomberg, Rabobank
Chart 2: Peripheral spread compression – 2013/2014 comparison
80
85
90
95
100
105
1 2 3 4 5 6 7 8 9 10 11 12 13 14 15 16 17 18 19 20 21 22 23
2013 2014
Dec 31 = 100
GDP-weighted composite 10y peripheral spread over Germany
Number of sessions after Dec 31
Source: Rabobank
Chart 3: A tapering hedge?
270
290
310
330
350
370
390
410
430
Oct-13 Oct-13 Nov-13 Nov-13 Dec-13 Dec-13 Jan-14
PGB 5.65% 2024 vs. FRTR 1.75% 2023
bp
Source: Bloomberg, Rabobank
/ Richard McGuire +44 20 7664 9730 & Lyn Graham-Taylor +44 20 7664 9732
Page 17
Page 17 of 20 This marketing communication cannot be deemed as being impartial. This means that RI can act or may have acted on the
information contained therein. Please see last page for important information.
Monthly Outlook 14 January 2014 www.rabotransact.com
Credit Markets
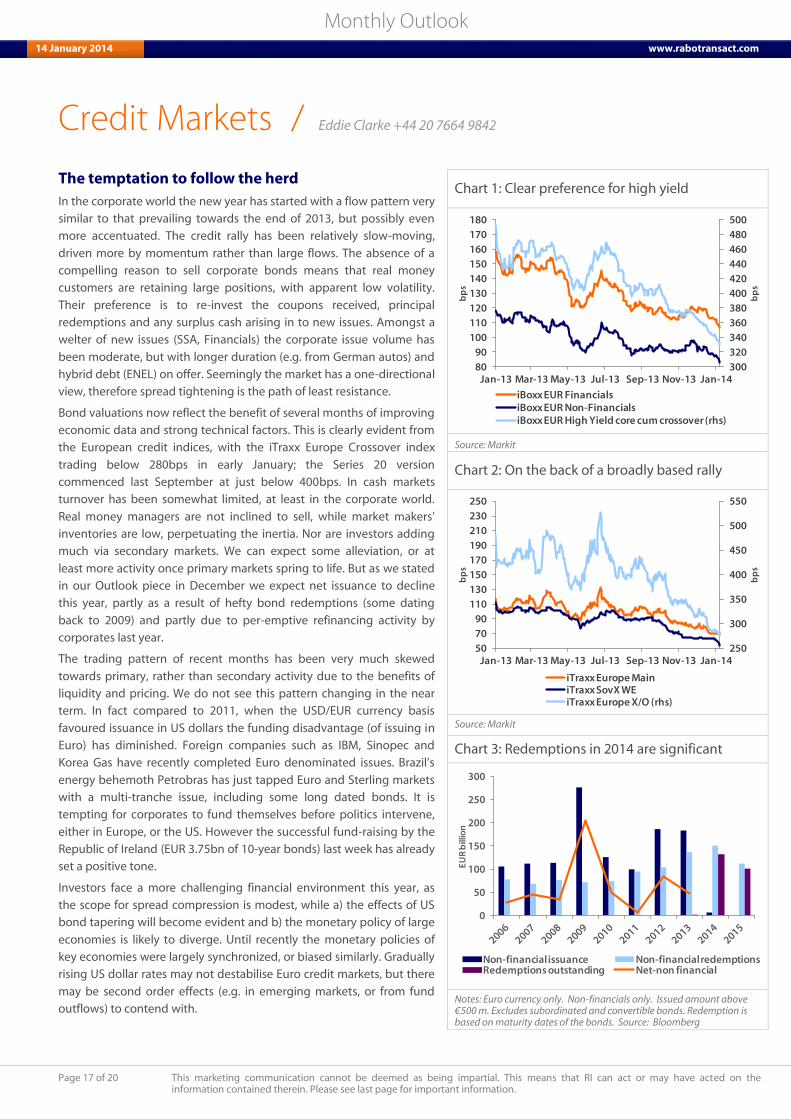
The temptation to follow the herd
In the corporate world the new year has started with a flow pattern very
similar to that prevailing towards the end of 2013, but possibly even
more accentuated. The credit rally has been relatively slow-moving,
driven more by momentum rather than large flows. The absence of a
compelling reason to sell corporate bonds means that real money
customers are retaining large positions, with apparent low volatility.
Their preference is to re-invest the coupons received, principal
redemptions and any surplus cash arising in to new issues. Amongst a
welter of new issues (SSA, Financials) the corporate issue volume has
been moderate, but with longer duration (e.g. from German autos) and
hybrid debt (ENEL) on offer. Seemingly the market has a one-directional
view, therefore spread tightening is the path of least resistance.
Bond valuations now reflect the benefit of several months of improving
economic data and strong technical factors. This is clearly evident from
the European credit indices, with the iTraxx Europe Crossover index
trading below 280bps in early January; the Series 20 version
commenced last September at just below 400bps. In cash markets
turnover has been somewhat limited, at least in the corporate world.
Real money managers are not inclined to sell, while market makers’
inventories are low, perpetuating the inertia. Nor are investors adding
much via secondary markets. We can expect some alleviation, or at
least more activity once primary markets spring to life. But as we stated
in our Outlook piece in December we expect net issuance to decline
this year, partly as a result of hefty bond redemptions (some dating
back to 2009) and partly due to per-emptive refinancing activity by
corporates last year.
The trading pattern of recent months has been very much skewed
towards primary, rather than secondary activity due to the benefits of
liquidity and pricing. We do not see this pattern changing in the near
term. In fact compared to 2011, when the USD/EUR currency basis
favoured issuance in US dollars the funding disadvantage (of issuing in
Euro) has diminished. Foreign companies such as IBM, Sinopec and
Korea Gas have recently completed Euro denominated issues. Brazil’s
energy behemoth Petrobras has just tapped Euro and Sterling markets
with a multi-tranche issue, including some long dated bonds. It is
tempting for corporates to fund themselves before politics intervene,
either in Europe, or the US. However the successful fund-raising by the
Republic of Ireland (EUR 3.75bn of 10-year bonds) last week has already
set a positive tone.
Investors face a more challenging financial environment this year, as
the scope for spread compression is modest, while a) the effects of US
bond tapering will become evident and b) the monetary policy of large
economies is likely to diverge. Until recently the monetary policies of
key economies were largely synchronized, or biased similarly. Gradually
rising US dollar rates may not destabilise Euro credit markets, but there
may be second order effects (e.g. in emerging markets, or from fund
outflows) to contend with.
Chart 1: Clear preference for high yield
300
320
340
360
380
400
420
440
460
480
500
80
90
100
110
120
130
140
150
160
170
180
Jan-13 Mar-13 May-13 Jul-13 Sep-13 Nov-13 Jan-14
bp
s
bp
s
iBoxx EUR FinancialsiBoxx EUR Non-FinancialsiBoxx EUR High Yield core cum crossover (rhs)
Source: Markit
Chart 2: On the back of a broadly based rally
250
300
350
400
450
500
550
50
70
90
110
130
150
170
190
210
230
250
Jan-13 Mar-13 May-13 Jul-13 Sep-13 Nov-13 Jan-14
bp
s
bp
s
iTraxx Europe MainiTraxx SovX WEiTraxx Europe X/O (rhs)
Source: Markit
Chart 3: Redemptions in 2014 are significant
0
50
100
150
200
250
300
EU
R b
illio
n
Non-financial issuance Non-financial redemptionsRedemptions outstanding Net-non financial
Notes: Euro currency only. Non-financials only. Issued amount above
€500 m. Excludes subordinated and convertible bonds. Redemption is
based on maturity dates of the bonds. Source: Bloomberg
/ Eddie Clarke +44 20 7664 9842
Page 18
Page 18 of 20 This marketing communication cannot be deemed as being impartial. This means that RI can act or may have acted on the
information contained therein. Please see last page for important information.
Monthly Outlook 14 January 2014 www.rabotransact.com
Financial Forecasts
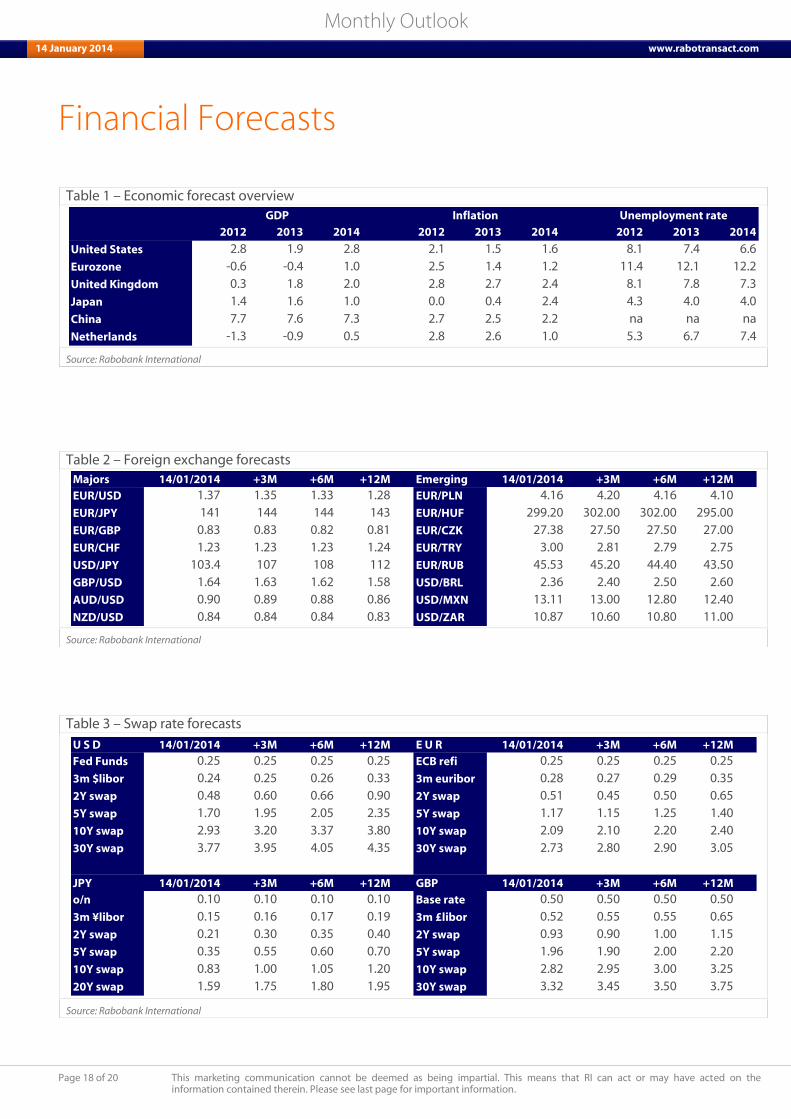
Table 1 – Economic forecast overview
2012 2013 2014 2012 2013 2014 2012 2013 2014
United States 2.8 1.9 2.8 2.1 1.5 1.6 8.1 7.4 6.6
Eurozone -0.6 -0.4 1.0 2.5 1.4 1.2 11.4 12.1 12.2
United Kingdom 0.3 1.8 2.0 2.8 2.7 2.4 8.1 7.8 7.3
Japan 1.4 1.6 1.0 0.0 0.4 2.4 4.3 4.0 4.0
China 7.7 7.6 7.3 2.7 2.5 2.2 na na na
Netherlands -1.3 -0.9 0.5 2.8 2.6 1.0 5.3 6.7 7.4
GDP Inflation Unemployment rate
Source: Rabobank International
Table 2 – Foreign exchange forecasts
Majors 14/01/2014 +3M +6M +12M Emerging 14/01/2014 +3M +6M +12M
EUR/USD 1.37 1.35 1.33 1.28 EUR/PLN 4.16 4.20 4.16 4.10
EUR/JPY 141 144 144 143 EUR/HUF 299.20 302.00 302.00 295.00
EUR/GBP 0.83 0.83 0.82 0.81 EUR/CZK 27.38 27.50 27.50 27.00
EUR/CHF 1.23 1.23 1.23 1.24 EUR/TRY 3.00 2.81 2.79 2.75
USD/JPY 103.4 107 108 112 EUR/RUB 45.53 45.20 44.40 43.50
GBP/USD 1.64 1.63 1.62 1.58 USD/BRL 2.36 2.40 2.50 2.60
AUD/USD 0.90 0.89 0.88 0.86 USD/MXN 13.11 13.00 12.80 12.40
NZD/USD 0.84 0.84 0.84 0.83 USD/ZAR 10.87 10.60 10.80 11.00
Source: Rabobank International
Table 3 – Swap rate forecasts
U S D 14/01/2014 +3M +6M +12M E U R 14/01/2014 +3M +6M +12M
Fed Funds 0.25 0.25 0.25 0.25 ECB refi 0.25 0.25 0.25 0.25
3m $libor 0.24 0.25 0.26 0.33 3m euribor 0.28 0.27 0.29 0.35
2Y swap 0.48 0.60 0.66 0.90 2Y swap 0.51 0.45 0.50 0.65
5Y swap 1.70 1.95 2.05 2.35 5Y swap 1.17 1.15 1.25 1.40
10Y swap 2.93 3.20 3.37 3.80 10Y swap 2.09 2.10 2.20 2.40
30Y swap 3.77 3.95 4.05 4.35 30Y swap 2.73 2.80 2.90 3.05
JPY 14/01/2014 +3M +6M +12M GBP 14/01/2014 +3M +6M +12M
o/n 0.10 0.10 0.10 0.10 Base rate 0.50 0.50 0.50 0.50
3m ¥libor 0.15 0.16 0.17 0.19 3m £libor 0.52 0.55 0.55 0.65
2Y swap 0.21 0.30 0.35 0.40 2Y swap 0.93 0.90 1.00 1.15
5Y swap 0.35 0.55 0.60 0.70 5Y swap 1.96 1.90 2.00 2.20
10Y swap 0.83 1.00 1.05 1.20 10Y swap 2.82 2.95 3.00 3.25
20Y swap 1.59 1.75 1.80 1.95 30Y swap 3.32 3.45 3.50 3.75
Source: Rabobank International
Page 19
Page 19 of 20 This marketing communication cannot be deemed as being impartial. This means that RI can act or may have acted on the
information contained therein. Please see last page for important information.
Monthly Outlook 14 January 2014 www.rabotransact.com
Financial Markets Research
Head
Jan Lambregts +44 207 664 9669 [email protected]
Macro
Elwin de Groot EMU +31 30 216 9012 [email protected]
Emile Cardon EMU/Switzerland +31 30 216 9013 [email protected]
Bas van Geffen EMU +31 30 216 9722 [email protected]
Philip Marey US +31 30 216 9721 [email protected]
Michael Every Asia +852 2103 2612 [email protected]
Marcel Weernink UK +31 30 216 0973 M.Weernink @rn.Rabobank.nl
Theo Smid Netherlands +31 30 216 7503 [email protected]
Dariusz Winek (BGZ) CEE +48 22 860 4356 [email protected]
Robério Costa Brazil +55 11 5503 7315 [email protected]
Foreign exchange
Jane Foley G10 +44 20 7809 4776 [email protected]
Christian Lawrence Emerging Markets +44 20 7664 9774 [email protected]
Fixed income
Richard McGuire +44 20 7664 9730 [email protected]
Lyn Graham-Taylor +44 20 7664 9732 [email protected]
Credit markets
Eddie Clarke Corporates +44 20 7664 9842 [email protected]
Stephen Queah Corporates +44 20 7664 9895 [email protected]
Oliver Burrows Financials +44 20 7664 9874 [email protected]
Ruben van Leeuwen ABS +31 30 216 9724 [email protected]
Commodity markets – Food & Agribusiness Research and Advisory (FAR)
Luke Chandler Global Head +61 2 8115 4826 [email protected]
Tracey Allen +44 20 7664 9514 [email protected]
Client coverage
Wholesale Corporate Clients
Martijn Sorber Global Head +31 30 216 9447 [email protected]
Hans Deusing Netherlands +31 30 216 90 45 [email protected]
David Kane Europe +44 20 7664 9744 [email protected]
Brandon Ma Asia +852 2103 2688 [email protected]
Andrew Millett Australia +61 2 8115 3101 [email protected]
Neil Williamson North America +1 212 808 6966 [email protected]
Marco Garcia Mexico +52 55 52610029 [email protected]
Gaston Iroume South America +56 2449 8536 [email protected]
Sergio Nakashima Brazil +55 11 55037150 [email protected]
Financial Institutions
Eddie Villiers Global Head +44 20 7664 9834 [email protected]
Arjan Brons Benelux +31 30 216 9070 [email protected]
Bill Cole UK, Eire, Scandinavia, M. East +44 20 7664 9885 [email protected]
Krishna Nayak Germany, Austria, CEE +44 20 7664 9883 [email protected]
Emmanuel Rodriguez Iberia +44 20 7664 9734 [email protected]
Philippe Macart France, Italy +44 20 7664 9893 [email protected]
Mark Melvin Switzerland +44 20 7809 9828 [email protected]
Edwin Bernard Asia +852 2103 2639 [email protected]
Sarah Lee USA +1 212 916 7875 [email protected]
Simon Jansen Treasury Sales – Europe +31 30 216 9782 [email protected]
Capital Markets
Rob Eilering ECM +31 30 7122162 Rob. [email protected]
Mark van Binsbergen DCM +31 30 2169771 [email protected]
Herald Top DCM +31 30 2169501 [email protected]
Othmar ter Waarbeek DCM +31 30 2169022 [email protected]
Page 20
Page 20 of 20 This marketing communication cannot be deemed as being impartial. This means that RI can act or may have acted on the
information contained therein. Please see last page for important information.
Monthly Outlook 14 January 2014 www.rabotransact.com
Disclaimer
Non Independent Research This document is issued by Coöperatieve Centrale Raiffeisen-Boerenleenbank B.A. incorporated in the Netherlands, trading as Rabobank International (“RI”). The liability of its members is limited. RI is authorised by De Nederlandsche Bank, Netherlands and the Prudential Regulation Authority (PRA) and subject to limited regulation by the Financial Conduct Authority (FCA) and PRA. Details about the extent of our authorisation and regulation by the PRA, and regulation by the FCA are available from us on request. Registered in England and Wales No. BR002630. This document is directed exclusively to Eligible Counterparties and Professional Clients. It is not directed at Retail Clients. This document does not purport to be impartial research and has not been prepared in accordance with legal requirements designed to promote the independence of Investment Research and is not subject to any prohibition on dealing ahead of the dissemination of Investment Research . This document does NOT purport to be an impartial assessment of the value or prospects of its subject matter and it must not be relied upon by any recipient as an impartial assessment of the value or prospects of its subject matter. No reliance may be placed by a recipient on any representations or statements made outside this document (oral or written) by any person which state or imply (or may be reasonably viewed as stating or implying) any such impartiality. This document is for information purposes only and is not, and should not be construed as, an offer or a commitment by RI or any of its affiliates to enter into a transaction. This document does not constitute investment advice and nor is any information provided intended to offer sufficient information such that is should be relied upon for the purposes of making a decision in relation to whether to acquire any financial products. The information and opinions contained in this document have been compiled or arrived at from sources believed to be reliable, but no representation or warranty, express or implied, is made as to their accuracy, completeness or correctness. The information contained in this document is not to be relied upon by the recipient as authoritative or taken in substitution for the exercise of judgement by any recipient. Any opinions, forecasts or estimates herein constitute a judgement of RI as at the date of this document, and there can be no assurance that future results or events will be consistent with any such opinions, forecasts or estimates. All opinions expressed in this document are subject to change without notice. To the extent permitted by law, neither RI, nor other legal entities in the group to which it belongs accept any liability whatsoever for any direct or consequential loss howsoever arising from any use of this document or its contents or otherwise arising in connection therewith. Insofar as permitted by applicable laws and regulations, RI or other legal entities in the group to which it belongs, their directors, officers and/or employees may have had or have a long or short position or act as a market maker and may have traded or acted as principal in the securities described within this document (or related investments) or may otherwise have conflicting interests. This may include hedging transactions carried out by RI or other legal entities in the group, and such hedging transactions may affect the value and/or liquidity of the securities described in this document. Further it may have or have had a relationship with or may provide or have provided corporate finance or other services to companies whose securities (or related investments) are described in this document. Further, internal and external publications may have been issued prior to this publication where strategies may conflict according to market conditions at the time of each publication. This document may not be reproduced, distributed or published, in whole or in part, for any purpose, except with the prior written consent of RI. By accepting this document you agree to be bound by the foregoing restrictions.
© Rabobank International, Croeselaan 18, 3521 CB Utrecht, The Netherlands