2017 H2 Globalscope Newsletter reporting on global M&A activity and the latest semi-annual conference “The starting point for business valuation across all sectors in any region in the global marketplace” Perth 2017 H2
Transcript
2017 H2
Globalscope Newsletterreporting on global M&A activity and the latest semi-annual conference
“The starting point for business valuation across all sectors in any region in the global marketplace”
Perth 2017 H2
1Issue 7
Published November 2017
About Globalscope
What we do
Our focus is on mergers and acquisitions (M&A). This oftenincludes representing clients who wish to divest or acquire acompany and advising our clients on the related fine detailsincluding, for example, restructuring, international jointventures and licensing initiatives.
We work with the senior management of private and public companies as well as private equity firms.
Who we are
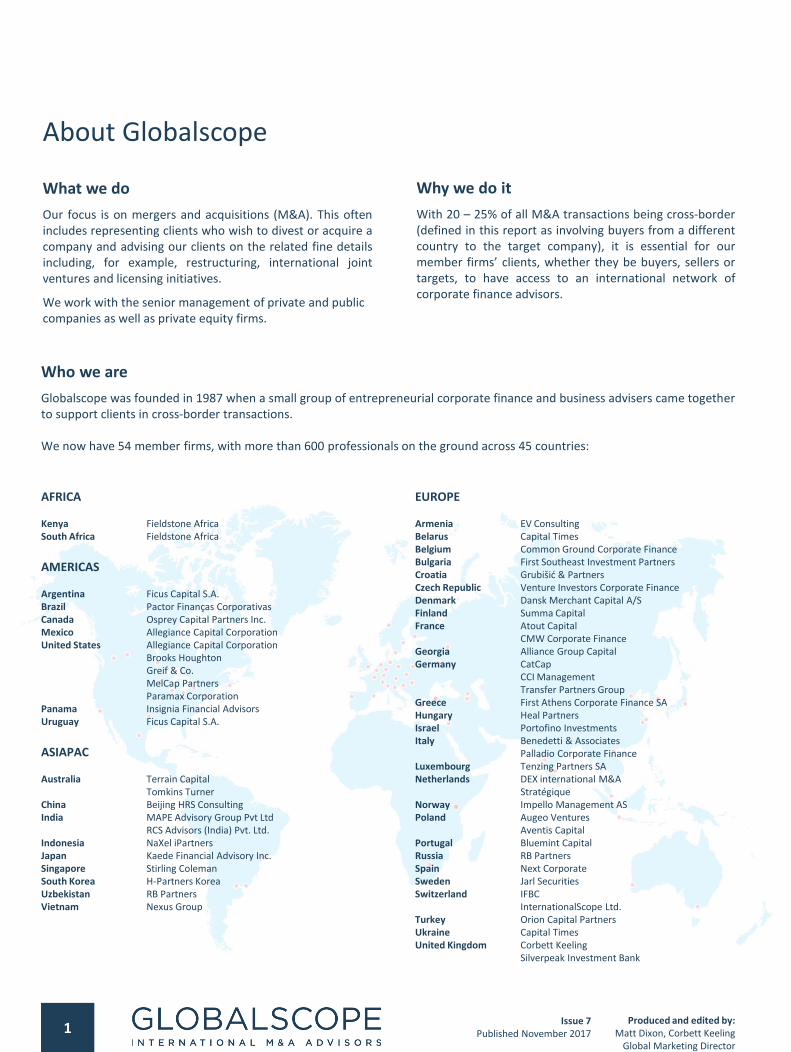
Globalscope was founded in 1987 when a small group of entrepreneurial corporate finance and business advisers came togetherto support clients in cross-border transactions.
We now have 54 member firms, with more than 600 professionals on the ground across 45 countries:
AFRICA
Kenya Fieldstone AfricaSouth Africa Fieldstone Africa
AMERICAS
Argentina Ficus Capital S.A.Brazil Pactor Finanças CorporativasCanada Osprey Capital Partners Inc.Mexico Allegiance Capital CorporationUnited States Allegiance Capital Corporation
Panama Insignia Financial AdvisorsUruguay Ficus Capital S.A.
ASIAPAC
Australia Terrain CapitalTomkins Turner
China Beijing HRS ConsultingIndia MAPE Advisory Group Pvt Ltd
RCS Advisors (India) Pvt. Ltd.Indonesia NaXel iPartnersJapan Kaede Financial Advisory Inc.Singapore Stirling ColemanSouth Korea H-Partners KoreaUzbekistan RB PartnersVietnam Nexus Group
EUROPE
Armenia EV ConsultingBelarus Capital TimesBelgium Common Ground Corporate FinanceBulgaria First Southeast Investment PartnersCroatia Grubišić & PartnersCzech Republic Venture Investors Corporate FinanceDenmark Dansk Merchant Capital A/SFinland Summa CapitalFrance Atout Capital
CMW Corporate FinanceGeorgia Alliance Group CapitalGermany CatCap
InternationalScope Ltd.Turkey Orion Capital PartnersUkraine Capital TimesUnited Kingdom Corbett Keeling
Silverpeak Investment Bank
Produced and edited by:Matt Dixon, Corbett Keeling
Global Marketing Director
Why we do it
With 20 – 25% of all M&A transactions being cross-border(defined in this report as involving buyers from a differentcountry to the target company), it is essential for ourmember firms’ clients, whether they be buyers, sellers ortargets, to have access to an international network ofcorporate finance advisors.
2
Contents
Globalscope ConferenceHighlights of discussions from the latest Globalscope conference held in Perth, Australia
New developments 5
Conference report 6
Global M&A market landscape 7
Lower-mid market sector highlights 8($5-150m enterprise value transactions)
Regional Valuation StatisticsCountry by country and region by region analysis of business valuation statistics
Transaction data by region 11
Listed companies data by region 13
The starting point for business valuation across all sectors in any region in the global marketplace
Sector-Specific AnalysisA closer look at the underlying sector-specific structural drivers, new developments, recent M&A and projections
Consumer 17
Financial Services 19
Life Sciences 21
Industrials 23
Services 25
Technology, Media & Telecoms (TMT) 27
3
Data analysed by:Data supplied by:
Definitions and notes
Definitions
TEV - “Total Enterprise Value”TEV is an economic measure reflecting the market value of a whole business independent of a business’ capital structure. The analysis in thisdocument calculates TEV as follows:• For transaction data, by reference to the target company of each transaction, from the transaction consideration, share of equity
acquired, and other disclosed details such as the target’s net debt, as at the transaction date,• For listed company data, from the listed share price of each company, together with known details of its capital structure including issued
shares and net debt, as at the stated date.
EBITDA - “Earnings Before Interest, Tax, Depreciation and Amortisation”EBITDA is a business’ net income with interest, taxes, depreciation and amortisation added back which is often taken as a proxy for the cashgeneration rate of a business. The analysis in this document calculates EBITDA as follows:• For transaction data, by reference to the target company of each transaction, from the most recent known historic 12 months’ reported
value as at the transaction date,• For listed company data, from the most recent known historic 12 months’ reported value as at the stated date.
TEV/EBITDA - “TEV/EBITDA Multiple”The TEV/EBITDA Multiple is calculated for each transaction where more than 40% of the target’s equity is sold or for each listed companywhere the required data is disclosed. Where appropriate, the analysis in this document uses weighted averages calculated as follows:• For transaction data analysis, selected transaction TEV/EBITDA Multiples, within a given six month period, are weighted by reference to
each transaction’s reported consideration or “transaction value”,• For listed company data analysis, selected listed company TEV/EBITDA Multiples, on the stated date, are weighted by reference to each
listed company’s TEV,• Anomalous outlying data points are excluded.
SizeThe size classifications used in this document are Globalscope defined limits with respect to the value of the included transactions or listedcompanies as follows:• For transaction data, transactions are included where the TEV of the target is disclosed and identified by Capital IQ as being greater than
or equal to $5m (All Market Transactions), or greater than or equal to $5m and lower than or equal to $150m (Lower-Mid MarketTransactions).
• For listed company data, companies are included where there is a stock market listing, and a TEV of the company that is disclosed andidentified by Capital IQ as being greater than or equal to $5m (All Market Listed Companies), or greater than or equal to $5m and lowerthan or equal to $150m (Lower-Mid Market Listed Companies).
SectorsThe sector classifications used in this document are Globalscope defined aggregations of similar business activities based on sub-sectorsdefined by reference to the primary Capital IQ industry classification as follows:• For transaction data, the target company of each transaction,• For listed company data, each listed company.
RegionsThe regional classifications used in this document are defined by reference to the Capital IQ regional classification as follows:• For transaction data, the target company of each transaction,• For listed company data, each listed company.
Note on using multiples for business valuation:It is important to note that TEV/EBITDA Multiples calculated as set out above and applied to the EBITDA of a typical lower-mid marketbusiness would, in the majority of cases, be expected to overstate the value of the business. This can in part be due to the net impact of acombination of the following factors:
• A discount may be applied due to reduced liquidity of shares in a lower-mid market business,
• A premium may be applied due to the additional value of owning a controlling equity share,
• A (perceived) lack of transparency with respect to a lower-mid market business’ affairs,
• “TEV” is based on forecast profits (which usually assume growth) whereas these multiples are based on historic profits.
4
Globalscope ConferenceHighlights of discussions from the latest Globalscope conference held in Perth, Australia
New developments 5
Conference report 6
Global M&A market landscape 7
Lower-mid market sector highlights 8($5-150m enterprise value transactions)
5
New developments
Valuation multiples peak 2017 H2
Synopsis
In the six months to June 2017 the global average Lower-Mid Market Transactions TEV/EBITDA Multiple has risen to 9.4, its highest value in the last two years. This latest business valuation indicator is based on an analysis of 18,553 transactions in the period, of which 25% were categorised as cross-border.
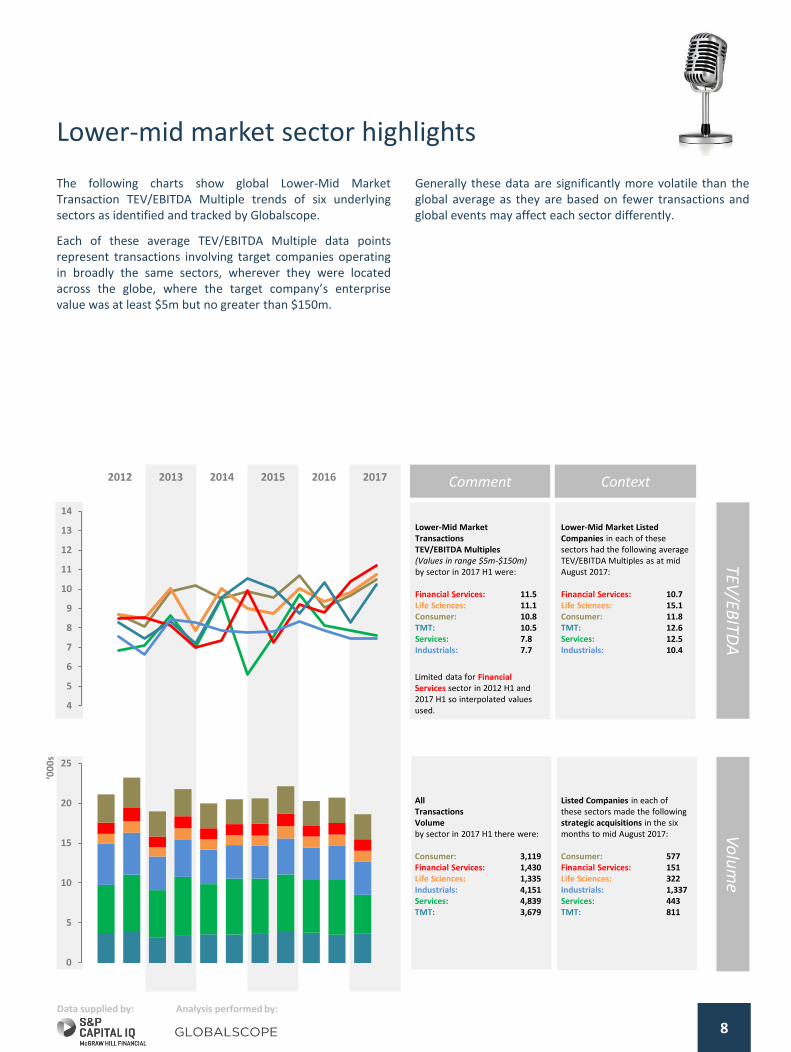
The Financial Services sector companies commanded the highest valuations, with Lower-Mid Market Transactions TEV/EBITDA Multiples averaging 11.5. This is in contrast to the Industrials sector where the average was 7.7; Industrials and Services were the only two sectors to fall over the period.
Synopsis
At the recent semi-annual conference in Perth, Globalscope president RussellD’Alba announced Globalscope’s newest member: Turkish firm Orion CapitalPartners.
Deniz Kartal of Orion Capital Partners commented:
President’s Comment
“No better place than Perth to bond withour overseas colleagues. Perth is a fantasticcity, has world class facilities as weexperienced at the Crown Towers, and somuch natural beauty. This event sawrepresentation from 20 countries and it isour great pleasure to welcome OrionCapital from Turkey as a new member. Wecelebrated the largest deal in the network,the most active firm, and flagship cross-border transactions.” - Russell D’Alba
“We are honored to be welcomed into such anesteemed group of corporate financeprofessionals and such a prestigious network. Webelieve that the extensive and deep connectionsthat Globalscope network provides around theglobe will enable us to better serve our clients inthe Turkish market whether it be in securingstrategic partners for further growth or in findingsolid investment opportunities abroad. We lookforward to completing many successfulinternational deals under the Globalscopeumbrella.”
Deniz KartalOrion Capital Partners New Member Firm
The two day conference programme, hosted byGlobalscope’s member firm in Perth, Tompkins Turner, wasattended by 30 delegates from Globalscope’s member firms.
The semi-annual conference included best practicepresentations given by CatCap, and a presentation oninteracting with PE by Corbett Keeling. In addition, guestspeakers Tony Chong, Partner at Lavan Legal, and IanThubron, founder of Asia Strategies and former Executive VPat TBWA Asia Pacific, gave talks on M&A in Asia.
Comment“We were honored to host theGlobalscope conference in Perth todevelop deeper member collaboration,share more techniques learned throughbest practices and generate the meansto increase the volume of partnershipdeals. We also found at least three newpotential global buyers for a business weare currently marketing.”
Todd GroverTompkins Turner
Host member firm
Tompkins Turner, an Australianadvisory firm based in Perthoffers mergers and acquisitionsadvice to mid-market companies.
Headlines
Next
The next Globalscope conference will be held in Panama City in April 2018.
Greatest number of transactions:CatCap (Germany) reported 6 deals completed in the last 6months.
Largest transaction:Summa Capital (Finland) for their transaction with YIT andLemminkäinen.
Intra-Globalscope deal:Stratégique (Netherlands) and Atout Capital (France) whichrespectively advised The Surgical Group, a Dutch medicalproducts company, on its acquisition of a majority stake inAxess Vision, a French medical devices company
Globalscope’s M&Atrack record continuesto gain momentumwith the followingheadlines in the lastsix months:
6
2012 2013 2014 2015 2016 2017
7
Global M&A market landscape
Thousands of M&A transactions all across the globe areclosed in any given six month period.
Transaction data, such as the latest published EBITDA andthe TEV (see definitions on page 3) at the time of sale of thetarget company, are sometimes published. These data canbe used to calculate average transaction TEV/EBITDAMultiples i.e. the average TEV/EBITDA Multiple across alltransactions for which data is disclosed for each six monthperiod.
Across a large enough sample of transactions, these averageTEV/EBITDA Multiples are a useful tool for assessing globalvaluation trends, as set out in the first chart below.
All Market TransactionsDot-dash lines show average data from all disclosedtransactions where the transaction value was at least $5m.The resulting All Market Transactions TEV/EBITDA Multiple,which can be used as a proxy for the M&A market as a whole,shows a further rise to an historic peak.
Lower-Mid Market TransactionsSolid lines show average data from all disclosed transactionswhere the transaction value was at least $5m but no greaterthan $150m. The resulting Lower-Mid Market TransactionsTEV/EBITDA Multiple shows a slight increase maintaining arelatively steady historic average.
TEV
/EB
ITD
AV
olu
me
Lower-Mid Market Transactions TEV/EBITDA Multiple(Values in range $5m-$150m)has risen to 9.4 from 8.9 in 2016 H2
All MarketTransactions TEV/EBITDA Multiple(Values over $5m)has risen further to 14.1 from the low of 11.3 in 2015 H1
‘000s
This compares to the currentAll Market Listed Companies TEV/EBITDA Multiple of 12.8
This compares to the currentLower-Mid Market Listed Companies TEV/EBITDA Multiple of 11.6
Comment Context
AllTransactions VolumeTransaction volumes have decreased, and are now below the 5 year average
Cross-Border TransactionsVolumeremaining at a consistent 22% - 25% of the total
Listed Companies made 3,641 strategic acquisitions in the last 6 months, this is below the average of 3,952 strategic acquisitions per six month period over the last three years
Lower-Mid Market Listed Companies made 561 strategic acquisitions in the last six months, this is above the average of 529 strategic acquisitions per six month period over the last three years
Data supplied by:
0
5
10
15
20
25
Data analysed by:
6.0
7.0
8.0
9.0
10.0
11.0
12.0
13.0
14.0
15.0
16.0
‘000s
8
Lower-mid market sector highlights
TEV/EB
ITDA
Vo
lum
e
Generally these data are significantly more volatile than theglobal average as they are based on fewer transactions andglobal events may affect each sector differently.
The following charts show global Lower-Mid MarketTransaction TEV/EBITDA Multiple trends of six underlyingsectors as identified and tracked by Globalscope.
Each of these average TEV/EBITDA Multiple data pointsrepresent transactions involving target companies operatingin broadly the same sectors, wherever they were locatedacross the globe, where the target company’s enterprisevalue was at least $5m but no greater than $150m.
2012 2013 2014 2015 2016 2017 Comment Context
Limited data for Financial Services sector in 2012 H1 and 2017 H1 so interpolated values used.
All TransactionsVolumeby sector in 2017 H1 there were:
Regional Valuation StatisticsCountry by country and region by region analysis of business valuation statistics
Transaction data by region 11
Listed companies data by region 13
11
Transactions data by region
Euro
pe
2012 2013 2014 2015 2016 2017 Comment Context
Lower-Mid Market European Transactions TEV/EBITDA Multiple(Values in range $5m-$150m) has fallen to 8.6 from 9.9 in 2014 H2
All MarketEuropean TransactionsTEV/EBITDA Multiple(Values over $5m) has fallen slightly to 14.8 from 14.9 in 2016 H2
This compares to the currentAll Market European Listed Companies TEV/EBITDA Multiple of 11.4
This compares to the currentLower-Mid Market European Listed Companies TEV/EBITDA Multiple of 12.3
Un
ited
Sta
tes
& C
an
ad
a
Lower-Mid MarketUS & Canada Transactions TEV/EBITDA Multiple(Values in range $5m-$150m) has risen to 11.0 from 8.6 in 2016 H2
All MarketUS & Canada Transactions TEV/EBITDA Multiple(Values over $5m) has risen to 14.6 from 12.4 in 2016 H2
This compares to the currentAll Market US & Canada Listed Companies TEV/EBITDA Multiple of 13.4
This compares to the currentLower-Mid Market US & Canada Listed Companies TEV/EBITDA Multiple of 11.8
Asi
a &
Pa
cifi
c
All MarketAsian TransactionsTEV/EBITDA Multiple(Values over $5m) has fallen to 10.6 from 11.0 in 2016 H2
This compares to the currentAll Market Asian Listed Companies TEV/EBITDA Multiple of 13.4
Lower-Mid MarketAsian TransactionsTEV/EBITDA Multiple(Values in range $5m-$150m)has fallen to 8.0 from 8.6 in 2016 H2
This compares to the currentLower-Mid Market Asian Listed Companies TEV/EBITDA Multiple of 11.6
Data supplied by: Data analysed by:
Lower-Mid Market Transactions (solid lines)
The solid line shows average TEV/EBITDA Multiple data fromall disclosed transactions where the transaction value was atleast $5m but no greater than $150m and the target locationwas recorded in one of the five global regions.
Multiples for Africa & Middle East and Latin America haveboth risen sharply. Multiples in United States & Canada havealso increased over the period.
All Market Transactions (dot-dash lines)
Dot-dash lines show average TEV/EBITDA Multiple data fromall disclosed transactions where the transaction value was atleast $5m and the target location was recorded in one of thefive global regions.
Multiples for Africa & Middle East have risen over the period.Both Europe and Asia & Pacific, by contrast, have fallen.
4
6
8
10
12
14
16
4
6
8
10
12
14
16
4
6
8
10
12
14
16
0
5
10
15
20
25
Tho
usa
nd
s
2012 2013 2014 2015 2016 2017
12
Africa
& M
idd
le East
Latin
Am
erica
Comment Context
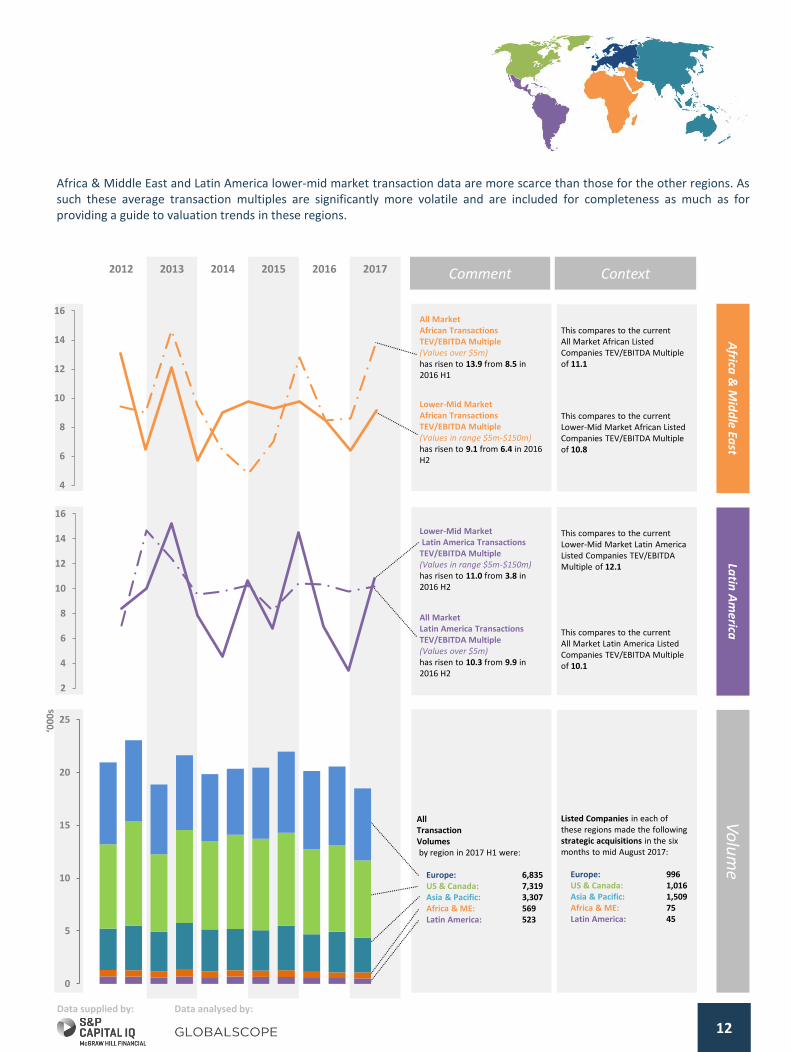
All MarketAfrican Transactions TEV/EBITDA Multiple(Values over $5m) has risen to 13.9 from 8.5 in 2016 H1
This compares to the currentAll Market African Listed Companies TEV/EBITDA Multiple of 11.1
Lower-Mid Market African Transactions TEV/EBITDA Multiple(Values in range $5m-$150m)has risen to 9.1 from 6.4 in 2016 H2
This compares to the currentLower-Mid Market African Listed Companies TEV/EBITDA Multiple of 10.8
All MarketLatin America Transactions TEV/EBITDA Multiple(Values over $5m) has risen to 10.3 from 9.9 in 2016 H2
This compares to the currentAll Market Latin America Listed Companies TEV/EBITDA Multiple of 10.1
Lower-Mid MarketLatin America Transactions
TEV/EBITDA Multiple(Values in range $5m-$150m) has risen to 11.0 from 3.8 in 2016 H2
This compares to the currentLower-Mid Market Latin America Listed Companies TEV/EBITDA Multiple of 12.1
Africa & Middle East and Latin America lower-mid market transaction data are more scarce than those for the other regions. Assuch these average transaction multiples are significantly more volatile and are included for completeness as much as forproviding a guide to valuation trends in these regions.
Data supplied by:
‘000s
Data analysed by:
Listed Companies in each of these regions made the following strategic acquisitions in the six months to mid August 2017:
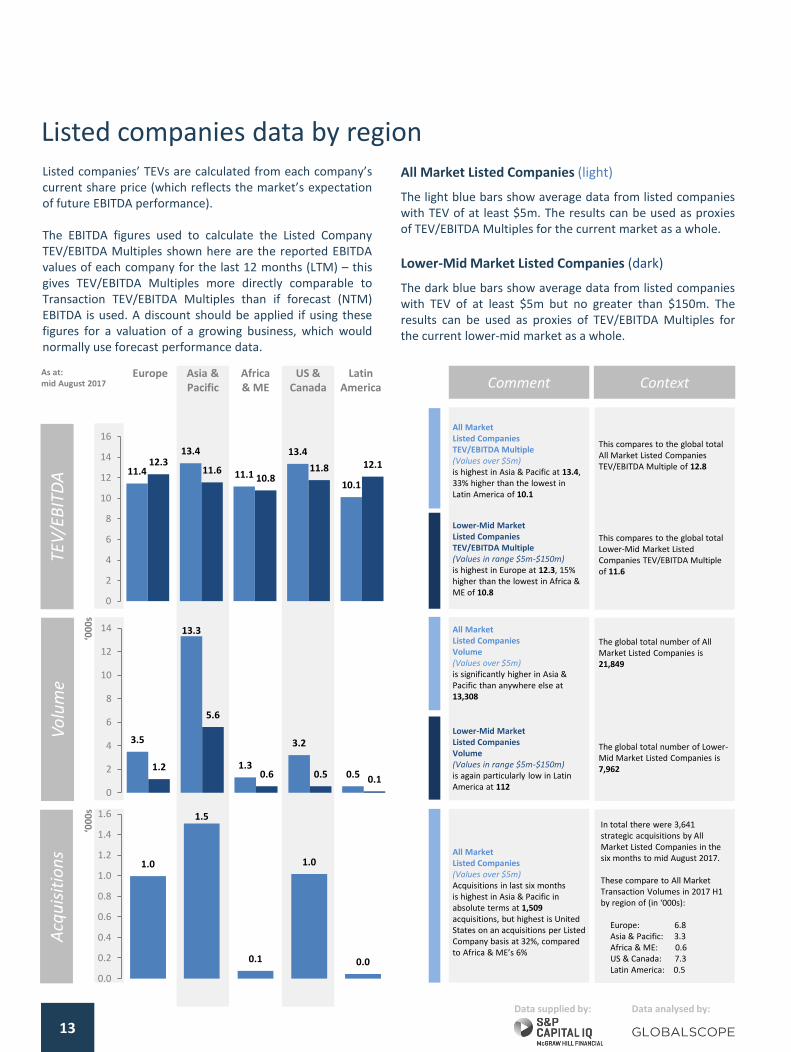
Listed companies’ TEVs are calculated from each company’scurrent share price (which reflects the market’s expectationof future EBITDA performance).
The EBITDA figures used to calculate the Listed CompanyTEV/EBITDA Multiples shown here are the reported EBITDAvalues of each company for the last 12 months (LTM) – thisgives TEV/EBITDA Multiples more directly comparable toTransaction TEV/EBITDA Multiples than if forecast (NTM)EBITDA is used. A discount should be applied if using thesefigures for a valuation of a growing business, which wouldnormally use forecast performance data.
13
Listed companies data by regionAll Market Listed Companies (light)
The light blue bars show average data from listed companieswith TEV of at least $5m. The results can be used as proxiesof TEV/EBITDA Multiples for the current market as a whole.
Lower-Mid Market Listed Companies (dark)
The dark blue bars show average data from listed companieswith TEV of at least $5m but no greater than $150m. Theresults can be used as proxies of TEV/EBITDA Multiples forthe current lower-mid market as a whole.
Lower-Mid MarketListed CompaniesVolume(Values in range $5m-$150m) is again particularly low in Latin America at 112
All MarketListed CompaniesVolume(Values over $5m) is significantly higher in Asia & Pacific than anywhere else at 13,308
The global total number of All Market Listed Companies is 21,849
The global total number of Lower-Mid Market Listed Companies is 7,962
Comment Context
Lower-Mid Market Listed CompaniesTEV/EBITDA Multiple(Values in range $5m-$150m) is highest in Europe at 12.3, 15% higher than the lowest in Africa & ME of 10.8
All Market Listed CompaniesTEV/EBITDA Multiple(Values over $5m) is highest in Asia & Pacific at 13.4, 33% higher than the lowest in Latin America of 10.1
This compares to the global total All Market Listed Companies TEV/EBITDA Multiple of 12.8
This compares to the global total Lower-Mid Market Listed Companies TEV/EBITDA Multiple of 11.6
Vo
lum
eTE
V/E
BIT
DA
Acq
uis
itio
ns
‘000s
As at:mid August 2017
Data supplied by:
All MarketListed Companies(Values over $5m) Acquisitions in last six months is highest in Asia & Pacific in absolute terms at 1,509acquisitions, but highest is United States on an acquisitions per Listed Company basis at 32%, compared to Africa & ME’s 6%
In total there were 3,641 strategic acquisitions by All Market Listed Companies in the six months to mid August 2017.
These compare to All Market Transaction Volumes in 2017 H1 by region of (in ‘000s):
During the Perth 2017 Globalscope conference, the network’s global Consumer sector team met to discuss recenttransactions and the evolving underlying structural drivers of the global sector M&A landscape.
A key theme is the growth of social media and its increasing influence over consumer spending habits. More details canbe obtained from team members or regional heads – see contact details below.
Lower-mid market observations
Sector contacts
Notable recent transactions
Sector themes
Polarised Consumer Spending
Customers within the food and beverage sector have tendedto favour the extremities of the market, as trends such asaffordable indulgence and healthier eating have grownalongside staples sold in budget supermarkets such as Aldiand Lidl.
Overseas Buyers Enticed by Devalued Pound
The devaluation of sterling meant UK assets wereexceptionally good value and international buyers seized theopportunity to invest.
Amazon Gobbles up Whole Foods
Amazon.com Inc. will acquire Whole Foods Market Inc. for$13.7bn, creating a launchpad for the e-commercecompany’s grocery sales. This acquisition follows Amazon’stie-up with UK supermarket chain Morrison's in late 2016.
Sycamore Partners Acquires Staples
The private equity firm has put together a $6.9bn turnaroundplan that includes reducing the retail footprint of the officesupplies company.
LVMH Takes Full Control of Christian Dior
French billionaire and LVMH chairman Bernard Arnaultmoved to consolidate control over Christian Dior forapproximately $14.1bn.
Online Shopping’s Continued Rise in Importance
The volume of products bought online continues to grow atan exceptional rate, with particular focus on purchases frommobile devices. The increased necessity for sufficientcybersecurity has added another layer of sophistication tothe platforms.
“Midorexia” and its Associated Spend
The stock coined phrase ‘mid-life crisis’ has a subdivision forthose customers who are acting, and therefore spending,younger than their years might suggest. The phenomenoncan be witnessed in the fashion industry, as well as fitnessrelated tech and apparel.
From holidays to hoodies, consumers continue to search for(seemingly) entirely tailorable products. Offering a widerange of services should help retailers build a strongeremotional attachment to their customers. It is now expectedthat all services possess some element of adaptability.
Social Media Influencer Marketing
The use of Instagram influencers by big brands has grownexponentially, although it is now expecting a crackdown fromconsumer protection bodies in the UK and US.
18
Durables& Apparel
Consumer Services
Retailing Food Staples
Food Luxuries
Europe Asia & Pacific
Africa & ME
US & Canada
Latin America
M&A trends & market analysis
The following data are compiled specifically for the Consumer sector, with valuation trends over time in the first chartbased on semi-annually averaged transactional data and regional and sub-sector comparisons in the second and thirdcharts based on listed companies data as at mid August 2017.
2012 2013 2014 2015 2016 2017
Lower-Mid Market Consumer Transactions TEV/EBITDA Multiple(Values in range $5m-$150m) has risen further to 10.8 from 9.3 in 2016 H1
All MarketConsumer Transactions TEV/EBITDA Multiple(Values over $5m) has fallen to 13.2 from 15.5 in 2016 H2
This compares to the current cross-sector All Market Transactions TEV/EBITDA Multiple of 14.1
This compares to the current cross-sector Lower-Mid Market Transactions TEV/EBITDA Multiple of 9.4
Comment Context
Lower-Mid MarketConsumer Listed Companies TEV/EBITDA Multiple(Values in range $5m-$150m) by subsector is highest in Food Staples at 12.9, 14% higher than the lowest in Food Luxuries of 11.3
All MarketConsumer Listed Companies TEV/EBITDA Multiple(Values over $5m) by subsector is highest in Retailing at 17.9, 72% higher than the lowest in Food Staples of 10.4
Reg
ion
al TEV
/EBITD
ASu
b-secto
r TEV/EB
ITDA
Sector TEV
/EBITD
A
Lower-Mid MarketConsumer Listed Companies TEV/EBITDA Multiple(Values in range $5m-$150m) by region is highest in Latin America at 14.0, 28% higher than the lowest in US & Canada of 11.0
All MarketConsumer Listed Companies TEV/EBITDA Multiple(Values over $5m) by region is highest in Asia & Pacific at 15.7, 15% higher than the lowest in Africa & ME of 13.6
This compares to the All Market Consumer Listed Companies TEV/EBITDA Multiple of 15.0
This compares to the Lower-Mid Market Consumer Listed Companies TEV/EBITDA Multiple of 11.8
Analysis performed by:Data supplied by:
6
7
8
9
10
11
12
13
14
15
16
This compares to the All Market Consumer Listed Companies TEV/EBITDA Multiple of 15.0
This compares to the Lower-Mid Market Consumer Listed Companies TEV/EBITDA Multiple of 11.8
14.315.7
13.6
15.313.7
11.5 11.8 12.011.0
14.0
0
2
4
6
8
10
12
14
16
18
20
14.0 14.3
17.9
10.4
15.2
12.0 11.8 11.612.9
11.3
0
2
4
6
8
10
12
14
16
18
20
Financial Services
19
The sector M&A landscape
During the Perth 2017 Globalscope conference, the network’s global Financial Services sector team met to discuss recenttransactions and the evolving underlying structural drivers of the global sector M&A landscape.
A key theme is the increasing reliance on both digital payments and cryptocurrency around the world. More details can beobtained from team members or regional heads – see contact details below.
Russia’s Central Bank announced the launch of a financialrehabilitation program for Otkritie Group, the country’slargest private financial institution. According to Russianmonetary authority, Otkritie requires a significant capitalincrease and extensive measures to improve its financialhealth. As a result of the process, Russia’s Central Bank maytake up to 75% equity position in the group.
Blockchain in Focus, but Uncertainty Lingers
Central banks and governments continue to voice their viewson Bitcoin and other cryptocurrencies, which has resulted inprices becoming even more volatile than usual. One exampleis the recent ban imposed by Chinese authorities on initialcoin offerings in the country, which led to a dramatic drop inBitcoin prices and put a question mark on the future of aChinese blockchain-based economy.
Canaccord Genuity Acquires Hargreave Hale
Canadian wealth manager Canaccord Genuity has acquiredUK-based wealth manager Hargreave Hale for circa £80m.The Hargreave Hale business will be merged with Canaccord’sexisting UK wealth management business.
Canada’s CIBC Acquires $5bn PrivateBancorp
Canadian Imperial Bank of Commerce has completed the$5bn acquisition of Chicago-based PrivateBancorp. Accordingto CIBC CEO Victor Dodig, the deal has been almost threeyears in the making.
Macquarie Acquires Green Investment Bank
Macquarie Group, along with support from UniversitiesSuperannuation Scheme, acquired the UK Government’sGreen Investment Bank for £2.3bn. The Green InvestmentBank provides banking and lending services to eco-friendlyprojects.
Digital Payments Providers Under Pressure
Mounting consumer pressure for faster, seamless, cheaperand more secure digital payments will press companies tocollaborate and move quickly in order to keep up. This willalso fuel consolidation in the industry. The latestdevelopment is the global fund Hellman & Friedman, which isfronting an investor group, bidding to acquire the Nordicpayment system provider NETS for $5.1bn. Hellman &Friedman wants to use the NETS platform for Europeanconsolidation of the payment service industry andsubsequent expansion into e-commerce.
Banks Continue to Embrace Cloud & AI Tech
Banks are exploring opportunities for IT to increase theirrange of services and value proposition. In Russia, forexample, these efforts are largely led by Sberbank whichrecently announced the launch of a cloud service for SME / e-commerce companies. There are plans, too, to develop alegal chat-bot and other initiatives in the high-tech area.M&A opportunities may arise for smaller IT companies thatdevelop FinTech solutions that can be “plugged in” to largercorporates.
The following data are compiled specifically for the Financial Services sector, with valuation trends over time in the firstchart based on semi-annually averaged transactional data and regional and sub-sector comparisons in the second andthird charts based on listed companies data as at mid August 2017.
2012 2013 2014 2015 2016 2017
All MarketFinancial Services Transactions TEV/EBITDA Multiple (Values over $5m) has fallen to 13.2 from 15.3 in 2016 H2
Lower-Mid Market Financial Services Transactions TEV/EBITDA Multiple(Values in range $5m-$150m) has risen to 11.5 from 9.1 in 2016 H1
Comment Context
Lower-Mid MarketFinancial Services Listed Companies TEV/EBITDA Multiple(Values in range $5m-$150m) by subsector is highest in Banks at 13.4, 41% higher than the lowest in Insurance of 9.5
All MarketFinancial Services Listed Companies TEV/EBITDA Multiple(Values over $5m) by subsector is highest in Real Estate at 15.8, 31% higher than the lowest in Insurance of 12.1
Lower-Mid MarketFinancial Services Listed Companies TEV/EBITDA Multiple(Values in range $5m-$150m) by region is highest in Asia & Pacific at 11.7, 80% higher than the lowest in Latin America of 6.5
All MarketFinancial Services Listed Companies TEV/EBITDA Multiple(Values over $5m) by region is highest in Asia & Pacific at 15.6, 81% higher than the lowest in Latin America of 8.6
Analysis performed by:Data supplied by:
Banks Diversified Insurance Real Estate
4
6
8
10
12
14
16
18
This compares to the All Market Financial Services Listed Companies TEV/EBITDA Multiple of 12.9
This compares to the Lower-Mid Market Financial Services Listed Companies TEV/EBITDA Multiple of 10.7
Reg
ion
al TEV
/EBITD
ASu
b-secto
r TEV/EB
ITDA
Sector TEV
/EBITD
A
This compares to the All Market Financial Services Listed Companies TEV/EBITDA Multiple of 12.9
This compares to the Lower-Mid Market Financial Services Listed Companies TEV/EBITDA Multiple of 10.7
This compares to the current cross-sector All Market Transactions TEV/EBITDA Multiple of 14.1
This compares to the current cross-sector Lower-Mid Market Transactions TEV/EBITDA Multiple of 9.4
10.2
15.6
12.9 12.8
8.610.0
11.710.4 9.7
6.5
0
2
4
6
8
10
12
14
16
18
20
13.0 13.512.1
15.8
13.4
11.5
9.5
12.0
0
2
4
6
8
10
12
14
16
18
20
Life Sciences
21
The sector M&A landscape
During the Perth 2017 Globalscope conference, the network’s global Life Sciences sector team met to discuss recenttransactions and the evolving underlying structural drivers of the global sector M&A landscape.
A key theme is the continued tightening of regulation, in spite of some policy uncertainty. More details can be obtained from team members or regional heads – see contact details below.
In May 2017 the MDR was published and will be mandatoryfrom May 2020 onwards. Slowly, more and more potentialimpacts are coming to light. For instance, several products,and even some software, that had previously not beenclassified as a medical product will be classified as such.Extensive clinical data will be required, not only for newproducts, but also for the re-certification of proven products.Overall, quality management and regulatory affair (QM/RA)costs will noticeably increase resulting in a higher barrier toentry in favour of established oligopolists.
Shortfall in QM/RA Capacities Expected
Due to the MDR, notified bodies themselves need torecertify. Smaller institutions might not be able to comply.Therefore, we expect a consolidation wave in the sector.Over the next few years, both corporates and notified bodieswill need more QM/RA capacities leading to a shortage inthat area.
Johnson & Johnson acquired Actelion
J&J has closed the acquisition of Swiss company Actelion for$29.4bn. Actelion has spun off its drug discovery operationsand early-stage clinical development assets into a newlycreated Swiss biopharmaceutical company, Idorsia Ltd.
Becton Dickinson to Acquire Bard
The $24bn deal adds Bard’s devices to Becton Dickinson’sportfolio in the high-growth sectors of oncology and surgery.The deal is the latest in a string of deals in the MedTechsector.
Gilead to Acquire Kite Pharma
Kite is a leader in the emerging field of cell therapy in which apatient’s immune cells are activated to fight cancer. The dealis expected to be worth $11.9bn. Gilead’s focus previouslyhas been on infectious diseases, and this deal is seen as amove to diversify its portfolio.
Cyberattacks
Some of the industry’s most established companies, includingMerck, Beiersdorf and the British NHS, were subject to theWannaCry ransomware attack this summer. Many healthcareinstitutions have taken to implementing some moresophisticated IT systems, as well as adhering to morestringent digital housekeeping. At the end of August 2017,the FDA announced that approximately 500,000 implantablecardiac pacemakers require a firmware update to addresscybersecurity vulnerabilities. One lesson learned is thathealthcare products with digital components require specialquality management attention in general and even postmarket introduction to remain secure.
US Big Dealmaking Declines
Companies have been shying away from large takeoversfollowing President Donald Trump’s failure to move aheadwith overhauling the American tax code. This is coupled withEuropean uncertainty around Britain’s extraction from theEuropean Union.
Medical Services Activity Up
Low interest rates, higher deal leverage multiples, cash onprivate equity and strategic balance sheets allowed forcontinued consolidation in the medical services sub-sector.This has been further driven by greater demand for, amongstother things, non-invasive surgeries.
Lower-mid market observations
Sector contacts
Notable recent transactions
Sector themes
Europe Asia & Pacific
Africa & ME
US & Canada
Latin America
22
M&A trends & market analysis
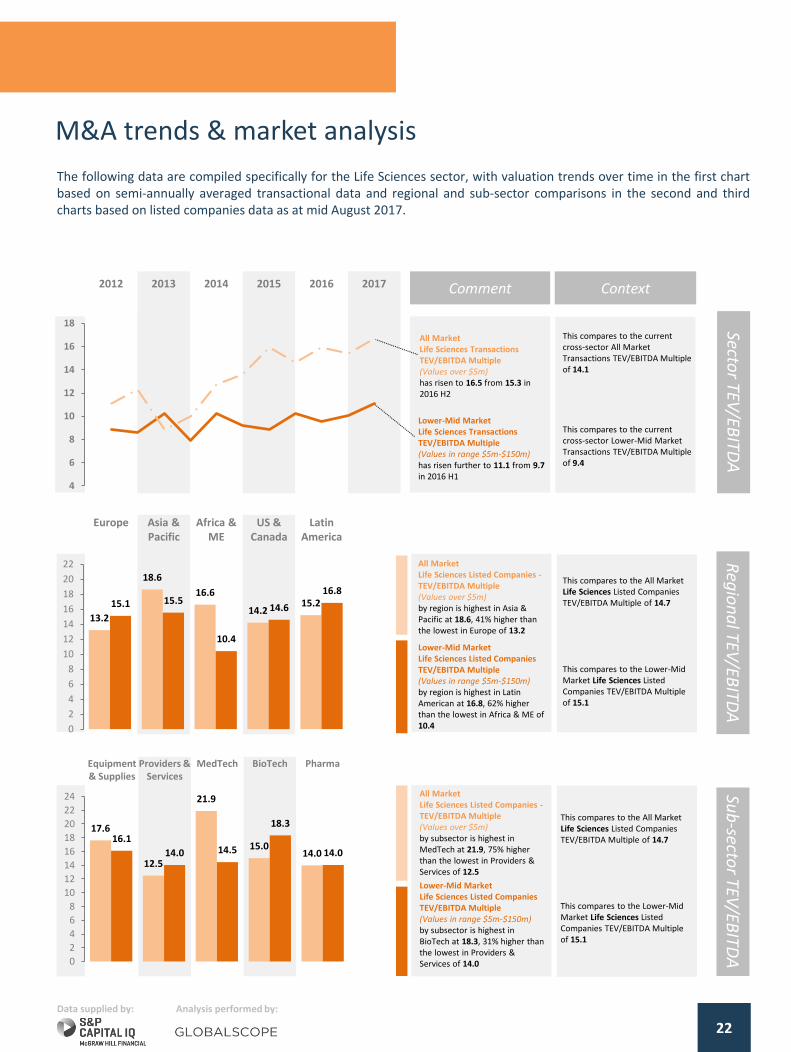
The following data are compiled specifically for the Life Sciences sector, with valuation trends over time in the first chartbased on semi-annually averaged transactional data and regional and sub-sector comparisons in the second and thirdcharts based on listed companies data as at mid August 2017.
2012 2013 2014 2015 2016 2017
Lower-Mid Market Life Sciences TransactionsTEV/EBITDA Multiple(Values in range $5m-$150m) has risen further to 11.1 from 9.7 in 2016 H1
All MarketLife Sciences Transactions TEV/EBITDA Multiple(Values over $5m) has risen to 16.5 from 15.3 in 2016 H2
Comment Context
Lower-Mid Market Life Sciences Listed Companies TEV/EBITDA Multiple(Values in range $5m-$150m) by subsector is highest in BioTech at 18.3, 31% higher than the lowest in Providers & Services of 14.0
All MarketLife Sciences Listed Companies -TEV/EBITDA Multiple(Values over $5m) by subsector is highest in MedTech at 21.9, 75% higher than the lowest in Providers & Services of 12.5
Lower-Mid Market Life Sciences Listed Companies TEV/EBITDA Multiple(Values in range $5m-$150m) by region is highest in Latin American at 16.8, 62% higher than the lowest in Africa & ME of 10.4
All MarketLife Sciences Listed Companies -TEV/EBITDA Multiple(Values over $5m) by region is highest in Asia & Pacific at 18.6, 41% higher than the lowest in Europe of 13.2
Analysis performed by:Data supplied by:
4
6
8
10
12
14
16
18
Equipment & Supplies
Providers & Services
MedTech BioTech Pharma
This compares to the All Market Life Sciences Listed Companies TEV/EBITDA Multiple of 14.7
This compares to the Lower-Mid Market Life Sciences Listed Companies TEV/EBITDA Multiple of 15.1
Reg
ion
al TEV
/EBITD
ASu
b-secto
r TEV/EB
ITDA
Sector TEV
/EBITD
A
This compares to the All Market Life Sciences Listed Companies TEV/EBITDA Multiple of 14.7
This compares to the Lower-Mid Market Life Sciences Listed Companies TEV/EBITDA Multiple of 15.1
This compares to the current cross-sector All Market Transactions TEV/EBITDA Multiple of 14.1
This compares to the current cross-sector Lower-Mid Market Transactions TEV/EBITDA Multiple of 9.4
13.2
18.6
16.6
14.215.215.1 15.5
10.4
14.6
16.8
0
2
4
6
8
10
12
14
16
18
20
22
17.6
12.5
21.9
15.014.0
16.1
14.0 14.5
18.3
14.0
0
2
4
6
8
10
12
14
16
18
20
22
24
The sector M&A landscape
Industrials
During the Perth 2017 Globalscope conference, the network’s global Industrials sector team met to discuss recenttransactions and the evolving underlying structural drivers of the global sector M&A landscape.
A key theme is the emergence of technology and Internet of Things as a facet of manufacturing. More details can be obtained from team members or regional heads – see contact details below.
23
Utilities Companies Empower Consumer
Schemes are being trialled that allow consumers to own grid-tied solar panels. These panels, and energy storage thereof,are provided by a utility company and allow the consumer tobe a “self-consumer” of power.
Manufacturing now Multifaceted
Modern-day manufacturing has now become a multi-sectorproblem. With the rise of connected factories, and in-builtlogistics systems, companies view manufacturing as an areafor sector-by-sector improvement.
Use of Data Analytics Shaping Maintenance
‘Condition-based maintenance’ is altering the way thatservice contracts and warranties are provided by companies.Constant monitoring of equipment allows companies tomonitor wear, usage patterns and service timelines.
SNC-Lavelin acquires WS Atkins
Diversified industrials company SNC-Lavelin has acquired WSAtkins in a $2.7bn transformational deal. WS Atkins providesconsultancy services in design, engineering and projectmanagement.
Rockwell Collins acquires B/E Aerospace
Aircraft interior manufacturer Rockwell Collins has completedthe $8.6bn acquisition of B/E Aerospace, a manufacturer ofaircraft interiors and accessories, including lighting, lavatorysystems and connectivity solutions.
Bridgepoint Acquires Miller Homes
Britain’s largest privately owned housebuilder, Miller Homes,has been acquired by private equity group BridgepointCapital in a deal worth $850m. Miller reported a 31% increasein operating profit between 2015 and 2016.
New Era of Personal Transportation
Connected cars are making in-roads in the automotiveindustry; software designers are now more in demand thanmechanical engineers. This coupled with the electrification ofvehicles will lead to manufacturers adjusting their strategy.According to PWC’s global automotive M&A report, largeauto-tech deals quintupled in H1 2017 compared to H1 2016.
Digitalisation in the Chemicals Sector
Chemicals companies are seeking to improve customerexperience by utilising the latest digital technology. Oneexample of this is to track usage patterns of chemicals andproducts and proactively addressing customer needs.
Emerging Economies Taking Market Share
Engineering and contracting firms in rapidly growingeconomies have begun to adopt an outward-facing approach.Previously, these firms focused on their respective domesticmarkets, but are now competing on the world stage.
Low Cost Carriers Disrupting Airline Industry
The airline industry was once clear-cut in its definition of low-cost carriers and full-service carriers. These distinctionscontinue to be blurred as ultra low-cost carriers take marketshare from the once dominant full-service carriers. Overall,the industry continues to thrive as global passenger trafficgrew 7.9% in H1 2017 over H1 2016 according to IATA.
The following data are compiled specifically for the Industrials sector, with valuation trends over time in the first chartbased on semi-annually averaged transactional data, and regional and sub-sector comparisons in the second and thirdcharts based on listed companies data as at mid August 2017.
2012 2013 2014 2015 2016 2017
Lower-Mid MarketIndustrials Transactions TEV/EBITDA Multiple (Values in range $5m-$150m) has remained flat at 7.7, its previous high of 8.6 was in 2015 H2
All MarketIndustrials Transactions TEV/EBITDA Multiple (Values over $5m) has risen to 14.6 from 10.4 in 2016 H2
Comment Context
Lower-Mid MarketIndustrials Listed CompaniesTEV/EBITDA Multiples(Values in range $5m-$150m) by subsector is highest in Capital Goods at 11.2, 28% higher than the lowest in Energy of 8.7
All MarketIndustrials Listed CompaniesTEV/EBITDA Multiple (Values over $5m) by subsector is highest in Capital Goods at 13.9, 51% higher than the lowest in Automobiles of 9.2
Lower-Mid MarketIndustrials Listed CompaniesTEV/EBITDA Multiple(Values in range $5m-$150m) by region is highest in Europe at 11.2, 11% higher than the lowest in US & Canada at 10.1
All MarketIndustrials Listed CompaniesTEV/EBITDA Multiple(Values over $5m) by region is highest in US & Canada at 12.4, 46% higher than the lowest in Latin America of 8.5
Data analysed by:Data supplied by:
24
This compares to the All Market Industrials Listed Companies TEV/EBITDA Multiple of 11.3
This compares to the Lower-Mid Market Industrials Listed Companies TEV/EBITDA Multiple of 10.4
Reg
ion
al TEV
/EBITD
ASu
b-secto
r TEV/EB
ITDA
Sector TEV
/EBITD
A
This compares to the All Market Industrials Listed Companies TEV/EBITDA Multiple of 11.3
This compares to the Lower-Mid Market Industrials Listed Companies TEV/EBITDA Multiple of 10.4
4
6
8
10
12
14
16
Europe Asia & Pacific
Africa & ME
US & Canada
Latin America
This compares to the current cross-sector All Market Transactions TEV/EBITDA Multiple of 14.1
This compares to the current cross-sector Lower-Mid Market Transactions TEV/EBITDA Multiple of 9.4
9.3
12.010.5
12.4
8.5
11.210.2 10.3 10.1 10.6
0
2
4
6
8
10
12
14
16
18
20
9.611.2
13.9
9.210.7
8.79.8
11.2
9.5 9.8
0
2
4
6
8
10
12
14
16
18
20
25
Services
The sector M&A landscape
During the Perth 2017 Globalscope conference, the network’s global Services sector team met to discuss recenttransactions and the evolving underlying structural drivers of the global sector M&A landscape.
Key themes are acquirers undergoing unprecedented diversification, and how an understanding of the trends in digital disruption is critical to determining the best potential acquirers of services businesses. More details can be obtained from team members or regional heads – see contact details below.
Whilst the consulting sector is still traditionally dominated bythe large firms, inclusive of the Big 4, smaller challengers aregaining momentum by focusing solely on a niche and offeringa highly specialised service.
Consolidation Across the Consulting Market
More mature, mid-size, companies are being snapped up bymajor players in a bid to provide a full suite of services. Thisis, in turn, making it difficult for mid-size players to competein a market where scale benefits matter.
Freelance Employees Causing Disruption
Freelancers and network-based employees are disruptingtraditional professional service subsectors by offering moretailored knowledge of buyers and providing a more ‘high-touch’ service.
Political Headwinds Subsiding
2016 was the year of political upsets. Trump is now well intohis presidency, and whilst Brexit is still fraught withuncertainty, it is largely ‘business as usual’ for UK companiesoperating within the EU. Some believe, though, that Britain'sEU extraction may take five or more years.
Gartner Acquires CEB
Information technology research and advisory companyGartner, Inc. has acquired US best practice and talentmanagement company CEB for approximately $2.6bn.
GoGoVan and 58 Suyun Merge
The merger between GoGoVan and 58 Suyun has created thelargest online intra-city logistics platform in Asia. Thecombined company is worth in excess of $1bn. 58 Suyun isthe logistics business of online classifieds giant 58 Home.
General Electric Completes Penske Equity Sale
GE has sold its final 15.5% stake in Penske Truck Leasing tothe former partners of the business for around $674m.Penske manages a fleet of around 250,000 trucks acrossAmerica.
Robotics Shaping the Future of Logistics
UPS, DHL and FedEx are all experimenting with roboticloading and unloading of irregular parcels. Improved mappingtechnologies will allow robots to evaluate packets moreaccurately, as well as increasing efficient use of space inshipping containers and lorries.
Digital Driving New Business Models
Management consultancies are looking to reduce their over-reliance on senior consultants by applying more quantitativeanalysis and using automation to decrease lead times andincrease efficiency.
2012 2013 2014 2015 2016 2017
Europe Asia & Pacific
Africa & ME
US & Canada
Latin America
26
ProfessionalServices
HR and Employ-
ment
Real Estate Mgmt
Research / Consulting
Transport-ation
M&A trends & market analysis
The following data are compiled specifically for the Services sector, with valuation trends over time in the first chart based onsemi-annually averaged transactional data, and regional and sub-sector comparisons in the second and third charts based onlisted companies data as at mid August 2017.
Lower-Mid MarketServices Transactions TEV/EBITDA Multiple (Values in range $5m-$150m) has fallen further to 7.8 from 10.0 in 2015 H2
All MarketServices Transactions TEV/EBITDA Multiple (Values over $5m) has risen further to 13.9 from 10.5 in 2016 H1
Comment Context
Lower-Mid MarketServices Listed CompaniesTEV/EBITDA Multiple(Values in range $5m-$150m) by subsector is highest in HR & Employment at 15.2, 31% higher than the lowest in Transportation of 11.6
All MarketServices Listed CompaniesTEV/EBITDA Multiple(Values over $5m) by subsector is highest in Research / Consulting at 16.0, 70% higher than the lowest in Transportation of 9.4
Lower-Mid MarketServices Listed CompaniesTEV/EBITDA Multiple(Values in range $5m-$150m) by region is highest in US & Canada at 16.5, 54% higher than the lowest in Africa & ME of 10.7
All MarketServices Listed CompaniesTEV/EBITDA Multiple(Values over $5m) by region is highest in Asia & Pacific at 14.4, 33% higher than the lowest in Latin America of 10.8
Data analysed by:Data supplied by:
4
6
8
10
12
14
16
This compares to the All Market Services Listed Companies TEV/EBITDA Multiple of 13.5
This compares to the Lower-Mid Market Services Listed Companies TEV/EBITDA Multiple of 12.5
This compares to the All Market Services Listed Companies TEV/EBITDA Multiple of 13.5
This compares to the Lower-Mid Market Services Listed Companies TEV/EBITDA Multiple of 12.5
Reg
ion
al TEV
/EBITD
ASu
b-secto
r TEV/EB
ITDA
Sector TEV
/EBITD
A
This compares to the current cross-sector All Market Transactions TEV/EBITDA Multiple of 14.1
This compares to the current cross-sector Lower-Mid Market Transactions TEV/EBITDA Multiple of 9.4
13.414.4
12.511.8
10.8
12.5 12.5
10.7
16.5
13.8
0
2
4
6
8
10
12
14
16
18
20
13.712.8
15.216.0
9.4
11.9
15.214.3
12.411.6
0
2
4
6
8
10
12
14
16
18
20
Technology, Media & Telecoms (TMT)
27
The sector M&A landscape
During the Perth 2017 Globalscope conference, the network’s global Technology, Media & Telecoms (TMT) sector teammet to discuss recent transactions and the evolving underlying structural drivers of the global sector M&A landscape.
A key theme is the establishment of venture capital arms by larger firms in order to nurture novel technologies. Moredetails can be obtained from team members or regional heads – see contact details below.
Investments in IP-based technology companies havesignificantly increased in volume, across traditional sectorssuch as semiconductors (e.g. Graphcore, Kalray, UltraSoC), aswell as more visionary areas such as flying cars (e.g. Lilium),microsatellites (e.g. ICEYE) and simulated worlds (e.g.Improbable). This environment seems likely to producesignificant M&A targets in the near future, that would beexpected to command high strategic prices.
Corporates Seek to Raise Visibility Over Targets
It is becoming increasingly common for trade buyers toestablish venture capital arms, as a means of enhancing theirvisibility and understanding of the innovation taking place intheir operating markets, as well as to deepen their pipeline ofM&A targets. A nominal co-investment can often prove acheap way of obtaining optionality over whether to acquire apotential target.
Amazon Acquires Online Retailer Souq.com
Amazon has sought to strengthen its e-commerce footprintwith expansion into the Middle Eastern market through theacquisition of Souq.com for $580m in cash. The deal givesAmazon a strong footing in a relatively untapped market.
HPE Acquires Hyper-Converged Player Nimble
HPE has agreed to acquire flash-optimised storage vendorNimble Storage for circa $1bn in cash. Nimble had neverturned a profit since its inception in 2008 and the price tagreflects the value to HPE of broadening their flash portfolio.
Eventbrite Profits from Pandora Misfire
Eventbrite has acquired leading ticketing platform Ticketflyfrom Pandora for $200m. This deal comes only 2 years afterPandora acquired Ticketfly for $450m, in a deal that washailed as a landmark transaction linking music streaming datawith ticket sales.
PE Buyers are Setting the Tone in the Market
Between direct and bolt-on acquisitions, private equitybuyers are forecast to purchase c. 900 technology companiesin 2017. Private equity remains a favoured asset class forinstitutional investors and the recycling of distributions fromsuccessful exits into new capital has led to a fundraisingsurge, generating substantial dry powder.
Cloud Transformation Fuels Activity in Software
As the enterprise market continues to slowly transition to thecloud, the requirement to support hybrid IT environmentswill drive M&A activity as larger players seek to broaden anddeepen their product/service portfolios.
Chinese Buyers Continue to Make Presence Felt
As part of the country’s One Belt, One Road initiative, Chinacontinues to support and modernise its traditionalmanufacturing industries through the acquisition of Westerntechnology companies. This aggressive strategy has seenseveral deals fall foul of national regulators, such as thedecision to block the €780m sale of German chip equipmentmaker Aixtron to a consortium of Chinese investors.
Automotive M&A Expected to Accelerate
The automotive sector has rapidly emerged as a keytechnology battleground, that has seen established playersacquiring competence at all stages of the value chain.
6
7
8
9
10
11
12
13
14
Media Software Hardware Semi-conductors
Telecoms
28
M&A trends & market analysis
The following data are compiled specifically for the TMT sector, with valuation trends over time in the first chart based onsemi-annually averaged transactional data and regional and sub-sector comparisons in the second and third charts basedon listed companies data as at mid August 2017.
Comment Context
Lower-Mid Market TMT Listed Companies TEV/EBITDA Multiple(Values in range $5m-$150m) by subsector is highest in Software at 14.2, 41% higher than the lowest in Telecoms of 10.1
All MarketTMT Listed CompaniesTEV/EBITDA Multiple(Values over $5m) by subsector is highest in Software at 17.5, 140% higher than the lowest in Telecoms of 7.3
Lower-Mid Market TMT Listed Companies TEV/EBITDA Multiple(Values in range $5m-$150m) by region is highest in Europe at 14.3, 89% higher than the lowest in Latin America of 7.6
All MarketTMT Listed Companies -TEV/EBITDA Multiple(Values over $5m) by region is highest in US & Canada at 13.1, 63% higher than the lowest in Latin America of 8.1
Analysis performed by:Data supplied by:
This compares to the All Market TMT Listed Companies TEV/EBITDA Multiple of 12.4
This compares to the Lower-Mid Market TMT Listed Companies TEV/EBITDA Multiple of 12.6
This compares to the All Market TMT Listed Companies TEV/EBITDA Multiple of 12.4
This compares to the Lower-Mid Market TMT Listed Companies TEV/EBITDA Multiple of 12.6
Reg
ion
al TEV
/EBITD
ASu
b-secto
r TEV/EB
ITDA
Sector TEV
/EBITD
A
All MarketTMT TransactionsTEV/EBITDA Multiple(Values over $5m) has fallen to 10.3 from 12.1 in 2016 H2
Lower-Mid Market TMT TransactionsTEV/EBITDA Multiple(Values in range $5m-$150m) has risen to 10.5 from 8.5 in 2016 H2
2012 2013 2014 2015 2016 2017
Europe Asia & Pacific
Africa & ME
US & Canada
Latin America
This compares to the current cross-sector All Market Transactions TEV/EBITDA Multiple of 14.1
This compares to the current cross-sector Lower-Mid Market Transactions TEV/EBITDA Multiple of 9.4