University of Iowa Iowa Research Online eses and Dissertations Fall 2009 Glycan targeted gene delivery to the dendritic cell SIGN receptor B Kevin Anderson University of Iowa Copyright 2009 B. Kevin Anderson is dissertation is available at Iowa Research Online: hp://ir.uiowa.edu/etd/328 Follow this and additional works at: hp://ir.uiowa.edu/etd Part of the Pharmacy and Pharmaceutical Sciences Commons Recommended Citation Anderson, B Kevin. "Glycan targeted gene delivery to the dendritic cell SIGN receptor." PhD (Doctor of Philosophy) thesis, University of Iowa, 2009. hp://ir.uiowa.edu/etd/328.
Transcript
University of IowaIowa Research Online
Theses and Dissertations
Fall 2009
Glycan targeted gene delivery to the dendritic cellSIGN receptorB Kevin AndersonUniversity of Iowa
Copyright 2009 B. Kevin Anderson
This dissertation is available at Iowa Research Online: http://ir.uiowa.edu/etd/328
Follow this and additional works at: http://ir.uiowa.edu/etd
Part of the Pharmacy and Pharmaceutical Sciences Commons
Recommended CitationAnderson, B Kevin. "Glycan targeted gene delivery to the dendritic cell SIGN receptor." PhD (Doctor of Philosophy) thesis,University of Iowa, 2009.http://ir.uiowa.edu/etd/328.
GLYCAN TARGETED GENE DELIVERY TO THE DENDRITIC CELL SIGN
RECEPTOR
by
B. Kevin Anderson
An Abstract
Of a thesis submitted in partial fulfillment of the requirements for the Doctor of
Philosophy degree in Pharmacy (Medicinal and Natural Products Chemistry) in the Graduate College of
The University of Iowa
December 2009
Thesis Supervisor: Professor Kevin G. Rice
1
ABSTRACT
The 21st century has been called the age of genomic medicine, yet gene therapy
for medicinal use remains a theory. One reason that there are no safe and effective
treatments for human disease is the lack of a vehicle capable of delivering genetic
material to a specific target. In nature we observe gene pathology by viral vectors, which
deliver their own genetic material to specific host cells efficient at spreading the viral
blueprint throughout the organism.
The aim of my research into gene therapy has been to develop a synthetic vector
with the delivery capability of viral vectors found in nature. This includes the ability to
protect genetic cargo from modification and degradation in vivo, target to a desired cell
type within a specific tissue, facilitating absorption into the cell, and delivery to the
nucleus, where expression of genetic material occurs.
The goal of this thesis project was to synthesize a novel vector which would
selectively target the dendritic cell SIGN receptor, mirroring the method of pathogens
such as HIV, which target this receptor and subsequently the immune system, resulting in
chronic infection.
The vector we designed contains two major components, the high mannose N-
glycan Man9GlcNAc2Asn, and a peptide composed of nine amino acids: four lysine
spacing residues, four lysines derivatized with acridine on the epsilon amine of their side
chains, and a cysteine for conjugation to the glycan. This compound, the Man9-AcrLys
Glycopeptide, was engineered to intercalate into plasmid DNA via the acridine functional
groups and to bind the DC-SIGN receptor through the glycan’s mannose residues.
The vehicle was tested in vitro in CHO cells bearing a recombinant DC-SIGN
receptor in the context of luciferase reporter gene delivery. We found that under equal
treatment conditions, DC-SIGN (+) CHO cells expressed more luciferase and were 100-
fold more luminescent than control DC-SIGN (-) CHO cells.
2
My delivery method was further analyzed in a cell-sorting FACS experiment. I
covalently labeled pGL3 reporter plasmid with a fluorophore, and transfected the CHO
cells under typical transfection conditions. The experimental results confirmed
preferential DC-SIGN mediated gene delivery.
Abstract Approved:________________________________________________________ Kevin G. Rice, Thesis Supervisor ________________________________________________________ Title and Department ________________________________________________________ Date
GLYCAN TARGETED GENE DELIVERY TO THE DENDRITIC CELL SIGN
RECEPTOR
by
B. Kevin Anderson
A thesis submitted in partial fulfillment of the requirements for the Doctor of
Philosophy degree in Pharmacy (Medicinal and Natural Products Chemistry) in the Graduate College of
The University of Iowa
December 2009
Thesis Supervisor: Professor Kevin G. Rice
Graduate College The University of Iowa
Iowa City, Iowa
CERTIFICATE OF APPROVAL
_______________________
PH.D. THESIS
_______________
This is to certify that the Ph.D. thesis of
B. Kevin Anderson
has been approved by the Examining Committee for the thesis requirement for the Doctor of Philosophy degree in Pharmacy (Medicinal and Natural Products Chemistry) at the December 2009 graduation.
Thesis Committee: ___________________________________ Kevin G. Rice, Thesis Supervisor
___________________________________ Jonathan A. Doorn
___________________________________ Michael W. Duffel
___________________________________ Ernesto J. Fuentes
___________________________________ Robert J. Kerns
ACKNOWLEDGMENTS
Thank you, Dr. Rice, for your exceptional leadership and guidance throughout my
graduate career. From the time of my first correspondence with the University of Iowa
until the end, you made sure that I and the rest of my colleagues had a graduate
experience which met and exceeded expectations.
I would also like to thank the Medicinal and Natural Products Chemistry faculty
who served on my committee, Dr. Jonathan Doorn, Dr. Michael Duffel, and Dr. Robert
Kerns. Without your educational and challenging courses, and your experimental
knowledge and experience, I would not have learned fundamental principles of Medicinal
Chemistry nor made the advances which I realized on my thesis project. I would like to
individually thank my extra-departmental committee member, Dr. Ernesto Fuentes. Your
experience was very valuable and your advice was timely and came at a critical period
when my research project was well into maturity.
Finally I would like to thank my colleagues and my family members who
supported my educational endeavor. My parents, Milton and Vinette Anderson, who
instilled in me the value of education and the importance of doing my best, and my
siblings, Michelle and Richard Anderson, who provided role models for their younger
brother. Richard, without having you obtain your PhD 7 years before me, it would have
been much more difficult for me. Thank you.
ii
ABSTRACT
The 21st century has been called the age of genomic medicine, yet gene therapy
for medicinal use remains a theory. One reason that there are no safe and effective
treatments for human disease is the lack of a vehicle capable of delivering genetic
material to a specific target. In nature we observe gene pathology by viral vectors, which
deliver their own genetic material to specific host cells efficient at spreading the viral
blueprint throughout the organism.
The aim of my research into gene therapy has been to develop a synthetic vector
with the delivery capability of viral vectors found in nature. This includes the ability to
protect genetic cargo from modification and degradation in vivo, target to a desired cell
type within a specific tissue, facilitating absorption into the cell, and delivery to the
nucleus, where expression of genetic material occurs.
The goal of this thesis project was to synthesize a novel vector which would
selectively target the dendritic cell SIGN receptor, mirroring the method of pathogens
such as HIV, which target this receptor and subsequently the immune system, resulting in
chronic infection.
The vector we designed contains two major components, the high mannose N-
glycan Man9GlcNAc2Asn, and a peptide composed of nine amino acids: four lysine
spacing residues, four lysines derivatized with acridine on the epsilon amine of their side
chains, and a cysteine for conjugation to the glycan. This compound, the Man9-AcrLys
Glycopeptide, was engineered to intercalate into plasmid DNA via the acridine functional
groups and to bind the DC-SIGN receptor through the glycan’s mannose residues.
The vehicle was tested in vitro in CHO cells bearing a recombinant DC-SIGN
receptor in the context of luciferase reporter gene delivery. We found that under equal
treatment conditions, DC-SIGN (+) CHO cells expressed more luciferase and were 100-
fold more luminescent than control DC-SIGN (-) CHO cells.
iii
My delivery method was further analyzed in a cell-sorting FACS experiment. I
covalently labeled pGL3 reporter plasmid with a fluorophore, and transfected the CHO
cells under typical transfection conditions. The experimental results confirmed
preferential DC-SIGN mediated gene delivery.
iv
TABLE OF CONTENTS
LIST OF TABLES............................................................................................................ vii
LIST OF FIGURES ......................................................................................................... viii
LIST OF SCHEMES........................................................................................................ xiv
LIST OF EQUATIONS ................................................................................................... xvi
LIST OF ABBREVIATIONS......................................................................................... xvii
CHAPTER
1. LITERATURE REVIEW .................................................................................1 Introduction.......................................................................................................1 Isolation and Synthesis of Acridine..................................................................2 Synthesis of 9-Chloroacridine ..........................................................................8 The Interaction of Acridine With Nucleic Acid ...............................................9 The DC-SIGN Receptor .................................................................................21 Research Objective .........................................................................................37
2. AN IMPROVED METHOD FOR PREPARING SEPHAROSE N-CAPROYL GALACTOSAMINE AFFINITY RESIN FOR THE PURIFICATION OF SOYBEAN AGGLUTININ FROM SOY FLOUR .....39 Introduction.....................................................................................................39 Materials and Methods ...................................................................................40 Results.............................................................................................................41 Discussion.......................................................................................................46
3. ENZYMATIC RELEASE OF MAN9GLCNAC2ASN FROM SOYBEAN AGGLUTININ AND DERIVITIZATION OF MAN9GLCNAC2ASN ANALOGS................................................................47 Introduction.....................................................................................................47 Materials and Methods ...................................................................................48 Results.............................................................................................................53 Discussion.......................................................................................................69
4. SYNTHESIS OF AN ACRIDINYLATED HIGH MANNOSE TARGETING LIGAND .................................................................................70 Introduction.....................................................................................................70 Materials and Methods ...................................................................................71 Results.............................................................................................................74 Discussion.......................................................................................................85
v
5. IN VITRO TESTING AND ANALYSIS OF THE HIGH MANNOSE TARGETING LIGAND WITH DC-SIGN CHO CELLS..............................87 Introduction.....................................................................................................87 Materials and Methods ...................................................................................87 Results.............................................................................................................91 Discussion.......................................................................................................97
6. RESEARCH SUMMARY............................................................................100
1-1. Acridines Prepared by Bernthesen’s Reaction and Popp’s Modification. Adapted from Acheson et al., 1973. ...........................................................................4
1-2. Disubstituted Acridines Prepared by Bernthsen’s Reaction and Popp’s Modification. Adapted from Acheson et al., 1973. ...................................................5
1-3. Binding of Oligosaccharides to DC-SIGN 58 Competition binding assays with the immobilized CRD of DC-SIGN were performed. The KDs relative to the KD for mannose were reported. Adapted from Feinberg et al., 2001. .....................26
1-4. Binding of High Mannose Oligosaccharides to DC-SIGN. 63 Competition binding assays with the immobilized CRD of DC-SIGN were performed. Absolute KI value omitted due to experiment with a different batch of 125I Man-bovine serum albumin. Adapted from Feinberg et al., 2007. .........................28
1-5. DC-SIGN Binding Pathogens.64 gp120, glycoprotein 120; GP, glycoprotein; LPS, lipopolysaccharide, LPG, lipophosphoglycan; SEA, soluble egg antigen. Adapted from van Kooyk et al., 2003........................................................35
2-1. Mascot MS/MS Ion Identification. Three peptides were identified in the MS/MS ion search of the tryptic digest. SBA had the highest probability-based Mowse score of all the proteins identified by the deconvolution algorithm...................................................................................................................46
3-1. 300 MHz 1H NMR Chemical Shift Data for 9-Phenoxyacridne and 6-(Acridin-9-ylamino)-hexanoic acid .........................................................................................63
4-1. 300 MHz 1H NMR Chemical Shift Data for N-α-Fmoc-N-ε-9-Acridinyl-Lysine.......75
vii
LIST OF FIGURES
Figure
1-1 Acridine Structure, Nomenclature and Numbering. Carl Graebe proposed the given numbering system for acridine in 1893.9 Ten systems were proposed over the next 50 years. Graebe’s numbering system is most widely employed at present. ....................................................................................................................2
1-2. The binding of proflavine to herring sperm DNA. r = number of ligands bound per molecule; c = free ligand concentration Reproduced with the addition of proflavine from Peacocke et al., 1956......................................................9
1-3. Lerman’s model for the interaction of acridine and DNA.42 Adapted from Pritchard et al., 1973.................................................................................................10
1-4. Modified intercalation model for Acridine-DNA interaction. 42 Reproduced from Pritchard et al., 1973. .......................................................................................11
1-5. Phenanthraline analogs. In 1973, Gabbay et al.46 published the results of their investigation into the steric effects of methyl and phenyl functional groups on the intercalation of methylated phenanthroline in DNA. Adapted from Gabbay et al., 1973. .........................................................................................13
1-6. The classical (A) and non-classical (B) intercalation models of DNA-ligand interaction.44 L0 is a section of B-form DNA, L1 is the same section after binding a simple, unsubstituted intercalator, L2 represents the DNA after binding a non-classical intercalating molecule, such as a large aromatic ring system with an assymetrical distribution of bulky substituents. Reproduced from Wilson et al., 1981. ..........................................................................................14
1-7. The effects of intercalating drug on solution viscosity of closed superhelical DNA. 44 As increasing intercalator is added, DNA loses its coiled structure, then regains superhelical coils in the opposite (left-handed) direction. Maximum solution viscosity is reached in the open structure, with minima at minimum and maximum drug concentration. Reproduced from Wilson et al., 1981. .........................................................................................................................15
1-8. Plot of the Logarithm of the Observed Equilibrium Constants (K) of Ethidium and Quinacrine vs the the Logarithm of the Sodium Ion Concentration 44 Ethidium : solid line, Quinacrine : broken line. Reproduced with addition of Ethidium and Quinacrine from Wilson et al., 1981..................................................17
1-9. Acridinylated lysine monomer (A) and polyacridinylated peptide (B) Ueyama et al. 53 synthesized a polyacridinylated intercalating peptide on an automated peptide synthesizer....................................................................................................18
1-10. Absorption spectra of Ueyama’s polyacridinylated peptide Spectra taken without (a) and with (b) 68.8 μM-bp calf thymus DNA [in 10 mM MES and 1 mM EDTA, pH 6.25 containing 0.4 M NaCl at 25°C] 53 Reproduced from Ueyama et al., 2000. .................................................................................................19
viii
1-11. Series of Polyacridinylated Peptides. 55 For 5 compounds, 1: n = 0, 2: n = 1, 3 : n = 2, 4: n = 3, 5: n = 4 (1: R = OCH3, 2 – 5: R = NH2 .....................................20
1-12. Properties of the series of polyacridinylated peptides. 55 The molar absorptivity (A) and logarithm of the binding constant (B) of each peptide was determined and plotted. Experiments were performed in 10 mM MES and 1 mM EDTA pH 6.25 at 25°C. Reproduced from Ueyama et al., 2001...........20
1-13. Nucleotide and deduced amino acid sequence of DC-SIGN cDNA 56 The membrane spanning sequence is underlined and potential N-linked glycosylation site is marked by a star. The beginning of the seven complete and eighth partial repeat (R1-R8) and the beginning of the lectin domain (L) are indicated. Adapted from Curtis et al., 1992.......................................................22
1-14. CRD of DC-SIGN with Man3GlcNAc2 pentasaccharide and calcium. Structure 1k9i (Protein Data Bank) is the decameric representation of the carbohydrate recognition domain (CRD) of DC-SIGN with the Man3GlcNAc2 pentasaccharide bound. Ca2+ ions are depicted as black spheres, the pentasaccharides are the ball and stick structures.....................................................23
1-15. Polysaccharide Structures 58 (A) Pentasaccharide co-crystallized with the DC-SIGN receptor (B) Man9 N-glycan – abundant on gp120 (C) A common, complex-type N-glycan. The structure in the purple box is analogous to the structure in (A). Adapted from Feinberg et al., 2001. .............................................24
1-16. Ball and stick representation of DC-SIGN bound to Man3 GlcNAc2. 58 The large gray and cyan spheres are Ca2+, the red spheres are oxygen and the blue spheres represent nitrogen. Reproduced from Feinberg et al., 2001 .......................25
1-17. Comparative affinity of carbohydrate ligands for DC-SIGN 62 Synthetic glycoconjugates were screened for affinity to a chimeric DC-SIGN with a human IgG1-Fc tag in an ELISA-type assay. Anti-DC-SIGN mAb AZN-D1 was used to block binding. Reproduced from Appelmelk et al., 2003....................26
1-18. Schematic diagram of the synthetic glycoconjugate ligands used in the DC-SIGN binding assay. 62..............................................................................................27
1-19. Asparagine linked high mannose structures. 63 Man6a is shown in the red box, Man6b is in the blue box, and Man9 is in the green box. Adapted from Feinberg et al., 2007. ................................................................................................28
1-20. Ball and stick representation of DC-SIGN bound to Man6b. 63 The green spheres represent Ca2+, The red sticks are oxygen, nitrogen is blue. Ca2+ coordination bonds are dashed black lines, van der Waals interactions are dashed blue lines, hydrogen bonds are dashed gray lines. A is the major orientation of the bound ligand, B is a magnified view of A, C is the minor orientation of the ligand, D is a magnified view of C. Reproduced from Feinberg et al., 2007 .................................................................................................29
ix
1-21. DC Activation In Vivo. 66 Antigens are captured by DCs in peripheral tissues and processed to form MHC-peptide complexes. The immature DCs derive from proliferating and non-proliferating precursor cells. Antigen deposition and inflammation matures the DCs and they express molecules which will lead to binding and stimulation of T cells in the T-cell areas of lymphoid tissues. If the antigen has also been bound by B cells, then B and T cells can cluster with DCs. After activation, T and B blasts leave the T cell area. B blasts move to the lining of the intestine, bone marrow and other parts of the lymphoid tissue. Some become antibody-secreting plasma cells. T blasts leave the blood at the original site of antigen deposition, recognize changes in the inflamed blood vessels and respond vigorously to cells presenting antigen. Adapted from Geijtenbeek et al., 2000.....................................................................33
2-1. Sepharose N-caproyl Galactosamine Affinity Column. Soy flour is dispersed in PBS, centrifuged, and the supernatant is loaded onto a 30 mL affinity column A 200 mM galactose solution is loaded for elution. Panel A: Chromatogram of the affinity purification of 10 g of soy flour. Panel B: Galactosamine affinity column yields. The column bound 11 mg SBA per mL of resin, and the soy flour contained 3 mg SBA per gram of soy flour. ............43
2-2. SDS-PAGE Gel Analysis of SBA Affinity Purification Lane 1: soy flour/PBS suspension, Lane 2: supernatant from soy flour/PBS suspension, Lane 3: unbound protein, Lane 4: purified soybean agglutinin. SBA is seen in reduced monomeric form, at 30 kDA. ......................................................................44
3-1. SBA Digestion by Pronase. Pronase, an enzyme preparation from Streptomyces griseus, with three proteolytic activities and a wide range of substrate specificity digests the SBA glycoprotein allowing isolation of the glycan........................................................................................................................54
3-2. Gel Filtration of the SBA Pronase Digest. Mobile phase was 10 mM acetic acid, with UV peptide and amino acid detection at 280 nm and carbohydrate detection at 490 nm by the phenol sulfuric acid assay. ............................................55
3-3. Cation Exchange Purification of Man9GlcNAc2. Man9GlcNAc2Asn binds weakly to the cation resin through its Asn residue. The contamination peak with 280 nm absorbance contains peptides with a pI below 3.2...............................56
3-4. MALDI-TOF Analysis of Purified Man9GlcNAc2Asn. The glycan was ionized with a super 2,5 DHB matrix and analyzed in reflectron mode with. It was identified with sodium atoms adducted. ...................................................................56
3-5. 600 MHz 1H NMR of Man9GlcNAc2Asn. Spectra taken with a 1 mM sample in D2O. The numbers and letters in the spectrum correspond to the monosaccharide residues in the structure. A large signal corresponding to the unexchanged proton of HOD can be seen at 4.7 ppm. .............................................57
3-6. Gel Filtration Purification of Boc-Man9GlcNAc2Asn-Tyr. The reaction mixture was loaded onto a gel filtration column containing Sephadex G-25 resin and eluted with 0.1% acetic acid. The Man9 tyrosinamide was separated from the excess Boc-tyrosine-NHS reagent..............................................................58
x
3-7 600 MHz 1H NMR of Boc-Man9GlcNAc2Asn. Spectra taken with a 1 mM sample in D2O. The numbers and letters in the spectrum correspond to the monosaccharide residues in the structure. HOD was suppressed. The shift equivalent signals corresponding to the methyl protons of the Boc group are seen furthest upfield. The pair of doublets from tyrosine’s phenyl ring appear downfield in the aromatic region. The ‘1’ and ‘2’ signals immediately downfield of Boc correspond to the protons on the N-acetyl groups. ......................59
3-8. Characterization of Man9GlcNAc2Asn Tyrosinamide Analogs. The Boc protected and de-protected compounds were analyzed by HPLC on a 1-30% ACN in 0.1% TFA gradient over 30 mins, and infused into an in-line ESI-MS detecting in negative mode. ......................................................................................60
3-9. 300 MHz 1H NMR Characterization of 9-Phenoxyacridine and 6-(Acridin-9-ylamino)-hexanoic acid. Phenoxyacridine in DMSO-d6 , Acridine acid in CF3CO2D. .................................................................................................................62
3-10. RP-HPLC of 9-Phenoxyacridine. A 3 nmol sample of 9-phenoxyacridine was analyzed with a 30-60% ACN in 0.1% TFA 30 min gradient. .................................64
3-11. RP-HPLC Characterization of Acridine Acid and Acridine Ester. Acridine acid (2 nmol) and acridine ester (2 nmol) were analyzed on a 30 min 15-45% ACN in 0.1% TFA 30 min gradient. The conversion of the acid moiety to more hydrophobic ester results in an increase in retention time...............................64
3-12. Gel Filtration Purification of Man9GlcNAc2Asn-Acr and Man9GlcNAc2Asn-TyrAcr. For each analog, the reaction mixture was loaded onto a gel filration column containing sephadex G-25 resin and eluted with 0.1% acetic acid. The derivatized glycan is separated from excess Acr-NHS reagent. A. The Man9GlcNAc2Asn-Acr had an unusal elution profile, however the entire 100 ml elution volume was collected. B. The Man9GlcNAc2Asn-TyrAcr eluted from the column in 50 ml. ........................................................................................65
3-13. RP-HPLC ESI-MS and 600 MHz 1H NMR Characterization of Man9GlcNAc2Asn-Acr. Man9GlcNAc2Asn-Acr (2 nmol) was injected on a 30 min 1-30% acetonitrile in 0.1% TFA gradient and analyzed by ESI-MS in the negative mode. A 0.8 mM sample in D2O was analyzed by NMR. The aromatic signals from the acridine moiety appear downfield between 7.4 and 8.4 ppm. The distortion which appears is likely due to the anisotropic effect of the interaction between the rings and the neighboring methylene protons. .........66
3-14. RP-HPLC ESI and 600 MHz 1H NMR Characterization of Man9GlcNAc2Asn-TyrAcr. Man9GlcNAc2Asn-Acr (2 nmol) was injected on a 30 min 1-30% acetonitrile in 0.1% TFA gradient and analyzed by ESI-MS in the negative mode. A 0.8 mM sample in D2O was analyzed by NMR. The aromatic signals arising from tyrosine and acridine are seen downfield.................................67
3-15. Man9GlcNAc2Asn-Acr – Plasmid DNA Band Shift Assay. 0.6 μg of SEAP plasmid was incubated with the Man9 bioconjugate and assayed at the following levels: Lane 1:0.03 nmol, 2: 0.32 nmol, 3: 3 nmol, 4: 8 nmol, 5: 16 nmol, 6: 32 nmol, 7: no bioconjugate. cr: circular plasmid, sc: supercoiled plasmid......................................................................................................................68
xi
4-1. RP-HPLC ESI-MS of N-α-Fmoc-N-ε-9-Acridinyl-Lysine. A 2 nmol sample of N-α-Fmoc-N-ε-9-Acridinyl lysine in MeOH/1 N HCl was injected on a 30 minute 30-60% acetonitrile in 0.1% TFA. The singly charged species was detected by ESI-MS in the negative mode. The amino acid also ionized as a dimer and was detected.............................................................................................76
4-2. Preparative Purification of Polyacridine-Lysine Peptide. A. The 30 μmol synthesis yielded 11.7 μmol (40%) crude peptide 2 μmol (17%) purified peptide. B. 1 nmol of the purified compound was injected on a 30 min 15-30% acetonitrile in 0.1% TFA gradient with detection in the positive mode...........78
4-3. Gel Filtration Purification of Man9GlcNAc2Asn-Tyr Mal. The reaction mixture was loaded onto a gel filtration column containing Sephadex G-25 resin and eluted with 0.1% acetic acid. The derivatized glycan was separated from excess 3-maleimidoproprionic acid NHS reagent...........................................80
4-4. RP-HPLC ESI-MS of Man9GlcNAc2Asn-Tyr Mal. 4 nmol of the prepped sample was analyzed with a 1-30% acetonitrile in 0.1% TFA gradient with ESI-MS detection in the negative mode. ..................................................................80
4-5. RP-HPLC ESI-MS Analysis of Man9-AcrLys Glycopeptide. 400 pmol of Man9-AcrLys Glycopeptide was analyzed with a 30 min 1-30% ACN gradient in 0.1% TFA. The compound was observed in the triply-charged state by ESI-MS, with detection in the positive mode..............................................82
4-6. Man9-AcrLys Glycopeptide:DNA Binding: The Band Shift Assay. 1 μg pGL3 plasmid was incubated with Man9-AcrLys Glycopeptide and assayed at the following levels: Lane 3: 0.054 nmol, 5: 0.216 nmol, 7: 0.532 nmol, 9: 1.064 nmol. Lane 1 : 1 μg pGL3. cr: circular plasmid, sc: supercoiled plasmid ..............83
4-7. Thiazole Orange Displacement Assay. The affinities of the Man9-AcrLys Glycopeptide and Man9-Acr for plasmid DNA were assayed by the fluorescence-based thiazole orange displacement assay. .........................................84
5-1. Phycoerythrin FACS Analysis of DC-SIGN (+) and (-) CHO cells. Both cell types were incubated with 2.4 μg of antibody-phycoerythrin conjugate and subsequently analyzed. .............................................................................................91
5-2. Representation of Cy5 labeled glycopeptide condensate. A Cy5 labeled polyplex was made at 0.5 nmoL per microgram DNA, consistent with the stoichiometry used for transfection. Transfected CHO cells were imaged by FACS. .......................................................................................................................92
5-3. Cy5 FACS Analysis of DC-SIGN (+) and (-) CHO cells. Both cell types were transfected with 0.5 nmol of Man9-AcrLys Glycopeptide and 1 μg of Cy5 labeled pGL3 plasmid. After incubation overnight, the cells were lifted and imaged.......................................................................................................................93
xii
5-4. Luciferase Assay of CHO cell transfection. pGL3 condensates were made with 1 μg plasmid DNA and the follwing transfection reagents: PEI (poly(ethylenimine)), WK18 (tryptophan-lysine18), AcKPep (C-KAc-K-KAc-K- KAc-K- KAc-K), Biocon (Man9-AcrLys Glycopeptide). The cells were lysed and RLU levels were recorded after incubation overnight. Luciferase expression from the bioconjugate condensate was 100 fold greater in the DC-SIGN (+) CHO cells than the DC-SIGN (-) CHO cells, indicating receptor mediated uptake. .......................................................................................................95
5-5. BCA Assay of Protein Levels of PEI, WK18, AcKPep and Bioconjugate. Protein levels were normalized with the BCA assay using bovine serum albumin as a standard. Total protein levels in the DC-SIGN (-) CHO cells varied between 16 and 20 μg, while levels in the (+) cells were between 28 and 32 μg, reflecting a slight difference. Reagents: PEI (poly(ethylenimine)), WK18 (tryptophan-lysine18), AcKPep (C-KAc-K-KAc-K- KAc-K- KAc-K), Biocon (Man9-AcrLys Glycopeptide).......................................................................95
5-6. In Vitro Inhibition of Gene Transfer. An excess of Man9GlcNAc2Asn and an excess of antibody to DC-SIGN were included with Man9-AcrLys Glycopeptide in formulation in order to reduce gene transfer. No knockdown was observed with the glycan and treatment with antibody only resulted in a slight decrease. Reagents: PEI (poly(ethylenimine)), Biocon (Man9-AcrLys Glycopeptide), Man9 (Mannose9 GlcNAc2 Asparagine), Abody (antibody to DC-SIGN – phycoerythrin conjugate). .....................................................................96
5-7. BCA Assay of Protein Levels of PEI, Bioconjugate, Man9 and Antibody. Protein levels were normalized with the BCA assay using bovine serum albumin as a standard. Reagents: PEI (poly(ethylenimine)), Biocon (Man9-AcrLys Glycopeptide), Man9 (Mannose9 GlcNAc2 Asparagine), Abody (antibody to DC-SIGN – phycoerythrin conjugate). ................................................97
xiii
LIST OF SCHEMES
Scheme
1-1. The Bernthsen Reaction. Unsubstituted acridine is made by this method when formic acid (R = H) is used. .......................................................................................3
1-2. 2-Amino-9-phenyl-Acridine Prepared by the Bernthsen Reaction.8 ...........................5
1-3. High temperature gas phase conversion of 2-benzylaniline to acridine.34 .................6
1-4. Flash vacuum pyrolytic conversion of (2-Phenylamino-phenyl)-methanol to acridine. 35 ..................................................................................................................6
1-5. Aluminum chloride catalyzed formation of acridine.36 ...............................................7
1-6. The synthesis of 9-chloroacridine from N-phenylanthranilic acid..............................8
1-7. Conversion of 9-acridanone to 9-chloroacridine ........................................................9
1-8. Retrosynthesis of the Man9 nonasaccharide. 65 Seeberger’s retrosynthetic method for producing Man9 was adopted. Man6b was produced by the same approach, using methyl 2,3,4-tri-O-benzyl-α-D-manopyranoside as the core sugar unit. 63,66,67 ......................................................................................................30
1-9. Reaction conditions for the Man9 nonasaccharide. 65 Seeberger’s 15 step synthesis produces Man9 at a 25% overall yield. It is linear, and was designed to be automated..........................................................................................31
1-10. High mannose oligosaccharide target compounds. 65 Compounds 2-4 were synthesized, compound 1, the native N-glycan, has never been synthesized to date............................................................................................................................32
2-1. Synthesis of Sepharose-N-caproylgalactosamine Affinity Resin. Sepharose CL-4B is brought up in acetone and activated with 1,1’carbonyldiimidzole. The 6-aminohexanoic acid linker is then bound, followed by galactosamine coupling with a water soluble carbodiimide. ............................................................42
3-1 Synthesis of the Acridine Ester. The literature procedure of Karup et. al. was adopted to make 6-(9-Acridinylamino)-hexanoic acid. The acid was converted into the ester with DCC............................................................................61
4-1. Synthesis of N-α-Fmoc-N-ε-9-Acridinyl-Lysine. An acridinylated lysine derivatve was made for solid phase peptide synthesis with Fmoc chemistry...........75
4-2. Polyacridine Lysine Peptide. The peptide was synthesized on Wang resin using Fmoc chemistry with an automated synthesizer .............................................77
4-3. Man9GlcNAc2Asn-Tyr Maleimide. Boc-Man9GlcNAc2Asn-Tyr was deprotected, dried, and directly derivatized with an NHS ester-maleimido derivative of proprionic acid.....................................................................................79
xiv
4-4. Synthesis of the Man9-AcrLys Glycopeptide. Polyacridine lysine peptide was reacted with Man9Asn Tyr-Mal at a 1.2:1 ratio in 5 mM HEPES at pH 7.0 for 2 hrs...........................................................................................................................81
xv
LIST OF EQUATIONS
Equation
1-1. Ion Condensation Theory: Quantitative Prediction.44 Kobs = observed equilibrium constant for intercalation, [M+] = counterion concentration, m’ = the number of cationic charges on the drug, Ψ = 0.88, the number of cations associated per phosphate...........................................................................................16
1-2. Binding constant (K) determination Ueyama et al.55 adapted McGhee and Von Hippel’s 54 conditional probability derivation of Scatchard’s equation to determine the binding constant of their polyacridinylated peptide. n = total number of binding sites, c = free peptide concentration, v = moles of peptide bound per base pair, K = observed binding constant................................................19
DNA vaccination is an experimental therapeutic method where a subject is dosed
with DNA which is expressed in the host as foreign, antigenic protein. This protein
should elicit humoral and cell-mediated immunity against the antigen.1 DNA vaccines
could potentially be as effective as live attenuated vaccines, with a much higher degree of
safety.
Dendritic cells are the primary antigen presenting cells in the immune system, and
are therefore an ideal target for gene delivery.2 The challenge lies in designing a vector
to selectively target DCs. My hypothesis was that I could selectively target the dendritic
cell SIGN receptor and stimulate gene expression to a significant level above control.
This is demonstrated by the application of the Man9-AcrLys Bioconjugate. This non-
viral gene delivery vector is composed of two principal components: a peptide containing
cysteine, lysine and lysine derivatized with an ε-amino acridine, and the high mannose N-
glycan Man9GlcNAc2Asn.
Acridine has a 140 year history of scientific usage, as an antiviral, antimicrobial,
anti-inflammatory and antiprion agent, among other medicinal purposes.3 It contains a
vivid chromophore, and is also used in various labeling applications.4 Although some
studies suggest that the therapeutic action of acridinylated compounds is due to direct
interaction with biologically active protein,5 most attribute their activity to DNA binding,
cell cycle arrest and the resulting cytotoxicity.6 The first portion of this review will be
devoted to examining the discovery, chemical and physical properties of acridine, and the
chemical synthesis of acridine, with an emphasis on 9-chloroacridine, the starting
material for the compounds described in the experimental sections of this thesis. The
2
interaction of select acridine containing compounds with nucleic acids will also be
discussed.
Dendritic cells are generally accepted as the most potent antigen presenting cells
in the immune system,2 and as such would be a logical target for a synthetic DNA vector
bearing a therapeutic gene. The vector designed in this thesis was targeted to the DC-
SIGN receptor on dendritic cells. The structure, function and role of the DC-SIGN
receptor in normal and abnormal physiology is also examined in this review. Special
emphasis will be placed on oligosaccharide targeting to the DC-SIGN receptor, as the
high mannose glycan Man9GlcNAc2 was incorporated into our vector design.
Isolation and Synthesis of Acridine
Carl Graebe and Heinrich Caro announced their discovery of a new compound in
the anthracene fraction of coal tar in 1870.7 They named the molecule ‘Acridin’ because
of its ‘acrid smell and irritating action on the skin and mucous membrane’ (Figure 1-1).8
N
7
98
10
6
5 4
3
21
Figure 1-1 Acridine Structure, Nomenclature and Numbering. Carl Graebe proposed the given numbering system for acridine in 1893.9 Ten systems were proposed over the next 50 years. Graebe’s numbering system is most widely employed at present.
Acridine was isolated from the anthracene fraction of coal tar by extraction with dilute
sulfuric acid and addition of potassium dichromate to precipitate acridine bichromate,
which is decomposed with ammonia.
3
Acridine is a pale yellow solid which melts at 111°C and boils at 346°C. It is
weakly basic, with a pKa of 5.6010,11. Acridine is poorly soluble in water but dissolves
readily in most organic solvents. In an ethanol solution, it absorbs UV light at λex 360
nm, and it emits violet-colored light at λem 417 nm, with lower maxima at 400, 435 and
460 nm.12
One of the earliest syntheses of acridine was completed in 1884 by August
Bernthsen.13 The reaction was achieved by heating a mixture of a formic acid with
diphenyl amine and 1.5 to 3 moles of zinc chloride to 200-270°C for 24 hr. in the absence
of solvent (Scheme 1-1). The yield of the reaction is poor, however substituting acetic or
benzoic acid for formic acid increases the yield of the corresponding 9-substituted
acridines. The temperature, time of reaction, and quantity of zinc chloride used are
important in obtaining optimum yields.
NH
R OH
OZnCl2
N
Δ
R
Scheme1-1. The Bernthsen Reaction. Unsubstituted acridine is made by this method when formic acid (R = H) is used.
Frank Popp proposed the use of polyphosphoric acid in place of zinc chloride for the
cyclization of diphenyl amine.14 This modification greatly reduced the reaction time and
temperature necessary to obtain the desired product. Many acridines and benzacridines
have been made through this method by varying the carboxylic acid and diphenylamine
used (Table 1-1).8 Di-substituted acridines are also made by Bernthsen’s method
(Scheme 1-2), and substitutents can be introduced at the 2, 3 or 4 position (Table 1-2).
4
Acridines Prepared by Bernthsen’s Reaction and Popp’s Modification1
1Polyphosphoric acid as the catalyst and solvent. 8
Table 1-2. Disubstituted Acridines Prepared by Bernthsen’s Reaction and Popp’s Modification. Adapted from Acheson et al., 1973.
6
Recent methods for the synthesis of acridine include high temperature gas phase,
flash vacuum pyrolitic, and acid halide catalyzed reactions (Scheme 1-3,4,5).
NH2 N
CaO
Δ
Scheme1-3. High temperature gas phase conversion of 2-benzylaniline to acridine.34
In 2004, Horaguchi et. al.34 published a thermal cyclization reaction to produce acridine
(Scheme 1-3). 2-Benzylaniline was placed in a quartz column, vaporized with a traveling
furnace and introduced by nitrogen carrier gas to calcium oxide. The calcium oxide was
heated to 600°C in a 40 minute reaction. The product was then collected in an ice-water
cooled vessel, extracted with acetone, and chromatographed on a silica column. The
conversion to acridine was quantitive and the yield was 75%.
N
OH
NH
NΔ
Scheme1-4. Flash vacuum pyrolytic conversion of (2-Phenylamino-phenyl)-methanol to acridine. 35
7
In 1984 Hodgetts et. al.35 published a flash vacuum pyrolytic method for the
conversion of (2-phenylamino-phenyl)-methanol to acridine (Scheme 1-4). The starting
material was passed over molecular sieves (3” boat containing 1/16”) pellets at 450°C
resulting in quantitative conversion to acridine. Typically, the intermediate azaxylylene
intermediate requires a minimum temperature of 650°C for elimination of CO2 and
subsequent cyclization, however the SiO2, Al2O3, and molecular sieve catalysts
introduced in these reactions lower the necessary reaction temperature.
One of the more mild contemporary syntheses of acridine was published by Baum
et. al.36 in 1987. In this reaction, a 2.5-fold molar excess of AlCl3 is added to
diphenylamine-2-carboxaldehyde (Scheme 1-5). After neutralization with 1 N NaOH
and extraction with ether, the product is concentrated and washed with petroleum ether.
The reaction yielded 85% acridine.
NH
O
N
AlCl3
Scheme 1-5. Aluminum chloride catalyzed formation of acridine.36
8
Synthesis of 9-Chloroacridine
It is interesting to note that although acridine is the parent compound of many
useful and widely differing properties, it is not very useful itself. 8 9-Chloroacridine, the
starting material used in the syntheses in this volume, is a more valuable compound due
to the reactivity of the chlorine atom. The compound can be made on a large scale with a
nearly quantitative yield from N-phenylanthranilic acid through the addition of an excess
of phosphorous oxychloride. The mixture is first heated to 140°C for two hours, then the
excess POCl3 is removed by distillation under vacuum (Scheme 1-6). A mixture of
chloroform/ammonia is added to the reaction, and the organic layer is extracted, dried
with calcium chloride and filtered. The solvent is finally removed by distillation, and the
9-chloracridine is dried by heating.37
NH
O
OH
POCl3
N
Cl
Δ
Scheme 1-6. The synthesis of 9-chloroacridine from N-phenylanthranilic acid
9-chloroacridine can also be made from 9-acridanone and thionyl chloride; (Scheme 1-
7)38 however, 9-acridanone is typically a more expensive starting material than N-
phenylanthranilic acid and is typically made from the acid.39 Also, thionyl chloride is
slightly more toxic than phosphorous oxychloride.
9
NH
O
N
Cl
SOCl2
Scheme1-7. Conversion of 9-acridanone to 9-chloroacridine
The Interaction of Acridine With Nucleic Acid
The effect of acridine in biological systems is due in large part to its intercalation
with nucleic acid. This interaction was first observed by Peacocke and Skerrett, who
published a binding curve of proflavine to herring sperm DNA (Figure 1-2).40
NH2N NH2
Figure 1-2. The binding of proflavine to herring sperm DNA. r = number of ligands bound per molecule; c = free ligand concentration Reproduced with the addition of proflavine from Peacocke et al., 1956.
Analysis of the curve and the derived Scatchard plot revealed binding by two processes,
(I), a high affinity process up to approximately 0.2 molecules proflavine per nucleotide,
10
and (II), a weaker mode up to r ≈ 1.0. Five years later, Leonard Lerman first identified
binding by process (I) as intercalation. 41 He utilized x-ray crystallography as well as the
dialysis and spectrophotometric methods of Peacocke and Skerret and was thus able to
rule out simple aggregation as responsible for the binding phenomena and proposed a
novel model for binding (Figure 1-3).
Figure 1-3. Lerman’s model for the interaction of acridine and DNA.42 Adapted from Pritchard et al., 1973.
In 1966 N.J. Pritchard et. al. published a modified model which proposed that acridine
bound DNA within a single strand, as opposed to across a base pair (Figure 1-4).42 This
was significant because it meant that acridine could bind single stranded and denatured
nucleic acid species. He stated that the negatively charged oxygen atom on the phosphate
group between two bases can swing to the inside of the chain, where it is adjacent to the
positively charged ring nitrogen of the amino acridine. And further, if acridine is
oriented as shown, a long side chain at the nine position should not cause steric hindrance
to binding, as is seen in the case of acranil and atebrin, which do not bind less strongly to
DNA than proflavine.
11
Figure 1-4. Modified intercalation model for Acridine-DNA interaction. 42 Reproduced from Pritchard et al., 1973.
Although Lerman’s physical intercalation model was slightly incorrect, his
characterization of the acridine-DNA complex for proflavine and acridine was very good.
He characterized the intercalation interaction as disrupting the normal double helix,
casusing the DNA to become longer and/or stiffer, while retaining its 3.4 Å spacing along
the helix with the base pairs remaining perpendicular to the axis. These observations
formed the basis of the classical intercalation model. 41
However, we know now that there are additional factors to consider when binding
between an acridine compound and a nucleic acid occurs. First, acridine compounds bind
differently when stacking between consecutive A-A, A-G, G-G, C-C or G-C bases.
12
Secondly, acridine compounds can contain multiple functional groups of varying polarity,
size and hydrophobicity; this results in differing acridine-nucleic acid complex
conformation. New details regarding the intercalation interaction were uncovered by the
research of Cohen and Eisenberg in the late 1960’s. 43 They analyzed the DNA-
proflavine complex using sonicated calf thymus DNA. These short rod-like molecules
could be analyzed more accurately than high-molecular weight DNA with tertiary
structure. They derived equations which related change in the length of the double helix
to change in solution viscosity and ligand-DNA sedimentation rates. Their study was the
first quantitative hydrodynamic experiment to test and confirm the structural predictions
of the classical intercalation model.44 However, their experimental methods and
techniques laid the foundation for a new, ‘nonclassical’ intercalation model. Saucier et
al.45 adopted the methods of Cohen and Eisenberg and found that daunorubicin and 9-
methoxyellipticine gave the predicted increase in viscosity, while Ethidium bromide,
quinacrine, and proflavine gave less than the theoretically predicted increase. Gabbay et
al.46 worked with a series of methylated phenanthroline analogs, and found that the
viscosity of intercalated solutions varied with the number and position of methylated
substituents (Figure 1-5). They found that (1) unsubstituted phenanthroline binds in a
classical manner; (2) symmetrically substituted compounds bind in a classical manner but
cause larger increases in length than unsubstituted compound due to the greater effective
thickness of their intercalated methylated ring systems; (3) asymmetrically substituted
compounds bind by intercalation but can cause lengthening and bending of the double
helix, resulting in a smaller viscosity change than that predicted by the classical model.
13
N
N
R2
R3
R4
R5
R6R7
R8
R9
Figure 1-5. Phenanthraline analogs. In 1973, Gabbay et al.46 published the results of their investigation into the steric effects of methyl and phenyl functional groups on the intercalation of methylated phenanthroline in DNA. Adapted from Gabbay et al., 1973.
Sobell et al.47 published an X-ray analysis of intercalating drugs crystallized with
complimentary dinucleotide monophosphates, and this lent further support to the bending
and stretching phenomena caused by intercalation of acridines with the necessary
substituents (Figure 1-6). The new, nonclassical model was illustrated by Wilson et al. in
1981.
14
Figure 1-6. The classical (A) and non-classical (B) intercalation models of DNA-ligand interaction.44 L0 is a section of B-form DNA, L1 is the same section after binding a simple, unsubstituted intercalator, L2 represents the DNA after binding a non-classical intercalating molecule, such as a large aromatic ring system with an assymetrical distribution of bulky substituents. Reproduced from Wilson et al., 1981.
Further experimentation has provided more detail to the non-classical model. It is
now evident that intercalating molecules have an unwinding effect on superhelical DNA,
and in fact, each molecule will cause a specific amount of unwinding, termed the
unwinding angle. 41 The discovery of closed, superhelical DNA made this analysis more
simple, and the unwinding angles of a variety of intercalators have been quantitatively
determined. 44 Today it is well known that as the concentration of an intercalator in
solution with a fixed amount of DNA is increased, naturally right-handed superhelical
DNA will unwind until it is hydrodynamically equivalent to nicked circular DNA, and
then wind into a left handed superhelical structure. The viscosity of the solution will also
rise and decrease with the concentration of intercalator (Figure 1-7). 48,49
15
Figure 1-7. The effects of intercalating drug on solution viscosity of closed superhelical DNA. 44 As increasing intercalator is added, DNA loses its coiled structure, then regains superhelical coils in the opposite (left-handed) direction. Maximum solution viscosity is reached in the open structure, with minima at minimum and maximum drug concentration. Reproduced from Wilson et al., 1981.
The Binding Affinity of Acridines for DNA
There are a number of factors which must be considered when measuring the
affinity of acridine compounds for DNA. Perhaps the most significant of these are the
ionic strength of the experimental solution and the structure of the acridine molecule
bound. B-form DNA is inherently unstable due to its high charge density. This
instability is overcome by “condensation” with mobile counterions in solution. 44,50-52 An
intercalating compound will replace some of these counterions when it binds to DNA.
16
This aspect of the ion-condensation theory relates the observed equilibrium constant for
intercalation Kobs, to counterion concentration [M+] (Equation 1-1):
Equation 1-1. Ion Condensation Theory: Quantitative Prediction.44 Kobs = observed equilibrium constant for intercalation, [M+] = counterion concentration, m’ = the number of cationic charges on the drug, Ψ = 0.88, the number of cations associated per phosphate.
In this quantitative treatment, Ψ = 0.88, and is the number of cations associated per
phosphate in the thermodynamic sense. m’ is related to the number of ion pairs formed
between the acridinylated compound and DNA, and in general is equal to the number of
cationic charges on the compound. 44 In summary, it is of utmost importance to consider
the ionic strength of the solutions in question when comparing the binding affinity of
acridinylated compounds for DNA. Wilson and Jones 44 recommend constructing a
graph where the logarithm of the observed equilibrium constant (K) for the acridine-DNA
complex at different ion concentrations is plotted against the negative logarithm of the
concentration of the ion. In the following figure, the equilibrium constants of Ethidium, a
monocation, and quinacrine, a dication, are plotted versus the concentration of sodium.
The slope of the plots allow a determination of m’, the number of ion pairs formed in the
DNA-acridine complex, as in Equation 8.
17
HNCl
ONH
NH
N
H2N
NH2
Figure 1-8. Plot of the Logarithm of the Observed Equilibrium Constants (K) of Ethidium and Quinacrine vs the the Logarithm of the Sodium Ion Concentration 44 Ethidium : solid line, Quinacrine : broken line. Reproduced with addition of Ethidium and Quinacrine from Wilson et al., 1981.
Ueyama et. al conducted a series of binding experiments which are particularly
illustrative of the binding capacity of polyintercalators for DNA (Figure 1-8). The first
compounds they synthesized were an acridinylated lysine derivative and a peptide
containing four acridinylated lysines and three natural lysine residues. 53
18
NH
O
NH
HN
O
Cl
O
O
Cl
A
NH
OHN
O (CH2)4
NH3
NH
O
NH
HN
O
Cl
NH
HN
O
Cl
HN
O (CH2)4
NH3
NH
O
NH
HN
O
Cl
HN
O (CH2)4
NH3
NH
O
NH
HN
O
Cl
NH2
O
2 2 2CF3COO CF3COO CF3COO
CF3COOCF3COOCF3COOCF3COO
B
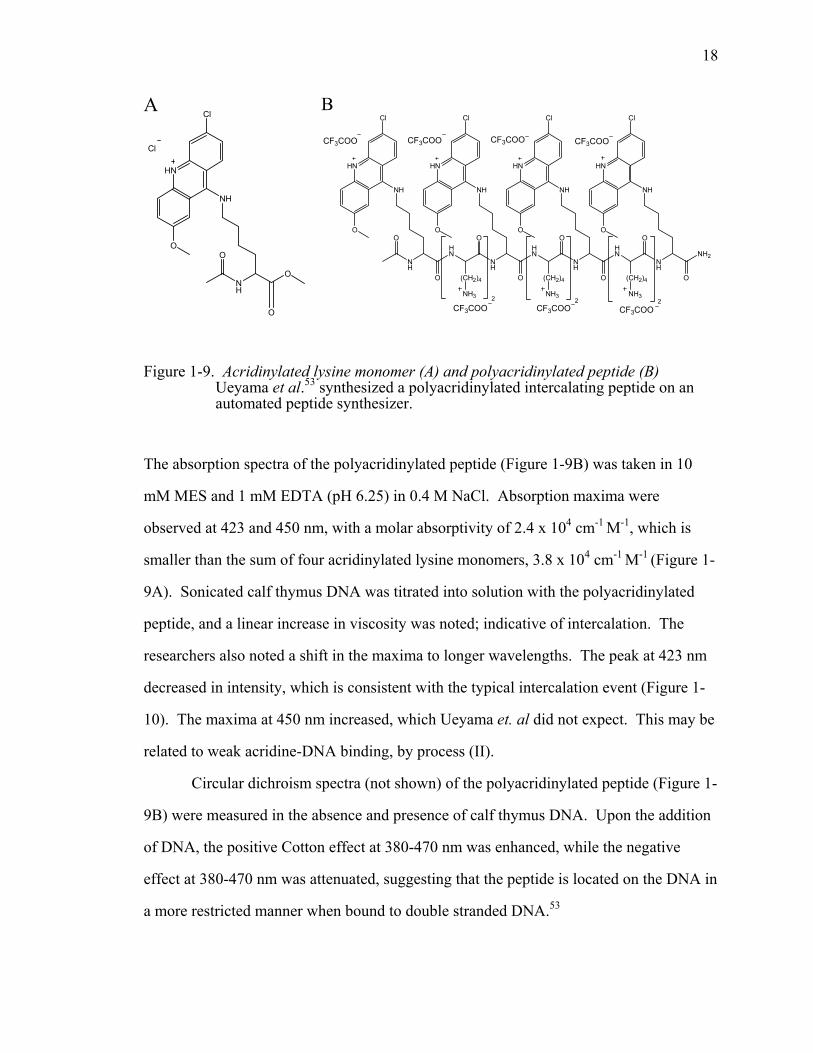
Figure 1-9. Acridinylated lysine monomer (A) and polyacridinylated peptide (B) Ueyama et al.53 synthesized a polyacridinylated intercalating peptide on an automated peptide synthesizer.
The absorption spectra of the polyacridinylated peptide (Figure 1-9B) was taken in 10
mM MES and 1 mM EDTA (pH 6.25) in 0.4 M NaCl. Absorption maxima were
observed at 423 and 450 nm, with a molar absorptivity of 2.4 x 104 cm-1 M-1, which is
smaller than the sum of four acridinylated lysine monomers, 3.8 x 104 cm-1 M-1 (Figure 1-
9A). Sonicated calf thymus DNA was titrated into solution with the polyacridinylated
peptide, and a linear increase in viscosity was noted; indicative of intercalation. The
researchers also noted a shift in the maxima to longer wavelengths. The peak at 423 nm
decreased in intensity, which is consistent with the typical intercalation event (Figure 1-
10). The maxima at 450 nm increased, which Ueyama et. al did not expect. This may be
related to weak acridine-DNA binding, by process (II).
Circular dichroism spectra (not shown) of the polyacridinylated peptide (Figure 1-
9B) were measured in the absence and presence of calf thymus DNA. Upon the addition
of DNA, the positive Cotton effect at 380-470 nm was enhanced, while the negative
effect at 380-470 nm was attenuated, suggesting that the peptide is located on the DNA in
a more restricted manner when bound to double stranded DNA.53
19
Figure 1-10. Absorption spectra of Ueyama’s polyacridinylated peptide Spectra taken without (a) and with (b) 68.8 μM-bp calf thymus DNA [in 10 mM MES and 1 mM EDTA, pH 6.25 containing 0.4 M NaCl at 25°C] 53 Reproduced from Ueyama et al., 2000.
A Scatchard analysis of binding was used with the probability method of McGhee and
von Hippel 54 to determine the binding constant, K = (3.0 ± 0.4) x 106 M-1, which they
noted as being 1000 times higher than that of quinacrine, K = 1.6 x 10³ M-1 (Equation 1-
2).
Equation 1-2. Binding constant (K) determination Ueyama et al.55 adapted McGhee and Von Hippel’s 54 conditional probability derivation of Scatchard’s equation to determine the binding constant of their polyacridinylated peptide. n = total number of binding sites, c = free peptide concentration, v = moles of peptide bound per base pair, K = observed binding constant.
20
Ueyama and co-workers 55 continued their acridinylation research with the publication
of a series of acridinylated compounds of varying length (Figure 1-11).
HN
NH
(CH2)4
NH
HN
O
O
O
Cl
(CH2)4
NH3
NH
O (CH2)4
NH
HN
O
Cl
O
R
CF3COO
2 CF3COO
CF3COO
2 n
Figure 1-11. Series of Polyacridinylated Peptides. 55 For 5 compounds, 1: n = 0, 2: n = 1, 3 : n = 2, 4: n = 3, 5: n = 4 (1: R = OCH3, 2 – 5: R = NH2
The authors also plotted the relationship between the peptides and their molar
absorptivity, and their respective logarithmic binding constants (Figure 1-12).
Figure 1-12. Properties of the series of polyacridinylated peptides. 55 The molar absorptivity (A) and logarithm of the binding constant (B) of each peptide was determined and plotted. Experiments were performed in 10 mM MES and 1 mM EDTA pH 6.25 at 25°C. Reproduced from Ueyama et al., 2001.
21
It is interesting to note the behavior of the longer peptides, with four to five acridinyl
units. The molar absorptivity of the compounds begins to level off, which suggests
aggregation or polymeric behavior. Also, although compound 5 seemed to have high
affinity for DNA, it precipitated during Scatchard analysis, and a binding constant could
not be obtained. 55
The DC-SIGN Receptor
The DC-SIGN (Dendritic Cell-Specific Intracellular adhesion molecule-3
Grabbing Non-integrin) receptor was discovered by Curtis and co-workers in 1992. 56
They screened a placental cDNA library via expression cloning and identified a 1.3
kilobase cDNA sequence predictive of a 404 amino acid protein of 45 775 Da organized
into three domains: an N-terminal cytoplasmic and hydrophobic region, seven complete
and one incomplete tandem repeats, and a C-terminal domain with homology to C-type
(calcium-dependent) lectins (Figure 1-13). Curtis et al. transfected COS cells with the
cDNA and CD4-independent gp120 binding was observed. This was noteworthy because
it meant that HIV could bind a receptor protein in the placenta which had previously been
unidentified. Kd values of 1.7 ± 0.4 nM and 1.8 ± 0.2 nM were derived for protein -
vgp120 (vaccinia virus derived gp120) binding, and protein - ngp120 (native gp120
purified from HIVBRU) binding. A similar Kd (1.3 nM) was obtained for binding between
the protein and placental membranes in the presence of CD4a antibodies. The protein
was confirmed to be a lectin by analysis of binding and gp120 internalization. Mannan,
L-Fucose, α-methyl D-mannoside, D-mannose and N-acetylglucosamine inhibited gp120
binding with an IC50 value of 6 μg/ml, and Ki values of 6 mM, 15 mM, 23 mM and 70
mM respectively. Binding between the protein and gp120 required calcium and was
blocked by EGTA (Ki 0.3 mM), characteristic of C-type lectins. 125I-gp120 bound to the
surface of transfected COS cells was shown to be internalized by an acid stripping
procedure used to remove cell surface ligand. 57
22
Figure 1-13. Nucleotide and deduced amino acid sequence of DC-SIGN cDNA 56 The membrane spanning sequence is underlined and potential N-linked glycosylation site is marked by a star. The beginning of the seven complete and eighth partial repeat (R1-R8) and the beginning of the lectin domain (L) are indicated. Adapted from Curtis et al., 1992.
23
In 2001, Hadar Feinberg et al.58 published a crystal structure of the carbohydrate
recognition domain of DC-SIGN complexed with a Mannose3 N-acetyl Glucosamine2
pentasaccharide (Figure 1-14).
Ca2+
Man3GlcNAc2
Figure 1-14. CRD of DC-SIGN with Man3GlcNAc2 pentasaccharide and calcium. Structure 1k9i (Protein Data Bank) is the decameric representation of the carbohydrate recognition domain (CRD) of DC-SIGN with the Man3GlcNAc2 pentasaccharide bound. Ca2+ ions are depicted as black spheres, the pentasaccharides are the ball and stick structures.
The publication also contained the more highly resolved structure of the pentasaccharide
complexed with DC-SIGNR, a receptor 77% identical in sequence. DC-SIGNR is found
on lymph node and liver sinusoidal endothelia, and in the placental villi, 59-61 while DC-
SIGN is expressed on dendritic cells present in the lamina propria of mucosal tissues such
as those in the rectum, uterus, and cervix. The bound pentasaccharide (Figure 1-15A)
cross-linked two monomeric carbohydrate recognition domains in DC-SIGN exclusively,
but in all other respects the conformation of the pentasaccharide was identical for both
receptors.
Figure 1-15. Polysaccharide Structures 58 (A) Pentasaccharide co-crystallized with the DC-SIGN receptor (B) Man9 N-glycan – abundant on gp120 (C) A common, complex-type N-glycan. The structure in the purple box is analogous to the structure in (A). Adapted from Feinberg et al., 2001.
25
The most unusual interaction between the pentasaccharide and DC-SIGN was the
interaction between mannose (2), Ca2+, and a set of proximal amino acids. Lectin-
carbohydrate reactions typically involve terminal, not internal sugars. In this complex,
the equatorial 3- and 4-OHs of mannose (2) form coordination bonds with Ca2+, which in
turn bonds to Glu354, Asn365, Asp347, and Asn349. The exocyclic C6 of the sugar forms a
water mediated bond with Asp367. The acetamido carbonyl oxygen of GlcNAc (1) forms
van der Waals bonds with Val351. GlcNAc (1) also coordinates with a Ca2+ ion which
cross-links to a partner monomer, forming a dimer (Figure 1-16).
Figure 1-16. Ball and stick representation of DC-SIGN bound to Man3 GlcNAc2. 58 The large gray and cyan spheres are Ca2+, the red spheres are oxygen and the blue spheres represent nitrogen. Reproduced from Feinberg et al., 2001
The crystal structures reported in 2001 by Feinberg et al. 58 were the first
published containing DC-SIGN and a bound polysaccharide. The study was a landmark
and it serves as a valuable model. However, the Man3GlcNAc2 pentasaccharide used had
weak affinity for DC-SIGN relative to a number of high mannose and fucosylated
carbohydrates (Table 1-3 and Figure 1-17, structures on Figure 1-18).
26
Binding Competition Assays Ligand (KD, Man/KD)
Man α1-2 Man 4.1 ± 0.1
Man α1-3 Man 1.8 ± 0.3
Man α1-4 Man 1.8 ± 0.4
Man α1-6 Man 1.6 ± 0.1
Man α1-3 [Man α1-6] Man 3.9 ± 0.5
Man α1-3 [Man α1-3 [Man α1-6] Man α1-6] Man 7.3 ± 0.4
GlcNAc β1-2 Manα 1-3 [GlcNAc β1-2 Man α1-6]Man A 17 ± 6.4
Man9GlcNAc2 131 + 26
A GlcNAc β1-2 Man α1-3[GlcNAc β1-2 Man α1-6]Man is the Man3GlcNAc2 pentasaccharide reported in the crystal structure, Figure 16.
Table 1-3. Binding of Oligosaccharides to DC-SIGN. 58 Competition binding assays with the immobilized CRD of DC-SIGN were performed. The KDs relative to the KD for mannose were reported. Adapted from Feinberg et al., 2001.
Figure 1-17. Comparative affinity of carbohydrate ligands for DC-SIGN. 62 Synthetic glycoconjugates were screened for affinity to a chimeric DC-SIGN with a human IgG1-Fc tag in an ELISA-type assay. Anti-DC-SIGN mAb AZN-D1 was used to block binding. Reproduced from Appelmelk et al., 2003.
27
Figure 1-18. Schematic diagram of the synthetic glycoconjugate ligands used in the DC-SIGN binding assay. 62
In 2007, Feinberg et al. published a second paper on DC-SIGN with
crystallographic analysis of bound polysaccharides. 63 The Man6 structure reported is of
special interest because it is part of the structure of the Man9GlcNAc2Asn N-glycan,
present on the coating of the HIV virus, Ebola virus, and the Leishmania pifanoi parasite. 64 The binding competition assay was performed with Man6, Man9, and Man9GlcNAc2.
Man6 bound 14 times more tightly than mannose, but Man9 bound 32 times more tightly,
and Man9GlcNAc2 bound with 88 times the affinity (Table 1-4 and Figure 1-19). The
researchers did not report the binding affinity of the full-length N-glycan,
Man9GlcNAc2Asn. The addition of a single amino acid into the spacer arm may have
created a significant increase in binding affinity.
a – absolute and relative KI vs. mannose values taken from Feinberg et al, 2001. 58
Table 1-4. Binding of High Mannose Oligosaccharides to DC-SIGN. 63 Competition binding assays with the immobilized CRD of DC-SIGN were performed. Absolute KI value omitted due to experiment with a different batch of 125I Man-bovine serum albumin. Adapted from Feinberg et al., 2007.
Figure 1-19. Asparagine linked high mannose structures. 63 Man6a is shown in the red box, Man6b is in the blue box, and Man9 is in the green box. Adapted from Feinberg et al., 2007.
The researchers found that the crystal structure of Man6b bound to the receptor
was the same as that of Man3GlcNAc2, from their 2001 paper. However, they observed
Man6b bound in two overlapping orientations in a 3:1 ratio, designated major and minor.
Only three mannose residues were visible in the major orientation; two were visible in the
29
minor orientation. The penultimate α1-3 linked mannose binds to the primary Ca2+ site
and is seen in both orientations (Figure 1-20). In the minor orientation, the same
mannose is seen, but it is rotated 180° around an axis bisecting the pyranose ring through
the C-3 – C-4 bond.
Figure 1-20. Ball and stick representation of DC-SIGN bound to Man6b. 63 The green spheres represent Ca2+, The red sticks are oxygen, nitrogen is blue. Ca2+ coordination bonds are dashed black lines, van der Waals interactions are dashed blue lines, hydrogen bonds are dashed gray lines. A is the major orientation of the bound ligand, B is a magnified view of A, C is the minor orientation of the ligand, D is a magnified view of C. Reproduced from Feinberg et al., 2007
One of the primary challenges in quantifying the affinity of DC-SIGN for high
mannose N-glycans is the difficulty involved in obtaining material. For instance, in the
30
competition, binding assays performed by Feinberg and co-workers, 63 the Man9GlcNAc2
glycan was assayed only once in duplicate because only limited quantities were available.
This is also part the reason the group did not produce a crystal structure of the ligand-
receptor complex. The Man9 nonasaccharide was synthesized by the lengthy procedure
shown below (Scheme 1-8,9 and 10):
Scheme 1-8. Retrosynthesis of the Man9 nonasaccharide. 65 Seeberger’s retrosynthetic method for producing Man9 was adopted. Man6b was produced by the same approach, using methyl 2,3,4-tri-O-benzyl-α-D-manopyranoside as the core sugar unit. 63,66,67
31
Scheme 1-9. Reaction conditions for the Man9 nonasaccharide. 65 Seeberger’s 15 step synthesis produces Man9 at a 25% overall yield. It is linear, and was designed to be automated.
32
Scheme 1-10. High mannose oligosaccharide target compounds. 65 Compounds 2-4 were synthesized, compound 1, the native N-glycan, has never been synthesized to date.
The carbohydrate chemistry used in the synthesis of compounds 2-4 is unique in many
ways and the methodology could potentially be used in an automated setting. However at
this time, the chemical synthesis of natural glycans is still much less practical than natural
product isolation. Seeberger’s synthesis provides specific evidence of this, particularly
because the research group could not synthesize the full N-glycan.
The Functions of DC-SIGN
The membrane associated mannose binding lectin discovered by Curtis and co-
workers in 1992 56 was renamed DC-SIGN (dendritic cell-specific intracellular adhesion
molecule-3 grabbing non-integrin) by Geijtenbeek et al. in 2000.68 Steinman and Cohn
discovered dendritic cells (DCs) in 1973 69 and over the next three decades it became
well established that dendritic cells were essential to the initiation of a primary immune
33
response. DCs do this by capturing antigens in peripheral tissue and processing them to
form a major-histocompatibility (MHC) – peptide complex. The DCs then migrate from
the periphery to the T-cell areas of secondary lymphoid organs (Figure 1-21). The cells
mature during the migration and their surface profile is altered. At that point resting T-
cells are attracted to DCs, and when the cells bind, the antigen payload in the DC is
transferred to the T cells. 2,70,71
Figure 1-21. DC Activation In Vivo. 66 Antigens are captured by DCs in peripheral tissues and processed to form MHC-peptide complexes. The immature DCs derive from proliferating and non-proliferating precursor cells. Antigen deposition and inflammation matures the DCs and they express molecules which will lead to binding and stimulation of T cells in the T-cell areas of lymphoid tissues. If the antigen has also been bound by B cells, then B and T cells can cluster with DCs. After activation, T and B blasts leave the T cell area. B blasts move to the lining of the intestine, bone marrow and other parts of the lymphoid tissue. Some become antibody-secreting plasma cells. T blasts leave the blood at the original site of antigen deposition, recognize changes in the inflamed blood vessels and respond vigorously to cells presenting antigen. Adapted from Geijtenbeek et al., 2000.
34
The discovery of DC-SIGN by Geijtenbeek and his co-workers began with their
observation of high levels of ICAM-3 (intracellular adhesion molecule 3) expression on
the surface of resting T cells. The β2 integrins LFA-1 (lymphocyte function associated
integrin-1, also known as αLβ2) and αDβ2, both present on DCs, had been described as
the primary receptors for ICAM-3, although their affinity for ICAM-3 is low. 72-75 In
addition to these observations, the investigators knew that ICAM-3 is a heavily
glycosylated transmembrane protein. 76,77 The researchers then used these facts to design
a set of experiments which would show that DC-SIGN, (and neither LFA-1 nor αDβ2) a
induce humoral immunity, and it may be possible that some microorganisms target DC-
SIGN specifically to induce a TH2 dominant response.88 This phenomena is seen with
Leishmania mexicana, where a TH1 to TH2 shift is necessary for virulence and
persistence. This is also the case with the parasite Schistosoma mansoni, where the TH2-
type immune response to infection is associated with persistence, driven by its major
glycan antigen Lex.95
Research Objective
For several years the objective of research in our laboratory has been to design
and synthesize non-viral gene delivery vectors. Designing an effective vector of this type
generally requires 1) a method of binding or enveloping DNA,96 2) preventing the vector-
DNA complex from binding non-specifically with blood plasma proteins, undesired cells,
and the extracellular matrix, 97 3) inducing cell or tissue specific binding and endocytosis,
4) a method for the release of the DNA from liposomal or endosomal enclosure, 5)
resistance to cytoplasmic degradation, and 6) localization to and passage through the
double-membrane of the nuclear envelope surrounding the nucleus.98,99
The focus of the research in the following chapters is on advances made in vector
design and application in two areas: the synthesis of acridine derivatives which reversibly
bind to DNA, and the development of new targeting ligands for gene transfer to dendritic
cells.
Cationic lipids, polymers, and peptides are commonly used to encapsulate and
complex DNA. The binding interaction results from electrostatic attraction between the
anionic phosphate backbone of the nucleic acid and positively charged moieties on the
38
carriers.100 DOTMA, PEI, and poly-arginine peptide belong to this group of compounds.
I adopted an approach which combines a cationic amino acid and a derivatized,
intercalating amino acid into a single DNA-binding peptide.
Antibodies, proteins, and oligosaccharides are often utilized as targeting agents
for non-viral vectors. The single-chain antibody to the tumor associated cell surface
ERBB2 antigen,101 the glycoprotein transferrin,97 and sialyl Lewis X 102 are examples of
targeting ligands used with synthetic vectors. We used the high-mannose N-glycan
Man9GlcNAc2Asn as the targeting ligand for our vector.
Haensler and Szoka 103 synthesized a targeted vector similar in design to the
vector designed in this publication. It contained a bisacridine moiety for intercalating
into plasmid DNA and galactose monosaccharides for binding the asialoglycoprotein
receptor on primary hepatocytes. While the compound bound the pCLUC4 plasmid
encoding firefly luciferase with micromolar affinity, it did not induce transfection of the
hepatocytes. Our hypothesis was that we could achieve targeted gene delivery with a
vector containing carbohydrate and intercalative functionality. The objective of this
research project was to synthesize a vector containing acridine for non-covalent
complexation of DNA, and a glycan ligand for targeting the DC-SIGN receptor on
dendritic cells. Gene expression in the target cells would be quantified by luciferase
analysis of the translated pGL3 reporter gene.
39
CHAPTER 2
AN IMPROVED METHOD FOR PREPARING SEPHAROSE
N-CAPROYL GALACTOSAMINE AFFINITY RESIN FOR THE
PURIFICATION OF SOYBEAN AGGLUTININ FROM SOY FLOUR
Introduction
Soybean Agglutinin (SBA) is a glycoprotein and a lectin. SBA was initially
identified as a toxin with hemagglutinating activity found in defatted soybean flour by
Irvin Liener in the 1950s.104 This discovery soon led to collaboration with Nathan
Sharon, who published articles on the structure, purification and application of SBA and
other lectins over the next four decades.105,106,107 Lectins bind carbohydrates through
non-covalent interaction, and as such are used experimentally to investigate intracellular,
extracellular, and membrane bound glycoproteins. SBA has been used clinically to purge
mononuclear bone marrow cells, enriching CD34+ hematopoietic progenitor cells,
thereby preventing graft-vs-host disease in bone marrow transplants.108 SBA is also of
interest because it contains Mannose-9 N-Glycan, an N-Glycan on the HIV glycoprotein
120 which binds the mannose binding lectin (MBL), DC-SIGN, and other lectins in the
innate immune system, facilitating HIV infection of T cells.109 Previously, we
incorporated Man9 into a non-viral gene delivery vector to target the mannose receptor on
Kupffer cells in the liver.110
My initial research into improving our ammonium sulfate precipitation procedure
for isolating SBA led to the discovery of Sharon’s affinity purification method.106 Low-
pressure chromatography was an ideal means for purification of the quantity of N-glycan
necessary to synthesize our bioconjugate vectors. We found the affinity absorbent
preparation procedure of Allen and Neuberger111 easy to follow and an improvement over
the method published by Gordon et. al.106 The former procedure can be completed in
much less time than the latter with fewer steps and under milder conditions. We produce
40
the same Sepharose-N-caproylgalactosamine conjugate as Allen and Neuberger111 at
significantly lower cost as unfunctionalized sepharose is used instead of sepharose
containing N-hydroxysuccinimide protected 6-aminohexanoic acid. This was done by
adopting the 1,1’Carbonyldiimidazole (CDI) sepharose activation procedure published
by Bethel and Ayers.112 Mild, benchtop chemistry is employed to synthesize affinity
resin which consistently produces approximately 3 mg of pure SBA per gram of soy
flour.
Materials and Methods
Sepharose-N-caproylgalactosamine affinity resin
Sepharose CL-4B, D-Galactosamine HCl, and 6-aminocaproic acid were from
Sigma-Aldrich. 1,1’Carbonyldiimidazole, and N-(3-Dimethylaminopropyl)-N’-ethyl-
carbodiimide HCl were Fluka Biochemica products. Trypsin used for LC-MS
identification of SBA was SIGMA proteomics grade. All of the other solvents and buffer
solutions were reagent grade material from Fisher or Sigma. The soy flour was a sample
from Archer Daniels Midland. Centrifugation was done on a Sorvall RC 5B Plus
centrifuge, and low pressure chromatography was monitored with an ISCO UA-6
UV/VIS detector and Type 12 optical unit.
SBA Analysis
NuPAGE® Novex Bis-Tris Gels from Invitrogen were used with the NuPAGE®
Gel System for protein analysis. Staining was done with the PIERCE GelCode® Blue
Stain Reagent. Protein concentration was determined with a Beckman DU-640
spectrophotometer and LC-MS/MS identification of SBA was performed with an Agilent
1100 series HPLC system on a Vydac C18 column with an inline 1100 series LC/MSD
trap.
41
Results
Preparation of the Sepharose-N-caproylgalactosamine
conjugate
6-Aminocaproic acid was bound to activated Sepharose CL-4B as described.112
A moist cake (50 g) of Sepharose CL-4B was washed with sequential 200 mL washes of
water, 3:7 acetone water, 7:3 acetone water, and acetone. The sepharose was suspended
in 50 mL acetone. 1,1’Carbonyldiimidazole (1.2 g) was added with stirring for 15 min at
RT. A solution of 14 g of 6-aminocaproic acid in 90 mL of water was prepared. After a
15 min reaction with CDI, the mixture was washed with 1 L of acetone, and the 6-
aminocaproic acid solution was immediately used to transfer the activated sepharose into
a round-bottomed flask, where the pH was raised to 10 with 1 M NaOH. The mixture
was stirred overnight at 4°C.
Galactosamine was coupled to the carbonyl of 6-aminocaproic acid with a water
soluble carbodiimide (Scheme 2-1).111 The linker-bound sepharose was washed with 2 L
of water, 1 L of 1 M NaCL and again with 2 L of water. A slurry was (125 mL) was
prepared with water, and 600 mg of Galactosamine HCl was added followed by
adjustment of the pH of the mixture to 5.0 with 0.1 M NaOH. A solution 300 mg of fresh
N-(3-Dimethylaminopropyl)-N’-ethyl-carbodiimide HCl in 8 mL of water was prepared,
and added to the slurry over 5 min, and after 10 min a pH of 5.2 was determined. The
slurry was stirred for 1 hr, and then left at RT for 20 hr without stirring. The gel (30 mL,
31.2 g) was loaded into a glass column (2.5 x 10 cm) and washed successively with 3
column volumes each of 1 M NaCl, 1 M NaCl containing 100 mM Tris-HCl pH 8.6, 1 M
NaCl containing 50 mM sodium formate pH 3.0, 1 M NaCl containing 100mM Tris-HCl
pH 8.6, water, and PBS. The gel was then ready for use, or could be stored at 4°C in 2 M
NaCl.
42
OO
OH
O
OH
O
O
O
O N
O
N
OO
OH
O
OH
O
O
O
O
NH
O
HO
O
H2N
O
HO
OHOH
OH
NH2HO
O
O
N
HNNH
NO
O
OH
O
OH
O
O
O
OH
OO
OH
O
OH
O
O
O
O
NH
O
HN
O
O
HO
OHOH
OH
Acetone
EDC
Scheme 2-1. Synthesis of Sepharose-N-caproylgalactosamine Affinity Resin. Sepharose CL-4B is brought up in acetone and activated with 1,1’carbonyldiimidzole. The 6-aminohexanoic acid linker is then bound, followed by galactosamine coupling with a water soluble carbodiimide.
Purification of SBA
Soy flour (10 g) was added to 200 mL of PBS and stirred overnight at 4°C. The
solution was then centrifuged at 9 000 g for 15 min, and the supernatant was applied to
the galactosamine affinity column at RT. The column was washed with PBS until the
absorbance of the effluent was below 0.02 at 280 nm. SBA was eluted in 8 mL fractions
by the addition of 30 mL of 0.2 M D-Galactose in PBS. SBA was then pooled and
dialyzed in 12-14 kDa MWCO tubing for 48 hrs against running water and freeze dried.
The yield was then determined by measuring absorbance at 280 nm with ε280 = 40, 250
M-1 cm-1 as the molar absorptivity (Figure 2-1).
43
Elution vol (ml)
0 50 100 150 200
Abs
orba
nce
280
nm
0.0
0.5
1.0
1.5
2.0
Soy Flour (g)
0 20 40 60 80 100 120
SBA
(mg)
0
50
100
150
200
250
300
350
SBAA
B
Figure 2-1. Sepharose N-caproyl Galactosamine Affinity Column. Soy flour is dispersed in PBS, centrifuged, and the supernatant is loaded onto a 30 mL affinity column A 200 mM galactose solution is loaded for elution. Panel A: Chromatogram of the affinity purification of 10 g of soy flour. Panel B: Galactosamine affinity column yields. The column bound 11 mg SBA per mL of resin, and the soy flour contained 3 mg SBA per gram of soy flour.
44
Protein Electrophoretic Analysis and LC-MS/MS
Identification
The soy flour-PBS suspension, soy flour supernatant, affinity purified pool of
SBA, and dialyzed SBA were analyzed by PAGE according to the NuPAGE® protocol.
The PAGE gel was loaded with 6.5 μL samples and compared to a 1 μg sample of
purified SBA (Figure 2-2).
kDa
Stds 1 2 3 4
98
28
14
Figure 2-2. SDS-PAGE Gel Analysis of SBA Affinity Purification Lane 1: soy flour/PBS suspension, Lane 2: supernatant from soy flour/PBS suspension, Lane 3: unbound protein, Lane 4: purified soybean agglutinin. SBA is seen in reduced monomeric form, at 30 kDA.
To prepare a sample for LC-MS/MS identification, 1 mg of purified SBA in 40 μl
H2O was mixed with 40 μl 0.05% SDS. The sample was then heated at 95°C for 7 min
Then two weight percent trypsin (SIGMA Proteomics Grade) 50 mM Tris HCl, pH 8 was
45
added and incubated at 37°C overnight. The digest was then freeze dried and redissolved
in 0.5 mL water. A portion of the digest (75 μl, 5 nmol) was injected onto the RP-HPLC
and eluted with a 10-60% acetonitrile in 0.1% acetic acid 60 min gradient, eluting at 0.7
ml/min The peaks were detected by an ESI-MS ion trap in the positive mode with 50 psi
nebulizer pressure, 10 L/min dry gas flow with a source temp of 350°C (Figure 2-3).
The data files were exported to the MASCOT (Matrix Science) search engine where an
MS/MS Ion Search was conducted with the SwissProt database to identify SBA from
peptides deconvoluted with the Agilent software (Table 2-1).
Time (min)0 10 20 30 40 50 6
Abs
orba
nce
280
nm
0
SBA
Figure 2-3. Tryptic Digestion of SBA. Soybean agglutinin (top panel) was digested with a 2 wt/% trypsin solution and injected on an ESI LC-MS (bottom panel).
46
Soybean Agglutinin Mass: 30,909 Observed Mass (m/z) Calculated Mass (g/mol) Peptide
988.10 986.52 K.TSLPEWVR.I
1150.43 1148.55 K.TTSWDLANNK.V
1304.28 1302.70 R.TSNILSDVVDLK.T
Table 2-1. Mascot MS/MS Ion Identification. Three peptides were identified in the MS/MS ion search of the tryptic digest. SBA had the highest probability-based Mowse score of all the proteins identified by the deconvolution algorithm.
Discussion
The N-caproylgalactosamine affinity column described here purified 328 mg of
SBA from 110 g of soy flour. The experimentally determined resin capacity of 11 mg/ml
is close to the previously reported 12 mg/mL capacity. 111 While loading 120 g soy flour
would likely have yielded 360 mg SBA at a capacity of 12 mg/mL, loading 130 g soy
flour clogged the column on two occasions.
The affinity resin used here is essentially the same as that described by Allen and
Neuberger111, however, we activate our resin to covalently link 6-aminohexanoic acid
using 1, 1’carbonyldiimidazole, thereby lowering the cost of synthesis several fold. CDI
activation results in a greater number of linker functional groups to the resin compared to
cyanogen bromide activation. This is because the imidazole carbamate is the sole
reaction product, while CNBr activation produces isourea, carbamate and carbonate
products of varying reactivity.113 Also, when using CDI, N-hydroxysuccinimide
activation of 6-aminohexanoic acid is unnecessary, since the amide bond between the
acid and Galactosamine is formed directly with the water soluble carbodiimide. Acetone
is the only organic solvent needed, and the series of reactions are completed in two days
under mild conditions and with basic laboratory equipment. We have made 500
milliliters of the affinity resin by this method for gram scale purification of SBA.
47
CHAPTER 3
ENZYMATIC RELEASE OF MAN9GLCNAC2ASN FROM SOYBEAN
AGGLUTININ AND DERIVITIZATION OF MAN9GLCNAC2ASN
ANALOGS
Introduction
Glycans are often integrated into drug delivery vehicles as bioactive ligands to
confer target recognition and specificity, or to impart structural stability and integrity in
in vivo. They are also applied to take advantage of intrinsic pharmacological properties.
They have been shown to posses immuno modulatory, anti-tumor, anti-inflammatory,
anti-coagulant, hypoglycemic, and antiviral activity.114
In our laboratory we have constructed non-viral gene delivery vectors containing
either Man9 N-glycan, or Triantennary N-glycan, for selective in vivo targeting to the
liver; to the mannose receptor on Kuppfer cells or the asialoglycoprotein receptor on
hepatocytes.110,115
In the present study we sought to improve the design of the high mannose targeted
gene delivery vector. This chapter describes a greatly improved method of proteolytic
release of Man9 from affinity purified SBA. To endow this N-glycan with affinity for
DNA we attached Acridine to the Asn residue on the reducing end of the oligosaccharide.
This was achieved by preparing 6-(9-Acridinylamino) hexanoic acid. 116 The acridine
acid was converted to an NHS ester via DCC coupling and used to make two novel
Man9GlcNAc2Asn analogs; Man9GlcNAc2Asn-Acridine, and Man9GlcNAc2Asn-
Tyrosine Acridine. Man9GlcNAc2Asn-Acr was the more efficient acridinylated
compound from a synthetic and purification standpoint, however as demonstrated, it
displayed weak binding affinity for plasmid DNA.
48
Materials and Methods
Liquefied phenol was from J.T. Baker, and the concentrated sulfuric acid was a
Fisher Scientific reagent. D2O was from Cambridge Isotope Laboratories. NuPAGE®
Novex Bis-Tris Gels from Invitrogen were used with the NuPAGE® Gel System for
protein analysis. SDS PAGE gel staining was done with PIERCE GelCode® Blue Stain
Reagent. The Sephadex G-50 resin was from Amersham Biosciences. The AG 50W-X2
cation exchange resin was from Bio-Rad. The centrifuge was an IEC HN-SII, and the
freeze dry system was a Labconco Freezone 4.5 with a centrivap concentration accessory.
An ISCO UA-6 UV/VIS detector and Type 12 optical unit were used to monitor the
eluate during gel filtration and ion exchange chromatography. A Milton Roy Spectronic
20D was used for colorimetric detection in the phenol sulfuric assay. The MALDI-TOF
was a Bruker Biflex III, and the NMR spectrometer was a 600 MHz Bruker Oxford
AS600.
Pronase was a BioChemika product from Sigma-Aldrich. Tris, pyridine, acetic
acid, and trifluoroacetic acid were certified ACS grade Fisher reagents or an equivalent.
Boc-Tyrosine N-hydroxysuccinimide was a Chemika reagent from Sigma-
Aldrich. Sodium bicarbonate and N,N-dimethylformamide (DMF) were Fisher reagents.
The 9-Chloroacridine (97%) was a Sigma-Aldrich product, the solid phenol was a
Riedel-de-Haën product (ACS grade) through Sigma-Aldrich. The sodium hydroxide
pellets were a Mallinckrodt product through Fisher Scientific. The N,N-
Dimethylformamide and anhydrous ethyl ether were Fisher reagents, and the 95% ethanol
was a USP reagent from the university Biochemistry store. The N-hydroxysuccinimide
(NHS) was a Sigma-Aldrich product, and the N,N’-Dicyclohexylcarbodiimide (DCC)
was a Fluka product through Sigma-Aldrich. NMR spectra were taken with a 300 MHz
Bruker NMR.
49
The 0.1% Agarose gel was made with agarose from GIBCO, Tris and Boric acid
from Fisher Scientific, and EDTA from Sigma-Aldrich. SEAP plasmid was obtained
from the Promega corporation. The Ethidium bromide stock solution was from Bio-Rad.
Enzymatic Digestion of SBA
Affinity purified SBA (600 mg) was freeze dried and brought up in 8 mL of 100
mM HCl. The protein was then denatured at 50°C for 15 min The pH was raised to 8.5
with 600 μL 1M NaOH resulting in the formation of a gel. The SBA gel was dissolved
by adding 2 ml of water and 100 μL 2M NaOH followed by the addition of 7 mg of
pronase in 2 ml of 30 mM CaCl2 in 50 mM Tris pH 8.5. The digestion was carried out
for 24 hours at 37°C, after which an additional 5 mg of pronase in 1 mL of Tris was
added, and the digestion continued for an additional 24 hr period.
Low Pressure Chromatographic Purification of
Man9GlcNAc2Asn
The digested SBA (3 μg) was loaded on a PAGE gel to verify digestion. The
digest was centrifuged at 4000 g for 8 min, and the supernatant was freeze dried. The
centrifugation and lyophilization were repeated, and the sample was brought up in 1.5 ml
water. An aliquot was analyzed by phenol sulfuric assay,117 a colorimetric assay for
carbohydrates. The 490 nm absorbance was converted to estimate mannose content using
the conversion of 1 AU = 18.5 nmol Man9. Man9 was quanified throughout the
purification. Approximately 15 μmol of Man9 (from 20 μmol digested) was recovered.
The pronase digest was applied to Sephadex G-50 resin in a column (1.5 x 170 cm) and
eluted with 10 mM acetic acid. The eluant was collected in 8.5 mL fractions, with
detection by absorbance at 280 nm and by assaying fractions with PSA. The
carbohydrate containing fractions (200 mL) were pooled, concentrated by roto-
evaporation, freeze-dried, and brought to 1.5 ml. The PSA was used to determine that
14.1 μmol were recovered from the first gel filtration column. The gel filtration was
50
repeated, and the glycan containing fractions were pooled, dried, and brought up in 1.5
mL for polishing on a cation exchange column. The PSA recovery at this point was 11.7
μmol.
The Man9 was applied to a cation exchange column (1.5 x 50 cm) and eluted with
pyridine/acetic acid, pH 3.2. The glycan (1.1 L) was pooled, dried, and brought up in 1.5
mL. Total recovery was determined to be 6.7 μmol by PSA, a 45% overall yield.
A 2 nmol sample of Man9Asn was analyzed by MALDI-TOF with a super-DHB
matrix in linear mode. Likewise, a 1 mM sample in D2O with an acetone internal
standard was analyzed by NMR.
Man9GlcNAc2Asn Tyrosine Analogs
Man9GlcNAc2Asn (500 nmol) was freeze dried and reconstituted in 300 μl
DMF. Boc Tyrosine NHS (5 μmol) was brought up in 200 μl of DMF, added to
Man9Asn and reacted for 3 hr. The reaction was loaded onto Sephadex G-25 resin in a
1.5 x 50 cm glass column, eluting with a 10 mM acetic acid mobile phase, detecting by
absorbance at 280 nm. The derivatized Boc-Man9GlcNAc2Asn-Tyr (50 ml) was pooled,
dried, reconstituted in water, and analyzed by UV/VIS and HPLC ESI-MS. The yield
was determined by measuring tyrosine absorbance at 274 nm with a molar absorptivity of
1400 M-1cm-1. The purity and identity of Boc-Man9GlcNAc2Asn-Tyr was determined by
RP-HPLC. The sample was analyzed on an 1100 series Agilent HPLC with a
GraceVydac C18 column (0.46 x 25 cm) and an inline 1100 series LC/MSD trap, eluting
with 1-30% ACN in 0.1% TFA over 30 min, while detecting in negative mode. The yield
was quantitative and no contaminating peaks were visible in the chromatogram.
Boc-Man9GlcNAc2Asn-Tyr (253 nmol) was freeze dried and reconstituted with
150 μl of 95% TFA for 5 min The de-protection reaction was then quenched on dry ice,
and dried by speedvac for 1 hr. The compound was reconstituted with 1 mL of water,
and a quantitative yield was determined by UV/VIS. The derivatized glycan was then
51
analyzed for purity on an ISCO HPLC system with a Vydac C18 column and a model
2360 gradient programmer, model 2350 pump, and a V4 absorbance detector. The
gradient was the same as used in the previous analysis. The Man9GlcNAc2Asn-Tyr
chromatograms were free of contaminating peaks.
Synthesis of the 6-(Acridin-9-ylamino)-hexanoic acid 2,5-
dioxo-pyrrolidin-1-yl-ester
Sodium hydroxide (720 mg) was added to 12 g of phenol, and heated with stirring
at 100°C. 9-Chloroacridine (2.8 g) was added, and the reaction continued for 1.5 hrs.
The heat was removed, and 100 mL of 2N NaOH was added. The mixture was stirred
briefly, and left at RT for 24 hrs, after which the precipitate was collected by filtration,
washed with water, and dried. The reaction yielded 3.4 g (95%) 9-Phenoxyacridine,
which had a m.p. of 123-124°C. (300 MHz, DMSO-d6): δ = 8.23 (d, 2H), 8.03 (d, 2H),
in 50 μL DMF was added and reacted for 24 hrs. The reaction product was purified by
Sephadex G-25 as described above. The product was analyzed for purity by analytical
RP-HPLC and determined to 83%, with an isolated yield of 107 nmol (54%).
Man9GlcNAc2Asn-Acridine - Plasmid DNA Binding: The
Band Shift Assay
Six experimental samples were made adding SEAP plasmid DNA (0.6 μg) to
0.03, 0.32, 3, 8, 16, and 32 nmol Man9GlcNAc2Asn-Acr. Each sample was incubated
for 30 min and loaded into an agarose gel. The gel was electrophoresed with an 80V
electric field for 90 min and stained overnight at 4°C with 200 ml 0.1 μg/μl ethidium
bromide. The gel was analyzed with a UVP Dual Intensity Ultraviolet Transilluminator
and a Fisher Electrophoresis photodocumentation system.
53
Results
Enzymatic Digestion of SBA and Chromatographic
Purification of Man9GlcNAc2Asn
Affinity purified SBA was digested with 2 wt % pronase solution for 48 hours,
followed by purification by low pressure gel filtration and ion exchange chromatography,
as in Lis and Sharon (Figure 3-1).118
The digestion was monitored by determining the loss of protein bands on SDS-
PAGE to establish reaction completion. The SBA digest was fractionated as a
glycopeptide. The glycopeptide lacked 280 nm absorbance but could be detected by
performing a phenol sulphuric assay specific for detecting monosaccharides and
oligosaccharides (Figure 3-2). While gel filtration enriched the glycopeptide, there was
still significant protein and peptide contamination. The Man9GlcNAc2Asn was further
enriched by a second gel filtration purification followed by a cation exchange column
(Figure 3-3). The final column step led to Man9GlcNAc2Asn that was substantially free
of peptide. MALDI-TOF analysis indicated the purified Man9 possessed two major ions,
corresponding to the mono and di-sodium adducts (Figure 3-4). Further confirmation of
the proposed structure was obtained by high field NMR. By comparison with the
chemical shifts and coupling constants from previously indentified Man9GlcNAc2Asn, 119,105 it was possible to make assignments for most of the anomeric protons (Figure 3-5).
Most importantly, the chemical shifts of the D1-D3 residues were identified with
chemical shifts of 5.04, 5.05, and 5.03 ppm.
54
O
H3COCHN
HN OOH
O
H3COCHN
OOH
O
OOH
OOH
O
OO
OOH
O
OHHO
OOH
OOH
OHHO
OO
OH
OHHO
OH
OH
O
O
OHOH
O OH
O
OHOH
OOH
OHOH
OH
OH
OOH OH
OHOH
OHOH
H2N
HO O
O
NHCOCH3
HNOHO
O
NHCOCH3
OHO
O
OOH
OHO
O
OO
OOH
O
HOOH
OHO
OHO
HOOH
OO
HO
HOOH
HO
HO
O
O
HOHO
OOH
O
HOHO
OHO
HOOH
OH
OH
OOHOH
HOHO
OH OH
NH2
OHO
OH3COCHN
NH
OOH
OH3COCHN
OOH
O
OOH
OHO
O
OO
OOH
OHO
HO
OHO
O
OHHO
HOO
OOH
HOHO
OH
OH
O
O
OHHO
O
OH
O
OHHO
O
OHHO
OH
OH
OH
O OH
OHOHHO
OH
OH
NH2HO
O
OH3COCHN
NH
OOH
OH3COCHN
OOH
O
OOH
OHO
O
OO
OOH
OHO
HO
OHO
O
OHHO
HOO
OOH
HOHO
OH
OH
O
O
OHHO
O
OH
O
OHHO
O
OHHO
OH
OH
OH
O OH
OHOHHO
OH
OH
NH2HO
O
O
NHCOCH3
HNOHO
O
NHCOCH3
OHO
O
OOH
OHO
O
OO
OOH
O
HOOH
OHO
OHO
HOOH
OO
HO
HOOH
HO
HO
O
O
HOHO
OOH
O
HOHO
OHO
HOOH
OH
OH
OOHOH
HOHO
OH OH
NH2
OHO
amino acids and
short peptides
2 wt% pronase
48 hrs 37°C
+
Figure 3-1. SBA Digestion by Pronase. Pronase, an enzyme preparation from Streptomyces griseus, with three proteolytic activities and a wide range of substrate specificity digests the SBA glycoprotein allowing isolation of the glycan.
55
Elution vol (ml)0 100 200 300 400 500
Abs
orba
nce
A490
A280
A490
A280
Figure 3-2. Gel Filtration of the SBA Pronase Digest. Mobile phase was 10 mM acetic acid, with UV peptide and amino acid detection at 280 nm and carbohydrate detection at 490 nm by the phenol sulfuric acid assay.
56
Elution vol (ml)
0 5 10 15 20 25
Abs
orba
nce
A490
A280
Figure 3-3. Cation Exchange Purification of Man9GlcNAc2. Man9GlcNAc2Asn binds weakly to the cation resin through its Asn residue. The contamination peak with 280 nm absorbance contains peptides with a pI below 3.2.
m/z
1950 2000 2050 2100 2150
Inte
nsity
[M + 2Na]2041.66
[M + Na]2019.72
Figure 3-4. MALDI-TOF Analysis of Purified Man9GlcNAc2Asn. The glycan was ionized with a super 2,5 DHB matrix and analyzed in reflectron mode with. It was identified with sodium atoms adducted.
57
1H NMR Man9GlcNAc2Asn
O
NHCOCH3
HNO
HO
O
NHCOCH3
OHO
O
OOH
OHO
O
OO
OOH
O
HO
OH
OHO
OHO
HO
OH
O
OHO
HO
OH
HO
HO
O
O
HOHO
OOH
O
HOHO
OHO
HO
OH
OH
OH
OOH
OH
HOHO
OH OH
NH2
OHO
123
4
4’
A
D2 B
D3
C D1
A
4
C B
D1 D2 D3
4’
HOD
4’3
bulk region
21
Figure 3-5. 600 MHz 1H NMR of Man9GlcNAc2Asn. Spectra taken with a 1 mM sample in D2O. The numbers and letters in the spectrum correspond to the monosaccharide residues in the structure. A large signal corresponding to the unexchanged proton of HOD can be seen at 4.7 ppm.
Man9GlcNAc2Asn Tyrosine Analogs
We have previously developed N-glycans for receptor targeting in non-viral gene
delivery by incorporation of tyrosine.120 The phenyl group confers absorption at 280 nm
and provides a site for 125I iodination; which facilitates in vivo biodistribution studies.
When a Boc-protected tyrosine is used and Boc is removed, the 1° amine can be further
derivatized, typically with a peptide which will condense DNA. In past years the
laboratory has produced tyrosinamide Man9 from Man9GlcNAc2 obtained through
preparative hydrazinolysis of semi purified SBA.119 The tyrosinamide Man9 analogs in
the following pages were produced through a more efficient process, from affinity
58
purified SBA and enzymatically released Man9GlcNAc2Asn. Additionally, no HPLC
purification was employed, and the products were isolated via low pressure gel filtration
chromatography.
Boc-protected Man9GlcNAc2Asn Tyrosine was prepared by reaction of
Man9GlcNAc2Asn and a 10-fold excess of Boc-Tyrosine N-hydroxysuccinimide. After
the reaction was complete, the product was isolated with a Sephadex G-25 column, which
sufficiently separated the derivatized product from excess reagent (Figure 3-6). The
eluting Boc-Man9GlcNAc2Asn-Tyr fractions were pooled, concentrated, and freeze dried
prior to analysis by NMR and HPLC-MS. The upfield signals coming from the Boc
group can be clearly seen. Two doublets in the aromatic region resulting from tyrosine
are visible as well (Figure 3-7). The de-protected Man9 was prepared in water and
analyzed as described above. The loss of Boc resulted in a loss of 100 mass units and a
distinct 13 min shift in retention time on the LC-MS chromatogram, as the compound
became distinctly more hydrophilic (Figure 3-8).
Elution Volume (mL)50 100 150 200 250 300
Abso
rban
ce 2
80 n
m Boc-Man9GlcNAc2Asn-Tyr
Figure 3-6. Gel Filtration Purification of Boc-Man9GlcNAc2Asn-Tyr. The reaction mixture was loaded onto a gel filtration column containing Sephadex G-25 resin and eluted with 0.1% acetic acid. The Man9 tyrosinamide was separated from the excess Boc-tyrosine-NHS reagent.
59
O
NHCOCH3
HNO
HO
O
NHCOCH3
OHO
O
OOH
OHO
O
OO
OOH
O
HOOH
OHO
OHO
HOOH
O
OHO
HOOH
HO
HO
O
O
HOHO
OOH
O
HOHO
OHO
HO
OH
OH
OH
OOH
OH
HOHO
OH OH
HN
OH
O
O
NHH
HO O
O
1H NMR Boc-Man9GlcNAc2Asn-Tyr
1A
D2
D3
D1 C
4
2
Tyr
3
B
4’
1
2
Boc
1
D1 D2 D3B
C
A
bulk region
Figure 3-7 600 MHz 1H NMR of Boc-Man9GlcNAc2Asn. Spectra taken with a 1 mM sample in D2O. The numbers and letters in the spectrum correspond to the monosaccharide residues in the structure. HOD was suppressed. The shift equivalent signals corresponding to the methyl protons of the Boc group are seen furthest upfield. The pair of doublets from tyrosine’s phenyl ring appear downfield in the aromatic region. The ‘1’ and ‘2’ signals immediately downfield of Boc correspond to the protons on the N-acetyl groups.
Figure 3-8. Characterization of Man9GlcNAc2Asn Tyrosinamide Analogs. The Boc protected and de-protected compounds were analyzed by HPLC on a 1-30% ACN in 0.1% TFA gradient over 30 mins, and infused into an in-line ESI-MS detecting in negative mode.
61
Synthesis of the 6-(Acridin-9-ylamino)-hexanoic acid 2,5-
dioxo-pyrrolidin-1-yl-ester
To investigate a novel method of reversibly attaching Man9 to plasmid DNA, we
began by attaching a single acridine to the N-glycan. This was accomplished by first
synthesizing the 6-(9-Acridinylamino)-hexanoic acid ester.
The synthetic procedure described by Karup et. al.116, 121 was followed to produce
the acid, as indicated below (Scheme 3-1). Subsequent activation of the acid to the NHS
ester was accomplished with DCC. Proton NMR was used to characterize the 9-
phenoxyacridine and 6-(9-Acridinylamino)-hexanoic acid intermediates (Figure 3-9).
The six aromatic signals seen in the 9-phenoxyacridine spectrum were essentially the
same as those recorded in the literature. Likewise, the chemical shifts seen in 6-(9-
Acridinylamino)-hexanoic acid spectra matched the literature, although minor impurities
were present (Table 3-1).
N N
N
Cl O
HNOH
O
HO
O
NH2
N
HNO
O
NOO
PhenolNaOH(s)100°C 1.5 h +
95%
95-110°C 4 h
NHSDCC24 h
94%
Scheme 3-1 Synthesis of the Acridine Ester. The literature procedure of Karup et. al. was adopted to make 6-(9-Acridinylamino)-hexanoic acid. The acid was converted into the ester with DCC.
62
N
O
9-Phenoxyacridine
N
HNOH
O
6-(9-Acridinylamino)-hexanoic acid
Figure 3-9. 300 MHz 1H NMR Characterization of 9-Phenoxyacridine and 6-(Acridin-9-ylamino)-hexanoic acid. Phenoxyacridine in DMSO-d6 , Acridine acid in CF3CO2D.
Table 3-1. 300 MHz 1H NMR Chemical Shift Data for 9-Phenoxyacridne and 6-(Acridin-9-ylamino)-hexanoic acid
9-Phenoxyacridine (3 nmol) was prepared in methanol and analyzed with a 30
min 30-60% acetonitrile in 0.1% TFA gradient (Figure 3-10). The compound was
monitored at 280 nm, but was also visible at 409 nm. The four phenyl rings in the
structure confer hydrophobicity, and it elutes at approximately 40% acetonitrile under
these gradient conditions. The synthesized 9-phenoxyacridine was 86% pure without
silica purification, and was used directly to synthesize the 6-(9-Acridinylamino)-hexanoic
acid.
6-(9-Acridinylamino)-hexanoic acid (2 nmol) and 6-(9-Acridinylamino)-hexanoic
ester (2 nmol) were prepared in DMF and analyzed with a 30 min 15-45% acetonitrile in
0.1% TFA gradient (Figure 3-11). These compounds were also analyzed without
purification, and were 99% and 83% pure, respectively. Conversion of the acid
functional group to the more hydrophobic ester moiety resulted in a five minute shift in
retention time.
64
Retention Time (min)5 10 15 20 25 30
Abs
orba
nce
280
nm
9-Phenoxyacridine
Figure 3-10. RP-HPLC of 9-Phenoxyacridine. A 3 nmol sample of 9-phenoxyacridine was analyzed with a 30-60% ACN in 0.1% TFA 30 min gradient.
Retention time (min)0 5 10 15 20 25
Abs
orba
nce
409
nm
Acr-Ester
Acr-Acid
Figure 3-11. RP-HPLC Characterization of Acridine Acid and Acridine Ester. Acridine acid (2 nmol) and acridine ester (2 nmol) were analyzed on a 30 min 15-45% ACN in 0.1% TFA 30 min gradient. The conversion of the acid moiety to more hydrophobic ester results in an increase in retention time.
65
Synthesis of the Man9GlcNAc2Asn Acridine Analogs
Two Man9 Acridine compounds were made with the acridine ester. The first
compound was Man9GlcNAc2Asn directly derivatized with the acridine ester. The
second was Man9GlcNAc2Asn-Tyr derivatized with the ester. In both reactions, a 10-fold
excess of the ester was used, and the product was purified by gravity-fed gel-filtration
chromatography (Figure 3-12). However, additional preparative HPLC purification was
employed for the Man9GlcNAc2Asn-TyrAcr.
Both compounds were analyzed by HPLC on 30 min 1-30% acetonitrile in 0.1%
TFA gradients and characterized by ESI-MS in the negative mode (Figure 3-13 and 3-
14). Each displayed an observed mass which was within 1 mass unit of the calculated
mass. The derivatized glycans were also analyzed by high field nmr, and characteristic
anomeric proton shifts were noted (figs. 3-13 and 3-14).
B
75 150 225 300 375 450
Elution vol (ml)75 150 225 300 375 450
Abs
orba
nce
280
nm
AMan9GlcNAc2Asn-Acr
Man9GlcNAc2Asn-TyrAcr
Figure 3-12. Gel Filtration Purification of Man9GlcNAc2Asn-Acr and Man9GlcNAc2Asn-TyrAcr. For each analog, the reaction mixture was loaded onto a gel filration column containing sephadex G-25 resin and eluted with 0.1% acetic acid. The derivatized glycan is separated from excess Acr-NHS reagent. A. The Man9GlcNAc2Asn-Acr had an unusal elution profile, however the entire 100 ml elution volume was collected. B. The Man9GlcNAc2Asn-TyrAcr eluted from the column in 50 ml.
Figure 3-13. RP-HPLC ESI-MS and 600 MHz 1H NMR Characterization of Man9GlcNAc2Asn-Acr. Man9GlcNAc2Asn-Acr (2 nmol) was injected on a 30 min 1-30% acetonitrile in 0.1% TFA gradient and analyzed by ESI-MS in the negative mode. A 0.8 mM sample in D2O was analyzed by NMR. The aromatic signals from the acridine moiety appear downfield between 7.4 and 8.4 ppm. The distortion which appears is likely due to the anisotropic effect of the interaction between the rings and the neighboring methylene protons.
Figure 3-14. RP-HPLC ESI and 600 MHz 1H NMR Characterization of Man9GlcNAc2Asn-TyrAcr. Man9GlcNAc2Asn-Acr (2 nmol) was injected on a 30 min 1-30% acetonitrile in 0.1% TFA gradient and analyzed by ESI-MS in the negative mode. A 0.8 mM sample in D2O was analyzed by NMR. The aromatic signals arising from tyrosine and acridine are seen downfield.
68
Man9 Bioconjugate–Plasmid DNA Binding: The Band Shift
Assay
The affinity of Man9GlcNAc2Asn-Acr for plasmid DNA was assayed by a band
retardation assay on 0.1% agarose gel (Figure 3-15). The migration of plasmid DNA was
compared with DNA containing Man9GlcNAc2Asn-Acr. Intercalated Man9GlcNAc2Asn-
Acr inhibits plasmid migration. The samples are analyzed after electrophoresis by
soaking the gel in an Ethidium bromide solution. Ethidium bromide intercalates into
DNA and can be visualized under a UV lightsource. In the control sample, (lane 7), the
supercoiled and circular forms of the plasmid are visible as the lowest two bands. Minor
impurities are also visible as faint bands. The migration of the bioconjugate-DNA
polyplex through the gel was never totally retarded, even at the highest stoichiometry
tested. This result led to the development of a second generation of bioconjugate with
higher affinity for DNA.
1 2 3 4 5 6 7
sc →
cr →
Figure 3-15. Man9GlcNAc2Asn-Acr – Plasmid DNA Band Shift Assay. 0.6 μg of SEAP plasmid was incubated with the Man9 bioconjugate and assayed at the following levels: Lane 1:0.03 nmol, 2: 0.32 nmol, 3: 3 nmol, 4: 8 nmol, 5: 16 nmol, 6: 32 nmol, 7: no bioconjugate. cr: circular plasmid, sc: supercoiled plasmid
69
Discussion
Two novel Man9GlcNAc2Asn-Acridine analogs were prepared through the
application of literature procedure and classical medicinal chemistry synthetic strategy.
Affinity purified soybean agglutinin was digested with Pronase, and the
Man9GlcNAc2Asn glycan of interest was separated from contaminating digested amino
acids by gel filtration and ion exchange chromatography. This particular strategy for
isolating the glycan is currently the most efficient by far, as organic synthetic strategies
have been unsuccessful in producing glycans with the correct structure, and
hydrazinoysis of the purified glycan requires re-N-acetylation and additional purification.
We investigated acridine with the intent of replacing lysine as the DNA binding
agent in our non-viral gene delivery systems. Acridine contains the planar, aromatic
fused ring system common to nucleic acid intercalators. 9-Chloracridine starting material
was available from commercial sources, and the chemistry to make 6-(Acridin-9-
ylamino)-hexanoic acid was straightforward. The NHS ester of the acid was made
through traditional DCC coupling, providing a facile reagent for nucleophilic addition.
Man9GlcNAc2Asn could be directly coupled to the acridine ester through the N-
terminal amine of asparagine; this was the first compound made. An analog was made by
derivatizing the Man9GlcNAc2Asn with a Boc-tyrosine-NHS, and removing the boc
group with TFA. The limiting feature of this strategy was the additional derivatization
reaction and gel filtration procedure, and the precarious acid deprotection. Excess water
or reaction time hydrolyzed mannose monomer from the glycan.
Man9GlcNAc2Asn-Acr was a promising compound, requiring relatively simple
purification and synthesis to produce it. However, it showed weak affinity for plasmid
DNA, based on the stoichiometry required to produce plasmid retardation in an agarose
gel band shift assay. This result prompted the development of a bioconjugate with higher
affinity for DNA, the Man9 glycopeptide described in the following chapter.
70
CHAPTER 4
SYNTHESIS OF AN ACRIDINYLATED HIGH MANNOSE
TARGETING LIGAND
Introduction
Our investigation into the synthesis of an acridinylated high mannose targeting
ligand began with experimentation on a model compound, triantennary-cysteine-lysine4.
We knew that a glycan derivatized with a single acridine had weak affinity for DNA, so
our plan was to derivatize the four lysines on our model compound with four acridines.
The derivatization proved problematic however; the reaction was often incomplete, and
purification, recovery, and analysis of the compound was difficult.
One possible solution lay in the acridinylation of the epsilon amine of lysine and
the synthesis of a cysteine-bearing acridine-lysine peptide for conjugation to the glycan.
This would allow for versatility and control over peptide length, spacing between
acridinylated lysine residues, and other variables which can be manipulated via solid-
phase peptide synthesis. A literature search revealed the work Ueyama et. al.55, who
synthesized a series of similar polyacridinylated-lysine peptides in 2001. The short
supplement that was submitted did not contain any information pertaining to the synthesis
of the acridinylated-lysine amino acid, but molar absorptivity and binding constant data
for polyacridinylated lysine peptides of varying length were included in the paper.
In 1992, Tung et al. published the synthesis of a polyacridinylated-lysine peptide
for analyzing protease activity. 122 This report did contain a synthetic procedure for the
acridinylation of lysine, which was similar to our method for the derivatization of 6-
aminohexanoic acid (Scheme 3-1). Based on this, Tung’s procedure was adapted and
modified slightly to improve the reaction yield, and a polyacridinylated lysine peptide
was synthesized on solid phase. A Man9 analog containing a tyrosine and a Maleimide
71
group was then synthesized, and the analog was then coupled to the peptide to create the
Man9Ac-Lys glycopeptide.
Materials and Methods
Solid phenol was a Riedel-de-Haën product through Sigma-Aldrich. The sodium
hydroxide pellets were a Mallinckrodt product through Fisher Scientific. The anhydrous
ethyl ether was a Fisher product. Fmoc-Lys-OH was from Novabiochem. NMR spectra
were taken with a 300 MHz Bruker NMR. All reagents were certified ACS grade,
hexafluoro-phosphate (HBTU) and Hydroxybenzotriazole hydrate (HOBt) were from
Advanced ChemTech. The synthesized N- α-Fmoc-N-ε-9-Acridinyl-Lysine (KAc) was
used as the third amino acid monomer. Diisopropylethylamine, piperidine,
triisopropylsilane (TIS), and acetic anhydride were from Sigma-Aldrich. N’,N-
Dimethylformamide (DMF) was from Amresco. The APEX 396 solid phase peptide
synthesizer was an Advanced Chemtech product, the preparatory HPLC system consisted
of a model 2350 gradient programmer, pump, and V4 wavelength detector from ISCO
Inc., with a semipreparative C18 column (2 x 25 cm) from GraceVydac. The analytical
HPLC system was an Agilent 1100 series with a GraceVydac C18 column (0.46 x 25 cm)
and an inline 1100 series LC/MSD trap.
3-Maleimidoproprionic acid N-hydroxysuccinimide ester was from ABD
Bioquest, Inc. The Boc-Man9GlcNAc2Asn-Tyr was synthesized previously (Chapter 4),
N,N-Dimethylformamide (DMF) was from Amresco, Inc, and the sodium bicarbonate
was a Fisher Scientific product. An ISCO UA-6 UV/VIS detector and Type 12 optical
unit were used to monitor the eluate during gel filtration chromatography. An ISCO
HPLC system with a Vydac C18 column (0.46 x 25 cm), model 2360 gradient
72
programmer, model 2350 pump, V4 absorbance detector was used for additional
purification. The freeze dry system was a Labconco Freezone 4.5 with a centrivap
concentration accessory.
The 0.1% agarose gel was made with agarose from GIBCO, Tris and Boric acid
from Fisher Scientific, and EDTA from Sigma-Aldrich. pGL3 plasmid was obtained
from the Promega corporation. The Ethidium bromide stock solution was from Bio-Rad.
Thiazole Orange and HEPES were from Sigma Aldrich, pGL3 plasmid was from
the Promega corp., and the fluorimeter was a Perkin Elmer model LS50B.
Synthesis of N-α-Fmoc-N-ε-9-Acridinyl-Lysine
9-phenoxyacridine (3.0 g)(synthesis described in Chapter 3) was added to 6.78 g
of phenol and liquefied with stirring under argon at 50°C. Fmoc-Lys-OH (2.18 g) was
added, and the reaction was run at 50-60°C for 4 hr. Heating was discontinued, and 80
ml of diethyl ether was added with vigorous stirring. The yellow precipitate that formed
was recovered by filtration and washed thoroughly with diethyl ether. The product was
then dried overnight under vacuum. The reaction yielded 2.90 g (90%) N- α-Fmoc-N-ε-
9-Acridinyl-Lysine which had a m.p. of 135-136°C. (300 MHz, DMSO-d6): δ = 6.70 –
8.70 (17H, m, Har), 3.60 - 3.95 (2H, m), 3.25 – 3.55 (3H, br), 2.06 (1H, m), 0.80 – 1.50
(6H, m).
Synthesis of Polyacridine-Lysine Peptide
The nine amino acid peptide C-KAc-K-KAc-K-KAc-K-KAc-K was synthesized using
standard Fmoc chemistry with HOBt and HBTU double coupling on 30 μmol scale with
an APEX 396 Advanced ChemTech solid phase peptide synthesizer. The peptide was
removed from the resin and deprotected with a 2 ml cleavage cocktail consisting of
TFA/TIS/H2O (95:2.5:2.5 v/v/v) for 3 hr followed by precipitation in 40 ml cold ether.
The precipitate was collected by centrifugation at 4 000 rpm for 10 min, then
reconstituted in 0.1 v/v % TFA and purified by preparatory HPLC with a 16-30% ACN in
73
0.1% TFA 45 min gradient. The peptide was quantified by UV/VIS with an ε409 nm = 37,
064 M-1 cm-1 for a 17% (2.0 μmol) yield. Purity and identity were verified by RP-HPLC
MS with a 15-30% ACN in 0.1% TFA 30 min gradient detecting in positive mode.
Synthesis of Man9GlcNAc2Asn-Tyrosine Maleimide
Boc-Man9GlcNAc2Asn-Tyr (250 nmol) was dried by centrivap concentration and
the boc group was removed by the addition of 100 μl of 95% TFA for 5 min The reaction
was frozen on dry ice and the product was dried by centrivap concentration. The glycan
was then brought into 300 μl of 100 mM sodium bicarbonate. 3-maleimidoproprionic
acid NHS ester (2.5 μmol) was brought into 125 μl DMF and added to the
Man9GlcNAc2Asn. The reaction continued for 1 hr followed by separation from excess
derivatizing reagent on a Sephadex G-25 column (1.5 x 50 cm), eluting with 0.1% acetic
acid. The reaction yield was determined by absorbance by monitoring tyrosine (ε274 nm =
1 400 M-1 cm-1). RP-HPLC analysis showed minor impurities, so the derivatized glycan
was purified with the same system on a 1-15% ACN in 0.1% TFA 30 min gradient. The
Man9Asn-Tyr Mal was assayed for purity and identity by RP-HPLC ESI-MS, on a 30
min 1-30% acetonitrile gradient in 0.1% TFA with ESI-MS detection in the negative
mode. The recovery of Man9GlcNAc2Asn-Tyr Mal was 57 nmol, a 23% yield.
Synthesis of the Man9-AcrLys Glycopeptide
Man9GlcNAc2Asn-Tyr Mal (435 nmol) and polyacridine lysine peptide (539
nmol) were dried by centrivap. The derivatized glycan was prepared in 435 μl of 5 mM
HEPES pH 7.0 and added to the dry peptide. The reaction continued for 2 hr and was
purified from excess dimeric peptide by RP-HPLC with a 30 min 15-30% acetonitrile
gradient in 0.1% TFA. The purity and identity were verified by analytical RP-HPLC
ESI-MS in positive mode. A secondary analysis was performed by MALDI-TOF. The
recovery of Man9-AcrLys Glycopeptide was 102 nmol, for a 23% yield.
74
Man9-AcrLys Glycopeptide : DNA Binding: The Band
Shift Assay
Four experimental samples were made by mixing 1 μg of the plasmid with
0.054, 0.216, 0.532, and 1.064 nmol Man9-AcrLys Glycopeptide. Each sample was
incubated for 30 min before loading into the agarose gel. A plasmid control was run
beside the experimental compounds. The samples were run under an 80V electric field
for 60 min. The gel was stained overnight with 200 ml 0.1 μg/μl ethidium bromide.
Acridine : DNA Binding: The Thiazole Orange
Displacement Assay
A 40 nM thiazole orange solution containing 1 μg plasmid was made with 5 mM
HEPES buffer, pH 7.4. Man9-Ac was titrated into solution and thiazole orange
fluorescence was recorded after 30 min of incubation. The final volume of the samples
for analysis was 500 μl. Triplicate measurements were taken with 0.2, 0.3, 0.4, 1, 5 and
10 nmol compound, with excitation at 500 nm and emission at 530 nm. Man9-AcrLys
was assayed by the same procedure; triplicate measurements were made with 0.2, 0.3,
0.4, 0.5, 1 and 2 nmol of the bioconjugate.
Results
Synthesis of N-α-Fmoc-N-ε-9-Acridinyl-Lysine
An acridinylated lysine derivative for use in peptide chemistry was made, as in
Tung et. al. (Scheme 4-1).122 9-phenoxyacridine was added to solid phenol and liquefied
with stirring at 50°C. Fmoc-Lys-OH was then added and the reaction continued for 4 hr.
The heat source was removed and diethyl ether was added with vigorous stirring. The
derivatized amino acid precipitated out of solution and was recovered by filtration. The
N-α-Fmoc-N-ε-9-Acridinyl-lysine was then washed thoroughly with diethyl ether and
dried under vacuum.
75
The amino acid was analyzed for purity and structural identity by NMR, HPLC,
and ESI-MS. The signals in the 1H NMR spectra were in agreement with the literature
(Table 4-1).122 The N-α-Fmoc-N-ε-9-Acridinyl-Lysine was prepared in 1:1 methanol : 1
N HCl and analyzed by RP-HPLC with a 30 min 30-60% acetonitrile in 0.1% TFA
gradient with detection in the negative mode. The compound was 94% pure, and the
observed mass was within one mass unit of the calculated mass. Interestingly, the
dimeric anionic species was also detected (Figure 4-1).
N
O
NH
HO
O
H2N
O
O
NH
HO
O
HN
O
O
N
+ Phenol50°C 4 h
Scheme 4-1. Synthesis of N-α-Fmoc-N-ε-9-Acridinyl-Lysine. An acridinylated lysine derivatve was made for solid phase peptide synthesis with Fmoc chemistry.
1H NMR δ
N-α-Fmoc-N-ε-9-Acridinyl-Lysine 6.70 – 7.80 (17H, m, Har), 3.60 – 3.95 (2H, m), 3.25 – 3.55 (3H, br), 2.06 (1H,
m), 0.80 – 1.50 (6H, m)
Table 4-1. 300 MHz 1H NMR Chemical Shift Data for N-α-Fmoc-N-ε-9-Acridinyl-Lysine
Figure 4-1. RP-HPLC ESI-MS of N-α-Fmoc-N-ε-9-Acridinyl-Lysine. A 2 nmol sample of N-α-Fmoc-N-ε-9-Acridinyl lysine in MeOH/1 N HCl was injected on a 30 minute 30-60% acetonitrile in 0.1% TFA. The singly charged species was detected by ESI-MS in the negative mode. The amino acid also ionized as a dimer and was detected.
Synthesis of Polyacridine Lysine Peptide
A nine amino acid peptide C-KAc-K-KAc-K-KAc-K-KAc-K was synthesized with a
cysteine residue to conjugate to Man9GlcNAc2Asn-Tyr Mal (Scheme 4-2). This
particular peptide was designed to have high affinity for DNA (four lysine-acridines
amino acids) and to be synthesized efficiently (nine amino acids total). Lysine was
selected as a spacing amino acid because it is cationic, and produces higher yields after
work-up than do arginine-containing peptides. The derivatized lysine analog N-α-Fmoc-
N-ε-9-Acridinyl lysine was used directly in solid phase peptide synthesis of the
77
polyacridine lysine peptide. The peptide was prepared on a 30 μmol scale with a crude
yield of 11.7 μmol (40%) and a 2.0 μmol (17%) purified yield. It had a tendency to form
a disulfide bond, and as a result had to be stored at low concentration in 0.1% TFA (-
20°C), or in a crude mixture with an excess of TCEP (tris(2-carboxyethyl)phosphine).
The Ac-Lys peptide was analyzed for purity and identity by RP-HPLC ESI-MS. The
compound was prepared in 0.1% TFA and injected on a 30 min 15-30% acetonitrile in
0.1% TFA gradient with detection in the positive mode (Figure 4-2). It was 97% pure,
and the observed mass was within 1 mass unit of the calculated mass.
HNO
O
OH
O
HN
O
O
HN
S
O
OHO
O
N
HN
OH
ONH
O
O
H2N
HS
NH
O
HN
N
HN
O
NH2
NH
O
HN
HN
O
NH2
NH
O
HN
HN
O
NH2
NH
O
HN
HN
O
NH2
OH
O
N N N
Scheme 4-2. Polyacridine Lysine Peptide. The peptide was synthesized on Wang resin using Fmoc chemistry with an automated synthesizer
Figure 4-2. Preparative Purification of Polyacridine-Lysine Peptide. A. The 30 μmol synthesis yielded 11.7 μmol (40%) crude peptide 2 μmol (17%) purified peptide. B. 1 nmol of the purified compound was injected on a 30 min 15-30% acetonitrile in 0.1% TFA gradient with detection in the positive mode.
79
Synthesis of Man9GlcNAc2Asn-Tyrosine Maleimide
Removal of the Boc group from Boc-Man9GlcNAc2Asn-Tyr proceeded smoothly
and to 100% completion with 95% TFA as evidenced by change in retention time on RP-
HPLC from 19 min to 6 min The TFA was removed by evacuation and the amine
terminus of the tyrosine was derivatized by the addition of an active ester (Scheme 4-3).
The high molecular weight glycopeptide product was easily resolved from the excess
reagent (Figure 4-3), and this reaction also proceeded to completion as determined by a
shift in retention time to 13 min (Figure 4-4). The Man9GlcNAc2Asn-Tyr Mal was
analyzed with a 30 min 1-30% acetonitrile in 0.1% TFA gradient with ESI-MS detection
in the negative mode. The observed mass of the major product was approximately 2
mass units greater than the calculated mass of Man9GlcNAc2Asn-Tyr Mal.
O
NHCOCH3
HNO
HO
O
NHCOCH3
OHO
O
OOH
OHO
O
OO
OOH
O
HOOH
OHO
OHO
HOOH
OO
HO
HOOH
HO
HO
O
O
HOHO
OOH
O
HOHO
OHO
HOOH
OH
OH
OOHOH
HOHO
OH OH
HN
OH
O
O
NH
O
N
O
O
HHO
HN
O HN
OH
O
O
NH2H
HO
Man9 GlcNAc2
N O
O
NO
O
O
O
DMF, 1 hr
Man9GlcNAc2Asn-Tyr Maleimide
Scheme 4-3. Man9GlcNAc2Asn-Tyr Maleimide. Boc-Man9GlcNAc2Asn-Tyr was deprotected, dried, and directly derivatized with an NHS ester-maleimido derivative of proprionic acid.
80
Elution vol (mL)
20 40 60 80 100 120
Abso
rban
ce 2
80 n
m
Man9Asn-Tyr Mal
Figure 4-3. Gel Filtration Purification of Man9GlcNAc2Asn-Tyr Mal. The reaction mixture was loaded onto a gel filtration column containing Sephadex G-25 resin and eluted with 0.1% acetic acid. The derivatized glycan was separated from excess 3-maleimidoproprionic acid NHS reagent.
Figure 4-4. RP-HPLC ESI-MS of Man9GlcNAc2Asn-Tyr Mal. 4 nmol of the prepped sample was analyzed with a 1-30% acetonitrile in 0.1% TFA gradient with ESI-MS detection in the negative mode.
81
Synthesis of the Man9-AcrLys Glycopeptide
The reaction of Man9Asn Tyr-Mal with the polyacridine lysine peptide was
optimized by varying the pH and stoichiometry of the reactants. The optimal pH (7.0)
and reaction stoichiometry of 1.2:1 mol equivalents of peptide : Man9Asn Tyr-Mal
resulted in complete consumption of Man9Asn Tyr-Mal and formation of the desired
product (Scheme 4-4). Excess peptide formed a disulfide and eluted later during RP-
HPLC. The purified products rechromatographed as a single product peak of > 95%
purity with a mass of 4167 g/mol as determined by ESI-MS (Figure 4-5).
H2N
HS
NH
O
HN
N
HN
O
NH2
NH
O
HN
HN
O
NH2
NH
O
HN
HN
O
NH2
NH
O
HN
HN
O
NH2
OH
O
N N N
HN
O HN
OH
O
O
NH
O
N
O
O
HHO
Man9 GlcNAc2
HN
O HN
OH
O
O
NH
O
N
O
O
HHO
Man9 GlcNAc2
H2NNH
O
S
(CH2)4
NH
N
HN
O (CH2)4
NH2
OH
O
4
5 mM HEPES pH 7.02 hr
Polyacridine Lysine peptide
Man9-AcrLys Glycopeptide
Man9Asn Tyr-Mal
Scheme 4-4. Synthesis of the Man9-AcrLys Glycopeptide. Polyacridine lysine peptide was reacted with Man9Asn Tyr-Mal at a 1.2:1 ratio in 5 mM HEPES at pH 7.0 for 2 hrs.
Figure 4-5. RP-HPLC ESI-MS Analysis of Man9-AcrLys Glycopeptide. 400 pmol of Man9-AcrLys Glycopeptide was analyzed with a 30 min 1-30% ACN gradient in 0.1% TFA. The compound was observed in the triply-charged state by ESI-MS, with detection in the positive mode.
83
Man9-AcrLys Glycopeptide : DNA Binding Band Shift
Assay
The affinity of the Man9-AcrLys Glycopeptide for plasmid DNA was assayed by
a band retardation assay on 0.1% agarose gel. In the control sample, (lane 1), the
supercoiled and circular forms of the plasmid are visible as the lowest two bands. Minor
impurities are also visible as faint bands. Four samples were analyzed with an increasing
bioconjugate : plasmid ratio. At a ratio of 1 nmol bioconjugate : 1 μg plasmid, migration
of the polyplex was completely arrested at the origin (Figure 4-6). The binding affinity
of this glycopeptide for DNA was found to be significantly higher than the glycopeptide
possessing a single acridine (Figure 3-15).
1 3 5 7 9
cr
sc
Figure 4-6. Man9-AcrLys Glycopeptide:DNA Binding: The Band Shift Assay. 1 μg pGL3 plasmid was incubated with Man9-AcrLys Glycopeptide and assayed at the following levels: Lane 3: 0.054 nmol, 5: 0.216 nmol, 7: 0.532 nmol, 9: 1.064 nmol. Lane 1 : 1 μg pGL3. cr: circular plasmid, sc: supercoiled plasmid
Figure 4-7. Thiazole Orange Displacement Assay. The affinities of the Man9-AcrLys Glycopeptide and Man9-Acr for plasmid DNA were assayed by the fluorescence-based thiazole orange displacement assay.
85
Discussion
The high mannose targeting ligand described in the current chapter is a significant
improvement over the high mannose ligand presented in the previous chapter due to its
higher affinity for plasmid DNA. The poly-acridinylated peptide anchor intercalates
between DNA’s base pairs, and the lysine-spacer amino acids provide additional
electrostatic binding force. This is a much stronger interaction than that provided by the
single acridine heterocycle of the Man9GlcNAc2Asn-Acr.
The comparative binding affinities of the two compounds were demonstrated by
agarose gel band-shift assay and by the thiazole orange displacement assay. The band
shift assay showed strong plasmid to Man9-AcrLys Glycopeptide binding at less than 1
nmol per microgram plasmid (Figure 4-6). Whereas at 32 nmol Man9GlcNAc2Asn-Acr
to 1 microgram plasmid, the derivatized glycan was still only weakly bound, as
evidenced by the very slight band shift (Figure 3-15). The thiazole orange displacement
assay revealed a similar result: thiazole orange was displaced from plasmid DNA at less
than 1 nmol per microgram plasmid, quenching thiazole’s fluorescence, whereas 10 nmol
Man9GlcNAc2Asn-Acr was not sufficient to displace 1 microgram of plasmid (Figure 4-
5).
It is also important to consider whether the synthesis of the compound is efficient
and practical. The source of glycan, soy flour is inexpensive and available in large
quantity, and the glycoprotein can be isolated easily and in reproducible fashion through
a reusable affinity column. The most expensive component of the purification is the
pronase enzyme, which is not prohibitively costly. The tyrosine label and proprionic acid
maleimido NHS ester are inexpensive small molecules. The acridine-lysine peptide 9-
mer is only slightly more expensive to synthesize than an ordinary nine amino acid
peptide, due to the four acridinylated lysines. However, the phenoxyacridine and
resulting acridinylated lysine can be produced relatively cheaply and loaded directly into
the peptide synthesizer without additional purification. The glycopeptide is quickly
86
formed as the thiol of the peptide attacks the maleimide of the derivatized glycan, and the
product is purified by RP-HPLC.
87
CHAPTER 5
IN VITRO TESTING AND ANALYSIS OF THE HIGH MANNOSE
TARGETING LIGAND WITH DC-SIGN CHO CELLS
Introduction
Perhaps the most important phase of this research project was the biological
evaluation of the high mannose targeting ligand. A relevant and practical system was
required for testing, and positive results were needed to validate the synthetic effort to
produce the ligand. We obtained a cell line from Dr. Chae Gyu Park, a member of the
Laboratory of Cellular Immunology and Physiology at the Rockefeller University. The
cells were immortal Chinese hamster ovary cells (CHO) engineered to stably express
recombinant human DC-SIGN receptor. We also received control CHO cells which did
not express receptor. The laboratory is well renowned for dendritic cell research; the
principal investigator, Dr. Ralph Steinman, co-discovered dendritic cells in 1973.
With the cells in hand, the next task was to show selective targeting and
preferential gene delivery to the DC-SIGN using the glycopeptide ligand. We have
routine gene delivery assays in our laboratory which employ quantification of expressed
luciferase reporter gene, however our supply of ligand was somewhat limited. To
compensate we scaled the amount of plasmid used in the assay down to one tenth of the
typical quantity, and were still able to elicit significant gene expression.
In order to further establish that selective gene delivery was a receptor dependent
phenomenon, I employed FACS analysis. I transfected the CHO cells with pGL3 which
had been covalently labeled with a fluorophore, and confirmed preferential endocytosis
into the DC-SIGN positive cells.
Materials and Methods
Human DC-SIGN (+) and DC-SIGN (-) CHO cells were a gift from Dr. Chae Gyu
Park of the Laboratory of Cellular Immunology and Physiology at The Rockefeller
88
University. CyTM5 LabelIT was from Mirus Biotechnology. The Becton Dickson LSR II
with DiVA 6.01 software was used for analyzing CHO cell populations. Cy5 data was
obtained with 488 nm excitation and 575 nm emission. Phycoerythrin data was obtained
with 633 nm excitation and 670 nm emission. FACS data was prepared with WinMDI
2.8. The Hoechst 33258 stain was an Invitrogen product.
pGL3 control vector, a 5.3 kb luciferase plasmid containing an SV40 promoter
and enhancer, was was obtained from the Promega corporation, amplified in DH5α E coli
from Invitrogen, and purified with a Giga kit from Qiagen. D-Luciferin was from Gold
Biotechnology, Adenosine 5’-triphosphate was from Roche, and BCA Protein Assay
reagents were Pierce protein research products of Thermo Scientific. Polyethylenimine
(PEI) was from Aldrich, Dulbecco’s Modified Eagle Medium (DMEM), MEM non-
μg DNA. For antibody knockdown, 1.75 nmol Man9-AcrLys Glycopeptide was added to
17.5 μg antibody and 3.5 μg DNA in a 5.8 : 1 PBS : HBM solution. The cells were then
91
dosed in triplicate with 30 μL aliquots containing 0.5 nmoL Man9-AcrLys Glycopeptide,
5 μg antibody, and 1 μg DNA.
Results
FACS Analysis
An anti-DC-SIGN antibody-phycoerythrin conjugate was procured to verify
stable expression of the DC-SIGN receptor on the CHO cells. 1 x 10⁶ DC-SIGN (+)
CHO cells were incubated with 2.4 μg antibody conjugate in 1 mL isotonic solution, with
additional Hoechst stain to identify dead cells. 1 x 10⁶ (-) CHO cells were incubated
simultaneously with the same preparation. LSR analysis of the samples revealed
receptor-mediated binding of the antibody conjugate as indicated by the shift in
fluorescence associated with the DC-SIGN (+) CHO cells (Figure 5-1). The overlap
between the cell populations suggests that a percentage of the CHO (+) cells did not
express receptor.
Figure 5-1. Phycoerythrin FACS Analysis of DC-SIGN (+) and (-) CHO cells. Both cell types were incubated with 2.4 μg of antibody-phycoerythrin conjugate and subsequently analyzed.
92
We developed a FACS assay to demonstrate selective receptor binding which
utilized the Man9-AcrLys Glycopeptide. pGL3 plasmid (5 μg) was covalently labeled
with 5 μL Label IT reagent. A particle containing 0.5 nmoL Man9-AcrLys Glycopeptide
and 1 μg Cy5 labeled pGL3 was made and allowed to stand at room temp. for half an
hour (Figure 5-2).
Figure 5-2. Representation of Cy5 labeled glycopeptide condensate. A Cy5 labeled polyplex was made at 0.5 nmoL per microgram DNA, consistent with the stoichiometry used for transfection. Transfected CHO cells were imaged by FACS.
DC-SIGN (+) CHO cells (1 x 10⁶) were plated and transfected with labeled condensate.
CHO (-) cells (1 x 10⁶) were treated in the same way. After overnight transfection the
cells were lifted with 1 mM EDTA in PBS. A two minute centrifugation was used to
pellet the cells and remove the EDTA. Each cell population was then brought into a
milliliter of PBS and analyzed by FACS (Figure 5-3). The histogram shows higher
fluorescence in the (+) CHO cell population due to higher receptor mediated-uptake of
93
the labeled condensate. An overlap between the cell populations treated with ligand is
seen; this suggests that a fraction of the CHO (+) cells did not express receptor.
Figure 5-3. Cy5 FACS Analysis of DC-SIGN (+) and (-) CHO cells. Both cell types were transfected with 0.5 nmol of Man9-AcrLys Glycopeptide and 1 μg of Cy5 labeled pGL3 plasmid. After incubation overnight, the cells were lifted and imaged.
In vitro transfection of CHO Cells
hDC-SIGN (+) CHO cells (1 x 10⁵) were plated in triplicate for four treatment
groups. After incubation for 24 hrs, the media was removed, the cells were washed with
PBS and fresh transfection media was added to the cells. Particles containing pGL3
plasmid and PEI, Trp-Lys18, Acridine-Lysine peptide, or Man9-AcrLys Glycopeptide
were made and dosed in polyplex containing 1 μg DNA and 1.2 μg PEI (9:1 N:P), 1.3 μg
94
WK18 (3:1 K:P), 0.5 nmoL AcLys pep, or 0.5 nmoL Man9-AcrLys Glycopeptide. The
cells were returned to the incubator and kept at 37°C for 24 hr. On the following day the
cells were lysed and centrifuged to separate the cytosolic solution containing expressed
luciferase from cell debris. The solution was combined with a small volume of 165 mM
ATP and placed in a luminometer, where a 0.4 mM solution of luciferin was combined
with the sample to produce a light response proportional to the amount of luciferase
expressed. The experiment was conducted with hDC-SIGN (-) CHO cells
simultaneously. Selective targeting to the DC-SIGN expressing CHO-cells was observed
by the Man9-AcrLys Glycopeptide polyplex, as exhibited by a two log increase in relative
light unit luminescence over control cell levels (Figure 5-4). The PEI positive controls
displayed the highest transfection levels. Transfection with WK18 provided a negative
control. The polyacridine lysine peptide (AcKPep) lacked the glycan which the
bioconjugate (Biocon) contained. Protein levels post-transfection were normalized and
quantified with the BCA assay using bovine serum albumin as a standard (Figure 5-5).
This assay provided a relative measure of toxicity of the compound in the two cell types.
In Vitro Inhibition of Gene Transfer
DC-SIGN (+) CHO cells (1 x 10⁴) were plated in triplicate for four treatment
groups. After incubation for 24 hrs, the media was removed, the cells were washed with
PBS and fresh transfection media was added to the cells. PEI and Man9-AcrLys
Glycopeptide control transfections were conducted as in the gene transfer experiment. In
order to establish receptor-mediated endocytosis as the mechanism for gene transfer, we
tried to reduce endocytosis by including Man9 and antibody to DC-SIGN into the
formulations for transfection. For the Man9 treatment, 175 nmoL of Man9GlcNAc2Asn
Figure 5-4. Luciferase Assay of CHO cell transfection. pGL3 condensates were made with 1 μg plasmid DNA and the follwing transfection reagents: PEI (poly(ethylenimine)), WK18 (tryptophan-lysine18), AcKPep (C-KAc-K-KAc-K- KAc-K- KAc-K), Biocon (Man9-AcrLys Glycopeptide). After transfection and incubation for 24 hr, the cells were lysed and RLU levels were recorded. Luciferase expression from the bioconjugate condensate was 100 fold greater in the DC-SIGN (+) CHO cells than the DC-SIGN (-) CHO cells, indicating receptor mediated uptake.
Figure 5-5. BCA Assay of Protein Levels of PEI, WK18, AcKPep and Bioconjugate. Protein levels were normalized with the BCA assay using bovine serum albumin as a standard. Total protein levels in the DC-SIGN (-) CHO cells varied between 16 and 20 μg, while levels in the (+) cells were between 28 and 32 μg, reflecting a slight difference. Reagents: PEI (poly(ethylenimine)), WK18 (tryptophan-lysine18), AcKPep (C-KAc-K-KAc-K- KAc-K- KAc-K), Biocon (Man9-AcrLys Glycopeptide).
96
was mixed with 1.75 nmoL Man9-AcrLys Glycopeptide. Then 3.5 μg of DNA and HBM
were added to bring the solution to volume. The CHO cells were dosed with 0.5 nmoL
glycopeptide, 50 nmoL glycan, and 1 μg DNA. For the antibody knockdown dose, 17.5
μg antibody, 1.75 nmoL Man9-AcrLys Glycopeptide, 3.5 μg DNA and HBM were
brought into solution. In this case the CHO cells were dosed with 0.5 nmoL
glycopeptide, 5 μg antibody, and 1 μg DNA. We did not observe any reduction in gene
transfer with a 10 fold excess of Man9, and treatment with excess antibody resulted in a
two fold reduction in gene transfer (Figure 5-6). These results indicate a strong
multivalent enhancement of avidity of the glycopeptide-pGL3 polyplex for the DC-SIGN
receptor. Total protein levels were determined by BCA assay and are indicated in Figure
5-7. It may be possible to significantly reduce gene transfer by incubating the CHO cell
population with the blocking agent prior to the addition of the pGL3 polyplex, but we felt
that simultaneous addition would be more representative of the comparative affinity of
the reagents.
PEI(+) Biocon(+) MAN9(+) Abody(+)
RLU
/mg
prot
ein
1e+5
1e+6
1e+7
1e+8
1e+9
1e+10
Figure 5-6. In Vitro Inhibition of Gene Transfer. An excess of Man9GlcNAc2Asn and an excess of antibody to DC-SIGN were included with Man9-AcrLys Glycopeptide in formulation in order to reduce gene transfer. No knockdown was observed with the glycan and treatment with antibody only resulted in a slight decrease. Reagents: PEI (poly(ethylenimine)), Biocon (Man9-AcrLys Glycopeptide), Man9 (Mannose9 GlcNAc2 Asparagine), Abody (antibody to DC-SIGN – phycoerythrin conjugate).
97
PEI(+) Biocon(+) MAN9(+) Abody(+)
mg
prot
ein
0.000
0.002
0.004
0.006
0.008
0.010
Figure 5-7. BCA Assay of Protein Levels of PEI, Bioconjugate, Man9 and Antibody. Protein levels were normalized with the BCA assay using bovine serum albumin as a standard. Reagents: PEI (poly(ethylenimine)), Biocon (Man9-AcrLys Glycopeptide), Man9 (Mannose9 GlcNAc2 Asparagine), Abody (antibody to DC-SIGN – phycoerythrin conjugate).
Discussion
The CHO cell transfection experiments described in this chapter demonstrated
that targeted in-vitro gene delivery to the DC-SIGN receptor with a novel bioconjugate
vector is feasible. Stable polyplex can be formed at a low ligand : plasmid stoichiometry,
and avidity for the DC-SIGN receptor is quite high due to the multivalent effect created
by glycan clustering. The CHO cell system employed was ideal; the experimental cells
stably expressed the DC-SIGN receptor. This was preferable to using commercially
available primary human dendritic cells, as DC-SIGN expression was not guaranteed.
Providing evidence of targeted gene delivery can be very challenging. Haensler
and Szoka103 synthesized a vector targeted to the asialoglycoprotein receptor but did not
observe gene expression from the pCLUC4 plasmid. Their compound contained two
acridines for intercalation into DNA, which it bound with micromolar affinity. It also
contained three galactose residues for receptor binding. The authors felt that the
bioconjugate did not induce gene expression because it lacked a membrane destabilizing
moiety. Our results suggest that this feature may not be necessary for in vitro gene
expression. Targeting primary hepatocytes in culture is complicated by the down
98
regulation of the receptor, 103 although Chiu et al.120 targeted 125I labeled biantennary
oligosaccharide to hepatocytes in vivo, where it must compete with endogenous ligand.
This suggests that natural, complex carbohydrates may be the best ligands for ASGP-R
binding.
The antibody : phycoerythrin conjugate we employed to establish expression of
the DC-SIGN receptor was useful and effective for FACS imaging, however we could
not knockdown bioconjugate binding and luciferase expression. This was most likely
due to our method of co-administration with Man9-AcrLys Glycopeptide. If we had pre-
treated the DC-SIGN (+) CHO cells with the antibody, it might have been easier to bind
and block the receptor.
We transfected CHO cells with Man9-AcrLys Glycopeptide in triplicate in three
separate experiments and consistently saw a two log difference in gene expression which
favored the DC-SIGN (+) cells. This is very strong evidence indicating selective receptor
mediated of the gene delivery vector. We also know that the glycan, not the polyacridine
peptide is essential for binding and transfection because luciferase expression levels for
the bioconjugate are ten times higher than with peptide alone.
The Man9-AcrLys Glycopeptide will be evaluated in vivo in a murine system.
The experiments would be complicated by the multiplicity of mouse DC-SIGN
homologues, and due to the fact the SIGN homologue present on mouse plasmacytoid-
pre dendritic cells (CIRE/mDC-SIGN) does not bind pathogens known to interact with
human DC-SIGN.124 Rather, it is mSIGNR1, expressed on macrophage subgroups in the
lymph node and in liver sinusoid endothelial cells (LSECs),125 which shares antigen
specificity with hDC-SIGN.126 However, in 2007, Kretz-Rommel et. al. demonstrated
effective targeting to DC-SIGN in vivo. 127 The researchers raised Rag2 -/-γ-/- mice with
human immune cells, and induced a T-cell response by administering anti-DC-SIGN
antibody bound to tetanus toxoid peptide or keyhole limpet hemocyanin (KLH). They
99
were also able to inhibit tumor growth in the same system. This is an indication that
targeted gene delivery could be evaluated in a similar type of system.
100
CHAPTER 6
RESEARCH SUMMARY
The preceding pages have described the development and testing of a novel
glycan-targeted gene delivery vector to the dendritic-cell SIGN receptor. These
experiments provide evidence that it is possible, in principle, to express foreign protein in
cells presenting DC-SIGN receptor. This could be utilized in vaccine development, to
prime the immune system against pathogenic protein, which would be transcribed and
translated from plasmids delivered to dendritic cells.
The primary focus of my research is to design and synthesize efficient non-viral
usually contain some type of targeting ligand. As such, my initial research project was to
devise a method for the isolation of Man9GlcNAc2, a high mannose N-glycan we used to
target our vectors to the mannose receptor on kupffer cells in mice. A thorough search of
the literature revealed two related methods for affinity purification of soybean agglutinin,
a natural source of the glycan.106,111 Allen and Neuberger’s method 111 was combined
with Bethel and Ayer’s, 112 and affinity resin for the purification of soybean agglutinin
was made on a large scale.
With multi-gram quantities of pure soybean agglutinin on hand, it was necessary
to devise a means of isolating the glycan from the unwanted protein. A mild, enzymatic
method was preferable to chemical hydrazinolysis, which would require special safety
measures. The glycoprotein proved resistant to digestion with trypsin, and our efforts
with PNGase F and pepsin were also met with failure. We soon turned to Lis and
Sharon’s procedure for pronase digestion, which worked well.118
At this point we began to conceptualize a DNA vector which would function as a
vaccine. Our target would be the dendritic cell SIGN receptor, found on immature
dendritic cells, the primary antigen presenting cell of the immune system. This strategy
mirrors that utilized by a variety of pathogens including HIV, which is one of the most
101
efficient viral vectors in nature.64 We derivatized Man9GlcNAc2Asn on the N-terminus
of asparagine with acridine, a polycyclic aromatic hydrocarbon containing three fused
benzene rings. The Man9GlcNAc2Asn-Acr compound (Figure 3-13) could be used to
non-covalently glycosylate DNA, a novel approach to gene delivery which we termed
Glyco-DNA.
Man9GlcNAc2Asn-Acr could be made readily in sufficient quantity, but testing
revealed that it bound DNA with low affinity (Figure 3-15). The solution to this problem
lay in synthesizing a bioconjugate containing one Man9GlcNAc2Asn and four acridines.
The acridine portion of the compound was made on an automated peptide synthesizer.
An fmoc protected lysine with an acridine on the epsilon amine was made and used in the
synthesis of peptide C-KAc-K-KAc-K-KAc-K-KAc-K (Figure 4-17). Man9GlcNAc2Asn
was derivatized with a maleimido derivative of proprionic acid, and a thioether linkage
was formed between the glycan and the peptide. The Man9-AcrLys Glycopeptide had
much higher affinity for plasmid DNA than Man9GlcNAc2Asn-Acr (Figure 4-5).
I obtained CHO cells stably expressing human DC-SIGN from a collaborator.
CHO cells are more robust and easier to work with than primary cells, and they proved to
be a valuable resource. An antibody-phycoerythrin conjugate was used in FACS analysis
to verify the presence of the receptor (Figure 5-1). The Man9-AcrLys Glycopeptide was
condensed with pGL3 plasmid at a stoichiometry of 0.5 nmol : 1 μg and tested with the
CHO cells in a standard 24 hr transfection assay with the appropriate controls (Figure 5-
4). Luciferase expression was 100 fold higher in the cells expressing receptor than in
control DC-SIGN (-) CHO cells. As an additional experiment to demonstrate receptor
mediated uptake, pGL3 was covalently labeled with Cy5 fluorophore. The CHO cells
were transfected and analyzed by FACS, and higher levels of fluorescence were clearly
seen in the DC-SIGN (+) cell population (Figure 5-3).
As stated earlier, this gene delivery system will be evaluated in vivo. Common
laboratory mice cannot be used for this type of experiment, because the SIGN homologue
102
present on mouse plasmacytoid-pre dendritic cells (CIRE/mDC-SIGN) does not bind
pathogens known to interact with human DC-SIGN.124 This includes HIV, and likely
precludes Man9 as a high affinity ligand. Recently, Kretz-Rommel et. al. demonstrated
effective targeting to DC-SIGN in vivo 127 by raising Rag2 -/-γ-/- mice with human
immune cells, and inducing a T-cell response by administering anti-DC-SIGN antibody
bound to tetanus toxoid peptide or keyhole limpet hemocyanin (KLH). They were also
able to inhibit tumor growth in the same system. It is possible that this type of system
could be used to measure gene delivery and antibody and T-cell response to foreign
protein expression.
103
REFERENCES
1. Robinson HL, Pertmer TM 2000. DNA vaccines for viral infections: basic studies and applications. Advances in virus research 55:1-74.
2. Banchereau J, Steinman RM 1998. Dendritic cells and the control of immunity. Nature 392(6673):245-252.
3. Kukowska-Kaszuba M, Dzierzbicka K 2007. Synthesis and Structure-Activity Studies of Peptide-Acridine/Acridone Conjugates. Current Medicinal Chemistry 14:3079-3104.
4. Sebestik J, Hlavacek J, Stibor I 2007. A role of the 9-aminoacridines and their conjugates in a life science. Current protein & peptide science 8(5):471-483.
5. Demeunynck M, Charmantray F, Martelli A 2001. Interest of acridine derivatives in the anticancer chemotherapy. Current pharmaceutical design 7(17):1703-1724.
6. Wakelin LP, Bu X, Eleftheriou A, Parmar A, Hayek C, Stewart BW 2003. Bisintercalating threading diacridines: relationships between DNA binding, cytotoxicity, and cell cycle arrest. Journal of medicinal chemistry 46(26):5790-5802.
7. Graebe C, Caro H 1870. Ueber Acridin. Chemische Berichte 3:746.
9. Graebe C, Lagodzinski K 1893. Ueber Oxyderivate des Anthracholinchinons Justus Liebigs Annalen der Chemie 276(35).
10. Albert A, Goldacre R 1946. The Ionisation of Acridine Bases. J Chem Soc:706.
11. Albert A, Rubbo SD, Goldacre R 1941. Correlation of Basicity and Antiseptic Action in an Acridine Series. Nature 147:332-333.
12. Merck. 2001. The Merck Index. 13 ed.: John Wiley & Sons.
13. Bernthsen A 1884. Die Acridine. Justus Liebigs Annalen der Chemie 224:1.
14. Popp FD 1962. Polyphosphoric Acid in the Bernthsen Reaction. The Journal of Organic Chemistry 27(9):2658 - 2659.
15. Huntress EH, Shaw EN 1948. 4-Benzyl-2,6-dimethylpyridine, 1-benzylisoquinoline, 9-benzylacridine, and certain relatives. J Org Chem 13(5):674-681.
16. Dunstan AE, Stubbs JA 1906. Derivate des 9- Phenyl-acridins. III. Mittheilung: Ueber 9- p-Bromphenylacridine. Chemische Berichte 39:2402.
17. Bernthsen A, Traube J 1884. Butylacridin und Acridylbenzoësäure Chemische Berichte 17:1510.
18. Buu-Hoi NP, Lecocq J 1945. Des acridines substituees I. sur quelques 9-alcoyl et 9-aryl-alcoyl-acridines. Recueil des travaux chimiques des Pays-Bas 64:250.
104
19. Decker H, Hock T 1904. Ueber einige Ammoniumverbindungen: Methylirung der ms-Phenyl-acridin-o-carbonsäure Chemische Berichte 37:1002.
20. Dunstan AE, Hilditch TP 1907. The action of bromine on 5-phenylacridine and its halogen derivatives. J Chem Soc 91:1659.
21. Schmid A, Decker H 1906. Zur Kenntniss der Methylderivate des 9-Phenyl-acridins. Chemische Berichte 39:933.
22. Volpi A 1891. Organische Chemie. Chemische Berichte 24R:912.
23. Volpi A 1892. Organische Chemie. Chemische Berichte 25R:940.
24. Landauer E 1904. Recherches dans le groupe de la phenylacridine. Bulletin de la Société Chimique de France 31:1083.
25. Graef E, Fredericksen JM, Burger A 1946. Antitubercular Studies. Heterocyclic Fatty Acids. The Journal of Organic Chemistry 11(3):257-267.
26. Cook AH, Heilbron IM, Spinks A 1943. New therapeutic agents of the quinoline series. Part V. Pyridylacridines. J Chem Soc:417.
27. Bernthsen A, Hess W 1885. Ueber Amidound Oxyderivate des Phenylacridins. Chemische Berichte 18:689.
28. Kehrmann F, Stepanoff A 1908. Über einige Derivate des 9-Phenyl-acridins Chemische Berichte 41:4133.
29. Besthorn E, Curtman W 1891. Ueber Anilodo- und Oxyacridine. Chemische Berichte 24:2039.
30. Tsuge O, Nishinohara M, Tashiro M 1963. Compounds Related to Acridine. I. Condensation of Acridine Derivatives Having Active Methyl Group and Aromatic Nitroso Compounds. Bulletin of the Chemical Society of Japan 36:1477.
31. Bonna A 1887. V. Ueber Phenylparatoluidin. Justus Liebigs Annalen der Chemie 239(1):55-64.
32. Inagaki S 1938. A study on diphenylisatin and its derivative (the 4th report): regarding the monobromide compound of dianisolisation and its oxidation result. J Pharm Soc Jap 58:961.
33. Kehrmann F, Matusinsky Z 1912. Über ein Analogon des Aposafranons in der Acridin-Reihe. Über Acridin-Derivate. II. Chemische Berichte 45:3498.
34. Horaguchi T, Oyanagi T, Creencia EC, Tanemra K, Suzuki T 2004. Synthesis of Carbazole, Acridine, Phenazine, 4H-Benzo[def]carbazole and Their Derivatives by Thermal Cyclization Reaction of Aromatic Amines. J Heterocyclic Chem 41:1-6.
35. Hodgetts I, Noyce SJ, Storr RC 1984. Catalysis in Flash Vacuum Pyrolysis. Tet Lett 25(47):5435-5438.
36. Baum JS, Condon ME, Shook DA 1987. Nickel-Catalyzed Transformations of 2,1-Benzisoxazoles with Organozinc Reagents. J Org Chem 52:2983-2988.
105
37. Albert A, Ritchie B 1955. 9-Aminoacridine. Organic Syntheses 3:53.
38. El-Sherief HAH, Abdel-Rahman AE, Mahmoud AM 1983. Synthesis of certain acridine derivatives structurally related to some chemotherapeutic agents. Journal of the Indian Chemical Society 60(1):55-57.
39. Allen CFH, McKee GHW 1943. Acridone. Organic Syntheses 2:15.
40. Peacocke AR, Skerrett JHN 1956. The Interaction of Aminoacridines with Nucleic Acids. Trans Faraday Soc 52:261-279.
41. Lerman LS 1961. Structural considerations in the interactions of deoxyribonucleic acid and acridines. J Mol Biol 3:18-30.
42. Pritchard NJ, Blake A, Peacocke AR 1966. Modified intercalation model for the interaction of amino acridines and DNA. Nature 212(5068):1360-1361.
43. Cohen G, Eisenberg HK 1969. Viscosity and sedimentation study of sonicated DNA-Proflavine complexes. Biopolymers 8:45-55.
44. Wilson WD, Jones RL 1981. Intercalating drugs: DNA binding and molecular pharmacology. Advances in pharmacology and chemotherapy 18:177-222.
45. Saucier JM, Festy B, Le Pecq JB 1971. The change of the torsion of the DNA helix caused by intercalation. II. Measurement of the relative change of torsion induced by various intercalating drugs. Biochimie 53(9):973-980.
46. Gabbay EJ, Scofield RE, Baxter CS 1973. Steric effects on the intercalation of aromatic cations to deoxyribonucleic acid. Journal of the American Chemical Society 95(23):7850-7857.
47. Sobell HM. 1973. The stereochemistry of Actinomycin binding to DNA and its implications in molecular biology. ed.
48. Bauer WR 1978. Structure and reactions of closed duplex DNA. Annual review of biophysics and bioengineering 7:287-313.
49. Waring MJ. 1972. The Molecular Basis of Antibiotic Action. ed.: John Wiley & Sons Ltd
50. Manning GS 1978. The molecular theory of polyelectrolyte solutions with applications to the electrostatic properties of polynucleotides. Quarterly reviews of biophysics 11(2):179-246.
51. Record MT, Jr., Anderson CF, Lohman TM 1978. Thermodynamic analysis of ion effects on the binding and conformational equilibria of proteins and nucleic acids: the roles of ion association or release, screening, and ion effects on water activity. Quarterly reviews of biophysics 11(2):103-178.
52. Lohman TM, Wensley CG, Cina J, Burgess RR, Record MT, Jr. 1980. Use of difference boundary sedimentation velocity to investigate nonspecific protein-nucleic acid interactions. Biochemistry 19(15):3516-3522.
106
53. Ueyama H, Waki M, Takagi M, Takenaka S 2000. Novel synthesis of a tetra-acridinyl peptide as a new DNA polyintercalator. Nucleic acids symposium series (44):133-134.
54. McGhee JD, von Hippel PH 1974. Theoretical aspects of DNA-protein interactions: co-operative and non-co-operative binding of large ligands to a one-dimensional homogenous lattice. J Mol Biol 86:469-489.
55. Ueyama H, Takagi M, Waki M, Takenaka S 2001. DNA binding behavior of peptides carrying acridinyl units: First example of effective poly-intercalation. NUCLEIC ACIDS SYMP SER (OXF) 1(1):163-164.
56. Curtis BM, Scharnowske S, Watson AJ 1992. Sequence and expression of a membrane-associated C-type lectin that exhibits CD4. ProclNatlAcadSci 89:8356-8360.
57. Curtis BM, Widmer MB, deRoos P, Qwarnstrom EE 1990. IL-1 and its receptor are translocated to the nucleus. J Immunol 144(4):1295-1303.
58. Feinberg H, Mitchell DA, Drickamer K, Weis WI 2001. Structural basis for selective recognition of oligosaccharides by DC-SIGN and DC-SIGNR. Science (New York, NY 294(5549):2163-2166.
59. Soilleux EJ, Barten R, Trowsdale J 2000. DC-SIGN; a related gene, DC-SIGNR; and CD23 form a cluster on 19p13. J Immunol 165(6):2937-2942.
60. Pohlmann S, Soilleux EJ, Baribaud F, Leslie GJ, Morris LS, Trowsdale J, Lee B, Coleman N, Doms RW 2001. DC-SIGNR, a DC-SIGN homologue expressed in endothelial cells, binds to human and simian immunodeficiency viruses and activates infection in trans. Proceedings of the National Academy of Sciences of the United States of America 98(5):2670-2675.
61. Bashirova AA, Geijtenbeek TB, van Duijnhoven GC, van Vliet SJ, Eilering JB, Martin MP, Wu L, Martin TD, Viebig N, Knolle PA, KewalRamani VN, van Kooyk Y, Carrington M 2001. A dendritic cell-specific intercellular adhesion molecule 3-grabbing nonintegrin (DC-SIGN)-related protein is highly expressed on human liver sinusoidal endothelial cells and promotes HIV-1 infection. The Journal of experimental medicine 193(6):671-678.
62. Appelmelk BJ, van Die I, van Vliet SJ, Vandenbroucke-Grauls CM, Geijtenbeek TB, van Kooyk Y 2003. Cutting edge: carbohydrate profiling identifies new pathogens that interact with dendritic cell-specific ICAM-3-grabbing nonintegrin on dendritic cells. J Immunol 170(4):1635-1639.
63. Feinberg H, Castelli R, Drickamer K, Seeberger PH, Weis WI 2007. Multiple modes of binding enhance the affinity of DC-SIGN for high mannose N-linked glycans found on viral glycoproteins. The Journal of biological chemistry 282(6):4202-4209.
64. van Kooyk Y, Geijtenbeek TB 2003. DC-SIGN: escape mechanism for pathogens. Nat Rev Immunol 3(9):697-709.
65. Ratner DM, Plante OJ, Seeberger PH 2002. A Linear Synthesis of Branched High-Mannose Oligosaccharides from the HIV-1 Viral Surface Envelope Glycoprotein gp120. Eur J Org Chem:826-833.
107
66. Ding X, Wang W, Kong F 1997. Detritylation of mono- and di-saccharide derivatives using ferric chloride hydrate. Carbohydrate Research 303:445-448.
67. Sondheimer SJ, Eby R, Schuerch C 1978. A synthesis of 1,6-anhydro-2,3,4-tri-O-benzyl-β-D-mannopyranose. Carbohydrate Research 60:187-192.
68. Geijtenbeek TB, Torensma R, van Vliet SJ, van Duijnhoven GC, Adema GJ, van Kooyk Y, Figdor CG 2000. Identification of DC-SIGN, a novel dendritic cell-specific ICAM-3 receptor that supports primary immune responses. Cell 100(5):575-585.
69. Steinman RM, Cohn ZA 1973. Identification of a novel cell type in peripheral lymphoid organs of mice. I. Morphology, quantitation, tissue distribution. The Journal of experimental medicine 137(5):1142-1162.
70. Shaw S, Luce GE, Quinones R, Gress RE, Springer TA, Sanders ME 1986. Two antigen-independent adhesion pathways used by human cytotoxic T-cell clones. Nature 323(6085):262-264.
71. Adema GJ, Hartgers F, Verstraten R, de Vries E, Marland G, Menon S, Foster J, Xu Y, Nooyen P, McClanahan T, Bacon KB, Figdor CG 1997. A dendritic-cell-derived C-C chemokine that preferentially attracts naive T cells. Nature 387(6634):713-717.
72. Dustin ML, Springer TA 1989. T-cell receptor cross-linking transiently stimulates adhesiveness through LFA-1. Nature 341(6243):619-624.
73. van Kooyk Y, van de Wiel-van Kemenade P, Weder P, Kuijpers TW, Figdor CG 1989. Enhancement of LFA-1-mediated cell adhesion by triggering through CD2 or CD3 on T lymphocytes. Nature 342(6251):811-813.
74. Binnerts ME, van Kooyk Y, Simmons DL, Figdor CG 1994. Distinct binding of T lymphocytes to ICAM-1, -2 or -3 upon activation of LFA-1. European journal of immunology 24(9):2155-2160.
75. Van der Vieren M, Le Trong H, Wood CL, Moore PF, St John T, Staunton DE, Gallatin WM 1995. A novel leukointegrin, alpha d beta 2, binds preferentially to ICAM-3. Immunity 3(6):683-690.
76. Hernandez-Caselles T, Rubio G, Campanero MR, del Pozo MA, Muro M, Sanchez-Madrid F, Aparicio P 1993. ICAM-3, the third LFA-1 counterreceptor, is a co-stimulatory molecule for both resting and activated T lymphocytes. European journal of immunology 23(11):2799-2806.
77. Juan M, Vinas O, Pino-Otin MR, Places L, Martinez-Caceres E, Barcelo JJ, Miralles A, Vilella R, de la Fuente MA, Vives J, et al. 1994. CD50 (intercellular adhesion molecule 3) stimulation induces calcium mobilization and tyrosine phosphorylation through p59fyn and p56lck in Jurkat T cell line. The Journal of experimental medicine 179(6):1747-1756.
78. Geijtenbeek TB, Krooshoop DJ, Bleijs DA, van Vliet SJ, van Duijnhoven GC, Grabovsky V, Alon R, Figdor CG, van Kooyk Y 2000. DC-SIGN-ICAM-2 interaction mediates dendritic cell trafficking. Nature immunology 1(4):353-357.
79. Vestweber D, Blanks JE 1999. Mechanisms that regulate the function of the selectins and their ligands. Physiological reviews 79(1):181-213.
108
80. Nortamo P, Li R, Renkonen R, Timonen T, Prieto J, Patarroyo M, Gahmberg CG 1991. The expression of human intercellular adhesion molecule-2 is refractory to inflammatory cytokines. European journal of immunology 21(10):2629-2632.
81. Heisig N 1968. Functional analysis of the microcirculation in the exocrine pancreas. Adv Microcirc 1:89-94.
82. Garcia-Vallejo JJ, van Liempt E, da Costa Martins P, Beckers C, van het Hof B, Gringhuis SI, Zwaginga JJ, van Dijk W, Geijtenbeek TB, van Kooyk Y, van Die I 2008. DC-SIGN mediates adhesion and rolling of dendritic cells on primary human umbilical vein endothelial cells through LewisY antigen expressed on ICAM-2. Molecular immunology 45(8):2359-2369.
83. Geijtenbeek TB, van Duijnhoven GC, van Vliet SJ, Krieger E, Vriend G, Figdor CG, van Kooyk Y 2002. Identification of different binding sites in the dendritic cell-specific receptor DC-SIGN for intercellular adhesion molecule 3 and HIV-1. The Journal of biological chemistry 277(13):11314-11320.
84. Steinman RM 2000. DC-SIGN: a guide to some mysteries of dendritic cells. Cell 100(5):491-494.
85. Geijtenbeek TB, Kwon DS, Torensma R, van Vliet SJ, van Duijnhoven GC, Middel J, Cornelissen IL, Nottet HS, KewalRamani VN, Littman DR, Figdor CG, van Kooyk Y 2000. DC-SIGN, a dendritic cell-specific HIV-1-binding protein that enhances trans-infection of T cells. Cell 100(5):587-597.
86. Engering A, Geijtenbeek TB, van Vliet SJ, Wijers M, van Liempt E, Demaurex N, Lanzavecchia A, Fransen J, Figdor CG, Piguet V, van Kooyk Y 2002. The dendritic cell-specific adhesion receptor DC-SIGN internalizes antigen for presentation to T cells. J Immunol 168(5):2118-2126.
87. Lue J, Hsu M, Yang D, Marx P, Chen Z, Cheng-Mayer C 2002. Addition of a single gp120 glycan confers increased binding to dendritic cell-specific ICAM-3-grabbing nonintegrin and neutralization escape to human immunodeficiency virus type 1. Journal of virology 76(20):10299-10306.
88. Geijtenbeek TBH, van Vliet SJ, Koppel EA, Sanchez-Hernandez M, Vandenbroucke-Grauls CMJE, Appelmelk B, van Kooyk Y 2003. Mycobacteria Target DC-SIGN to Suppress Dendritic Cell Function. The Journal of experimental medicine 197(1):7-17.
89. Maeda N, Nigou J, Herrmann JL, Jackson M, Amara A, Lagrange PH, Puzo G, Gicquel B, Neyrolles O 2003. The cell surface receptor DC-SIGN discriminates between Mycobacterium species through selective recognition of the mannose caps on lipoarabinomannan. The Journal of biological chemistry 278(8):5513-5516.
90. Kaufmann SH, Schaible UE 2003. A dangerous liaison between two major killers: Mycobacterium tuberculosis and HIV target dendritic cells through DC-SIGN. The Journal of experimental medicine 197(1):1-5.
91. Tailleux L, Schwartz O, Herrmann JL, Pivert E, Jackson M, Amara A, Legres L, Dreher D, Nicod LP, Gluckman JC, Lagrange PH, Gicquel B, Neyrolles O 2003. DC-SIGN is the major Mycobacterium tuberculosis receptor on human dendritic cells. The Journal of experimental medicine 197(1):121-127.
109
92. Chatterjee D, Khoo KH 1998. Mycobacterial lipoarabinomannan: an extraordinary lipoheteroglycan with profound physiological effects. Glycobiology 8(2):113-120.
93. Sada E, Brennan PJ, Herrera T, Torres M 1990. Evaluation of lipoarabinomannan for the serological diagnosis of tuberculosis. Journal of clinical microbiology 28(12):2587-2590.
94. Jonuleit H, Schmitt E, Schuler G, Knop J, Enk AH 2000. Induction of interleukin 10-producing, nonproliferating CD4(+) T cells with regulatory properties by repetitive stimulation with allogeneic immature human dendritic cells. The Journal of experimental medicine 192(9):1213-1222.
95. Okano M, Satoskar AR, Nishizaki K, Abe M, Harn DA, Jr. 1999. Induction of Th2 responses and IgE is largely due to carbohydrates functioning as adjuvants on Schistosoma mansoni egg antigens. J Immunol 163(12):6712-6717.
96. Glover DJ, Lipps HJ, Jans DA 2005. Towards safe, non-viral therapeutic gene expression in humans. Nat Rev Genet 6(4):299-310.
97. Kircheis R, Wightman L, Schreiber A, Robitza B, Rossler V, Kursa M, Wagner E 2001. Polyethylenimine/DNA complexes shielded by transferrin target gene expression to tumors after systemic application. Gene therapy 8(1):28-40.
98. Jans DA, Xiao CY, Lam MH 2000. Nuclear targeting signal recognition: a key control point in nuclear transport? Bioessays 22(6):532-544.
99. Lyman SK, Guan T, Bednenko J, Wodrich H, Gerace L 2002. Influence of cargo size on Ran and energy requirements for nuclear protein import. The Journal of cell biology 159(1):55-67.
100. Paleos CM, Tziveleka LA, Sideratou Z, Tsiourvas D 2009. Gene delivery using functional dendritic polymers. Expert opinion on drug delivery 6(1):27-38.
101. Uherek C, Fominaya J, Wels W 1998. A modular DNA carrier protein based on the structure of diphtheria toxin mediates target cell-specific gene delivery. The Journal of biological chemistry 273(15):8835-8841.
102. Horie K, Masahiro S, Kuramochi K, Hanasaki K, Hamana H, Ito T 1999. Enhanced Accumulation of Sialyl Lewis X-Carboxymethylpullulan Conjugate in Acute Inflammatory Lesion. Pharm Res 16(2):314-320.
103. Haensler J, Szoka JFC 1993. Synthesis and characterization of a trigalactosylated bisacridine compound to target DNA to hepatocytes. Bioconjug Chem 4(1):85-93.
104. Liener IE, Pallansch MJ 1952. Purification of a toxic substance from defatted soy bean flour. The Journal of biological chemistry 197(1):29-36.
105. Dorland L, van Halbeek H, Vleigenthart JF, Lis H, Sharon N 1981. Primary structure of the carbohydrate chain of soybean agglutinin. A reinvestigation by high resolution 1H NMR spectroscopy. The Journal of biological chemistry 256(15):7708-7711.
110
106. Gordon JA, Blumberg S, Lis H, Sharon N 1972. Purification of Soybean Agglutinin by Affinity Chromatography of Sepharose-N-e-Aminocaproyl-B-D-Galactopyranosylamine. FEBS letters 24(2):193-196.
107. Reisner Y, Itzicovitch L, Meshorer A, Sharon N 1978. Hemopoietic stem cell transplantation using mouse bone marrow and spleen cells fractionated by lectins. Proceedings of the National Academy of Sciences of the United States of America 75(6):2933-2936.
108. Nagler A, Morecki S, Slavin S 1999. The use of soybean agglutinin (SBA) for bone marrow (BM) purging and hematopoietic progenitor cell enrichment in clinical bone-marrow transplantation. Molecular biotechnology 11(2):181-194.
109. Ji X, Chen Y, Faro J, Gewurz H, Bremer J, Spear GT 2006. Interaction of human immunodeficiency virus (HIV) glycans with lectins of the human immune system. Current protein & peptide science 7(4):317-324.
110. Yang Y, Park Y, Man S, Liu Y, Rice KG 2001. Cross-linked low molecular weight glycopeptide-mediated gene delivery: relationship between DNA metabolic stability and the level of transient gene expression in vivo. Journal of pharmaceutical sciences 90(12):2010-2022.
111. Allen AK, Neuberger A 1975. A simple method for the preparation of an affinity absorbent for soybean agglutinin using galactosamine and CH-Sepharose. FEBS letters 50(3):362-364.
112. Bethell GS, Ayers JS, Hancock WS, Hearn MT 1979. A novel method of activation of cross-linked agaroses with 1,1'-carbonyldiimidazole which gives a matrix for affinity chromatography devoid of additional charged groups. The Journal of biological chemistry 254(8):2572-2574.
113. Wilchek M, Miron T, Kohn J 1984. Affinity chromatography. Methods in enzymology 104:3-55.
114. Sihorkar V, Vyas SP 2001. Potential of polysaccharide anchored liposomes in drug delivery, targeting and immunization. J Pharm Pharm Sci 4(2):138-158.
115. Collard WT, Yang Y, Kwok KY, Park Y, Rice KG 2000. Biodistribution, metabolism, and in vivo gene expression of low molecular weight glycopeptide polyethylene glycol peptide DNA co-condensates. Journal of pharmaceutical sciences 89(4):499-512.
116. Karup G, Meldal M, Nielsen PE, Buchardt O 1988. 9-Acridinylpeptides and 9-acridinyl-4-nitrophenylsulfonylpeptides. Synthesis, binding to DNA, and photoinduced DNA cleavage. Int J Pept Protein Res 32(5):331-343.
117. Dubois M, Gilles K, Hamilton JK, Rebers PA, Smith F 1951. A Colorimetric Method for the Determination of Sugars. Nature 168(4265):167.
118. Lis H, Sharon N 1978. Soybean Agglutinin--A Plant Glycoprotein. Structure of the Carbohydrate Unit. J Biol Chem 253(10 (25 May)):3468-3476.
111
119. Evers DL, Hung RL, Thomas VH, Rice KG 1998. Preparative purification of a high-mannose type N-glycan from soy bean agglutinin by hydrazinolysis and tyrosinamide derivatization. Analytical biochemistry 265(2):313-316.
120. Chiu MH, Tamura T, Wadhwa MS, Rice KG 1994. In vivo targeting function of N-linked oligosaccharides with terminating galactose and N-acetylgalactosamine residues. J Biol Chem 269(23):16195-16202.
121. Dupre DJ, Robinson FA 1945. N-Substituted 5-Aminoacridines. Journal of the Chemical Society none:549-551.
122. Tung C, Zhu T, Lackland H, Stein S 1992. An acridine amino acid derivative for use in Fmoc peptide synthesis. Peptide Research 5(2):115-118.
123. Smith PK, Krohn RI, Hermanson GT, Mallia AK, Gartner FH, Provenzano MD, Fujimoto EK, Goeke NM, Olson BJ, Klenk DC 1985. Measurement of protein using bicinchoninic acid. Analytical biochemistry 150(1):76-85.
124. Caminschi I, Corbett AJ, Zahra C, Lahoud M, Lucas KM, Sofi M, Vremec D, Gramberg T, Pohlmann S, Curtis J, Handman E, van Dommelen SL, Fleming P, Degli-Esposti MA, Shortman K, Wright MD 2006. Functional comparison of mouse CIRE/mouse DC-SIGN and human DC-SIGN. International immunology 18(5):741-753.
125. Geijtenbeek TB, Groot PC, Nolte MA, van Vliet SJ, Gangaram-Panday ST, van Duijnhoven GC, Kraal G, van Oosterhout AJ, van Kooyk Y 2002. Marginal zone macrophages express a murine homologue of DC-SIGN that captures blood-borne antigens in vivo. Blood 100(8):2908-2916.
126. Galustian C, Park CG, Chai W, Kiso M, Bruening SA, Kang YS, Steinman RM, Feizi T 2004. High and low affinity carbohydrate ligands revealed for murine SIGN-R1 by carbohydrate array and cell binding approaches, and differing specificities for SIGN-R3 and langerin. International immunology 16(6):853-866.
127. Kretz-Rommel A, Qin F, Dakappagari N, Torensma R, Faas S, Wu D, Bowdish KS 2007. In vivo targeting of antigens to human dendritic cells through DC-SIGN elicits stimulatory immune responses and inhibits tumor growth in grafted mouse models. J Immunother 30(7):715-726.