38
For Research Use Only. Not for use in diagnostic procedures. GlycanAssure ™ Data Analysis Software v1.0 USER GUIDE Catalog Numbers A30751 Publication Number 100036373 Revision A

For Research Use Only. Not for use in diagnostic procedures.
GlycanAssure™ Data Analysis Software v1.0USER GUIDE
Catalog Numbers A30751Publication Number 100036373
Revision A

The information in this guide is subject to change without notice.
DISCLAIMER
TO THE EXTENT ALLOWED BY LAW, LIFE TECHNOLOGIES AND/OR ITS AFFILIATE(S) WILL NOT BE LIABLE FOR SPECIAL, INCIDENTAL, INDIRECT,PUNITIVE, MULTIPLE, OR CONSEQUENTIAL DAMAGES IN CONNECTION WITH OR ARISING FROM THIS DOCUMENT, INCLUDING YOUR USE OF IT.
NOTICE TO PURCHASER: DISCLAIMER OF LICENSE
Purchase of this software product alone does not imply any license under any process, instrument or other apparatus, system, composition, reagentor kit rights under patent claims owned or otherwise controlled by Life Technologies Corporation, either expressly, or by estoppel.
Revision history
Revision Date Description
A 15 February 2016 New document for v1.0 software.
Corporate entity
Life Technologies | Carlsbad, CA 92008 USA | Toll Free in USA 1 800 955 6288
TRADEMARKS
All trademarks are the property of Thermo Fisher Scientific and its subsidiaries unless otherwise specified.
©2016 Thermo Fisher Scientific Inc. All rights reserved.

Contents
■ CHAPTER 1 Get started . . . . . . . . . . . . . . . . . . . . . . . . . . . . . . . . . . . . . . . . . . . . . . . . . . 5
GlycanAssure™ Data Analysis Software . . . . . . . . . . . . . . . . . . . . . . . . . . . . . . . . . . . . . . . . . . . . . 5
System overview . . . . . . . . . . . . . . . . . . . . . . . . . . . . . . . . . . . . . . . . . . . . . . . . . . . . . . . . . . . . . . . . 5
Workflow . . . . . . . . . . . . . . . . . . . . . . . . . . . . . . . . . . . . . . . . . . . . . . . . . . . . . . . . . . . . . . . . . . . . . . 6
Set preferences . . . . . . . . . . . . . . . . . . . . . . . . . . . . . . . . . . . . . . . . . . . . . . . . . . . . . . . . . . . . . . . . . 9
Print, export, or save (.pdf, .png) results . . . . . . . . . . . . . . . . . . . . . . . . . . . . . . . . . . . . . . . . . . 10
■ CHAPTER 2 Work with projects . . . . . . . . . . . . . . . . . . . . . . . . . . . . . . . . . . . . . . . . 11
Create open or save a project . . . . . . . . . . . . . . . . . . . . . . . . . . . . . . . . . . . . . . . . . . . . . . . . . . . . 11
Search for a project . . . . . . . . . . . . . . . . . . . . . . . . . . . . . . . . . . . . . . . . . . . . . . . . . . . . . . . . . . . . 11
Search for samples . . . . . . . . . . . . . . . . . . . . . . . . . . . . . . . . . . . . . . . . . . . . . . . . . . . . . . . . . . . . . 12
Import samples . . . . . . . . . . . . . . . . . . . . . . . . . . . . . . . . . . . . . . . . . . . . . . . . . . . . . . . . . . . . . . . . 12
Display sample info, raw data, or EPT data . . . . . . . . . . . . . . . . . . . . . . . . . . . . . . . . . . . . . . . . 12
Analyze samples . . . . . . . . . . . . . . . . . . . . . . . . . . . . . . . . . . . . . . . . . . . . . . . . . . . . . . . . . . . . . . . 13
View a report . . . . . . . . . . . . . . . . . . . . . . . . . . . . . . . . . . . . . . . . . . . . . . . . . . . . . . . . . . . . . . . . . . 13
Edit project name or description . . . . . . . . . . . . . . . . . . . . . . . . . . . . . . . . . . . . . . . . . . . . . . . . . 13
Set a project as a favorite . . . . . . . . . . . . . . . . . . . . . . . . . . . . . . . . . . . . . . . . . . . . . . . . . . . . . . . 13
Create or apply table settings . . . . . . . . . . . . . . . . . . . . . . . . . . . . . . . . . . . . . . . . . . . . . . . . . . . . 13
Define sample path . . . . . . . . . . . . . . . . . . . . . . . . . . . . . . . . . . . . . . . . . . . . . . . . . . . . . . . . . . . . . 14
Analysis status . . . . . . . . . . . . . . . . . . . . . . . . . . . . . . . . . . . . . . . . . . . . . . . . . . . . . . . . . . . . . . . . 14
Processing flags . . . . . . . . . . . . . . . . . . . . . . . . . . . . . . . . . . . . . . . . . . . . . . . . . . . . . . . . . . . . . . . 15
■ CHAPTER 3 Work with analysis methods . . . . . . . . . . . . . . . . . . . . . . . . . . . . . 16
Assign or remove an Analysis Method . . . . . . . . . . . . . . . . . . . . . . . . . . . . . . . . . . . . . . . . . . . . . 16
Filter analysis methods . . . . . . . . . . . . . . . . . . . . . . . . . . . . . . . . . . . . . . . . . . . . . . . . . . . . . . . . . 16
Analysis method parameters . . . . . . . . . . . . . . . . . . . . . . . . . . . . . . . . . . . . . . . . . . . . . . . . . . . . 17
Create an analysis method . . . . . . . . . . . . . . . . . . . . . . . . . . . . . . . . . . . . . . . . . . . . . . . . . . . . . . 20
Open an analysis method . . . . . . . . . . . . . . . . . . . . . . . . . . . . . . . . . . . . . . . . . . . . . . . . . . . . . . . . 21
Create a size standard definition . . . . . . . . . . . . . . . . . . . . . . . . . . . . . . . . . . . . . . . . . . . . . . . . . 21
GlycanAssure™ Data Analysis Software v1.0 User Guide 3

■ CHAPTER 4 Analyze and review results . . . . . . . . . . . . . . . . . . . . . . . . . . . . . . 22
View results tables . . . . . . . . . . . . . . . . . . . . . . . . . . . . . . . . . . . . . . . . . . . . . . . . . . . . . . . . . . . . . 22
Search for peak calls (results) . . . . . . . . . . . . . . . . . . . . . . . . . . . . . . . . . . . . . . . . . . . . . . . . . . . 23
View electropherogram plots . . . . . . . . . . . . . . . . . . . . . . . . . . . . . . . . . . . . . . . . . . . . . . . . . . . . 24
View data trending . . . . . . . . . . . . . . . . . . . . . . . . . . . . . . . . . . . . . . . . . . . . . . . . . . . . . . . . . . . . . 25
Print, export, or save (.pdf, .png) results . . . . . . . . . . . . . . . . . . . . . . . . . . . . . . . . . . . . . . . . . . 26
Analysis flags . . . . . . . . . . . . . . . . . . . . . . . . . . . . . . . . . . . . . . . . . . . . . . . . . . . . . . . . . . . . . . . . . . 27
Compare processing . . . . . . . . . . . . . . . . . . . . . . . . . . . . . . . . . . . . . . . . . . . . . . . . . . . . . . . . . . . . 28
Zoom and unzoom . . . . . . . . . . . . . . . . . . . . . . . . . . . . . . . . . . . . . . . . . . . . . . . . . . . . . . . . . . . . . . 29
Examine the size standard plot and curve . . . . . . . . . . . . . . . . . . . . . . . . . . . . . . . . . . . . . . . . . 29
Override Sizing Quality (SQ) . . . . . . . . . . . . . . . . . . . . . . . . . . . . . . . . . . . . . . . . . . . . . . . . . . . . . 30
Plot toolbar . . . . . . . . . . . . . . . . . . . . . . . . . . . . . . . . . . . . . . . . . . . . . . . . . . . . . . . . . . . . . . . . . . . 30
Adjust delimiters (peak start/end) and baseline . . . . . . . . . . . . . . . . . . . . . . . . . . . . . . . . . . . . 31
Create sample groups . . . . . . . . . . . . . . . . . . . . . . . . . . . . . . . . . . . . . . . . . . . . . . . . . . . . . . . . . . 31
■ Troubleshooting . . . . . . . . . . . . . . . . . . . . . . . . . . . . . . . . . . . . . . . . . . . . . . . . . . . . . . . . . . 32
Troubleshooting . . . . . . . . . . . . . . . . . . . . . . . . . . . . . . . . . . . . . . . . . . . . . . . . . . . . . . . . . . . . . . . 32
■ Documentation and support . . . . . . . . . . . . . . . . . . . . . . . . . . . . . . . . . . . . . . . . . . . . . 33
Related documents . . . . . . . . . . . . . . . . . . . . . . . . . . . . . . . . . . . . . . . . . . . . . . . . . . . . . . . . . . . . . 33
Customer and technical support . . . . . . . . . . . . . . . . . . . . . . . . . . . . . . . . . . . . . . . . . . . . . . . . . 33
Limited product warranty . . . . . . . . . . . . . . . . . . . . . . . . . . . . . . . . . . . . . . . . . . . . . . . . . . . . . . . 34
Index . . . . . . . . . . . . . . . . . . . . . . . . . . . . . . . . . . . . . . . . . . . . . . . . . . . . . . . . . . . . . . . . . . . . . . . 35
Contents
4 GlycanAssure™ Data Analysis Software v1.0 User Guide

Get started
■ GlycanAssure™ Data Analysis Software . . . . . . . . . . . . . . . . . . . . . . . . . . . . . . . . . . 5
■ System overview . . . . . . . . . . . . . . . . . . . . . . . . . . . . . . . . . . . . . . . . . . . . . . . . . . . . . . 5
■ Workflow . . . . . . . . . . . . . . . . . . . . . . . . . . . . . . . . . . . . . . . . . . . . . . . . . . . . . . . . . . . . 6
■ Set preferences . . . . . . . . . . . . . . . . . . . . . . . . . . . . . . . . . . . . . . . . . . . . . . . . . . . . . . . . 9
■ Print, export, or save (.pdf, .png) results . . . . . . . . . . . . . . . . . . . . . . . . . . . . . . . . . 10
GlycanAssure™ Data Analysis Software
The GlycanAssure™ Data Analysis Software is a glycan analysis software solution.
The software uses a database host to store projects, and settings.
System overview
The GlycanAssure™ System is an integrated glycan analysis platform with threecomponents:
1. GlycanAssure™ Kits (described in Pub. no. 100033998 ) – Provide reagents forsample preparation (to release, purify, and label glycans) and for capillaryelectrophoresis. Three kits are available; each includes a different dye for glycanlabeling:
• GlycanAssure™ APTS Kit (Cat. no. A28676)• GlycanAssure™ Teal™ Kit (Cat. no. A28677)• GlycanAssure™ Turquoise™ Kit (Cat. no. A28678)
2. Applied Biosystems™ 3500/3500xL Genetic Analyzer for Protein QualityAnalysis (POP-7™ polymer, 50-cm capillary array) (described in Pub. no.100036372) – Runs GlycanAssure™ Data Acquisition Software to collect data forsamples prepared with the GlycanAssure™ Kits.
3. GlycanAssure™ Data Analysis Software (described in Pub. no. 100036373) – Processes and analyzes glycan data and includes data trending and profilematching features.
1
GlycanAssure™ Data Analysis Software v1.0 User Guide 5

Workflow
1 Dashboard
Create a project
▼ ▼
2 Processing
Import samples
▼ ▼
Assign analysismethod
▼ ▼
Chapter 1 Get startedWorkflow1
6 GlycanAssure™ Data Analysis Software v1.0 User Guide

Review the SizingQuality (SQ) andsample quality flags
▼ ▼
(Optional) Create ormodify analysismethod
▼ ▼
Analyze samples
▼ ▼
Chapter 1 Get startedWorkflow 1
GlycanAssure™ Data Analysis Software v1.0 User Guide 7

4 Analysis
Review analysisresults
(Optional) Adjust peakdelimiters, baseline,and bins
▼ ▼
Review data trending
▼ ▼
5 Report
Chapter 1 Get startedWorkflow1
8 GlycanAssure™ Data Analysis Software v1.0 User Guide

Review reports
Set preferences
1. In the top right of the toolbar, click .
2. Specify settings as needed, then click Apply.
Preference Setting Description
Dashboard Show number of projects Number of projects per page
Refresh Run Count For Autoanalysis. Not available in this release.
Define Run Paths For Autoanalysis. Not available in this release.
Processing Save project Sets automatic saving and interval.
Show Analysis Methods Determines the projects listed: All, Favorite, or Default.
Show quality alerts Determines whether flags are shown as colored indicators ornumbers.
Analysis Show quality alerts Determines whether flags are shown as colored indicators ornumbers.
Data trending default Determines if the trending default is Area, Relative Area, Height,Relative Height, or Retention Time.
Reports Logo Image (.jpg) to include in the report header.
Header and footer text Text to include in the report header and footer.
Date format Region US or UK (selection determines options displayed in Format list)
Format Date format
Chapter 1 Get startedSet preferences 1
GlycanAssure™ Data Analysis Software v1.0 User Guide 9

Print, export, or save (.pdf, .png) results
• To print, export, or save results as .pdf – Click or in the table toolbar.• To print or save plots as .pdf or .png– Click or in the plot toolbar.• To print or save data trending results as .pdf or .png– Click or in the Data
Trending screen.
Chapter 1 Get startedPrint, export, or save (.pdf, .png) results1
10 GlycanAssure™ Data Analysis Software v1.0 User Guide

Work with projects
■ Create open or save a project . . . . . . . . . . . . . . . . . . . . . . . . . . . . . . . . . . . . . . . . . . . 11
■ Search for a project . . . . . . . . . . . . . . . . . . . . . . . . . . . . . . . . . . . . . . . . . . . . . . . . . . . 11
■ Search for samples . . . . . . . . . . . . . . . . . . . . . . . . . . . . . . . . . . . . . . . . . . . . . . . . . . . . 12
■ Import samples . . . . . . . . . . . . . . . . . . . . . . . . . . . . . . . . . . . . . . . . . . . . . . . . . . . . . . 12
■ Display sample info, raw data, or EPT data . . . . . . . . . . . . . . . . . . . . . . . . . . . . . . 12
■ Analyze samples . . . . . . . . . . . . . . . . . . . . . . . . . . . . . . . . . . . . . . . . . . . . . . . . . . . . . 13
■ View a report . . . . . . . . . . . . . . . . . . . . . . . . . . . . . . . . . . . . . . . . . . . . . . . . . . . . . . . . 13
■ Edit project name or description . . . . . . . . . . . . . . . . . . . . . . . . . . . . . . . . . . . . . . . . 13
■ Set a project as a favorite . . . . . . . . . . . . . . . . . . . . . . . . . . . . . . . . . . . . . . . . . . . . . . 13
■ Create or apply table settings . . . . . . . . . . . . . . . . . . . . . . . . . . . . . . . . . . . . . . . . . . 13
■ Define sample path . . . . . . . . . . . . . . . . . . . . . . . . . . . . . . . . . . . . . . . . . . . . . . . . . . . 14
■ Analysis status . . . . . . . . . . . . . . . . . . . . . . . . . . . . . . . . . . . . . . . . . . . . . . . . . . . . . . . 14
■ Processing flags . . . . . . . . . . . . . . . . . . . . . . . . . . . . . . . . . . . . . . . . . . . . . . . . . . . . . . 15
Create open or save a project
In the Dashboard tab:• Create – Click Create New Project• Open – Double-click a project
In the Processing tab:• Create – Click • Open – Click • Save – Click
Search for a project
In the Dashboard, select a criterion (name, date created or modified, favorite, status),or click Advanced Search to set more specific criteria to search by sample, run,experiment, or injection.
2
GlycanAssure™ Data Analysis Software v1.0 User Guide 11

Search for samples
You can do either of the following to search for samples:• In the Dashboard, click Advanced Search, select Search by Sample, then set
search parameters.• In the Processing, tab click Import Samples, then enter a sample name in the Key
Word field.
Import samples
1. In the Processing tab, click Import Samples.
2. Select:• Computer to select .fsa files stored on the computer.• Existing projects to select samples from an existing project stored in the
database.
3. To search for a sample, type the name of a .fsa file or a sample name from anexisting project.
4. Select the files or samples, then click Import to Project.
Display sample info, raw data, or EPT data
In the Processing tab, double-click the Raw Data field for a sample.
If the Raw Data column is not displayed, see “Create or apply table settings“ onpage 13.
Chapter 2 Work with projectsSearch for samples2
12 GlycanAssure™ Data Analysis Software v1.0 User Guide

Analyze samples
In the Processing tab:
1. Select one or more samples.
2. Assign an analysis method (see “Assign or remove an Analysis Method“ onpage 16).
3. Click Analyze.
View a report
View a report from:• Dashboard by clicking in a project tile• Report tab by clicking Preview
Edit project name or description
1. In the Processing tab, click .
2. Edit the name or description, then click Save.
Set a project as a favorite
In the Dashboard or Processing tab, click .You can search for favorites as described in “Search for a project“ on page 11.
Create or apply table settings
1. Click .
2. Click Create New, enter a name, then click OK.
3. Select the columns to display.
4. Click OK.
Column names
Sample ID is an internal identifier applied by the software.
UD1 through UD 3 are user-defined columns that can contain information from theGlycanAssure™ Data Acquisition Software.
See “Processing flags“ on page 15 and “Analysis flags“ on page 27 for a descriptionof flag columns.
Chapter 2 Work with projectsAnalyze samples 2
GlycanAssure™ Data Analysis Software v1.0 User Guide 13

Define sample path
When you add samples from sample files to a project:• You specify the location of the sample files on the hard drive or a network drive.• Sample files remain in their original location on the drive, and are not stored in
the database.• The software reads the information it needs from the sample files. No information
is written back to the original sample files.
If the sample files are later moved from their original location, you must define a newsample file path in the project if you want to view raw data, view EPT data, orreanalyze samples.
1. In the Processing tab, select the samples for which you want to define a path.The SFNF (Sample File Not Found) column is if the software cannot find asample file.
2. Click Define sample path.
3. Navigate to the original folder from which the sample was added to the project.The individual sample files are not listed if you open the folder containing thesample files. Select the folder, then click Define.The SFNF (Sample File Not Found) column is if the software successfullylocates the sample file.
Analysis status
Icon Description
No icon Not analyzed
Analyzed
Analysis Method changed, click Analyze toapply changes
Chapter 2 Work with projectsDefine sample path2
14 GlycanAssure™ Data Analysis Software v1.0 User Guide

Processing flags
Table 1 Processing flags
Flag Description Status
SFNF Sample File Not Found Sample file is in the original location from which it was addedto the project.
Sample file is not in the original location from which it wasadded to the project.
STDNF Size Standard Not Found Size standard definition is specified in analysis method.
Size standard definition is not specified in analysis method.
SQ Sizing Quality SQ value is in the Pass range
SQ value is between the Pass range and the Low Quality range
SQ value is In the Fail range
OS Off Scale No fluorescence signals within the analysis range exceed thesignal threshold of the instrument
One or more fluorescence signals within the analysis rangeexceed the signal threshold of the instrument
SQI Sizing Quality Invalid Override SQ applied
LMNF Landmark Not Found Number of landmark dye peaks detected is ³ the number ofpeaks required by the software
Number of landmark dye peaks detected is < the number ofpeaks required by the software
LMQ Landmark Quality LMNF is and the distance between the landmark peaks iswithin the limits required by the software
LMNF is and the distance between the landmark peaks isnot within the limits required by the software
N/A LMNF is
Chapter 2 Work with projectsProcessing flags 2
GlycanAssure™ Data Analysis Software v1.0 User Guide 15

Work with analysis methods
■ Assign or remove an Analysis Method . . . . . . . . . . . . . . . . . . . . . . . . . . . . . . . . . . 16
■ Filter analysis methods . . . . . . . . . . . . . . . . . . . . . . . . . . . . . . . . . . . . . . . . . . . . . . . . 16
■ Analysis method parameters . . . . . . . . . . . . . . . . . . . . . . . . . . . . . . . . . . . . . . . . . . . 17
■ Create an analysis method . . . . . . . . . . . . . . . . . . . . . . . . . . . . . . . . . . . . . . . . . . . . . 20
■ Open an analysis method . . . . . . . . . . . . . . . . . . . . . . . . . . . . . . . . . . . . . . . . . . . . . . 21
■ Create a size standard definition . . . . . . . . . . . . . . . . . . . . . . . . . . . . . . . . . . . . . . . 21
Assign or remove an Analysis Method
In the Processing tab:• To assign an analysis method, you can:
– Select individual samples, then click Assign next to the method to assign– Select Select All Samples from the drop-down list above the Processing
table, then select the method to assign• To remove an analysis method, you can:
– Click x next to the method to remove– Right-click a row in the table, select Remove Analysis Method, then select
the method to assign
After adding or removing an analysis method, click Analyze to apply the change
Filter analysis methods
• In the Processing tab, click , then select All, Favorite, or Default analysismethods.
• Set the Processing tab preference to display All, Favorite, or Default analysismethods. You can override the preference setting by clicking .
3
16 GlycanAssure™ Data Analysis Software v1.0 User Guide

Analysis method parameters
Table 2 Analysis method Processing parameters
Parameter Description
General Name and description Unique name and optional description.
Add to Favorites Click to tag as a favorite. You can set preferences to show onlyfavorite analysis methods in the Analysis tab.
Set as default Click to specify as the default method. You can set preferences toshow only the default analysis methods in the Analysis tab. Youcannot delete or modify a method specified as the default method.
Bins Bins Specifies the bins (expected RMU for a detected peak) for analysis.This list is displayed in the Analyze tab.
Click Auto Bin to create bins based on detected peaks (RMU±1) in theselected sample.
Click Import to select bins, or click to create a bin.
Baseline Analysis Range Specify the range (in migration time) to analyze:
• Full Range to analyze the entire scan region as collected by thecapillary electrophoresis instrument, including the LandmarkRed peak.
• Partial Range to analyze only data points within a specifiedrange. Enter Start Point in data points after the primer peak andbefore the first required size standard peak. Enter a Stop Pointafter the last required size standard fragment. Start and Stoppoints may vary from instrument to instrument and platform toplatform. Display raw data to determine the appropriate analysisrange.
Data points outside the specified analysis range are ignored.
Ensure the Analysis Range contains all size standard peaks.
Smoothing Select an option to smooth the outline of peaks and reduce thenumber of false peaks detected:
• None to apply no smoothing. Best if the data display sharp,narrow peaks of interest.
• Light (default) to provide the best results for typical data. Lightsmoothing slightly reduces peak height.
• Heavy for data with broad peaks of interest. Heavy smoothingcan significantly reduce peak height.
Chapter 3 Work with analysis methodsAnalysis method parameters 3
GlycanAssure™ Data Analysis Software v1.0 User Guide 17
Parameter Description
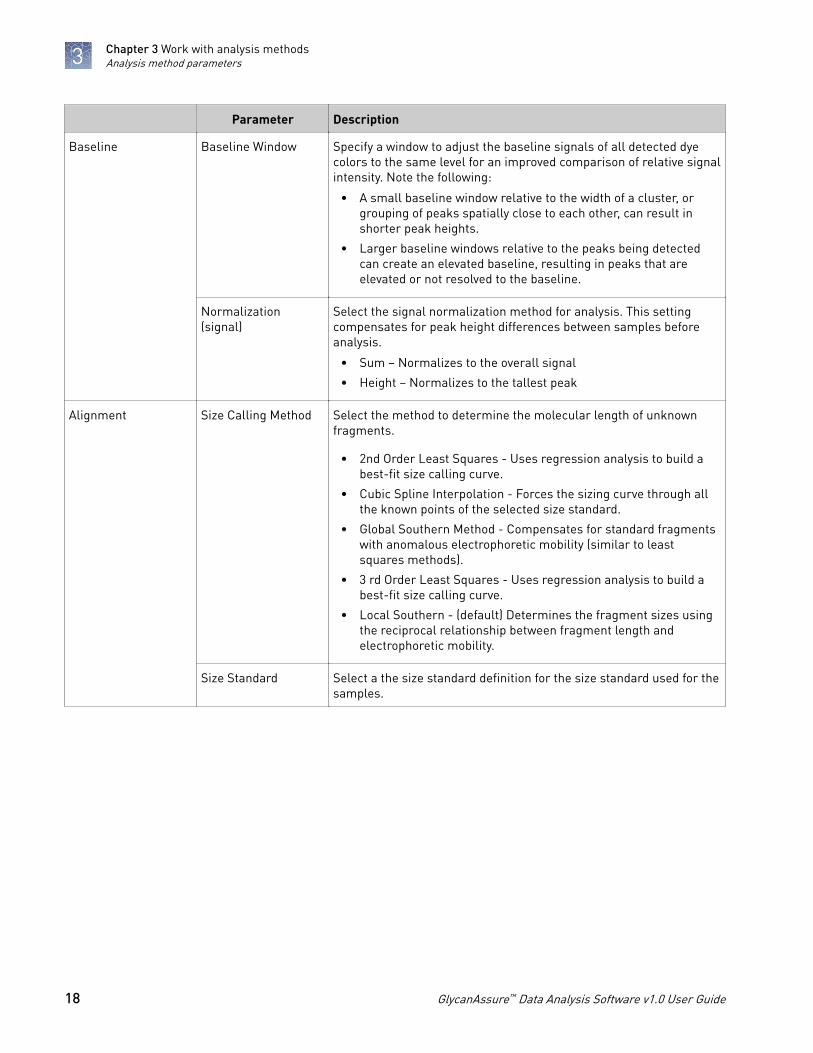
Baseline Baseline Window Specify a window to adjust the baseline signals of all detected dyecolors to the same level for an improved comparison of relative signalintensity. Note the following:
• A small baseline window relative to the width of a cluster, orgrouping of peaks spatially close to each other, can result inshorter peak heights.
• Larger baseline windows relative to the peaks being detectedcan create an elevated baseline, resulting in peaks that areelevated or not resolved to the baseline.
Normalization(signal)
Select the signal normalization method for analysis. This settingcompensates for peak height differences between samples beforeanalysis.
• Sum – Normalizes to the overall signal
• Height – Normalizes to the tallest peak
Alignment Size Calling Method Select the method to determine the molecular length of unknownfragments.
• 2nd Order Least Squares - Uses regression analysis to build abest-fit size calling curve.
• Cubic Spline Interpolation - Forces the sizing curve through allthe known points of the selected size standard.
• Global Southern Method - Compensates for standard fragmentswith anomalous electrophoretic mobility (similar to leastsquares methods).
• 3 rd Order Least Squares - Uses regression analysis to build abest-fit size calling curve.
• Local Southern - (default) Determines the fragment sizes usingthe reciprocal relationship between fragment length andelectrophoretic mobility.
Size Standard Select a the size standard definition for the size standard used for thesamples.
Chapter 3 Work with analysis methodsAnalysis method parameters3
18 GlycanAssure™ Data Analysis Software v1.0 User Guide

Parameter Description
Alignment Enable Size StandardNormalization
The Data Acquisition Software provides a normalization option that isenabled through the size standard selection.
It uses the GeneScan™600 LIZ™ Size Standard to obtain consistent lot-to-lot peak heights. It provides more consistent results between datafrom different instruments, injections, and capillaries.
The software calculates a normalization factor based on a thresholdsetting. For each injection, the normalization factor is used as amultiplier to adjust the peak height of the sample peaks relative tothe GS600 LIZ™ size standard peaks. There are minimum andmaximum limits to the normalization factor, so if the size standardpeak heights are abnormally high or low, the normalization will belimited.
The normalization factor is saved in the sample data file. When youimport a normalized data file in to a project, you can remove andapply the normalization factor by deselecting and selecting theEnable Size Standard Normalization check box.
Peak Integration Slope ThresholdsPeak Start and End
• Peak Start - The peak starts when the first derivative (slope ofthe tangent) in the beginning of the peak signal before theinflection point becomes equal to or exceeds the Peak Startvalue. This threshold is set to 0 by default, which means that thepeak will normally start at the leftmost point where the slope ofthe tangent is closest to 0° (horizontal line). A value other than 0moves the peak start point toward its center. The value enteredmust be non-negative.
• Peak End - The peak ends when the first derivative (slope of thetangent) in the end of the peak signal after the inflection pointbecomes equal to or exceeds the Peak End value. This value isset to 0 by default, which means that the peak will normally endat the rightmost point where the slope of the tangent is closestto 0° (horizontal line). A value other than 0 moves the peak endpoint toward its center. The value entered in this field must benon-positive.
Min. Peak Half Width Specify the smallest half peak width at full height for peak detection.The range is 2 to 99 data points.
Polynomial Degree Polynomial Degree cannot be greater than Peak Window Size.
Adjust to affect the sensitivity of peak detection. You can adjust thisparameter to detect a single base pair difference while minimizingthe detection of shoulder effects and/or noise.
The peak detector calculates the first derivative of a polynomial curvefitted to the data within a window that is centered on each data pointin the analysis range.
Using curves with larger polynomial degree values allows the curveto more closely approximate the signal and, therefore, captures moreof the peak structure in the electropherogram.
Chapter 3 Work with analysis methodsAnalysis method parameters 3
GlycanAssure™ Data Analysis Software v1.0 User Guide 19

Parameter Description
Peak Integration Peak Window size Enter a window width in data points for peak detection sensitivity. Ifmore than one peak apex is within the window, all are labeled as asingle peak. Note the following:
• The maximum value is the number of data points betweenpeaks.
• The Peak Window Size setting is limited to odd numbers.
To increase peak detection sensitivity: Increase polynomial degree,decrease peak window size.
To decrease peak detection sensitivity: Decrease polynomial degree,increase peak window size.
Peak AmplitudeThresholds
Specify the threshold (RFU) for peak detection for each dye color.Peaks ³ the threshold are detected.
For example, if you use the default values of 50, peaks with heightsequal to or greater than 50 are detected. Peaks with heights below 50are still displayed in the electropherogram plots but are not detectedor labeled.
Peak Calling andQuality
Relative % Area and% Height
Determines if Relative % Area and Relative % Height are calculatedusing all peaks or identified peaks:
Area or height of the peak/Total area (sum of absolute area or heightof all peaks or identified peaks)
Relative MigrationTime
Not used at this time.
Max. Peak Width Max Peak Width Threshold to identify broad peaks (BD).
Pull-up The pull-up ratio or for a peak to be called a pull-up peak.
Pull-up occurs when the peak height of the called peak is less than X% of the larger peak that is within ±1 data point.
SQ (sizing quality)Range
Pass, Check, and Fail ranges for SQ flag.
Create an analysis method
1. In the Processing tab in the Analysis method list, click .
2. Enter parameters (see “Analysis method parameters“ on page 17).
3. As needed, select Set as default or Add to Favorite.
4. Click Save.
Chapter 3 Work with analysis methodsCreate an analysis method3
20 GlycanAssure™ Data Analysis Software v1.0 User Guide

Open an analysis method
In the Processing tab, click an analysis method name in the analysis method list.
Create a size standard definition
1. In the Processing tab, open an analysis method, then click Alignment.
2. Click .
3. Enter a Name and optional Description.
4. Select a Size Standard Dye.
5. Enter Peak sizes (RMU).
6. Click Save.
Chapter 3 Work with analysis methodsOpen an analysis method 3
GlycanAssure™ Data Analysis Software v1.0 User Guide 21

Analyze and review results
■ View results tables . . . . . . . . . . . . . . . . . . . . . . . . . . . . . . . . . . . . . . . . . . . . . . . . . . . 22
■ Search for peak calls (results) . . . . . . . . . . . . . . . . . . . . . . . . . . . . . . . . . . . . . . . . . . 23
■ View electropherogram plots . . . . . . . . . . . . . . . . . . . . . . . . . . . . . . . . . . . . . . . . . . 24
■ View data trending . . . . . . . . . . . . . . . . . . . . . . . . . . . . . . . . . . . . . . . . . . . . . . . . . . . 25
■ Print, export, or save (.pdf, .png) results . . . . . . . . . . . . . . . . . . . . . . . . . . . . . . . . . 26
■ Analysis flags . . . . . . . . . . . . . . . . . . . . . . . . . . . . . . . . . . . . . . . . . . . . . . . . . . . . . . . . 27
■ Compare processing . . . . . . . . . . . . . . . . . . . . . . . . . . . . . . . . . . . . . . . . . . . . . . . . . . 28
■ Zoom and unzoom . . . . . . . . . . . . . . . . . . . . . . . . . . . . . . . . . . . . . . . . . . . . . . . . . . . 29
■ Examine the size standard plot and curve . . . . . . . . . . . . . . . . . . . . . . . . . . . . . . . 29
■ Override Sizing Quality (SQ) . . . . . . . . . . . . . . . . . . . . . . . . . . . . . . . . . . . . . . . . . . . 30
■ Plot toolbar . . . . . . . . . . . . . . . . . . . . . . . . . . . . . . . . . . . . . . . . . . . . . . . . . . . . . . . . . . 30
■ Adjust delimiters (peak start/end) and baseline . . . . . . . . . . . . . . . . . . . . . . . . . . . 31
■ Create sample groups . . . . . . . . . . . . . . . . . . . . . . . . . . . . . . . . . . . . . . . . . . . . . . . . . 31
View results tables
In the Analysis tab for an analyzed project:
1. Examine the Sample list.
1 3 42
1 Plate map – Click to view the location of the sample in the plate2 Sample type color-coding from the data acquisition software3 Analysis flags selected in table settings (see “Analysis flags“ on page 27 and “Create
or apply table settings“ on page 13)4 Bins from the analysis method
To filter the list, you can click or Show Flagged Samples.
4
22 GlycanAssure™ Data Analysis Software v1.0 User Guide

Avg, SD and %CV are calculated across replicates.
2. Examine the Summary list for results on assigned peaks.
3. Examine the All Peaks list for results on assigned and unassigned peaks.
Search for peak calls (results)
In the Analysis tab:
1. Select the attribute to search for: Area, Relative Percent Peak Area, Height,Relative Height, Migration Time.
2. Select the property to search for: Actual, Average, %CV, SD.
3. Specify search by value or range.
4. Specify the value (and conditions) or range to search.
5. Select a color to apply to the results.
6. Click Search.
Chapter 4 Analyze and review resultsSearch for peak calls (results) 4
GlycanAssure™ Data Analysis Software v1.0 User Guide 23

View electropherogram plots
In the Analysis tab:
• Check for expected peaks by scrolling through all traces using the scroll bar onthe far right of the pane, or clicking .
• View peaks assigned to bins and peaks not assigned to bins.
• Right-click a peak, then add a glycan peak or bin, lock the peak (to preventadjustment of peak start/end or baseline, or deletion of peak), or delete peaks.
• Remove bins from analysis by deselecting in the left pane (you must re-analyze inthe Processing tab to apply the changes)
• Search for peaks with specific attributes, for example, peaks with an area below aminimum setting you specify (“Search for peak calls (results)“ on page 23).
• Zoom (see “Zoom and unzoom“ on page 29).
• Adjust peak detection (“Adjust delimiters (peak start/end) and baseline“ onpage 31).
• Create sample groups for analysis and trending (“Create sample groups“ onpage 31).
Chapter 4 Analyze and review resultsView electropherogram plots4
24 GlycanAssure™ Data Analysis Software v1.0 User Guide

View data trending
In the Analysis tab:
1. Click Data Trending at the right of the screen to expand the pane.The first four bins and associated peak abundance are displayed in bar chartformat and the first glycan is displayed in scatter plot format.
2. As needed in the bar chart:• Select a different attribute to display• Drag the scroll bar below the bar chart to view additional bins• Zoom
Chapter 4 Analyze and review resultsView data trending 4
GlycanAssure™ Data Analysis Software v1.0 User Guide 25
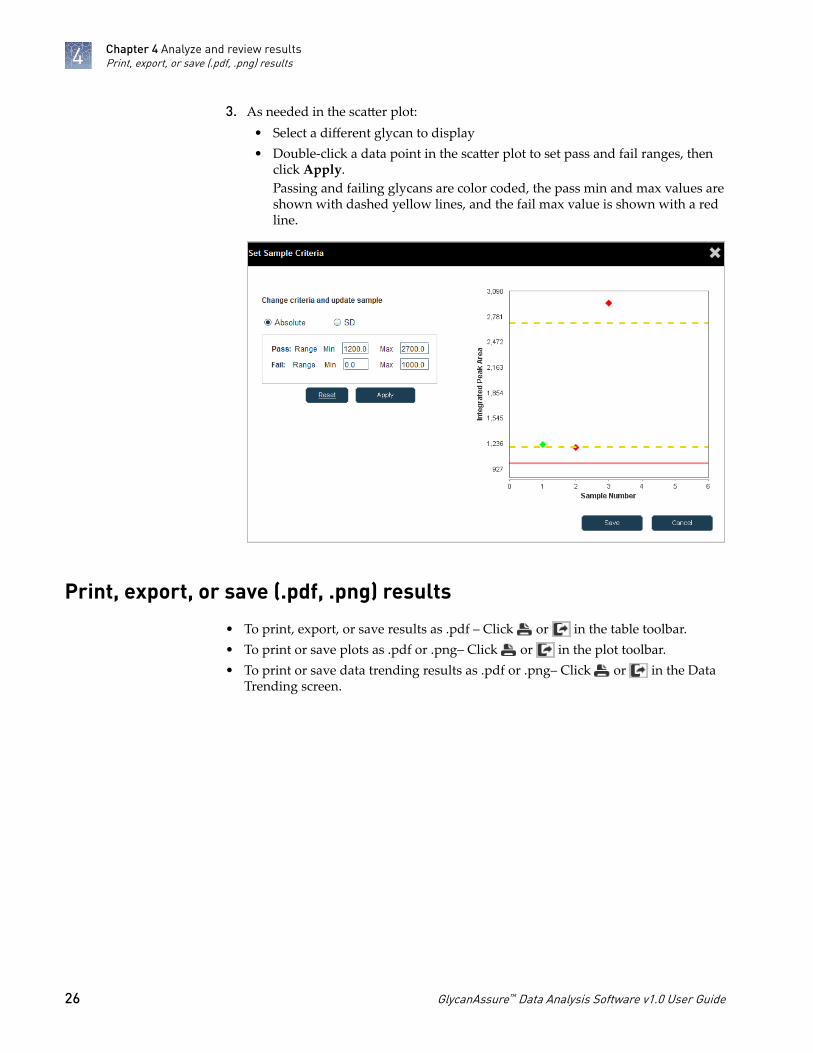
3. As needed in the scatter plot:• Select a different glycan to display• Double-click a data point in the scatter plot to set pass and fail ranges, then
click Apply.Passing and failing glycans are color coded, the pass min and max values areshown with dashed yellow lines, and the fail max value is shown with a redline.
Print, export, or save (.pdf, .png) results
• To print, export, or save results as .pdf – Click or in the table toolbar.• To print or save plots as .pdf or .png– Click or in the plot toolbar.• To print or save data trending results as .pdf or .png– Click or in the Data
Trending screen.
Chapter 4 Analyze and review resultsPrint, export, or save (.pdf, .png) results4
26 GlycanAssure™ Data Analysis Software v1.0 User Guide

Analysis flags
Table 3 Analysis flags
Flag Description Status
Analysismethod
setting forthreshold or
range
Analysis>Peak Calling
& Quality
SQ Sizing Quality SQ value is in the Pass range
SQ value is between the Pass range and the LowQuality range
SQ value is In the Fail range
SQ Range
BD Broad Peak No peaks exceed the Max Peak Width threshold.
One or more peaks exceed the Max Peak Widththreshold.
Max PeakWidth
EB Empty Bin Peaks are assigned to all the bins specified in theanalysis method
One or more bins does not have a peak assigned to it
N/A
BIN Out of Bin Allele All detected peaks are assigned to bins and areidentified
One or more detected peaks are unassigned and areun-identified
N/A
OS Off Scale No fluorescence signals within the analysis rangeexceed the signal threshold of the instrument
One or more fluorescence signals within the analysisrange exceed the signal threshold of the instrument
N/A
SQI Sizing Quality Invalid Override SQ applied N/A
SPU Spectral Pull Up No pull-up peaks are detected in the sample signal
One or more pull-up peaks are detected in the samplesignal
Pull up ratio
OMIT Sample manually omittedfrom analysis
Sample is omitted from results calculation by the user
Displays sample file name of omitted sample
N/A
Chapter 4 Analyze and review resultsAnalysis flags 4
GlycanAssure™ Data Analysis Software v1.0 User Guide 27

Compare processing
1. In the Processing tab, select a sample.
2. Assign two analysis methods to the sample by clicking the Assign button next toa method at the left of the screen, or by selecting a method from the list above thetable.
3. Click Compare Processing.
4. As needed:• Review the traces• Click Show Differences table• Select the second analysis method• Click Apply or Apply to All Samples
Chapter 4 Analyze and review resultsCompare processing4
28 GlycanAssure™ Data Analysis Software v1.0 User Guide

Zoom and unzoom
To zoom and unzoom on the x axis:• Zoom –
– Click or click-drag a box around the area or– Place the pointer above the plot until it turns into , right-click, select Zoom
To, then enter the x-axis unit to zoom to• Unzoom –
– Click or or– Place the pointer above the plot until it turns into , right-click, then select
Full View
To zoom and unzoom on the y axis:• Zoom –
– Place the pointer to the left of the plot until it turns into , then click-drag abox around the area or
– Place the pointer to the left of the plot until it turns into , right-click, selectZoom To, then enter the y-axis unit to zoom to
• Unzoom – – Place the pointer to the left of the plot until it turns into , then double-click
or– Place the pointer to the left the plot until it turns into , right-click, then
select Full View
Examine the size standard plot and curve
To investigate SQ flags:
1. In the Processing tab, select the samples of interest.
2. Click SQ Editor to view the size standard and peak assignments.
3. Ensure that all size standard peaks are present and labeled correctly. If all peaksare not present, make sure the analysis range in the analysis method is setcorrectly.
4. If the peak assignments are correct, you can override the size quality value.
5. Select the Size Calling Curve tab to view the size standard curve for the selectedsample.Red data points represent the fragments from the size standard against a blackbest-fit curve.
6. Click Apply, then OK.
Chapter 4 Analyze and review resultsZoom and unzoom 4
GlycanAssure™ Data Analysis Software v1.0 User Guide 29

Override Sizing Quality (SQ)
You can fix failed size standards in the Size Match Editor and reanalyze the samplesthat failed sizing.
1. In the Processing tab, select a sample with a failed SQ.
2. Click Size Match Editor.
3. Adjust size standard peaks as needed, then click Override SQ.After overriding the SQ values:
• The SQ flags are changed to .• Analysis status changes from to .• A appears in the SQI (Size Quality Invalid) Samples table column (if
displayed).
4. In the Processing tab, click Analyze.
Plot toolbar
Button or icon Description
Delimiters Click to change peak start and end (see “Adjustdelimiters (peak start/end) and baseline“ on page 31)
Baseline Click to change peak baseline (see “Adjust delimiters(peak start/end) and baseline“ on page 31)
Assigned/unassigned peaks Click to display peaks are assigned to bins and peaks thatare not assigned to bins
Zoom in and out. You can also click-drag on the plot tozoom.
Unzoom and fit plot to window
Save plot settings
Export Save the plot as PNG or PDF
Print plots
Click to change peak start and end and baseline (see “Adjust delimiters (peak start/end) and baseline“ onpage 31)
Overlay or separate electropherograms
Plot units Data points, RMU, or migration time
Dye colors to display in the plot
Chapter 4 Analyze and review resultsOverride Sizing Quality (SQ)4
30 GlycanAssure™ Data Analysis Software v1.0 User Guide

Adjust delimiters (peak start/end) and baseline
In the Analysis tab:
1. Select Datapoints from the plot toolbar.
2. Click to deselect all colors, then click .
3. Click Delimiters.
4. Zoom on the x axis and y axis of an assigned peak until you can see peak startand end tick marks.To zoom, move the cursor to the left of or above an axis until it changes to ,then drag around the area to zoom.
5. Click , then move the cursor over a start or end tick mark until it changes to, then click-drag the tick mark to a new location.
6. Click Analyze.
7. Click to apply the settings to the analysis method for the sample.Peaks that have been adjusted are flagged with .
Create sample groups
You can create sample groups in the Analysis tab to allow easy review of subsets ofsamples in the project.
1. Select the samples of interest in the samples list.
2. Right-click, then select Create Sample Group.
Chapter 4 Analyze and review resultsAdjust delimiters (peak start/end) and baseline 4
GlycanAssure™ Data Analysis Software v1.0 User Guide 31

Troubleshooting
Troubleshooting
Observation Possible cause Action
"Some samples are not normalized. Anormalization factor will not beapplied to un-normalized samples"message
One or more .fsa files was acquiredwith a size standard that does notspecify normalization, but theanalysis method has Enable SizeStandard Normalization enabled inthe analysis method (Processing>Alignment).
Only samples acquired with a sizestandard that specifies normalizationwill be normalized during processing.
"Assigning bin to peak failed"message
Peak is already assigned to bin No action.
Peak is not a detected peak (no startand end tick marks displayed)
Adjust peak detection if needed(“Adjust delimiters (peak start/end)and baseline“ on page 31).
In the Processing tab, the Analyzebutton is dimmed
Analysis method is not assigned tosample
Assign analysis method.
Peak is flagged with a star Peak delimiters (start, end) orbaseline were manually adjusted.
No action.
32 GlycanAssure™ Data Analysis Software v1.0 User Guide

Documentation and support
Related documents
The following related documents are available:
Document Publication number Description
3500/3500xL Genetic Analyzer with GlycanAssure™ Data AcquisitionSoftware User Guide
100036372 Describes the instrument andsoftware used to collect glycananalysis data files.
GlycanAssure™ System QuickReference
100038224 Describes the complete workflowfrom preparing samples, performingcapillary electrophoresis, throughgenerating sample results.
N-Linked Glycan Analysis User Guide 100033998 Describes sample preparation andcapillary electrophoresis using theGlycanAssure™ labeling reagents.
Note: For additional documentation, see “Customer and technical support“ onpage 33.
Customer and technical support
Visit thermofisher.com/support for the latest in services and support, including:• Worldwide contact telephone numbers• Product support, including:
– Product FAQs– Software, patches, and updates
• Order and web support• Product documentation, including:
– User guides, manuals, and protocols– Certificates of Analysis– Safety Data Sheets (SDSs; also known as MSDSs)
Note: For SDSs for reagents and chemicals from other manufacturers,contact the manufacturer.
GlycanAssure™ Data Analysis Software v1.0 User Guide 33

Limited product warranty
Life Technologies Corporation and/or its affiliate(s) warrant their products as set forthin the Life Technologies' General Terms and Conditions of Sale found on LifeTechnologies' website at www.thermofisher.com/us/en/home/global/terms-and-conditions.html. If you have any questions, please contact LifeTechnologies at www.thermofisher.com/support.
Documentation and supportLimited product warranty
34 GlycanAssure™ Data Analysis Software v1.0 User Guide

Index
3500/3500xL Genetic Analyzer 5
AAnalysis, preferences 9analysis method
assign or remove 16create 20filter 16open 21parameters 17
analyze samples 13available kits 5
Bbaseline, adjust 31BD 27BIN 27
Ccompare processing 28
DDashboard, preferences 9data, trending 25Data Acquisition Software 5Data Analysis Software 5Date format, preferences 9delimiters (peak start/end), adjust 31documentation, related 33
EEB 27electropherogram plot
save as .pdf or .png 10, 26view 24
EPT, view 12experiment name, search for 11export results 10, 26
Fflags
analysis 27processing 15
GGlycanAssure Kits, available kits 5
Iinjection name, search for 11
Kkits. See GlycanAssure Kits
Llimited product warranty 34LMNF 15LMQ 15
OOMIT 27OS 15, 27override SQ 30
Ppdf, save results 10, 26peak
baseline, adjust 31integrate manually 31start and end, adjust 31
plot, view 24plot toolbar 30png, save results 10, 26preferences 9print, results 10, 26Processing, preferences 9project
change name or description 13
GlycanAssure™ Data Analysis Software v1.0 User Guide 35
create, open, save 11favorite 13import samples 12preferences 9search for 11
Rraw data, view 12related documentation 33Replace with index term 5report, view 13Reports, preferences 9results
bar chart 25export 10, 26print 10, 26samples table 22scatter plot 25
run name, search for 11
Ssample
analyze 13import into project 12info from data acquisition 12name, search for 11, 12
sample group 31sample path, define 14samples 12search
experiment name 11injection name 11peak calls 23
project 11results 23run name 11sample 11
SFNF 15size standard, plot and curve 29size standard definition, create 21sizing quality. See SQsoftware 5SPK 27SPU 27SQ, override 30SQI 15, 27status, analysis 14STDNF 15system overview 5
Ttable settings
apply 13create 13set as default 13
terms and conditions 34troubleshoot 32troubleshooting 32
Wwarranty 34workflow 6
Zzoom and unzoom 29
Index
36 GlycanAssure™ Data Analysis Software v1.0 User Guide


For support visit thermofisher.com/support or email [email protected]
thermofisher.com
15 February 2016


