Page 1
Glyoxal yield from isoprene oxidation and relation to formaldehyde:chemical mechanism, constraints from SENEX aircraftobservations, and interpretation of OMI satellite dataChristopher Chan Miller1, Daniel J. Jacob1,2, Eloise A. Marais1, Karen Yu2, Katherine R. Travis2, PatrickS. Kim1, Jenny A. Fisher3, Lei Zhu2, Glenn M. Wolfe4,5, Frank N. Keutsch6, Jennifer Kaiser6,a,Kyung-Eun Min7,8,b, Steven S. Brown8,9, Rebecca A. Washenfelder7,8, Gonzalo González Abad10, andKelly Chance10
1Department of Earth and Planetary Sciences, Harvard University, Cambridge, MA, USA2School of Engineering and Applied Sciences, Harvard University, Cambridge, MA, USA3School of Chemistry and School of Earth and Environmental Sciences, University of Wollongong, Wollongong, NSW,Australia4Atmospheric Chemistry and Dynamics Lab, NASA Goddard Space Flight Center, Greenbelt, MD, USA5Joint Center for Earth Systems Technology, University of Maryland Baltimore County, Baltimore, MD, USA6Department of Chemistry, University of Wisconsin Madison, Madison, WI, USA7Cooperative Institute for Research in Environmental Sciences, University of Colorado Boulder, Boulder, CO, USA8Chemical Sciences Division, NOAA Earth System Research Laboratory, Boulder, CO, USA9Department of Chemistry and Biochemistry, University of Colorado, Boulder, CO, USA10Harvard-Smithsonian Center for Astrophysics, Cambridge MA, USAanow at: School of Engineering and Applied Sciences, Harvard University, Cambridge MA, USAbnow at: School of Earth Sciences and Environmental Engineering, Gwangju Institute of Science and Technology, Gwangju,South Korea
Correspondence to: Daniel Jacob ([email protected] )
Abstract.
Glyoxal (CHOCHO) is produced in the atmosphere by oxidation of volatile organic compounds (VOCs). It is measurable
from space by solar backscatter along with formaldehyde (HCHO), another oxidation product of VOCs. Isoprene emitted by
vegetation is the dominant source of CHOCHO and HCHO in most of the world. We use aircraft observations of CHOCHO
and HCHO from the SENEX campaign over the Southeast US in summer 2013 to better understand the time-dependent yields5
from isoprene oxidation, their dependences on nitrogen oxides (NOx≡NO +NO2), the behaviour of the CHOCHO-HCHO
relationship, the quality of OMI satellite observations, and the implications for using satellite CHOCHO observations as con-
straints on isoprene emission. We simulate the SENEX and OMI observations with the GEOS-Chem chemical transport model
featuring a new chemical mechanism for CHOCHO formation from isoprene. The mechanism includes prompt CHOCHO
formation under low-NOx conditions following the isomerization of the isoprene peroxy radical (ISOPO2). The SENEX ob-10
servations provide support for this prompt CHOCHO formation pathway, and are generally consistent with the GEOS-Chem
mechanism. Boundary layer CHOCHO and HCHO are strongly correlated in the observations and the model, with some de-
parture under low-NOx conditions due to prompt CHOCHO formation. SENEX vertical profiles indicate a free tropospheric
CHOCHO background that is absent from the model. The OMI CHOCHO data provide some support for this free tropospheric
1
Atmos. Chem. Phys. Discuss., doi:10.5194/acp-2016-1042, 2016Manuscript under review for journal Atmos. Chem. Phys.Published: 29 November 2016c© Author(s) 2016. CC-BY 3.0 License.
Page 2
background and show Southeast US enhancements consistent with the isoprene source but a factor of 2 too low. Part of this
OMI bias is due to excessive surface reflectivities assumed in the retrieval. The OMI CHOCHO and HCHO seasonal data over
the Southeast US are tightly correlated and provide redundant proxies of isoprene emission. Higher temporal resolution in fu-
ture geostationary satellite observations may enable detection of the prompt CHOCHO production under low-NOx conditions
apparent in the SENEX data.5
1 Introduction
Glyoxal (CHOCHO) and formaldehyde (HCHO) are short-lived products of the atmospheric oxidation of volatile organic
compounds (VOCs). Both are detectable from space by solar backscatter (Chance et al., 2000; Wittrock et al., 2006). Isoprene
emitted by terrestrial vegetation accounts for about a third of the global source of non-methane VOCs (NMVOCs) (Guenther
et al., 2012) and drives large enhancements of CHOCHO and HCHO in the continental boundary layer (Palmer et al., 2003;10
Fu et al., 2008). Satellite observations of HCHO have been widely used as a proxy to estimate isoprene emission (Abbot et al.,
2003; Palmer et al., 2006; Millet et al., 2008; Curci et al., 2010; Barkley et al., 2013), but there are uncertainties related to
the HCHO yield from isoprene oxidation (Marais et al., 2012) and the role of other NMVOCs as HCHO precursors (Fu et al.,
2007). CHOCHO observations from space could provide a complementary constraint (Vrekoussis et al., 2009, 2010; Alvarado
et al., 2014; Chan Miller et al., 2014). Here we use CHOCHO and HCHO aircraft observations over the Southeast United15
States from the Summer 2013 Southeast Nexus (SENEX) campaign (Warneke et al., 2016), interpreted with the GEOS-Chem
chemical transport model (CTM), to test understanding of the CHOCHO yield from isoprene oxidation, its dependence on
nitrogen oxide radicals (NOx ≡NO +NO2), and the combined value of the HCHO-CHOCHO pair measured from space to
constrain isoprene emissions and chemistry.
Isoprene impacts air quality and climate as a precursor to ozone (Geng et al., 2011) and secondary organic aerosol (SOA)20
(Carlton et al., 2009), and also affects concentrations of hydrogen oxide radicals (HOx ≡OH+peroxy radicals) (Peeters
and Muller, 2010) and NOx (Mao et al., 2013; Fisher et al., 2016). Atmospheric oxidation of isoprene by OH takes place
on a timescale of less than an hour to produce organic peroxy radicals (ISOPO2). Reaction of ISOPO2 with NO drives
production of ozone and of organic nitrates that serve as a reservoir for NOx (Browne and Cohen, 2012). At lower NOx levels,
ISOPO2 reacts dominantly with HO2 to produce isoprene epoxydiols (IEPOX) via isoprene peroxides (ISOPOOH) (Paulot25
et al., 2009b), and from there isoprene SOA (Marais et al., 2016). ISOPO2 can also isomerize to generate HOx radicals (Peeters
et al., 2009; Crounse et al., 2011; Peeters et al., 2014).
The fate of ISOPO2 determines the production rates and overall yields of CHOCHO and HCHO. Several studies have
provided insight on the time- and NOx-dependent yield of HCHO (Palmer et al., 2003; Marais et al., 2012; Wolfe et al., 2016).
Under high-NOx conditions, HCHO production is sufficiently prompt that observed HCHO columns can be locally related30
to isoprene emission rates (Palmer et al., 2006). This assumption is the basis of many studies that have used satellite HCHO
observations to constrain isoprene emissions (Palmer et al., 2006; Fu et al., 2007; Millet et al., 2008; Curci et al., 2010). HCHO
production is much slower under low-NOx conditions, spatially "smearing" the local relationship between isoprene emissions
2
Atmos. Chem. Phys. Discuss., doi:10.5194/acp-2016-1042, 2016Manuscript under review for journal Atmos. Chem. Phys.Published: 29 November 2016c© Author(s) 2016. CC-BY 3.0 License.
Page 3
and HCHO columns. This has been addressed by using concurrent satellite data for NO2 columns to correct the isoprene-
HCHO relationship (Marais et al., 2012) or by using adjoint-based inverse modeling to relate HCHO columns to isoprene
emissions including the effect of transport (Fortems-Cheiney et al., 2012).
Isoprene is estimated to account for about ∼ 50% of global CHOCHO production (Fu et al., 2008), but there is large
uncertainty regarding the yield. Open fires and aromatic VOCs also produce CHOCHO with high yield (Volkamer et al.,5
2001; Fu et al., 2008; Chan Miller et al., 2016). Several studies have used the measured CHOCHO-HCHO concentration ratio
RGF = [CHOCHO]/[HCHO] as an indicator of the dominant VOC precursors. Vrekoussis et al. (2010) found higher RGF
values (> 0.04) from GOME-2 satellite observations in regions where biogenic VOCs are dominant, and lower values where
anthropogenic VOCs are dominant. However, the opposite behaviour is observed from ground-based studies (DiGangi et al.,
2012). Our recent CHOCHO retrieval from the OMI satellite instrument (Chan Miller et al., 2014) is in better agreement with10
surface observations of CHOCHO and RGF (Kaiser et al., 2015) as a result of improved background corrections and removal
of NO2 interferences. There remains the question of how observed CHOCHO-HCHO relationships are to be interpreted.
The Southeast Nexus (SENEX) aircraft campaign was conducted over the Southeast United States in June-July 2013. The
aircraft had a detailed chemical payload including in situ CHOCHO (Min et al., 2016) and HCHO (Cazorla et al., 2015).
Thirteen daytime flights were conducted over the campaign with extensive boundary layer coverage. A previous comparison of15
the SENEX observations to AM3 CTM simulations highlighted the CHOCHO yield uncertainty in current isoprene oxidation
mechanisms (Li et al., 2016). Here we present an improved chemical mechanism for CHOCHO formation from isoprene for
the GEOS-Chem CTM. We use the SENEX observations to evaluate the CHOCHO formation pathways from isoprene in the
new mechanism and in the Master Chemical Mechanism v3.3.1 (Jenkin et al., 2015). Wolfe et al. (2016) used their SENEX
HCHO observations to analyze the HCHO yield from isoprene and its time- and NOx-dependence. We apply here some of the20
same methods to analyze the CHOCHO yield.
2 GEOS-Chem Model Description
2.1 General Description
We use the same version of GEOS-Chem v9.2 (http://www.geos-chem.org) that has been used previously to interpret obser-
vations from the NASA SEAC4RS aircraft campaign conducted in the same Southeast US region in August-September 201325
(Toon et al., 2016). The model is driven by assimilated meteorological data with 0.25◦×0.3125◦ horizontal resolution from the
Goddard Earth Observing System (GEOS-FP) reanalysis product (Molod et al., 2012). The native 0.25◦× 0.3125◦ resolution
is retained in GEOS-Chem over the North American domain (130◦−60◦W, 9.75◦−60◦N ), nested within a global simulation
at 2◦× 2.5◦ resolution (Kim et al., 2015). Isoprene chemistry in v9.2 is as described by Mao et al. (2013), but the SEAC4RS
simulation includes a number of updates described by Travis et al. (2016) and Fisher et al. (2016). The simulation presented30
here includes further modifications relevant to CHOCHO, listed in the supplementary material (Table S1), and summarized
below. Evaluation of the model with SEAC4RS observations has been presented by Kim et al. (2015) for aerosols,Travis et al.
3
Atmos. Chem. Phys. Discuss., doi:10.5194/acp-2016-1042, 2016Manuscript under review for journal Atmos. Chem. Phys.Published: 29 November 2016c© Author(s) 2016. CC-BY 3.0 License.
Page 4
(2016) for ozone and NOx, Fisher et al. (2016) for organic nitrates, Marais et al. (2016) for isoprene SOA, and Zhu et al. (2016)
for HCHO including satellite validation.
Isoprene emissions in the model are from MEGANv2.1 (Guenther et al., 2012) with a 15% reduction (Kim et al., 2015), and
NOx emissions are as described by Travis et al. (2016) including a 50% decrease in the anthropogenic source relative to the
2013 National Emission Inventory of the U.S. Environmental Protection Agency. Yu et al. (2016) pointed out that isoprene and5
NOx emissions in the Southeast US are spatially segregated and show that the 0.25◦× 0.3125◦ resolution of GEOS-Chem is
adequate for separating the populations of high- and low-NOx conditions for isoprene oxidation.
2.2 CHOCHO Formation from Isoprene and Loss Pathways
Figure 1 shows the CHOCHO formation pathways from isoprene oxidation by OH (the main isoprene sink) as implemented
in this work. Oxidation is initiated by OH addition to the terminal carbons of the isoprene double bonds (positions 1 and 4,10
Figure 1). Isoprene peroxy radicals (ISOPO2) are formed by O2 addition to the carbon either in β or δ to the hydroxyl carbon.
ISOPO2 reacts with NO and HO2, and also isomerizes. Together these pathways represent 92% of ISOPO2 loss, with the
remainder due to reactions with organic peroxy radicals.
Under high-NOx conditions, CHOCHO is produced promptly via products of the δ isomers (HC5, DIBOO) (Paulot et al.,
2009a; Galloway et al., 2011). CHOCHO production via the β isomers is slower, due to the intermediary production of15
methylvinylketone (MVK) followed by glycolaldehyde (GLYC). GEOS-Chem originally had a fixed δ branching ratio of
24% for the reaction of ISOPO2 + NO, based on the chamber experiments of Paulot et al. (2009a). However recent work has
shown that O2 addition to the isoprene-OH adducts is reversible (pink pathway, Figure 1), allowing interconversion between
β and δ ISOPO2 isomers (Peeters et al., 2009; Crounse et al., 2011; Peeters et al., 2014). β isomers are heavily favoured at
equilibrium, accounting for∼ 95% of ISOPO2 (Peeters et al., 2014). The experimental conditions in Paulot et al. (2009a) used20
high NO concentrations (∼ 500 ppbv). This implies short ISOPO2 lifetimes, and thus may not reflect the degree of isomer in-
terconversion seen at ambient oxidant levels. Here we adopt a δ−ISOPO2 branch ratio of 10%, following Fisher et al. (2016),
to match SEAC4RS observations of organic nitrates produced through the δ−ISOPO2 + NO pathway.
CHOCHO forms under low-NOx conditions through isoprene epoxydiols (IEPOX) and through the ISOPO2 isomerization
pathway. IEPOX forms as second-generation non-radical product of isoprene oxidation via ISOPOOH, and thus represents a25
slow CHOCHO formation pathway. IEPOX isomer fractions in GEOS-Chem are based on equilibrium δ/β ISOPO2 branching
ratios (Bates et al., 2014; Travis et al., 2016). At low NOx levels the ISOPO2 lifetime is sufficiently long for equilibrium to be
reached (Peeters et al., 2014). ISOPO2 isomerization in the previous GEOS-Chem mechanism of Travis et al. (2016) produced
solely hydroperoxyaldehydes (HPALDs), but here we also include the formation of dihydroperoxy α-formyl peroxy radicals
(di-HPCARPs) (Peeters et al., 2014) following the Master Chemical Mechanism v3.3.1 (MCMv3.3.1) (Jenkin et al., 2015).30
di-HPCARPs in MCMv3.3.1 have a low CHOCHO yield, but here we introduce a (1,5)H-shift isomerization of di-HPCARPs
that could be competitive with the (1,4)H-shift isomerization due to the presence of the terminal-peroxide functional group
(Crounse et al., 2013). The resulting di-hydroperoxide dicarbonyl compound (DHDC) product quickly photolyzes to produce
4
Atmos. Chem. Phys. Discuss., doi:10.5194/acp-2016-1042, 2016Manuscript under review for journal Atmos. Chem. Phys.Published: 29 November 2016c© Author(s) 2016. CC-BY 3.0 License.
Page 5
CHOCHO, analagous to the mechanisms proposed for HPALDs (Peeters et al., 2014) and carbonyl nitrates (Müller et al., 2014).
We find that this pathway can explain SENEX observations of prompt CHOCHO production under low-NOx conditions.
GEOS-Chem includes CHOCHO loss via photolysis and oxidation by OH. Pressure-dependent CHOCHO photolysis rates
are computed using the FAST-JX radiative transfer model (http://www.ess.uci.edu/~prather/fastJX.html). CHOCHO loss via
aerosol reactive uptake does not significantly alter daytime CHOCHO concentrations because the CHOCHO lifetime against5
OH and photolysis is short (1-2 h). Since we only consider daytime observations (10-17 local), our model evaluation is not
sensitive to aerosol reactive uptake, in contrast with a previous CTM comparison to SENEX by Li et al. (2016) where no time
filtering was applied.
2.3 Time- and NOx-dependent CHOCHO and HCHO yields from isoprene
Understanding the time- and NOx-dependent yields of CHOCHO and HCHO from isoprene oxidation is critical for inter-10
preting observed CHOCHO and HCHO columns from space in terms of isoprene emissions. Here we examine time-dependent
CHOCHO and HCHO molar yields in the GEOS-Chem and MCMv3.3.1 chemical mechanisms using the DSMACC box model
(Emmerson and Evans, 2009). Simulations are initiated at 9am local time with 1 ppbv isoprene, 40 ppbv O3, and 100 ppbv CO.
NOx concentrations are held at fixed values. Photolysis rates are calculated for clear-sky with the TUV radiative transfer model
(Madronich, 1987). To correct for differences in time-dependent yields associated with differences in OH concentrations, we15
reference GEOS-Chem and MCMv3.3.1 results to a common "OH exposure time" variable (tOH );
tOH =1
[OH]ref
t∫
0
[OH](t′)dt′ (1)
Here [OH](t) is the OH concentration simulated in the box model, and [OH]ref = 4× 10⁶ molecules cm−3 is a reference
OH concentration representative of summer daytime conditions over the Southeast US (Wolfe et al., 2016). For a fixed [OH]=
4× 10⁶ molecules cm−3 tOH represents the actual time.20
Figure 2 shows the time- and NOx-dependent cumulative molar yields of CHOCHO and HCHO in GEOS-Chem and
MCMv3.3.1. The branching ratio of ISOPO2 as a function of NOx is also shown. The time-dependent HCHO yields in
both mechanisms are similar under high-NOx conditions. Additional confidence in the HCHO yield under these conditions
is offered by the ability of GEOS-Chem to reproduce the observed correlation between HCHO and isoprene organic nitrates
(Mao et al., 2013; Fisher et al., 2016). The HCHO yield is lower under low-NOx conditions in both mechanisms, and overall25
the difference between them is minor.
There is far more disagreement between the two mechanisms for CHOCHO yields. Under high-NOx conditions, GEOS-
Chem produces CHOCHO rapidly in the first two hours due to its higher δ−ISOPO2 + NO branching ratio (10% in GEOS-
Chem vs. 3.4% in MCMv3.3.1). This is compensated at longer OH-exposure times by higher GLYC yields from isoprene in
MCMv3.3.1. GEOS-Chem produces higher ultimate yields of CHOCHO under low-NOx conditions mainly due to DHDC30
formation and subsequent photolysis, neither of which are included in MCMv3.3.1. The NOx-dependence of the CHOCHO
5
Atmos. Chem. Phys. Discuss., doi:10.5194/acp-2016-1042, 2016Manuscript under review for journal Atmos. Chem. Phys.Published: 29 November 2016c© Author(s) 2016. CC-BY 3.0 License.
Page 6
yield in MCMv3.3.1 is similar to that of HCHO, implying that CHOCHO and HCHO observations would provide redundant
information on isoprene emissions. The SENEX observations indicate that CHOCHO yields under low-NOx conditions are
too low in MCMv3.3.1, as discussed below. In GEOS-Chem, by contrast, the CHOCHO and HCHO yields show opposite
dependences on NOx, implying that they could provide complementary information on isoprene emissions.
3 Constraints from SENEX observations5
Figure 3 shows the observed and simulated median vertical profiles of CHOCHO, HCHO, and NOx concentrations along the
SENEX flight tracks. Figure 4 shows maps of concentrations below 1 km altitude (above ground level) taken as the mixed
layer. Here and elsewhere we only include daytime observations (10-17 local) and exclude targeted sampling of biomass
burning plumes (diagnosed by acetonitrile concentrations above 200 pptv). CHOCHO, HCHO and NOx were measured by
the Airborne Cavity Enhanced Spectrometer (ACES) (Min et al., 2016), In-Situ Airborne Formaldehyde (ISAF) instrument10
(Cazorla et al., 2015), and the NOAA chemiluminescence instrument (Ryerson et al., 1999; Pollack et al., 2010), with stated
accuracies of 6%, 10%, and 5% respectively.
Simulated median NOx concentrations in the mixed layer are within 10% of observations, supporting the 50% reduction in
EPA NEI NOx emissions previously inferred from the analysis of SEAC4RS observations by Travis et al. (2016), also included
here (Section 2.1). Half of isoprene oxidation in the model under the SENEX conditions takes place by the low-NOx pathways15
(Figure 1). Simulated median CHOCHO and HCHO concentrations in the mixed layer are within 20% of observations, but the
model is too low at higher altitudes. During SENEX the mixed layer was typically capped by a neutrally stable transition layer
of shallow cumulus convection which extended up to 3 km (Wagner et al., 2015), suggesting that transport via this mechanism
is underestimated in the model. The CHOCHO observations in the free troposphere (> 3 km) have to be treated with caution
since they are close to the instrument detection limit (Kaiser et al., 2015). It is therefore difficult to determine whether the20
bias is due to a missing CHOCHO source in the model or instrument artifact. Elevated CHOCHO concentrations above the
boundary layer have also been observed in previous campaigns over the Southeast US (Lee et al., 1998), California (Baidar
et al., 2013), and the remote Pacific (Volkamer et al., 2015). There could be a free tropospheric source missing in the model,
but it is unclear what this source could be, and correlative analysis in the SENEX observations offer no insight.
The mixed layer concentrations maps in Figure 4 show that the model captures some of the horizontal variability in the25
observations. The spatial correlation for HCHO is high (r = 0.75) as in SEAC4RS (r = 0.64, Zhu et al. (2016)), and reflects
isoprene emission patterns. Correlation for CHOCHO is also relatively strong (r = 0.51). Average mixed layer CHOCHO and
HCHO concentrations simulated by the model for the SENEX period are much more uniform than those sampled along the
SENEX flight tracks, as shown in the GEOS-Chem panels of Figure 4. This is because of day-to-day variability in isoprene
emissions, mostly driven by temperature (Zhu et al., 2016).30
Figure 5 compares simulated and observed CHOCHO vs. HCHO relationships in the mixed layer color coded by NOx
concentrations. Correlation between the two species is strong, and model and observations are consistent. This might suggest
6
Atmos. Chem. Phys. Discuss., doi:10.5194/acp-2016-1042, 2016Manuscript under review for journal Atmos. Chem. Phys.Published: 29 November 2016c© Author(s) 2016. CC-BY 3.0 License.
Page 7
that CHOCHO and HCHO provide redundant information for constraining isoprene emissions. However, examination of Figure
5 indicates some NOx sensitivity, which will be discussed further below.
Measurements of isoprene (ISOP) and total methylvinylketone + methacrolein (MVK+MACR) made by proton transfer
mass spectrometry from the SENEX aircraft (de Gouw and Warneke, 2007) allow some evaluation of GEOS-Chem CHOCHO
and HCHO yields by using the parcel model of Wolfe et al. (2016) to infer initial isoprene [ISOP]0 and OH exposure time5
tOH . The evolution of ISOP and MACR concentrations within the parcel is given by
ISOP +OHk1→ YMACR(NO)MACR (R1)
MACR+OHk2→ products (R2)
Here YMACR(NO) is the NO-dependent yield of MACR from isoprene, and k1 and k2 are the rate constants for the10
reactions of OH with ISOP and MACR respectively, all given by Wolfe et al. (2016). Whole air samples (Lerner et al., 2016)
during SENEX indicated a uniform [MVK]/[MACR] ratio of 2.3± 0.2 mol mol−1 so that the MACR concentrations can be
inferred from the higher-frequency MVK+MACR measurement. For an air parcel initially containing only isoprene we derive
the following expression for the ratio of MACR to isoprene as sampled by the aircraft.
[MACR][ISOP ]
=YMACR(NO)k1
k2− k1(1− exp((k1− k2)[OH]ref tOH)) (2)15
We use equation 2 to calculate tOH from the observed [MACR]/[ISOP] ratios and from there to infer the initial isoprene
concentration [ISOP]0=[ISOP]exp(k1[OH]reftOH). The calculation is applied to the ensemble of SENEX data below 1 km
altitude and yields tOH in the range of 0.25 - 1.5 h.
Figure 6 shows the observed relationships of CHOCHO and HCHO concentrations vs. initial isoprene color coded by NOx
concentrations. High-NOx and low-NOx conditions can be separated by envelopes using linear regression fits to the data with20
NOx concentrations above 800 pptv and below 200 pptv respectively (Figure 2). The observed slopes increase by at least a
factor of two for both CHOCHO and HCHO in the transition from low- to high-NOx conditions. This is well reproduced
by GEOS-Chem, even though the model CHOCHO yield is NOx-independent over the first few hours of isoprene oxidation
(Figure 2). The higher CHOCHO under high-NOx conditions in GEOS-Chem is due to longer photochemical aging, as OH
concentrations increase with increasing NOx. Overall the comparison in Figure 6 provides support for the CHOCHO and25
HCHO yields computed by GEOS-Chem and their dependences on NOx.
Previous studies have used the RGF =[CHOCHO]/[HCHO] ratio as an indicator for different VOC precursors (Vrekoussis
et al., 2010; DiGangi et al., 2012). In the Southeast US, isoprene is the dominant source of both. In this case variations in
RGF would be expected to reflect differences in the chemical environment for isoprene oxidation, and the information may be
useful for relating satellite column observations to isoprene emission. Figure 7 shows RGF as a function of NOx below 1 km30
7
Atmos. Chem. Phys. Discuss., doi:10.5194/acp-2016-1042, 2016Manuscript under review for journal Atmos. Chem. Phys.Published: 29 November 2016c© Author(s) 2016. CC-BY 3.0 License.
Page 8
in the SENEX observations and as simulated by GEOS-Chem. Points are color coded by OH exposure time tOH (Equation 1),
derived from the parcel model. The median and interquartile RGF values binned in 250 pptv NOx increments are also shown.
The observed median RGF values (0.02 to 0.024 mol mol−1) show no significant dependence on NOx, while GEOS-Chem
shows a weak dependence. In both the model and observations there is a subset of low-NOx points with higher RGF values
(0.03-0.06). These correspond to short OH exposure times and are caused by OH titration by isoprene. The high RGF reflects5
the relatively faster production of CHOCHO than HCHO in the early stage of isoprene oxidation under low-NOx conditions
as shown by Figure 2. The presence of that population in the observations provides support for fast glyoxal production from
the isomerization pathway of isoprene oxidation (Figure 1) that is present in GEOS-Chem but not in MCMv3.3.1.
4 Implications for satellite observations
Knowledge gained from SENEX enables an improved interpretation of CHOCHO and HCHO column observations from space10
in isoprene dominated environments. We use for this purpose June-August 2006-2007 observations of CHOCHO, HCHO, and
tropospheric NO2 columns from the Ozone Monitoring Instrument (OMI). OMI was launched onboard the NASA Aura satellite
in July 2004, and provides daily global coverage in sun-synchronous orbit with an equatorial crossing time of 13:40 LT. The
CHOCHO data are from the Smithsonian Astrophysical Observatory (SAO) retrieval described in Chan Miller et al. (2014) and
hereby referred to as OMI SAO. The HCHO and NO2 data are from the OMI Version 3 product release (González Abad et al.,15
2015; Bucsela et al., 2013). Retrievals are in the 435-461 nm spectral range for CHOCHO, 328.5-356.5 nm for HCHO, and
405-465 nm for NO2. We use 2006-2007 data because 2013 data for CHOCHO are very noisy (Figure S1), possibly because
of sensor degradation.
Slant columns along the optical path of the backscattered solar radiation are fitted to the observed spectra and converted to
vertical columns by division with an air mass factor (AMF) that accounts for the viewing geometry, atmospheric scattering,20
and the vertical profile of the gas (Palmer et al., 2001):
AMF =
∞∫
0
w(z)s(z)dz (3)
Here w(z) is the scattering weight measuring the sensitivity of the retrieval to the gas concentration at altitude z, and s(z)
is a normalized vertical profile of gas number density. Here we recomputed the AMFs for the three retrievals using vertical
profiles from GEOS-Chem, as it is necessary for comparing simulated and observed vertical columns (Duncan et al., 2014). We25
remove observations impacted by the row anomaly (http://www.knmi.nl/omi/research/product/rowanomaly-background.php),
and those with cloud fractions over 20%. Previous validation of the OMI HCHO retrievals with SEAC4RS aircraft observations
revealed a 43% uniform low bias (Zhu et al., 2016), corrected in the data shown here.
Figure 8 compares CHOCHO and HCHO vertical columns from GEOS-Chem and OMI, and Figure 9 shows spatial cor-
relations over the eastern US. Excellent agreement is found for HCHO, providing an independent test of the correction to30
the OMI HCHO retrieval inferred from the SEAC4RS data (Zhu et al., 2016). CHOCHO from OMI is highly correlated with
8
Atmos. Chem. Phys. Discuss., doi:10.5194/acp-2016-1042, 2016Manuscript under review for journal Atmos. Chem. Phys.Published: 29 November 2016c© Author(s) 2016. CC-BY 3.0 License.
Page 9
GEOS-Chem (r = 0.76), indicative of the isoprene source. However OMI CHOCHO shows a higher continental background
and a factor of 2 weaker enhancement over the Southeast US.
Zhu et al. (2016) suggested that errors in the assumed surface reflectivities affecting the AMFs were an important source of
the bias in the OMI HCHO retrievals. CHOCHO retrievals are even more sensitive to surface reflectivity because of the longer
wavelengths. Russell et al. (2011) previously pointed out that the OMI surface reflectivities used in the standard NO2 retrievals5
(Kleipool et al., 2008) were too high and replaced them with high resolution (0.05◦× 0.05◦) reflectivity observations from
MODIS (Schaaf and Wang, 2015) to produce the Berkeley High-Resolution (BEHR) OMI NO2 retrieval. CHOCHO and NO2
are retrieved at similar wavelengths so the sensitivity to surface reflectivity should be similar. Figure 8 (bottom right) shows
the mean CHOCHO scattering weights computed from the OMI-SAO and BEHR. The lower BEHR surface reflectivity values
result in a lower AMF and hence a higher vertical column (Figure 8, bottom left panel). The slope of the regression between10
GEOS-Chem and OMI CHOCHO columns increases from 0.46 to 0.57, improving but not reconciling the differences.
As pointed out above, SENEX and other observations suggest that GEOS-Chem may be missing a source of CHOCHO in
the free troposphere (Figure 3), although it is not clear what this source might be. Integration of the median CHOCHO profile
above 2 km in Figure 3 shows a negative model bias of 1.3×10¹⁴ molecules cm−2, comparable to the continental background
intercept in Figure 9 (1.7× 10¹⁴ molecules cm−2). The presence of free tropospheric CHOCHO would further impact the15
AMF calculation under continental background conditions since the retrieval sensitivity as measured by the scattering weights
increases with altitude. Thus the retrieved continental background would be overestimated.
Figure 10 shows CHOCHO vs. HCHO relationships for OMI (using the BEHR scattering weights) and GEOS-Chem, color
coded by tropospheric NO2 columns. Individual points are seasonal averages (data points from Figure 8) in order to limit noise.
The slope is steeper in GEOS-Chem because the CHOCHO columns are higher. Since GEOS-Chem reproduces the aircraft20
CHOCHO-HCHO relationship without bias (Figure 5), this is further evidence of bias in the OMI CHOCHO observations. The
CHOCHO-HCHO relationship is tight in both OMI (r = 0.83) and GEOS-Chem (r = 0.99), with no indication of a separate
population of low-NOx points with high RGF as there was in the SENEX data. It thus appears from the OMI data that satellite
observations of CHOCHO and HCHO in isoprene-dominated environments are redundant. This may reflect the higher NOx
levels in 2006-2007 compared to 2013 (Russell et al., 2012). However since median RGF shows no significant variation with25
NOx in the SENEX data (Figure 7), the required temporal averaging of satellite observations is a more likely explanation
for the tight correlation. Finer-scale and more temporally resolved data, as will be available from the TEMPO geostationary
instrument to be launched in the 2018-2020 time frame (Zoogman et al., 2016), may provide new perspectives of the utility of
the CHOCHO retrieval.
5 Conclusions30
We have used aircraft observations of glyoxal (CHOCHO), formaldehyde (HCHO), and related species from the SENEX
aircraft campaign over the Southeast US together with OMI satellite data to better understand the CHOCHO yield from isoprene
9
Atmos. Chem. Phys. Discuss., doi:10.5194/acp-2016-1042, 2016Manuscript under review for journal Atmos. Chem. Phys.Published: 29 November 2016c© Author(s) 2016. CC-BY 3.0 License.
Page 10
and the complementarity of CHOCHO and HCHO observations from space for constraining isoprene emissions. This work
includes a first validation of the CHOCHO retrieval from the OMI satellite instrument.
We began with an analysis of the time- and NOx dependent CHOCHO and HCHO yields from isoprene oxidation in the
GEOS-Chem chemical transport model and in the Master Chemical Mechanism (MCMv3.3.1). The GEOS-Chem mechanism
features several updates relevant to CHOCHO formation. These include a decrease in the δ−ISOPO2 + NO branching ratio5
leading to prompt CHOCHO production under high-NOx conditions, and a low-NOx pathway for prompt CHOCHO forma-
tion from a (1,5)H-shift isomerization of dihydroperoxy α-formyl peroxy radicals formed through the ISOPO2 isomerization
pathway (proposed here). GEOS-Chem and MCMv3.3.1 show similar HCHO yields from isoprene, increasing with increasing
NOx. CHOCHO yields from isoprene in MCMv3.3.1 show behavior similar to HCHO but GEOS-Chem has a higher yield at
low-NOx from the ISOPO2 isomerization pathway.10
Comparison of GEOS-Chem to the SENEX observations of CHOCHO and HCHO shows good agreement in the bound-
ary layer but a negative CHOCHO model bias in the free troposphere. This could reflect an instrument artifact but may also
imply a missing background source in the model. Mixed layer (< 1 km) observations show a strong CHOCHO-HCHO rela-
tionship that is reproduced in GEOS-Chem and is remarkably consistent across all conditions except at very low NOx where
the [CHOCHO]/[HCHO] ratio (RGF ) can be unusually high. This reflects prompt formation of CHOCHO under low-NOx15
conditions, which the model attributes to the new pathway via ISOPO2 isomerization followed by DHDC photolysis proposed
here (Figure 1).
The SENEX observations enable indirect validation of the OMI CHOCHO satellite data using GEOS-Chem as an inter-
comparison platform. The OMI data show a continental background that is consistent with the SENEX free tropospheric
observations, and an enhancement over the Southeast US that is consistent with the isoprene source. However this enhance-20
ment is a factor of 2 too low in the OMI data. A partial explanation is that surface reflectivities assumed in the retrieval are
too high. The satellite data show strong CHOCHO-HCHO correlation consistent with the model and imply that the two gases
provide redundant information for constraining isoprene emissions in regions where isoprene is their dominant precursor. This
may reflect the seasonal averaging in the OMI data required to reduce noise, which still may permit observation of oxidation
pathway-driven changes in the CHOCHO-HCHO relationship from future geostationary missions.25
Acknowledgements. This work was funded by NASA ACMAP and ACCDAM and is a contribution to the NASA Aura Science Team. This
research was undertaken with the assistance of resources provided at the NCI National Facility systems at the Australian National University
through the National Computational Merit Allocation Scheme supported by the Australian Government.
10
Atmos. Chem. Phys. Discuss., doi:10.5194/acp-2016-1042, 2016Manuscript under review for journal Atmos. Chem. Phys.Published: 29 November 2016c© Author(s) 2016. CC-BY 3.0 License.
Page 11
References
Abbot, D. S., Palmer, P. I., Martin, R. V., Chance, K. V., Jacob, D. J., and Guenther, A.: Seasonal and interannual variability of North American
isoprene emissions as determined by formaldehyde column measurements from space, Geophysical Research Letters, 30, n/a–n/a, 2003.
Alvarado, L. M. A., Richter, A., Vrekoussis, M., Wittrock, F., Hilboll, A., Schreier, S. F., and Burrows, J. P.: An improved glyoxal re-
trieval from OMI measurements, Atmospheric Measurement Techniques Discussions, 7, 5559–5599, doi:10.5194/amtd-7-5559-2014,5
http://www.atmos-meas-tech-discuss.net/7/5559/2014/, 2014.
Baidar, S., Oetjen, H., Coburn, S., Dix, B., Ortega, I., Sinreich, R., and Volkamer, R.: The CU Airborne MAX-DOAS instrument: vertical
profiling of aerosol extinction and trace gases, Atmospheric Measurement Techniques, 6, 719–739, doi:10.5194/amt-6-719-2013, http:
//www.atmos-meas-tech.net/6/719/2013/, 2013.
Barkley, M. P., De Smedt, I., Van Roozendael, M., Kurosu, T. P., Chance, K., Arneth, A., Hagberg, D., Guenther, A., Paulot, F., Marais, E.,10
and Mao, J.: Top-down isoprene emissions over tropical South America inferred from SCIAMACHY and OMI formaldehyde columns,
Journal of Geophysical Research: Atmospheres, 118, 6849–6868, doi:10.1002/jgrd.50552, http://dx.doi.org/10.1002/jgrd.50552, 2013.
Bates, K. H., Crounse, J. D., Clair, J. M. S., Bennett, N. B., Nguyen, T. B., Seinfeld, J. H., Stoltz, B. M., and Wennberg, P. O.: Gas
Phase Production and Loss of Isoprene Epoxydiols, The Journal of Physical Chemistry A, 118, 1237–1246, doi:10.1021/jp4107958,
http://dx.doi.org/10.1021/jp4107958, pMID: 24476509, 2014.15
Browne, E. C. and Cohen, R. C.: Effects of biogenic nitrate chemistry on the NOx lifetime in remote continental regions, Atmospheric
Chemistry and Physics, 12, 11 917–11 932, doi:10.5194/acp-12-11917-2012, http://www.atmos-chem-phys.net/12/11917/2012/, 2012.
Bucsela, E. J., Krotkov, N. A., Celarier, E. A., Lamsal, L. N., Swartz, W. H., Bhartia, P. K., Boersma, K. F., Veefkind, J. P., Gleason, J. F.,
and Pickering, K. E.: A new stratospheric and tropospheric NO2 retrieval algorithm for nadir-viewing satellite instruments: applications
to OMI, Atmospheric Measurement Techniques, 6, 2607–2626, doi:10.5194/amt-6-2607-2013, http://www.atmos-meas-tech.net/6/2607/20
2013/, 2013.
Carlton, A. G., Wiedinmyer, C., and Kroll, J. H.: A review of Secondary Organic Aerosol (SOA) formation from isoprene, Atmospheric
Chemistry and Physics, 9, 4987–5005, doi:10.5194/acp-9-4987-2009, http://www.atmos-chem-phys.net/9/4987/2009/, 2009.
Cazorla, M., Wolfe, G. M., Bailey, S. A., Swanson, A. K., Arkinson, H. L., and Hanisco, T. F.: A new airborne laser-induced fluorescence in-
strument for in situ detection of formaldehyde throughout the troposphere and lower stratosphere, Atmospheric Measurement Techniques,25
8, 541–552, doi:10.5194/amt-8-541-2015, http://www.atmos-meas-tech.net/8/541/2015/, 2015.
Chan Miller, C., Gonzalez Abad, G., Wang, H., Liu, X., Kurosu, T., Jacob, D. J., and Chance, K.: Glyoxal retrieval from the Ozone Monitor-
ing Instrument, Atmospheric Measurement Techniques, 7, 3891–3907, doi:10.5194/amt-7-3891-2014, http://www.atmos-meas-tech.net/
7/3891/2014/, 2014.
Chan Miller, C., Jacob, D. J., González Abad, G., and Chance, K.: Hotspot of glyoxal over the Pearl River delta seen from the OMI satellite30
instrument: implications for emissions of aromatic hydrocarbons, Atmospheric Chemistry and Physics, 16, 4631–4639, doi:10.5194/acp-
16-4631-2016, http://www.atmos-chem-phys.net/16/4631/2016/, 2016.
Chance, K., Palmer, P. I., Spurr, R. J. D., Martin, R. V., Kurosu, T. P., and Jacob, D. J.: Satellite observations of formaldehyde over
North America from GOME, Geophysical Research Letters, 27, 3461–3464, doi:10.1029/2000GL011857, http://dx.doi.org/10.1029/
2000GL011857, 2000.35
Crounse, J. D., Paulot, F., Kjaergaard, H. G., and Wennberg, P. O.: Peroxy radical isomerization in the oxidation of isoprene, Phys. Chem.
Chem. Phys., 13, 13 607–13 613, doi:10.1039/C1CP21330J, http://dx.doi.org/10.1039/C1CP21330J, 2011.
11
Atmos. Chem. Phys. Discuss., doi:10.5194/acp-2016-1042, 2016Manuscript under review for journal Atmos. Chem. Phys.Published: 29 November 2016c© Author(s) 2016. CC-BY 3.0 License.
Page 12
Crounse, J. D., Nielsen, L. B., Jørgensen, S., Kjaergaard, H. G., and Wennberg, P. O.: Autoxidation of Organic Compounds in the Atmosphere,
The Journal of Physical Chemistry Letters, 4, 3513–3520, doi:10.1021/jz4019207, http://dx.doi.org/10.1021/jz4019207, 2013.
Curci, G., Palmer, P. I., Kurosu, T. P., Chance, K., and Visconti, G.: Estimating European volatile organic compound emissions using
satellite observations of formaldehyde from the Ozone Monitoring Instrument, Atmospheric Chemistry and Physics, 10, 11 501–11 517,
doi:10.5194/acp-10-11501-2010, http://www.atmos-chem-phys.net/10/11501/2010/, 2010.5
de Gouw, J. and Warneke, C.: Measurements of volatile organic compounds in the earth’s atmosphere using proton-transfer-reaction mass
spectrometry, Mass Spectrometry Reviews, 26, 223–257, doi:10.1002/mas.20119, http://dx.doi.org/10.1002/mas.20119, 2007.
DiGangi, J. P., Henry, S. B., Kammrath, A., Boyle, E. S., Kaser, L., Schnitzhofer, R., Graus, M., Turnipseed, A., Park, J.-H., Weber, R. J.,
Hornbrook, R. S., Cantrell, C. A., Maudlin III, R. L., Kim, S., Nakashima, Y., Wolfe, G. M., Kajii, Y., Apel, E., Goldstein, A. H., Guenther,
A., Karl, T., Hansel, A., and Keutsch, F. N.: Observations of glyoxal and formaldehyde as metrics for the anthropogenic impact on rural10
photochemistry, Atmospheric Chemistry and Physics, 12, 9529–9543, doi:10.5194/acp-12-9529-2012, http://www.atmos-chem-phys.net/
12/9529/2012/, 2012.
Duncan, B. N., Prados, A. I., Lamsal, L. N., Liu, Y., Streets, D. G., Gupta, P., Hilsenrath, E., Kahn, R. A., Nielsen, J. E., Beyersdorf, A. J.,
Burton, S. P., Fiore, A. M., Fishman, J., Henze, D. K., Hostetler, C. A., Krotkov, N. A., Lee, P., Lin, M., Pawson, S., Pfister, G., Pickering,
K. E., Pierce, R. B., Yoshida, Y., and Ziemba, L. D.: Satellite data of atmospheric pollution for U.S. air quality applications: Examples of15
applications, summary of data end-user resources, answers to FAQs, and common mistakes to avoid, Atmospheric Environment, 94, 647 –
662, doi:http://dx.doi.org/10.1016/j.atmosenv.2014.05.061, http://www.sciencedirect.com/science/article/pii/S1352231014004270, 2014.
Emmerson, K. M. and Evans, M. J.: Comparison of tropospheric gas-phase chemistry schemes for use within global models, Atmospheric
Chemistry and Physics, 9, 1831–1845, doi:10.5194/acp-9-1831-2009, http://www.atmos-chem-phys.net/9/1831/2009/, 2009.
Fisher, J. A., Jacob, D. J., Travis, K. R., Kim, P. S., Marais, E. A., Chan Miller, C., Yu, K., Zhu, L., Yantosca, R. M., Sulprizio,20
M. P., Mao, J., Wennberg, P. O., Crounse, J. D., Teng, A. P., Nguyen, T. B., St. Clair, J. M., Cohen, R. C., Romer, P., Nault, B. A.,
Wooldridge, P. J., Jimenez, J. L., Campuzano-Jost, P., Day, D. A., Shepson, P. B., Xiong, F., Blake, D. R., Goldstein, A. H., Misz-
tal, P. K., Hanisco, T. F., Wolfe, G. M., Ryerson, T. B., Wisthaler, A., and Mikoviny, T.: Organic nitrate chemistry and its implica-
tions for nitrogen budgets in an isoprene- and monoterpene-rich atmosphere: constraints from aircraft (SEAC4RS) and ground-based
(SOAS) observations in the Southeast US, Atmospheric Chemistry and Physics Discussions, 2016, 1–38, doi:10.5194/acp-2016-52,25
http://www.atmos-chem-phys-discuss.net/acp-2016-52/, 2016.
Fortems-Cheiney, A., Chevallier, F., Pison, I., Bousquet, P., Saunois, M., Szopa, S., Cressot, C., Kurosu, T. P., Chance, K., and Fried, A.: The
formaldehyde budget as seen by a global-scale multi-constraint and multi-species inversion system, Atmospheric Chemistry and Physics,
12, 6699–6721, doi:10.5194/acp-12-6699-2012, http://www.atmos-chem-phys.net/12/6699/2012/, 2012.
Fu, T.-M., Jacob, D. J., Palmer, P. I., Chance, K., Wang, Y. X., Barletta, B., Blake, D. R., Stanton, J. C., and Pilling, M. J.: Space-based30
formaldehyde measurements as constraints on volatile organic compound emissions in east and south Asia and implications for ozone, J.
Geophys. Res., 112, 2007.
Fu, T.-M., Jacob, D. J., Wittrock, F., Burrows, J. P., Vrekoussis, M., and Henze, D. K.: Global budgets of atmospheric glyoxal and methyl-
glyoxal, and implications for formation of secondary organic aerosols, J. Geophys. Res., 113, http://dx.doi.org/10.1029/2007JD009505,
2008.35
Galloway, M. M., Huisman, A. J., Yee, L. D., Chan, A. W. H., Loza, C. L., Seinfeld, J. H., and Keutsch, F. N.: Yields of oxidized volatile
organic compounds during the OH radical initiated oxidation of isoprene, methyl vinyl ketone, and methacrolein under high-NOx con-
12
Atmos. Chem. Phys. Discuss., doi:10.5194/acp-2016-1042, 2016Manuscript under review for journal Atmos. Chem. Phys.Published: 29 November 2016c© Author(s) 2016. CC-BY 3.0 License.
Page 13
ditions, Atmospheric Chemistry and Physics, 11, 10 779–10 790, doi:10.5194/acp-11-10779-2011, http://www.atmos-chem-phys.net/11/
10779/2011/, 2011.
Geng, F., Tie, X., Guenther, A., Li, G., Cao, J., and Harley, P.: Effect of isoprene emissions from major forests on ozone forma-
tion in the city of Shanghai, China, Atmospheric Chemistry and Physics, 11, 10 449–10 459, doi:10.5194/acp-11-10449-2011, http:
//www.atmos-chem-phys.net/11/10449/2011/, 2011.5
González Abad, G., Liu, X., Chance, K., Wang, H., Kurosu, T. P., and Suleiman, R.: Updated Smithsonian Astrophysical Observatory
Ozone Monitoring Instrument (SAO OMI) formaldehyde retrieval, Atmospheric Measurement Techniques, 8, 19–32, doi:10.5194/amt-8-
19-2015, http://www.atmos-meas-tech.net/8/19/2015/, 2015.
Guenther, A. B., Jiang, X., Heald, C. L., Sakulyanontvittaya, T., Duhl, T., Emmons, L. K., and Wang, X.: The Model of Emissions of Gases
and Aerosols from Nature version 2.1 (MEGAN2.1): an extended and updated framework for modeling biogenic emissions, Geoscientific10
Model Development, 5, 1471–1492, doi:10.5194/gmd-5-1471-2012, http://www.geosci-model-dev.net/5/1471/2012/, 2012.
Jenkin, M. E., Young, J. C., and Rickard, A. R.: The MCM v3.3.1 degradation scheme for isoprene, Atmospheric Chemistry and Physics, 15,
11 433–11 459, doi:10.5194/acp-15-11433-2015, http://www.atmos-chem-phys.net/15/11433/2015/, 2015.
Kaiser, J., Wolfe, G. M., Min, K. E., Brown, S. S., Miller, C. C., Jacob, D. J., deGouw, J. A., Graus, M., Hanisco, T. F., Holloway, J., Peischl,
J., Pollack, I. B., Ryerson, T. B., Warneke, C., Washenfelder, R. A., and Keutsch, F. N.: Reassessing the ratio of glyoxal to formaldehyde15
as an indicator of hydrocarbon precursor speciation, Atmospheric Chemistry and Physics, 15, 7571–7583, doi:10.5194/acp-15-7571-2015,
http://www.atmos-chem-phys.net/15/7571/2015/, 2015.
Kim, P. S., Jacob, D. J., Fisher, J. A., Travis, K., Yu, K., Zhu, L., Yantosca, R. M., Sulprizio, M. P., Jimenez, J. L., Campuzano-Jost, P., Froyd,
K. D., Liao, J., Hair, J. W., Fenn, M. A., Butler, C. F., Wagner, N. L., Gordon, T. D., Welti, A., Wennberg, P. O., Crounse, J. D., St. Clair,
J. M., Teng, A. P., Millet, D. B., Schwarz, J. P., Markovic, M. Z., and Perring, A. E.: Sources, seasonality, and trends of southeast US20
aerosol: an integrated analysis of surface, aircraft, and satellite observations with the GEOS-Chem chemical transport model, Atmospheric
Chemistry and Physics, 15, 10 411–10 433, doi:10.5194/acp-15-10411-2015, http://www.atmos-chem-phys.net/15/10411/2015/, 2015.
Kleipool, Q. L., Dobber, M. R., de Haan, J. F., and Levelt, P. F.: Earth surface reflectance climatology from 3 years of OMI data, Journal of
Geophysical Research: Atmospheres, 113, n/a–n/a, 2008.
Laughner, J. L., Zare, A., and Cohen, R. C.: Effects of daily meteorology on the interpretation of space-based remote sensing of NO2,25
Atmospheric Chemistry and Physics Discussions, 2016, 1–27, doi:10.5194/acp-2016-536, http://www.atmos-chem-phys-discuss.net/
acp-2016-536/, 2016.
Lee, Y.-N., Zhou, X., Kleinman, L. I., Nunnermacker, L. J., Springston, S. R., Daum, P. H., Newman, L., Keigley, W. G., Holdren,
M. W., Spicer, C. W., Young, V., Fu, B., Parrish, D. D., Holloway, J., Williams, J., Roberts, J. M., Ryerson, T. B., and Fehsenfeld,
F. C.: Atmospheric chemistry and distribution of formaldehyde and several multioxygenated carbonyl compounds during the 199530
Nashville/Middle Tennessee Ozone Study, Journal of Geophysical Research: Atmospheres, 103, 22 449–22 462, doi:10.1029/98JD01251,
http://dx.doi.org/10.1029/98JD01251, 1998.
Lerner, B. M., Gilman, J. B., Kuster, W. C., and de Gouw, J. A.: An improved, automated whole-air sampler and VOC GC-MS analysis
system, (In preparation), 2016.
Li, J., Mao, J., Min, K.-E., Washenfelder, R. A., Brown, S. S., Kaiser, J., Keutsch, F. N., Volkamer, R., Wolfe, G. M., Hanisco, T. F., Pollack,35
I. B., Ryerson, T. B., Graus, M., Gilman, J. B., Lerner, B. M., Warneke, C., de Gouw, J. A., Middlebrook, A. M., Liao, J., Welti, A.,
Henderson, B. H., McNeill, V. F., Hall, S. R., Ullmann, K., Donner, L. J., Paulot, F., and Horowitz, L. W.: Observational constraints on
13
Atmos. Chem. Phys. Discuss., doi:10.5194/acp-2016-1042, 2016Manuscript under review for journal Atmos. Chem. Phys.Published: 29 November 2016c© Author(s) 2016. CC-BY 3.0 License.
Page 14
glyoxal production from isoprene oxidation and its contribution to organic aerosol over the Southeast United States, Journal of Geophysical
Research: Atmospheres, 121, 9849–9861, doi:10.1002/2016JD025331, http://dx.doi.org/10.1002/2016JD025331, 2016JD025331, 2016.
Madronich, S.: Photodissociation in the atmosphere: 1. Actinic flux and the effects of ground reflections and clouds, Journal of Geophysical
Research: Atmospheres, 92, 9740–9752, doi:10.1029/JD092iD08p09740, http://dx.doi.org/10.1029/JD092iD08p09740, 1987.
Mao, J., Paulot, F., Jacob, D. J., Cohen, R. C., Crounse, J. D., Wennberg, P. O., Keller, C. A., Hudman, R. C., Barkley, M. P., and Horowitz,5
L. W.: Ozone and organic nitrates over the eastern United States: Sensitivity to isoprene chemistry, Journal of Geophysical Research:
Atmospheres, 118, 11,256–11,268, doi:10.1002/jgrd.50817, http://dx.doi.org/10.1002/jgrd.50817, 2013.
Marais, E. A., Jacob, D. J., Kurosu, T. P., Chance, K., Murphy, J. G., Reeves, C., Mills, G., Casadio, S., Millet, D. B., Barkley, M. P., Paulot,
F., and Mao, J.: Isoprene emissions in Africa inferred from OMI observations of formaldehyde columns, Atmospheric Chemistry and
Physics, 12, 6219–6235, doi:10.5194/acp-12-6219-2012, http://www.atmos-chem-phys.net/12/6219/2012/, 2012.10
Marais, E. A., Jacob, D. J., Jimenez, J. L., Campuzano-Jost, P., Day, D. A., Hu, W., Krechmer, J., Zhu, L., Kim, P. S., Miller, C. C.,
Fisher, J. A., Travis, K., Yu, K., Hanisco, T. F., Wolfe, G. M., Arkinson, H. L., Pye, H. O. T., Froyd, K. D., Liao, J., and McNeill,
V. F.: Aqueous-phase mechanism for secondary organic aerosol formation from isoprene: application to the southeast United States
and co-benefit of SO2 emission controls, Atmospheric Chemistry and Physics, 16, 1603–1618, doi:10.5194/acp-16-1603-2016, http:
//www.atmos-chem-phys.net/16/1603/2016/, 2016.15
Millet, D. B., Jacob, D. J., Boersma, K. F., Fu, T.-M., Kurosu, T. P., Chance, K., Heald, C. L., and Guenther, A.: Spatial distribution of isoprene
emissions from North America derived from formaldehyde column measurements by the OMI satellite sensor, Journal of Geophysical
Research: Atmospheres, 113, n/a–n/a, http://dx.doi.org/10.1029/2007JD008950, 2008.
Min, K.-E., Washenfelder, R. A., Dubé, W. P., Langford, A. O., Edwards, P. M., Zarzana, K. J., Stutz, J., Lu, K., Rohrer, F., Zhang, Y.,
and Brown, S. S.: A broadband cavity enhanced absorption spectrometer for aircraft measurements of glyoxal, methylglyoxal, nitrous20
acid, nitrogen dioxide, and water vapor, Atmospheric Measurement Techniques, 9, 423–440, doi:10.5194/amt-9-423-2016, http://www.
atmos-meas-tech.net/9/423/2016/, 2016.
Molod, A., Takacs, L., Suarez, M., Bacmeister, J., Song, I.-S., and Eichmann, A.: The GEOS-5 Atmospheric General Circulation Model:
Mean Climate and Development from MERRA to Fortuna, Tech. Rep. NASA/TM–2012-104606/Vol 28, Nasa Godard Space Flight Center,
2012.25
Müller, J.-F., Peeters, J., and Stavrakou, T.: Fast photolysis of carbonyl nitrates from isoprene, Atmospheric Chemistry and Physics, 14,
2497–2508, doi:10.5194/acp-14-2497-2014, http://www.atmos-chem-phys.net/14/2497/2014/, 2014.
Palmer, P. I., Jacob, D. J., Chance, K., Martin, R. V., Spurr, R. J. D., Kurosu, T. P., Bey, I., Yantosca, R., Fiore, A., and Li, Q.: Air mass factor
formulation for spectroscopic measurements from satellites: Application to formaldehyde retrievals from the Global Ozone Monitoring
Experiment, Journal of Geophysical Research: Atmospheres, 106, 14 539–14 550, http://dx.doi.org/10.1029/2000JD900772, 2001.30
Palmer, P. I., Jacob, D. J., Fiore, A. M., Martin, R. V., Chance, K., and Kurosu, T. P.: Mapping isoprene emissions over North
America using formaldehyde column observations from space, Journal of Geophysical Research: Atmospheres, 108, n/a–n/a,
doi:10.1029/2002JD002153, http://dx.doi.org/10.1029/2002JD002153, 2003.
Palmer, P. I., Abbot, D. S., Fu, T.-M., Jacob, D. J., Chance, K., Kurosu, T. P., Guenther, A., Wiedinmyer, C., Stanton, J. C., Pilling, M. J.,
Pressley, S. N., Lamb, B., and Sumner, A. L.: Quantifying the seasonal and interannual variability of North American isoprene emissions35
using satellite observations of the formaldehyde column, Journal of Geophysical Research: Atmospheres, 111, n/a–n/a, http://dx.doi.org/
10.1029/2005JD006689, 2006.
14
Atmos. Chem. Phys. Discuss., doi:10.5194/acp-2016-1042, 2016Manuscript under review for journal Atmos. Chem. Phys.Published: 29 November 2016c© Author(s) 2016. CC-BY 3.0 License.
Page 15
Paulot, F., Crounse, J. D., Kjaergaard, H. G., Kroll, J. H., Seinfeld, J. H., and Wennberg, P. O.: Isoprene photooxidation: new insights
into the production of acids and organic nitrates, Atmospheric Chemistry and Physics, 9, 1479–1501, doi:10.5194/acp-9-1479-2009,
http://www.atmos-chem-phys.net/9/1479/2009/, 2009a.
Paulot, F., Crounse, J. D., Kjaergaard, H. G., Kürten, A., St. Clair, J. M., Seinfeld, J. H., and Wennberg, P. O.: Unexpected Epoxide Formation
in the Gas-Phase Photooxidation of Isoprene, Science, 325, 730–733, doi:10.1126/science.1172910, http://www.sciencemag.org/content/5
325/5941/730.abstract, 2009b.
Peeters, J. and Muller, J.-F.: HOx radical regeneration in isoprene oxidation via peroxy radical isomerisations. II: experimental evidence and
global impact, Phys. Chem. Chem. Phys., 12, 14 227–14 235, doi:10.1039/C0CP00811G, http://dx.doi.org/10.1039/C0CP00811G, 2010.
Peeters, J., Nguyen, T. L., and Vereecken, L.: HOx radical regeneration in the oxidation of isoprene, Phys. Chem. Chem. Phys., 11, 5935–
5939, doi:10.1039/B908511D, http://dx.doi.org/10.1039/B908511D, 2009.10
Peeters, J., Müller, J.-F., Stavrakou, T., and Nguyen, V. S.: Hydroxyl Radical Recycling in Isoprene Oxidation Driven by Hydro-
gen Bonding and Hydrogen Tunneling: The Upgraded LIM1 Mechanism, The Journal of Physical Chemistry A, 118, 8625–8643,
doi:10.1021/jp5033146, http://dx.doi.org/10.1021/jp5033146, pMID: 25010574, 2014.
Pollack, I. B., Lerner, B. M., and Ryerson, T. B.: Evaluation of ultraviolet light-emitting diodes for detection of atmospheric NO2 by
photolysis - chemiluminescence, Journal of Atmospheric Chemistry, 65, 111–125, doi:10.1007/s10874-011-9184-3, http://dx.doi.org/10.15
1007/s10874-011-9184-3, 2010.
Russell, A. R., Perring, A. E., Valin, L. C., Bucsela, E. J., Browne, E. C., Wooldridge, P. J., and Cohen, R. C.: A high spatial resolution
retrieval of NO<sub> 2</sub> column densities from OMI: method and evaluation, Atmospheric Chemistry and Physics, 11, 8543–8554,
doi:10.5194/acp-11-8543-2011, http://www.atmos-chem-phys.net/11/8543/2011/, 2011.
Russell, A. R., Valin, L. C., and Cohen, R. C.: Trends in OMI NO2 observations over the United States: effects of emission con-20
trol technology and the economic recession, Atmospheric Chemistry and Physics, 12, 12 197–12 209, doi:10.5194/acp-12-12197-2012,
http://www.atmos-chem-phys.net/12/12197/2012/, 2012.
Ryerson, T. B., Huey, L. G., Knapp, K., Neuman, J. A., Parrish, D. D., Sueper, D. T., and Fehsenfeld, F. C.: Design and initial charac-
terization of an inlet for gas-phase NOy measurements from aircraft, Journal of Geophysical Research: Atmospheres, 104, 5483–5492,
doi:10.1029/1998JD100087, http://dx.doi.org/10.1029/1998JD100087, 1999.25
Schaaf, C. and Wang, Z.: MCD43C3 MODIS/Terra+Aqua BRDF/Albedo Albedo Daily L3 Global 0.05Deg CMG V006., Tech. Rep.
doi:10.5067/MODIS/MCD43C3.006, NASA EOSDIS Land Processes DAAC, 2015.
Toon, O. B., Maring, H., Dibb, J., Ferrare, R., Jacob, D. J., Jensen, E. J., Luo, Z. J., Mace, G. G., Pan, L. L., Pfister, L., Rosenlof, K. H.,
Redemann, J., Reid, J. S., Singh, H. B., Thompson, A. M., Yokelson, R., Minnis, P., Chen, G., Jucks, K. W., and Pszenny, A.: Planning,
implementation, and scientific goals of the Studies of Emissions and Atmospheric Composition, Clouds and Climate Coupling by Regional30
Surveys (SEAC4RS) field mission, Journal of Geophysical Research: Atmospheres, 121, 4967–5009, doi:10.1002/2015JD024297, http:
//dx.doi.org/10.1002/2015JD024297, 2015JD024297, 2016.
Travis, K. R., Jacob, D. J., Fisher, J. A., Kim, P. S., Marais, E. A., Zhu, L., Yu, K., Miller, C. C., Yantosca, R. M., Sulprizio, M. P., Thompson,
A. M., Wennberg, P. O., Crounse, J. D., St. Clair, J. M., Cohen, R. C., Laughner, J. L., Dibb, J. E., Hall, S. R., Ullmann, K., Wolfe, G. M.,
Pollack, I. B., Peischl, J., Neuman, J. A., and Zhou, X.: Why do models overestimate surface ozone in the Southeast United States?,35
Atmospheric Chemistry and Physics, 16, 13 561–13 577, doi:10.5194/acp-16-13561-2016, http://www.atmos-chem-phys.net/16/13561/
2016/, 2016.
15
Atmos. Chem. Phys. Discuss., doi:10.5194/acp-2016-1042, 2016Manuscript under review for journal Atmos. Chem. Phys.Published: 29 November 2016c© Author(s) 2016. CC-BY 3.0 License.
Page 16
Volkamer, R., Platt, U., and Wirtz, K.: Primary and Secondary Glyoxal Formation from Aromatics: Experimental Evidence for the
Bicycloalkyl-Radical Pathway from Benzene, Toluene, and p-Xylene, The Journal of Physical Chemistry A, 105, 7865–7874,
doi:10.1021/jp010152w, http://dx.doi.org/10.1021/jp010152w, 2001.
Volkamer, R., Baidar, S., Campos, T. L., Coburn, S., DiGangi, J. P., Dix, B., Eloranta, E. W., Koenig, T. K., Morley, B., Ortega, I., Pierce,
B. R., Reeves, M., Sinreich, R., Wang, S., Zondlo, M. A., and Romashkin, P. A.: Aircraft measurements of BrO, IO, glyoxal, NO2, H2O,5
O2–O2 and aerosol extinction profiles in the tropics: comparison with aircraft-/ship-based in situ and lidar measurements, Atmospheric
Measurement Techniques, 8, 2121–2148, doi:10.5194/amt-8-2121-2015, http://www.atmos-meas-tech.net/8/2121/2015/, 2015.
Vrekoussis, M., Wittrock, F., Richter, A., and Burrows, J. P.: Temporal and spatial variability of glyoxal as observed from space, Atmospheric
Chemistry and Physics, 9, 4485–4504, doi:10.5194/acp-9-4485-2009, http://www.atmos-chem-phys.net/9/4485/2009/, 2009.
Vrekoussis, M., Wittrock, F., Richter, A., and Burrows, J. P.: GOME-2 observations of oxygenated VOCs: what can we learn from the ratio10
glyoxal to formaldehyde on a global scale?, Atmospheric Chemistry and Physics, 10, 10 145–10 160, doi:10.5194/acp-10-10145-2010,
http://www.atmos-chem-phys.net/10/10145/2010/, 2010.
Wagner, N. L., Brock, C. A., Angevine, W. M., Beyersdorf, A., Campuzano-Jost, P., Day, D., de Gouw, J. A., Diskin, G. S., Gordon, T. D.,
Graus, M. G., Holloway, J. S., Huey, G., Jimenez, J. L., Lack, D. A., Liao, J., Liu, X., Markovic, M. Z., Middlebrook, A. M., Mikoviny,
T., Peischl, J., Perring, A. E., Richardson, M. S., Ryerson, T. B., Schwarz, J. P., Warneke, C., Welti, A., Wisthaler, A., Ziemba, L. D.,15
and Murphy, D. M.: In situ vertical profiles of aerosol extinction, mass, and composition over the southeast United States during SENEX
and SEAC<sup>4</sup>RS: observations of a modest aerosol enhancement aloft, Atmospheric Chemistry and Physics, 15, 7085–7102,
doi:10.5194/acp-15-7085-2015, http://www.atmos-chem-phys.net/15/7085/2015/, 2015.
Warneke, C., Trainer, M., de Gouw, J. A., Parrish, D. D., Fahey, D. W., Ravishankara, A. R., Middlebrook, A. M., Brock, C. A., Roberts,
J. M., Brown, S. S., Neuman, J. A., Lerner, B. M., Lack, D., Law, D., Huebler, G., Pollack, I., Sjostedt, S., Ryerson, T. B., Gilman, J. B.,20
Liao, J., Holloway, J., Peischl, J., Nowak, J. B., Aikin, K., Min, K.-E., Washenfelder, R. A., Graus, M. G., Richardson, M., Markovic,
M. Z., Wagner, N. L., Welti, A., Veres, P. R., Edwards, P., Schwarz, J. P., Gordon, T., Dube, W. P., McKeen, S., Brioude, J., Ahmadov,
R., Bougiatioti, A., Lin, J., Nenes, A., Wolfe, G. M., Hanisco, T. F., Lee, B. H., Lopez-Hilfiker, F. D., Thornton, J. A., Keutsch, F. N.,
Kaiser, J., Mao, J., and Hatch, C.: Instrumentation and Measurement Strategy for the NOAA SENEX Aircraft Campaign as Part of the
Southeast Atmosphere Study 2013, Atmospheric Measurement Techniques Discussions, 2016, 1–39, doi:10.5194/amt-2015-388, http:25
//www.atmos-meas-tech-discuss.net/amt-2015-388/, 2016.
Wittrock, F., Richter, A., Oetjen, H., Burrows, J. P., Kanakidou, M., Myriokefalitakis, S., Volkamer, R., Beirle, S., Platt, U., and Wagner, T.:
Simultaneous global observations of glyoxal and formaldehyde from space, Geophysical Research Letters, 33, 2006.
Wolfe, G. M., Kaiser, J., Hanisco, T. F., Keutsch, F. N., de Gouw, J. A., Gilman, J. B., Graus, M., Hatch, C. D., Holloway, J., Horowitz, L. W.,
Lee, B. H., Lerner, B. M., Lopez-Hilifiker, F., Mao, J., Marvin, M. R., Peischl, J., Pollack, I. B., Roberts, J. M., Ryerson, T. B., Thornton,30
J. A., Veres, P. R., and Warneke, C.: Formaldehyde production from isoprene oxidation across NOx regimes, Atmospheric Chemistry and
Physics, 16, 2597–2610, doi:10.5194/acp-16-2597-2016, http://www.atmos-chem-phys.net/16/2597/2016/, 2016.
Yu, K., Jacob, D. J., Fisher, J. A., Kim, P. S., Marais, E. A., Miller, C. C., Travis, K. R., Zhu, L., Yantosca, R. M., Sulprizio, M. P., Cohen,
R. C., Dibb, J. E., Fried, A., Mikoviny, T., Ryerson, T. B., Wennberg, P. O., and Wisthaler, A.: Sensitivity to grid resolution in the ability of
a chemical transport model to simulate observed oxidant chemistry under high-isoprene conditions, Atmospheric Chemistry and Physics35
Discussions, 2016, 1–16, doi:10.5194/acp-2015-980, http://www.atmos-chem-phys-discuss.net/acp-2015-980/, 2016.
Zhu, L., Jacob, D. J., Kim, P. S., Fisher, J. A., Yu, K., Travis, K. R., Mickley, L. J., Yantosca, R. M., Sulprizio, M. P., De Smedt, I.,
González Abad, G., Chance, K., Li, C., Ferrare, R., Fried, A., Hair, J. W., Hanisco, T. F., Richter, D., Jo Scarino, A., Walega, J., Weibring,
16
Atmos. Chem. Phys. Discuss., doi:10.5194/acp-2016-1042, 2016Manuscript under review for journal Atmos. Chem. Phys.Published: 29 November 2016c© Author(s) 2016. CC-BY 3.0 License.
Page 17
P., and Wolfe, G. M.: Observing atmospheric formaldehyde (HCHO) from space: validation and intercomparison of six retrievals from
four
satellites (OMI, GOME2A, GOME2B, OMPS) with SEAC4RS aircraft observations over the southeast US, Atmospheric Chemistry and
Physics, 16, 13 477–13 490, doi:10.5194/acp-16-13477-2016, http://www.atmos-chem-phys.net/16/13477/2016/, 2016.
Zoogman, P., Liu, X., Suleiman, R., Pennington, W., Flittner, D., Al-Saadi, J., Hilton, B., Nicks, D., Newchurch, M., Carr, J., Janz,5
S., Andraschko, M., Arola, A., Baker, B., Canova, B., Miller, C. C., Cohen, R., Davis, J., Dussault, M., Edwards, D., Fishman, J.,
Ghulam, A., Abad, G. G., Grutter, M., Herman, J., Houck, J., Jacob, D., Joiner, J., Kerridge, B., Kim, J., Krotkov, N., Lamsal, L.,
Li, C., Lindfors, A., Martin, R., McElroy, C., McLinden, C., Natraj, V., Neil, D., Nowlan, C., O’Sullivan, E., Palmer, P., Pierce,
R., Pippin, M., Saiz-Lopez, A., Spurr, R., Szykman, J., Torres, O., Veefkind, J., Veihelmann, B., Wang, H., Wang, J., and Chance,
K.: Tropospheric emissions: Monitoring of pollution (TEMPO), Journal of Quantitative Spectroscopy and Radiative Transfer, pp. –,10
doi:http://dx.doi.org/10.1016/j.jqsrt.2016.05.008, http://www.sciencedirect.com/science/article/pii/S0022407316300863, 2016.
17
Atmos. Chem. Phys. Discuss., doi:10.5194/acp-2016-1042, 2016Manuscript under review for journal Atmos. Chem. Phys.Published: 29 November 2016c© Author(s) 2016. CC-BY 3.0 License.
Page 18
Figures
OHO
OHOH
O
OHOOH
OHO
OH
O
OOH
O OH
O O
Isoprene
HPALD
IEPOX GLYC
ISOPO2
ISOPOOH HC5 DIBOO
O
MVK
(1,6)HIsom. NOHO2
hν
β δ
OH
OH
OHOH NO/HO2
OH
CHOCHO
7% 13%17%26%
9%
Mean branching ratiosContributions to CHOCHO formation
10% 34% 48%
HOOH
OH
O2
(Major Isomers)
1 23
4
1-OH 4-OH
HOOO
OH
OO
1-OH,2-O2 4-OH,3-O2Z-1-OH,4-O2 Z-4-OH,1-O2
-O2
δ (10%)β (90%)
OOOH
OHOO
(& E Isomers)
0.7 h
5.5 h 8.7 h
0.9 h 3.5 h 0.6 h
Lifetime
2%
4%
66%25%3%
O
OOH
OOH
OO
di-HPCARP
OH
NOO
OOOH
OOHDHDC
hν
0.7 h
50%50%(1,4)HIsom.(1,5)HIsom.
26%1%
Contributions to Glycolaldehyde (GLYC) formation
Figure 1. Pathways for glyoxal (CHOCHO) formation from isoprene oxidation in GEOS-Chem as implemented in this work. Only species
relevant to CHOCHO formation are shown. Branching ratios, species lifetimes, and contributions to glyoxal and glycolaldehyde (GLYC)
formation from each boxed species are mean values over the Southeast United States ( 96.25− 73.75◦W, 29− 41◦N ) during the SENEX
campaign (June 1st - July 10th 2013). Species lifetimes are shown for an OH concentration of 4× 10⁶ molecules cm−3.
18
Atmos. Chem. Phys. Discuss., doi:10.5194/acp-2016-1042, 2016Manuscript under review for journal Atmos. Chem. Phys.Published: 29 November 2016c© Author(s) 2016. CC-BY 3.0 License.
Page 19
0.0 0.2 0.4 0.6 0.8 1.0Molar Yield
0.1
1.0
NO
x (pp
bv)
NOHO2Isom.
0 2 4 6 8 10OH Exposure Time (h)
0.1
1.00.3 0.6
0.6
0.9
0.9
1.2
1.50.3
0.6
0.6
0.9
0.9
1.2
1.5
0 2 4 6 8 10OH Exposure Time (h)
0.1
1.00.
01 0.03 0.05
0.05
0.07
0.01 0.03
0.03
0.05
GEOS-ChemMCMv3.3.1
CHOCHO Yield HCHO YieldISOPO2 Fate
0.5 0.5 0.5
Figure 2. Cumulative time- and NOx dependent molar yields of CHOCHO and HCHO from isoprene oxidation in the GEOS-Chem and
MCM3.3.1 chemical mechanisms. Results are from box model simulations with fixed NOx concentration as described in the text, and
are presented as functions of the imposed NOx concentration (vertical axis). The left panel shows the isoprene peroxy radical (ISOPO2)
branching ratios for reaction with NO, HO2, and isomerization. The middle and right panels show the time-dependent cumulative yields
of CHOCHO and HCHO, where time is normalized by OH exposure (Equation 1). "OH exposure time" is equivalent to time for a constant
[OH] = 4× 10⁶ molecules cm−3.
0.0 0.1 0.2 0.3 0.4 0.5 0.6Concentration (ppbv)
0
1
2
3
4
5
0 1 2 3 4 5 6Concentration (ppbv)
0
1
2
3
4
5
0 50 100 150Concentration (pptv)
0
1
2
3
4
5
Altit
ude
(km
)
CHOCHO HCHO NOx
ObservedGEOS-Chem
Figure 3. Median vertical profiles of CHOCHO, HCHO, and NOx concentrations during SENEX (June 1 - July 10 2013). Observed con-
centrations (Min et al., 2016; Cazorla et al., 2015; Pollack et al., 2010) are compared to GEOS-Chem model values sampled along the flight
tracks. Horizontal bars indicate interquartile range. Altitudes are above ground level (AGL).
19
Atmos. Chem. Phys. Discuss., doi:10.5194/acp-2016-1042, 2016Manuscript under review for journal Atmos. Chem. Phys.Published: 29 November 2016c© Author(s) 2016. CC-BY 3.0 License.
Page 20
0.00
0.04
0.08
0.12
0.16
30oN
35oN
40oN
95oW 90oW 85oW 80oW 75oW
30oN
35oN
40oN
30oN
35oN
40oN
95oW 90oW 85oW 80oW 75oW
Observed GEOS-Chem
CHOCHO
HCHO
CHOCHO
HCHO
Concentrations below 1 km altitude
NOxNOx
0.00
0.25
0.50
0.75
1.00
0.00
1.75
3.50
5.25
7.00
r = 0.51NMB = -17%
r = 0.75NMB = -17%
r = 0.54NMB = -13%
≥
≥
≥Con
cent
ratio
n (p
pbv)
Figure 4. CHOCHO, HCHO, and NOx concentrations below 1 km AGL during SENEX (June 1 - July 10 2013). The grid squares show
daytime aircraft observations compared to the colocated GEOS-Chem model values on the 0.25◦×0.3125◦ model grid. Background contours
in the right panels show the average model-simulated concentrations at 13 - 14 local time for the SENEX period. Comparison statistics
between model and observation grid squares are shown as the correlation coefficient r and the normalized mean bias (NMB). Correlation
statistics for NO2 exclude urban plumes in the observations ([NOx] > 4 ppb) as these would not be resolved at the scale of the model.
20
Atmos. Chem. Phys. Discuss., doi:10.5194/acp-2016-1042, 2016Manuscript under review for journal Atmos. Chem. Phys.Published: 29 November 2016c© Author(s) 2016. CC-BY 3.0 License.
Page 21
r = 0.92Slope = 0.028Intercept = -22 pptv
r = 0.73Slope = 0.024Intercept = -9 pptv
0 2 4 6 8 10HCHO (ppbv)
0.000.05
0.10
0.15
0.20
0.25
0.30
CH
OC
HO
(ppb
v)
0 2 4 6 8 10HCHO (ppbv)
0.000.05
0.10
0.15
0.20
0.25
0.30
CH
OC
HO
(ppb
v)
0.05
0.25
0.45
0.65
0.85
NO
x (pp
bv)
Observed GEOS-Chem
Figure 5. Relationship between CHOCHO and HCHO concentrations in the mixed layer (< 1 km AGL) during SENEX (June 1 - July 10
2013), color coded by NOx concentration. Observed concentrations (Min et al., 2016; Cazorla et al., 2015) are compared to GEOS-Chem
model values sampled along the flight tracks. Lines and reported slopes are from reduced major axis regressions.
21
Atmos. Chem. Phys. Discuss., doi:10.5194/acp-2016-1042, 2016Manuscript under review for journal Atmos. Chem. Phys.Published: 29 November 2016c© Author(s) 2016. CC-BY 3.0 License.
Page 22
0.10 0.25 0.50 1.00 2.00
0 5 10 15 20Initial Isoprene (ppbv)
0
2
4
6
8
10
12
HC
HO
(ppb
v)
0 5 10 15 20Initial Isoprene (ppbv)
0
50
100
150
200
250
CH
OC
HO
(ppt
v)
0 5 10 15 20Initial Isoprene (ppbv)
0
2
4
6
8
10
12
HC
HO
(ppb
v)
0 5 10 15 20Initial Isoprene (ppbv)
0
50
100
150
200
250
CH
OC
HO
(ppt
v)
NOx (ppbv)
CHOCHO HCHO
Observed Observed
GEOS-Chem GEOS-Chem
0.0130.028
0.010
0.030
1.11
0.38
0.35
0.99
Figure 6. Relationships of mixed layer CHOCHO and HCHO concentrations in SENEX to initial isoprene as derived from a parcel model.
Observations are compared to the corresponding GEOS-Chem model values sampled along the aircraft flight tracks. Points are color coded
by NOx concentration. Dashed lines are reduced major axis regression fits to data below 200 pptv and above 800 pptv NOx. The slopes from
the regressions are indicated next to the dashed lines.
22
Atmos. Chem. Phys. Discuss., doi:10.5194/acp-2016-1042, 2016Manuscript under review for journal Atmos. Chem. Phys.Published: 29 November 2016c© Author(s) 2016. CC-BY 3.0 License.
Page 23
0.25
0.50
0.75
1.00
1.25
1.50
0.0 0.5 1.0 1.5 2.0 2.5NOx (ppbv)
0.00
0.01
0.02
0.03
0.04
0.05
0.06
0.0 0.5 1.0 1.5 2.0 2.5NOx (ppbv)
0.00
0.01
0.02
0.03
0.04
0.05
0.06
RG
F=[C
HO
CH
O]/[
HC
HO
] (m
ol m
ol-1)
OH
Exp
osur
e Ti
me
(h)Observed GEOS-Chem
Figure 7. Dependence of the CHOCHO-to-HCHO ratio RGF on NOx concentrations for the SENEX conditions. Observations below 1 km
altitude (left) are compared to GEOS-Chem model values sampled along the flight tracks (right). Points are color coded by the OH exposure
time tOH (Equation 1). Binned median and interquartile RGF values in increments of 250 pptv NOx for bins with more than 20 values are
also shown.
23
Atmos. Chem. Phys. Discuss., doi:10.5194/acp-2016-1042, 2016Manuscript under review for journal Atmos. Chem. Phys.Published: 29 November 2016c© Author(s) 2016. CC-BY 3.0 License.
Page 24
25oN
30oN
35oN
40oN
45oN
100oW 95oW 90oW 85oW 80oW 75oW 70oW
25oN
30oN
35oN
40oN
45oN
100oW 95oW 90oW 85oW 80oW 75oW 70oW
25oN
30oN
35oN
40oN
45oN
100oW 95oW 90oW 85oW 80oW 75oW 70oW
25oN
30oN
35oN
40oN
45oN
100oW 95oW 90oW 85oW 80oW 75oW 70oW
25oN
30oN
35oN
40oN
45oN
100oW 95oW 90oW 85oW 80oW 75oW 70oW
GEO
S-C
hem
OM
I-SAO
CHOCHO HCHO
HCHOCHOCHO
SAO: 21%BEHR: -2%
SAO: -12%
≥
4
9
14
19
24
0.00
0.12
0.25
0.37
0.50
0.00
0.12
0.25
0.37
0.50
Col
umn
Den
sity
(101
5 mol
ecul
es c
m-2
)
Col
umn
Den
sity
(101
5 mol
ecul
es c
m-2
)
CHOCHOOM
I-BEH
R
0 2 4 6Scattering Weights, Shape Factors
1000
800
600
400
200
Pres
sure
(hPa
)
≥
CHOCHO Scattering Weights
SENEXGEOS-Chem
OMI-SAOOMI-BEHR
Scattering Weights (solid)Shape Factors (dashed)
Figure 8. Mean CHOCHO and HCHO columns in summer (JJA) 2006-2007. GEOS-Chem model values (top) are compared to OMI satellite
observations (middle and bottom). OMI-SAO is the standard operational product (Chan Miller et al., 2014; González Abad et al., 2015). The
OMI-BEHR product for CHOCHO uses tropospheric scattering weights from the BEHR NO2 retrieval (Russell et al., 2011; Laughner et al.,
2016). The OMI HCHO observations have been scaled up by a factor of 1.67 to correct for retrieval bias (Zhu et al., 2016). The normalized
mean bias (NMB) between GEOS-Chem and OMI in the Southeast US (75◦− 100◦W, 29.5◦− 37.5◦N) is shown within the GEOS-Chem
panels. The bottom right panel shows the mean CHOCHO scattering weights (w) from the OMI-SAO and OMI-BEHR retrievals and the
vertical shape factors (s) over the Southeast US from the SENEX observations and GEOS-Chem in the Southeast US from a typical orbit
(10114, 9 June 2006).
24
Atmos. Chem. Phys. Discuss., doi:10.5194/acp-2016-1042, 2016Manuscript under review for journal Atmos. Chem. Phys.Published: 29 November 2016c© Author(s) 2016. CC-BY 3.0 License.
Page 25
0 2 4 6 8GEOS-Chem (1014 molecules cm-2)
0
2
4
6
8
OM
I (10
14 m
olec
ules
cm
-2)
OMI-SAOr = 0.76Slope = 0.46 ± 0.04
OMI-BEHRr = 0.79Slope = 0.57 ± 0.04
CHOCHO
0 1 2 3 4GEOS-Chem (1016 molecules cm-2)
0
1
2
3
4
OM
I (10
16 m
olec
ules
cm
-2)
HCHO
OMI-SAOr = 0.90Slope = 1.00 ± 0.04
Figure 9. scatter plots of OMI vs. GEOS-Chem CHOCHO and HCHO columns over the eastern US (75◦−100◦W, 29.5◦−45◦N). Values are
seasonal means for JJA 2006-2007 as plotted in Figure 8. OMI observations for CHOCHO are from the standard SAO retrieval (Chan Miller
et al., 2014) and using BEHR scattering weights (Russell et al., 2011; Laughner et al., 2016). Correlation coefficients and reduced-major-axis
(RMA) regressions are shown.
0 5 10 15 20 25 30HCHO (1015 molecules cm-2)
0.00.1
0.2
0.3
0.4
0.50.6
CH
OC
HO
(1015
mol
ecul
es c
m-2)
0 5 10 15 20 25 30HCHO (1015 molecules cm-2)
0.00.1
0.2
0.3
0.4
0.50.6
CH
OC
HO
(1015
mol
ecul
es c
m-2)
OMI-BEHR GEOS-Chem
1.00
1.50
2.00
2.50
3.00
Trop
osph
eric
NO
2 (1
015 m
olec
ules
cm
-2)
r = 0.83slope = 0.016
r = 0.99slope = 0.028
Relationship Between CHOCHO and HCHO Columns
Figure 10. Relationship between CHOCHO and HCHO vertical columns over the eastern US (75◦−100◦W, 29.5◦−45◦N) in June-August
2006-2007 color coded by tropospheric NO2 columns. OMI values with CHOCHO AMFs computed from BEHR scattering weights are
compared to GEOS-Chem values. Lines and reported slopes are from reduced major axis regressions.
25
Atmos. Chem. Phys. Discuss., doi:10.5194/acp-2016-1042, 2016Manuscript under review for journal Atmos. Chem. Phys.Published: 29 November 2016c© Author(s) 2016. CC-BY 3.0 License.
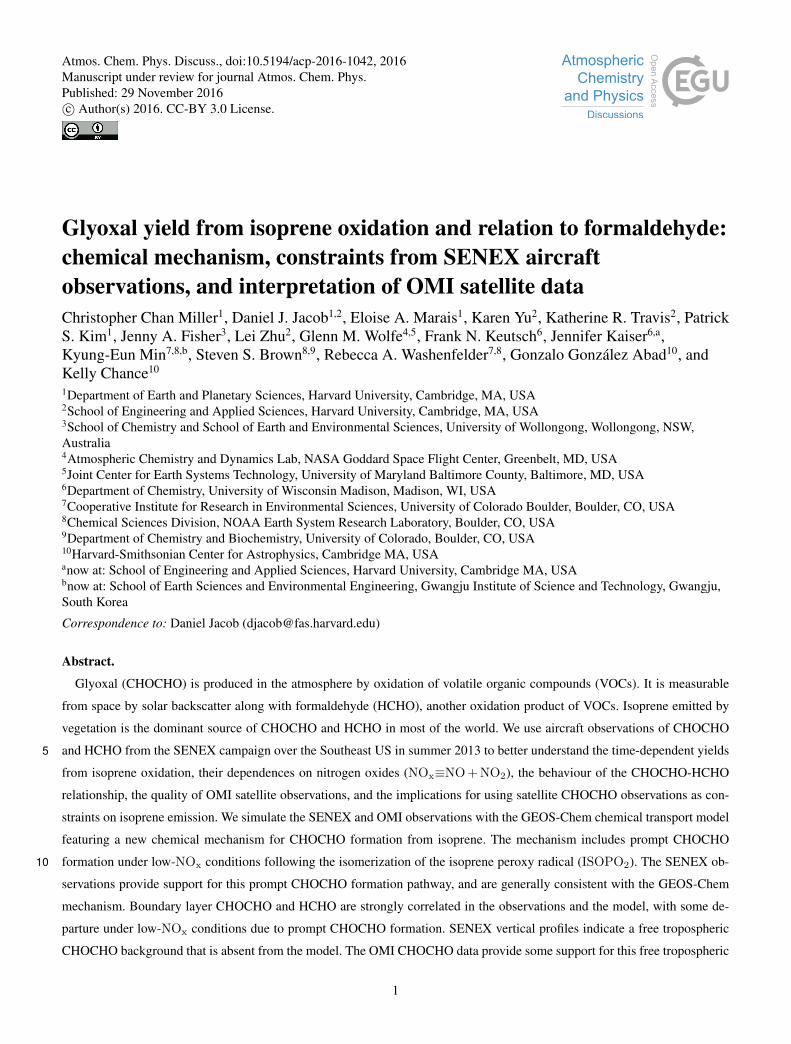
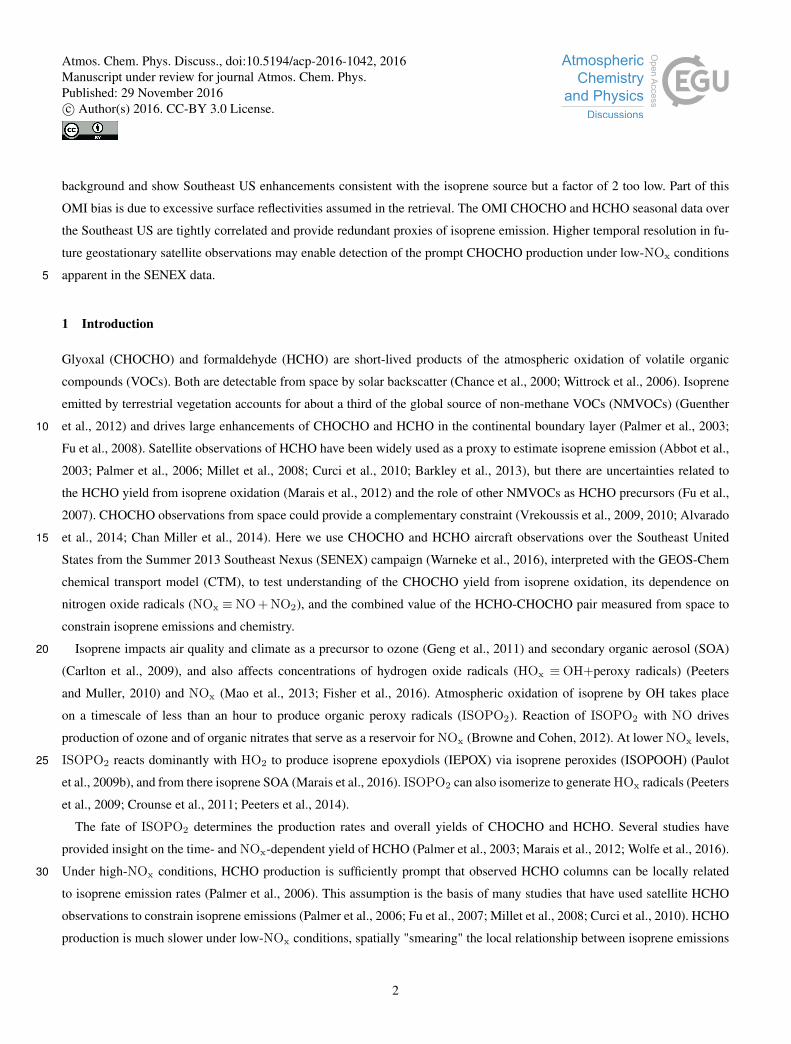


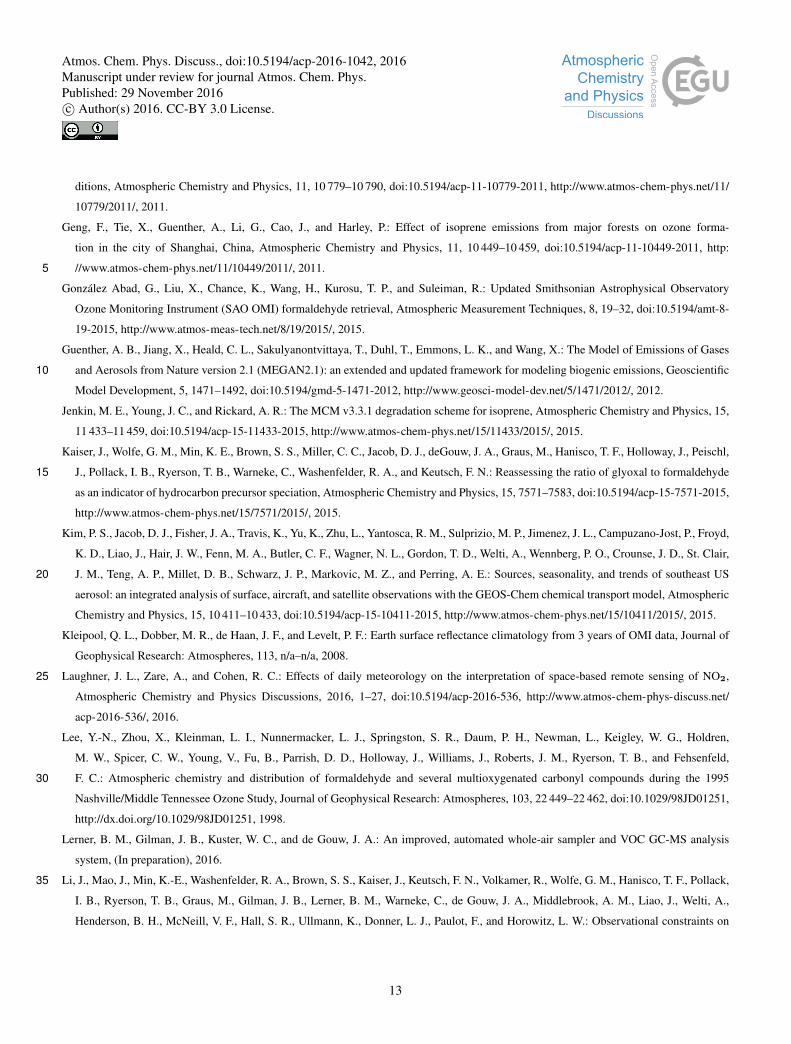

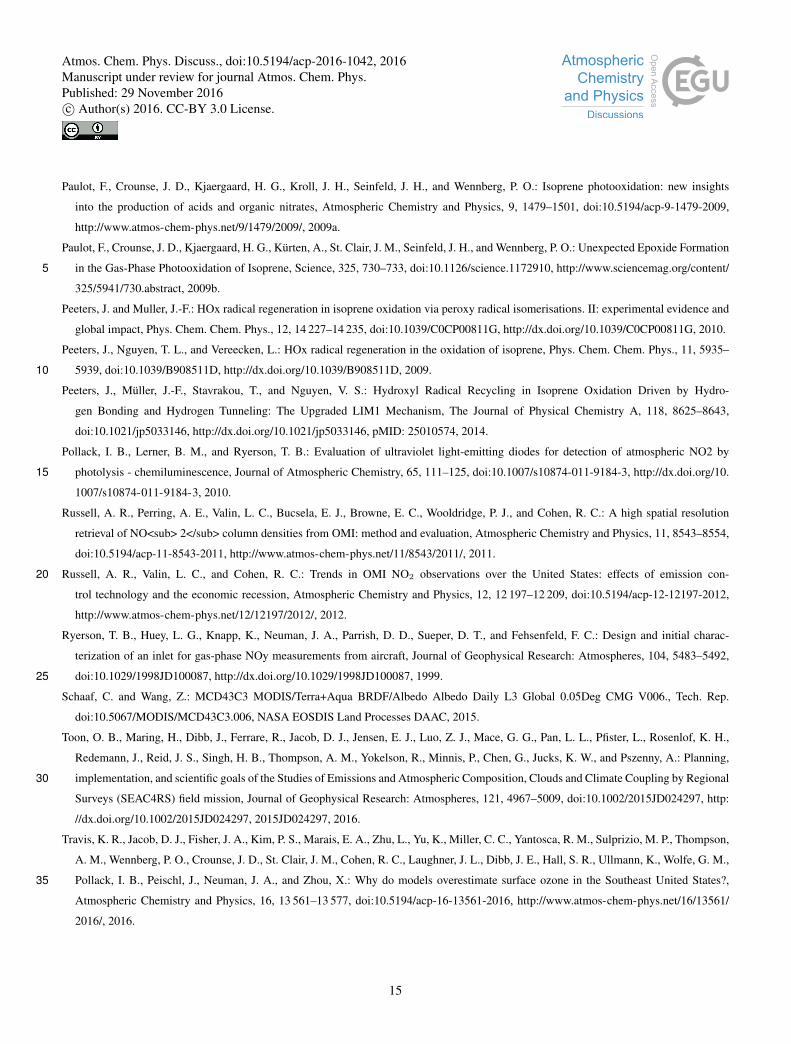


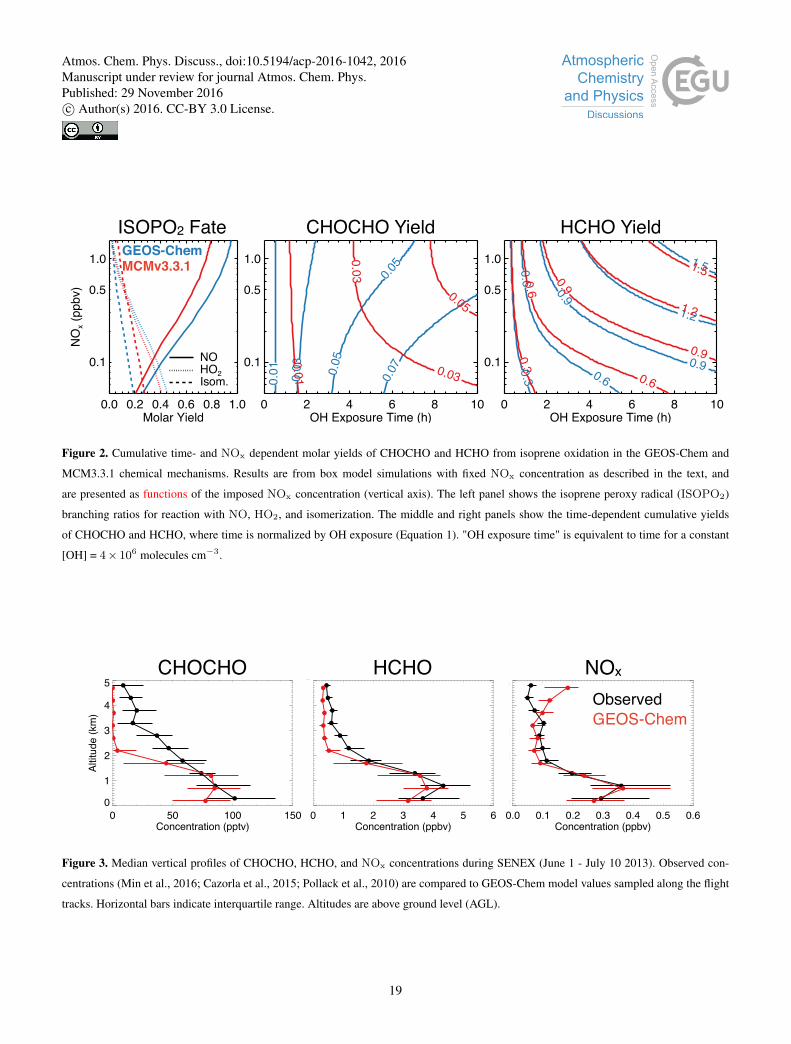
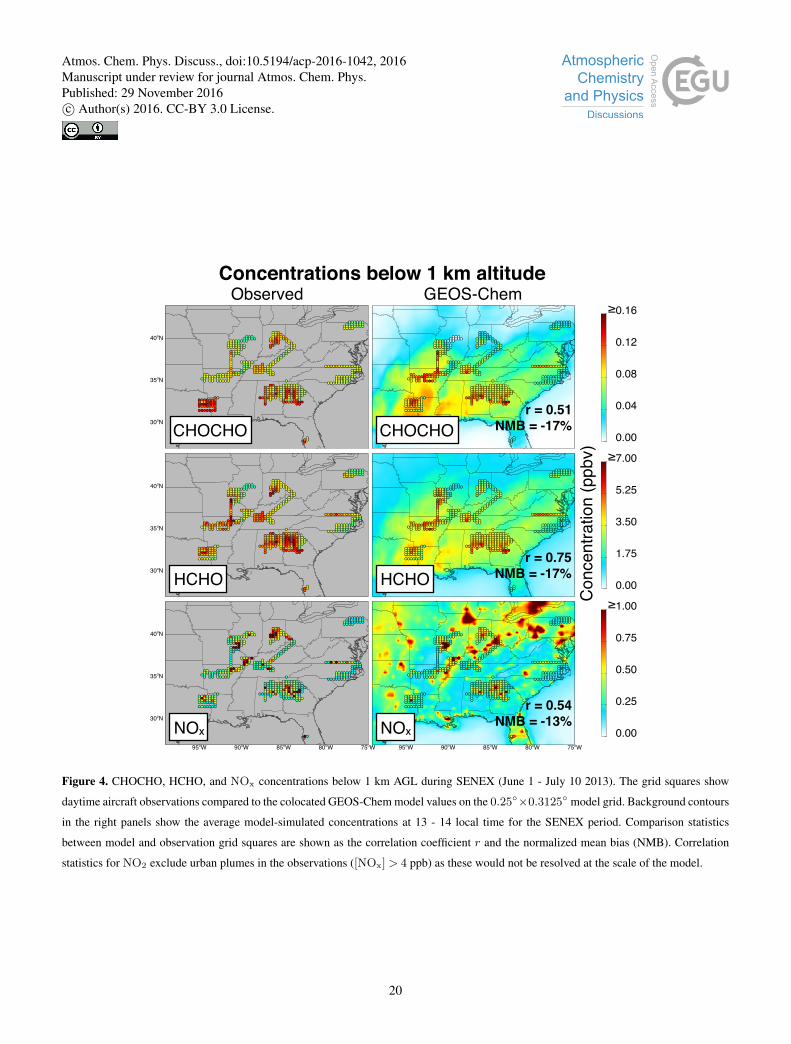
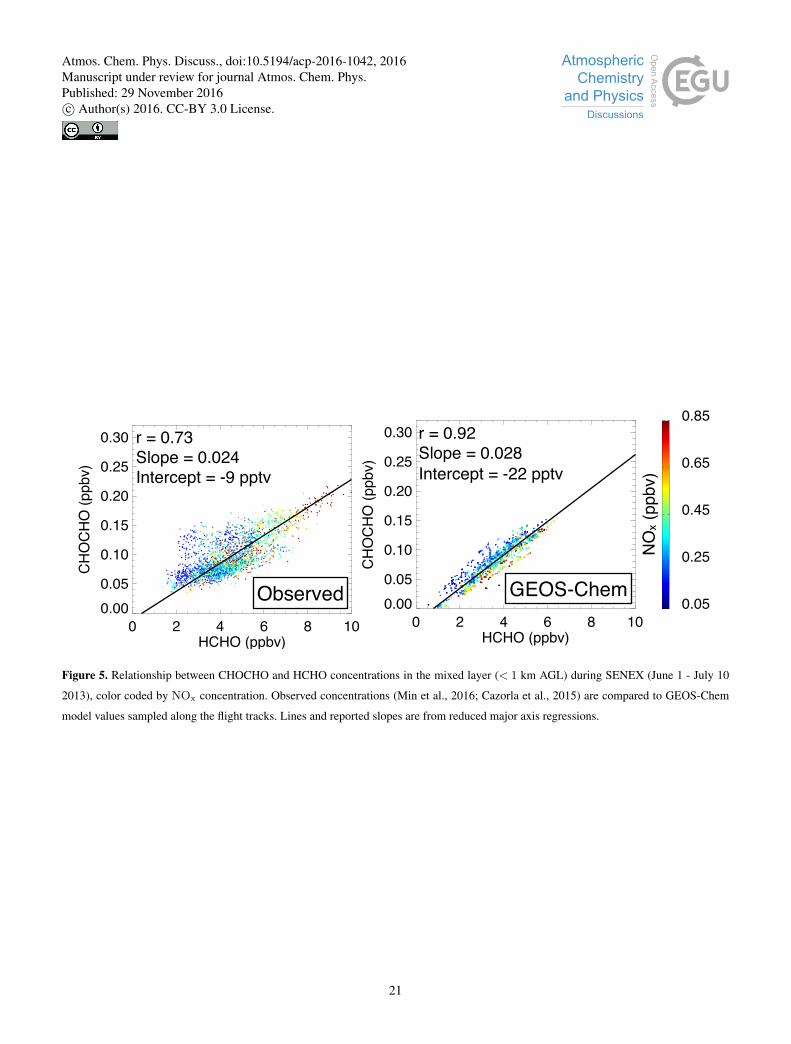


![CONSTRAINTS FROM ATMOSPHERIC MEASUREMENTS ON THE …acmg.seas.harvard.edu/.../Wednesday/WedF_Carbon_suntharalingam… · Suntharalingam et al. [GRL, 2008] •Matching observed seasonal](https://static.documents.pub/doc/80x56/6082bfe97d4e4d3c903485b4/constraints-from-atmospheric-measurements-on-the-acmgseas-suntharalingam-et-al.jpg)
