89
| Date post: | 07-Apr-2017 |
| Category: |
Economy & Finance |
| Upload: | usittech |
| View: | 1,332 times |
| Download: | 0 times |


General Meeting #610.13.2015University Securities Investment Teamtexasusit.org
TexasUSIT.org
Agenda• General Announcements• Market Update• Jack Butler
• Portfolio Update• Cliffe Kim
• Lecture: Generating Investment Theses• Dylan James
• Stock Pitch: IPG Photonics (IPGP)• Grant Kjeldsen, Sunny Pamidimukkala, Priyanka Suri,
Collin Hartman, Srija Nalla, Max Huang
10/6/15

TexasUSIT.org
General Announcements
10/6/15
• First TWO meetings are free!• Analyst Groups: CLOSED• Email [email protected] for WSJ log-in
information• UCF Workshop: Options Theory II• Thursday, Oct 1st – CBA 4.328, 7-8pm

TexasUSIT.org
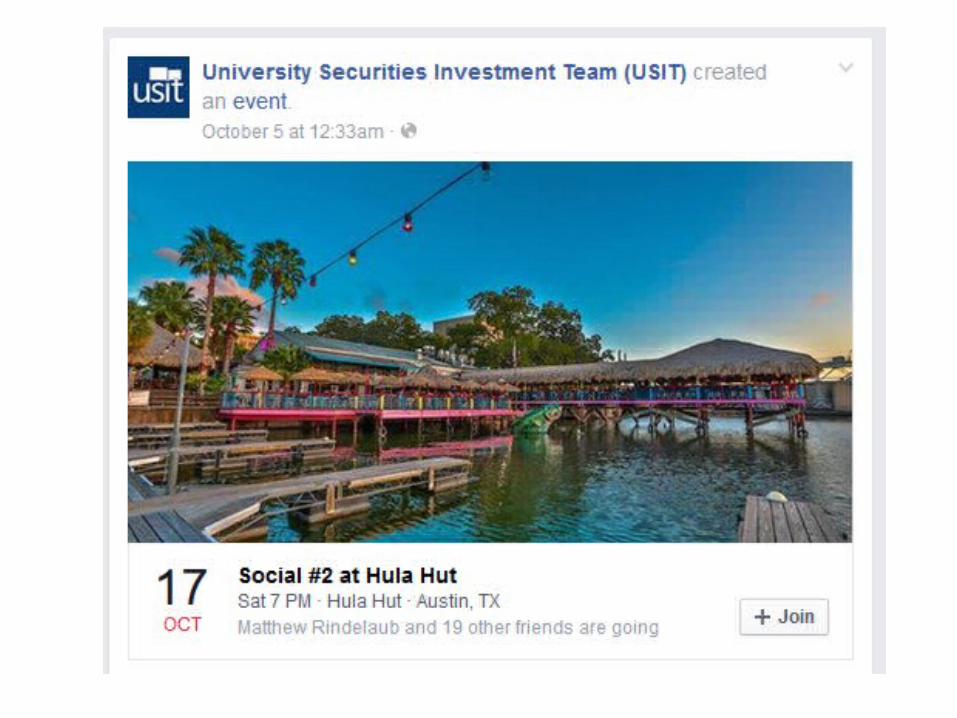
USIT Social! • The Picnic• Saturday, October 17th • 7pm – 9pm • Meet at Littlefield Fountain at 6:30pm• RSVP online!!
10/6/15

TexasUSIT.org
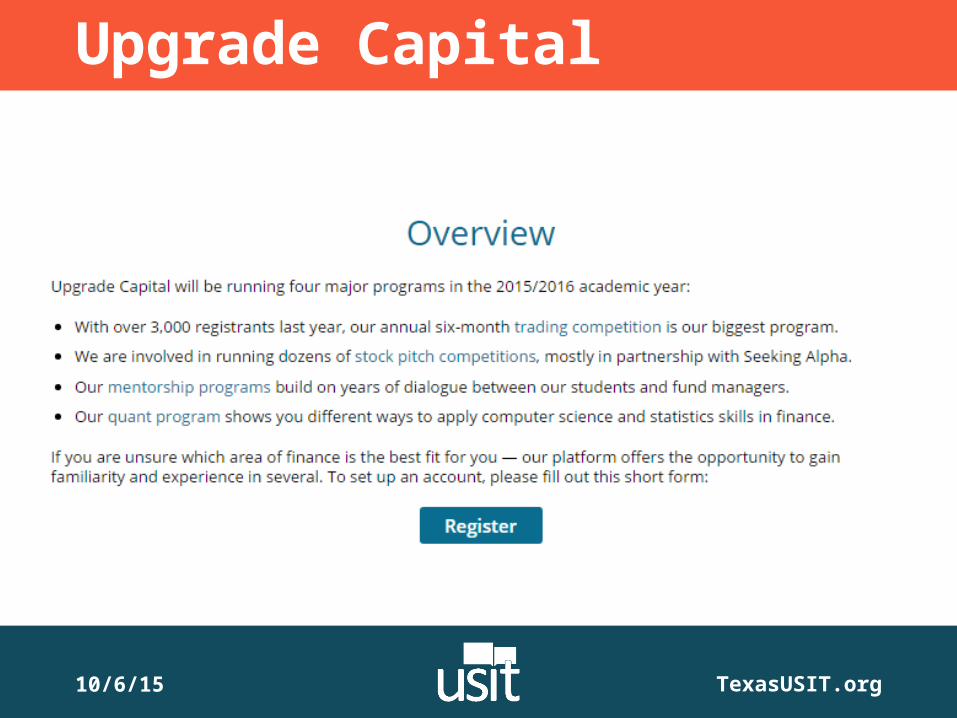
Upgrade Capital
10/6/15

TexasUSIT.org
Upgrade Capital
10/6/15

Market UpdateJack Butler
TexasUSIT.org
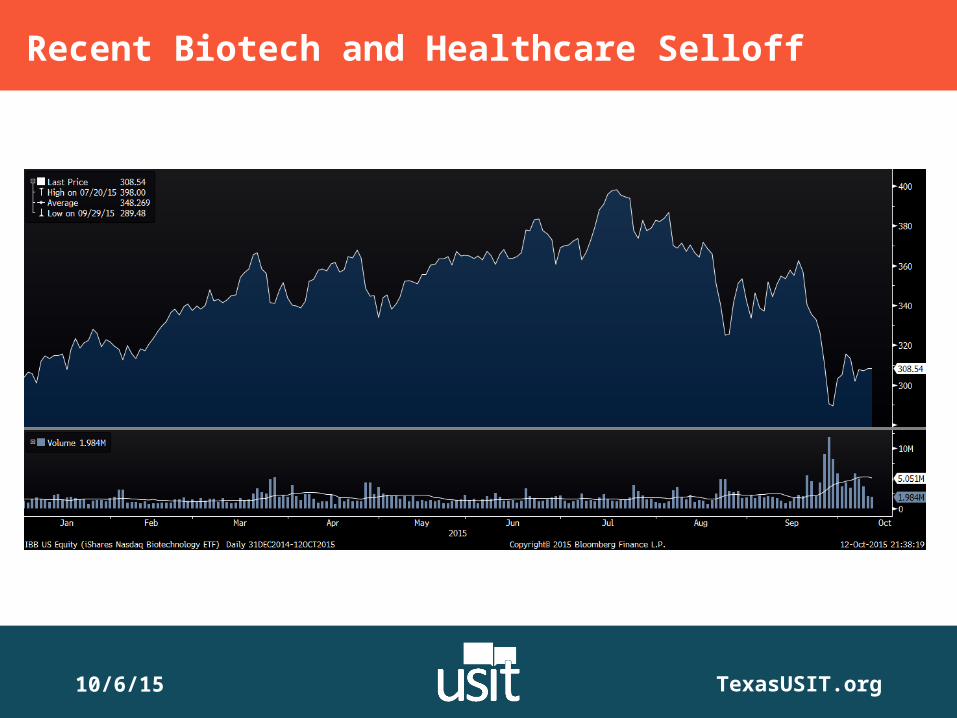
Recent Biotech and Healthcare Selloff
10/6/15

TexasUSIT.org
Why?
10/6/15

TexasUSIT.org
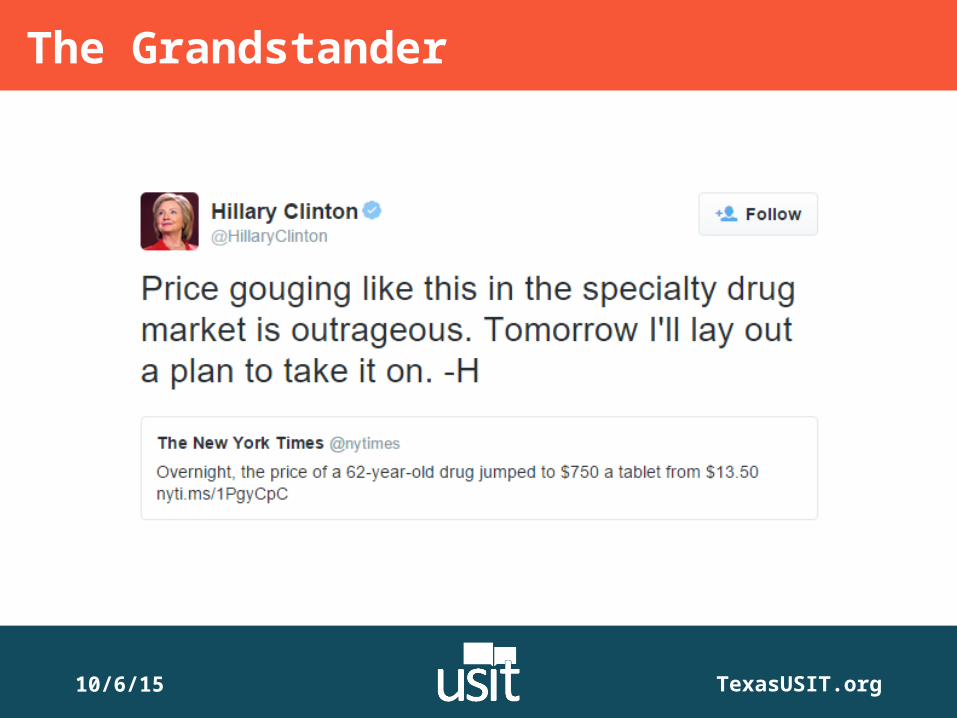
- Hedge fund manager- Owner of Turing Pharmaceuticals- Douche- Bought rights to existing HIV drug- Raised price from $13.50 to $750
Martin Shkreli
- Later said Turing would lower the price
The Compensator
10/6/15
TexasUSIT.org
The Grandstander
10/6/15

TexasUSIT.org
The Biotech Investor
10/6/15

TexasUSIT.org
Buying Opportunity? Too Soon to Tell?
The Value Play
10/6/15

TexasUSIT.org
Alcoa earnings miss: 7 cents per share, vs expected 13 cents
Why?
MORE upside?Falling aluminum prices
In Other News…
10/6/15

TexasUSIT.org
Stock down 23% off three-month highPrice targets lowered
Model X Luxury SUV• Model X price higher
than expected• Slow manufacturing,
fewer deliveries than expected
Tesla Continues to Slide
10/6/15
TexasUSIT.org
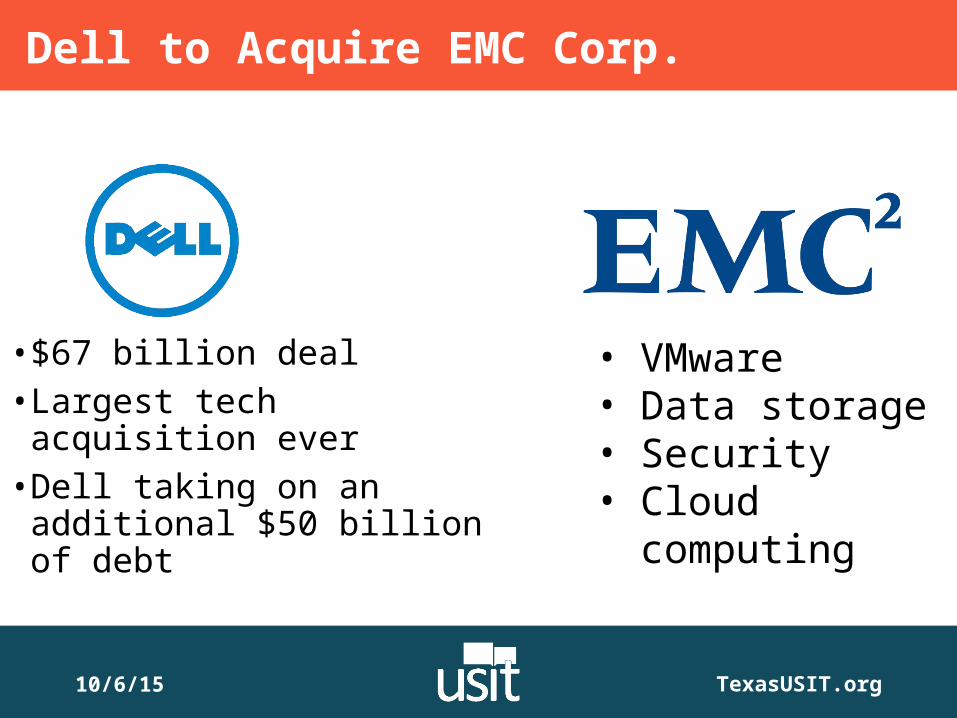
• $67 billion deal• Largest tech acquisition ever• Dell taking on an additional $50 billion of debt
• VMware • Data storage• Security• Cloud
computing
Dell to Acquire EMC Corp.
10/6/15

TexasUSIT.org
• SABMiller valued at $104.2 billion• Largest beer acquisition ever• New company will have over 28% global market share, $64 billion in revenue, toehold in high growth Asian and African markets
Anheuser-Busch InBev to Acquire SABMiller
10/6/15
Portfolio UpdateCliffe Kim
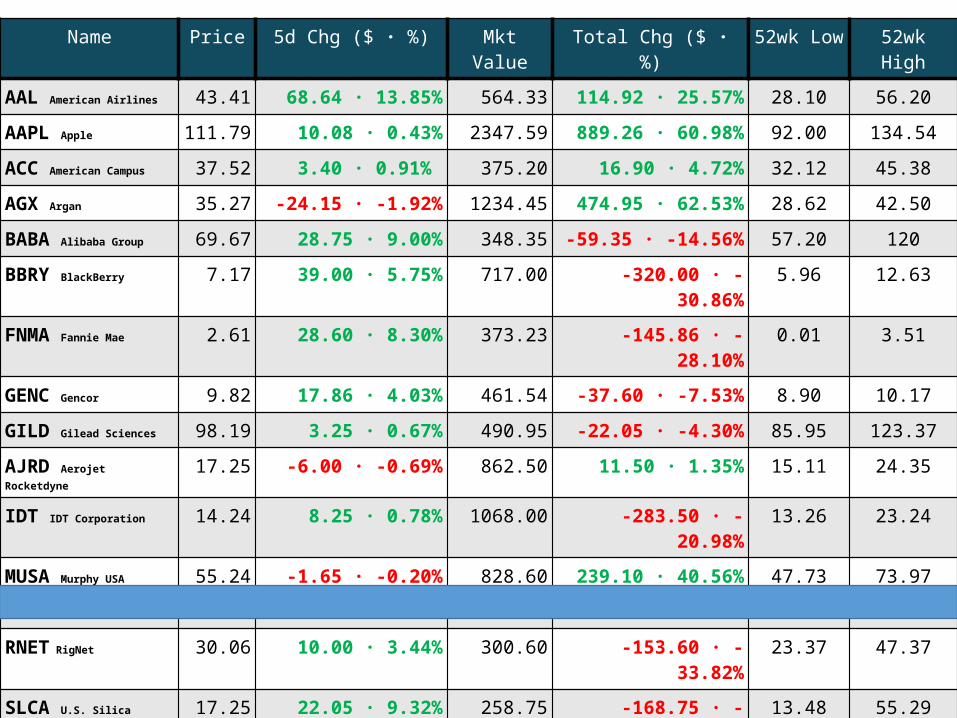
Name Price 5d Chg ($ · %) Mkt Value Total Chg ($ · %) 52wk Low
52wk High
AAL American Airlines 43.41 68.64 · 13.85% 564.33 114.92 · 25.57% 28.10 56.20AAPL Apple 111.79 10.08 · 0.43% 2347.59 889.26 · 60.98% 92.00 134.54ACC American Campus 37.52 3.40 · 0.91% 375.20 16.90 · 4.72% 32.12 45.38AGX Argan 35.27 -24.15 · -1.92% 1234.45 474.95 · 62.53% 28.62 42.50BABA Alibaba Group 69.67 28.75 · 9.00% 348.35 -59.35 · -14.56% 57.20 120BBRY BlackBerry 7.17 39.00 · 5.75% 717.00 -320.00 · -30.86% 5.96 12.63FNMA Fannie Mae 2.61 28.60 · 8.30% 373.23 -145.86 · -28.10% 0.01 3.51GENC Gencor 9.82 17.86 · 4.03% 461.54 -37.60 · -7.53% 8.90 10.17GILD Gilead Sciences 98.19 3.25 · 0.67% 490.95 -22.05 · -4.30% 85.95 123.37AJRD Aerojet Rocketdyne
17.25 -6.00 · -0.69% 862.50 11.50 · 1.35% 15.11 24.35
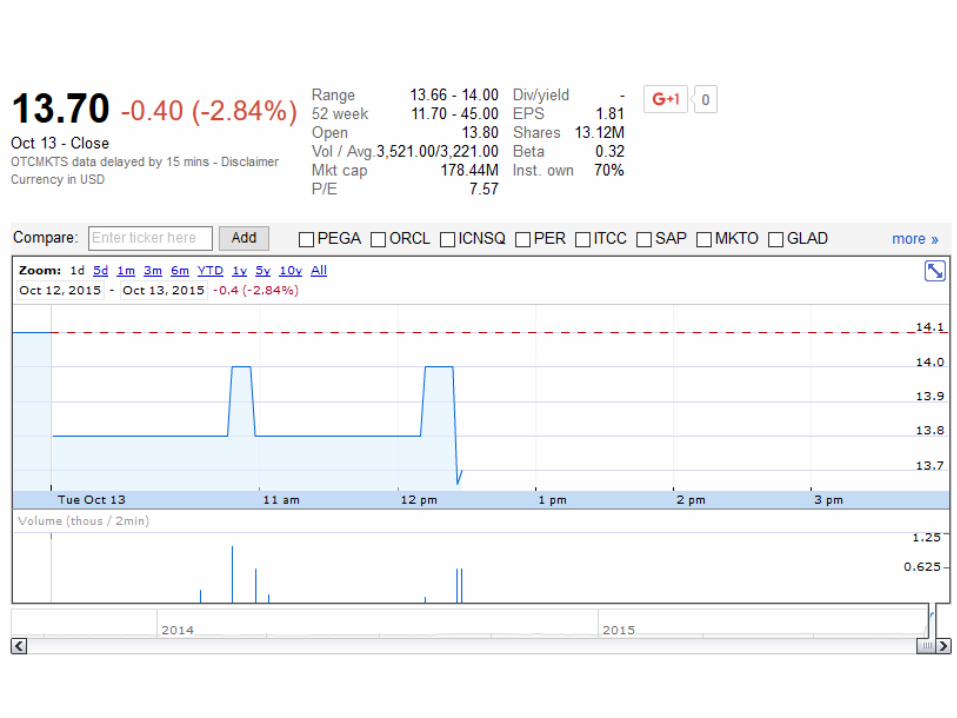
IDT IDT Corporation 14.24 8.25 · 0.78% 1068.00 -283.50 · -20.98% 13.26 23.24MUSA Murphy USA 55.24 -1.65 · -0.20% 828.60 239.10 · 40.56% 47.73 73.97PTC PTC Inc. 34.68 6.50 · 1.91% 346.80 8.70 · 2.57% 30.53 42.75RNET RigNet 30.06 10.00 · 3.44% 300.60 -153.60 · -33.82% 23.37 47.37SLCA U.S. Silica 17.25 22.05 · 9.32% 258.75 -168.75 · -39.47% 13.48 55.29SWKH SWK Holdings 13.70 49,420.00 ·
864.79%54800.00 54352.00 ·
1123.21%1.17 4.5
TRN Trinity Industries 27.08 27.82 · 8.58% 354.04 -47.06 · -11.79% 21.78 42.08HLT Hilton Worldwide Holdings
25.00 20.57 · 5.09% 425.00 -13.43 · -3.06% 20.72 31.60
05/02/2023 TexasUSIT.org
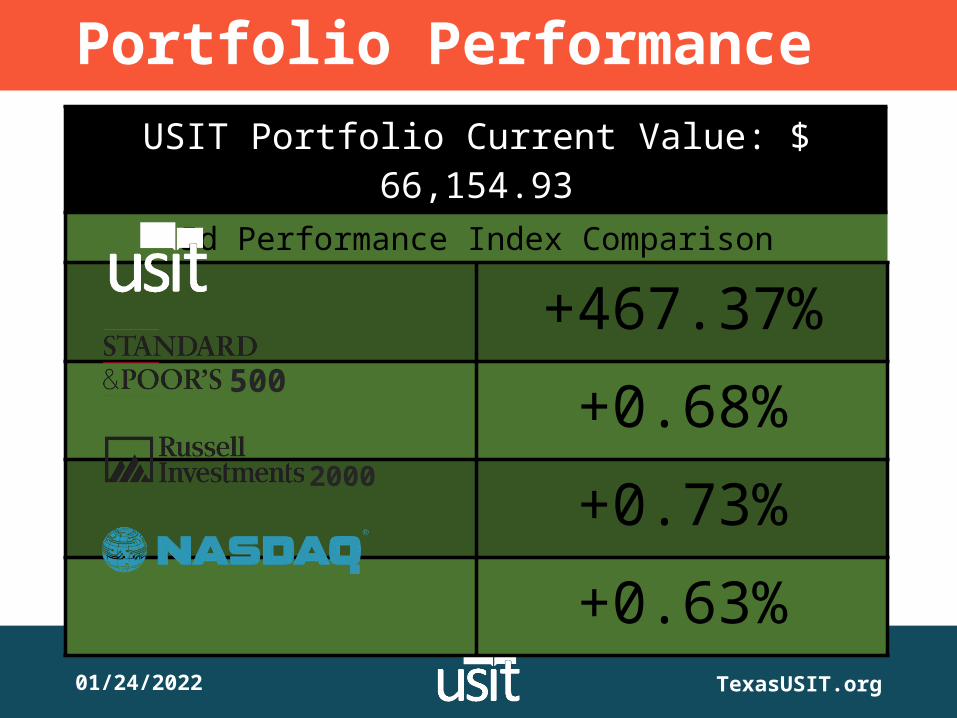
Portfolio PerformanceUSIT Portfolio Current Value: $ 66,154.93
5d Performance Index Comparison
+467.37%+0.68%+0.73%+0.63%
500
2000

05/02/2023 TexasUSIT.org
The IMPORTANT Question to Ask:• What happened with SWKH?• Why did it rise so dramatically??• How is this possible???
Where are we going to go for the next social?
#goodJobGuys

05/02/2023 TexasUSIT.org
The Choices:1. Hawaii• Actually go to an actual Hula Hut
2. Milano• Buy Italian tailored suits to impress recruiters
at the next Career Fair3. Las Vegas• Gamble away our returns and come back
with even HIGHER returns, repeat, etc.
Get your passports ready!

05/02/2023 TexasUSIT.org
The IMPORTANT Question to Ask:• What happened with SWKH?• Why did it rise so dramatically??• How is this possible???
Where are we going to go for the next social?
#goodJobGuys
05/02/2023 TexasUSIT.org
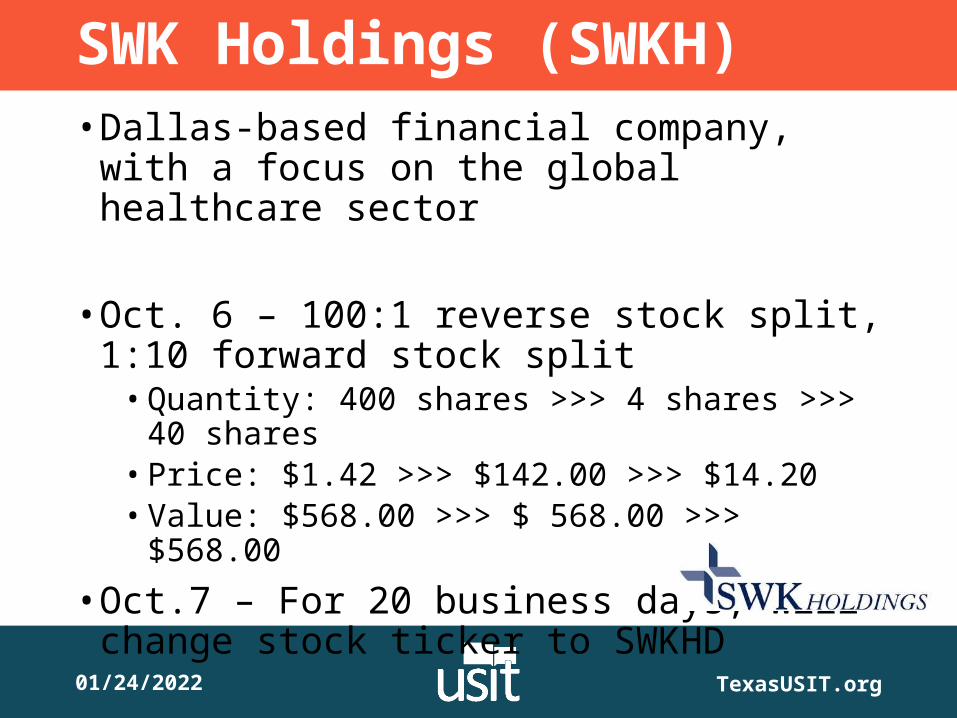
SWK Holdings (SWKH)• Dallas-based financial company, with a
focus on the global healthcare sector
• Oct. 6 – 100:1 reverse stock split, 1:10 forward stock split• Quantity: 400 shares >>> 4 shares >>> 40
shares• Price: $1.42 >>> $142.00 >>> $14.20• Value: $568.00 >>> $ 568.00 >>> $568.00
• Oct.7 – For 20 business days, will change stock ticker to SWKHD

05/02/2023 TexasUSIT.org
Reverse Stock Split?• Why do companies do reverse stock
splits?
• Perception Change: ($10 stock vs $1 stock)• Some institutions won’t buy stocks under $5
• Regulatory Reasons• Listing requirements of NYSE and NASDAQ
• Getting rid of small investors• Cash payout for small shares
05/02/2023 TexasUSIT.org
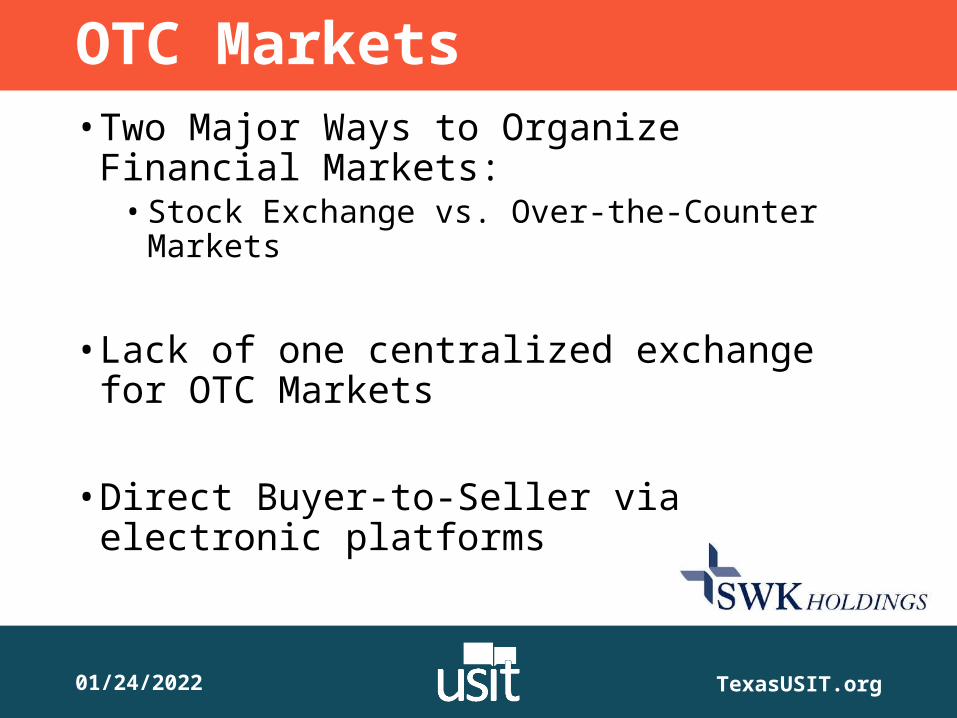
OTC Markets• Two Major Ways to Organize Financial
Markets:• Stock Exchange vs. Over-the-Counter Markets
• Lack of one centralized exchange for OTC Markets
• Direct Buyer-to-Seller via electronic platforms


05/02/2023 TexasUSIT.org
ConclusionReverse/Forward Stock Split+ OTC Market+ Lack of Coverage/Interest+ Change in Stock Ticker+ Google Finance being wonky
= False Hopes, Life Disappointments, Confused Cliffe

05/02/2023 TexasUSIT.org
Portfolio PerformanceUSIT Portfolio Current Value: $ 11,902.93
5d Performance Index Comparison
+2.08%+0.68%+0.73%+0.63%
500
2000

Lecture: Generating Investment ThesesDylan James
10-13-15
Constructing a ThesisThe ABCs
Investment “X” is undervalued because of “XYZ”
10-13-15
Constructing a Thesis
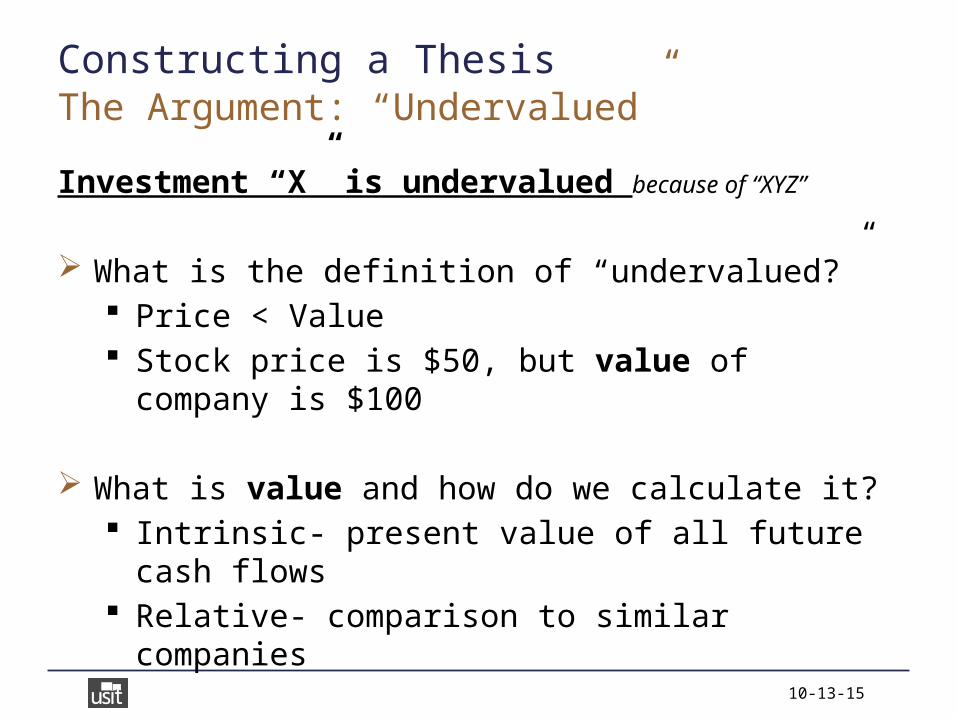
Investment “X” is undervalued because of “XYZ”
What is the definition of “undervalued?” Price < Value Stock price is $50, but value of company is $100
What is value and how do we calculate it? Intrinsic- present value of all future cash flows Relative- comparison to similar companies
The Argument: “Undervalued”
10-13-15
Constructing a Thesis
Investment “X” is undervalued because of “XYZ”
The fun part! Simply the ability to craft a coherent, logical argument Skillset not unique to finance (philosophy, debate, politics)
Will focus on providing examples particular to finance Can look for supporting evidence in two broad categories Fundamental vs. Technical
Supporting Evidence
10-13-15
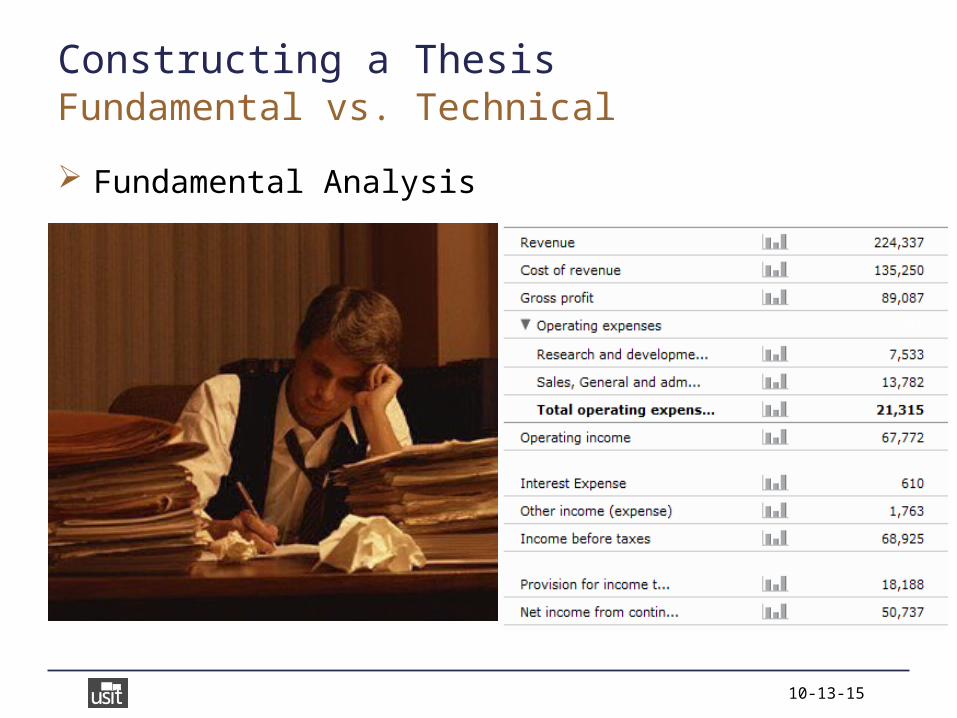
Constructing a Thesis
Fundamental Analysis
Fundamental vs. Technical
10-13-15
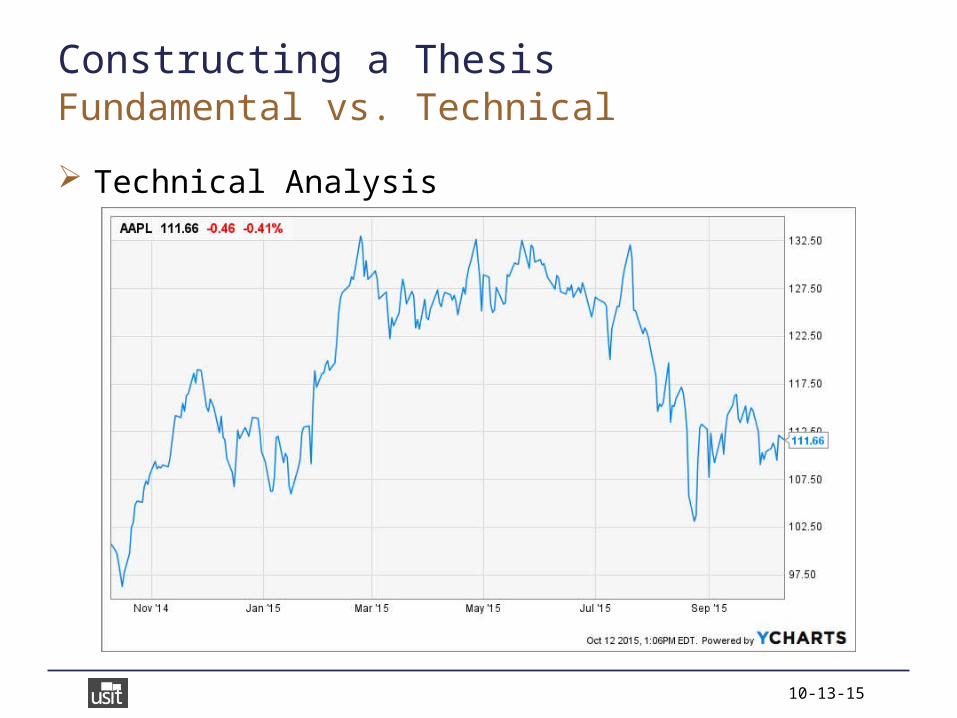
Constructing a Thesis
Technical Analysis
Fundamental vs. Technical
10-13-15
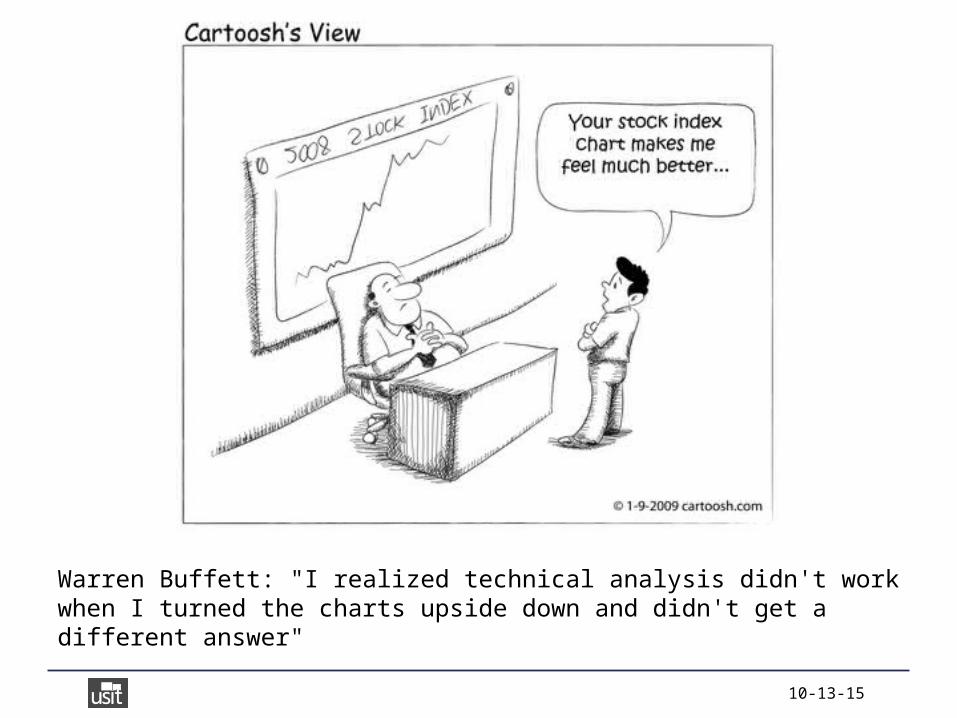
Warren Buffett: "I realized technical analysis didn't work when I turned the charts upside down and didn't get a different answer"

10-13-15
Constructing a Thesis
Technical Analysis
Fundamental vs. Technical

10-13-15
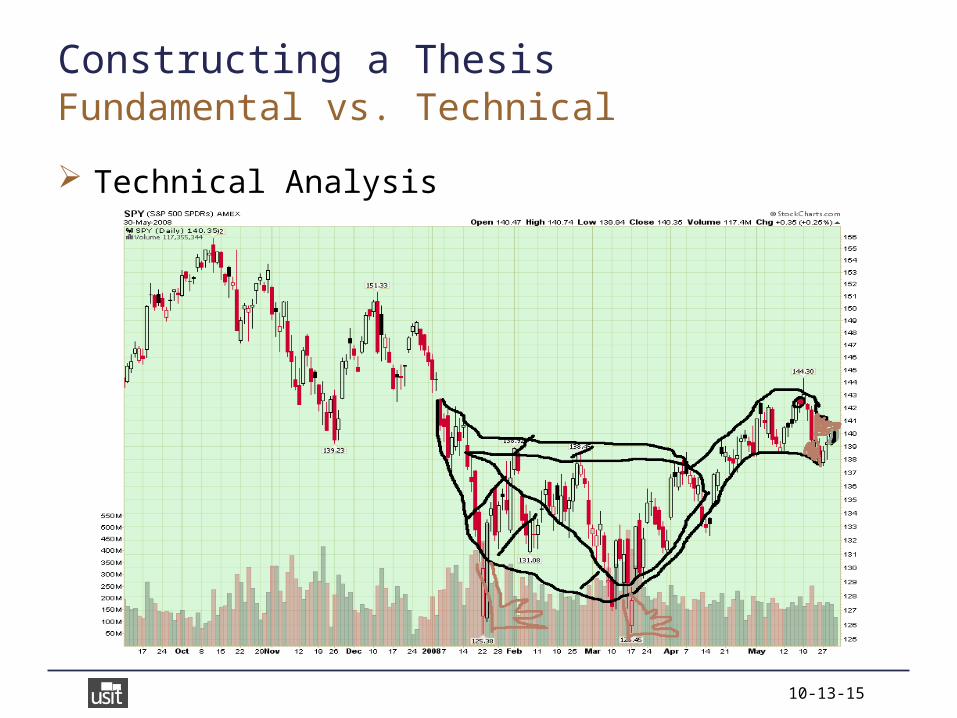
Constructing a Thesis
Technical Analysis
Fundamental vs. Technical
10-13-15
Constructing a Thesis
Technical Analysis
Fundamental vs. Technical

10-13-15
Constructing a Thesis
Technical Analysis
Fundamental vs. Technical

10-13-15
Constructing a Thesis
Growth Investors Search for companies that will grow at above-market rates,
willing to pay a premium for future growth Often buy stocks in popular sectors such as biotech Argue that investors are underestimating future growth
Value Investors Search for companies that are down on their luck, attempting
to buy at a discount with a margin of safety Often buy stocks in unpopular sectors such as energy Argue that investors are underestimating current value
Value vs. Growth

10-13-15
Constructing a ThesisBottom Up V.S. Top Down

10-13-15
Constructing a Thesis
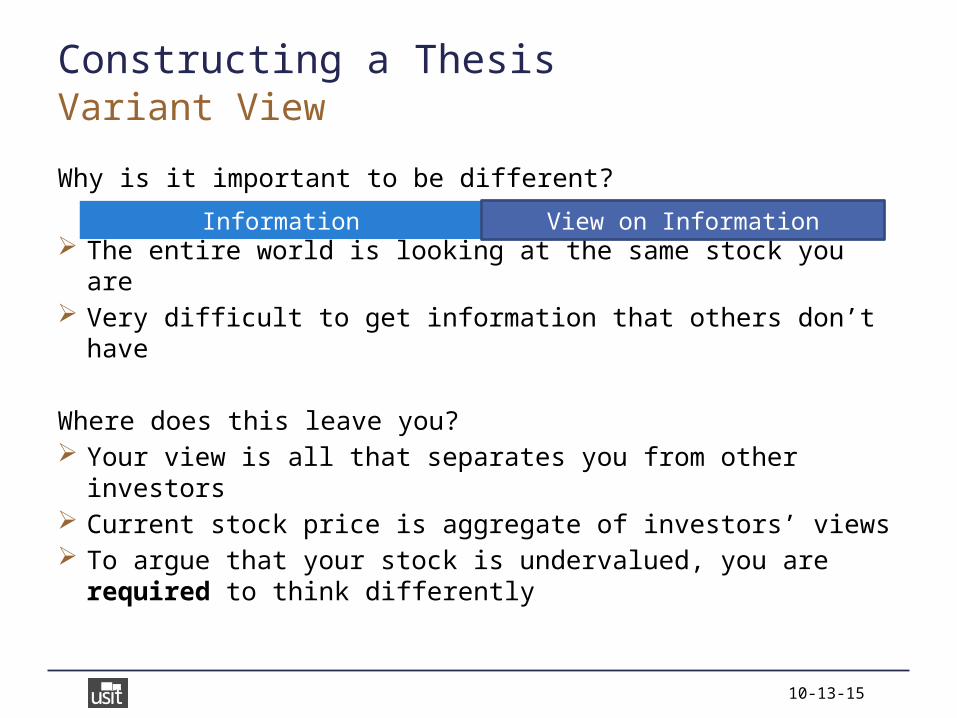
Why is it important to be different?
The entire world is looking at the same stock you are Very difficult to get information that others don’t have
Where does this leave you?
Variant View
Information View on Information
10-13-15
Constructing a Thesis
Why is it important to be different?
The entire world is looking at the same stock you are Very difficult to get information that others don’t have
Where does this leave you? Your view is all that separates you from other investors Current stock price is aggregate of investors’ views To argue that your stock is undervalued, you are required to
think differently
Variant View
Information View on Information
10-13-15
Constructing a Thesis
Examples Buy AAPL because of recent product launch in the news Buy NFLX because it’s a great company that’s growing fast Buy TSLA because the company’s electric cars are the future
What NOT to Do
10-13-15
Constructing a Thesis
Examples Buy AAPL because of recent product launch in the news Buy NFLX because it’s a great company that’s growing fast Buy TSLA because the company’s electric cars are the future
Takeaway Thesis should be carefully built, logical argument Fundamental, value research is contrarian by nature Variant view is key- why are you different?
What NOT to Do

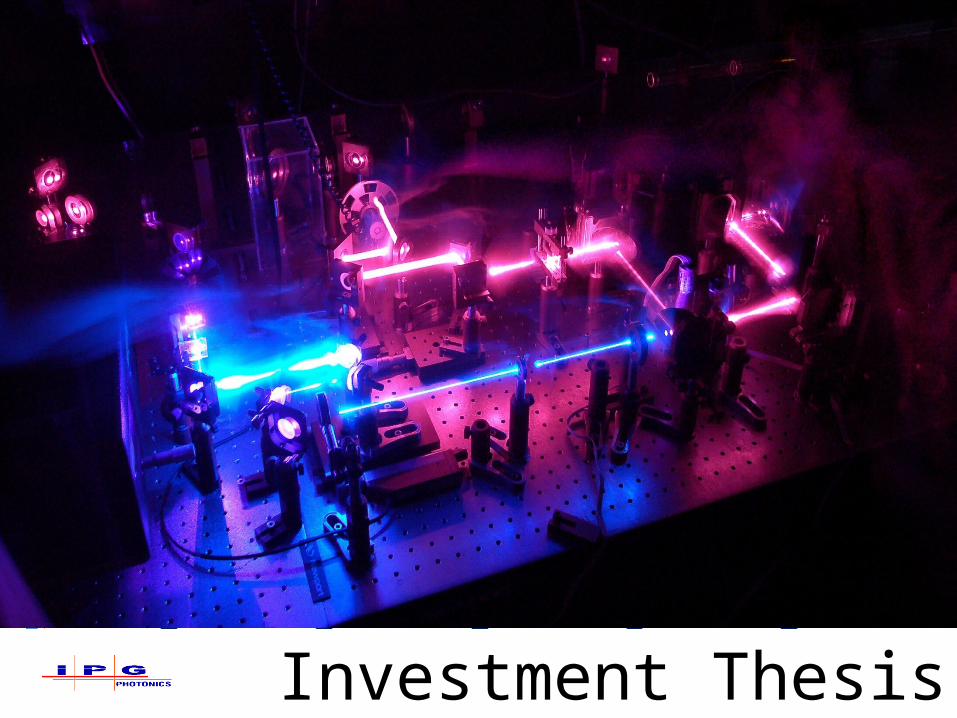
Stock Pitch: IPG Photonics (IPGP)Pitch Team: Grant Kjeldsen, Sunny Pamidimukkala, Priyanka Suri, Collin Hartman, Srija Nalla, Max Huang

IPG
Phot
onics
CompanyThesis Industry RisksValuation
IPG Photonics Corp (IPGP)Chinese Economic Downturn Overshadows Revenue GrowthLONG, TP $94.38 (+23.7%)
PITCH TEAM
Grant Kjeldsen, DirectorSunny Pamidimukkala, Senior AnalystCollin Hartman, Junior AnalystPriyanka Suri, Junior AnalystSrija Nalla, AnalystMax Huang, Analyst
IPG
Phot
onics
CompanyThesis Industry RisksValuationInvestment Thesis
IPG
Phot
onics
CompanyThesis Industry RisksValuation
Investment Thesis
3
2
1 Market has overreacted to fears that dependency on China will affect sales
Increased dependence on fiber lasers in manufacturing provides an expanding marketHigh volume of shorts provides potential for a “short squeeze”

IPG
Phot
onics
CompanyThesis Industry RisksValuationCompany Overview

IPG
Phot
onics
CompanyThesis Industry RisksValuation
Company Overview Global Leader in Rapidly Expanding Technological Market
Growing international market
• Fiber laser usage quickly displacing conventional lasers: increased power, accuracy, customizability
• Diverse applications: materials processing, advanced tech, telecommunication, medical
• Uncontested leader in fiber laser industry
Fiber laser + laser amplifier manufacturer
• Products sold to OEMs, systems integrators and end users for use in many industries
• Significant quarterly revenue increase in Chinese sales department despite economic slowdown

IPG
Phot
onics
CompanyThesis Industry RisksValuation
Company Overview Competitive Advantage
Vertical Integration• Reduce costs while controlling quality• Allows for protection of intellectual
property and trade secretss costControls qualityFirst mover advantage in fiber lasers• Dominance in market share• Allows creation of diverse customer base
across geographic locations
Strong Global Presence• Revenues seeing a positive trend in Asia• Infrastructure built up primarily in the US, China, and Europe
IPG
Phot
onics
CompanyThesis Industry RisksValuation
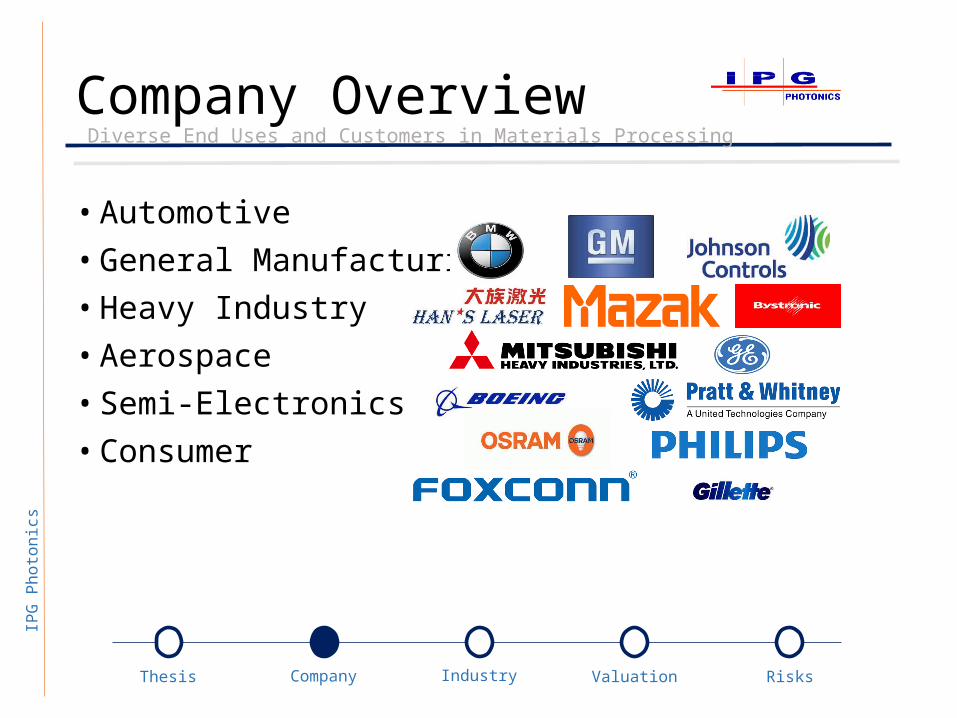
Company Overview Diverse End Uses and Customers in Materials Processing
• Automotive• General Manufacturing• Heavy Industry• Aerospace• Semi-Electronics• Consumer
IPG
Phot
onics
CompanyThesis Industry RisksValuation
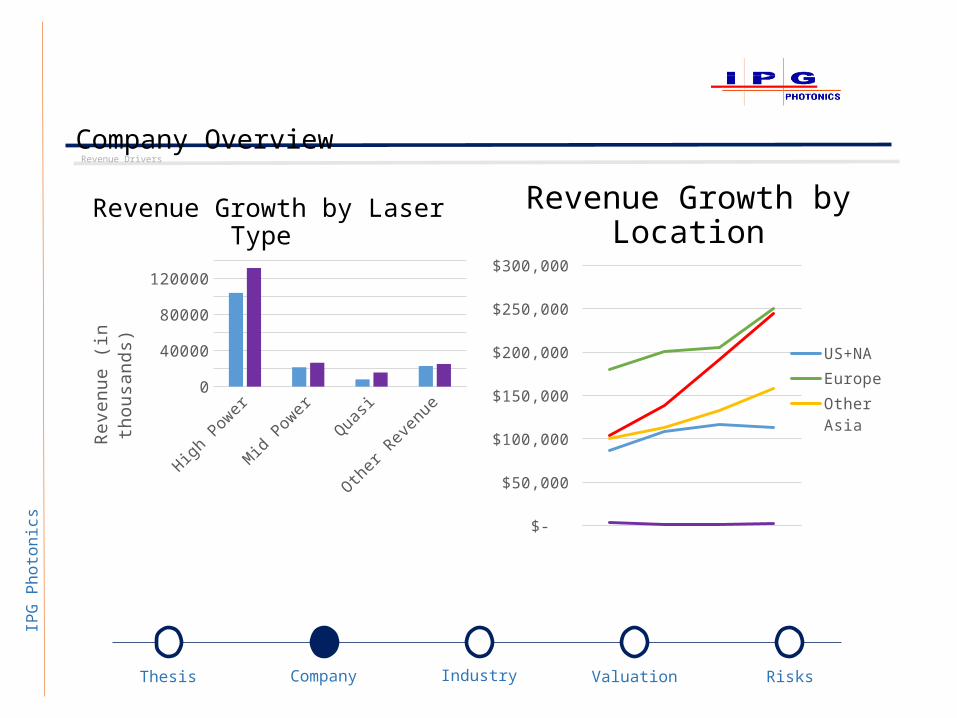
Company Overview Revenue Drivers
Revenue Growth by Laser Type
High Power
Mid Power
Quasi Other Revenue
0
20000
40000
60000
80000
100000
120000
140000
2014 Q2
Reve
nue
(in th
ousa
nds)
Revenue Growth by Location
2011 2012 2013 2014 $-
$50,000
$100,000
$150,000
$200,000
$250,000
$300,000
US+NAEuropeOther AsiaChina

IPG
Phot
onics
CompanyThesis Industry RisksValuation
Company Overview Chinese Market Slowdown?
2014 Q1
2014 Q2
2014 Q3
2014 Q4
2015 Q1
2015 Q2
$-
$50.0
$100.0
$150.0
$200.0
$250.0
Quarterly Revenue
reve
nue
in th
ousa
nds
2014 Q1
2014 Q2
2014 Q3
2014 Q4
2015 Q1
2015 Q2
0%
5%
10%
15%
20%
25%
30%
% Quarterly Revenue Growth vs Previous Year
% g
rowt
h
slowd
own
begi
ns
slowd
own
begi
ns
IPG
Phot
onics
CompanyThesis Industry RisksValuation
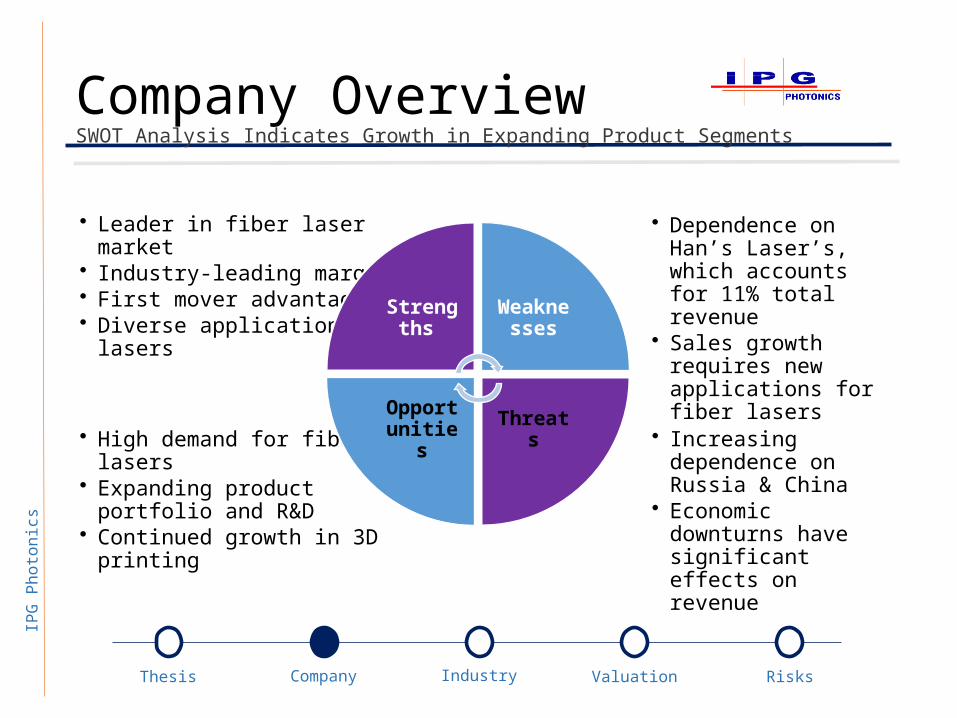
Company OverviewSWOT Analysis Indicates Growth in Expanding Product Segments
• Increasing dependence on Russia & China
• Economic downturns have significant effects on revenue
• High demand for fiber lasers• Expanding product portfolio
and R&D• Continued growth in 3D
printing
• Dependence on Han’s Laser’s, which accounts for 11% total revenue
• Sales growth requires new applications for fiber lasers
• Leader in fiber laser market• Industry-leading margins• First mover advantage• Diverse applications for
lasersStreng
ths Weaknesses
Threats
Opportunities

IPG
Phot
onics
CompanyThesis Industry RisksValuationIndustry Overview

IPG
Phot
onics
CompanyThesis Industry RisksValuation
Industry Overview
Barriers to Entry
Bargaining Power of Buyers
Threat of Substitutes
Intensity of Rivalry
Threat of Substitutes
Bargaining Power of Suppliers
HIGH
MODERATE
LOW
MODERATE
LOW
Large startup costs discourage new entrants High costs of resources, human capital, and research
and development
Industry is not contract-based, so buyers can alter the product volumes they demand
Top 5 customers account for 23% of sales
Firms compete based on differentiation from competitors in prices and products
IPGP has an individualized approach
Compete with non-laser production methods, such as water-jet cutting and resistance welding
Manufacturing equipment is specialized
Bargaining power of suppliers is minimized due to IPGP’s vertical integration
Materials required to build lasers produced in-house
Industry Dynamic
Porter’s Assessment
Rationale

IPG
Phot
onics
CompanyThesis Industry RisksValuation
Industry OverviewIndustry improvements have produced success
Vertical integration has allowed IPGP to create personalized laser diodes and finished fiber lasers and amplifiers, which has reduced manufacturing costs and increased quality.
Lower costs the average cost per watt of output power has decreased dramatically over the past decade.
Expanded Product Portfolio IPGP continues to invest in research and development to add additional wavelengths and power levels, while developing new product lines.
IPG
Phot
onics
CompanyThesis Industry RisksValuation
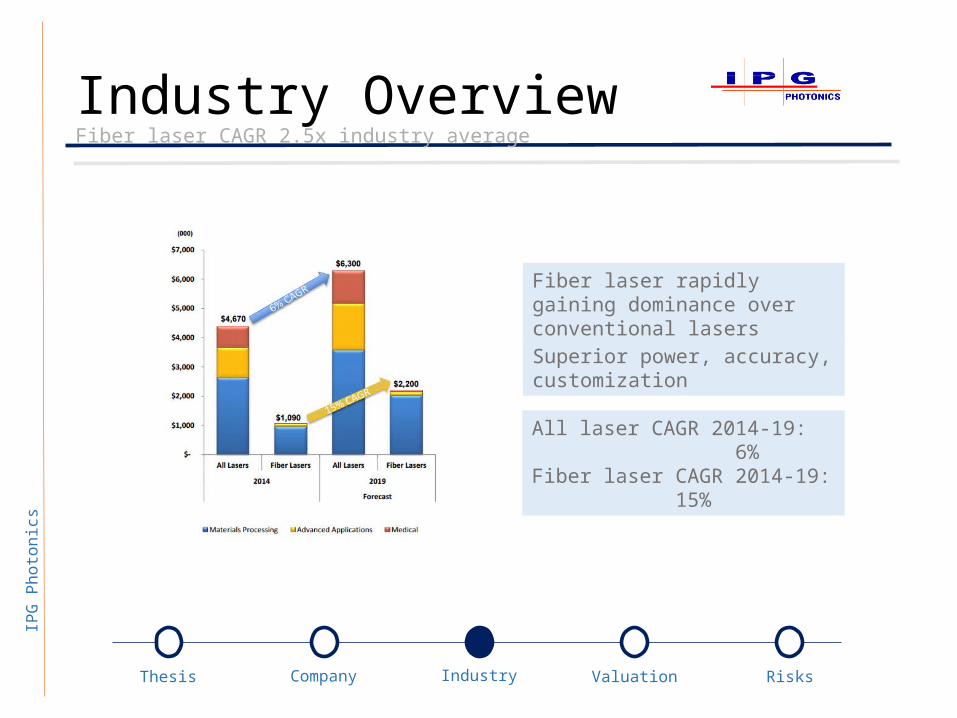
Industry OverviewFiber laser CAGR 2.5x industry average
Fiber laser rapidly gaining dominance over conventional lasers
All laser CAGR 2014-19: 6%Fiber laser CAGR 2014-19: 15%
Superior power, accuracy, customization

IPG
Phot
onics
CompanyThesis Industry RisksValuationValuation
IPG
Phot
onics
CompanyThesis Industry RisksValuation
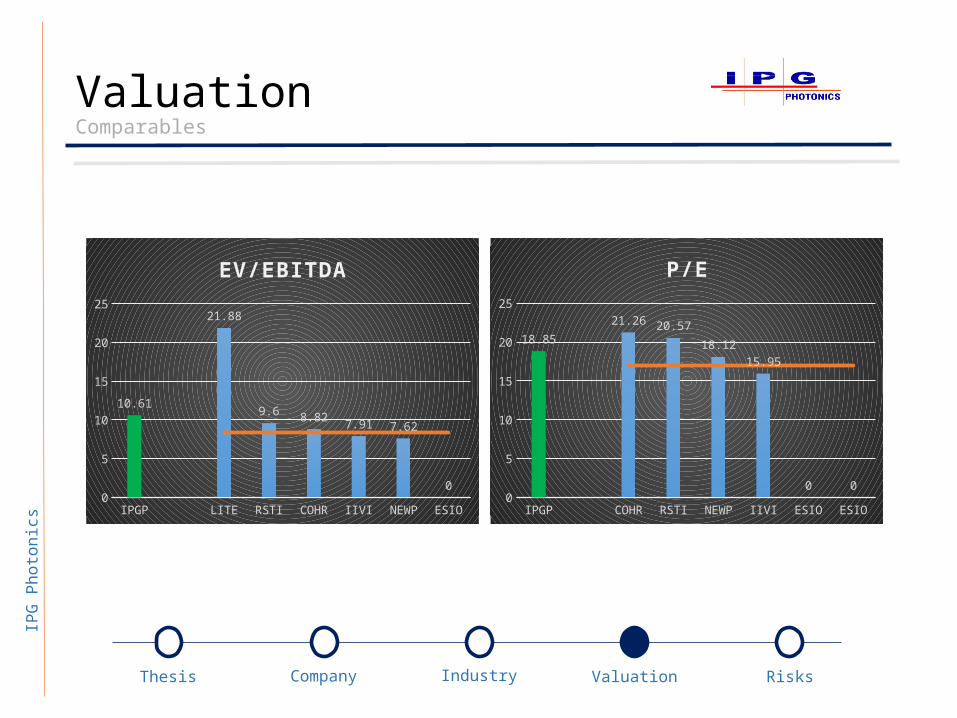
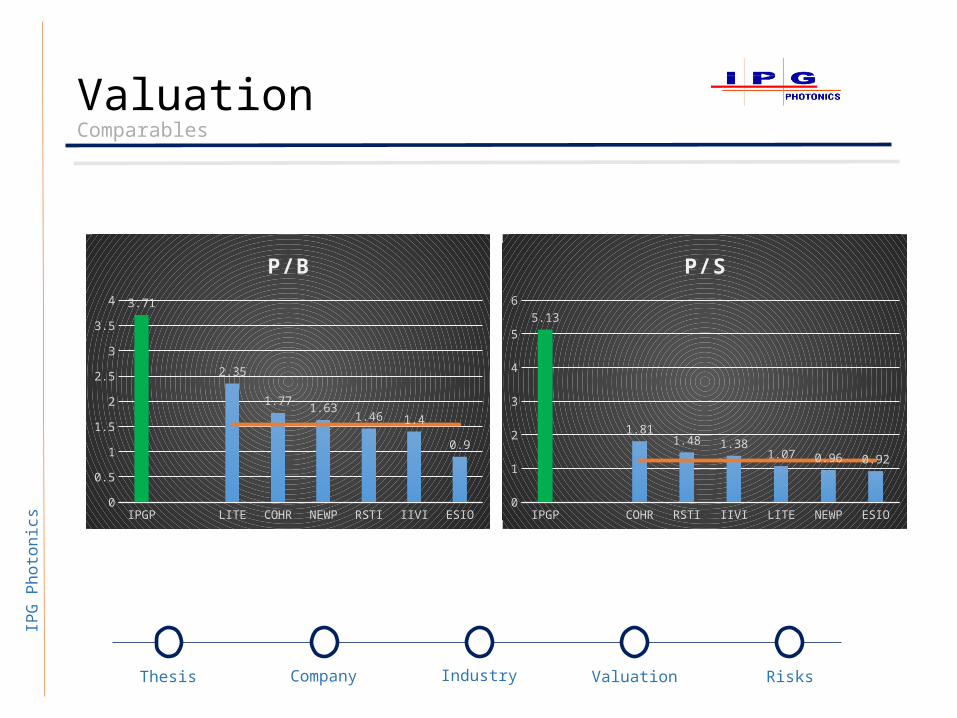
ValuationComparables
IPGP LITE RSTI COHR IIVI NEWP ESIO0
5
10
15
20
25
10.61
21.88
9.6 8.82 7.91 7.62
0
EV/EBITDA
IPGP COHR RSTI NEWP IIVI ESIO ESIO0
5
10
15
20
25
18.85
21.26 20.57
18.1215.95
0 0
P/E
IPG
Phot
onics
CompanyThesis Industry RisksValuation
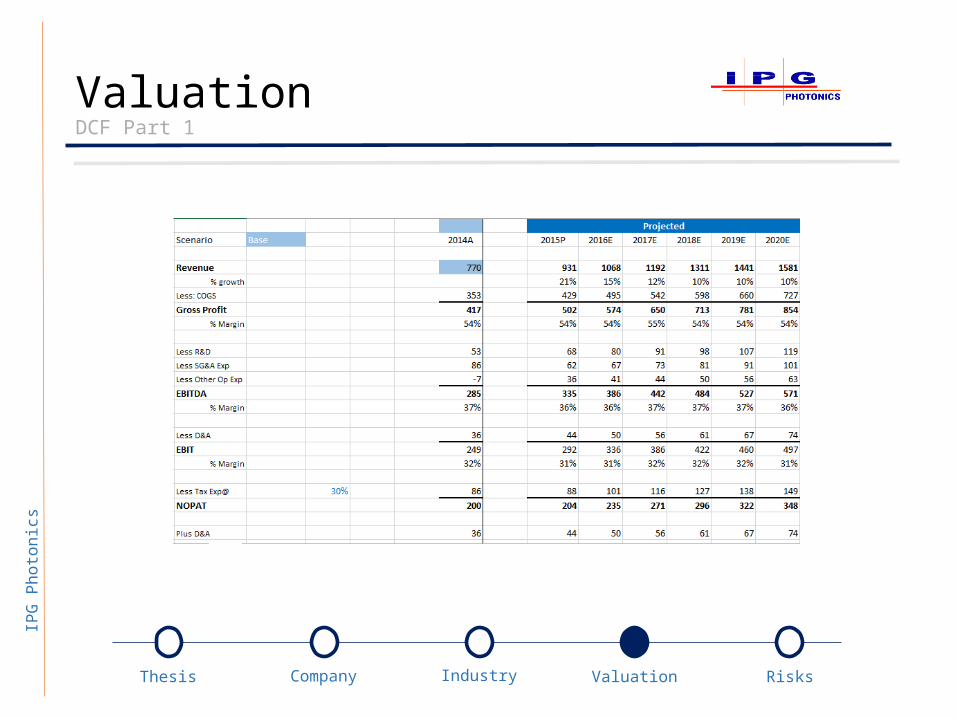
ValuationDCF Part 1
IPG
Phot
onics
CompanyThesis Industry RisksValuation
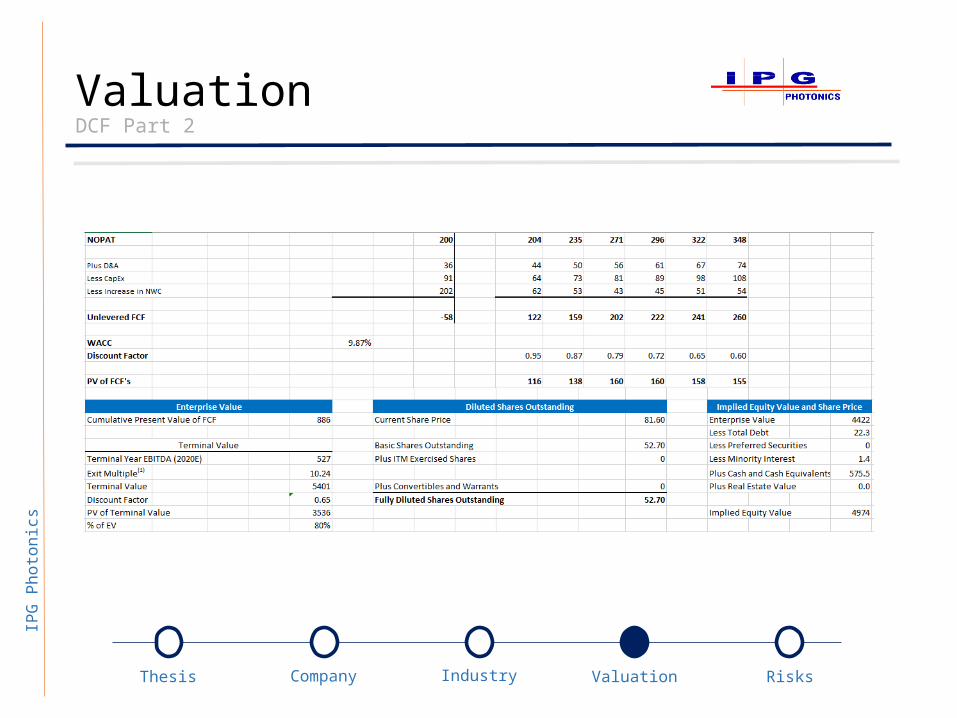
ValuationDCF Part 2
IPG
Phot
onics
CompanyThesis Industry RisksValuation
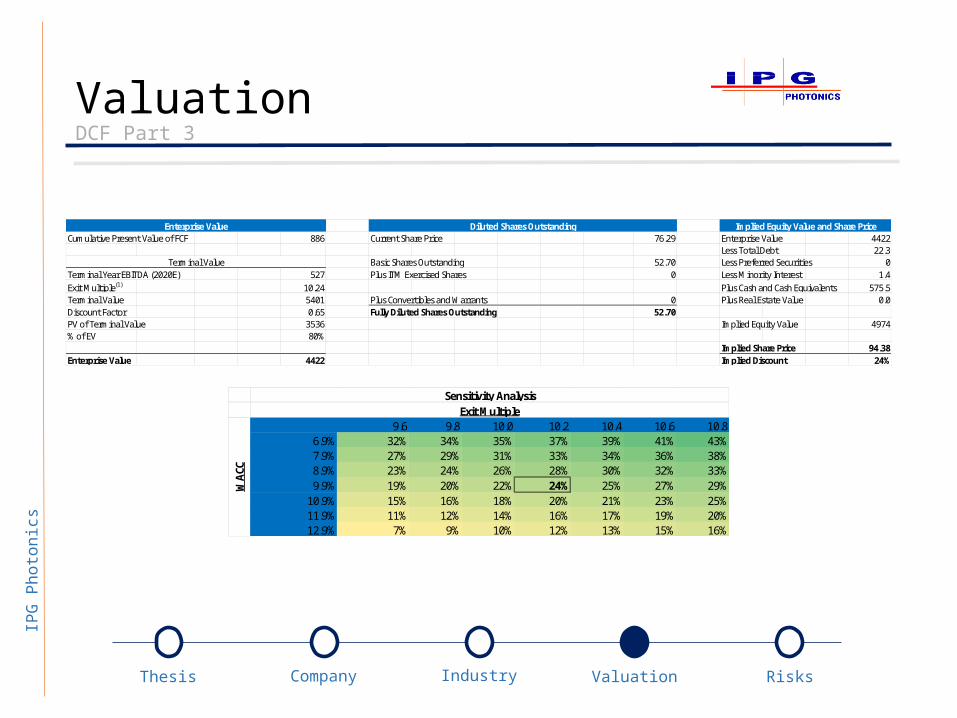
ValuationDCF Part 3
Cumulative Present Value of FCF 886 Current Share Price 76.29 Enterprise Value 4422Less Total Debt 22.3
Basic Shares Outstanding 52.70 Less Preferred Securities 0Terminal Year EBITDA (2020E) 527 Plus ITM Exercised Shares 0 Less Minority Interest 1.4Exit Multiple(1) 10.24 Plus Cash and Cash Equivalents 575.5Terminal Value 5401 Plus Convertibles and Warrants 0 Plus Real Estate Value 0.0Discount Factor 0.65 Fully Diluted Shares Outstanding 52.70PV of Terminal Value 3536 Implied Equity Value 4974% of EV 80%
Implied Share Price 94.38Enterprise Value 4422 Implied Discount 24%
Enterprise Value
Terminal Value
Diluted Shares Outstanding Implied Equity Value and Share Price
9.6 9.8 10.0 10.2 10.4 10.6 10.86.9% 32% 34% 35% 37% 39% 41% 43%7.9% 27% 29% 31% 33% 34% 36% 38%8.9% 23% 24% 26% 28% 30% 32% 33%9.9% 19% 20% 22% 24% 25% 27% 29%
10.9% 15% 16% 18% 20% 21% 23% 25%11.9% 11% 12% 14% 16% 17% 19% 20%12.9% 7% 9% 10% 12% 13% 15% 16%
Sensitivity AnalysisExit Multiple
WAC
C
IPG
Phot
onics
CompanyThesis Industry RisksValuation
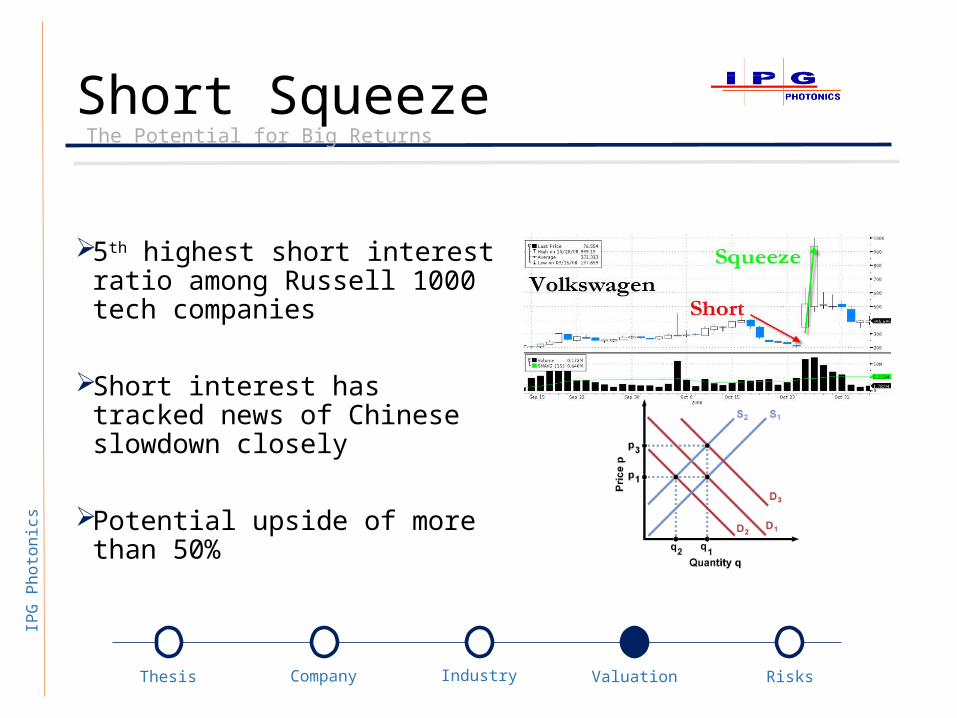
Short Squeeze The Potential for Big Returns
5th highest short interest ratio among Russell 1000 tech companies
Short interest has tracked news of Chinese slowdown closely
Potential upside of more than 50%
IPG
Phot
onics
CompanyThesis Industry RisksValuationRisks and Mitigants
IPG
Phot
onics
CompanyThesis Industry RisksValuation
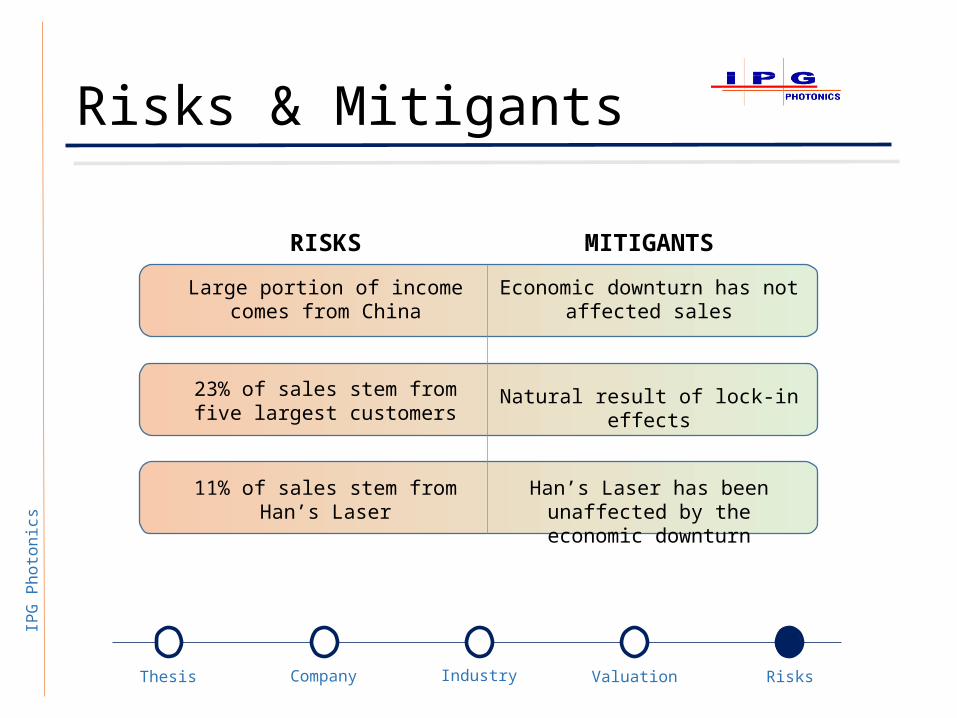
Risks & Mitigants
Large portion of income comes from China
23% of sales stem from five largest customers
11% of sales stem from Han’s Laser
Economic downturn has not affected sales
Natural result of lock-in effects
Han’s Laser has been unaffected by the economic
downturn
RISKS MITIGANTS

IPG
Phot
onics
CompanyThesis Industry RisksValuation
Conclusion
321Investors misgauged sensitivity to China
Expanding fiber laser industry
Potential shortsqueeze
TP: $ 94.38 (+23.7%)
IPG
Phot
onics
CompanyThesis Industry RisksValuation
Questions?
IPG
Phot
onics
CompanyThesis Industry RisksValuation
Appendix
IPG
Phot
onics
CompanyThesis Industry RisksValuation
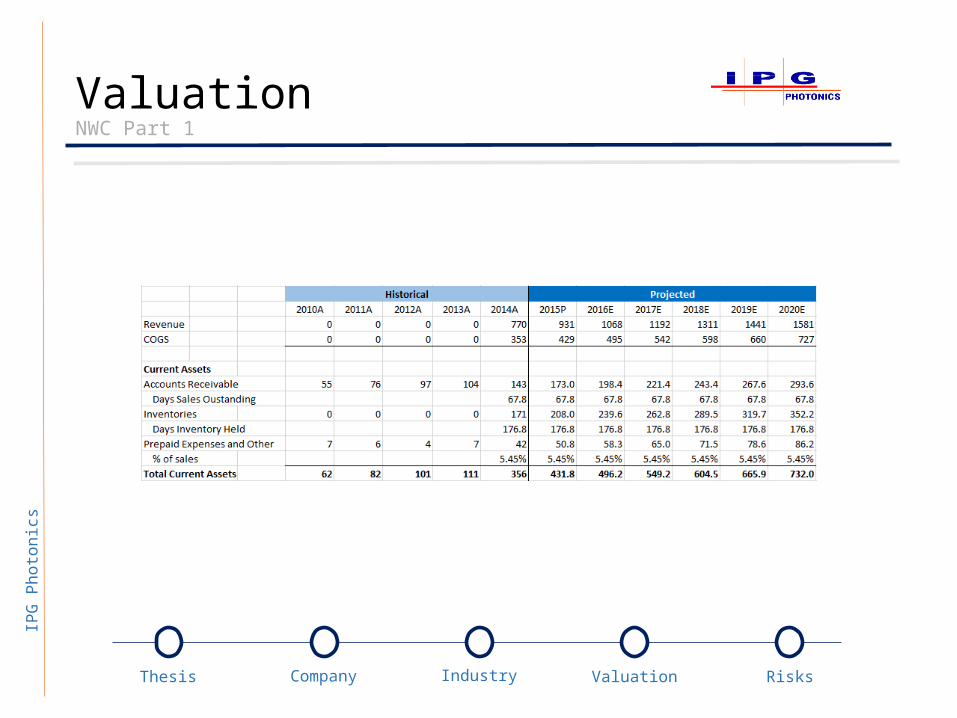
ValuationNWC Part 1
IPG
Phot
onics
CompanyThesis Industry RisksValuation
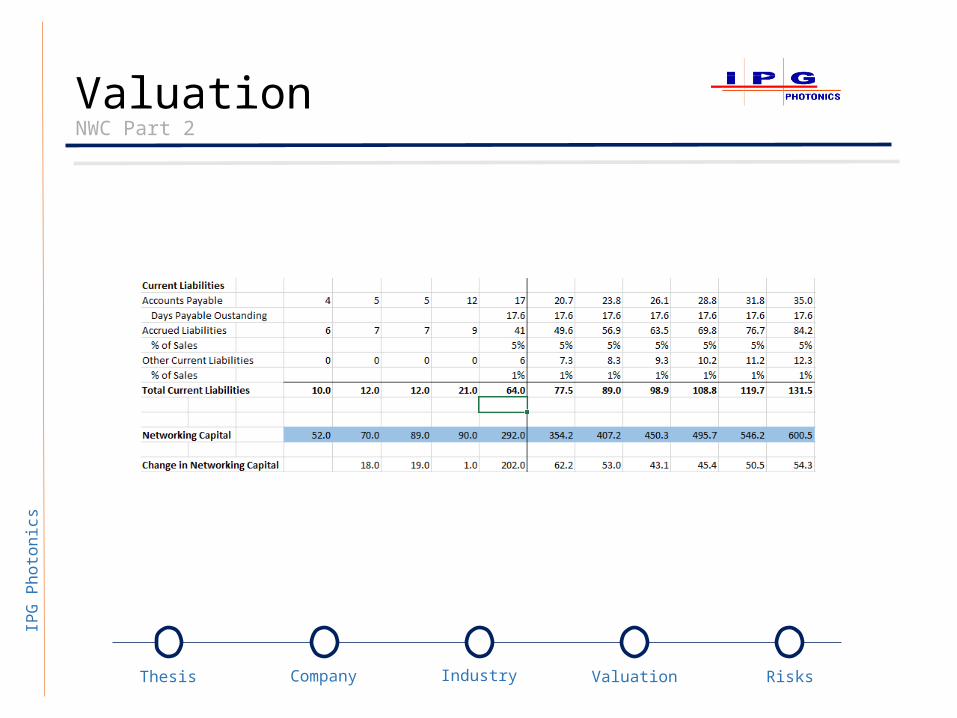
ValuationNWC Part 2
IPG
Phot
onics
CompanyThesis Industry RisksValuation
ValuationComparables
IPGP LITE COHR NEWP RSTI IIVI ESIO0
0.5
1
1.5
2
2.5
3
3.5
4 3.71
2.35
1.77 1.631.46 1.4
0.9
P/B
IPGP COHR RSTI IIVI LITE NEWP ESIO0
1
2
3
4
5
6
5.13
1.811.48 1.38
1.07 0.96 0.92
P/S

IPG
Phot
onics
CompanyThesis Industry RisksValuation
ValuationComparables
IPG
Phot
onics
CompanyThesis Industry RisksValuation
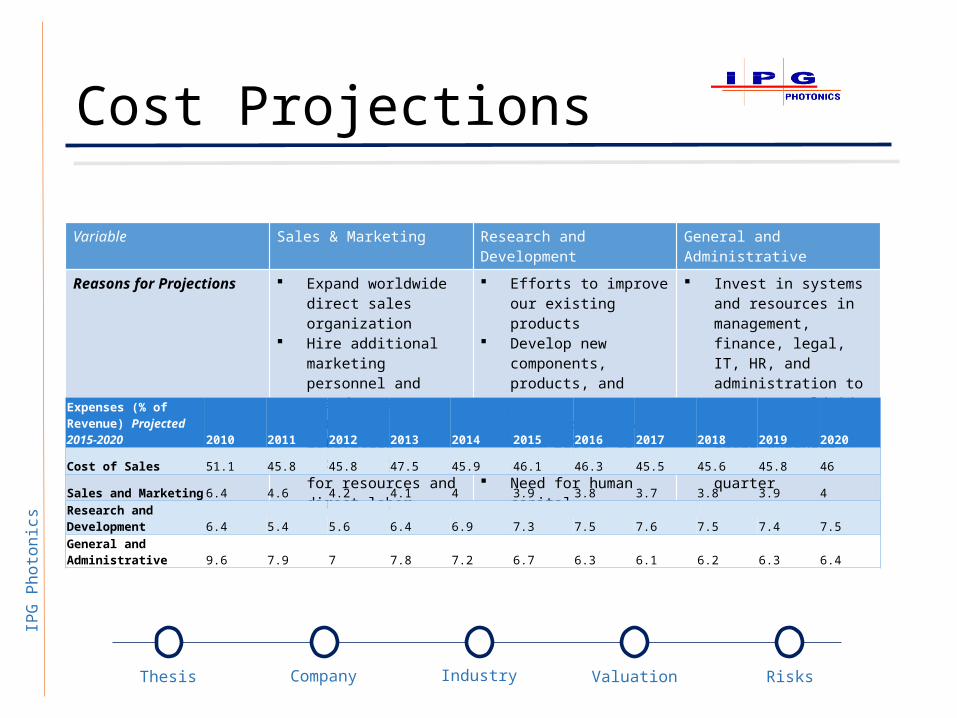
Cost ProjectionsVariable Sales & Marketing Research and Development General and Administrative
Reasons for Projections Expand worldwide direct sales organization
Hire additional marketing personnel and spend more on marketing activities
Increasing costs for resources and direct labor
Efforts to improve our existing products
Develop new components, products, and systems
Expenses may vary from period to period
Need for human capital
Invest in systems and resources in management, finance, legal, IT, HR, and administration to support worldwide operations
Legal expenses vary quarter to quarter
Expenses (% of Revenue) Projected 2015-2020 2010 2011 2012 2013 2014 2015 2016 2017 2018 2019 2020
Cost of Sales 51.1 45.8 45.8 47.5 45.9 46.1 46.3 45.5 45.6 45.8 46
Sales and Marketing 6.4 4.6 4.2 4.1 4 3.9 3.8 3.7 3.8 3.9 4
Research and Development 6.4 5.4 5.6 6.4 6.9 7.3 7.5 7.6 7.5 7.4 7.5
General and Administrative 9.6 7.9 7 7.8 7.2 6.7 6.3 6.1 6.2 6.3 6.4
IPG
Phot
onics
CompanyThesis Industry RisksValuation
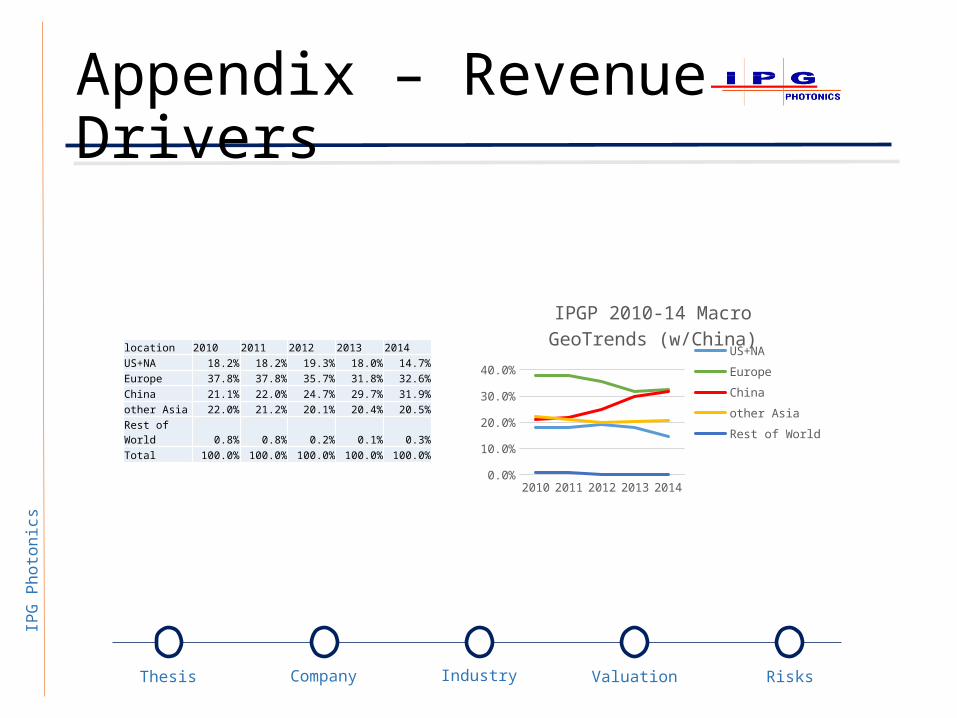
Appendix – Revenue Drivers
location 2010 2011 2012 2013 2014US+NA 18.2% 18.2% 19.3% 18.0% 14.7%Europe 37.8% 37.8% 35.7% 31.8% 32.6%China 21.1% 22.0% 24.7% 29.7% 31.9%other Asia 22.0% 21.2% 20.1% 20.4% 20.5%Rest of World 0.8% 0.8% 0.2% 0.1% 0.3%Total 100.0% 100.0% 100.0% 100.0% 100.0%
2010 2011 2012 2013 20140.0%5.0%
10.0%15.0%20.0%25.0%30.0%35.0%40.0%
IPGP 2010-14 Macro GeoTrends (w/China)
US+NAEuropeChina other AsiaRest of World
IPG
Phot
onics
CompanyThesis Industry RisksValuation
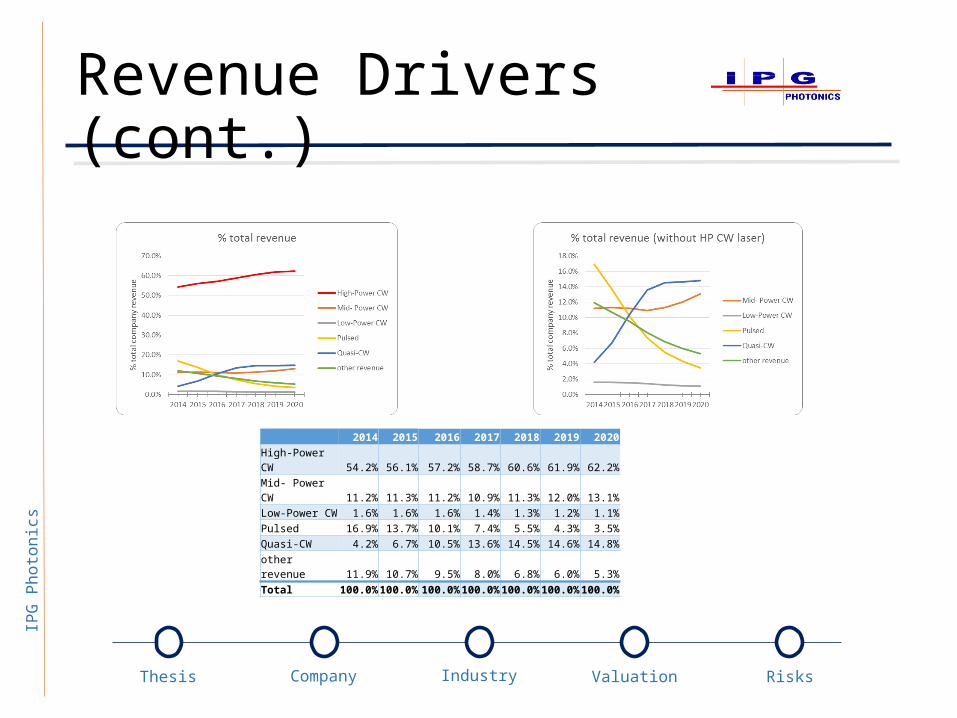
Revenue Drivers (cont.)
2014 2015 2016 2017 2018 2019 2020High-Power CW 54.2% 56.1% 57.2% 58.7% 60.6% 61.9% 62.2%Mid- Power CW 11.2% 11.3% 11.2% 10.9% 11.3% 12.0% 13.1%Low-Power CW 1.6% 1.6% 1.6% 1.4% 1.3% 1.2% 1.1%Pulsed 16.9% 13.7% 10.1% 7.4% 5.5% 4.3% 3.5%Quasi-CW 4.2% 6.7% 10.5% 13.6% 14.5% 14.6% 14.8%other revenue 11.9% 10.7% 9.5% 8.0% 6.8% 6.0% 5.3%Total 100.0% 100.0% 100.0% 100.0% 100.0% 100.0% 100.0%
IPG
Phot
onics
CompanyThesis Industry RisksValuation
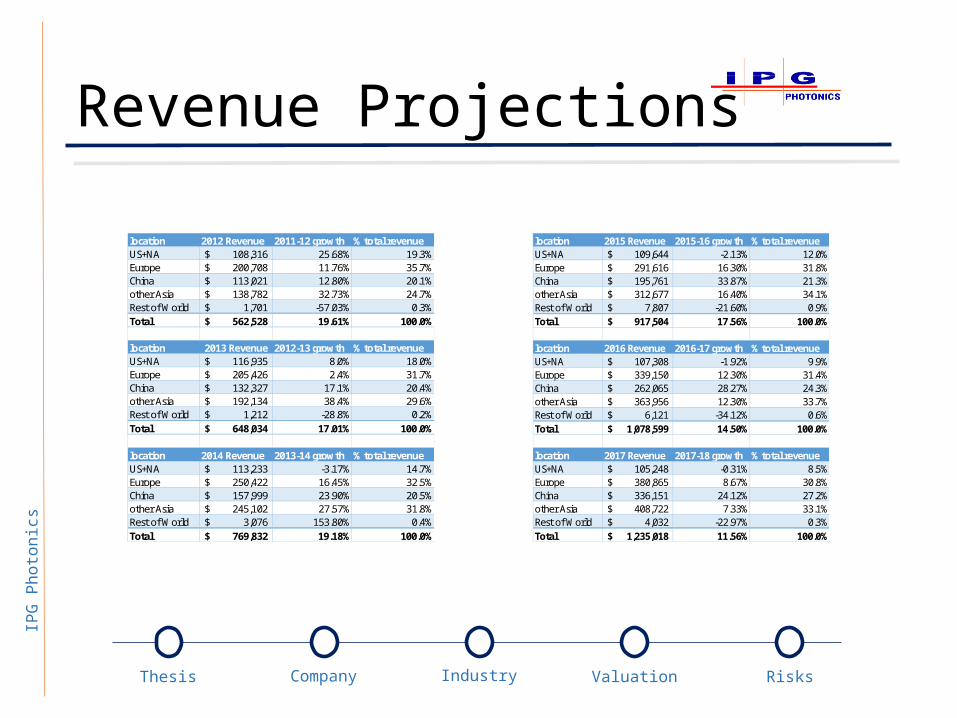
Revenue Projectionslocation 2012 Revenue 2011-12 growth % total revenueUS+NA 108,316$ 25.68% 19.3%Europe 200,708$ 11.76% 35.7%China 113,021$ 12.80% 20.1%other Asia 138,782$ 32.73% 24.7%Rest of World 1,701$ -57.03% 0.3%Total 562,528$ 19.61% 100.0%
location 2013 Revenue 2012-13 growth % total revenueUS+NA 116,935$ 8.0% 18.0%Europe 205,426$ 2.4% 31.7%China 132,327$ 17.1% 20.4%other Asia 192,134$ 38.4% 29.6%Rest of World 1,212$ -28.8% 0.2%Total 648,034$ 17.01% 100.0%
location 2014 Revenue 2013-14 growth % total revenueUS+NA 113,233$ -3.17% 14.7%Europe 250,422$ 16.45% 32.5%China 157,999$ 23.90% 20.5%other Asia 245,102$ 27.57% 31.8%Rest of World 3,076$ 153.80% 0.4%Total 769,832$ 19.18% 100.0%
location 2015 Revenue 2015-16 growth % total revenueUS+NA 109,644$ -2.13% 12.0%Europe 291,616$ 16.30% 31.8%China 195,761$ 33.87% 21.3%other Asia 312,677$ 16.40% 34.1%Rest of World 7,807$ -21.60% 0.9%Total 917,504$ 17.56% 100.0%
location 2016 Revenue 2016-17 growth % total revenueUS+NA 107,308$ -1.92% 9.9%Europe 339,150$ 12.30% 31.4%China 262,065$ 28.27% 24.3%other Asia 363,956$ 12.30% 33.7%Rest of World 6,121$ -34.12% 0.6%Total 1,078,599$ 14.50% 100.0%
location 2017 Revenue 2017-18 growth % total revenueUS+NA 105,248$ -0.31% 8.5%Europe 380,865$ 8.67% 30.8%China 336,151$ 24.12% 27.2%other Asia 408,722$ 7.33% 33.1%Rest of World 4,032$ -22.97% 0.3%Total 1,235,018$ 11.56% 100.0%

IPG
Phot
onics
CompanyThesis Industry RisksValuation
Revenue Projections (cont.)location 2018 Revenue 2018-19 growth % total revenueUS+NA 104,922$ -0.42% 7.6%Europe 413,886$ 4.36% 30.0%China 417,230$ 22.93% 30.3%other Asia 438,681$ 6.10% 31.8%Rest of World 3,106$ -7.89% 0.2%Total 1,377,826$ 10.15% 100.0%
location 2019 Revenue 2019-20 growth % total revenueUS+NA 104,481$ -0.49% 6.9%Europe 431,932$ 2.22% 28.5%China 512,901$ 20.98% 33.8%other Asia 465,441$ 5.34% 30.7%Rest of World 2,861$ -5.68% 0.2%Total 1,517,616$ 9.32% 100.0%
2020 Revenue 2020-21 growth % total revenueUS+NA 103,969$ -0.08% 6.3%Europe 441,521$ 2.05% 26.6%China 620,508$ 18.67% 37.4%other Asia 490,296$ 5.09% 29.6%Rest of World 2,698$ -3.77% 0.2%Total 1,658,991$ 9.02% 100.0%
CAGR: 13.21%
2012 562,528$ Y/Y Growth2013 648,034$ 15.20%2014 769,832$ 18.80%2015 917,504$ 19.18%2016 1,078,599$ 17.56%2017 1,235,018$ 14.50%2018 1,377,826$ 11.56%2019 1,517,616$ 10.15%2020 1,658,991$ 9.32%
Total Revenues
20112012201320142015201620172018201920202021 $-
$500,000 $1,000,000 $1,500,000 $2,000,000
Total Revenue
2012 2013 2014 2015 2016 2017 2018 2019 20200.00%
5.00%
10.00%
15.00%
20.00%
25.00%
YoY growth

IPG
Phot
onics
CompanyThesis Industry RisksValuation
Industry OverviewAcross-board growth of fiber laser market share
The technology leader and most profitable company in the
rapidly growing fiber laser market

Vote: texasusit.org/portfolioVoting opens after DCF Analysis


![STIFF RING SUBFRAME KITstiffring.com/model.pdf · 28 City 6th Gen [GM6] Front - Year 2013 up Front 8 29 City 6th Gen [GM6] Rear - Year 2013 up Rear 2 30 City SX8 3rd Gen [3A2/3A3]](https://static.documents.pub/doc/80x56/60b17914e1c3d51b4d476141/stiff-ring-subframe-28-city-6th-gen-gm6-front-year-2013-up-front-8-29-city-6th.jpg)


