33


Project Number 630W0223
DISCLAIMER
This report has been prepared by the Institute of Geological and Nuclear Sciences Limited (GNS Science) exclusively for and under contract to Hawkes Bay Regional Council. Unless otherwise agreed in writing by GNS Science, GNS Science accepts no responsibility for any use of or reliance on any contents of this report by any person other than Hawkes Bay Regional Council and shall not be liable to any person other than Hawkes Bay Regional Council, on any ground, for any loss, damage or expense arising from such use or reliance.
Use of Data:
Date that GNS Science can use associated data: October, 2016
BIBLIOGRAPHIC REFERENCE
Rissmann, C.; Lovett A. 2016. Hydrochemical analysis for the Otane Waste Water Treatment Plant, GNS Science Consultancy Report 2016/83. 32p.

Confidential 2016
GNS Science Consultancy Report 2016/83 i
CONTENTS
EXECUTIVE SUMMARY ....................................................................................................... III
1.0 INTRODUCTION ........................................................................................................ 1
2.0 BACKGROUND AND SITE SETTING ........................................................................ 2
3.0 HYDROCHEMICAL SAMPLING AND ANALYSIS ..................................................... 5
4.0 HYDROCHEMICAL ASSESSMENT ........................................................................... 5
4.1 Waste Water Treatment Plant Effluent .......................................................................... 5 4.2 Total Ammoniacal Nitrogen (TAN) and E.coli source, transformation and transport .... 9 4.3 Phosphorus Source and Transport ............................................................................... 9
5.0 INTERPRETATION .................................................................................................. 14
6.0 CONCLUSIONS ....................................................................................................... 16
7.0 RECOMMENDATIONS ............................................................................................. 17
8.0 REFERENCES ......................................................................................................... 18
FIGURES
Figure 2.1 Map showing the extent of the Papanui Catchment and location of the fourteen water quality sampling sites (Lynch et al., 2013). ...................................................................... 2
Figure 2.2 Map showing the Papanui catchment boundary, locations of wells measured for groundwater elevation, and inferred groundwater elevation and flow directions (Gordon, 2016). ............................................................................................................................... 3
Figure 3.1 Map showing the location of the Otane WWTP, water quality sampling sites, and inferred groundwater flow direction from Lynch et al. (2013) and Gordon (2016). ......................... 5
Figure 4.1 Box and whisker plots comparing the Ca, Mg, K, and Na concentrations (ppm) between WWTP effluent from sites 3686 and 3561, and concentrations in local ground- and surface- waters sampled for this project. ......................................................................... 7
Figure 4.2 Box and whisker plots comparing halide ratios, and Cl/B ratios (D) between WWTP effluent from sites 3686 and 3561 and those of local ground and surface waters sampled for this project............................................................................................................................... 8
Figure 4.3 Box and whisker plots comparing TAN and SRP concentrations (ppm) between WWTP effluent from sites 3686 and 3561 and concentrations in local ground- and surface- waters sampled for this project. GV’s are shown and SRP represented by a log scale. ............. 8
Figure 4.4 A) and B): Binary plots of Mg and Ca versus Na/K ratio displays the relationship between the low Mg, Ca, and Na/K ratios of WWTP effluent and local ground- and surface- waters. ....................................................................................................................................... 11
Figure 4.5 Binary plots of halide normalised SRP concentrations versus Ca and Mg concentrations. ............................................................................................................... 12
Figure 5.1 Map showing the effluent contaminant drain pathway, possible extent of the WWTP plume an containing WWTP derived P, inferred groundwater flow direction (Lynch et al., 2013; Gordon, 2016), and a potential piezometer transect line for further investigation of the plume.............................................................................................................................. 15

Confidential 2016
GNS Science Consultancy Report 2016/83 ii
TABLES
Table 2.1 Summary of water quality results from sampling on Te Aute Drain/Kaikora Stream, adapted from Lynch et al. (2013). .................................................................................... 4
Table 4.2 Statistical Summary of hydrochemisry from both Te Aute Drain/Kaikora Stream sites. . 13
APPENDICES
APPENDIX 1: METHODOLOGY .......................................................................................... 22
A1.1 Redox Assignment ...................................................................................................... 22 A1.2 Mineral Saturation Indices ........................................................................................... 22 A1.3 Additional Halide references ....................................................................................... 23 A1.4 Additional Phosphate Transport references ................................................................ 24 A1.5 Ammonia and Nitrate Dynamics references ................................................................ 24
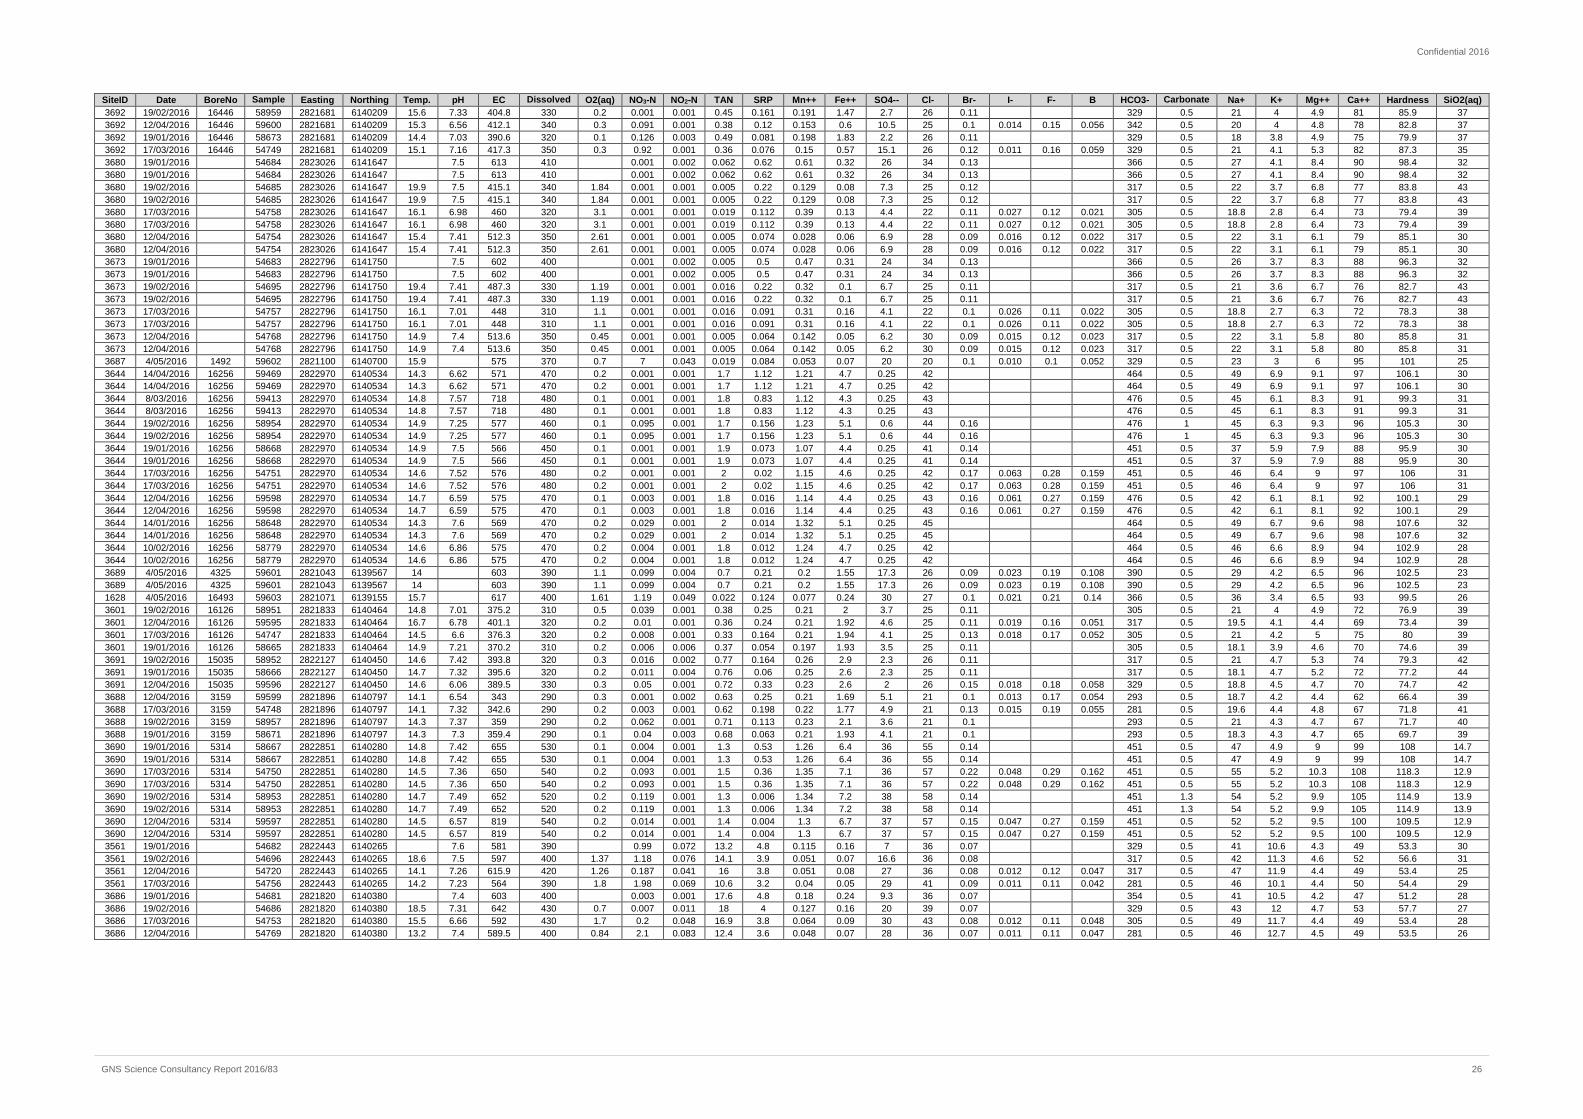
APPENDIX 2: FULL DATASET ........................................................................................... 25
APPENDIX TABLES
Table A 1.1: Redox category and dominant redox process for groundwater and surface water as determined from measured concentrations of water quality parameters (after Jurgens et al., 2009) ........................................................................................................................ 22

Confidential 2016
GNS Science Consultancy Report 2016/83 iii
EXECUTIVE SUMMARY
Central Hawke’s Bay District Council currently hold consent to discharge treated wastewater from the Otane Waste Water Treatment Plant (WWTP) to an un-named farm drain. During dry periods, the treated wastewater infiltrates to groundwater and the drain conducting the effluent to the Te Aute Drain/Kaikora Stream runs dry. The infiltration of effluent to groundwater poses a risk to groundwater and connected surface water bodies. The degree of impact of effluent on local aquifers is dependent on a number of physical and chemical processes that occur during infiltration of the effluent and once within the local aquifer. Hawke’s Bay Regional Council (HBRC) contracted GNS Science to conduct a hydrochemical analysis of surface- and ground- water quality datasets to determine the impact of treated effluent disposal on the hydrological system. In this report, the results of the hydrochemical analysis and recommendations for further work are provided.
A hydrochemical assessment of ground- and surface- (drain) waters in the vicinity and down gradient of the Drumpeel Rd drain indicated that the discharge of WWTP effluent is an important source of phosphorous to some local ground- and surface- waters. Impacted bores contained more than ten times, and unimpacted sites contained more than three times, the 0.015 mg/L soluble reactive phosphorous (SRP) level set by the HBRC for lowland streams within the Tukituki River Catchment. Despite evidence of local enrichment in phosphorous derived from WWTP effluent, the concentrations of SRP in local groundwaters were still 33 times lower than that of sampled WWTP effluent. This indicates a large proportion of phosphorous is likely to be retained within soil and subsurface materials. A portion of the WWTP impacted groundwater appears to discharge to the Te Aute Drain/Kaikora Stream. However, the lateral extent of the active WWTP plume is poorly defined. Elevated SRP concentrations at both Te Aute Drain/Kaikora Stream sites may also be partially derived from sources up-gradient of the WWTP. The relative contribution from WWTP effluent to the SRP concentration in stream is difficult to assess without a representative sample of the Te Aute Drain/Kaikora Stream waters from up gradient of the WWTP influence. Up gradient sources of phosphorous likely include both natural (lithological and organic) and land use derived sources.
It is suggested that the existence of a shallow unsaturated zone subject to significant water table fluctuations, reducing soils, and locally reducing aquifers favours higher phosphorous mobility than what occurs in areas where the unsaturated zone is much deeper and not subjected to frequent redox excursions associated with fluctuating water tables. The possibility of a legacy plume of phosphorous-rich water associated with an older discharge at or around the current Otane WWTP is raised, albeit tentatively. The impact of WWTP derived total ammoniacal nitrogen, nitrate and nitrite on local waters is minimal due to natural attenuation processes occurring in the unsaturated zone and shallow aquifer. Similarly, WWTP derived E.Coli did not appear to impact on local waters over the sampling period due to effective physical exclusion by the unsaturated zone matrix.
Due to a lack of monitoring bores the exact lateral extent of the phosphorous-rich plume was unable to be defined; and the varying source of phosphorous and the contribution from pastoral and/or natural sources is poorly defined for the Te Aute Drain/Kaikora Stream. Increased resolution of phosphorous sources in the local system and an understanding of the extend of the WWTP plume and its impact on local surface- and ground- waters may be derived from: installation of shallow monitoring bores; completing higher density longitudinal sampling of Te Aute Drain/Kaikora Stream; and further examination of the source and fate of phosphorous in the Papanui Catchment.

Confidential 2016
GNS Science Consultancy Report 2016/83 1
1.0 INTRODUCTION
The Otane Waste Water Treatment Plant (WWTP) is located at the end of Lawrence Street on the northern edge of Otane, Central Hawke’s Bay, and is operated by Central Hawke’s Bay District Council (CHBDC). CHBDC is currently applying to renew their existing resource consents with Hawke’s Bay Regional Council (HBRC). The Otane WWTP consent includes provision to discharge treated wastewater to water and to land where it may enter water, in an intermittently flowing un-named farm drain that discharges to Te Aute Drain/Kaikora Stream, a tributary of the Papanui Stream. During dry periods, the treated wastewater entering the drain infiltrates to groundwater and the drain conducting the effluent to the Te Aute Drain/Kaikora Stream runs dry.
The infiltration of effluent from the Otane WWTP to groundwater through the reticulation (open drains) network poses a risk to groundwater and connected surface water bodies. The degree of impact of effluent on local aquifers is however dependent on a number of physical and chemical processes that occur during infiltration of the effluent and once within the local aquifer. Some of these processes include retention by ion exchange, chemisorption, disassociation reactions and redox reactions, among others.
Accordingly, the degree to which chemical and physical reactions attenuate the concentration of contaminants within any effluent is dependent upon the local setting, specifically, the particular combination of soils, geology and hydrology. It is also important to be aware of the range of possible sources of nutrient (nitrogen and phosphorous) species. Within the area of interest this includes losses from intensive land use, natural sources associated with the local geology and aquifer characteristics and WWTP effluent. It is therefore important to discriminate between the various sources.
HBRC contracted GNS Science to conduct a hydrochemical analysis of surface- and ground- water quality datasets to determine the impact of treated effluent disposal on the hydrological system. This work involved the application of specialised techniques to assess the impact of WWTP effluent on the local aquifer systems and connected water bodies. In this report, the results of the hydrochemical analysis and recommendations for further work are provided.

Confidential 2016
GNS Science Consultancy Report 2016/83 2
2.0 BACKGROUND AND SITE SETTING
The Papanui Catchment covers an area of approximately 16,400 ha and is one of 16 sub-catchments of the main Tukituki River Catchment (Figure 2.1). The township of Otane (and the WWTP) is located at the centre of the Papanui Catchment (Lynch et al., 2013), and all sites sampled by HBRC as part of this project are located within the Papanui Catchment. The Papanui Catchment is a significant source of phosphorous to the Tukituki River, however, phosphorous sources in the catchment are poorly understood (Lynch et al., 2013). A study completed in June 2012 indicated ‘hot spot’ sources of phosphorous in the catchment, and trends indicated that the concentration of phosphorous was increasing over time (Lynch et al., 2013).
Figure 2.1 Map showing the extent of the Papanui Catchment and location of the fourteen water quality sampling sites (Lynch et al., 2013). Sites 3, 1, 2, and 12 are of particular interest as they are located on Kaikora Stream or Te Aute Drain/Kaikora Stream.
Surface geology of the study site primarily consists of quaternary deposits. The plains area south of Drumpeel Road is composed of late quaternary deposits, with moderately weathered, undifferentiated, poorly-sorted loess-covered alluvial gravels, and fluvial deposits from previous courses of the Waipawa River. The plains area to the north of Drumpeel Road is composed of poorly sorted alluvial gravel, sand and soft, dark brown to black organic swamp mud, muddy peat and woody peat with minor overbank sand, silt and mud (Lee, 2011). The study area is generally overlain with Otane Group soils, which are characterised as light with good natural fertility (Lynch et al., 2013). The Otane soils that are formed on river deposited sediments are slightly acidic, well supplied with lime, and low in phosphate (Lynch et al., 2013). Land use in the study area is a combination of arable and sheep/beef.

Confidential 2016
GNS Science Consultancy Report 2016/83 3
Previous hydrogeological studies in the area including assessments of groundwater chemistry (Ludecke, 1988) and hydraulic properties (Luba, 1999) are summarised in Larking (2004), and an environmental characterisation of the Papanui Catchment has been completed by Lynch et al. (2013). Groundwater resources occur in most geological formations in the Papanui Catchment, with the most productive aquifer being associated with Quaternary gravels. These sediments underlie the Waipawa and Papanui rivers, and range from depths of 30 m in the middle of the catchment to 50 m deep in the southern catchment. In the study area near Otane, the aquifer system appears to pinch out and grade into swampy deposits. General flow of groundwater within the aquifer has been interpreted to follow the topographic gradient (e.g., from the south-west to the north-east of the catchment) within paleo-channel sediment of the Waipawa River (Figure 2.2).
Figure 2.2 Map showing the Papanui catchment boundary, locations of wells measured for groundwater elevation, and inferred groundwater elevation and flow directions (Gordon, 2016).
There is a poor understanding of groundwater quality in the Papanui Basin, and current knowledge is primarily based on minimal information from a small number of historic monitoring bores. Limited water quality sampling was completed during the period 1997 – 2003. Results indicated that bores 3198 and 2860 had elevated faecal coliform concentrations, and that bores 2718 and 4617 had elevated levels of nitrate-nitrogen (NO3-N) (Lynch et al., 2013). However, the location of these bores was not provided in the report. Groundwater level information was available from bore 5006, located near the study site on Drumpeel Road.

Confidential 2016
GNS Science Consultancy Report 2016/83 4
Groundwater levels were interpreted to represent a confined gravel aquifer, and displayed a seasonal pattern with higher levels in the winter (c. 0.5 m BGL), and lower levels in the summer (c. 2.5 m BGL) (Lynch et al., 2013).
The upper reach of the Kaikora Stream drains hills to the west of Otane and is characterised by a small gravel bed system with clear water and some macrophyte growth (Lynch et al., 2013). The reach downstream of Otane becomes channelised and flows to the north then to the east until it confluences with Papanui Stream. The reach between Otane and the Papanui Stream confluence is commonly called Te Aute Drain, and for the purposes of this project is named Te Aute Drain/Kaikora Stream. In 2012, fourteen water quality sites in the Papanui Stream catchment were selected for intensive sampling, including four sites on Te Aute Drain/Kaikora Stream (Lynch et al., 2013; Figure 2.1). These sites were located at approximately 2 km intervals, from the upstream site at Kaikora Stream and Broomeknow Farm (Site 1); to Kaikora Stream at Drumpeel Road (Site 3), Kaikora Stream at Kahotea Station (Site 2), and Kaikora Stream upstream of Papanui Stream (Site 12) (Lynch et al., 2013; Figure 2.1).
Overall results of the Papanui Stream catchment water quality sampling indicated nutrient concentrations (e.g., soluble reactive phosphorous (SRP), total phosphorous (TP), NO3-N, and total nitrogen (TN)) concentrations were relatively high. The Australian and New Zealand Environment and Conservation Council (ANZECC, 2000) trigger level for TP concentration in lowland streams of 0.033 mg/L was exceeded at thirteen of the fourteen sites. In addition, the Regional Resource Management Plan (HBRC, 2006) guideline value for SRP in lowland streams of 0.015 mg/L was exceeded at all fourteen sites (Lynch et al., 2013). In particular, results indicated that there was a considerable increase in SRP and TP concentrations in Te Aute Drain/Kaikora Stream between Drumpeel Road and Kahotea Station. Within this reach, SRP concentration increased by 0.048 mg/L (100%), and TP concentration increased by 0.063 mg/L (103%) (Lynch et al., 2013). When compared to the ANZECC (2000) and Regional Resource Management Plan (HBRC, 2006) trigger values of 0.033 mg/L and 0.015 mg/L respectively, these increases were considered to be substantial (Lynch et al., 2013). In addition, all of the sampling sites were near or above the ANZECC trigger value of 0.614 mg/L for TN concentration in lowland rivers. Between Site 1 and Site 2 (Table 2.1) in the Te Aute Drain/Kaikora Stream, NO3-N concentration increased by 0.34 mg/L (454%), and TN concentration increased by 2.08 mg/L (400%).
Table 2.1 Summary of water quality results from sampling on Te Aute Drain/Kaikora Stream, adapted from Lynch et al. (2013). Locations of sampling sites are provided in Figure 2.1 (Lynch et al., 2013).
Site (site number) Flow (m3/s)
SRP load (g/day)
TP load (g/day)
NO3-N load (g/day)
TN load (g/day)
Kaikora Stream and Broomeknow Farm (1) 0.025* 95 114 328 1,793 Kaikora Stream at Drumpeel Road (3) 0.045* 187 237 288 2,022 Kaikora Stream at Kahotea Station (2) 0.55* 456 589 1,948 12,355 Kaikora Stream u/s of Papanui Stream (12) 0.14 1,008 1,572 7,441 31,202
* Flow was visually estimated.
Raw and summarised water quality datasets were not supplied in Lynch et al. (2013) in a useable format (e.g., only in graph form); however, calculated instantaneous nutrient loads for the sampling sites were provided (Table 2.1). These results further indicate a considerable increase in SRP, TP, NO3-N, and TN in Te Aute Drain/Kaikora Stream (in a downstream direction), even when the compounding effects of increased flow were considered.

Confidential 2016
GNS Science Consultancy Report 2016/83 5
3.0 HYDROCHEMICAL SAMPLING AND ANALYSIS
For the purposes of this project, HBRC arranged for the collection and analysis of water quality samples from nine bores and four surface water sites located down-gradient from the Otane WWTP discharge (Figure 3.1). Water quality datasets were provided by HBRC at the conclusion of sampling (Gordon, 2016). These datasets were then formatted and an analysis of the hydrochemical and water quality data was undertaken. Analysis included calculation of halide ratios, major ion ratios, mineral saturation indices, and redox assignments. Additional technical detail on these methods is provided in Appendix 1.
Figure 3.1 Map showing the location of the Otane WWTP, water quality sampling sites, and inferred groundwater flow direction from Lynch et al. (2013) and Gordon (2016).
4.0 HYDROCHEMICAL ASSESSMENT
4.1 WASTE WATER TREATMENT PLANT EFFLUENT
WWTP effluent sampled from the drain adjacent to Drumpeel Rd (sites 3686 and 3561) was characterised by elevated Cl/Br, Cl/I, and Cl/B ratios, anomalous potassium (K), total ammoniacal nitrogen (TAN), and SRP; yet low calcium (Ca) and magnesium (Mg) concentrations relative to local ground- and surface- waters (Figure 4.1 to Figure 4.3; Table 4.1). SRP from the WWTP effluent (median of 3.9 mg/L) is 257 times the Regional Resource Management Plan (HBRC, 2006) guideline value for SRP in lowland streams of 0.015 mg/L. TAN concentration is also elevated (median 15.1 mg/L). The ratio of conservative tracers (halides and boron (B)) are also anomalously elevated and form the basis for tracing WWTP inputs to the local groundwater system and associated streams (e.g., Te Aute Drain/Kaikora Stream). Halide ratios and conservative tracers such as B are widely used to assess contaminant source (Appendix 1). Differences in the major cations noted above, halide and Cl/B and both SRP and TAN are all statistically significance at the 95% level based on application of the non-parametric Wilcoxon–Mann–Whitney test.

Confidential 2016
GNS Science Consultancy Report 2016/83 6
Table 4.1 Summary statistics of WWTP effluent and local ground- and surface- waters. Concentration units are in parts per million (ppm), and Electrical Conductivity (EC) is in µs/cm.
WWTP effluent pH EC DO NO3-N NO2-N TAN SRP Na+ K+ Mg++ Ca++
Valid Cases 8 8 6 8 8 8 8 8 8 8 8
Mean 7.3 598.1 1.3 0.8 0.050 14.85 3.99 44.4 11.4 4.4 49.8
Median 7.4 594.5 1.3 0.6 0.059 15.05 3.85 44.5 11.5 4.4 49.0
Standard Deviation 0.3 23.4 0.4 0.9 0.031 2.68 0.56 3.0 0.9 0.2 1.9
Geometric Mean 7.3 597.7 1.2 0.2 0.030 14.63 3.95 44.3 11.3 4.4 49.7
Coefficient of Variation 0.0 0.0 0.3 1.0 0.613 0.18 0.14 0.1 0.1 0.0 0.0
Minimum 6.7 564.0 0.7 0.0 0.001 10.60 3.20 41.0 10.1 4.2 47.0
Maximum 7.6 642.0 1.8 2.1 0.083 18.00 4.80 49.0 12.7 4.7 53.0
Range 0.9 78.0 1.1 2.1 0.082 7.40 1.60 8.0 2.6 0.5 6.0
Local ground- and surface- waters pH EC DO NO3-N NO2-N TAN SRP Na+ K+ Mg++ Ca++
Valid Cases 55 59 55 59 59 59 59 59 59 59 59
Mean 7.2 529.4 0.6 0.2 0.003 0.85 0.22 32.2 4.7 7.2 85.7
Median 7.4 569.0 0.2 0.0 0.001 0.70 0.12 26.0 4.3 6.8 88.0
Standard Deviation 0.4 116.6 0.8 0.9 0.008 0.75 0.26 13.3 1.2 1.9 12.2
Geometric Mean 7.2 516.7 0.3 0.0 0.001 0.26 0.10 29.7 4.5 7.0 84.9
Coefficient of Variation 0.1 0.2 1.3 5.2 2.801 0.88 1.19 0.4 0.3 0.3 0.1
Minimum 6.1 342.6 0.1 0.0 0.001 0.01 0.00 18.0 2.7 4.4 62.0
Maximum 7.6 819.0 3.1 7.0 0.049 2.00 1.12 55.0 6.9 10.3 108.0
Range 1.5 476.4 3.0 7.0 0.048 2.00 1.12 37.0 4.2 5.9 46.0
WWTP effluent Cl/Br Cl/I Cl/F Cl/B Na/K Ca/K SRP/Cl SRP/Br SRP/I SRP/F SRP/B
Valid Cases 8 4 4 4 8 8 8 8 4 4 4
Mean 499.1 42463 348 851 3.9 4.4 0.11 53.1 312.0 32.0 78.2
Median 514.3 43103 350 831 3.9 4.4 0.10 50.1 317.6 32.2 77.9
Standard Deviation 41.8 3393 42 104 0.3 0.3 0.02 11.3 14.3 2.3 2.2
Geometric Mean 497.6 42359 346 846 3.9 4.4 0.10 52.1 311.8 31.9 78.2
Coefficient of Variation 0.08 0.08 0.12 0.12 0.08 0.08 0.18 0.21 0.05 0.07 0.03
Minimum 450.0 38136 300 766 3.6 3.9 0.08 35.6 290.9 29.1 76.2
Maximum 557.1 45512 391 976 4.6 5.0 0.13 68.6 322.0 34.5 80.9
Range 107.1 7376 91 210 1.0 1.1 0.06 33.0 31.1 5.5 4.7
Local ground- and surface waters Cl/Br Cl/I Cl/F Cl/B Na/K Ca/K SRP/Cl SRP/Br SRP/I SRP/F SRP/B
Valid Cases 51 27 27 27 59 59 59 51 27 27 27
Mean 262.7 11621 177 588 6.8 19.4 0.01 1.4 6.3 0.8 2.5
Median 250.0 10743 167 389 7.0 19.5 0.00 1.0 4.6 0.8 2.2
Standard Deviation 61.8 5997 39 390 1.8 4.4 0.01 1.2 5.2 0.5 1.8
Geometric Mean 256.2 10099 173 485 6.6 18.9 0.00 0.8 3.2 0.4 1.3
Coefficient of Variation 0.24 0.52 0.22 0.66 0.26 0.23 0.98 0.85 0.82 0.66 0.72
Minimum 161.5 3922 111 193 3.9 14.1 0.00 0.0 0.1 0.0 0.0
Maximum 414.3 22371 250 1304 10.6 31.7 0.03 4.8 19.2 1.8 5.7
Range 252.7 18450 139 1111 6.7 17.6 0.03 4.7 19.1 1.8 5.7

Confidential 2016
GNS Science Consultancy Report 2016/83 7
Figure 4.1 Box and whisker plots comparing the Ca, Mg, K, and Na concentrations (ppm) between WWTP effluent from sites 3686 and 3561, and concentrations in local ground- and surface- waters sampled for this project. Medians are the black horizontal line and whiskers extend to the 95% confidence interval. It is readily apparent that Ca and Mg are much lower in the WWTP effluent and K is much higher than local ground and surface waters. Na shows some overlap but has a higher median concentration for the WWTP effluent relative to local ground- and surface- waters.

Confidential 2016
GNS Science Consultancy Report 2016/83 8
Figure 4.2 Box and whisker plots comparing halide ratios, and Cl/B ratios (D) between WWTP effluent from sites 3686 and 3561 and those of local ground and surface waters sampled for this project. Halide and Cl/B ratios are elevated in WWTP effluent relative to local ground- and surface- waters.
Figure 4.3 Box and whisker plots comparing TAN and SRP concentrations (ppm) between WWTP effluent from sites 3686 and 3561 and concentrations in local ground- and surface- waters sampled for this project. GV’s are shown and SRP represented by a log scale. NO3-N (not shown here) is negligible and shows little difference in concentration between WWTP effluent and local ground- and surface- waters.

Confidential 2016
GNS Science Consultancy Report 2016/83 9
4.2 TOTAL AMMONIACAL NITROGEN (TAN) AND E.COLI SOURCE, TRANSFORMATION AND TRANSPORT
TAN concentrations in the WWTP effluent are high (median = 15.05 mg/L) relative to local ground- and surface- waters (median = 0.7 mg/L). However, TAN concentrations in the Te Aute drain/Kaikora Stream are low (median = 0.0105 mg/L, NH3-N) as are NO3-N concentrations (median = 0.0010 mg/L, NO3-N) indicating little transfer of TAN, ammonium or NO3-N from groundwater contaminated with WWTP effluent.
The attenuation of TAN concentrations from WWTP discharge is likely due to significant aerobic and or anaerobic oxidation of ammonium to nitrate within the unsaturated zone underlying the drain or in the shallow aquifer (Desimone et al., 1998; Buss et al., 2004; Böhlke et al., 2006; Moore et al., 2011). At the circumneutral pH of local sub-soils and unsaturated zone materials, ammonia is likely ionised to ammonium which is positively charged and retained by negatively charged surfaces within the unsaturated zone. Retention is followed by the oxidation of ammonium to oxidisable nitrogen within the unsaturated zone by bacteria which use O2 or potentially MnIV as electron acceptors (Buss et al., 2004; Moore et al., 2011). Significant unsaturated zone oxidation of WWTP derived ammonia is a common feature of some land based disposal systems (Buss et al., 2004 and references therein) and can lead to the decoupling of TAN and dissolved P species where receiving waters are reducing. In summary, WWTP TAN is firstly ionised to ammonium followed by nitrification and leaching of nitrate and nitrite into locally reduced groundwaters. Oxidisable nitrogen is then rapidly denitrified. Fluctuating water tables are known to play an important role in the above process (Burt et al., 2002; Hefting et al., 2004).
Elevated E.coli (> 100 cfu/ml) counts are primarily associated with surface water sites and waste water reticulation drains. Of the two groundwater sites with detectable E.Coli one was associated with a WWTP impacted site (bore, 3692) the other an unimpacted site (bore, 3690). Elevated E.coli in surface waters but not in groundwaters is commonly caused by poor well head protection being the primary reason for E.Coli contamination of groundwater. In most instances E.Coli is effectively removed by unsaturated zone and or saturated zone filtration. The low E.coli counts found in impacted groundwaters are up-gradient of the Te Aute/Kaikora Stream, and the fact that the drain was not discharging to the stream over the sampling period, indicates elevated E.coli in the stream is unlikely to be derived from groundwater contaminated with WWTP effluent. All groundwater samples were assessed against the New Zealand Drinking Water Standards Guideline Values (GV’s) (Ministry of Health, 2008). This assessment indicated that the only exceedances (other than one E.Coli impacted bore) were aesthetic in nature due to elevated MnII and Ca + Mg, which are typical of reduced groundwaters in areas of carbonate or alkali parent materials (see Gordon, 2016).
4.3 PHOSPHORUS SOURCE AND TRANSPORT
Unlike TAN and E.Coli, WWTP derived SRP appears to locally impact ground- and surface- waters. Unlike, TAN, P is not subject to assimilation by reduction. However, P is normally poorly mobile due to a high affinity for exchange sites associated with clay minerals (both structured and poorly ordered). Absorption is a two stage process, firstly electrostatic attraction followed by a slower process of chemisorption (bond formation) between the P molecule/ion and exchange sites. Normally, there is more than enough sorptive capacity to retain P within

Confidential 2016
GNS Science Consultancy Report 2016/83 10
the soil or unsaturated zone. However, when P loads are high, as with WWTP effluent and application occurs over an extended period, the sorptive capacity can be locally overwhelmed (Robertson et al., 1998; Siemens et al., 2004; Hu et al., 2005; Spiteri et al., 2007; Heredia et al., 2007; Leader et al., 2008). The latter is more common in areas of shallow water table and for areas with reducing soils or aquifers which tend to have a lower mass of highly sorptive Fe and Mn oxides and oxy-hydroxides (Villapando and Graetz, 2001; Leader et al., 2008; Obour et al., 2011; Domagalski and Johnson, 2012). Accordingly, over time, a large concentration gradient develops between sorption sites and the local pore waters driving an increase in P concentrations in solution. Soluble P then migrates in solution to down-gradient sites with available sorptive capacity. Over a period of time much of the sorptive capacity in an area down gradient of a WWTP loading area is overwhelmed and a P plume may extend through the unsaturated zone and into the shallow aquifer and down gradient to any hydrologically connected surface water (Holman et al., 2008; Domagalski and Johnson, 2012).
Binary plots of halide and B normalised SRP concentrations versus Ca and Mg concentrations are displayed in Figure 4.4 and Figure 4.5. These plots indicate varying degrees of mixing and dilution between P-enriched WWTP effluent and both local ground- and surface- waters (e.g., Te Aute/Kaikora Stream). Of the sites sampled, site 3690 (bore, 63.0 m BGL; screen 9.03 – 10.33 m BGL) and site 3644 (bore, 9.37 m BGL; screen 7.17 – 9.6 m BGL) located to the east of the Drumpeel Road farm drain are compositionally distinct from the WWTP effluent signature, with little to no signatures of WWTP contamination (i.e., normalised SRP or halide ratios). Both these sites have low median SRP concentrations of 0.006 mg/L and 0.015 mg/L respectively1. Accordingly, for the purposes of this study both of these sites constitute a local hydrochemical ‘end member’, being most consistent with what is expected of local groundwaters that are unimpacted by WWTP effluent.
1However, of the seven replicate samples for site 3690, SRP ranges between the lower detection limit of 0.004 mg/L to as high as 0.53 mg/L on one sampling occasion. Assuming the SRP measures are correct, the variation in SRP often occurs in response to local water table fluctuations that drive associated changes in redox conditions that govern P solubility (Villapondo and Gratez, 2001; Niedermeier and Robinson, 2009; Obour et al., 2011). It is noted that the majority of sites including both Te Aute Drain/Kaikora Stream sites show considerable fluctuation in SRP concentrations.

Confidential 2016
GNS Science Consultancy Report 2016/83 11
Figure 4.4 A) and B): Binary plots of Mg and Ca versus Na/K ratio displays the relationship between the low Mg, Ca, and Na/K ratios of WWTP effluent and local ground- and surface- waters. There is some evidence for a mixing trend between WWTP and local ground- and surface- waters although the degree of WWTP influence declines towards the NE quadrants of each figure. C) to F): Binary plots of Br and B normalised SRP concentrations versus Ca and Mg concentrations. Normalised SRP values suggest significant WWTP mixing with local groundwaters of sites 3692, 3601, 3691 and 3688. Where: ‘local end member’ refers to the unimpacted groundwaters sites 3690 and 3644 that for the purposes of this study constitute natural background.

Confidential 2016
GNS Science Consultancy Report 2016/83 12
Groundwater sites 3692, 3601, 3688 and 3691 are of broadly similar composition to the WWTP group albeit variably diluted (Figure 4.4 and Figure 4.5). These sites appear most impacted by WWTP effluent as is consistent with their immediate proximity down gradient of the Drumpeel Road Drain (Figure 3.1). The median SRP concentrations for these four sites is 0.161 mg/L or c. 3.5 times the median of the local background of 0.047 mg/L based on unimpacted sites 3690 and 36442. Impacted bores are 10.7 times and unimpacted 3.1 times the 0.015 mg/L SRP level set by the HBRC for lowland streams.
Figure 4.5 Binary plots of halide normalised SRP concentrations versus Ca and Mg concentrations. Again, varying degrees of mixing and dilution is evident between WWTP effluent and local ground and surface waters. Where: ‘local end member’ refers to the unimpacted groundwaters sites 3690 and 3644 that for the purposes of this study constitute natural background.
Both of the Te Aute/Kaikora Stream sites show a degree of WWTP impact in Figure 4.4 and Figure 4.5. However, they show a greater degree of dilution with local background waters relative to contaminated groundwaters (sites 3692, 3601, 3688, and 369). A higher degree of dilution is consistent with the larger drainage area associated with pastoral land use that occurs up gradient of the sampling sites. Importantly, the hydrochemical metrics for upstream (site
2 For reference, sites 3601 (bore of unknown depth) and 3691 (bore of unknown depth) both contain median SRP
concentrations that are 10.9 and 13.5 times the HBRC guideline value of 0.015 mg/L for lowland streams.

Confidential 2016
GNS Science Consultancy Report 2016/83 13
3673) and downstream (site 3680) of the WWTP drain confluence do not vary significantly. The similarity of WWTP effluent indicators is consistent with a diffuse groundwater plume that is not restricted to the vicinity of the farm drain. The flaring or broadening of a contaminant plume from its source (i.e., Drumpeel Road Drain) is typical of advection and dispersion processes within aquifers. The longitudinal distance between the two sites was small and the drain was not discharging to the Te Aute Drain/Kaikora Stream during the sampling period.
Overall, SRP for both Te Aute/Kaikora Stream sites is 10.9 times the HBRC guideline value of 0.015 mg/L for lowland streams. However, the relative contribution from WWTP to the SRP concentration in stream is difficult to assess without a representative sample of the Te Aute Drain /Kaikora Stream waters from up gradient of the WWTP influence. Up gradient samples of Te Aute Drain/Kaikora Stream samples are important given the possibility that a proportion of the P within the stream is derived from sources associated with intensive land use.
Table 4.2 Statistical Summary of hydrochemisry from both Te Aute Drain/Kaikora Stream sites.
The groundwater sampling sites 1628 (bore, 3 m BGL) and 3689 (bore, 65 m BGL; screen 2.01 – 65.0 m BGL) occur adjacent to, and down gradient of the Otane WWTP but up gradient of the Drumpeel Road drain which is the current site of effluent disposal. Hydrochemical signatures for both sites suggest some minor influence from WWTP effluent perhaps reflecting a legacy signature that developed prior to reticulation and or lining of the effluent pond. A similar assessment is made for groundwaters from site 3687 that lies to the NE of the Drumpeel Road Drain but down gradient of the Otane Plant3. The possibility of a legacy WWTP is consistent the persistence of P plumes in groundwater systems for many decades after a P-rich effluent source has been curtailed or relocated (Robertson et al., 1998; Hu et al., 2005; Spiteri et al., 2007). However, the WWTP effluent signature for these three groundwater sites is subdued relative to groundwaters immediately down gradient of the Drumpeel Road Drain and those of the Te Aute Drain/Kaikora Stream sites.
3 Groundwaters from site 3687 constitute the only strongly oxidised waters with elevated NO3-N that most likely
reflects a local pastoral land signature as oxidisable nitrate is likely to have been denitrified long before reaching this site.
NO3-N NO2-N Mg++ Ca++ Cl/Br Cl/I Cl/F Cl/B TAN SRP
Valid Cases 16 16 16 16 16 8 8 8 16 16
Mean 0.0010 0.0013 6.9 79.4 252.9 14421.2 216.7 1156.2 0.02 0.24
Median 0.0010 0.0010 6.6 78.0 244.4 13953.0 216.7 1160.2 0.01 0.17
Standard Deviation 0.0000 0.0004 0.9 6.3 46.9 7033.6 28.2 143.1 0.02 0.20
Coefficient of Variation 0.0000 0.3578 0.1 0.1 0.2 0.5 0.1 0.1 1.12 0.86
Minimum 0.0010 0.0010 5.8 72.0 200.0 7407.4 183.3 1000.0 0.01 0.06
Maximum 0.0010 0.0020 8.4 90.0 333.3 22371.4 250.0 1304.3 0.06 0.62
Range 0.0000 0.0010 2.6 18.0 133.3 14964.0 66.7 304.3 0.06 0.56
Lower Quartile 0.0010 0.0010 6.2 74.5 214.2 7934.5 191.7 1023.8 0.01 0.08
Upper Quartile 0.0010 0.0015 7.6 84.0 286.3 20907.9 241.7 1288.5 0.02 0.36
Interquartile Range 0.0000 0.0005 1.4 9.5 72.2 12973.4 50.0 264.7 0.01 0.28

Confidential 2016
GNS Science Consultancy Report 2016/83 14
In summary, analysis of the WWTP signature in WWTP effluent and local ground- and surface- waters indicates variable contamination with P-rich effluent from the Otane WWTP. More specifically, three WWTP signatures are apparent: (i) a clear WWTP signature on groundwaters immediately adjacent to or down gradient of the Drumpeel Road Drain through which the WWTP effluent percolates (groundwater sites 3601, 3692, 3688, 3691); (ii) a more dilute but still recognisable WWTP signature in both Te AuteDrain/Kaikora Stream sites (3673 and 3680), and; (iii) a possible legacy signature associated with historic disposal practices (i.e., pre-reticulation and plant upgrade) occurring in the groundwaters of sites 1628, 3689 and 3687. Of the three signatures, the legacy signatures are the most uncertain. Within the context of this study, groundwater sites 3644 and 3690 show little evidence of WWTP contamination, legacy or current.
5.0 INTERPRETATION
Hydrochemical analysis of water quality results from bores and surface water sites sampled by HBRC revealed localised elevated groundwater enriched in WWTP derived P. Specifically, three WWTP signatures are apparent: (i) a clear WWTP signature on groundwaters immediately adjacent to or down gradient of the Drumpeel Road Drain through which the WWTP effluent percolates (groundwater sites 3601, 3692, 3688, 3691); (ii) a more dilute but still recognisable WWTP signature in both Te Aute Drain/Kaikora Stream sites (3673 and 3680), and; (iii) a possible legacy signature associated with historic disposal practices (i.e., pre-reticulation and plant upgrade) occurring in the groundwaters of sites 1628, 3689 and 3687. Of the three signatures, the legacy signatures are the most uncertain.
The possibility of the overprinting of a legacy plume of P-rich WWTP by a more recent WWTP source signature is raised. The more recent (active) signature appears to extend north of the east-west trending Drumpeel Road drain (Sites 3686 and 3561) with a proportion of the local WWTP impacted groundwater discharging as base flow to the Te Aute Drain/Kaikora Stream (Figure 5.1). It is likely that the active plume extends up gradient of the upstream site and down gradient of the downstream site. Sites 3690 and 3644 lie immediately to the west-north-west of Drumpeel Road and show little evidence of contamination from the WWTP. Site 3690 is a deep bore (63 m BGL) but screened at a shallow depth of 9.03 – 10.33 m BGL and site 3644 is a shallow bore (9.3 m BGL; screen 7.17 – 9.3 m) and so provide some gross restriction on the eastern lateral extent of the plume. Site 3687 (22.6 m BGL; screen 15.09 – 16.92 m BGL) located to the east-north-east shows some signs of a legacy WWTP signature but little evidence for recent or active contamination from disposal through the Drumpeel Road Drain.
Finally, sites 1628, 3689 and 3687 show some signs of legacy contamination that may have migrated down gradient of the original WWTP disposal area parallel to the prevailing groundwater flow direction. The flaring or broadening of a contaminant plume down gradient of its source is typical of advection and dispersion processes within aquifers. However, the existence of a legacy plume associated with an older or legacy discharge remains a tentative hypothesis. Much more certainty is given to the active signature down gradient of the Drumpeel Road drain where WWTP effluent percolates into the shallow local aquifer system.

Confidential 2016
GNS Science Consultancy Report 2016/83 15
Figure 5.1 Map showing the effluent contaminant drain pathway, possible extent of the WWTP plume containing WWTP derived P, inferred groundwater flow direction (Lynch et al., 2013; Gordon, 2016), and a potential piezometer transect line for further investigation of the plume. Lateral extent of the plume and whether it extends beyond Te Aute Drain/Kaikora stream is poorly understood.
The mobility of P within the study area is likely a feature of the sorptive capacity of the shallow unsaturated zone and unconfined aquifer being overwhelmed by ongoing WWTP effluent rich in P. Whether or not P sorptive capacity is overwhelmed is a feature of the loading rates, duration of loading, the sorptive capacity of unsaturated and saturated zone materials and the redox status of local aquifers. At Otane it is suggested that the existence of a shallow unsaturated zone subject to significant water table fluctuations, reducing soils and locally reducing aquifers favours higher P mobility than in areas where the unsaturated zone is much deeper and not subjected to frequent redox excursions associated with fluctuating water tables. Furthermore, aside from site 3687, redox assignments indicate that all groundwater samples are reducing (Anoxic FeIII/SO4 and/or CO2- reducing with fewer Mixed (oxic-anoxic) waters; Appendix 1). This includes bores unimpacted by WWTP effluent. Due to reducing conditions within local aquifers all of the groundwaters sampled exhibit saturation with respects to manganese phosphate (MnHPO4(c)) and a few show saturation with respects to Vivianite (Fe2+Fe2
+2(PO4)2·8H2O). Vivianite is an iron phosphate mineral that is known to occur as colloids (1 nm – 1000 nm) that are mobile in reduced aquifers (Gschwend and Reynolds, 1987)4. The presence of natural aquifer conditions that favour phosphate transport equates to an elevated water quality risk to ground- and surface- waters from P rich WWTP effluent.
4 The observation of reducing groundwaters and elevated P concentrations raises a broader question around P
sources within the Papanui Catchment.

Confidential 2016
GNS Science Consultancy Report 2016/83 16
6.0 CONCLUSIONS
Phosphorus within the ground- and surface- waters of the Otane area may come from multiple sources including natural (lithological or organic), pastoral land-use, and WWTP effluent. However, a hydrochemical assessment of ground- and surface- (drain) waters in the vicinity and down gradient of the Drumpeel Road drain indicates that the discharge of WWTP effluent is an important source of P to some local ground- and surface- waters. Impacted bores contain 10.7 times, and unimpacted sites contain 3.1 times the 0.015 mg/L SRP level set by the HBRC for lowland streams. Despite evidence for local enrichment in P derived from WWTP effluent the concentrations of SRP in local groundwaters are still 33 times lower than that of sampled WWTP effluent. This indicates a large proportion of P is retained within soil and subsurface materials. Confidence that a proportion of the anomalous SRP is associated with the WWTP comes from multiple lines of evidence including evidence of mixing and dilution of WWTP effluent with local ground- and surface- waters.
A portion of the WWTP impacted groundwater appears to discharge to the Te Aute Drain/Kaikora Stream. However, currently the lateral extent of the active WWTP plume is poorly defined. Elevated SRP concentrations at both Te Aute Drain/Kaikora Stream sites may also be partially derived from up gradient sources. The relative contribution from WWTP effluent to the SRP concentration in stream is difficult to assess without a representative sample of the Te Aute Drain/Kaikora Stream waters from up gradient of the WWTP influence. Up gradient sources of P likely include both natural (lithological and organic) and land use derived sources.
The high mobility of P within the study area is likely a feature of the sorptive capacity of the shallow unsaturated zone and unconfined aquifer being overwhelmed by sustained discharge of P rich WWTP effluent and the typically greater mobility of P in reduced aquifer systems. Whether or not P sorptive capacity is overwhelmed is a feature of the loading rates, duration of loading, the sorptive capacity of unsaturated and saturated zone materials and the redox status of local aquifers. At Otane, it is suggested that the existence of a shallow unsaturated zone subject to significant water table fluctuations, reducing soils, and locally reducing aquifers favours higher P mobility than what occurs in areas where the unsaturated zone is much deeper and not subjected to frequent redox excursions associated with fluctuating water tables. The possibility of a legacy plume of P-enriched water associated with an older discharge at or around the current Otane WWTP was raised but remains a tentative hypothesis.
The impact of WWTP derived TAN and WWTP derived nitrate and nitrite on local waters is minimal due to natural attenuation processes occurring in the unsaturated zone and shallow aquifer. Similarly, WWTP derived E.Coli did not appear to impact on local waters over the sampling period due to effective physical exclusion by the unsaturated zone matrix.

Confidential 2016
GNS Science Consultancy Report 2016/83 17
7.0 RECOMMENDATIONS
Due to a lack of bores immediately south, south-west, and south-east of Te Aute Drain/Kaikora Stream, the exact lateral extent of the P-enriched plume was unable to be defined. Furthermore, the varying source of P and the contribution from pastoral and/or natural sources is poorly defined for the Te Aute Drain/Kaikora Stream. Better resolution over the source of P in local ground and surface waters as well as the extent of the WWTP plume and its impact on local aquifers and the Te Aute Drain/Kaikora Stream may be derived from:
1. Drilling and sampling of shallow monitoring bores immediately south, south-west, and south-east of Te Aute Drain/Kaikora Stream.
2. Completion of higher density longitudinal sampling up gradient and down gradient of the two Te Aute Drain/Kaikora Stream sampling sites. The two objectives are to: (i) characterise the hydrochemical signature of the stream up gradient of any WWTP influence, and; (ii) better define the lateral extent of the active WWTP on the stream. This work should be completed during a period of low flow.
3. Further examination of the source and fate of P in the Papanui Catchment is recommended in terms of assessing natural sources associated with local lithologies and reducing conditions. This could include analysis of P isotopes to determine the source of P in the catchment (e.g., WWTP effluent, lithological/natural, or agricultural).

Confidential 2016
GNS Science Consultancy Report 2016/83 18
8.0 REFERENCES
ANZEEC & ARMCANZ 2000. Australian and New Zealand guidelines for fresh and marine water quality. National Water Quality Management Strategy Paper No 4, Australian and New Zealand Environment and Conservation Council and Agriculture and Resource Management Council of Australia and New Zealand, Canberra, Australia.
Böhlke, J. K.; Smith, R. L.; Miller, D. N. 2006. Ammonium transport and reaction in contaminated groundwater: Application of isotope tracers and isotope fractionation studies. http://doi.org/10.1029/2005WR004349.
Burt, T. P.; Pinay, G.; Matheson, F. E.; Haycock, N. E.; Butturini, A.; Clement, J. C.; and Maitre, V. 2002. Water table fluctuations in the riparian zone: Comparative results from a pan-European experiment. Journal of Hydrology, 265(1-4), 129-148. http://doi.org/10.1016/S0022-1694(02)00102-6.
Buss, S. R.; Herbert, A. W.; Morgan, P.; Thornton, S. F.; Smith, J. W. N. 2004. A review of ammonium attenuation in soil and groundwater. Quarterly Journal of Engineering Geology and Hydrogeology, 37(4), 347-359. http://doi.org/10.1144/1470-9236/04-005.
Desimone, L. A.; Howes, Bullet, B. L. 1998. Nitrogen transport and transformations in a shallow aquifer receiving wastewater discharge: A mass balance approach. Water Resources Research, 34(2), 271-285. http://doi.org/10.1029/97WR03040.
Domagalski, J.L.; Johnson, H. 2012. Phosphorus and Groundwater: Establishing Links Between Agricultural Use and Transport to Streams: U.S. Geological Survey Fact Sheet 2012-3004, 4 p.
Gordon, D. 2016. Dougall Gordon, Principal Groundwater Scientist, Environmental Science Section, Resource Management Group. Personal communications via phone and email: [email protected].
Gschwend, P. M.; Reynolds, M. D. Monodisperse ferrous phosphate colloids in an anoxic groundwater plume, Journal of Contaminant Hydrology, Volume 1, Issue 3, 1987, Pages 309-327, ISSN 0169-7722, http://dx.doi.org/10.1016/0169-7722(87)90011-8.
Hawke’s Bay Regional Council (HBRC) 2006. Resource Management Plan (Includes Regional Policy Statement). Operative 28 August, 2006. Hawke’s Bay Regional Council, Napier.
Hefting, M.; Clément, J. C.; Dowrick, D.; Cosandey, A. C.; Bernal, S.; Cimpian, C.; Pinay, G. 2004. Water table elevation controls on soil nitrogen cycling in riparian wetlands along a European climatic gradient. Biogeochemistry, 67(1), 113-134. http://doi.org/10.1023/B:BIOG.0000015320.69868.33.
Heredia, O. S.; Fernndez, F.; Cirelli, A. 2007. Environmental risks of increasing phosphorus addition in relation to soil sorption capacity. Geoderma, 137(3-4), 426-431. http://doi.org/10.1016/j.geoderma.2006.09.005
Hem, J.D. 1985. Study and Interpretation of the Chemical Characteristics of Natural Water (3rd ed), U.S. Geological Survey Water Supply Paper 2254, U.S. Geological Survey, Alexandria, VA, 263.
Holman, I. P.; Whelan, M. J.; Howden, N. J. K.; Bellamy, P. H.; Willby, N. J.; Rivas-Casado, M.; McConvey, P. 2008. Phosphorus in groundwater - An overlooked contributor to eutrophication? Hydrological Processes, 22 (26), 5121-5127. http://doi.org/10.1002/hyp.7198.
Confidential 2016
GNS Science Consultancy Report 2016/83 19
Holman, I. P.; Howden, N. J. K.; Bellamy, P.; Willby, N.; Whelan, M. J.; Rivas-Casado, M. 2010. An assessment of the risk to surface water ecosystems of groundwater P in the UK and Ireland. Science of the Total Environment, 408(8), 1847-1857. http://doi.org/10.1016/j.scitotenv.2009.11.026.
Hu, C.; Zhang, T. C.; Huang, Y. H.; Dahab, M. F.; Surampalli, R. 2005. Effects of long-term wastewater application on chemical properties and phosphorus adsorption capacity in soils of a wastewater land treatment system. Environmental Science and Technology, 39(18), 7240-7245. http://doi.org/10.1021/es050526p
Jurgens, B.C.; McMahon, P.B.; Chapelle, F.H.; Eberts, S.M., 2009. An Excel workbook for identifying redox processes in groundwater: U.S. Geological Survey Open-File Report 2009-1004, 8 p.
Langmuir, D. 1997. Aqueous Environmental Geochemistry. Prentice-Hall, Inc., upper Saddle River, NJ, 600 pp.
Larking R, “Otane Consent Report,” Hawke's Bay Regional Council, Napier, 2004.
Leader, W, J.; Dunne, E. J.; Reddy, K. R. 2008. Phosphorus sorbing materials: sorption dynamics and physicochemical characteristics. Journal of Environmental Quality, 37(1), 174-181. http://doi.org/10.2134/jeq2007.0148.
Lee, J.M.; Townsend, D.; Bland, K.; Kamp, P.J.J. (compilers) 2011. Geology of the Hawke’s Bay area: scale 1:250,000. Lower Hutt: Institute of Geological and Nuclear Sciences Limited. Institute of Geological and Nuclear Sciences 1:250,000 geological map 8. 86 p. + 1 folded map.
Luba L., “Aquifer Test Ritchie (Bore 4167), Fraser (Bore 3155), Drumpeel Road, Otane.,” Hawke's Bay Regional Council, Napier, 1999.
Ludecke J. E., “Tukituki River Catchment Water and Soils Resource Management Plan,” Hawke's Bay Regional Water Board, Napier, 1988.
Lynch, B.; Cameron, F.; Kozyniak, K.; Harper, S.; Waldron, R.; Fake, D.; Heidekker, S.; Exeter, S. 2013. Papanui Catchment An Environmental Characterisation. Hawke’s Bay Regional Council, Napier 58 p.
McMahon, P.B.; Chapelle, F.H., 2008. Redox processes and water quality of selected principal aquifer systems: Ground Water, v. 46, p. 259-271.
Ministry of Health, 2008. Drinking-water Standards for New Zealand 2005 (Revised 2008), Ministry of Health, Wellington, 163 p.
Moore, T. A.; Xing, Y.; Lazenby, B.; Lynch, M. D. J.; Schiff, S.; Robertson, W. D.; Neufeld, J. D. 2011. Prevalence of anaerobic ammonium-oxidizing bacteria in contaminated groundwater. Environmental Science and Technology, 45 (17), 7217-7225. http://doi.org/10.1021/es201243t.
Obour, A. K.; Silveira, M. L.; Vendramini, J. M. B.; Sollenberger, L. E.; O’Connor, G. A. 2011. Fluctuating water table effect on phosphorus release and availability from a Florida Spodosol. Nutrient Cycling in Agroecosystems, 91(2), 207-217. http://doi.org/10.1007/s10705-011-9456-y.
Parkhurst, D.L.; Appelo, C.A.J. 2013. Description of input and examples for PHREEQC version 3—a computer program for speciation, batch-reaction, one-dimensional transport, and inverse geochemical calculations: U.S. Geological Survey Techniques and Methods, Book 6, Chap. A43, 497 p.

Confidential 2016
GNS Science Consultancy Report 2016/83 20
Robertson, W.D.; Schiff, S.L.; Ptacek, C.J. 1998. Review of Phosphate Mobility and Persistence in 10 Septic System Plumes. Ground Water, Vol. 36, No. 6.
Siemens, J.; Ilg, K.; Lang, F.; Kaupenjohann, M. 2004. Adsorption controls mobilization of colloids and leaching of dissolved phosphorus. European Journal of Soil Science, 55(2), 253-263. http://doi.org/10.1046/j.1365-2389.2004.00596.x.
Spiteri, C.; Slomp, C. P.; Regnier, P.; Meile, C.; Van Cappellen, P. 2007. Modelling the geochemical fate and transport of wastewater-derived phosphorus in contrasting groundwater systems. Journal of Contaminant Hydrology, 92(1-2), 87-108. http://doi.org/10.1016/j.jconhyd.2007.01.002.
Villapando, R. R.; Graetz, D. A. 2001. Water table effects on phosphorus reactivity and mobility in a dairy manure-impacted spodosol. Ecological Engineering, 18(1), 77-89. http://doi.org/10.1016/S0925-8574(01)00067-2.

Confidential 2016
GNS Science Consultancy Report 2016/83 21
APPENDICES

Confidential 2016
GNS Science Consultancy Report 2016/83 22
APPENDIX 1: METHODOLOGY
A1.1 REDOX ASSIGNMENT
Assignment of redox state is based on the methodology of McMahon and Chapelle (2008), as implemented in the excel spread sheet of Jurgens et al. (2009). This approach involves comparison of the concentrations of selected redox-sensitive substances to the thresholds listed in Table A 1.1.
Table A 0.1: Redox category and dominant redox process for groundwater and surface water as determined from measured concentrations of water quality parameters (after Jurgens et al., 2009)
Redox
Category
Redox
Process
Criteria for Assigning Redox State
D.O. ≥0.5 mg/L
NO3-N ≥0.5 mg/L
Mn(II) ≥0.05 mg/L
Fe(II) ≥0.01 mg/L
SO4
≥0.5 mg/L
Fe/H2S ≥0.3 (mass ratio)
Oxic O2 Y NA N N NA NA Suboxic O2 N N N N NA NA Mixed (oxic-anoxic) O2-Mn(IV) Y NA Y N NA NA Mixed (oxic-anoxic) O2-Fe(III) Y N NA Y Y Y Mixed (oxic-anoxic) O2-Fe(III)-SO4 Y N NA Y Y Y Mixed (oxic-anoxic) O2-SO4 Y N NA Y Y N Mixed (oxic-anoxic) O2-CH4 gen. Y N NA Y N NA Mixed (anoxic) NO3-Mn(IV) N Y Y N NA NA Mixed (anoxic) NO3-CH4 gen. N Y NA Y N NA Anoxic NO3 N Y N N NA NA Anoxic Mn(IV) N N Y N NA NA Anoxic Fe(III) N N NA Y Y Y Anoxic SO4 N N NA Y Y N Anoxic CH4 gen. N N NA Y N NA
It is recognised that redox reactions are usually not at chemical equilibrium in low temperature groundwaters. Hence this approach for assignment of redox state is based on the widely observed ecological succession of electron-accepting processes. Redox assignment for each sample includes identification of the dominant redox state (i.e., oxic, suboxic, or mixed (oxic-anoxic)) and the principal terminal electron accepting process operating within that groundwater. If the required data are available, iron reducing conditions are differentiated from SO4 reducing conditions by measuring the mass ratio of Fe(II) to total sulphide (Jurgens et al., 2009).
A1.2 MINERAL SATURATION INDICES
Mineral dissolution reactions can play an important role in governing the hydrochemistry of surface water and groundwater. Consider the generic reaction where the mineral AnBm dissolves to produce the ions A+ and B-:
−+ +→ mBnABA mn (A1)
The solubility product KSP is a constant that is specific for the mineral in question and that defines the relationship between A+ and B- at chemical equilibrium:
mnSP BAK ][][ −+= (A2)

Confidential 2016
GNS Science Consultancy Report 2016/83 23
where square brackets represent the activities5 of the enclosed ions and n and m are the stoichiometric coefficients in the dissolution reaction. The saturation index (SI) provides an evaluation of whether a given solution is at chemical equilibrium with respect to a given mineral:
=
−+
SP
mn
KBASI ][][log
(A3)
If SI = 0 then the system is at chemical equilibrium and the solution is saturated with respect to the given mineral; if SI < 0 the solution is under-saturated and the mineral is expected to dissolve; and if SI > 0 the solution is oversaturated and the mineral is expected to precipitate.
Measurement of the dissolved concentrations of several different elements allows the saturation indices for a wide variety of minerals to be calculated by comparison to published tables of mineral solubility products (Langmuir, 1997). This information on mineral saturation state can provide useful information on what types of minerals natural water has reacted with, which in turn can provide insight into hydrological processes and flow paths (Hem, 1985).
In this study, saturation indices are calculated with respect to a limited set of minerals. All calculations of saturation indices were performed using AquaChem 2014 software (Schlumberger Water Services) and the phreeqc thermodynamic database (Pankhurst and Appelo, 2013) and are based on either calculated median concentrations or sample-specific analytical results for the relevant elements.
A1.3 ADDITIONAL HALIDE REFERENCES
Katz, B. G.; Eberts, S. M.; Kauffman, L. J. 2011. Using Cl/Br ratios and other indicators to assess potential impacts on groundwater quality from septic systems: A review and examples from principal aquifers in the United States. Journal of Hydrology, 397(3-4), 151-166. doi:10.1016/j.jhydrol.2010.11.017
Kelly, W. R.; Panno, S. V.; Hackley, K. C.; Hwang, H. H.; Martinsek, A. T.; Markus, M. 2010. Using chloride and other ions to trace sewage and road salt in the Illinois Waterway. Applied Geochemistry, 25 (5), 661-673. doi:10.1016/j.apgeochem.2010.01.020
Panno, S. V.; Hackley, K.; Hwang, H. H.; Greenberg, S.; Krapac, I. G.; Landsberger, S. 2002. Source Identification of Sodium and Chloride Contamination in Natural Waters: Preliminary Results - S.V. Panno, K.C. Hackley, H.H. Hwang, S. Greenberg, I.G. Krapac, S. Landsberger and D.J. O’Kelly. Water, 22, 1-25. Retrieved from http://www.water- research.net/Waterlibrary/privatewell/nacl.pdf
Panno, S. V.; Hackley, K. C.; Hwang, H. H.; Greenberg, S. E.; Krapac, I. G.; Landsberger, S.; O’Kelly, D. J. 2006. Characterization and identification of Na-Cl sources in ground water. Ground Water, 44(2), 176-187. doi:10.1111/j.1745-6584.2005.00127.x
Vengosh, A.; Pankratov, I. 1998. Chloride/Bromide and Chloride/Fluoride Ratios of Domestic Sewage Effluents and Associated Contaminated Ground Water. Ground Water, 36(5), 815-824. http://doi.org/10.1111/j.1745-6584.1998.tb02200.x
5 In thermodynamics, activity defines the amount of a substance that is available for reaction. For most natural
waters, activity is approximately equal to concentration in moles per litre of solution.

Confidential 2016
GNS Science Consultancy Report 2016/83 24
A1.4 ADDITIONAL PHOSPHATE TRANSPORT REFERENCES
Domagalski, J. L.; Johnson, H. M. 2011. Subsurface transport of orthophosphate in five agricultural watersheds, USA. Journal of Hydrology, 409(1-2), 157-171. http://doi.org/10.1016/j.jhydrol.2011.08.014
Kanti Sen, T.; Khilar, K. C. 2006. Review on subsurface colloids and colloid-associated contaminant transport in saturated porous media. Advances in Colloid and Interface Science, 119(2), 71-96. http://doi.org/10.1016/j.cis.2005.09.001
Niedermeier, A., Robinson, J. S. 2009. Phosphorus dynamics in the ditch system of a restored peat wetland. Agriculture, Ecosystems and Environment, 131(3-4), 161-169. http://doi.org/10.1016/j.agee.2009.01.011
Puls, R. W.; Powell, R. M. 1992. Transport of inorganic colloids through natural aquifer material: implications for contaminant transport. Environmental Science & Technology, 26(3), 614-621. http://doi.org/10.1021/es00027a027.
Ryan, J. N.; Elimelech, M. 1996. Colloid mobilization and transport in groundwater. In Colloids and Surfaces A: Physicochemical and Engineering Aspects (Vol. 107, pp. 1-6). http://doi.org/10.1016/0927-7757(95)03384-X.
Stollenwerk, K. G. 1996. Simulation of phosphate transport in sewage-contaminated groundwater, Cape Cod, Massachusetts. Applied Geochemistry, 11(1-2), 317-324. http://doi.org/10.1016/0883-2927(95)00041-0.
Weiskel, P. K.; Howes, B. L. 1992. Differential Transport of Sewage-Derived Nitrogen and Phosphorus Through a Coastal Watershed. Environ Sci Technol, 26(2), 352-360. http://doi.org/10.1021/es00026a017.
A1.5 AMMONIA AND NITRATE DYNAMICS REFERENCES
Amy, G.; Drewes, J. (n.d.). Soil Aquifer Treatment (SAT) as a Natural and Sustainable Wastewater Reclamation/Reuse Technology: Fate of Wastewater Effluent Organic Matter (EfOM) and Trace Organic Compounds.
Weiskel, P. K.; Howes, B. L. 1992. Differential Transport of Sewage-Derived Nitrogen and Phosphorus Through a Coastal Watershed. Environ Sci Technol, 26(2), 352-360. http://doi.org/10.1021/es00026a017.
Vadas, P. A.; Srinivasan, M. S.; Kleinman, P. J. A.; Schmidt, J. P.; Allen, A. L. 2007. Hydrology and groundwater nutrient concentrations in a ditch-drained agroecosystem. Journal of Soil and Water Conservation, 62(4), 178-188. Retrieved from http://www.jswconline.org/content/62/4/178.

Confidential 2016
GNS Science Consultancy Report 2016/83 25
APPENDIX 2: FULL DATASET SiteID Date BoreNo Sample ID Easting Northing Well Depth
Screen
Type Observation SiteDesc General Redox Category Redox Process 3692 19/02/2016 16446 58959 2821681 6140209 3.6 Local GW&SW Shallow well immediately adjacent to WWTP open drain Well 16446 Anoxic Fe(III)/SO4 3692 12/04/2016 16446 59600 2821681 6140209 3.6 Local GW&SW Shallow well immediately adjacent to WWTP open drain Well 16446 Anoxic Fe(III)/SO4 3692 19/01/2016 16446 58673 2821681 6140209 3.6 Local GW&SW Shallow well immediately adjacent to WWTP open drain Well 16446 Anoxic Fe(III)/SO4 3692 17/03/2016 16446 54749 2821681 6140209 3.6 Local GW&SW Shallow well immediately adjacent to WWTP open drain Well 16446 Mixed(anoxic) NO3-Fe(III)/SO4 3680 19/01/2016 54684 2823026 6141647 Local GW&SW Te Aute/Kaikora Stream d/s conf with WWTP outfall Kaikora Drain 200m DS Otane Sewerage Scheme Drain TLB AnoxicOrMixed(oxic-anoxic) Fe(III)/SO4-O2? 3680 19/01/2016 54684 2823026 6141647 Local GW&SW Te Aute/Kaikora Stream d/s conf with WWTP outfall Kaikora Drain 200m DS Otane Sewerage Scheme Drain TLB AnoxicOrMixed(oxic-anoxic) Fe(III)/SO4-O2? 3680 19/02/2016 54685 2823026 6141647 Local GW&SW Te Aute/Kaikora Stream d/s conf with WWTP outfall Kaikora Drain 200m DS Otane Sewerage Scheme Drain TLB Mixed(oxic-anoxic) O2-Mn(IV) 3680 19/02/2016 54685 2823026 6141647 Local GW&SW Te Aute/Kaikora Stream d/s conf with WWTP outfall Kaikora Drain 200m DS Otane Sewerage Scheme Drain TLB Mixed(oxic-anoxic) O2-Mn(IV) 3680 17/03/2016 54758 2823026 6141647 Local GW&SW Te Aute/Kaikora Stream d/s conf with WWTP outfall Kaikora Drain 200m DS Otane Sewerage Scheme Drain TLB Mixed(oxic-anoxic) O2-Fe(III)/SO4 3680 17/03/2016 54758 2823026 6141647 Local GW&SW Te Aute/Kaikora Stream d/s conf with WWTP outfall Kaikora Drain 200m DS Otane Sewerage Scheme Drain TLB Mixed(oxic-anoxic) O2-Fe(III)/SO4 3680 12/04/2016 54754 2823026 6141647 Local GW&SW Te Aute/Kaikora Stream d/s conf with WWTP outfall Kaikora Drain 200m DS Otane Sewerage Scheme Drain TLB Oxic O2 3680 12/04/2016 54754 2823026 6141647 Local GW&SW Te Aute/Kaikora Stream d/s conf with WWTP outfall Kaikora Drain 200m DS Otane Sewerage Scheme Drain TLB Oxic O2 3673 19/01/2016 54683 2822796 6141750 Local GW&SW Te Aute/Kaikora Stream u/s conf with WWTP outfall 50m us of confluence on the TRB of the Kaikora Drain AnoxicOrMixed(oxic-anoxic) Fe(III)/SO4-O2? 3673 19/01/2016 54683 2822796 6141750 Local GW&SW Te Aute/Kaikora Stream u/s conf with WWTP outfall 50m us of confluence on the TRB of the Kaikora Drain AnoxicOrMixed(oxic-anoxic) Fe(III)/SO4-O2? 3673 19/02/2016 54695 2822796 6141750 Local GW&SW Te Aute/Kaikora Stream u/s conf with WWTP outfall 50m us of confluence on the TRB of the Kaikora Drain Mixed(oxic-anoxic) O2-Fe(III)/SO4 3673 19/02/2016 54695 2822796 6141750 Local GW&SW Te Aute/Kaikora Stream u/s conf with WWTP outfall 50m us of confluence on the TRB of the Kaikora Drain Mixed(oxic-anoxic) O2-Fe(III)/SO4 3673 17/03/2016 54757 2822796 6141750 Local GW&SW Te Aute/Kaikora Stream u/s conf with WWTP outfall 50m us of confluence on the TRB of the Kaikora Drain Mixed(oxic-anoxic) O2-Fe(III)/SO4 3673 17/03/2016 54757 2822796 6141750 Local GW&SW Te Aute/Kaikora Stream u/s conf with WWTP outfall 50m us of confluence on the TRB of the Kaikora Drain Mixed(oxic-anoxic) O2-Fe(III)/SO4 3673 12/04/2016 54768 2822796 6141750 Local GW&SW Te Aute/Kaikora Stream u/s conf with WWTP outfall 50m us of confluence on the TRB of the Kaikora Drain Anoxic Mn(IV) 3673 12/04/2016 54768 2822796 6141750 Local GW&SW Te Aute/Kaikora Stream u/s conf with WWTP outfall 50m us of confluence on the TRB of the Kaikora Drain Anoxic Mn(IV) 3687 4/05/2016 1492 59602 2821100 6140700 22.56 15.09-16.92 Local GW&SW Well - high TON/Ox Well 1492 Mixed(oxic-anoxic) O2-Mn(IV) 3644 14/04/2016 16256 59469 2822970 6140534 9.3 7.17-9.10 Local GW&SW Well 16256 east of unamed drain Drumpeel Road, Otane Anoxic CH4gen 3644 14/04/2016 16256 59469 2822970 6140534 9.3 7.17-9.10 Local GW&SW Well 16256 east of unamed drain Drumpeel Road, Otane Anoxic CH4gen 3644 8/03/2016 16256 59413 2822970 6140534 9.3 7.17-9.8 Local GW&SW Well 16256 east of unamed drain Drumpeel Road, Otane Anoxic CH4gen 3644 8/03/2016 16256 59413 2822970 6140534 9.3 7.17-9.8 Local GW&SW Well 16256 east of unamed drain Drumpeel Road, Otane Anoxic CH4gen 3644 19/02/2016 16256 58954 2822970 6140534 9.3 7.17-9.4 Local GW&SW Well 16256 east of unamed drain Drumpeel Road, Otane Anoxic Fe(III)/SO4 3644 19/02/2016 16256 58954 2822970 6140534 9.3 7.17-9.4 Local GW&SW Well 16256 east of unamed drain Drumpeel Road, Otane Anoxic Fe(III)/SO4 3644 19/01/2016 16256 58668 2822970 6140534 9.3 7.17-9.3 Local GW&SW Well 16256 east of unamed drain Drumpeel Road, Otane Anoxic CH4gen 3644 19/01/2016 16256 58668 2822970 6140534 9.3 7.17-9.3 Local GW&SW Well 16256 east of unamed drain Drumpeel Road, Otane Anoxic CH4gen 3644 17/03/2016 16256 54751 2822970 6140534 9.3 7.17-9.6 Local GW&SW Well 16256 east of unamed drain Drumpeel Road, Otane Anoxic CH4gen 3644 17/03/2016 16256 54751 2822970 6140534 9.3 7.17-9.6 Local GW&SW Well 16256 east of unamed drain Drumpeel Road, Otane Anoxic CH4gen 3644 12/04/2016 16256 59598 2822970 6140534 9.3 7.17-9.5 Local GW&SW Well 16256 east of unamed drain Drumpeel Road, Otane Anoxic CH4gen 3644 12/04/2016 16256 59598 2822970 6140534 9.3 7.17-9.5 Local GW&SW Well 16256 east of unamed drain Drumpeel Road, Otane Anoxic CH4gen 3644 14/01/2016 16256 58648 2822970 6140534 9.3 7.17-9.7 Local GW&SW Well 16256 east of unamed drain Drumpeel Road, Otane Anoxic CH4gen 3644 14/01/2016 16256 58648 2822970 6140534 9.3 7.17-9.7 Local GW&SW Well 16256 east of unamed drain Drumpeel Road, Otane Anoxic CH4gen 3644 10/02/2016 16256 58779 2822970 6140534 9.3 7.17-9.9 Local GW&SW Well 16256 east of unamed drain Drumpeel Road, Otane Anoxic CH4gen 3644 10/02/2016 16256 58779 2822970 6140534 9.3 7.17-9.9 Local GW&SW Well 16256 east of unamed drain Drumpeel Road, Otane Anoxic CH4gen 3689 4/05/2016 4325 59601 2821043 6139567 65 2.01-65.0 Local GW&SW Well adjacent (N-W) to WWTP Well 4325 Mixed(oxic-anoxic) O2-Fe(III)/SO4 3689 4/05/2016 4325 59601 2821043 6139567 65 2.01-65.0 Local GW&SW Well adjacent (N-W) to WWTP Well 4325 Mixed(oxic-anoxic) O2-Fe(III)/SO4 1628 4/05/2016 16493 59603 2821071 6139155 3 Local GW&SW Well adjacent (S-W) to WWTP Elsthorpe road, Otane Mixed(oxic-anoxic) O2-Fe(III)/SO4 3601 19/02/2016 16126 58951 2821833 6140464 Unknown Local GW&SW Well just N of 3686 WWTP water 203 Drumpeel Road Mixed(oxic-anoxic) O2-Fe(III)/SO4 3601 12/04/2016 16126 59595 2821833 6140464 Unknown Local GW&SW Well just N of 3686 WWTP water 203 Drumpeel Road Anoxic Fe(III)/SO4 3601 17/03/2016 16126 54747 2821833 6140464 Unknown Local GW&SW Well just N of 3686 WWTP water 203 Drumpeel Road Anoxic Fe(III)/SO4 3601 19/01/2016 16126 58665 2821833 6140464 Unknown Local GW&SW Well just N of 3686 WWTP water 203 Drumpeel Road Anoxic Fe(III)/SO4 3691 19/02/2016 15035 58952 2822127 6140450 Unknown Local GW&SW Well N of Drumpeel Rd drain and sites 3686 and 3561 Well 15035 @ Drumpeel Road Anoxic Fe(III)/SO4 3691 19/01/2016 15035 58666 2822127 6140450 Unknown Local GW&SW Well N of Drumpeel Rd drain and sites 3686 and 3562 Well 15035 @ Drumpeel Road Anoxic Fe(III)/SO4 3691 12/04/2016 15035 59596 2822127 6140450 Unknown Local GW&SW Well N of Drumpeel Rd drain and sites 3686 and 3563 Well 15035 @ Drumpeel Road Anoxic Fe(III)/SO4 3688 12/04/2016 3159 59599 2821896 6140797 15.8 9.1-15.8 Local GW&SW Well north of 3686 and WWTP drain Well 3159 Anoxic Fe(III)/SO4 3688 17/03/2016 3159 54748 2821896 6140797 15.8 9.1-15.8 Local GW&SW Well north of 3686 and WWTP drain Well 3159 Anoxic Fe(III)/SO4 3688 19/02/2016 3159 58957 2821896 6140797 15.8 9.1-15.8 Local GW&SW Well north of 3686 and WWTP drain Well 3159 Anoxic Fe(III)/SO4 3688 19/01/2016 3159 58671 2821896 6140797 15.8 9.1-15.8 Local GW&SW Well north of 3686 and WWTP drain Well 3159 Anoxic Fe(III)/SO4 3690 19/01/2016 5314 58667 2822851 6140280 63 9.03-10.33 Local GW&SW Well west of 3561 and WWTP drain Well 5314 @ Drumpeel Road Anoxic Fe(III)/SO4 3690 19/01/2016 5314 58667 2822851 6140280 63 9.03-10.33 Local GW&SW Well west of 3561 and WWTP drain Well 5314 @ Drumpeel Road Anoxic Fe(III)/SO4 3690 17/03/2016 5314 54750 2822851 6140280 63 9.03-10.33 Local GW&SW Well west of 3561 and WWTP drain Well 5314 @ Drumpeel Road Anoxic Fe(III)/SO4 3690 17/03/2016 5314 54750 2822851 6140280 63 9.03-10.33 Local GW&SW Well west of 3561 and WWTP drain Well 5314 @ Drumpeel Road Anoxic Fe(III)/SO4 3690 19/02/2016 5314 58953 2822851 6140280 63 9.03-10.33 Local GW&SW Well west of 3561 and WWTP drain Well 5314 @ Drumpeel Road Anoxic Fe(III)/SO4 3690 19/02/2016 5314 58953 2822851 6140280 63 9.03-10.33 Local GW&SW Well west of 3561 and WWTP drain Well 5314 @ Drumpeel Road Anoxic Fe(III)/SO4 3690 12/04/2016 5314 59597 2822851 6140280 63 9.03-10.33 Local GW&SW Well west of 3561 and WWTP drain Well 5314 @ Drumpeel Road Anoxic Fe(III)/SO4 3690 12/04/2016 5314 59597 2822851 6140280 63 9.03-10.33 Local GW&SW Well west of 3561 and WWTP drain Well 5314 @ Drumpeel Road Anoxic Fe(III)/SO4 3561 19/01/2016 54682 2822443 6140265 WWTP Eff WWTP water in drain/trib Kaikora Tributary at Drumpeel Road Mixed(anoxic)Or(oxic-anoxic) Fe(III)/SO4-O2?OrNO3 3561 19/02/2016 54696 2822443 6140265 WWTP Eff WWTP water in drain/trib Kaikora Tributary at Drumpeel Road Mixed(oxic-anoxic) O2-Mn(IV) 3561 12/04/2016 54720 2822443 6140265 WWTP Eff WWTP water in drain/trib Kaikora Tributary at Drumpeel Road Mixed(oxic-anoxic) O2-Mn(IV) 3561 17/03/2016 54756 2822443 6140265 WWTP Eff WWTP water in drain/trib Kaikora Tributary at Drumpeel Road Oxic O2 3686 19/01/2016 54681 2821820 6140380 WWTP Eff WWTP water in drain/trib Farm Drain opposite 203 Drumpeel Road AnoxicOrMixed(oxic-anoxic) Fe(III)/SO4-O2? 3686 19/02/2016 54686 2821820 6140380 WWTP Eff WWTP water in drain/trib Farm Drain opposite 203 Drumpeel Road Mixed(oxic-anoxic) O2-Fe(III)/SO4 3686 17/03/2016 54753 2821820 6140380 WWTP Eff WWTP water in drain/trib Farm Drain opposite 203 Drumpeel Road Mixed(oxic-anoxic) O2-Mn(IV) 3686 12/04/2016 54769 2821820 6140380 WWTP Eff WWTP water in drain/trib Farm Drain opposite 203 Drumpeel Road Oxic O2
Confidential 2016
GNS Science Consultancy Report 2016/83 26
SiteID Date BoreNo Sample
Easting Northing Temp. pH EC Dissolved
O2(aq) NO3-N NO2-N TAN SRP Mn++ Fe++ SO4-- Cl- Br- I- F- B HCO3- Carbonate
Na+ K+ Mg++ Ca++ Hardness SiO2(aq) 3692 19/02/2016 16446 58959 2821681 6140209 15.6 7.33 404.8 330 0.2 0.001 0.001 0.45 0.161 0.191 1.47 2.7 26 0.11 329 0.5 21 4 4.9 81 85.9 37 3692 12/04/2016 16446 59600 2821681 6140209 15.3 6.56 412.1 340 0.3 0.091 0.001 0.38 0.12 0.153 0.6 10.5 25 0.1 0.014 0.15 0.056 342 0.5 20 4 4.8 78 82.8 37 3692 19/01/2016 16446 58673 2821681 6140209 14.4 7.03 390.6 320 0.1 0.126 0.003 0.49 0.081 0.198 1.83 2.2 26 0.11 329 0.5 18 3.8 4.9 75 79.9 37 3692 17/03/2016 16446 54749 2821681 6140209 15.1 7.16 417.3 350 0.3 0.92 0.001 0.36 0.076 0.15 0.57 15.1 26 0.12 0.011 0.16 0.059 329 0.5 21 4.1 5.3 82 87.3 35 3680 19/01/2016 54684 2823026 6141647 7.5 613 410 0.001 0.002 0.062 0.62 0.61 0.32 26 34 0.13 366 0.5 27 4.1 8.4 90 98.4 32 3680 19/01/2016 54684 2823026 6141647 7.5 613 410 0.001 0.002 0.062 0.62 0.61 0.32 26 34 0.13 366 0.5 27 4.1 8.4 90 98.4 32 3680 19/02/2016 54685 2823026 6141647 19.9 7.5 415.1 340 1.84 0.001 0.001 0.005 0.22 0.129 0.08 7.3 25 0.12 317 0.5 22 3.7 6.8 77 83.8 43 3680 19/02/2016 54685 2823026 6141647 19.9 7.5 415.1 340 1.84 0.001 0.001 0.005 0.22 0.129 0.08 7.3 25 0.12 317 0.5 22 3.7 6.8 77 83.8 43 3680 17/03/2016 54758 2823026 6141647 16.1 6.98 460 320 3.1 0.001 0.001 0.019 0.112 0.39 0.13 4.4 22 0.11 0.027 0.12 0.021 305 0.5 18.8 2.8 6.4 73 79.4 39 3680 17/03/2016 54758 2823026 6141647 16.1 6.98 460 320 3.1 0.001 0.001 0.019 0.112 0.39 0.13 4.4 22 0.11 0.027 0.12 0.021 305 0.5 18.8 2.8 6.4 73 79.4 39 3680 12/04/2016 54754 2823026 6141647 15.4 7.41 512.3 350 2.61 0.001 0.001 0.005 0.074 0.028 0.06 6.9 28 0.09 0.016 0.12 0.022 317 0.5 22 3.1 6.1 79 85.1 30 3680 12/04/2016 54754 2823026 6141647 15.4 7.41 512.3 350 2.61 0.001 0.001 0.005 0.074 0.028 0.06 6.9 28 0.09 0.016 0.12 0.022 317 0.5 22 3.1 6.1 79 85.1 30 3673 19/01/2016 54683 2822796 6141750 7.5 602 400 0.001 0.002 0.005 0.5 0.47 0.31 24 34 0.13 366 0.5 26 3.7 8.3 88 96.3 32 3673 19/01/2016 54683 2822796 6141750 7.5 602 400 0.001 0.002 0.005 0.5 0.47 0.31 24 34 0.13 366 0.5 26 3.7 8.3 88 96.3 32 3673 19/02/2016 54695 2822796 6141750 19.4 7.41 487.3 330 1.19 0.001 0.001 0.016 0.22 0.32 0.1 6.7 25 0.11 317 0.5 21 3.6 6.7 76 82.7 43 3673 19/02/2016 54695 2822796 6141750 19.4 7.41 487.3 330 1.19 0.001 0.001 0.016 0.22 0.32 0.1 6.7 25 0.11 317 0.5 21 3.6 6.7 76 82.7 43 3673 17/03/2016 54757 2822796 6141750 16.1 7.01 448 310 1.1 0.001 0.001 0.016 0.091 0.31 0.16 4.1 22 0.1 0.026 0.11 0.022 305 0.5 18.8 2.7 6.3 72 78.3 38 3673 17/03/2016 54757 2822796 6141750 16.1 7.01 448 310 1.1 0.001 0.001 0.016 0.091 0.31 0.16 4.1 22 0.1 0.026 0.11 0.022 305 0.5 18.8 2.7 6.3 72 78.3 38 3673 12/04/2016 54768 2822796 6141750 14.9 7.4 513.6 350 0.45 0.001 0.001 0.005 0.064 0.142 0.05 6.2 30 0.09 0.015 0.12 0.023 317 0.5 22 3.1 5.8 80 85.8 31 3673 12/04/2016 54768 2822796 6141750 14.9 7.4 513.6 350 0.45 0.001 0.001 0.005 0.064 0.142 0.05 6.2 30 0.09 0.015 0.12 0.023 317 0.5 22 3.1 5.8 80 85.8 31 3687 4/05/2016 1492 59602 2821100 6140700 15.9 575 370 0.7 7 0.043 0.019 0.084 0.053 0.07 20 20 0.1 0.010 0.1 0.052 329 0.5 23 3 6 95 101 25 3644 14/04/2016 16256 59469 2822970 6140534 14.3 6.62 571 470 0.2 0.001 0.001 1.7 1.12 1.21 4.7 0.25 42 464 0.5 49 6.9 9.1 97 106.1 30 3644 14/04/2016 16256 59469 2822970 6140534 14.3 6.62 571 470 0.2 0.001 0.001 1.7 1.12 1.21 4.7 0.25 42 464 0.5 49 6.9 9.1 97 106.1 30 3644 8/03/2016 16256 59413 2822970 6140534 14.8 7.57 718 480 0.1 0.001 0.001 1.8 0.83 1.12 4.3 0.25 43 476 0.5 45 6.1 8.3 91 99.3 31 3644 8/03/2016 16256 59413 2822970 6140534 14.8 7.57 718 480 0.1 0.001 0.001 1.8 0.83 1.12 4.3 0.25 43 476 0.5 45 6.1 8.3 91 99.3 31 3644 19/02/2016 16256 58954 2822970 6140534 14.9 7.25 577 460 0.1 0.095 0.001 1.7 0.156 1.23 5.1 0.6 44 0.16 476 1 45 6.3 9.3 96 105.3 30 3644 19/02/2016 16256 58954 2822970 6140534 14.9 7.25 577 460 0.1 0.095 0.001 1.7 0.156 1.23 5.1 0.6 44 0.16 476 1 45 6.3 9.3 96 105.3 30 3644 19/01/2016 16256 58668 2822970 6140534 14.9 7.5 566 450 0.1 0.001 0.001 1.9 0.073 1.07 4.4 0.25 41 0.14 451 0.5 37 5.9 7.9 88 95.9 30 3644 19/01/2016 16256 58668 2822970 6140534 14.9 7.5 566 450 0.1 0.001 0.001 1.9 0.073 1.07 4.4 0.25 41 0.14 451 0.5 37 5.9 7.9 88 95.9 30 3644 17/03/2016 16256 54751 2822970 6140534 14.6 7.52 576 480 0.2 0.001 0.001 2 0.02 1.15 4.6 0.25 42 0.17 0.063 0.28 0.159 451 0.5 46 6.4 9 97 106 31 3644 17/03/2016 16256 54751 2822970 6140534 14.6 7.52 576 480 0.2 0.001 0.001 2 0.02 1.15 4.6 0.25 42 0.17 0.063 0.28 0.159 451 0.5 46 6.4 9 97 106 31 3644 12/04/2016 16256 59598 2822970 6140534 14.7 6.59 575 470 0.1 0.003 0.001 1.8 0.016 1.14 4.4 0.25 43 0.16 0.061 0.27 0.159 476 0.5 42 6.1 8.1 92 100.1 29 3644 12/04/2016 16256 59598 2822970 6140534 14.7 6.59 575 470 0.1 0.003 0.001 1.8 0.016 1.14 4.4 0.25 43 0.16 0.061 0.27 0.159 476 0.5 42 6.1 8.1 92 100.1 29 3644 14/01/2016 16256 58648 2822970 6140534 14.3 7.6 569 470 0.2 0.029 0.001 2 0.014 1.32 5.1 0.25 45 464 0.5 49 6.7 9.6 98 107.6 32 3644 14/01/2016 16256 58648 2822970 6140534 14.3 7.6 569 470 0.2 0.029 0.001 2 0.014 1.32 5.1 0.25 45 464 0.5 49 6.7 9.6 98 107.6 32 3644 10/02/2016 16256 58779 2822970 6140534 14.6 6.86 575 470 0.2 0.004 0.001 1.8 0.012 1.24 4.7 0.25 42 464 0.5 46 6.6 8.9 94 102.9 28 3644 10/02/2016 16256 58779 2822970 6140534 14.6 6.86 575 470 0.2 0.004 0.001 1.8 0.012 1.24 4.7 0.25 42 464 0.5 46 6.6 8.9 94 102.9 28 3689 4/05/2016 4325 59601 2821043 6139567 14 603 390 1.1 0.099 0.004 0.7 0.21 0.2 1.55 17.3 26 0.09 0.023 0.19 0.108 390 0.5 29 4.2 6.5 96 102.5 23 3689 4/05/2016 4325 59601 2821043 6139567 14 603 390 1.1 0.099 0.004 0.7 0.21 0.2 1.55 17.3 26 0.09 0.023 0.19 0.108 390 0.5 29 4.2 6.5 96 102.5 23 1628 4/05/2016 16493 59603 2821071 6139155 15.7 617 400 1.61 1.19 0.049 0.022 0.124 0.077 0.24 30 27 0.1 0.021 0.21 0.14 366 0.5 36 3.4 6.5 93 99.5 26 3601 19/02/2016 16126 58951 2821833 6140464 14.8 7.01 375.2 310 0.5 0.039 0.001 0.38 0.25 0.21 2 3.7 25 0.11 305 0.5 21 4 4.9 72 76.9 39 3601 12/04/2016 16126 59595 2821833 6140464 16.7 6.78 401.1 320 0.2 0.01 0.001 0.36 0.24 0.21 1.92 4.6 25 0.11 0.019 0.16 0.051 317 0.5 19.5 4.1 4.4 69 73.4 39 3601 17/03/2016 16126 54747 2821833 6140464 14.5 6.6 376.3 320 0.2 0.008 0.001 0.33 0.164 0.21 1.94 4.1 25 0.13 0.018 0.17 0.052 305 0.5 21 4.2 5 75 80 39 3601 19/01/2016 16126 58665 2821833 6140464 14.9 7.21 370.2 310 0.2 0.006 0.006 0.37 0.054 0.197 1.93 3.5 25 0.11 305 0.5 18.1 3.9 4.6 70 74.6 39 3691 19/02/2016 15035 58952 2822127 6140450 14.6 7.42 393.8 320 0.3 0.016 0.002 0.77 0.164 0.26 2.9 2.3 26 0.11 317 0.5 21 4.7 5.3 74 79.3 42 3691 19/01/2016 15035 58666 2822127 6140450 14.7 7.32 395.6 320 0.2 0.011 0.004 0.76 0.06 0.25 2.6 2.3 25 0.11 317 0.5 18.1 4.7 5.2 72 77.2 44 3691 12/04/2016 15035 59596 2822127 6140450 14.6 6.06 389.5 330 0.3 0.05 0.001 0.72 0.33 0.23 2.6 2 26 0.15 0.018 0.18 0.058 329 0.5 18.8 4.5 4.7 70 74.7 42 3688 12/04/2016 3159 59599 2821896 6140797 14.1 6.54 343 290 0.3 0.001 0.002 0.63 0.25 0.21 1.69 5.1 21 0.1 0.013 0.17 0.054 293 0.5 18.7 4.2 4.4 62 66.4 39 3688 17/03/2016 3159 54748 2821896 6140797 14.1 7.32 342.6 290 0.2 0.003 0.001 0.62 0.198 0.22 1.77 4.9 21 0.13 0.015 0.19 0.055 281 0.5 19.6 4.4 4.8 67 71.8 41 3688 19/02/2016 3159 58957 2821896 6140797 14.3 7.37 359 290 0.2 0.062 0.001 0.71 0.113 0.23 2.1 3.6 21 0.1 293 0.5 21 4.3 4.7 67 71.7 40 3688 19/01/2016 3159 58671 2821896 6140797 14.3 7.3 359.4 290 0.1 0.04 0.003 0.68 0.063 0.21 1.93 4.1 21 0.1 293 0.5 18.3 4.3 4.7 65 69.7 39 3690 19/01/2016 5314 58667 2822851 6140280 14.8 7.42 655 530 0.1 0.004 0.001 1.3 0.53 1.26 6.4 36 55 0.14 451 0.5 47 4.9 9 99 108 14.7 3690 19/01/2016 5314 58667 2822851 6140280 14.8 7.42 655 530 0.1 0.004 0.001 1.3 0.53 1.26 6.4 36 55 0.14 451 0.5 47 4.9 9 99 108 14.7 3690 17/03/2016 5314 54750 2822851 6140280 14.5 7.36 650 540 0.2 0.093 0.001 1.5 0.36 1.35 7.1 36 57 0.22 0.048 0.29 0.162 451 0.5 55 5.2 10.3 108 118.3 12.9 3690 17/03/2016 5314 54750 2822851 6140280 14.5 7.36 650 540 0.2 0.093 0.001 1.5 0.36 1.35 7.1 36 57 0.22 0.048 0.29 0.162 451 0.5 55 5.2 10.3 108 118.3 12.9 3690 19/02/2016 5314 58953 2822851 6140280 14.7 7.49 652 520 0.2 0.119 0.001 1.3 0.006 1.34 7.2 38 58 0.14 451 1.3 54 5.2 9.9 105 114.9 13.9 3690 19/02/2016 5314 58953 2822851 6140280 14.7 7.49 652 520 0.2 0.119 0.001 1.3 0.006 1.34 7.2 38 58 0.14 451 1.3 54 5.2 9.9 105 114.9 13.9 3690 12/04/2016 5314 59597 2822851 6140280 14.5 6.57 819 540 0.2 0.014 0.001 1.4 0.004 1.3 6.7 37 57 0.15 0.047 0.27 0.159 451 0.5 52 5.2 9.5 100 109.5 12.9 3690 12/04/2016 5314 59597 2822851 6140280 14.5 6.57 819 540 0.2 0.014 0.001 1.4 0.004 1.3 6.7 37 57 0.15 0.047 0.27 0.159 451 0.5 52 5.2 9.5 100 109.5 12.9 3561 19/01/2016 54682 2822443 6140265 7.6 581 390 0.99 0.072 13.2 4.8 0.115 0.16 7 36 0.07 329 0.5 41 10.6 4.3 49 53.3 30 3561 19/02/2016 54696 2822443 6140265 18.6 7.5 597 400 1.37 1.18 0.076 14.1 3.9 0.051 0.07 16.6 36 0.08 317 0.5 42 11.3 4.6 52 56.6 31 3561 12/04/2016 54720 2822443 6140265 14.1 7.26 615.9 420 1.26 0.187 0.041 16 3.8 0.051 0.08 27 36 0.08 0.012 0.12 0.047 317 0.5 47 11.9 4.4 49 53.4 25 3561 17/03/2016 54756 2822443 6140265 14.2 7.23 564 390 1.8 1.98 0.069 10.6 3.2 0.04 0.05 29 41 0.09 0.011 0.11 0.042 281 0.5 46 10.1 4.4 50 54.4 29 3686 19/01/2016 54681 2821820 6140380 7.4 603 400 0.003 0.001 17.6 4.8 0.18 0.24 9.3 36 0.07 354 0.5 41 10.5 4.2 47 51.2 28 3686 19/02/2016 54686 2821820 6140380 18.5 7.31 642 430 0.7 0.007 0.011 18 4 0.127 0.16 20 39 0.07 329 0.5 43 12 4.7 53 57.7 27 3686 17/03/2016 54753 2821820 6140380 15.5 6.66 592 430 1.7 0.2 0.048 16.9 3.8 0.064 0.09 30 43 0.08 0.012 0.11 0.048 305 0.5 49 11.7 4.4 49 53.4 28 3686 12/04/2016 54769 2821820 6140380 13.2 7.4 589.5 400 0.84 2.1 0.083 12.4 3.6 0.048 0.07 28 36 0.07 0.011 0.11 0.047 281 0.5 46 12.7 4.5 49 53.5 26

Confidential 2016
GNS Science Consultancy Report 2016/83 27
SiteID Date BoreNo Sample
Easting Northing Cl/Br Cl/I Cl/F Cl/B Na/K Ca/K SO4/Cl SRP/Cl SRP/Br SRP/I SRP/F SRP/B Amrph^silica Aragonite Calcite Chalcedony Gypsum MnHPO4(c) Quartz Rhodochrosite Siderite Vivianite 3692 19/02/2016 16446 58959 2821681 6140209 236 5.3 20.3 0.10 0.006 1.5 -0.40 -2.56 -2.39 0.68 -3.16 1.08 0.96 -3.18 -3.71 -4.93 3692 12/04/2016 16446 59600 2821681 6140209 250 17361 167 446 5.0 19.5 0.42 0.005 1.2 8.3 0.8 2.1 -0.40 -3.35 -3.18 0.69 -2.59 0.48 0.97 -4.05 -11.96 -29.92 3692 19/01/2016 16446 58673 2821681 6140209 236 4.7 19.7 0.08 0.003 0.7 -0.39 -2.90 -2.74 0.70 -3.27 0.69 0.98 -3.47 -3.12 -3.62 3692 17/03/2016 16446 54749 2821681 6140209 217 19174 163 441 5.1 20.0 0.58 0.003 0.6 6.7 0.5 1.3 -0.42 -2.74 -2.57 0.66 -2.42 0.58 0.95 -3.47 -12.38 -31.50 3680 19/01/2016 54684 2823026 6141647 262 6.6 22.0 0.76 0.018 4.8 -0.57 -2.24 -2.07 0.45 -2.19 2.14 0.72 -2.43 -2.73 -1.22 3680 19/01/2016 54684 2823026 6141647 262 6.6 22.0 0.76 0.018 4.8 -0.57 -2.24 -2.07 0.45 -2.19 2.14 0.72 -2.43 -2.73 -1.22 3680 19/02/2016 54685 2823026 6141647 208 5.9 20.8 0.29 0.009 1.8 -0.38 -2.35 -2.19 0.67 -2.76 1.07 0.95 -3.13 -13.68 -34.77 3680 19/02/2016 54685 2823026 6141647 208 5.9 20.8 0.29 0.009 1.8 -0.38 -2.35 -2.19 0.67 -2.76 1.07 0.95 -3.13 -13.68 -34.77 3680 17/03/2016 54758 2823026 6141647 200 7407 183 1048 6.7 26.1 0.20 0.005 1.0 4.1 0.9 5.3 -0.39 -2.94 -2.77 0.69 -2.98 1.11 0.97 -3.21 -13.15 -33.48 3680 17/03/2016 54758 2823026 6141647 200 7407 183 1048 6.7 26.1 0.20 0.005 1.0 4.1 0.9 5.3 -0.39 -2.94 -2.77 0.69 -2.98 1.11 0.97 -3.21 -13.15 -33.48 3680 12/04/2016 54754 2823026 6141647 311 19444 233 1273 7.1 25.5 0.25 0.003 0.8 4.6 0.6 3.4 -0.49 -2.50 -2.33 0.59 -2.77 -0.08 0.87 -3.94 -13.83 -35.98 3680 12/04/2016 54754 2823026 6141647 311 19444 233 1273 7.1 25.5 0.25 0.003 0.8 4.6 0.6 3.4 -0.49 -2.50 -2.33 0.59 -2.77 -0.08 0.87 -3.94 -13.83 -35.98 3673 19/01/2016 54683 2822796 6141750 262 7.0 23.8 0.71 0.015 3.8 -0.57 -2.24 -2.08 0.45 -2.23 1.94 0.72 -2.54 -2.74 -1.43 3673 19/01/2016 54683 2822796 6141750 262 7.0 23.8 0.71 0.015 3.8 -0.57 -2.24 -2.08 0.45 -2.23 1.94 0.72 -2.54 -2.74 -1.43 3673 19/02/2016 54695 2822796 6141750 227 5.8 21.1 0.27 0.009 2.0 -0.38 -2.45 -2.29 0.68 -2.80 1.45 0.96 -2.83 -13.46 -34.04 3673 19/02/2016 54695 2822796 6141750 227 5.8 21.1 0.27 0.009 2.0 -0.38 -2.45 -2.29 0.68 -2.80 1.45 0.96 -2.83 -13.46 -34.04 3673 17/03/2016 54757 2822796 6141750 220 8462 200 1000 7.0 26.7 0.19 0.004 0.9 3.5 0.8 4.1 -0.40 -2.91 -2.75 0.68 -3.02 0.93 0.96 -3.27 -12.97 -33.11 3673 17/03/2016 54757 2822796 6141750 220 8462 200 1000 7.0 26.7 0.19 0.004 0.9 3.5 0.8 4.1 -0.40 -2.91 -2.75 0.68 -3.02 0.93 0.96 -3.27 -12.97 -33.11 3673 12/04/2016 54768 2822796 6141750 333 22371 250 1304 7.1 25.8 0.21 0.002 0.7 4.3 0.5 2.8 -0.47 -2.51 -2.34 0.61 -2.81 0.56 0.90 -3.25 -13.71 -35.75 3673 12/04/2016 54768 2822796 6141750 333 22371 250 1304 7.1 25.8 0.21 0.002 0.7 4.3 0.5 2.8 -0.47 -2.51 -2.34 0.61 -2.81 0.56 0.90 -3.25 -13.71 -35.75 3687 4/05/2016 1492 59602 2821100 6140700 200 20619 200 385 7.7 31.7 1.00 0.004 0.8 8.7 0.8 1.6 -0.58 -2.24 -2.07 0.50 -2.26 0.25 0.78 -3.48 -13.78 -35.90 3644 14/04/2016 16256 59469 2822970 6140534 7.1 14.1 0.01 0.027 -0.48 -3.23 -3.07 0.61 -4.17 2.33 0.89 -3.13 -2.79 -0.48 3644 14/04/2016 16256 59469 2822970 6140534 7.1 14.1 0.01 0.027 -0.48 -3.23 -3.07 0.61 -4.17 2.33 0.89 -3.13 -2.79 -0.48 3644 8/03/2016 16256 59413 2822970 6140534 7.4 14.9 0.01 0.019 -0.47 -2.30 -2.14 0.62 -4.19 2.53 0.90 -2.21 -1.80 2.03 3644 8/03/2016 16256 59413 2822970 6140534 7.4 14.9 0.01 0.019 -0.47 -2.30 -2.14 0.62 -4.19 2.53 0.90 -2.21 -1.80 2.03 3644 19/02/2016 16256 58954 2822970 6140534 275 7.1 15.2 0.01 0.004 1.0 -0.49 -2.30 -2.13 0.60 -3.80 1.77 0.88 -2.18 -1.77 -0.09 3644 19/02/2016 16256 58954 2822970 6140534 275 7.1 15.2 0.01 0.004 1.0 -0.49 -2.30 -2.13 0.60 -3.80 1.77 0.88 -2.18 -1.77 -0.09 3644 19/01/2016 16256 58668 2822970 6140534 293 6.3 14.9 0.01 0.002 0.5 -0.49 -2.38 -2.22 0.60 -4.19 1.45 0.88 -2.29 -1.85 -0.18 3644 19/01/2016 16256 58668 2822970 6140534 293 6.3 14.9 0.01 0.002 0.5 -0.49 -2.38 -2.22 0.60 -4.19 1.45 0.88 -2.29 -1.85 -0.18 3644 17/03/2016 16256 54751 2822970 6140534 247 3922 150 264 7.2 15.2 0.01 0.000 0.1 0.3 0.1 0.1 -0.47 -2.33 -2.17 0.62 -4.17 0.91 0.90 -2.25 -1.91 -1.50 3644 17/03/2016 16256 54751 2822970 6140534 247 3922 150 264 7.2 15.2 0.01 0.000 0.1 0.3 0.1 0.1 -0.47 -2.33 -2.17 0.62 -4.17 0.91 0.90 -2.25 -1.91 -1.50 3644 12/04/2016 16256 59598 2822970 6140534 269 4406 159 270 6.9 15.1 0.01 0.000 0.1 0.3 0.1 0.1 -0.50 -3.27 -3.11 0.59 -4.18 0.44 0.87 -3.17 -2.76 -4.09 3644 12/04/2016 16256 59598 2822970 6140534 269 4406 159 270 6.9 15.1 0.01 0.000 0.1 0.3 0.1 0.1 -0.50 -3.27 -3.11 0.59 -4.18 0.44 0.87 -3.17 -2.76 -4.09 3644 14/01/2016 16256 58648 2822970 6140534 7.3 14.6 0.01 0.000 -0.46 -2.26 -2.09 0.64 -4.17 0.82 0.92 -2.12 -1.79 -1.51 3644 14/01/2016 16256 58648 2822970 6140534 7.3 14.6 0.01 0.000 -0.46 -2.26 -2.09 0.64 -4.17 0.82 0.92 -2.12 -1.79 -1.51 3644 10/02/2016 16256 58779 2822970 6140534 7.0 14.2 0.01 0.000 -0.51 -3.00 -2.83 0.58 -4.18 0.51 0.86 -2.87 -2.55 -3.64 3644 10/02/2016 16256 58779 2822970 6140534 7.0 14.2 0.01 0.000 -0.51 -3.00 -2.83 0.58 -4.18 0.51 0.86 -2.87 -2.55 -3.64 3689 4/05/2016 4325 59601 2821043 6139567 289 12560 137 241 6.9 22.9 0.67 0.008 2.3 9.1 1.1 1.9 -0.60 -2.26 -2.10 0.50 -2.32 1.22 0.78 -2.93 -12.49 -31.19 3689 4/05/2016 4325 59601 2821043 6139567 289 12560 137 241 6.9 22.9 0.67 0.008 2.3 9.1 1.1 1.9 -0.60 -2.26 -2.10 0.50 -2.32 1.22 0.78 -2.93 -12.49 -31.19 1628 4/05/2016 16493 59603 2821071 6139155 270 12857 129 193 10.6 27.4 1.11 0.005 1.2 5.9 0.6 0.9 -0.56 -2.36 -2.19 0.52 -2.10 0.56 0.80 -3.43 -13.25 -33.89 3601 19/02/2016 16126 58951 2821833 6140464 227 5.3 18.0 0.15 0.010 2.3 -0.37 -2.93 -2.77 0.72 -3.06 1.21 1.00 -3.46 -11.72 -28.45 3601 12/04/2016 16126 59595 2821833 6140464 227 12285 156 490 4.8 16.8 0.18 0.010 2.2 13.0 1.5 4.7 -0.39 -3.15 -2.98 0.68 -2.98 1.07 0.96 -3.66 -3.39 -3.55 3601 17/03/2016 16126 54747 2821833 6140464 192 10743 147 481 5.0 17.9 0.16 0.007 1.3 9.2 1.0 3.2 -0.37 -3.33 -3.16 0.72 -3.00 0.78 1.00 -3.87 -3.59 -4.50 3601 19/01/2016 16126 58665 2821833 6140464 227 4.6 17.9 0.14 0.002 0.5 -0.37 -2.74 -2.58 0.72 -3.09 0.60 1.00 -3.28 -2.97 -3.57 3691 19/02/2016 15035 58952 2822127 6140450 236 4.5 15.7 0.09 0.006 1.5 -0.34 -2.52 -2.35 0.75 -3.26 1.25 1.03 -2.96 -2.61 -1.63 3691 19/01/2016 15035 58666 2822127 6140450 227 3.9 15.3 0.09 0.002 0.5 -0.32 -2.63 -2.46 0.77 -3.27 0.77 1.05 -3.08 -2.51 -2.15 3691 12/04/2016 15035 59596 2822127 6140450 173 9472 144 448 4.2 15.6 0.08 0.013 2.2 18.0 1.8 5.7 -0.34 -3.89 -3.72 0.75 -3.33 0.69 1.03 -4.36 -4.38 -6.60 3688 12/04/2016 3159 59599 2821896 6140797 210 16154 124 389 4.5 14.8 0.24 0.012 2.5 19.2 1.5 4.6 -0.37 -3.47 -3.30 0.73 -2.96 0.94 1.01 -3.93 -11.39 -27.53 3688 17/03/2016 3159 54748 2821896 6140797 162 10989 111 382 4.5 15.2 0.23 0.009 1.5 13.5 1.0 3.6 -0.34 -2.66 -2.50 0.75 -2.96 1.25 1.03 -3.14 -3.03 -2.61 3688 19/02/2016 3159 58957 2821896 6140797 210 4.9 15.6 0.17 0.005 1.1 -0.36 -2.61 -2.44 0.74 -3.09 1.04 1.02 -3.06 -2.90 -2.75 3688 19/01/2016 3159 58671 2821896 6140797 210 4.3 15.1 0.20 0.003 0.6 -0.37 -2.69 -2.52 0.73 -3.04 0.73 1.01 -3.17 -2.57 -2.25 3690 19/01/2016 5314 58667 2822851 6140280 393 9.6 20.2 0.65 0.010 3.8 -0.80 -2.44 -2.28 0.29 -2.03 2.32 0.57 -2.33 -1.77 1.79 3690 19/01/2016 5314 58667 2822851 6140280 393 9.6 20.2 0.65 0.010 3.8 -0.80 -2.44 -2.28 0.29 -2.03 2.32 0.57 -2.33 -1.77 1.79 3690 17/03/2016 5314 54750 2822851 6140280 259 5398 197 352 10.6 20.8 0.63 0.006 1.6 7.5 1.2 2.2 -0.85 -2.48 -2.31 0.24 -2.01 2.15 0.52 -2.37 -1.87 1.16 3690 17/03/2016 5314 54750 2822851 6140280 259 5398 197 352 10.6 20.8 0.63 0.006 1.6 7.5 1.2 2.2 -0.85 -2.48 -2.31 0.24 -2.01 2.15 0.52 -2.37 -1.87 1.16 3690 19/02/2016 5314 58953 2822851 6140280 414 10.4 20.2 0.66 0.000 0.0 -0.82 -1.94 -1.77 0.27 -1.99 0.40 0.55 -1.82 -1.33 -2.07 3690 19/02/2016 5314 58953 2822851 6140280 414 10.4 20.2 0.66 0.000 0.0 -0.82 -1.94 -1.77 0.27 -1.99 0.40 0.55 -1.82 -1.33 -2.07 3690 12/04/2016 5314 59597 2822851 6140280 380 8085 211 358 10.0 19.2 0.65 0.000 0.0 0.1 0.0 0.0 -0.85 -3.29 -3.12 0.24 -2.02 -0.15 0.52 -3.16 -2.66 -4.99 3690 12/04/2016 5314 59597 2822851 6140280 380 8085 211 358 10.0 19.2 0.65 0.000 0.0 0.1 0.0 0.0 -0.85 -3.29 -3.12 0.24 -2.02 -0.15 0.52 -3.16 -2.66 -4.99 3561 19/01/2016 54682 2822443 6140265 514 3.9 4.6 0.19 0.133 68.6 -0.60 -2.37 -2.21 0.42 -2.95 2.41 0.69 -3.04 -2.93 0.06 3561 19/02/2016 54696 2822443 6140265 450 3.7 4.6 0.46 0.108 48.8 -0.51 -2.54 -2.38 0.55 -2.55 1.95 0.83 -3.56 -13.72 -32.27 3561 12/04/2016 54720 2822443 6140265 450 38136 300 766 3.9 4.1 0.75 0.106 47.5 322.0 31.7 80.9 -0.56 -2.88 -2.71 0.54 -2.36 1.88 0.82 -3.86 -13.51 -31.44 3561 17/03/2016 54756 2822443 6140265 456 41414 373 976 4.6 5.0 0.71 0.078 35.6 290.9 29.1 76.2 -0.50 -2.90 -2.73 0.60 -2.32 1.69 0.88 -3.99 -13.73 -32.24 3686 19/01/2016 54681 2821820 6140380 514 3.9 4.5 0.26 0.133 68.6 -0.62 -2.59 -2.42 0.39 -2.84 2.57 0.66 -3.04 -2.95 0.12 3686 19/02/2016 54686 2821820 6140380 557 3.6 4.4 0.51 0.103 57.1 -0.57 -2.73 -2.56 0.49 -2.47 2.30 0.77 -3.36 -13.12 -30.35 3686 17/03/2016 54753 2821820 6140380 538 44792 391 896 4.2 4.2 0.70 0.088 47.5 316.7 34.5 79.2 -0.52 -3.46 -3.29 0.56 -2.32 1.67 0.84 -4.34 -13.06 -30.13 3686 12/04/2016 54769 2821820 6140380 514 45512 327 766 3.6 3.9 0.78 0.100 51.4 318.6 32.7 76.6 -0.53 -2.75 -2.58 0.57 -2.34 1.87 0.85 -3.76 -13.66 -31.95

1 Fairway Drive
Avalon
PO Box 30368
Lower Hutt
New Zealand
T +64-4-570 1444
F +64-4-570 4600
Dunedin Research Centre
764 Cumberland Street
Private Bag 1930
Dunedin
New Zealand
T +64-3-477 4050
F +64-3-477 5232
Wairakei Research Centre
114 Karetoto Road
Wairakei
Private Bag 2000, Taupo
New Zealand
T +64-7-374 8211
F +64-7-374 8199
National Isotope Centre
30 Gracefield Road
PO Box 31312
Lower Hutt
New Zealand
T +64-4-570 1444
F +64-4-570 4657
Principal Location
www.gns.cri.nz
Other Locations


