16
1 Q2 2014 Earnings Results Summary July 31, 2014
| Date post: | 23-Jan-2017 |
| Category: |
Investor Relations |
| Upload: | shaen-pd |
| View: | 3,044 times |
| Download: | 0 times |

1
Q2 2014 Earnings Results SummaryJuly 31, 2014
SAFE HARBOR STATEMENT
2
Some of the information in this presentation may contain projections or other forward-looking
statements regarding future events. These statements involve risks and uncertainties, and
actual events or results may differ materially. Among the important factors that could cause
actual results to differ materially from those in the forward-looking statements are the effects of
the highly competitive market in which we operate; our dependence on sales of our capture
devices for substantially all of our revenue; our reliance on third-party suppliers, some of which
are sole-source suppliers, to provide components for our products; the fact that we do not
expect to continue to grow in the future at the same rate as we have in the past, and profitability
in recent periods might not be indicative of future performance; difficulty in accurately predicting
our future customer demand; the importance of maintaining the value and reputation of our
brand; any inability to successfully manage frequent product introductions and transitions; the
effects of international business uncertainties; our reliance on our Chief Executive Officer; and
other factors detailed in the Risk Factors section of the final prospectus that we filed with the
Securities and Exchange Commission in connection with our initial public offering. These
forward-looking statements speak only as of the date hereof or as of the date otherwise stated
herein. GoPro disclaims any obligation to update these forward-looking statements.
Q2 2014 HIGHLIGHTS
3
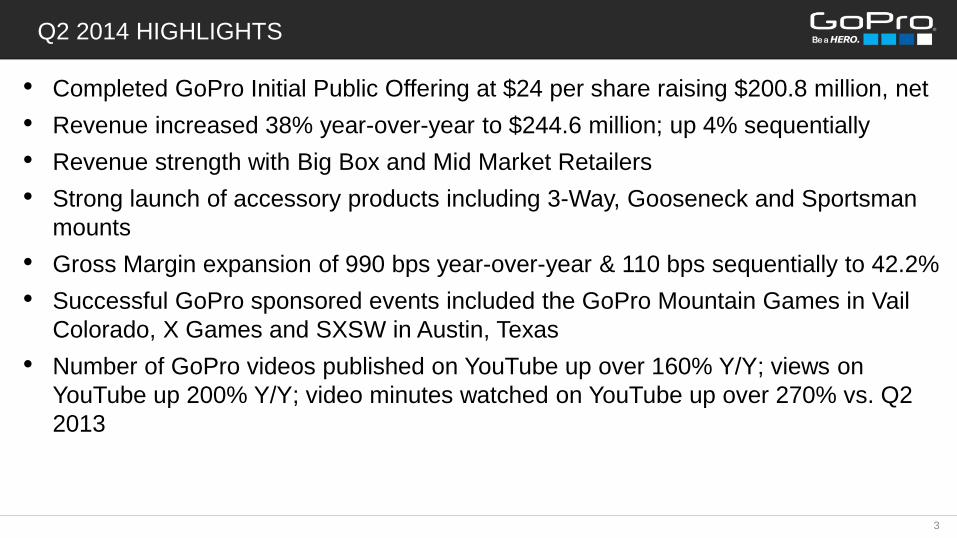
• Completed GoPro Initial Public Offering at $24 per share raising $200.8 million, net
• Revenue increased 38% year-over-year to $244.6 million; up 4% sequentially
• Revenue strength with Big Box and Mid Market Retailers
• Strong launch of accessory products including 3-Way, Gooseneck and Sportsman
mounts
• Gross Margin expansion of 990 bps year-over-year & 110 bps sequentially to 42.2%
• Successful GoPro sponsored events included the GoPro Mountain Games in Vail
Colorado, X Games and SXSW in Austin, Texas
• Number of GoPro videos published on YouTube up over 160% Y/Y; views on
YouTube up 200% Y/Y; video minutes watched on YouTube up over 270% vs. Q2
2013
USE OF NON-GAAP METRICS
4
We report net income or loss and basic and diluted net income or loss per share in accordance
with GAAP, and additionally on a non-GAAP basis, often referred to as pro forma. We believe
that non-GAAP information is useful because it can enhance the understanding of our ongoing
economic performance. We use non-GAAP reporting internally to evaluate and manage our
operations. We have chosen to provide this information to investors to enable them to perform
comparisons of operating results in a manner similar to how we analyze our own operating
results.
A full reconciliation of GAAP to non-GAAP financial data can be found in the appendix to this
slide package and in our Q2 2014 earnings press release issued on July 31, 2014, which
should be reviewed in conjunction with this presentation.
NON-GAAP INCOME STATEMENT SUMMARY
5
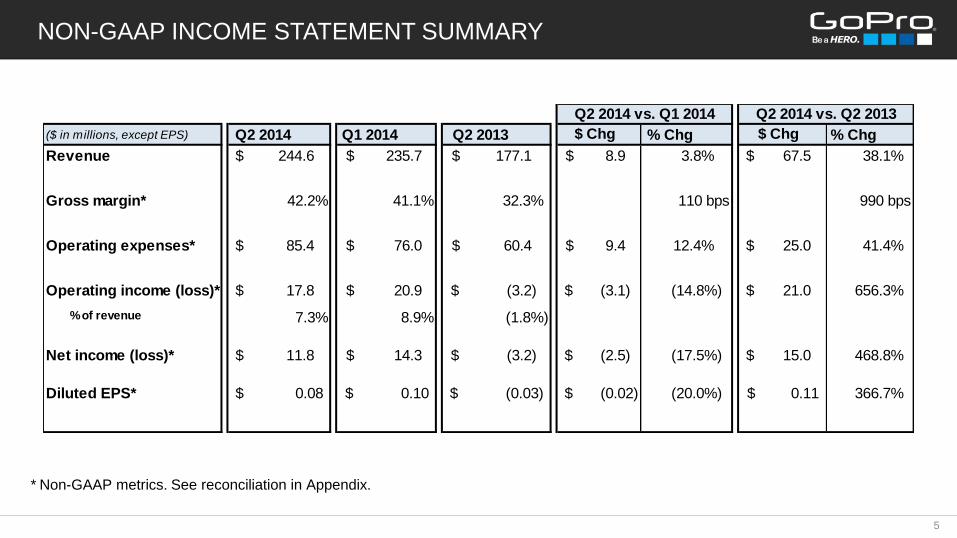
* Non-GAAP metrics. See reconciliation in Appendix.
($ in millions, except EPS) $ Chg $ Chg
Revenue 244.6$ 235.7$ 177.1$ 8.9$ 3.8% 67.5$ 38.1%
Gross margin*
Operating expenses* 85.4$ 76.0$ 60.4$ 9.4$ 12.4% 25.0$ 41.4%
Operating income (loss)* 17.8$ 20.9$ (3.2)$ (3.1)$ 21.0$ 656.3%
% of revenue
Net income (loss)* 11.8$ 14.3$ (3.2)$ (2.5)$ 15.0$ 468.8%
Diluted EPS* 366.7%
Q2 2014 vs. Q2 2013
% ChgQ2 2014 Q1 2014 Q2 2013
Q2 2014 vs. Q1 2014
% Chg
990 bps32.3%
(1.8%)
0.08$ 0.10$ (0.03)$
110 bps
(14.8%)
(17.5%)
(20.0%)
42.2%
7.3% 8.9%
41.1%
(0.02)$ 0.11$
REVENUE METRICS
6
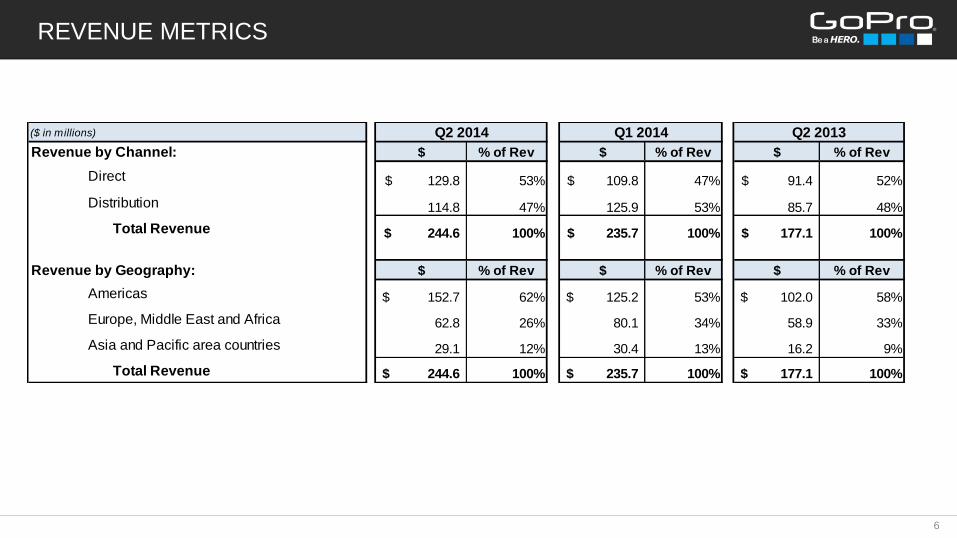
($ in millions)
Revenue by Channel: $ % of Rev $ % of Rev $ % of Rev
Direct 129.8$ 53% 109.8$ 47% 91.4$ 52%
Distribution 114.8 47% 125.9 53% 85.7 48%
Total Revenue 244.6$ 100% 235.7$ 100% 177.1$ 100%
Revenue by Geography: $ % of Rev $ % of Rev $ % of Rev
Americas 152.7$ 62% 125.2$ 53% 102.0$ 58%
Europe, Middle East and Africa 62.8 26% 80.1 34% 58.9 33%
Asia and Pacific area countries 29.1 12% 30.4 13% 16.2 9%
Total Revenue 244.6$ 100% 235.7$ 100% 177.1$ 100%
Q1 2014Q2 2014 Q2 2013
OTHER METRICS
7
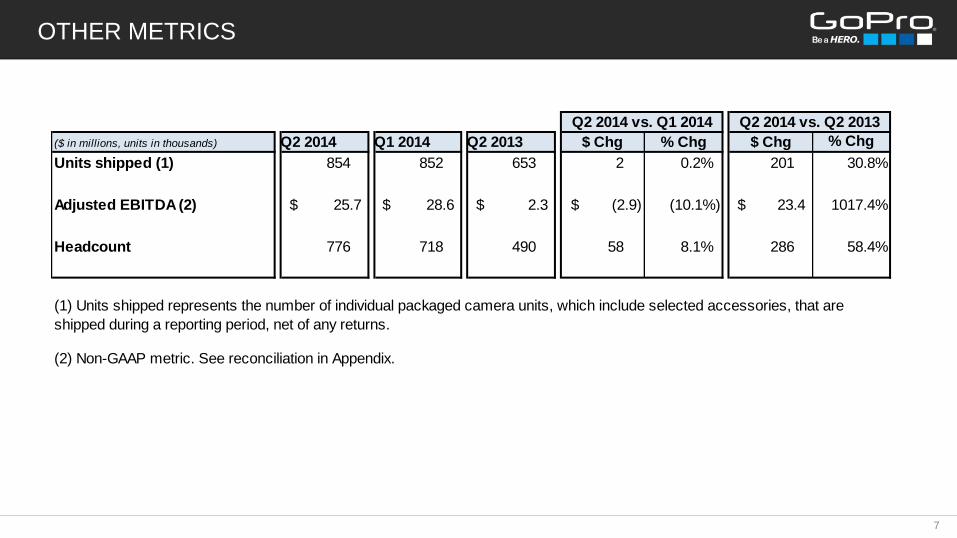
($ in millions, units in thousands) % Chg
Units shipped (1) 854 852 653 2 0.2% 201 30.8%
Adjusted EBITDA (2) 1017.4%
Headcount 776 718 490 58 8.1% 286 58.4%
23.4$
$ Chg
Q2 2014 vs. Q2 2013
(2) Non-GAAP metric. See reconciliation in Appendix.
25.7$
Q2 2014
28.6$
Q1 2014
2.3$
Q2 2013
(2.9)$
Q2 2014 vs. Q1 2014
$ Chg % Chg
(10.1%)
(1) Units shipped represents the number of individual packaged camera units, which include selected accessories, that are
shipped during a reporting period, net of any returns.
SELECTED BALANCE SHEET METRICS
8
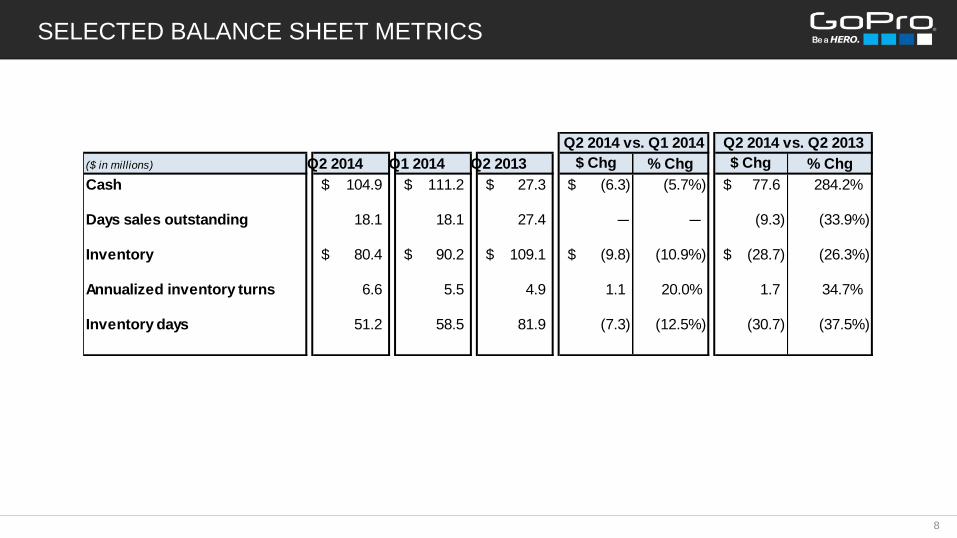
($ in millions) Q2 2014 Q1 2014 Q2 2013 $ Chg $ Chg
Cash 104.9$ 111.2$ 27.3$ (6.3)$ 77.6$ 284.2%
Days sales outstanding 18.1 18.1 27.4 ― ― (9.3)
Inventory 80.4$ 90.2$ 109.1$ (9.8)$ (28.7)$
Annualized inventory turns 6.6 5.5 4.9 1.1 20.0% 1.7 34.7%
Inventory days 51.2 58.5 81.9 (7.3) (30.7)
(10.9%)
(12.5%) (37.5%)
Q2 2014 vs. Q1 2014
% Chg
Q2 2014 vs. Q2 2013
(5.7%)
(33.9%)
% Chg
(26.3%)
APPENDIX: GAAP TO NON-GAAP RECONCILIATION
9
● the comparability of our on-going operating results over the periods presented;
● the ability to identify trends in our underlying business; and
●
To supplement our unaudited selected financial data presented on a basis consistent with Generally Accepted Accounting Principles, or
GAAP, we disclose certain non-GAAP financial measures, including non-GAAP gross profit, operating expenses, operating income (loss), net
income (loss), earnings (loss) per share and adjusted EBITDA. These non-GAAP measures are not in accordance with, nor serve as an
alternative for GAAP. We believe that these non-GAAP measures have limitations in that they do not reflect all of the amounts associated with
our GAAP results of operations. These non-GAAP measures should only be viewed in conjunction with corresponding GAAP measures.
In calculating non-GAAP financial measures, we exclude certain items to facilitate a review of the comparability of our core operating
performance on a period-to-period basis. The excluded items represent stock-based compensation and charges that are primarily driven by
discrete events that we do not consider to be directly related to core operating performance. We use non-GAAP measures to evaluate the core
operating performance of our business, for comparison with forecasts and strategic plans and for calculating return on investment. In addition,
management’s incentive compensation is determined using non-GAAP measures. Since we find these measures to be useful, we believe that
investors benefit from seeing results reviewed by management in addition to seeing GAAP results. We believe that these non-GAAP measures,
when read in conjunction with our GAAP financials, provide useful information to investors by facilitating:
the comparison of our operating results against analyst financial models and operating results of other public companies that
supplement their GAAP results with non-GAAP financial measures.
APPENDIX: GAAP TO NON-GAAP RECONCILIATION
10
The following are explanations of each type of adjustment that we incorporate into non-GAAP financial measures:
●
●
●
●
Acquisition-related charges include the amortization of acquired intangible assets primarily consisting of acquired technology,
customer relationships, tradenames and covenants not to compete related to our acquisitions. These charges are not factored into
our evaluation of potential acquisitions, or of our performance after completion of acquisitions, because they are not related to our
core operating performance, and the frequency and amount of such charges vary significantly based on the timing and magnitude of
our acquisition transactions and the maturities of the businesses being acquired.
Adjustment for taxes relates to the tax effect of the adjustments that we incorporate into non-GAAP measures in order to provide a
more meaningful measure of non-GAAP net income. We believe that these adjustments provide us with the ability to more clearly
view trends in our core operating performance.
Adjustment to shares includes the conversion of the redeemable convertible preferred stock into shares of common stock as though
the conversion had occurred at the beginning of the period, the initial public offering shares issued July 2014, as if they had been
outstanding since the beginning of the period, and the addition of all dilutive awards outstanding that were excluded from the GAAP
diluted earnings per share calculation because they were anti-dilutive as a result of our net loss position.
Stock-based compensation expense relates to equity awards granted primarily to our workforce. We exclude stock-based
compensation expense because we believe that the non-GAAP financial measures excluding this item provide meaningful
supplemental information regarding operational performance. In particular, we note that companies calculate stock-based
compensation expense for the variety of award types that they employ using of different valuation methodologies and subjective
assumptions. These non-cash charges are not factored into our internal evaluation of net income as we believe their inclusion would
hinder our ability to assess core operational performance. We believe that excluding this expense provides greater visibility to the
underlying performance of our business operations, facilitates comparison of our results with other periods, and may also facilitate
comparison with the results of other companies in our industry.
APPENDIX: GAAP TO NON-GAAP RECONCILIATION
11
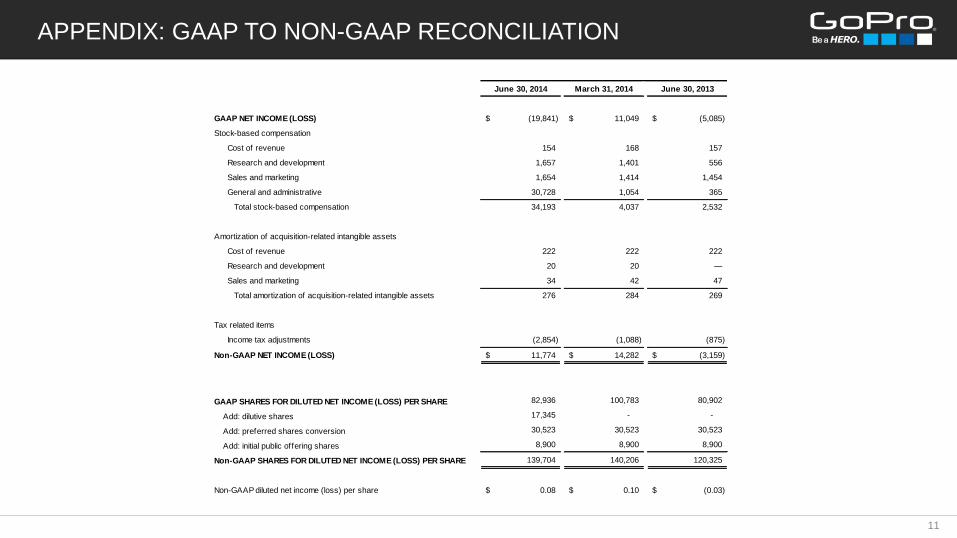
June 30, 2014 March 31, 2014 June 30, 2013
GAAP NET INCOME (LOSS) (19,841)$ 11,049$ (5,085)$
Stock-based compensation
Cost of revenue 154 168 157
Research and development 1,657 1,401 556
Sales and marketing 1,654 1,414 1,454
General and administrative 30,728 1,054 365
Total stock-based compensation 34,193 4,037 2,532
Amortization of acquisition-related intangible assets
Cost of revenue 222 222 222
Research and development 20 20 —
Sales and marketing 34 42 47
Total amortization of acquisition-related intangible assets 276 284 269
Tax related items
Income tax adjustments (2,854) (1,088) (875)
Non-GAAP NET INCOME (LOSS) 11,774$ 14,282$ (3,159)$
GAAP SHARES FOR DILUTED NET INCOME (LOSS) PER SHARE 82,936 100,783 80,902
Add: dilutive shares 17,345 - -
Add: preferred shares conversion 30,523 30,523 30,523
Add: initial public offering shares 8,900 8,900 8,900
Non-GAAP SHARES FOR DILUTED NET INCOME (LOSS) PER SHARE 139,704 140,206 120,325
Non-GAAP diluted net income (loss) per share 0.08$ 0.10$ (0.03)$
APPENDIX: GAAP TO NON-GAAP RECONCILIATION
12
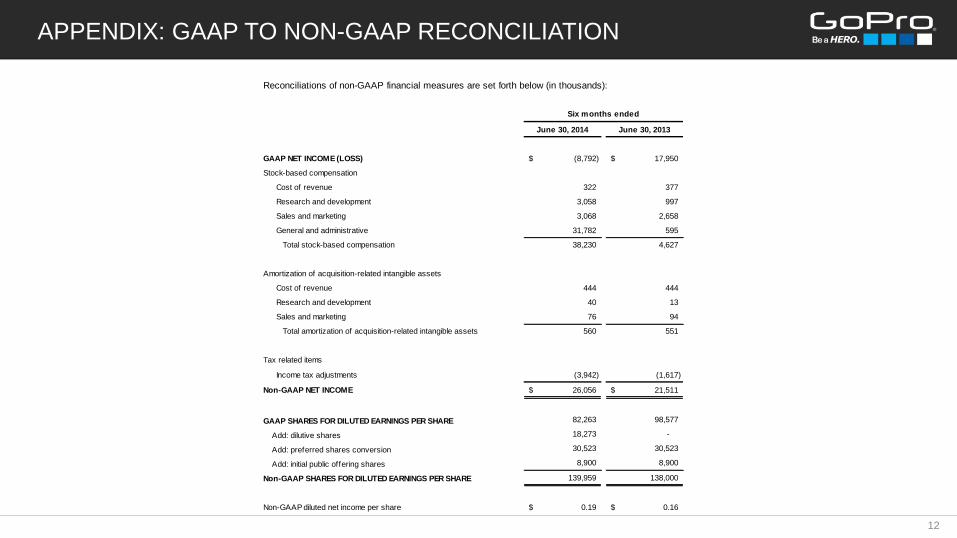
Reconciliations of non-GAAP financial measures are set forth below (in thousands):
June 30, 2014 June 30, 2013
GAAP NET INCOME (LOSS) (8,792)$ 17,950$
Stock-based compensation
Cost of revenue 322 377
Research and development 3,058 997
Sales and marketing 3,068 2,658
General and administrative 31,782 595
Total stock-based compensation 38,230 4,627
Amortization of acquisition-related intangible assets
Cost of revenue 444 444
Research and development 40 13
Sales and marketing 76 94
Total amortization of acquisition-related intangible assets 560 551
Tax related items
Income tax adjustments (3,942) (1,617)
Non-GAAP NET INCOME 26,056$ 21,511$
GAAP SHARES FOR DILUTED EARNINGS PER SHARE 82,263 98,577
Add: dilutive shares 18,273 -
Add: preferred shares conversion 30,523 30,523
Add: initial public offering shares 8,900 8,900
Non-GAAP SHARES FOR DILUTED EARNINGS PER SHARE 139,959 138,000
Non-GAAP diluted net income per share 0.19$ 0.16$
Six months ended
APPENDIX: GAAP TO NON-GAAP RECONCILIATION
13
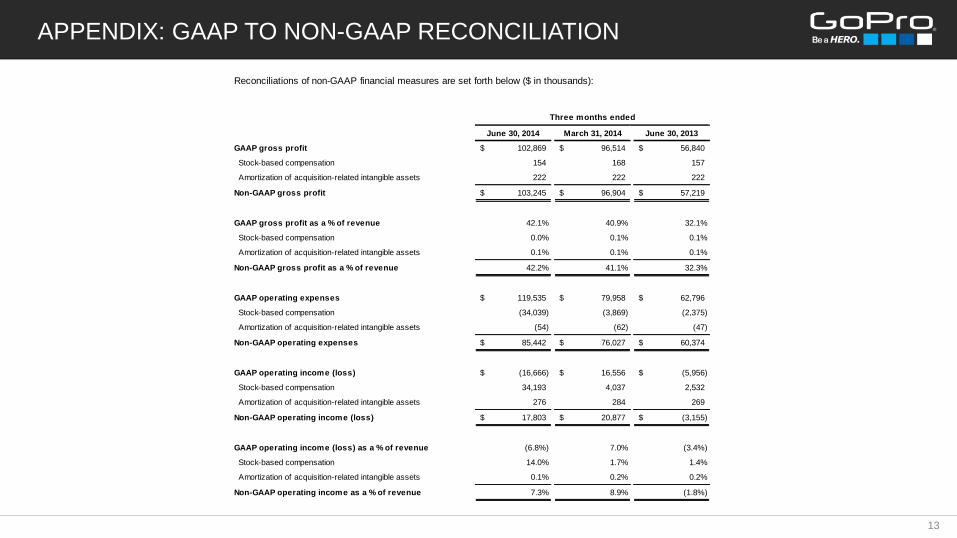
June 30, 2014 March 31, 2014 June 30, 2013
GAAP gross profit 102,869$ 96,514$ 56,840$
Stock-based compensation 154 168 157
Amortization of acquisition-related intangible assets 222 222 222
Non-GAAP gross profit 103,245$ 96,904$ 57,219$
GAAP gross profit as a % of revenue 42.1% 40.9% 32.1%
Stock-based compensation 0.0% 0.1% 0.1%
Amortization of acquisition-related intangible assets 0.1% 0.1% 0.1%
Non-GAAP gross profit as a % of revenue 42.2% 41.1% 32.3%
GAAP operating expenses 119,535$ 79,958$ 62,796$
Stock-based compensation (34,039) (3,869) (2,375)
Amortization of acquisition-related intangible assets (54) (62) (47)
Non-GAAP operating expenses 85,442$ 76,027$ 60,374$
GAAP operating income (loss) (16,666)$ 16,556$ (5,956)$
Stock-based compensation 34,193 4,037 2,532
Amortization of acquisition-related intangible assets 276 284 269
Non-GAAP operating income (loss) 17,803$ 20,877$ (3,155)$
GAAP operating income (loss) as a % of revenue (6.8%) 7.0% (3.4%)
Stock-based compensation 14.0% 1.7% 1.4%
Amortization of acquisition-related intangible assets 0.1% 0.2% 0.2%
Non-GAAP operating income as a % of revenue 7.3% 8.9% (1.8%)
Three months ended
Reconciliations of non-GAAP financial measures are set forth below ($ in thousands):
APPENDIX: GAAP TO NON-GAAP RECONCILIATION
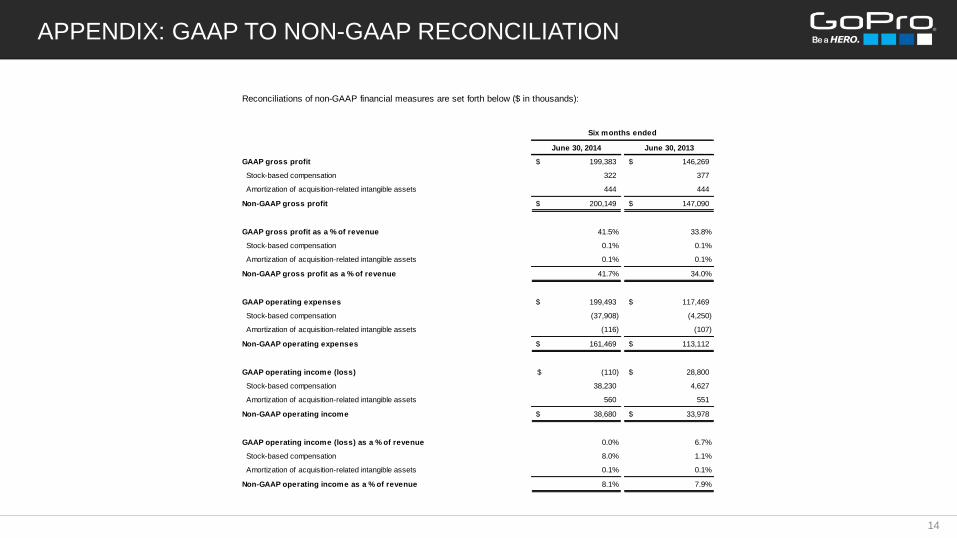
14
June 30, 2014 June 30, 2013
GAAP gross profit 199,383$ 146,269$
Stock-based compensation 322 377
Amortization of acquisition-related intangible assets 444 444
Non-GAAP gross profit 200,149$ 147,090$
GAAP gross profit as a % of revenue 41.5% 33.8%
Stock-based compensation 0.1% 0.1%
Amortization of acquisition-related intangible assets 0.1% 0.1%
Non-GAAP gross profit as a % of revenue 41.7% 34.0%
GAAP operating expenses 199,493$ 117,469$
Stock-based compensation (37,908) (4,250)
Amortization of acquisition-related intangible assets (116) (107)
Non-GAAP operating expenses 161,469$ 113,112$
GAAP operating income (loss) (110)$ 28,800$
Stock-based compensation 38,230 4,627
Amortization of acquisition-related intangible assets 560 551
Non-GAAP operating income 38,680$ 33,978$
GAAP operating income (loss) as a % of revenue 0.0% 6.7%
Stock-based compensation 8.0% 1.1%
Amortization of acquisition-related intangible assets 0.1% 0.1%
Non-GAAP operating income as a % of revenue 8.1% 7.9%
Six months ended
Reconciliations of non-GAAP financial measures are set forth below ($ in thousands):
APPENDIX: ADJUSTED EBITDA RECONCILIATION
15
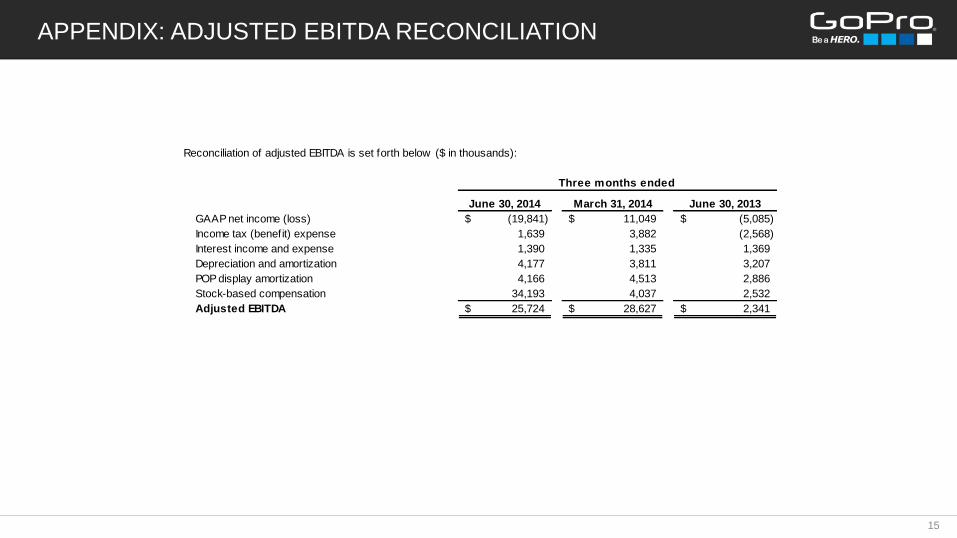
Reconciliation of adjusted EBITDA is set forth below ($ in thousands):
June 30, 2014 March 31, 2014 June 30, 2013
GAAP net income (loss) (19,841)$ 11,049$ (5,085)$
Income tax (benefit) expense 1,639 3,882 (2,568)
Interest income and expense 1,390 1,335 1,369
Depreciation and amortization 4,177 3,811 3,207
POP display amortization 4,166 4,513 2,886
Stock-based compensation 34,193 4,037 2,532
Adjusted EBITDA 25,724$ 28,627$ 2,341$
Three months ended
APPENDIX: ADJUSTED EBITDA RECONCILIATION
16
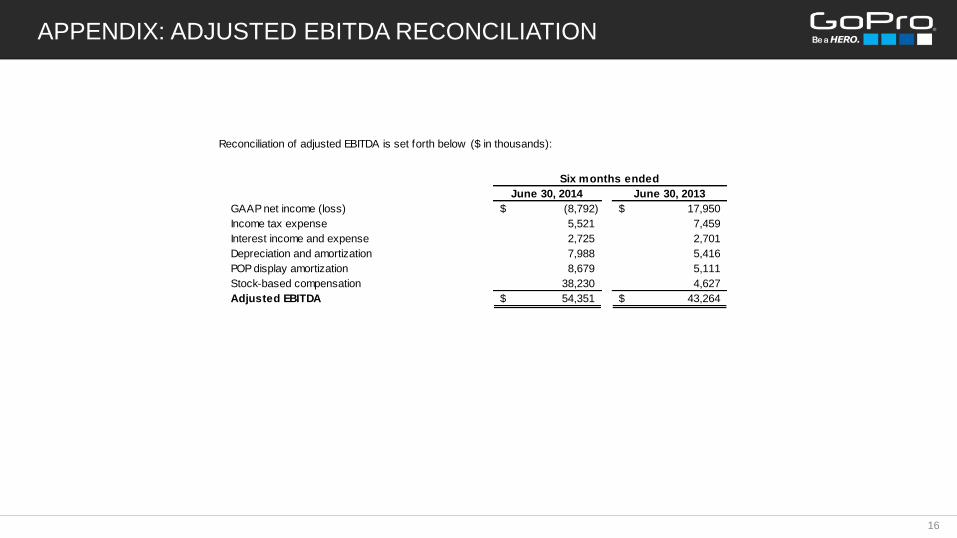
Reconciliation of adjusted EBITDA is set forth below ($ in thousands):
June 30, 2014 June 30, 2013
GAAP net income (loss) (8,792)$ 17,950$
Income tax expense 5,521 7,459
Interest income and expense 2,725 2,701
Depreciation and amortization 7,988 5,416
POP display amortization 8,679 5,111
Stock-based compensation 38,230 4,627
Adjusted EBITDA 54,351$ 43,264$
Six months ended


