Increase sales by having the right product portfolio for every customer How can I identify which products are trending in my market? Microsoft Cloud Hosted Project Architecture Azure SQL Data Warehouse, Azure Machine Learning, Azure Storage, Azure Data Factory, Power BI, HD Insight How do I optimize our shelf space for maximum revenue? Optimize Sales with Actionable Insights GOAL: SKU Max Inventory Optimization Solution Overview Webinar Neal Analytics Retail IQ Speaker: David McClellan, Practice Director March 2 nd , 2017
Transcript
Increase sales by having the right product portfolio for every customer
How can I identify which products
are trending in my market?
Microsoft Cloud Hosted Project Architecture
Azure SQL Data Warehouse, Azure Machine Learning, Azure
Storage, Azure Data Factory, Power BI, HD Insight
How do I optimize our shelf
space for maximum revenue?
Optimize Sales with Actionable Insights
GOAL:SKU Max Inventory OptimizationSolution Overview Webinar
Neal Analytics Retail IQ
Speaker: David McClellan, Practice Director
March 2nd, 2017
Our VisionBuild a Global Advanced Analytics
business focused on Microsoft’s
data technologies and
opportunistically spin off data-
enabled SaaS applications.
Our MissionEnable commercial and public
entities saddled with rudimentary
analytical techniques today, with
rigorous and ROI-focused end to
end data and analytics capabilities
Our CompanyWe are fast-growing, Seattle-based
Systems Integrator with over 50
employees, including data
engineers and scientists who have
helped dozens of customers
improve their businesses. We were
founded in 2011.
Industry AlignmentOur objective is to make analytics
accessible to institutions of all
sizes across our verticals. Our team
specializes in creation of analytical
practices to help companies grow
and scale.
PartnershipWe are a Microsoft partner that
develops solutions on using the
MSFT Data Insights platform,
including the Cortana Intelligence
Suite and the Azure IoT Suite.
SolutionsWe have a variety of solutions
available in the Retail, Energy,
Manufacturing, and Education
spaces, including inventory
optimization, advanced demand
forecasting, predictive maintenance,
quality optimization and many more
CEO, Co-Founder• Principal Consultant, The Arnold
Group
• Consultant, Booz Allen Hamilton
• MBA, Northwestern - Kellogg
VP Sales• Dir Enterprise Sales at Extended
Results – acquired by Tibco
• IBM, Software Sales
• MIS, Univ. of South Florida
BOD, Co-Founder• Partner, The Arnold Group
• Principal, Booz Allen Hamilton
• MBA, MIT – Sloan School
Practice Director• BS, Bioengineering − UC Berkeley
• MBA, Georgia Tech
• MS, Mechanical Engineering −
Georgia Tech
BOD, Advisor• CVP, Microsoft EPG
• MSc, Univ. College of London
Practice Director• MBA Big Data Analytics,
Washington State University
• BA Operations Management,
Washington State University
Dylan Dias Greg Gomez
Carl Albrecht Zach Perkel
Simon Witts David McClellan
+ Partners at The Arnold Group (Michael Spencer and Jim Neuburger)
Board
of
Dir
ect
ors
INNOVATORSRevenue: +6%
Profitability: -11%
Market Value: -12%
DIGITAL MASTERSRevenue: +9%
Profitability: +26%
Market Value: +12%
Revenue: -4%
Profitability: -11%
Market Value: -7%
BEGINNER
Revenue: -10%
Profitability: +9%
Market Value: +7%
CONSERVATIVE
+9%
Revenue
Creation
+12%
Market
Valuation
Dig
ital C
ap
ab
ilit
y
Leadership Capability
Source: MIT/Sloan “How digital leaders outperform their peers in every industry”
“Digital masters generate 9% more revenues with their employees and physical assets and, on an average, are 26% more profitable
than their industry competitors”
+26%
Profitability
The rise of digital
The pace of change has surpassed all prior
shifts in the nature of an industry – and the
move to digital shows no signs of stopping:
Consumer spending on household goods and services is expected to rise by an annual average of 8.5% in Asia over the next five years.
Major players will shift their focus more towards Asia as digital spending continues to rise.
The changing face of the consumer
Dominant forces that will drive change in
consumer landscape over next few years:
Urbanization
Digital-first
consumers
Aging
population
Shrinking
household size
Middle-class
explosion
Women in
workplace
growth rate in online
sales every year18%
The blurring of boundaries between consumers, stores, and brands
annual increase in online
grocery shopping9.5%
of brand purchase decisions
are made at home18%
Analytics DirectorField SellerMerchandising Director COO Sales Director
I want products to delight customers, but we
lack up-to-date SKU and trend information
I want technology to be a growth engine for the
business, but legacy systems hold me back
I need to be able to meet demand anywhere, on any channel, but I’m hindered by disconnected processes
Providing more personalized, relevant offers to clients would
require mobile analytics that I don’t have
Keeping up with rapidly changing customer preferences
feels out of reach with my current forecast methods
18.5%growth in the number of SKUs stored in distribution centers in 20154
1.5%increase in US manufacturers’ and trade inventories from 2015-20163
143%of inventory per total sales is the amount of stock US retailers are sitting on1
44%of CPGs don’t have adequate resources to interpret analytics outputs2
DELIVER IMMEDIATE BUSINESS VALUE THROUGH ADVANCED ANALYTICS
REDUCE EXCESS INVENTORY AND MATCH PRODUCTS WITH EACH MARKET
BUILD ANALYTICS INTO OPERATIONS
Tap into Microsoft Azure’s
Cloud Analytics Capabilities
Without Worrying About
Integration and Operations
Leverage Proven Modeling
Techniques for Immediate
Operational Business Value
Ensure Each and Every Outlet has
the Best Portfolio of Products to
Maximize Sales and Profit
We’re offering our customers more choices
than ever, yet our sales don’t show it!
Could we be missing sales opportunities as
often as we’re gaining them?
My team has every tool, report, and analysis
they could ask for, but we can’t keep up with
ever evolving market demands!
Despite our best efforts, our SKU portfolios are
often out of date, generic, or just not a good fit
and I know we can do better.
To start, we need an effective way to get our
analytics insights into the hands of operations
so they can make a difference!
This allows us to meld the experience of our
account specialists with insights from
advanced data science modeling
SKU Max Inventory Optimization attacks the problem from a
different perspective by asking the question-
Which SKUs are responsible for above average sales performance?
My competitor is selling a whole
bunch of widgets, I should carry
them too!
Some Retailers have SKUs with limited shelf lives before they
are upgraded, but that’s OK because we can analyze the
characteristics of products to see what’s trending and order
new products that meet those new customer needs.
Looks like last year’s Chardonnay vintage is gone, but I
found this year’s edition from the same winery
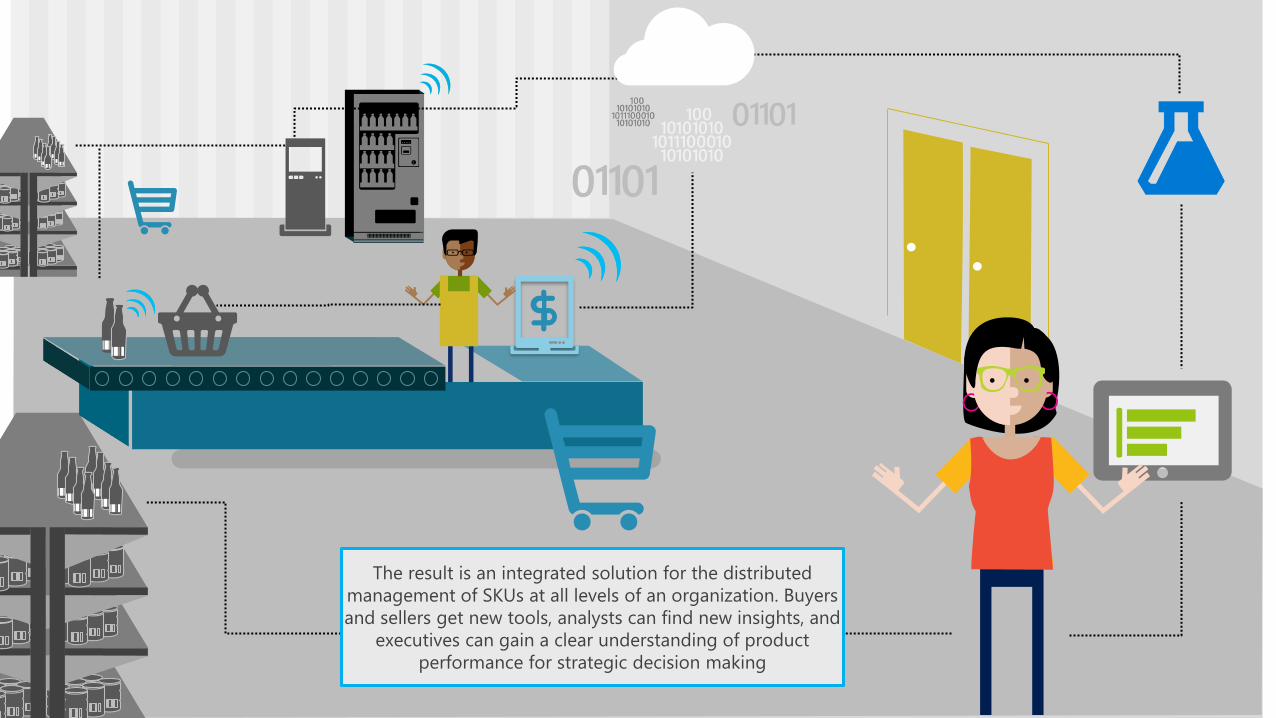
The result is an integrated solution for the distributed
management of SKUs at all levels of an organization. Buyers
and sellers get new tools, analysts can find new insights, and
executives can gain a clear understanding of product
performance for strategic decision making
80% of Sales in
112 SKUs out of
784 SKUs
90% of Sales in
the top 40 SKUs
out of 271
80% of Sales in
the top 122 SKUs
out of 727
80-90% of
SKUs generate
nominal sales
volume
Even when filtered
to only Core SKUs,
sales are still very
skewed!
Sales Distribution by SKUs
Undersold SKUs:
Low Distribution, High Performing SKUs
Unprofitable SKUs:
Low Distribution, Low Performing SKUs
Core SKUs:
Widely Distributed, High Volume SKUs
Winning SKUs:
Moderate Distribution, High Performing SKUs
Core SKUs:
Winning SKUs:
Undersold SKUs:
Unprofitable SKUs:
Four SKU
Categories
80% of Sales Occur in the
Top 10-20% of SKUs.
These are the Core
SKUs. We use models to
find the rest!
High Volume Low Volume High Revenue Low Revenue
Unprofitable SKUs:SKUs that are underperforming and have low revenue/volume. They can likely be removed
Undersold SKUs: SKUs that significantly increase sales when present, but have low penetration and are crying out to be distributed more
Winning SKUs: SKUs that are excellent performers in every market they are present, and penetration should be further increased
Core SKUs:High volume, commonplace SKUs that have marginal sales lift but should not be replaced
SKU Effects on Weekly Sales Per Store
Undersold
SKUsCore SKUsCore SKUsCore SKUsCore SKUsCore SKUs
Unprofitable
SKU
Winning
SKUs
Winning
SKUs
Winning
SKUs
Winning
SKUs
Example SKU Portfolio for Large Convenience Stores in California
Winning
SKUs
Core SKUs
…It is common to optimize
SKUs using sales analysis and
Business Intelligence,
…It is common to optimize
SKUs using sales analysis and
Business Intelligence,
but many SKU portfolios are
too large and complex to be
effectively managed using
traditional methods,
…It is common to optimize
SKUs using sales analysis and
Business Intelligence,
but many SKU portfolios are
too large and complex to be
effectively managed using
traditional methods,
so we segment sales outlets
using a variety of traits, then
use Machine Learning to
measure SKU performance
All
Sales
Data
Territory
B
GroceryLarge
Outlet
Sales Data for
Large Grocers in
Territory B Machine Learning Model
Ordered List of the
Best and Worst SKUs
for Large Grocers in
Territory B
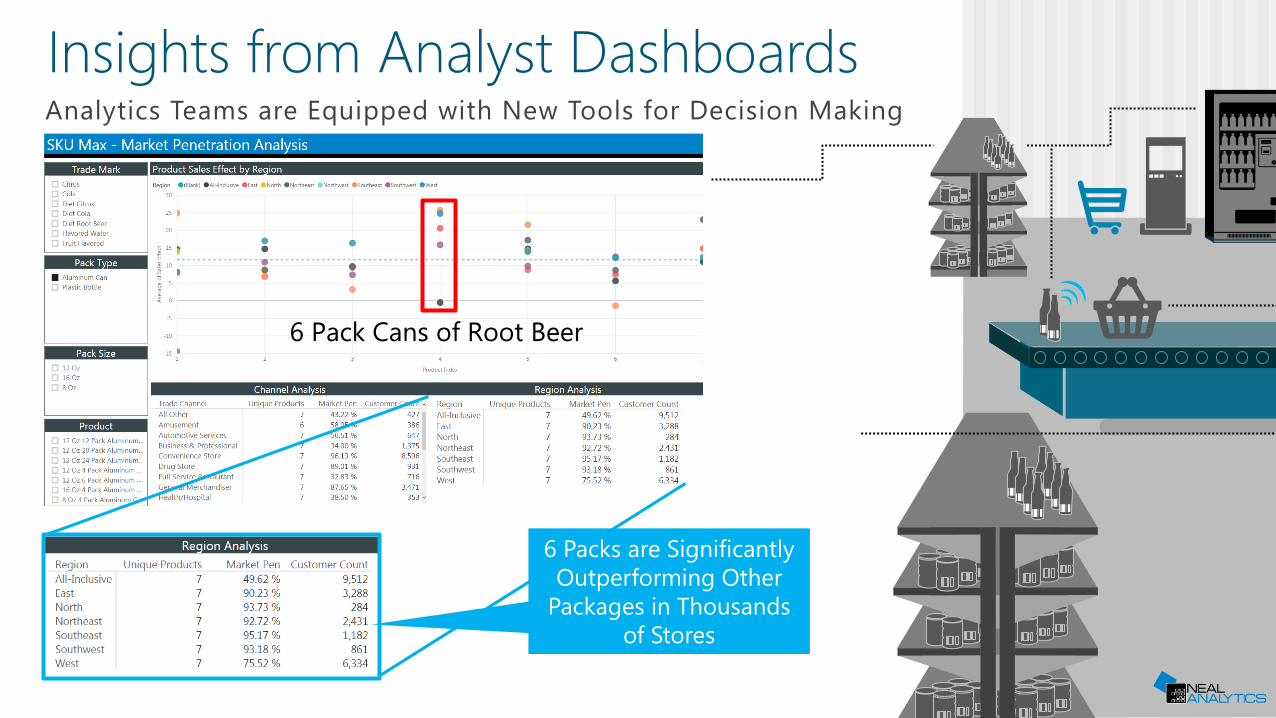
6 Pack Cans of Root Beer
6 Packs are Significantly
Outperforming Other
Packages in Thousands
of Stores
Now that the buyer knows which product attributes are
trending, they can work with their suppliers to order
products that meet the criteria
Product with the some of
the top performing
attributes in that product
segment
This product has some of
the top performing
attributes in that product
segment
Low performer SKUs are ideal removal candidates
These SKUs may just be a bad fit for customer
preferences in that market, and are better stocked
elsewhere or less frequently.
Each Seller is Equipped with a New Tool to Encourage Sales
Quickly identify top performing SKUs
The dashboard provides an ordered list of the
average effect on weekly sales for each SKU
across the stores in each sales outlet group.
Know exactly which good SKUs are missing
The seller can quickly identify which SKUs are
good candidates to replace underperforming
products on the shelf.
The customers for each day are easily selected
With dashboards refreshed each day, the seller
need only select from among the customers
they are going to visit that day. (IDs are used
here for anonymity)
1
2
3
4
3
4
1 2These SKUs can be
replaced to better
tailor products to each
outlet’s customer
preferences
The SKU Sales Effect shows
the average impact on weekly
sales if that product is
stocked and selling normally
Weekly Sales Effects
Every attribute combo provides an estimated sales
impact if SKUs with those attributes are sold in the
store, identifying winners, losers, and indicating
recommended purchase volumes
Retail Buyers Can Quickly Identify Trending Products to Order
Quickly Analyze Each Market and Department
The dashboard equips buyers with the ability to
drill into each market or product segment with
tailored Machine Learning recommendations.
Identify Optimal Product Attribute Combos
SKUs in Retail may come and go, but by
analyzing product attribute combinations, we
sequence the DNA of successful products so
new items with trending DNA can be ordered.
The Best Products Drive Recommended Buys
Successful products have common attributes,
which can be grouped and modeled against
other groups over time, recommending what is
trending in a given market or department
1
2
3
4
3 4
1
2
Buyers can work with
merchandisers to
order more trending
products and allocate
spend more effectively
In each department, the
best attribute combos
are recommended for
future procurement
Phil, a beverage Sales Associate, wants to improve his sales by ensuring that
every product he stocks is a good fit for his customers and maximizes their sales1
Phil sees that 1L energy drink bottles are under performing, so he
works with the customer to make the change3
Phil looks at the SKU Optimization dashboard on his tablet, and identifies
that this customer is not carrying Cola 1L bottles, which are very popular in
this customer segment.
2
How can we ensure SKU recommendations are valid,
logical, and likely to improve sales?Authorized SKU
Lists
High/Low
Volume
Products
On Shelf
Currently or Not
Above/Below
Average SKU
Effects
Limit to Certain
SKU Groups
Try the SKU Max sandbox today at AppSource.com
SKU Max Deployment Options
No Cost Trial
• Send us a sample of your data which
contains:
• 1 year or less weekly sales data
in one market or product group
you would like to analyze
• Relevant SKU dimension data
• Anonymized customer data
• We will provide some initial visuals
similar to those seen today using
your data
• Our team is available to walk you
through the data requirements on a
call should you require assistance
• Sample data specifications available
on AppSource
Deployment Call
• Neal Analytics data scientists and
engineers will participate in a call to
gather the necessary configuration
information from your business
stakeholders and IT department
• Neal Analytics will spin up the
solution in a base configuration
using the parameters you have
provided, either on a Neal managed
Azure instance or on your internal
subscription
• We will meet with your stakeholders
to present the initial results and
recommend any customizations (if
necessary) to increase business value
Configuration Workshop
• For customers that require significant
customization or assistance with the
data engineering required to
operationalize the solution, we offer a
workshop where our expert
consultants will scope the effort
required and guide your team
• Additional customizations, app
development, and new functionality
are handled as consulting hours
• Neal experts will provide insights and
knowledge transfer to your teams to
develop the internal analytics
capabilities recommended for getting
the most out of the SKU Max solution
Wait, what about the data? Can you manage the data
engineering for us?
Neal Hosted Data Engineering
• Neal Analytics can absolutely receive and host your raw
data and transform into the format we need for SKU Max
• Neal data transformation extra Azure cost and any one
time consulting hours are not included in the license fee,
and will be custom quoted depending on the size of the
data and complexity of the transformations required
• Ongoing data transformation cost Azure & labor will be
added to the monthly subscription cost and agreed upon
with the customer
• Neal is responsible for the fully managed solution
Client Hosted Data Engineering
• It is often easier to internally prepare your data to meet
the SKU Max requirements, and can result in significant
cost savings, so it is encouraged where possible
• Neal Analytics will connect to the prepared datasets and
load the data into Azure, where it will be processed
through Machine Learning algorithms and then provides
the results back to the end users
• Neal Analytics is not responsible for issues with the service
if the data is not up to date in the client’s staging tables
SKU Max Pricing Tiers
DiamondGold
Analysts Equipped with SKU Management Tools• Analysts can monitor models and make macro-level
business decisions using their existing Office 365 Accounts
• Interactive dashboards useful for making SKU portfolio
changes in various finely segmented markets
SKU Max Integrated with Additional Retail IQ Modules• Ops friendly tools that aid businesses in understanding the
complete picture of their sales environment
• Deployment of specific solutions and apps for various roles
provide tailored experiences for each business unit
Pricing
License Cost: $10k/month
Power BI Analysis Dashboards Retail IQ Integration
License Cost: $20k/month
Platinum
Operations/Field Sellers Equipped with SKU Insights• Tier 1 Analyst Dashboards enhanced with field monitoring
capabilities to ensure solid recommendations are made
• Interactive dashboards for sales/delivery roles available on
mobile devices or embedded in websites for easy access
• Power BI Pro licenses not included in the monthly fee
License Cost: $15k/month
Mobile Power BI for Buyers & Sellers
Retail IQ Analytics Platform
Retail IQ Platform
Retail IQ Framework
• SKU Max was built upon a
dynamic platform which
allows for timely deployment
of the core framework and
near plug and play addition
of analytics scenarios
• This core framework is a
foundation for the launch of
different permutations of
SKU Max and other retail
solutions with easy
customization and extension
to grow business value as
capabilities and more data
become available
• Additional solutions continue
to be developed in
partnership with leading
retailers around the world
Promo Max SKU Max Loyalty Max
Price Max Shelf Max Store Max
Core ERP DataCortana
Intelligence Suite
Architecture
SFA Customer & Product Data
Leverages ARM Templates for Rapid Deployment, Repeatability, & Customizable Solutions
Business
Logic
Marketing and Promotion Data
Nielsen/IRI Data
Business
Logic SFA Customer purchase history
Business
Logic
In Development In Development In Development
Automated with
Data Factory
Optional
CustomizationsOptional
Customizations
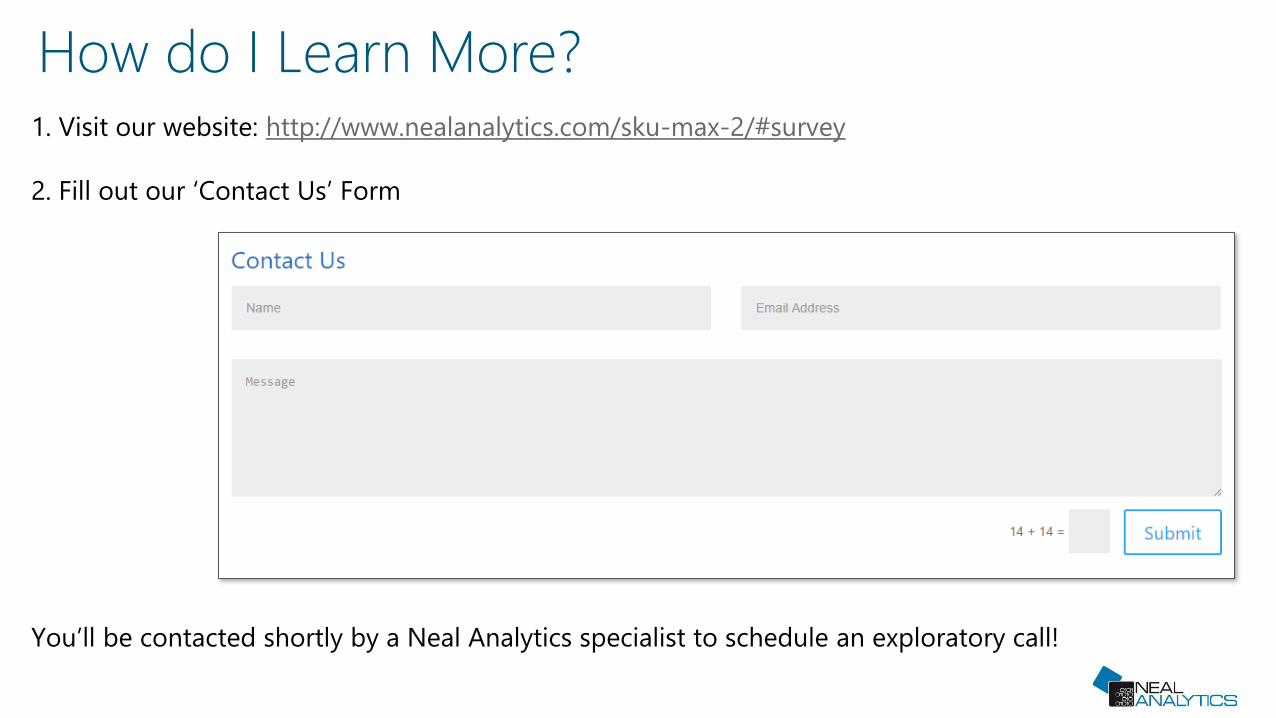
How do I Learn More?1. Visit our website: http://www.nealanalytics.com/sku-max-2/#survey
2. Fill out our ‘Contact Us’ Form
You’ll be contacted shortly by a Neal Analytics specialist to schedule an exploratory call!