12
Goals of Japan’s Energy and Environment Policy
| Date post: | 16-Dec-2015 |
| Category: |
Documents |
| Upload: | gary-bates |
| View: | 218 times |
| Download: | 7 times |
Goals of Japan’s Energy and Environment Policy

Goals of Japan’s Energy and Environment Policy
Establishment of Low Carbon Societyon the basis of long-term outlooks for energy and CO2 emissionsthrough development and diffusion of innovative technologies
In the medium and long term
In the short term
Achievement of the Kyoto Target“The Kyoto Target Achievement Plan” (2005) based on review and assessment of the current climate change policy programme
Climate change policy should be developed and implemented so as to contribute to both the environment and economy by making the best use of technological innovation and innovative ideas in economic circles.Japan assists developing countries with its climate-friendly technologies.
1

Framework of Japan’s Energy Policy
Basic Principles of Japan’s Energy Policy : 3Es(Based on the Basic Law on Energy Policy Making-*enacted in June 2002)
Master Plan for energy supply-demand *issued in October 2003
Long-term Outlook on Energy Supply-demand*interim report issued in October 2004
(Advisory Committee for Natural Resources and Energy, Energy Supply and Demand Subcommittee)
Security of Security of Energy SupplyEnergy Supply
e.g.e.g. Alternatives to oilAlternatives to oil
Harmony Harmony with Environmentwith Environment
e.g.e.g. Lowering Lowering CO2 emissionCO2 emission
Economic EfficiencyEconomic Efficiencye.g. Utilizing e.g. Utilizing
market mechanismmarket mechanism
* In utilizing market mechanism, full consideration will be given to other two policy goals.
2

Stabilization of global GHG concentrations
In order to stabilize the atmospheric concentration of CO2, carbon emissions from the burning of fossil fuels need to be balanced with the terrestrial and ocean carbon uptake. To balance emissions and uptake, emissions must be drastically reduced to less than half of the current level.
The IPCC scenario for stabilizing at 550 ppm (WRE550) shows that, although emissions need to be reduced to less than half of the current level, about one-fourth reduction will be necessary in comparison with the future emission peak.
3
-2
0
2
4
6
8
10
12
14
16
1990 2015 2040 2065 2090 2115 2140 2165 2190 2215 2240 2265 2290
CO
2 em
issi
on (
PgC
/yea
r)
WRE350
WRE450
WRE550
WRE650
WRE750
Emission scenarios to stabilize atmospheric CO2 concentration
(Source) IPCC (2001)

2030 Energy Demand-Supply Structure in JapanEnergy demand will begin to drop: In the reference case, energy demand will take a
downturn in fiscal 2021, mainly due to energy conservation technologies and introduction of efficient equipment along with industrial and socioeconomic structure change.
Energy supply structure will gradually change: The spread of distributed power generating systems will increase demand for natural gas to increase its share. Nuclear power will continue to secure a stable share as a power source. Oil, despite a decrease in share, will continue to be an important source of energy that accounts for around 40% of the total energy supply. Given progress in the introduction of new energy technologies, renewables may attain a share of around 10%.
Domestic Primary Energy Supply (10^3 kloe) Final Energy Consumption (10^3 kloe)
0
100
200
300
400
500
600
700
1990 2000 2030
Renewable etc.
Hydro & Geo.
Nuclear
Natural Gas
Coal
LPG
Oil (exc. LPG)(53%) (47%) (38%)
(17%)(18%)
(17%)
(10%)(13%)
(18%)(10%)
(13%) (15%)
0
50
100
150
200
250
300
350
400
450
1990 2000 2030
Freight
Passenger
Commercial
Residential
Industry
(50%) (47%) (44%)
(12%)
(13%) (15%)(13%)
(15%) (17%)(13%)
(15%)(16%)
(11%)
(10%)(8%)
4
300
258
317
286
311
324
240
250
260
270
280
290
300
310
320
330
340
1990 2000 2010 2020 2030FY
Mt-
C
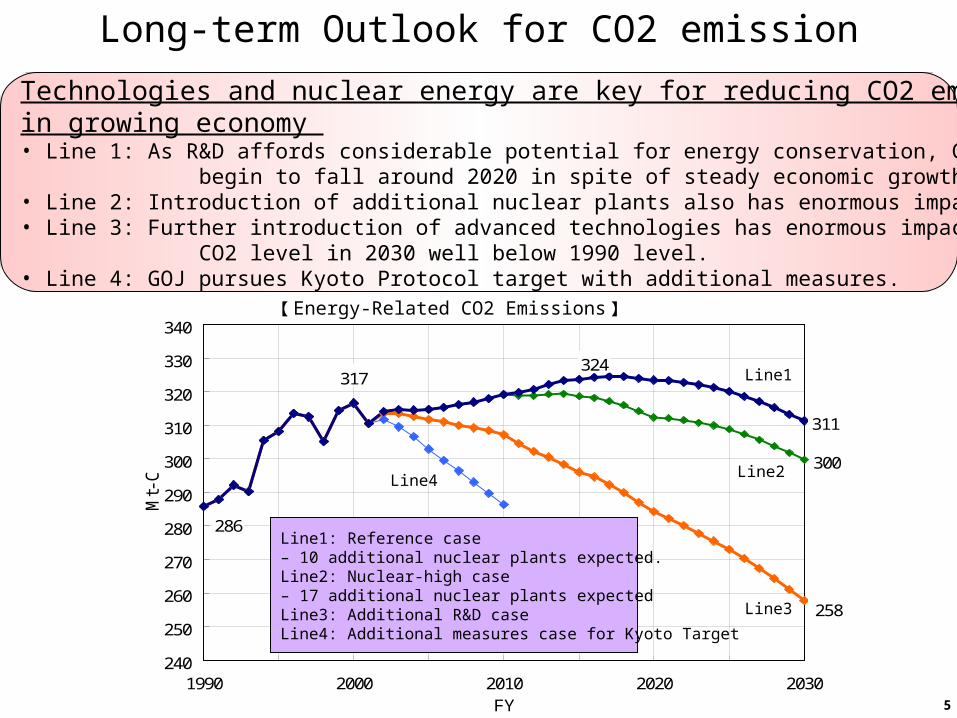
Long-term Outlook for CO2 emission
Technologies and nuclear energy are key for reducing CO2 emission in growing economy • Line 1: As R&D affords considerable potential for energy conservation, CO2 emissions may begin to fall around 2020 in spite of steady economic growth. • Line 2: Introduction of additional nuclear plants also has enormous impact.• Line 3: Further introduction of advanced technologies has enormous impact which would reduce CO2 level in 2030 well below 1990 level.• Line 4: GOJ pursues Kyoto Protocol target with additional measures.
【 Energy-Related CO2 Emissions】
5
Line1: Reference case – 10 additional nuclear plants expected.Line2: Nuclear-high case – 17 additional nuclear plants expected Line3: Additional R&D case Line4: Additional measures case for Kyoto Target
Line1
Line2
Line3
Line4
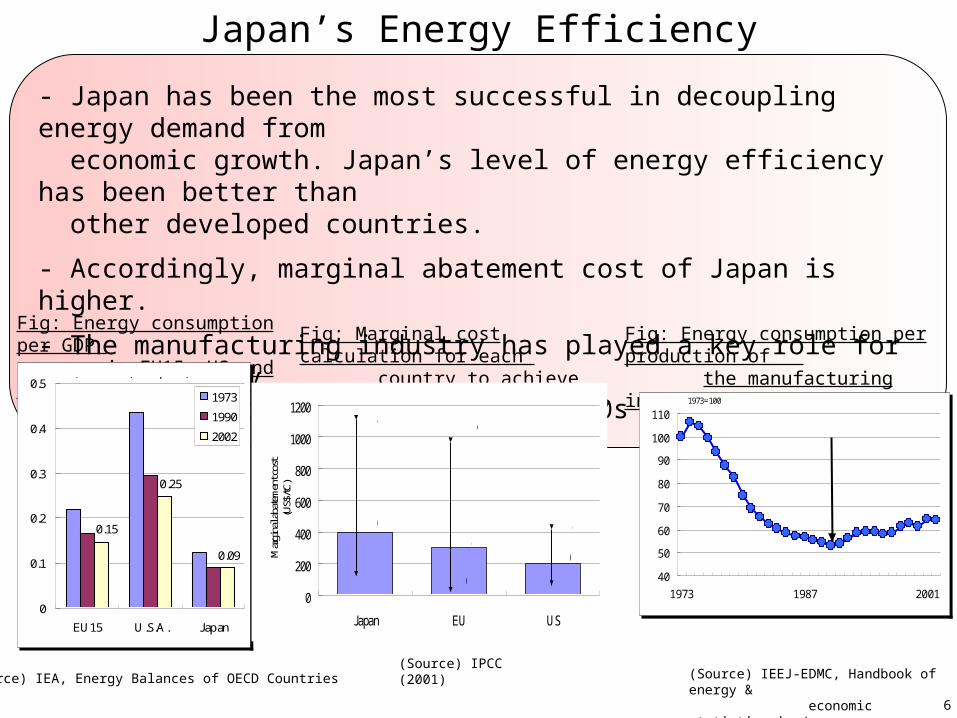
- Japan has been the most successful in decoupling energy demand from economic growth. Japan’s level of energy efficiency has been better than other developed countries.
- Accordingly, marginal abatement cost of Japan is higher.
- The manufacturing industry has played a key role for drastic energy efficiency improvement during 1970s and 1980s.
Fig: Energy consumption per GDP in EU15, US and Japan
0.15
0.25
0.09
0
0.1
0.2
0.3
0.4
0.5
EU15 U.S.A. Japan
1973
1990
2002
TOE/1,000 US $ (1995 price)
(Source) IEA, Energy Balances of OECD Countries
Fig: Energy consumption per production of the manufacturing industry in Japan
(Source) IEEJ-EDMC, Handbook of energy & economic statistics in Japan
Fig: Marginal cost calculation for each country to achieve its Kyoto target
0
200
400
600
800
1000
1200
Japan EU US
Mar
gina
l aba
tem
ent c
ost
(US$
/tC)
1074
97
966
20
410
76
about 400
about 300about 200
(Source) IPCC (2001)
40
50
60
70
80
90
100
110
1973 1987 2001
1973=100
fiscal year
Improvement of 47%
Japan’s Energy Efficiency
6

GAP
- Innovative technologies are necessary for sustainable development.
-The Government of Japan has put emphasis on energy-related R&D with a view to reducing emissions not only domestically but also globally.
Key for Success: New Technologies (1)
(Source) IEA (2002)
Fig: Importance of innovative technologies in CO2 emission reduction
(Source) Battelle (2000)
0
200
400
600
800
1000
1995 2000 1995 2000 1995 2000 1995 2000 1995 2000
Japan US Germany Italy UK
M$
Renewable energy
Energy conservation
343
712
869766
80 74 84 4218 9
Fig: Energy-related R&D investment by government
7

Key for Success: New Technologies (2)
- Light-emitting diode (Lights for the 21st Century) Low energy consumption (10% of incandescent lighting) Long life (10 times fluorescent lighting)- Saving of stand-by electricity consumption - High performance boiler & laser 17% improvement of thermal efficiency
- Photovoltaic power generation GOJ has been concentrated on supporting R&D program to contribute to global dissemination of PV.- Biomass
- 5 million vehicles by 2020 in Japan.
- Clean coal technologies, etc
Japan
US
German
Others
Japan636.8 MWUS
212.2MW
German277.3 MW
Others201.6 MW
World 1327.7MW(2002)• Renewable energy technologies
• Energy conservation technologies
• Promotion of nuclear power
• Carbon sequestration technologies
Fig: Total worldwide installations of photovoltaic power system
(Source) IEA PVPS
Progress of CO2 Aquifer Sequestration Project
CO2
CO2CO2
CO2CO2
TransportSeparation/Capture Injection
Injection
Onshore aquifer
Offshore
aquifer
Large scaleEmission source
CO2
CO2CO2
CO2CO2
TransportSeparation/Capture Injection
Injection
Onshore aquifer
Offshore
aquifer
Large scaleEmission source
TransportSeparation/Capture Injection
Injection
Onshore aquifer
Offshore
aquifer
Large scaleEmission source
Progress of CO2 Aquifer Sequestration ProjectProgress of CO2 Aquifer Sequestration Project
CO2
CO2
CO2
CO2CO2
CO2CO2
TransportSeparation/Capture Injection
Injection
Onshore aquifer
Offshore
aquifer
Large scaleEmission source
CO2
CO2CO2
TransportSeparation/Capture Injection
Injection
Onshore aquifer
Offshore
aquifer
Large scaleEmission source
CO2
CO2CO2
CO2CO2
CO2CO2
CO2CO2
TransportSeparation/Capture Injection
Injection
Onshore aquifer
Offshore
aquifer
Large scaleEmission source
TransportSeparation/Capture Injection
Injection
Onshore aquifer
Offshore
aquifer
Large scaleEmission source
8
• Clean technologies of fossil fuel
• Fuel cell

Fig. Example of Top Runner Program Table: Examples of covered equipment(18 equipments are covered in total.)
Passenger vehicles (diesel)Air conditioners (cooling & heating)TV setsVideo cassette recordersFluorescent lightsCopying machinesComputersMagnetic disc unitsElectric refrigerators / freezersGas cooking appliancesVending machines
Passenger vehicles(Gasoline and LP gas)
Fuel Efficiency
(km/l)
Fuel Efficiency
(km/l)
Top Runner Program
(Stricter energy conservation standard)
Conventional energy
conservation standard
Key for Success: Efficiency Improvement (1)
-Energy efficiency is a key for striking a balance between environment and economy.
-The “Top Runner Program” was introduced in 1998 as energy conservation standards for home/office appliances and fuel efficiency standards for automotives.
9
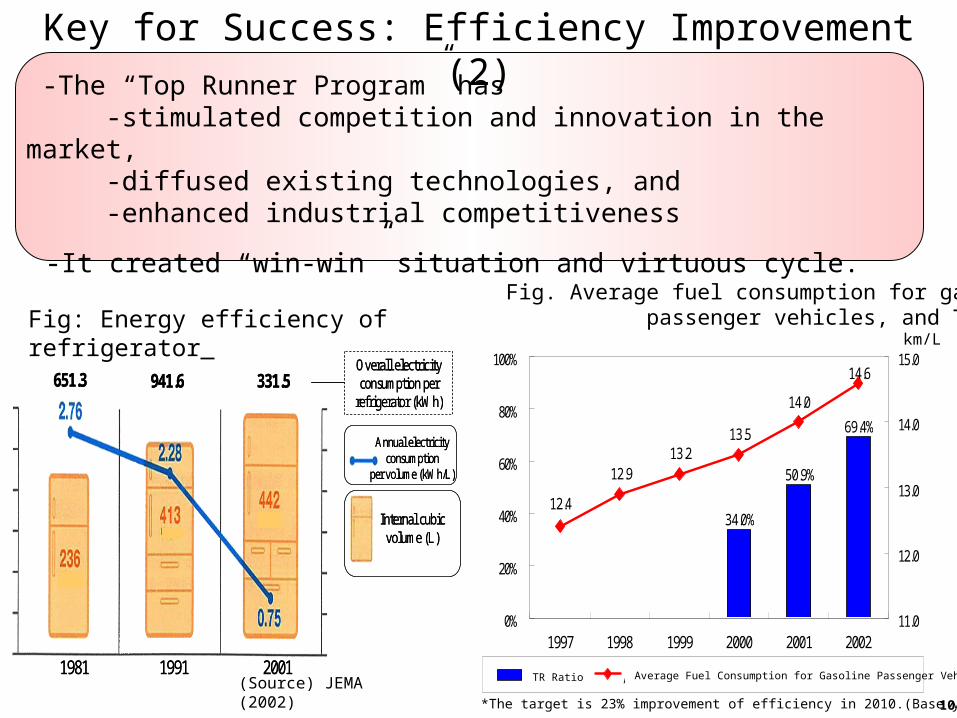
-The “Top Runner Program” has -stimulated competition and innovation in the market, -diffused existing technologies, and -enhanced industrial competitiveness
-It created “win-win” situation and virtuous cycle.
Key for Success: Efficiency Improvement (2)
(Source) JEMA (2002)
Annual electricity consumption
per volume (kWh/L)
Internal cubic volume (L)
1981 1991 2001
651.3 941.6 331.5Overall electricity consumption per
refrigerator (kWh)
Annual electricity consumption
per volume (kWh/L)
Internal cubic volume (L)
1981 1991 2001
651.3 941.6 331.5Overall electricity consumption per
refrigerator (kWh)
Fig: Energy efficiency of refrigerator
34.0%
50.9%
69.4%
14.6
14.0
13.513.2
12.9
12.4
0%
20%
40%
60%
80%
100%
1997 1998 1999 2000 2001 200211.0
12.0
13.0
14.0
15.0
TR Ratio Average Fuel Consumption for Gasoline Passenger VehiclesAverage Fuel Consumption for Gasoline Passenger VehiclesTR Ratio
*The target is 23% improvement of efficiency in 2010.(Base year is 1995.)
Fig. Average fuel consumption for gasoline passenger vehicles, and Top Runner ratio
km/L
10

Key for Success: Efficiency Improvement (3)
11
-As for industry sector, incentive for better competitiveness needs to be utilized.-They know their own technologies and facilities best. -Best practices and best available technologies need to be globally shared. Sectoral approach is effective for this purpose and can make technology transfer easier.
0
20
40
60
80
100
120
J apan NorthEurope
UK France Germany US China
0
20
40
60
80
100
120
140
160
J apan Korea EU US China(Large)
China
0
20
40
60
80
100
120
140
J apan Europe US World
0
2040
60
80100
120
140
160180
200
J apan WestEurope
Korea SouthAmerica
China US Russia
Thermal power sector; thermal efficiency(Electricity output per energy input)
Steel industry(Energy intensities in integrated steel plant)
Chemical industry(CO2 emission intensities of ethylene production)
Cement(Energy intensities of clinker)
(Source): ECOFYS(2004), etc
(Source): SRI Chemical Economic Handbook etc
(Source): Korea Iron & Steel Association , etc
(Source): Battelle


