United States Department of Agriculture Animal and Plant Health Inspection Service Veterinary Services National Animal Health Monitoring System April 2017 Goat and Kid Predator and Nonpredator Death Loss in the United States, 2015
Transcript
United States Department of Agriculture
Animal and Plant Health Inspection Service
Veterinary Services
National Animal Health Monitoring System
April 2017
Goat and Kid Predator and Nonpredator Death Loss in the United States, 2015
The U.S. Department of Agriculture (USDA) prohibits dis-crimination in all its programs and activities on the basis of race, color, national origin, age, disability, and where applicable, sex, marital status, familial status, parental status, religion, sexual orientation, genetic information, political beliefs, reprisal, or because all or part of an individual’s income is derived from any public assistance program. (Not all prohibited bases apply to all programs.) Persons with disabilities who require alternative means for communication of program information (Braille, large print, audiotape, etc.) Should contact USDA’s TARGET Center at 202.720.2600 (voice and TDD).
To file a complaint of discrimination, write to USDA, Director, Office of Civil Rights, 1400 Independence Avenue, S.W., Washington, D.C. 20250–9410, or call 800.795.3272 (voice) or 202.720.6382 (TDD). USDA is an equal opportunity provider and employer.
Mention of companies or commercial products does not imply recommendation or endorsement by the USDA over others not mentioned. USDA neither guarantees nor warrants the standard of any product mentioned. Product names are mentioned solely to report factually on avail-able data and to provide specific information.
USDA–APHIS–VS–CEAH–NAHMSNRRC Building B, M.S. 2E72150 Centre AvenueFort Collins, CO 80526–8117970.494.7000http://www.aphis.usda.gov/nahms
#724.0417
Cover photograph courtesy of Camilla Kristensen.
USDA APHIS VS / i
Items of Note
In 2015, about 500,000 adult and kid goats were lost to all causes (nonpredator and predator) in the United States, which represented 9.8 percent of U.S. adult goat inventory and 19.4 percent of kids born in 2015. About one-third of operations (34.2 percent) had any kid losses, and a slightly lower percentage (28.2 percent) had any adult goat losses. The total value of goat and kid losses was $69.6 million.
Texas had the largest inventory of goats on January 1, 2016: 30.5 percent of adult goats and 30.2 percent of the kid crop in the United States in 2015. Correspondingly, Texas had the highest percentage of losses: 36.3 percent of U.S. adult goat deaths and 37.8 percent of kid deaths.
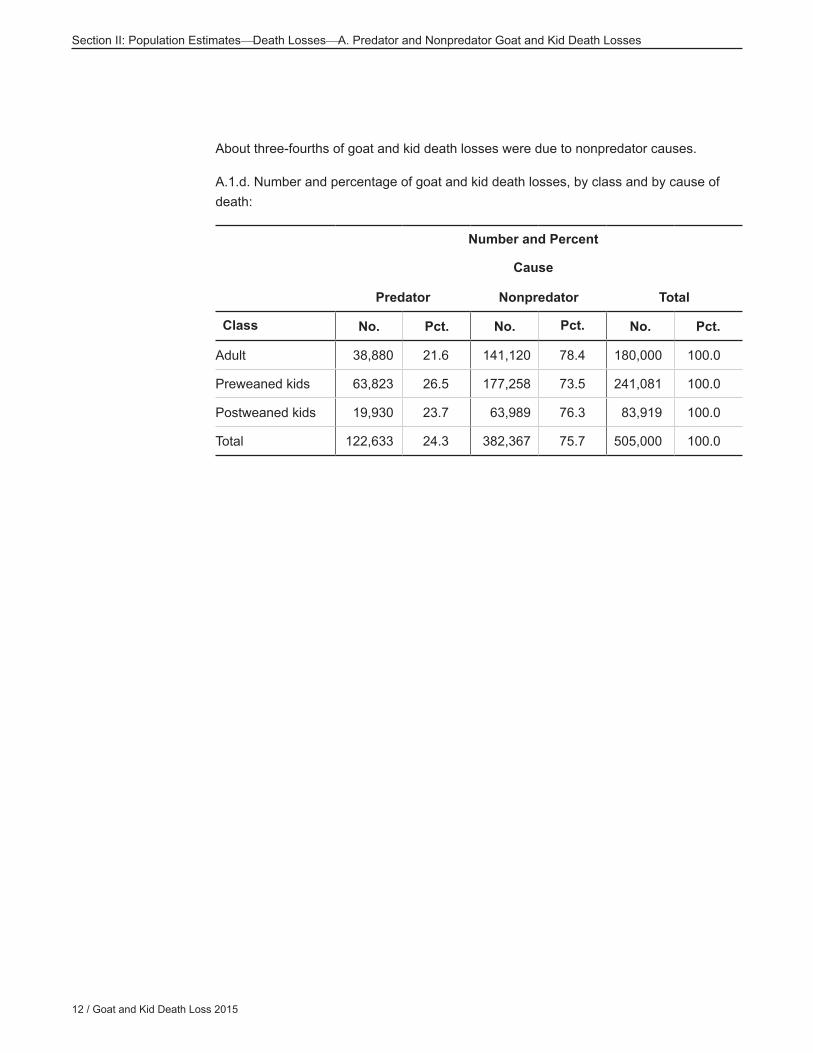
Nonpredator causes accounted for about three-fourths of all adult goat and kid death losses in the United States in 2015. Undetermined causes (found dead or unknown) accounted for the highest number of nonpredator losses in both goats and kids. Of known losses due to nonpredator causes, internal parasites were the primary cause of loss, resulting in almost 87,000 goat and kid deaths in 2015. Weather-related causes and kidding problems were also important causes of loss.
For losses due to predators, coyotes and dogs accounted for the highest percentages of goat and kid death losses in 2015. Overall, coyotes and dogs accounted for almost 80,000 goat and kid deaths, or about 65 percent of all losses due to predators. There was also a smaller number of goats and kids (about 14,500) that were injured but not killed by predators.
Overall, 93.0 percent of operations used some kind of nonlethal method to control predators. The nonlethal methods used by the highest percentage of operations (aside from “other”) were fencing and guard dogs (44.5 and 33.0 percent of operations, respectively). Operations spent an average of $1,085 on nonlethal predator control methods and $444 on lethal methods. Only 1 of 40 operations (2.3 percent) sought help from State or Federal government trappers to control predators.
Overall, 7.7 percent of operations that had goats at any time during year quit raising goats during 2015. Retirement was the most common reason (aside from “other” reason) for quitting.
The numbers provided in this report are based on a sample of operations and are thus estimates of the true numbers. There is variability associated with each estimate, although the measures of variability (such as the standard error) are not always shown.
ii / Goat and Kid Death Loss 2015
Acknowledgments
This report was a cooperative effort between two U.S. Department of Agriculture (USDA) Agencies: the National Agricultural Statistics Service (NASS) and the Animal and Plant Health Inspection Service (APHIS).
We’d like to thank the NASS enumerators who telephoned and visited goat operations and collected the data. Their hard work and dedication were invaluable. A thank you also goes to the personnel at the USDA–APHIS–Veterinary Services’ Center for Epidemiology and Animal Health for their efforts in generating and distributing this report.
We especially thank the goat producers whose voluntary efforts made the goat and kid death loss study possible.
Bruce Wagner Director Center for Epidemiology and Animal Health
USDA APHIS VS / iii
Suggested bibliographic citation for this report: USDA. 2015. “Goat and Kid Predator and Nonpredator Death Loss in the United States, 2015” USDA–APHIS–VS–CEAH. Fort Collins, CO #724.0417
Contacts for further information: Questions or comments on data analysis: Dr. Katherine Marshall (970) 494-7000 Information on reprints or other reports: Ms. Abby Zehr (970) 494-7000
Feedback Feedback, comments, and suggestions regarding the “Goat and Kid Predator and Nonpredator Death Loss, 2015” report are welcomed. You may submit feedback via online survey at: http://www.aphis.usda.gov/nahms (Click on “Provide FEEDBACK on NAHMS reports.”)
For questions about this report or additional copies, please contact: USDA–APHIS–VS–CEAH NRRC Building B, M.S. 2E7 2150 Centre Avenue Fort Collins, CO 80526-8117 970–494–7000
iv / Goat and Kid Death Loss 2015
Introduction 1Terms Used in This Report 2
Section I: Population EstimatesInventory 5A. U.S. Demographics 5
1. Inventory by class 52. Operations 63. Kid crop 7
B. State Demographics 81. Goat and kid inventories 8
Section II: Population EstimatesDeath Losses 10A. Predator and Nonpredator Goat and Kid Death Losses 10
1. Overall death losses in 2015 102. Overall death losses by State 133. Nonpredator goat and kid death losses 324. Predator goat and kid death losses 395. Number of goats and kids injured but not killed by predators 496. Nonlethal methods used to prevent wildlife-caused losses on goat
operations 537. Operations not raising goats in the future 65
Each January, USDA’s National Agricultural Statistics Service (NASS) collects data on goat inventory, kid crop, and total goat and kid death losses. State-level inventory and total U.S. kid crop estimates (number of head) are published each January via the NASS “Sheep and Goats” report. Total goat and kid death losses for 2009 were published via the NASS “Sheep and Goats Death Loss” report in May 2010.
For the NASS January 2016 goat survey, USDA’s Animal and Plant Health Inspection Service’s National Animal Health Monitoring System provided funding and expertise for a detailed, retrospective breakdown of goat and kid death losses by producer-attributed cause during the previous year. This report presents State-level and other summary results from the NASS survey and represents the first time that goat losses have been broken out by specific predator and nonpredator causes.
2 / Goat and Kid Death Loss 2015
Introduction
Acidosis: A condition caused by excessive amounts of acid produced in the rumen, often due to ration change or grain overload.
Adult goat inventory: Breeding bucks and does 1 year and older and market goats 1 year and older.
Bloat: A condition in which ruminants cannot release the gas developed in the rumen as a result of fermentation.
Fright tactics: Devices and strategies to frighten predators, including lights, bells, radios, vehicles, propane exploders, electronic guards, and others. Unless these devices are rotated or otherwise periodically changed, predators can become acclimated to them.
Herding: Using herders for goats in large pastures or on free range to help discourage predation.
Kid crop: Kids born.
Kid: Animal less than 1 year old.
Goat/market goat: Animals 1 year and older for use as feeders or for slaughter.
Metabolic problems: These can be caused by increased demand for a special nutrient. Examples include milk fever (hypocalcemia) and grass tetany (hypomagnesemia).
Night penning: Confining or concentrating flocks during the night when they are most vulnerable to predation.
Regions/States:
Pacific: California, Oregon, Washington West Central: Arizona, Colorado, Idaho, Montana, New Mexico, Nevada, Texas, Utah, Wyoming Central: Illinois, Indiana, Iowa, Kansas, Michigan, Minnesota, Missouri, Nebraska, North Dakota, Oklahoma, South Dakota, Wisconsin Northeast: Connecticut, Delaware, Maine, Maryland, Massachusetts, New Hampshire, New Jersey, New York, Ohio, Pennsylvania, Rhode Island, Vermont Southeast: Alabama, Arkansas, Florida, Georgia, Kentucky, Louisiana, Mississippi, North Carolina, South Carolina, Tennessee, Virginia, West Virginia
Terms Used in This Report
USDA APHIS VS / 3
Introduction
FL
NM
DEM D
TXOK
KS
NE
SD
ND
M T
W Y
CO
UT
ID
AZ
NV
W A
CA
OR
KY
M E
NY
PA
M I
VT NH
M A
RICT
VA
W V
OHIN
IL
NC
TN
SCALM S
AR
LA
M O
IA
M N
W I
NJ
GA
States participating in the Goat and Kid Predator and Nonpredator Death Loss, 2015study, by region
Standard error: Standard error of the estimates. If rounded to zero, the standard error was reported as (0.0). If there were no reports of the event, no standard error was reported (—)
Value: NASS collected data on the average per-head value of goats on January 1, 2016, by type of goat (Angora, milk, meat, and other). However, since data on death losses were not collected by goat type, operations were categorized by type of goat (Angora, milk, meat, and other) based on their inventory of these goat types. All deaths for a particular operation were then assigned to a single goat type based on operation type. Most operations had only one type of goat. The value of deaths for an operation was calculated as the number of deaths multiplied by the average value per head.
USDA APHIS VS / 5
Section I: Population EstimatesInventoryA. U.S. Demographics
Note: Where appropriate, column or row totals are shown as 100.0 to aid in interpretation; however, estimates may not sum to 100.0 due to rounding.
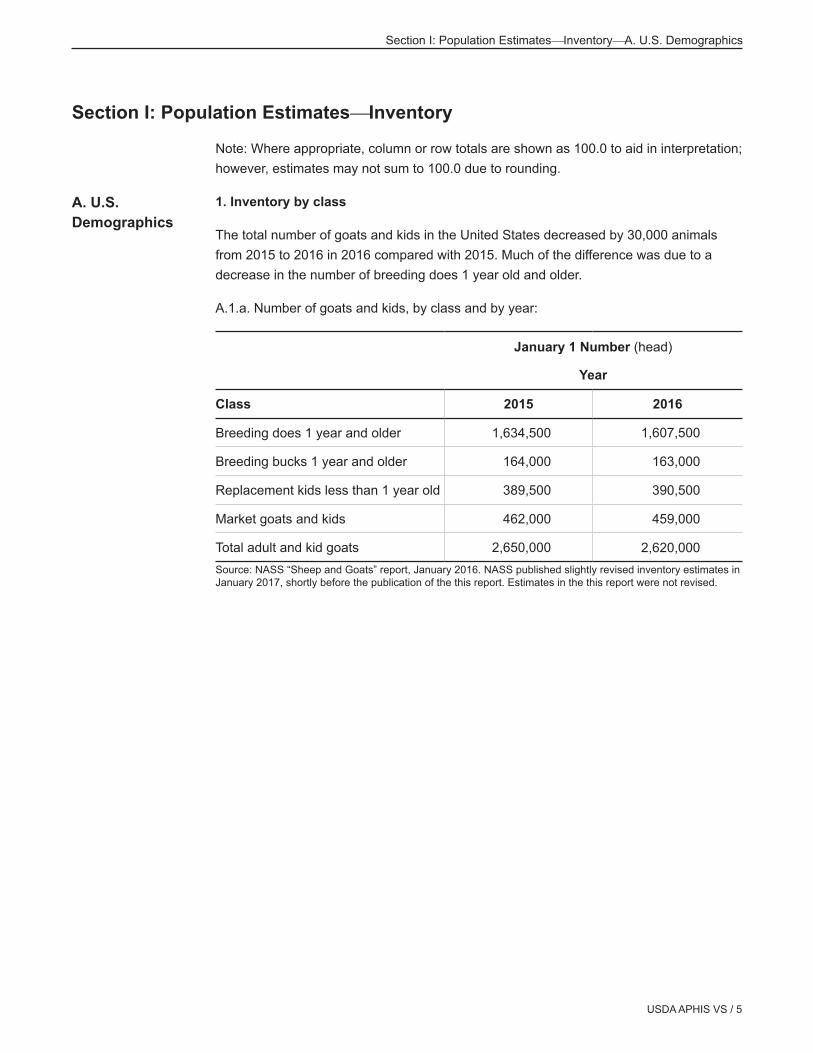
1. Inventory by class
The total number of goats and kids in the United States decreased by 30,000 animals from 2015 to 2016 in 2016 compared with 2015. Much of the difference was due to a decrease in the number of breeding does 1 year old and older.
A.1.a. Number of goats and kids, by class and by year:
January 1 Number (head)
Year
Class 2015 2016
Breeding does 1 year and older 1,634,500 1,607,500
Breeding bucks 1 year and older 164,000 163,000
Replacement kids less than 1 year old 389,500 390,500
Market goats and kids 462,000 459,000
Total adult and kid goats 2,650,000 2,620,000Source: NASS “Sheep and Goats” report, January 2016. NASS published slightly revised inventory estimates in January 2017, shortly before the publication of the this report. Estimates in the this report were not revised.
Section I: Population EstimatesInventory
A. U.S. Demographics
6 / Goat and Kid Death Loss 2015
Section I: Population EstimatesInventoryA. U.S. Demographics
Of the 2.6 million goats and kids in the national goat herd, almost 2.1 million (80 percent) were comprised of “meat and other” goat types. On average, about 0.8 kids were born for every Angora breeding doe and 1.1 kids born for every milk goat breeding doe.
A.1.b. Number of goats and kids, by goat class and by goat type, 2016:
January 1 Number (head)
Goat Type
Class Angora MilkMeat and
other
Breeding does 1 year and older 103,500 241,000 1,263,000
Breeding bucks 1 year and older 7,000 24,000 132,000
Replacement kids less than 1 year old 19,500 71,000 300,000
Market goats and kids 20,000 39,000 400,000
Total goats and kids 150,000 375,000 2,095,000
Kid crop (2015) 79,000 278,000 1,320,000Source: NASS “Sheep and Goats” report, January 2016. NASS published slightly revised inventory estimates in January 2017, shortly before the publication of the this report. Estimates in the this report were not revised.
2. Operations
The majority of operations with goats and/or kids on January 1, 2016, raised “meat and other” goat types.
A.2.a. Number of operations with goats and/or kids on January 1, 2016, by goat type:
Goat type Number of operations
Angora 7,419
Milk 33,448
Meat and other 118,635
Total 148,332Source: Estimated by NAHMS.
USDA APHIS VS / 7
Section I: Population EstimatesInventoryA. U.S. Demographics
Over 60 percent of operations on January 1, 2016, had 1 to 9 goats and kids.
A.2.b. Percentage of operations and percentage of goat and/or kids, by size of operation, January 1, 2016:
Size of operationPercent
operationsPercent goats
and/or kids
1 to 9 61.8 14.1
10 to 19 19.4 15.6
20 to 99 16.7 35.9
100 or more 2.2 34.4
Total 100.0 100.0Source: Estimated by NAHMS.
3. Kid crop
From 2014 to 2015, the U.S. kid crop decreased by 37,000 animals. Most of this decline can be attributed to the corresponding decrease in the number of breeding does (table A.1.a).
A.3. Kid crop and kid crop per 100 does on hand, by year:
Number Kids
Year
2014 2015
Kid crop (head) 1,714,000 1,677,000
Kid crop per 100 does on hand (January 1 of the following year) 104.9 104.3
Source: NASS “Sheep and Goats” report, January 2016. NASS published slightly revised inventory estimates in January 2017, shortly before the publication of the this report. Estimates in this report were not revised.
8 / Goat and Kid Death Loss 2015
Section I: Population EstimatesDeath LossesB. State Demographics
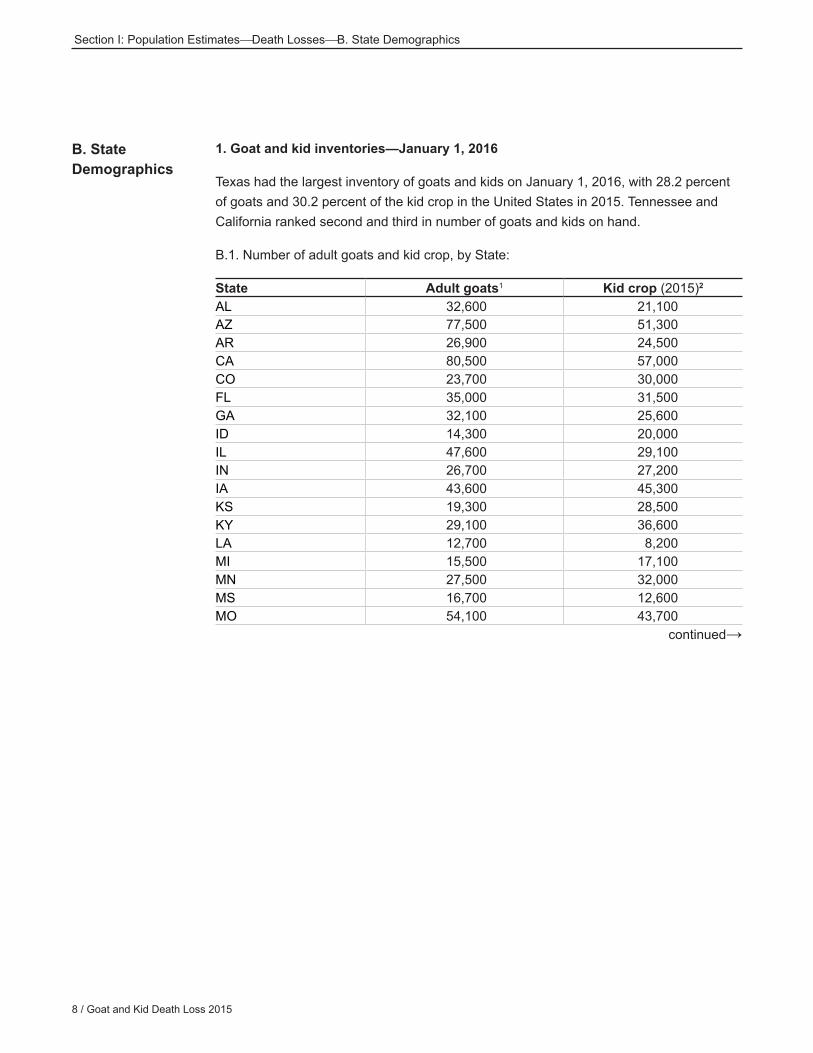
1. Goat and kid inventories—January 1, 2016
Texas had the largest inventory of goats and kids on January 1, 2016, with 28.2 percent of goats and 30.2 percent of the kid crop in the United States in 2015. Tennessee and California ranked second and third in number of goats and kids on hand.
B.1. Number of adult goats and kid crop, by State:
Section I: Population EstimatesDeath LossesB. State Demographics
B.1. Number of adult goats and kid crop, by State (cont’d):
State Adult goats1 Kid crop (2015)2
NE 16,200 19,500New England3 25,700 20,900NM 25,300 24,500NY 21,100 18,600NC 53,200 27,600OH 29,400 30,100OK 69,400 74,000OR 35,800 28,300PA 49,900 48,600SC 30,000 25,300TN 73,600 80,800TX 557,900 507,000VA 49,400 49,300WA 21,400 19,700WV 23,900 19,200WI 45,800 46,600Other States4 86,200 95,700U.S. 1,829,600 1,677,0001Includes does, bucks, and market goats 1 year and older. Estimated by NAHMS.2 State-level kid crop estimated by NAHMS; U.S total published by NASS.3New England includes CT, ME, MA, NH, RI, and VT.
The States composing the “New England” group (CT, ME, MA, NH, RI, and VT) are not shaded in the map above because of their small contribution to the U.S. goat and kid inventory (1.3 percent of U.S. goat and kid inventory when combined). The same is true for the “Other States” group (AK, DE, HI, MD, MT, NV, NJ, ND, SD, UT, and WY), which, when combined, make up only 5.2 percent of U.S. goat and kid inventory.
10 / Goat and Kid Death Loss 2015
Section II: Population EstimatesDeath LossesA. Predator and Nonpredator Goat and Kid Death Losses
Note: unless otherwise specified, all tables in this section refer to the calendar year 2015.
1. Overall death losses—2015
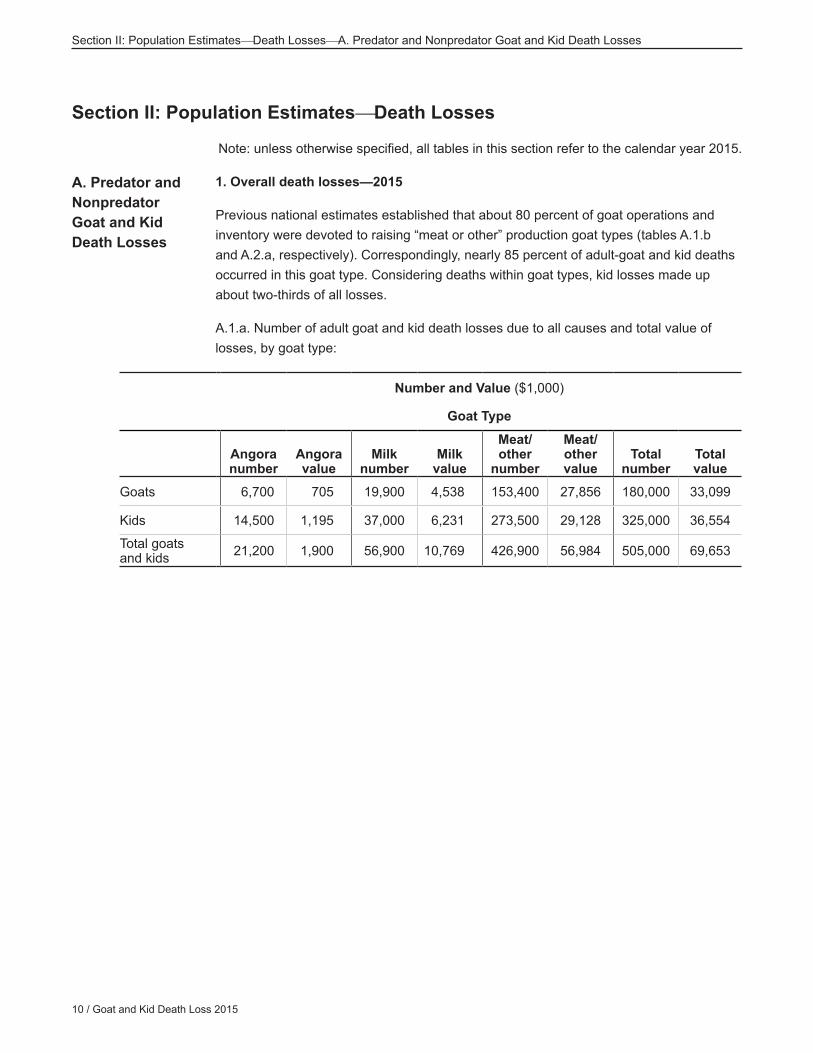
Previous national estimates established that about 80 percent of goat operations and inventory were devoted to raising “meat or other” production goat types (tables A.1.b and A.2.a, respectively). Correspondingly, nearly 85 percent of adult-goat and kid deaths occurred in this goat type. Considering deaths within goat types, kid losses made up about two-thirds of all losses.
A.1.a. Number of adult goat and kid death losses due to all causes and total value of losses, by goat type:
Section II: Population EstimatesDeath Losses
A. Predator and Nonpredator Goat and Kid Death Losses
Section II: Population EstimatesDeath LossesA. Predator and Nonpredator Goat and Kid Death Losses
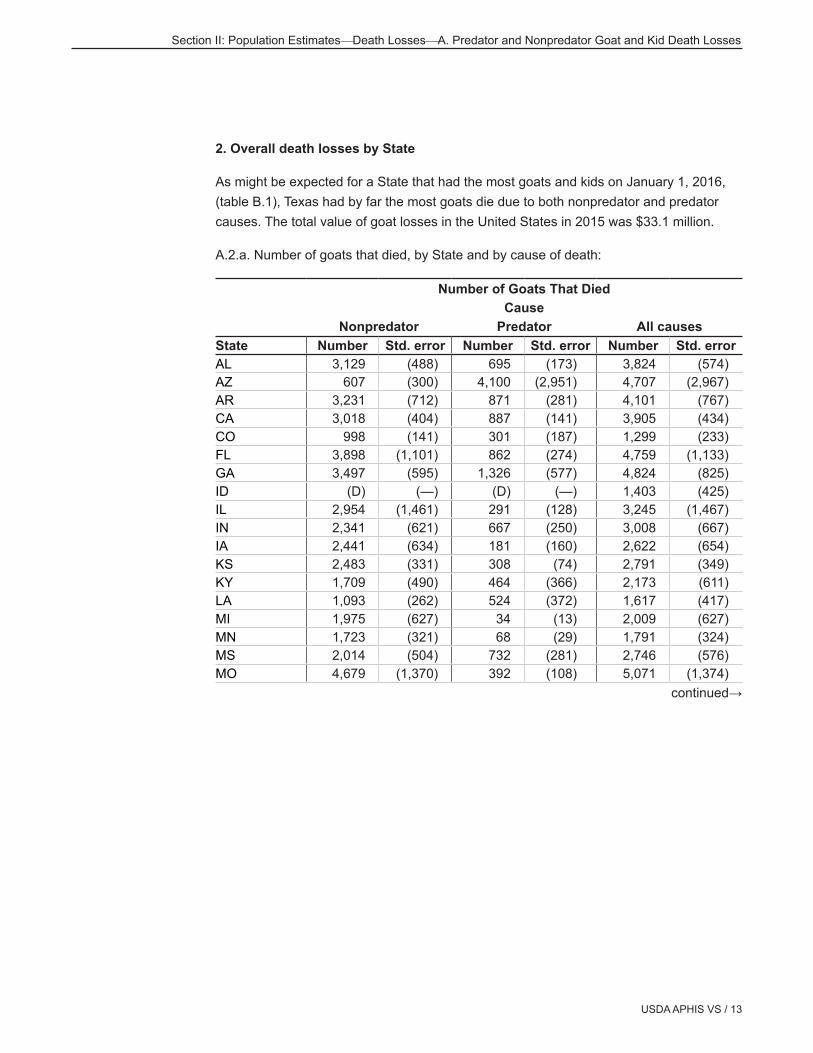
2. Overall death losses by State
As might be expected for a State that had the most goats and kids on January 1, 2016, (table B.1), Texas had by far the most goats die due to both nonpredator and predator causes. The total value of goat losses in the United States in 2015 was $33.1 million.
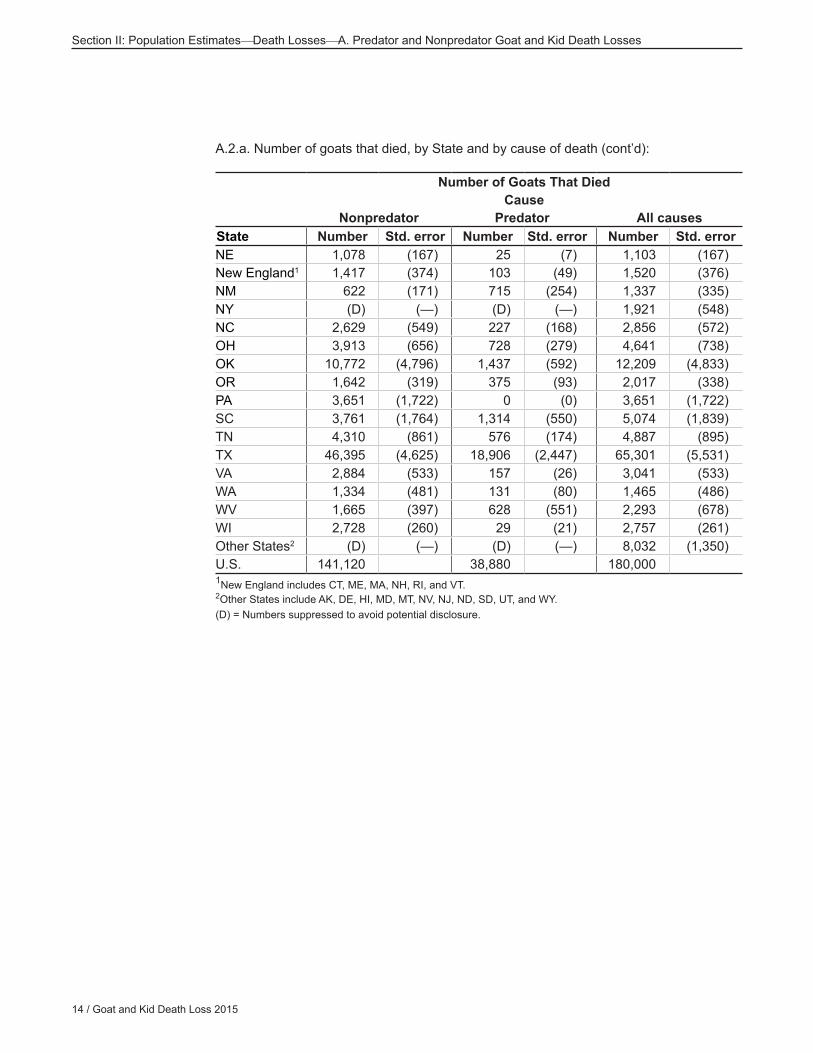
A.2.a. Number of goats that died, by State and by cause of death:
Section II: Population EstimatesDeath LossesA. Predator and Nonpredator Goat and Kid Death Losses
More than $35 million was lost in 2015 due to kid deaths from nonpredator and predator causes. Texas producers lost the most ($11 million). This valuation, however, does not include potential expenses incurred while trying to save these kids.
A.2.e. Value of kids that died, by State and by cause of death:
Section II: Population EstimatesDeath LossesA. Predator and Nonpredator Goat and Kid Death Losses
A.2.e. Value of kids that died, by State and by cause of death (cont’d):
Value of Kids that Died ($1,000)Cause
State Nonpredator Predator All causesNE 293 14 306New England1 256 11 268NM 163 145 308NY 262 33 295NC 504 52 556OH 560 45 605OK 2,688 178 2,866OR 540 76 616PA 914 24 938SC 343 465 808TN 1,205 239 1,444TX 7,120 4,416 11,536VA 631 164 795WA 240 56 297WV 585 26 611WI 764 14 778Other States2 1,199 180 1,379U.S. 27,784 8,767 36,5541New England includes CT, ME, MA, NH, RI, and VT. 2Other States include AK, DE, HI, MD, MT, NV, NJ, ND, SD, UT, and WY.
USDA APHIS VS / 23
Section II: Population EstimatesDeath LossesA. Predator and Nonpredator Goat and Kid Death Losses
The Pacific and Northeast regions had the lowest percentage of operations with any goat deaths compared with the other regions. Approximately one-third of operations in the West Central and Central regions had goat deaths due to any cause in 2015.
A.2.f. Percentage of operations that had any goat deaths, by region and by cause of death:
Percent Operations
Cause
Nonpredator Predator All causes
Region Pct.Std. error Pct.
Std. error Pct.
Std. error
Pacific 14.3 (2.1) 3.5 (0.6) 17.0 (2.3)
West Central 26.2 (2.1) 9.7 (1.2) 32.8 (2.4)
Central 29.9 (2.7) 3.8 (0.9) 33.1 (2.8)
Northeast 17.8 (2.5) 1.6 (0.5) 18.8 (2.5)
Southeast 26.1 (2.4) 4.5 (0.6) 29.4 (2.6)
U.S. 24.5 (1.2) 5.2 (0.4) 28.2 (1.2)
24 / Goat and Kid Death Loss 2015
Section II: Population EstimatesDeath LossesA. Predator and Nonpredator Goat and Kid Death Losses
Across regions, the percentage of operations that had preweaned nonpredator kid deaths was higher than the percentage that had postweaned nonpredator kid deaths. With the exception of the Southeast region, there were no differences across regions in the percentages of operations with pre- and postweaned kid losses due to predators.
A.2.g. Percentage of operations that had any pre- and postweaned kid deaths, by region and by cause of death:
Section II: Population EstimatesDeath LossesA. Predator and Nonpredator Goat and Kid Death Losses
About one-third of operations (34.2 percent) had kid losses. A lower percentage of operations in the Pacific and Northeast regions had kid losses due to nonpredator causes compared with operations in the other regions.The West Central region had the highest percentage of operations with kid losses due to predators.
A.2.h. Percentage of operations that had any kid deaths, by region and by cause of death:
Percent Operations
Cause
Region Nonpredator Predator All causes
Pacific 18.3 (3.7) 3.3 (0.7) 20.3 (3.8)
West Central 31.1 (2.9) 17.3 (2.6) 43.3 (3.3)
Central 35.5 (2.9) 3.4 (0.5) 37.3 (2.9)
Northeast 17.5 (2.4) 2.2 (0.7) 18.6 (2.5)
Southeast 31.1 (2.7) 8.8 (0.9) 36.5 (2.9)
U.S. 28.7 (1.4) 8.5 (0.8) 34.2 (1.5)
26 / Goat and Kid Death Loss 2015
Section II: Population EstimatesDeath LossesA. Predator and Nonpredator Goat and Kid Death Losses
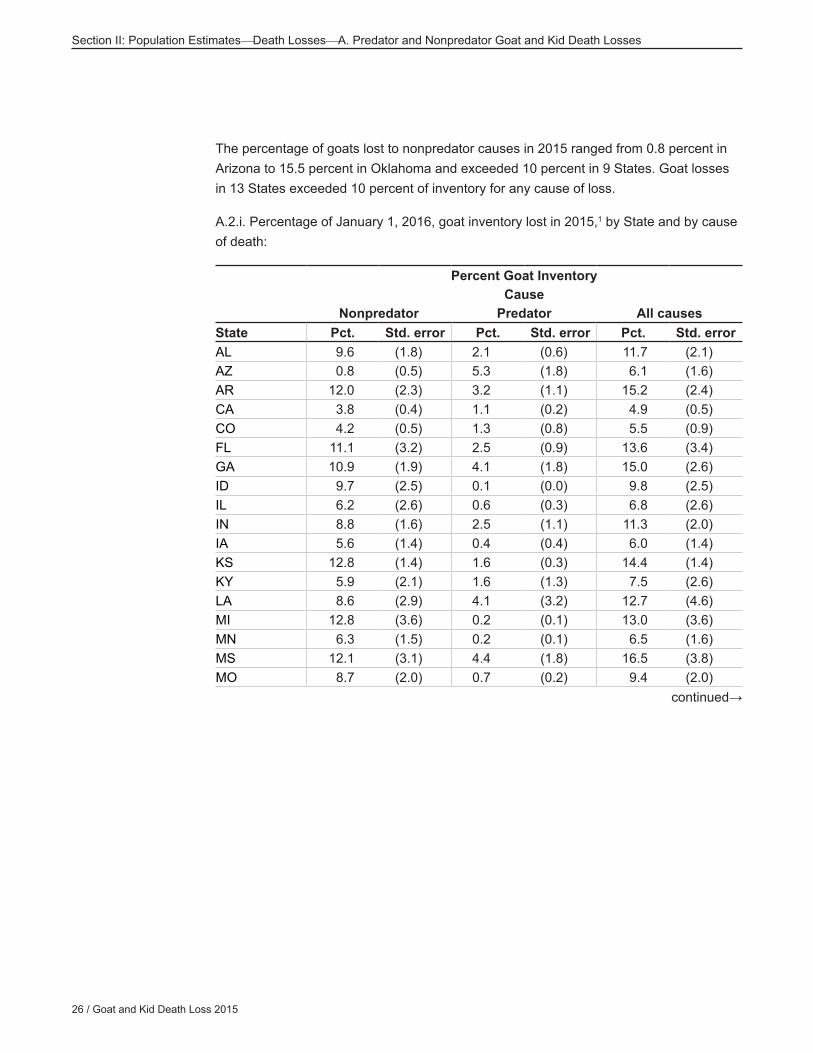
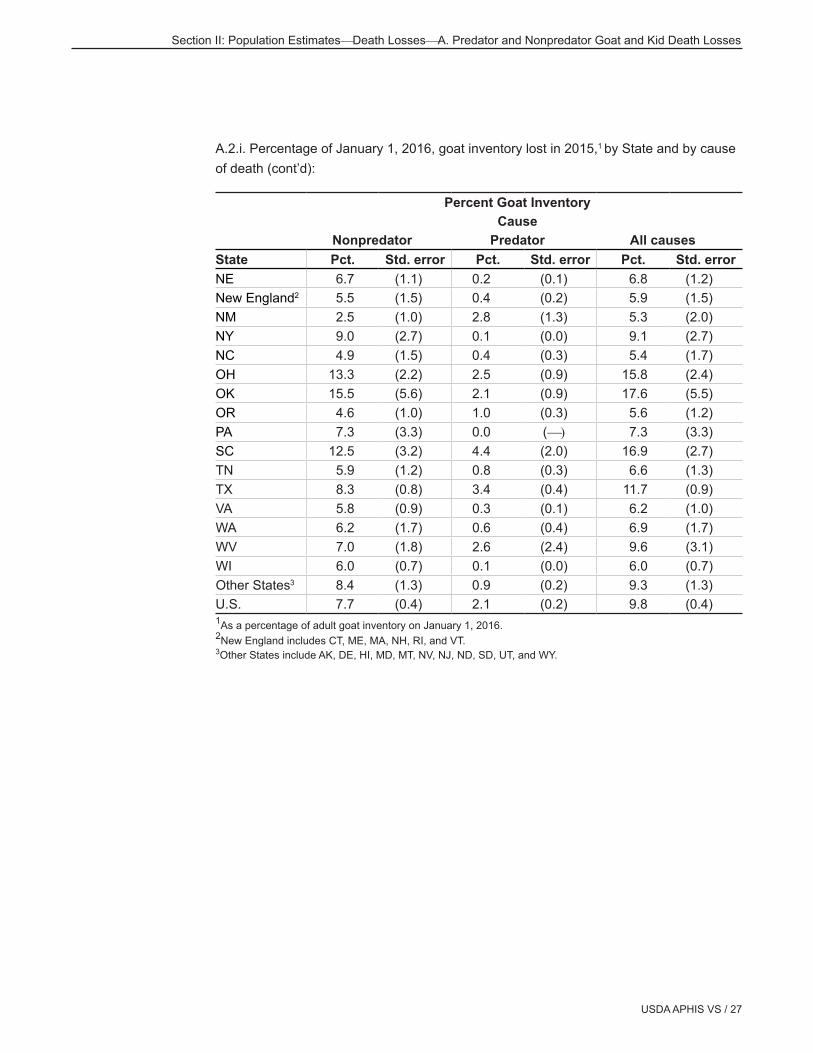
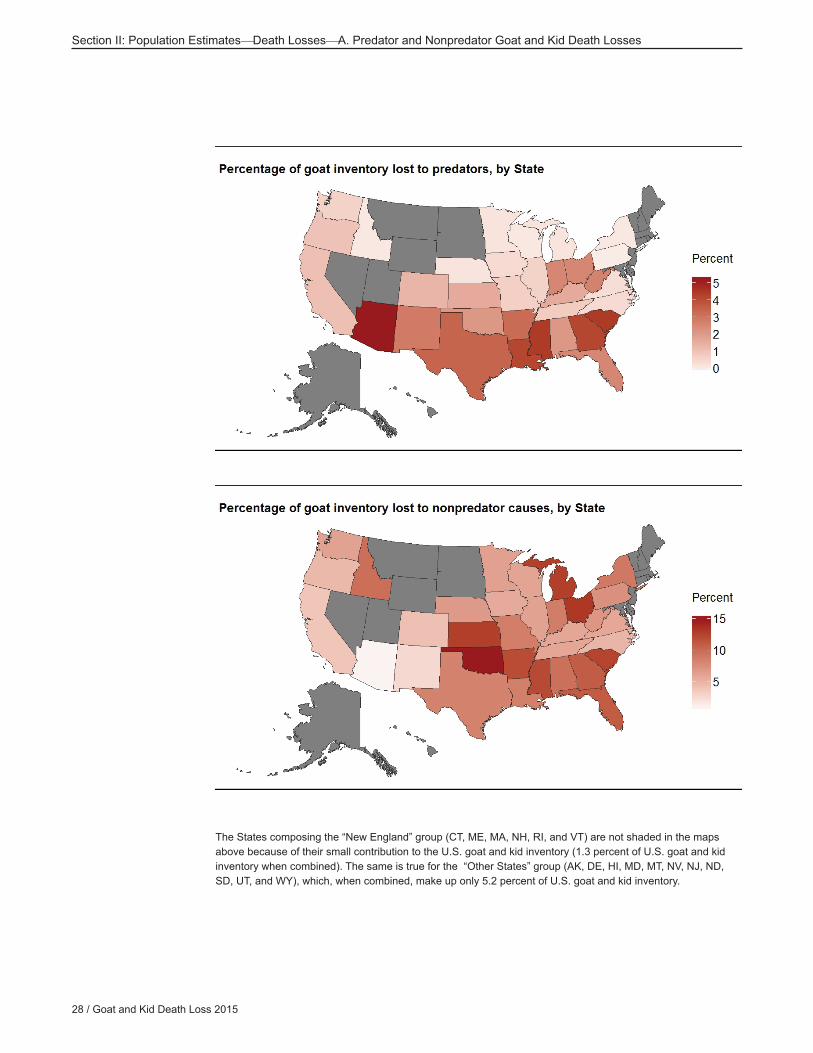
The percentage of goats lost to nonpredator causes in 2015 ranged from 0.8 percent in Arizona to 15.5 percent in Oklahoma and exceeded 10 percent in 9 States. Goat losses in 13 States exceeded 10 percent of inventory for any cause of loss.
A.2.i. Percentage of January 1, 2016, goat inventory lost in 2015,1 by State and by cause of death:
Section II: Population EstimatesDeath LossesA. Predator and Nonpredator Goat and Kid Death Losses
The States composing the “New England” group (CT, ME, MA, NH, RI, and VT) are not shaded in the maps above because of their small contribution to the U.S. goat and kid inventory (1.3 percent of U.S. goat and kid inventory when combined). The same is true for the “Other States” group (AK, DE, HI, MD, MT, NV, NJ, ND, SD, UT, and WY), which, when combined, make up only 5.2 percent of U.S. goat and kid inventory.
USDA APHIS VS / 29
Section II: Population EstimatesDeath LossesA. Predator and Nonpredator Goat and Kid Death Losses
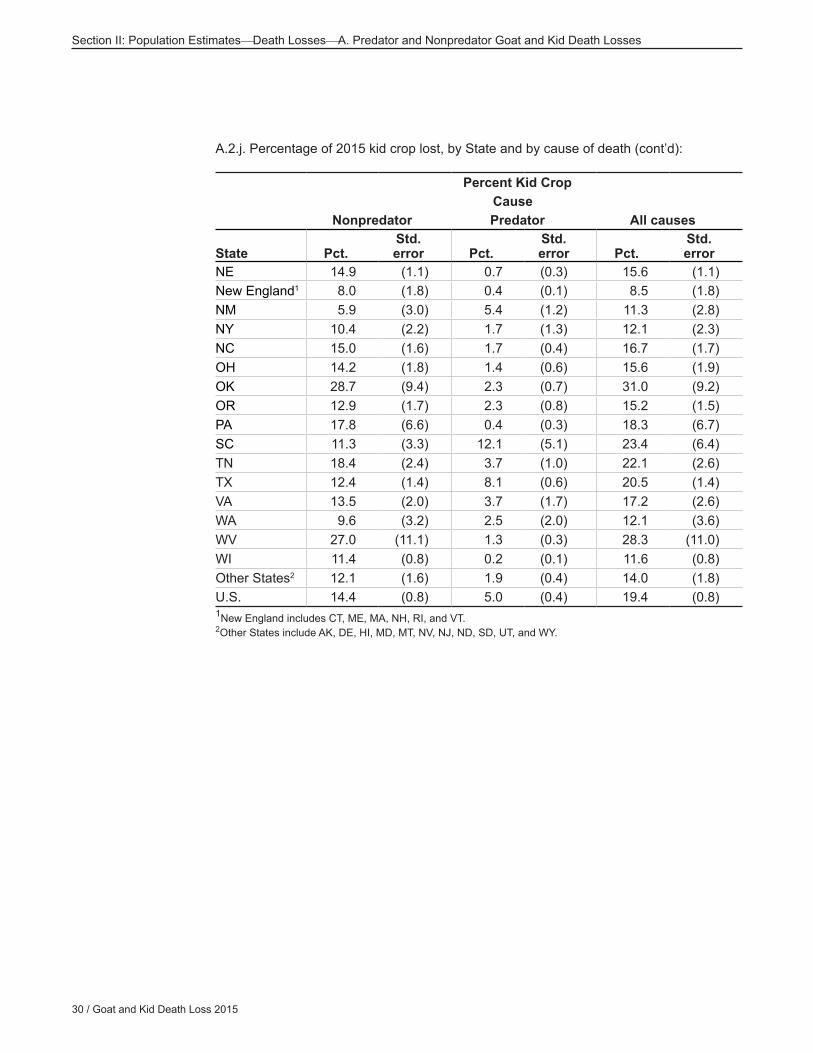
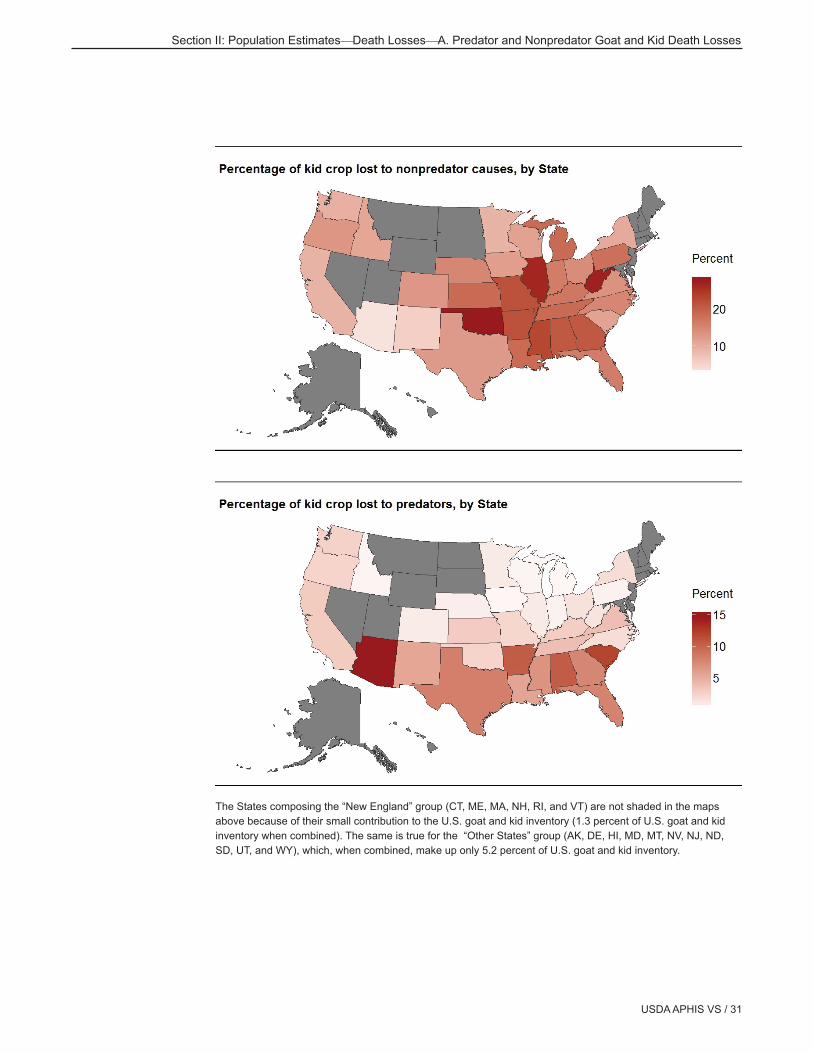
The percentage of kids lost to nonpredator causes ranged from 3.6 percent in Arizona to 28.7 percent in Oklahoma. Just over 10 percent of kids lost in Alabama, Arizona, Arkansas, and South Carolina were lost to predators.
A.2.j. Percentage of 2015 kid crop lost, by State and by cause of death:
Section II: Population EstimatesDeath LossesA. Predator and Nonpredator Goat and Kid Death Losses
The States composing the “New England” group (CT, ME, MA, NH, RI, and VT) are not shaded in the maps above because of their small contribution to the U.S. goat and kid inventory (1.3 percent of U.S. goat and kid inventory when combined). The same is true for the “Other States” group (AK, DE, HI, MD, MT, NV, NJ, ND, SD, UT, and WY), which, when combined, make up only 5.2 percent of U.S. goat and kid inventory.
32 / Goat and Kid Death Loss 2015
Section II: Population EstimatesDeath LossesA. Predator and Nonpredator Goat and Kid Death Losses
3. Nonpredator goat and kid death losses
The largest numbers and highest percentages of nonpredator death losses in goats and kids were due to undetermined causes (found dead or unknown). Of known causes, internal parasites were the primary cause of loss, resulting in almost 87,000 goat and kid deaths. Weather-related causes and kidding problems were also important causes of loss. On average, kidding problems accounted for approximately 2.5 kid deaths for every goat lost to kidding problems in 2015.
A.3.a. Number and percentage of nonpredator death losses in goats and kids, by cause of death:
Total 141,120 100.0 177,258 100.0 63,988 100.0 241,246 100.0 382,366 100.01Such as bloat, scours, or acidosis. 2Such as milk fever or grass tetany. 3Such as mastitis or foot rot. 4Such as chilling, drowning, or lightning. 5Such as by nitrate, noxious feeds, or noxious weeds. 6Such as lameness. 7With cause undetermined.
USDA APHIS VS / 33
Section II: Population EstimatesDeath LossesA. Predator and Nonpredator Goat and Kid Death Losses
The percentage of kid crop lost to nonpredator causes (14.4 percent) was almost twice the percentage of goat inventory lost to nonpredator causes (7.7 percent). Kids were lost to weather-related causes at nearly eight times the frequency of goats.
A.3.b. Percentage of January 1, 2016, goat inventory and kid crop lost to nonpredator causes:
CausePercent
inventoryStd. error
Percent kid crop
Std. error
Enterotoxemia (overeating) 0.1 (0.0) 0.2 (0.0)
Internal parasites 1.9 (0.3) 3.1 (0.6)
Other digestive problems1 0.4 (0.1) 0.8 (0.1)
Respiratory problems 0.3 (0.1) 0.8 (0.1)
Metabolic problems2 0.1 (0.0) 0.2 (0.1)
Other disease problems3 0.2 (0.0) 0.3 (0.1)
Weather related4 0.3 (0.0) 2.3 (0.2)
Starvation 0.1 (0.1) 0.2 (0.1)
Kidding problems 0.4 (0.0) 1.1 (0.2)
Pregnancy toxemia 0.1 (0.0)
Poisoning5 0.1 (0.0) 0.2 (0.1)
Theft (stolen) 0.1 (0.0) 0.1 (0.0)
Other nonpredator causes6 0.8 (0.1) 1.3 (0.5)
Found dead7 1.2 (0.2) 1.5 (0.2)
Unknown nonpredator causes 1.6 (0.1) 2.5 (0.2)
Total 7.7 (0.4) 14.4 (0.8)1Such as bloat, scours, or acidosis.2Such as milk fever or grass tetany.3Such as mastitis or foot rot.4Such as chilling, drowning, or lightning.5Such as by nitrate, noxious feeds, or noxious weeds.6Such as lameness.7With cause undetermined.
34 / Goat and Kid Death Loss 2015
Section II: Population EstimatesDeath LossesA. Predator and Nonpredator Goat and Kid Death Losses
Respiratory problems caused a higher percentage of deaths on operations with 100 or more goats and kids than on operations with 1 to 9 goats and kids. Conversely, the percentage of animals found dead was higher on operations with 1 to 9 goats and kids than on operations with 100 or more goats and kids
A.3.c. Percentage of nonpredator death losses in goats, by cause of death and by size of operation:
Percent Loss Size of Operation (number of goats and kids)
Total 100.0 100.0 100.0 100.0 100.01Such as bloat, scours, or acidosis.2Such as milk fever.3Such as mastitis or foot rot.4Such as chilling, drowning, or lightning.5Such as by nitrate, noxious feeds, or noxious weeds.6Such as lameness.7With cause undetermined.
USDA APHIS VS / 35
Section II: Population EstimatesDeath LossesA. Predator and Nonpredator Goat and Kid Death Losses
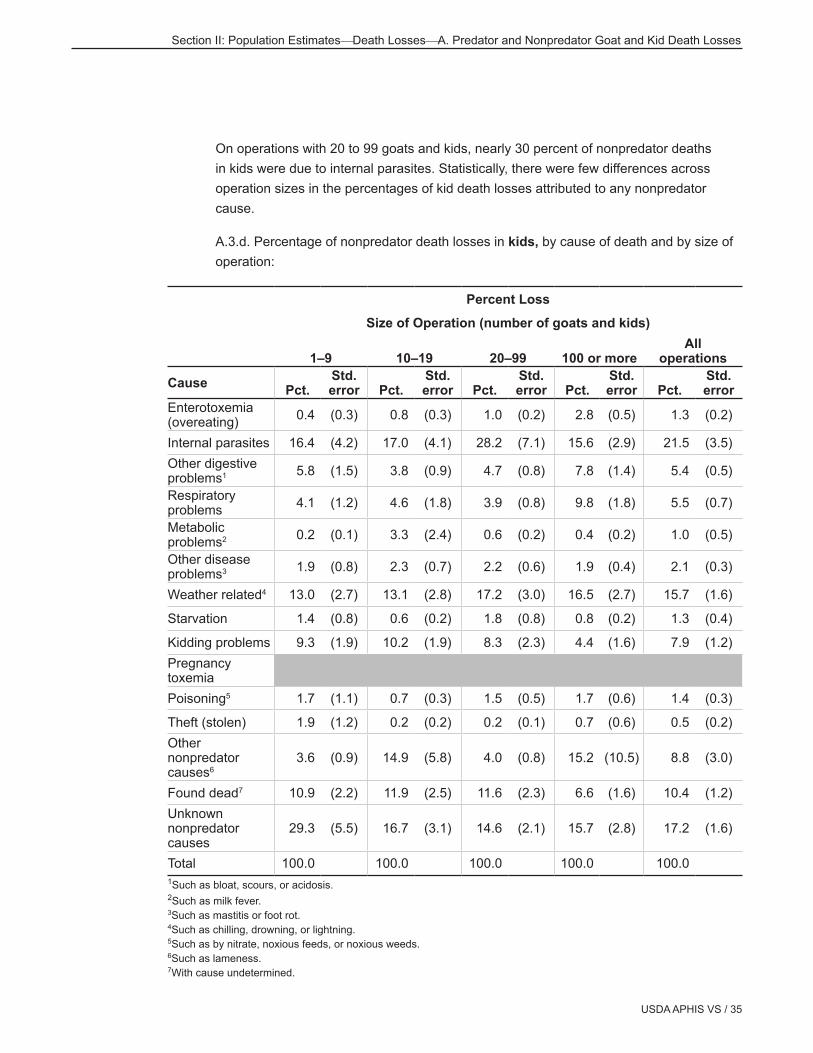
On operations with 20 to 99 goats and kids, nearly 30 percent of nonpredator deaths in kids were due to internal parasites. Statistically, there were few differences across operation sizes in the percentages of kid death losses attributed to any nonpredator cause.
A.3.d. Percentage of nonpredator death losses in kids, by cause of death and by size of operation:
Total 100.0 100.0 100.0 100.0 100.01Such as bloat, scours, or acidosis.2Such as milk fever.3Such as mastitis or foot rot.4Such as chilling, drowning, or lightning.5Such as by nitrate, noxious feeds, or noxious weeds.6Such as lameness.7With cause undetermined.
36 / Goat and Kid Death Loss 2015
Section II: Population EstimatesDeath LossesA. Predator and Nonpredator Goat and Kid Death Losses
Generally, there were no regional differences in the percentages of goat deaths attributable to nonpredator causes. One exception was that the Pacific and Northeast regions had a lower percentage of nonpredator deaths attributed to internal parasites than the West Central and Southeast regions. Also, the Pacific region had a higher percentage of nonpredator deaths due to respiratory disease than the West Central region.
A.3.e Percentage of nonpredator death losses in goats, by cause of death and by region:
Section II: Population EstimatesDeath LossesA. Predator and Nonpredator Goat and Kid Death Losses
Generally, there were no substantial differences across regions in the percentages of kid deaths due to nonpredator causes; however, the Pacific region had a lower percentage of nonpredator deaths due to internal parasites than the West Central region.
A.3.f. Percentage of nonpredator death losses in kids, by cause of death and by region:
Section II: Population EstimatesDeath LossesA. Predator and Nonpredator Goat and Kid Death Losses
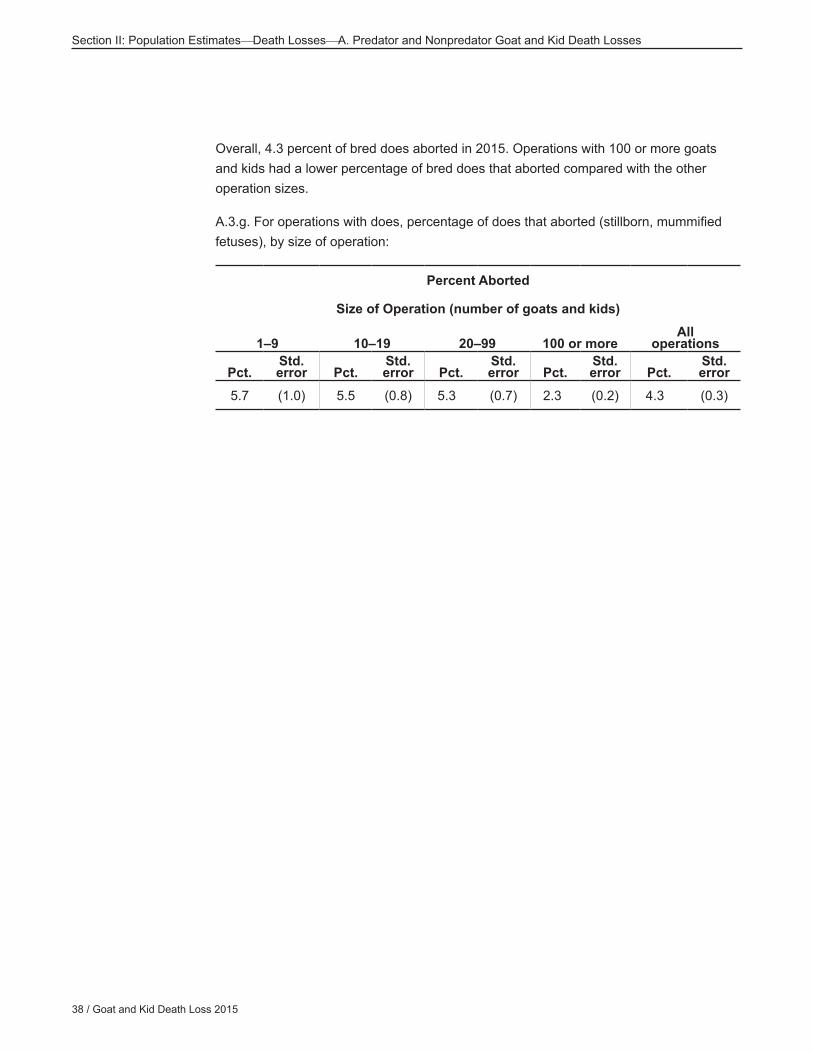
Overall, 4.3 percent of bred does aborted in 2015. Operations with 100 or more goats and kids had a lower percentage of bred does that aborted compared with the other operation sizes.
A.3.g. For operations with does, percentage of does that aborted (stillborn, mummified fetuses), by size of operation:
Percent Aborted
Size of Operation (number of goats and kids)
1–9 10–19 20–99 100 or moreAll
operations
Pct.Std. error Pct.
Std. error Pct.
Std. error Pct.
Std. error Pct.
Std. error
5.7 (1.0) 5.5 (0.8) 5.3 (0.7) 2.3 (0.2) 4.3 (0.3)
USDA APHIS VS / 39
Section II: Population EstimatesDeath LossesA. Predator and Nonpredator Goat and Kid Death Losses
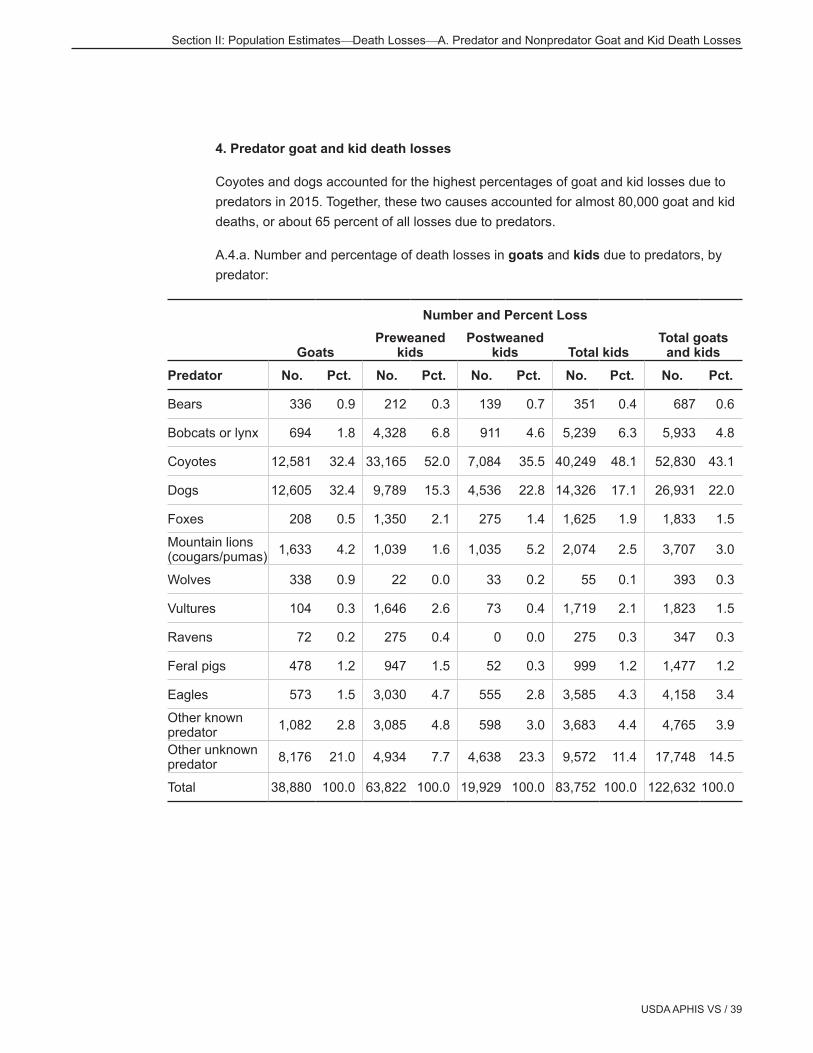
4. Predator goat and kid death losses
Coyotes and dogs accounted for the highest percentages of goat and kid losses due to predators in 2015. Together, these two causes accounted for almost 80,000 goat and kid deaths, or about 65 percent of all losses due to predators.
A.4.a. Number and percentage of death losses in goats and kids due to predators, by predator:
Section II: Population EstimatesDeath LossesA. Predator and Nonpredator Goat and Kid Death Losses
After canids and “other unknown predator causes,” mountain lions accounted for the third highest percentage of goat losses due to predators. There were no differences across operation sizes in the percentages of goats lost to specific predators.
A.4.b. Percentage of goat death losses due to predators, by predator and by size of operation:
Section II: Population EstimatesDeath LossesA. Predator and Nonpredator Goat and Kid Death Losses
Dogs accounted for 32.4 percent of goat death losses due to predators (see previous table) and 17.1 percent of kid death losses due to predators. Kid losses were attributed to eagles and feral pigs at a higher proportion of operations with 100 or more head compared with other operation sizes.
A.4.c. Percentage of death losses in kids due to predators, by predator and by size of operation:
Section II: Population EstimatesDeath LossesA. Predator and Nonpredator Goat and Kid Death Losses
Predator-related goat deaths as a percentage of January 1, 2016, goat inventory were 2.1 percent in total but were less than 1 percent for any single predator. All predator causes combined accounted for the loss of 5.0 percent of the 2015 kid crop. Coyotes were the single largest cause of kid deaths due to predators, accounting for 2.4 percent of kids born.
A.4.d. Percentage of January 1, 2016, goat inventory lost and percentage of 2015 kid crop lost, by predator:
Section II: Population EstimatesDeath LossesA. Predator and Nonpredator Goat and Kid Death Losses
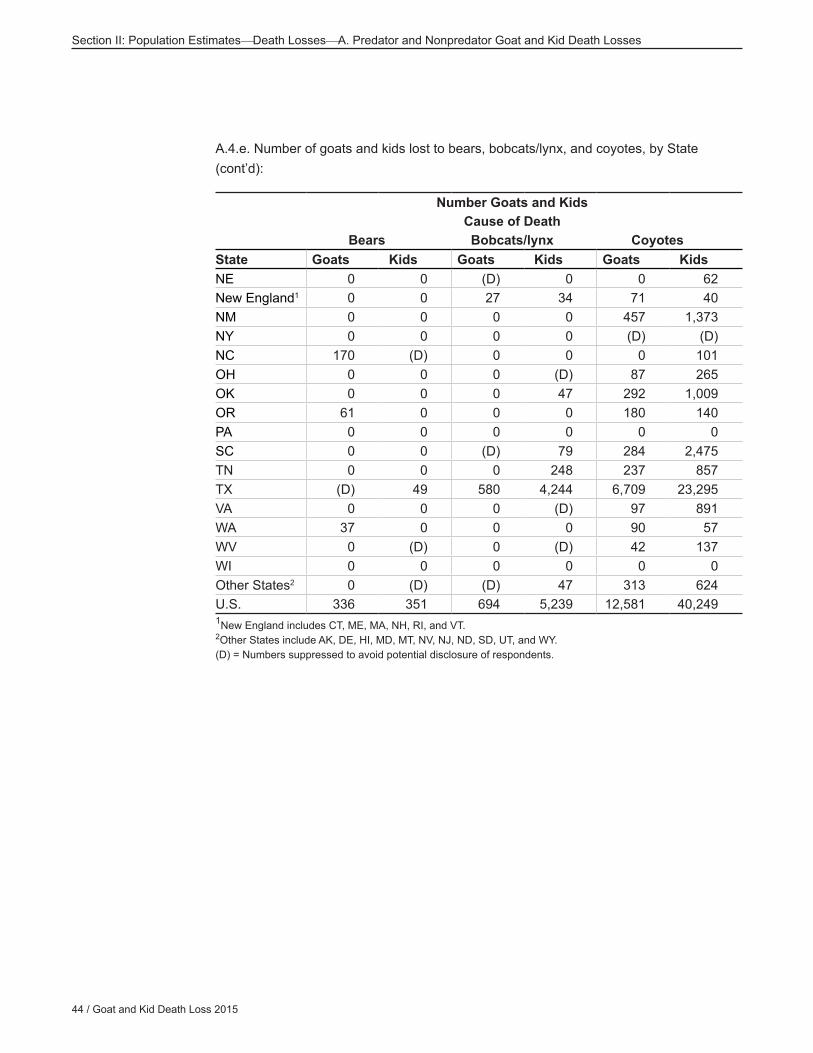
Relatively few goats or kids were lost to bears in 2015; in fact, death by bears appeared to be a regional occurrence. Washington and Oregon accounted for nearly 30 percent of all goat deaths due to bears, while Florida had the most kid deaths due to bears: 212 kid deaths or 60.4 percent of all kid deaths were due to bears in Florida.
A.4.e. Number of goats and kids lost to bears, bobcats/lynx, and coyotes, by State:
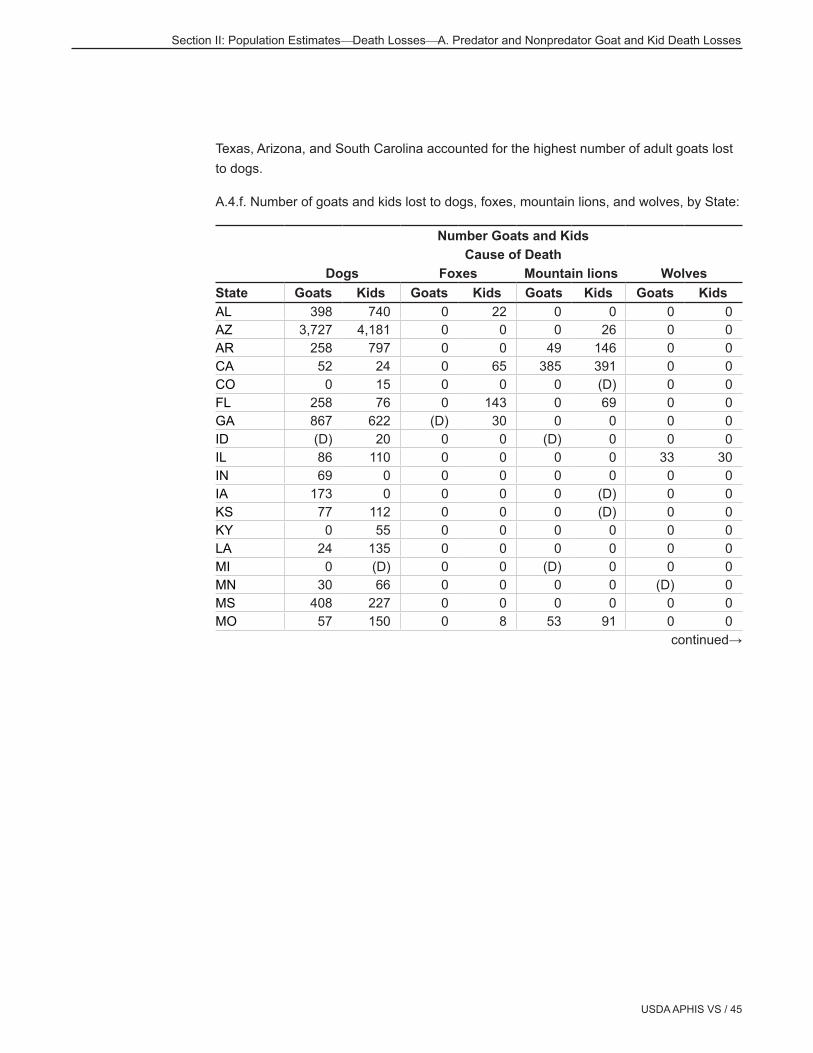
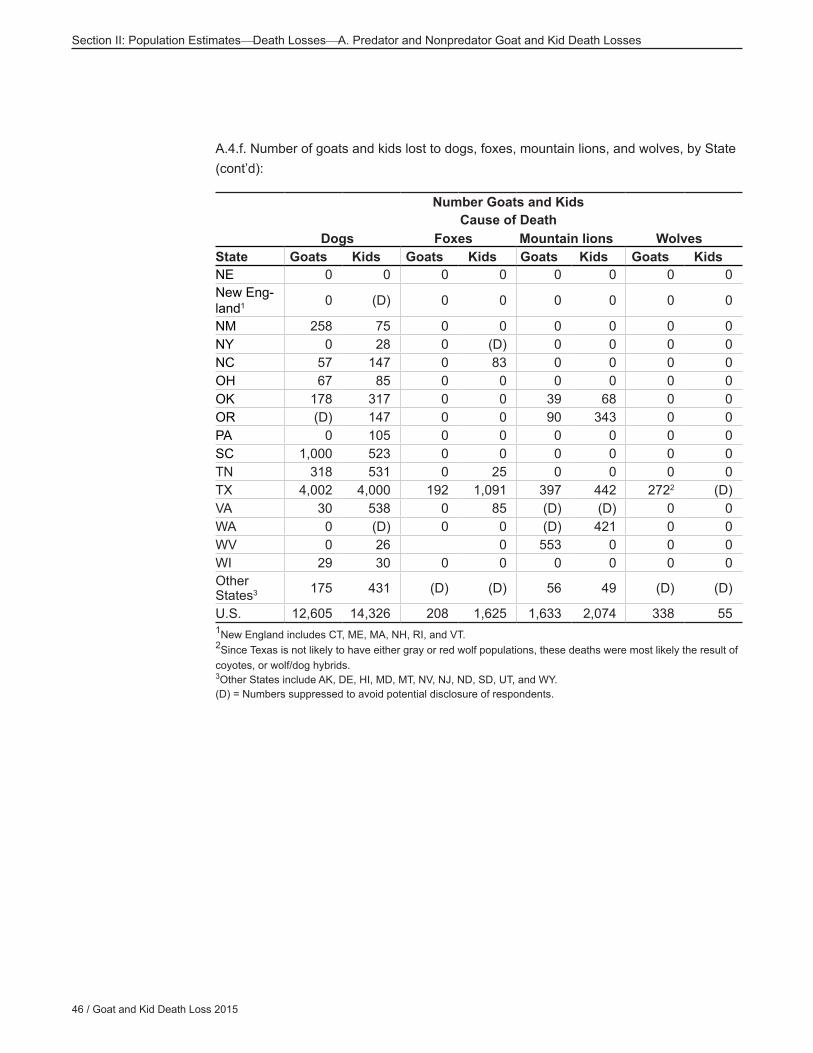
U.S. 12,605 14,326 208 1,625 1,633 2,074 338 551New England includes CT, ME, MA, NH, RI, and VT. 2Since Texas is not likely to have either gray or red wolf populations, these deaths were most likely the result of coyotes, or wolf/dog hybrids.3Other States include AK, DE, HI, MD, MT, NV, NJ, ND, SD, UT, and WY. (D) = Numbers suppressed to avoid potential disclosure of respondents.
USDA APHIS VS / 47
Section II: Population EstimatesDeath LossesA. Predator and Nonpredator Goat and Kid Death Losses
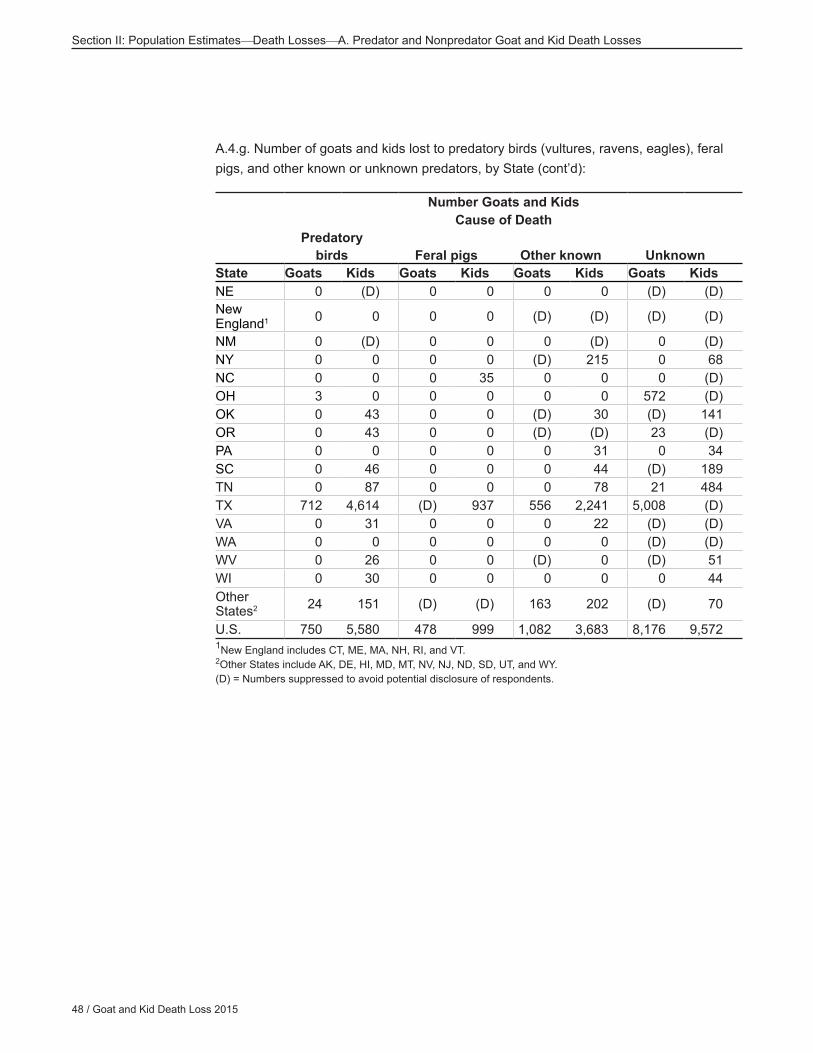
Seven times as many kids than goats were lost to predatory birds in 2015.
A.4.g. Number of goats and kids lost to predatory birds (vultures, ravens, eagles), feral pigs, and other known or unknown predators, by State:
Section II: Population EstimatesDeath LossesA. Predator and Nonpredator Goat and Kid Death Losses
A.4.g. Number of goats and kids lost to predatory birds (vultures, ravens, eagles), feral pigs, and other known or unknown predators, by State (cont’d):
U.S. 750 5,580 478 999 1,082 3,683 8,176 9,5721New England includes CT, ME, MA, NH, RI, and VT. 2Other States include AK, DE, HI, MD, MT, NV, NJ, ND, SD, UT, and WY. (D) = Numbers suppressed to avoid potential disclosure of respondents.
USDA APHIS VS / 49
Section II: Population EstimatesDeath LossesA. Predator and Nonpredator Goat and Kid Death Losses
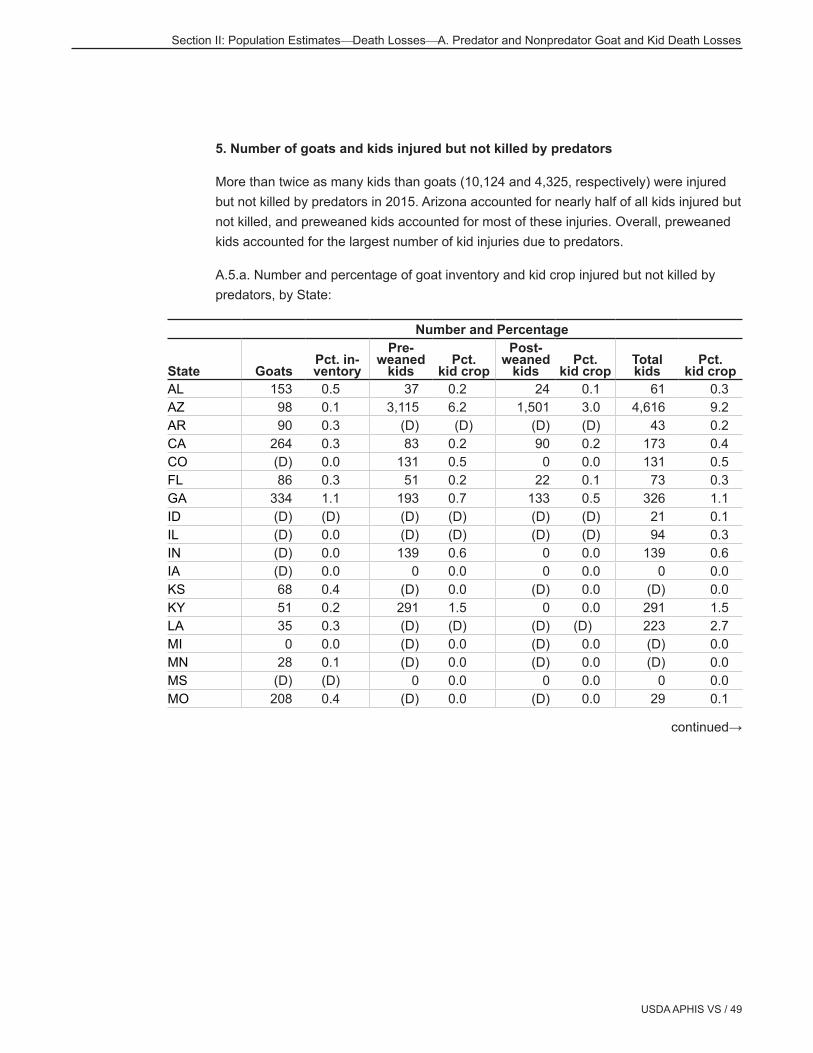
5. Number of goats and kids injured but not killed by predators
More than twice as many kids than goats (10,124 and 4,325, respectively) were injured but not killed by predators in 2015. Arizona accounted for nearly half of all kids injured but not killed, and preweaned kids accounted for most of these injuries. Overall, preweaned kids accounted for the largest number of kid injuries due to predators.
A.5.a. Number and percentage of goat inventory and kid crop injured but not killed by predators, by State:
U.S. 4,325 0.3 6,183 0.4 3,941 0.3 10,124 0.61New England includes CT, ME, MA, NH, RI, and VT. 2Other States include AK, DE, HI, MD, MT, NV, NJ, ND, SD, UT, and WY. (D) = Numbers suppressed to avoid potential disclosure of respondents.
USDA APHIS VS / 51
Section II: Population EstimatesDeath LossesA. Predator and Nonpredator Goat and Kid Death Losses
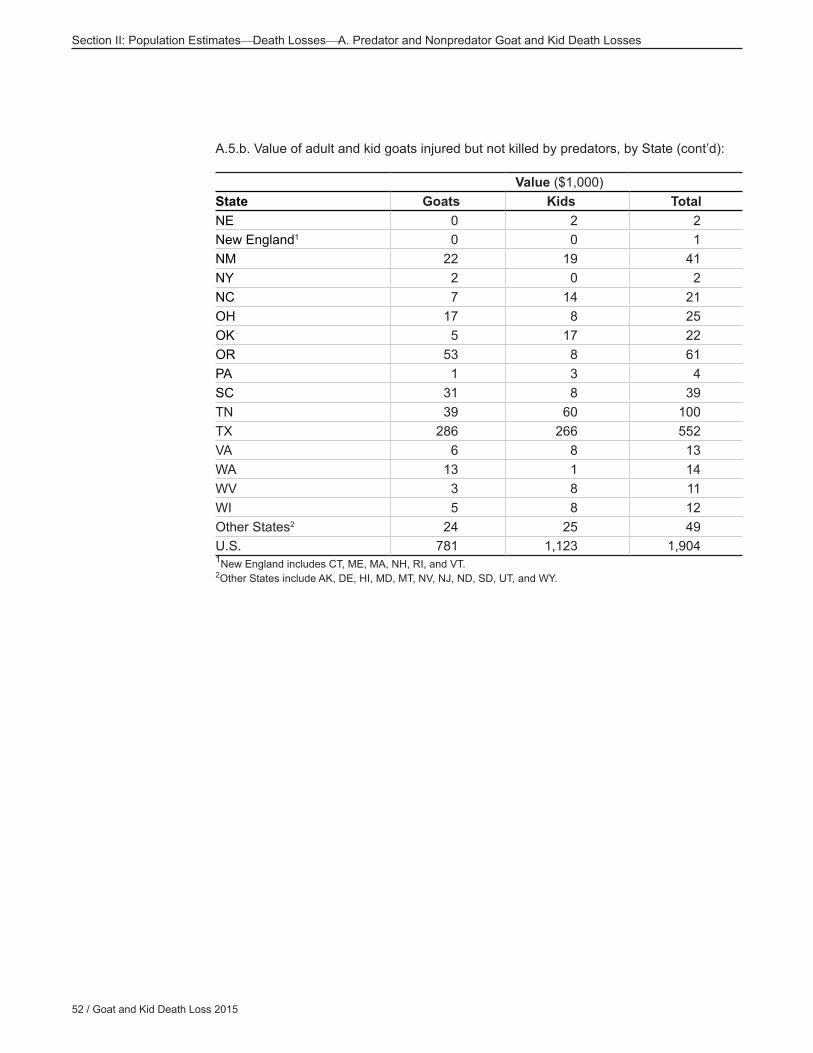
The total value of goats and kids injured but not killed by predators in 2015 was $1.9 million. It was assumed that injured goats or kids had no market value.
A.5.b. Value of goats and kids injured but not killed by predators, by State:
Section II: Population EstimatesDeath LossesA. Predator and Nonpredator Goat and Kid Death Losses
6. Nonlethal methods used to prevent losses caused by wildlife
Overall, 93 percent of operations used some kind of nonlethal method to control predators in 2015. The most common method (besides “other nonlethal”) was fencing, followed by guard dogs and night penning. Night penning includes putting up lights or motion-controlled lighting systems to keep predators away and was used by nearly one-fourth of operations in 2015.
A.6.a. Percentage of operations by nonlethal method(s) used to control predators:
Predator control method Percent operations Std. error
Guard dogs for goats 33.0 (1.8)
Llamas for guarding goats 4.2 (0.6)
Donkeys for guarding goats 9.6 (0.8)
Fencing (predator exclusion fencing) 44.5 (1.9)
Kid shed 18.3 (1.3)
Herding 5.5 (0.6)
Night penning 23.8 (1.5)
Fright tactics 2.1 (0.4)
Removing carrion 5.0 (0.5)
Culling older goats to prevent death loss 7.0 (0.8)
Changing bedding grounds 6.3 (0.7)
More frequent checks in high predation areas/seasons 10.3 (0.9)
Altered breeding season so kids are not born when predators such as coyotes are feeding their young
2.3 (0.4)
Other nonlethal 57.8 (1.9)
Any 93.0 (1.0)
54 / Goat and Kid Death Loss 2015
Section II: Population EstimatesDeath LossesA. Predator and Nonpredator Goat and Kid Death Losses
Although there was no difference by herd size in the overall percentage of operations that used any nonlethal predator control methods, there were some size-related differences in individual methods. A higher percentage of operations with 10 to 19 goats and kids used fencing than operations with 100 or more goats and kids. In addition, a higher percentage of operations with 100 or more goats and kids culled older goats, did more frequent checks in high predation areas/seasons, and removed carrion to prevent death loss by predators compared with smaller sized operations.
A.6.b. Percentage of operations by nonlethal method(s) used to control predators, and by size of operation:
Percent OperationsSize of Operation (number of goats and kids)
Section II: Population EstimatesDeath LossesA. Predator and Nonpredator Goat and Kid Death Losses
About the same percentage of operations used two or more predator control methods as used a single method. The most common single method was “other,” which might have included multiple other methods.
A.6.c. For operations that used nonlethal predator control methods, percentage of operations by number of nonlethal methods used:
Number of methods Percent operations Std. error
1 46.3 (2.1)
2 19.1 (1.3)
3 11.3 (0.9)
4 8.5 (1.0)
5 6.2 (0.9)
6 2.6 (0.4)
7 or more 6.1 (0.7)
Total 100.0
56 / Goat and Kid Death Loss 2015
Section II: Population EstimatesDeath LossesA. Predator and Nonpredator Goat and Kid Death Losses
Overall, 44.5 percent of operations used fencing either alone or in combination with other nonlethal predator control methods (table A.6.b) and 12.5 percent used fencing only.
A.6.d. Percentage of operations by the top 15 nonlethal predator control methods used singly and in combination:
Rank Method Percent operations
1 Other nonlethal methods only 22.8 (1.9)
2 Fencing only 12.5 (2.0)
3 Guard dogs only 6.2 (1.0)
4 Guard dogs Fencing 3.9 (0.5)
5 Fencing Other nonlethal methods 3.1 (0.5)
6 Guard dogs Other nonlethal methods 2.6 (0.6)
7 Night penning Other nonlethal methods 2.1 (0.5)
8 Guard donkeys only 1.7 (0.3)
9 Night penning only 1.7 (0.5)
10Guard dogs Fencing Other nonlethal methods
1.6 (0.4)
11
Guard dogs Fencing Kid shed Night penning Other nonlethal methods
1.6 (0.6)
12Fencing Night penning Other nonlethal methods
1.3 (0.3)
13Fencing Kid shed Other nonlethal methods
1.2 (0.3)
14 Fencing Kid shed 1.1 (0.2)
15Fencing Kid shed Night penning Other nonlethal methods
0.9 (0.4)
Other nonlethal predator control method combinations 35.7 (1.7)
Total 100.0
USDA APHIS VS / 57
Section II: Population EstimatesDeath LossesA. Predator and Nonpredator Goat and Kid Death Losses
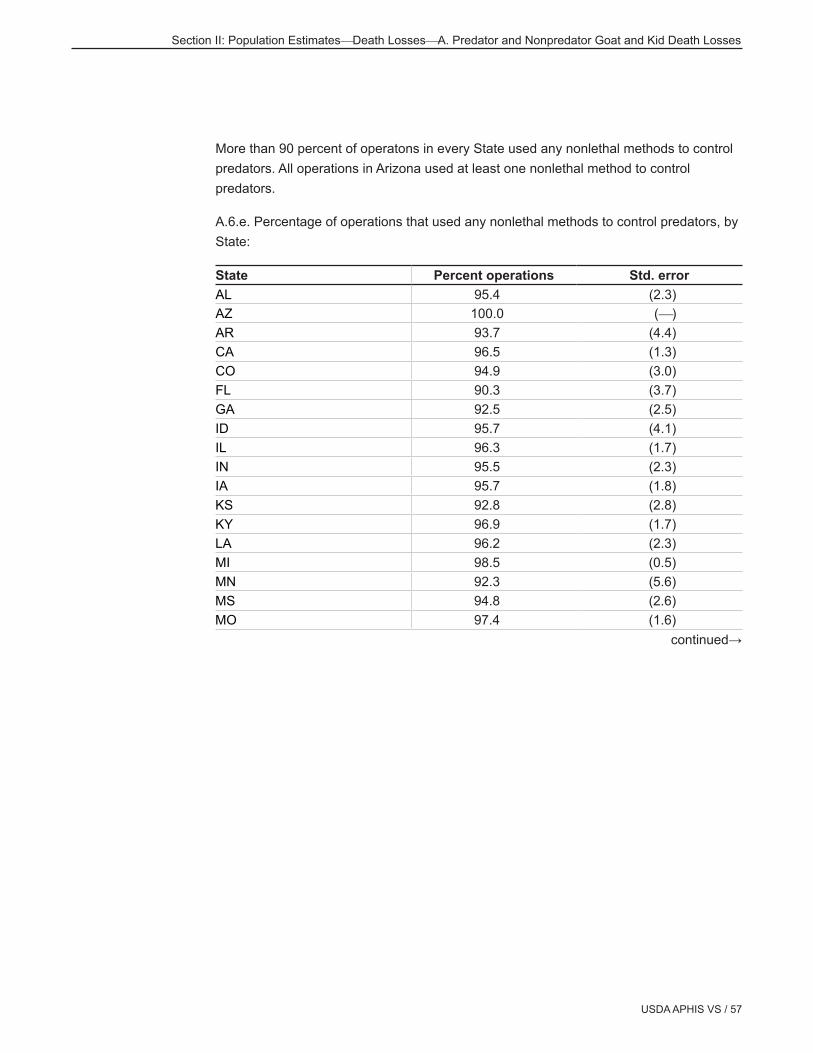
More than 90 percent of operatons in every State used any nonlethal methods to control predators. All operations in Arizona used at least one nonlethal method to control predators.
A.6.e. Percentage of operations that used any nonlethal methods to control predators, by State:
Section II: Population EstimatesDeath LossesA. Predator and Nonpredator Goat and Kid Death Losses
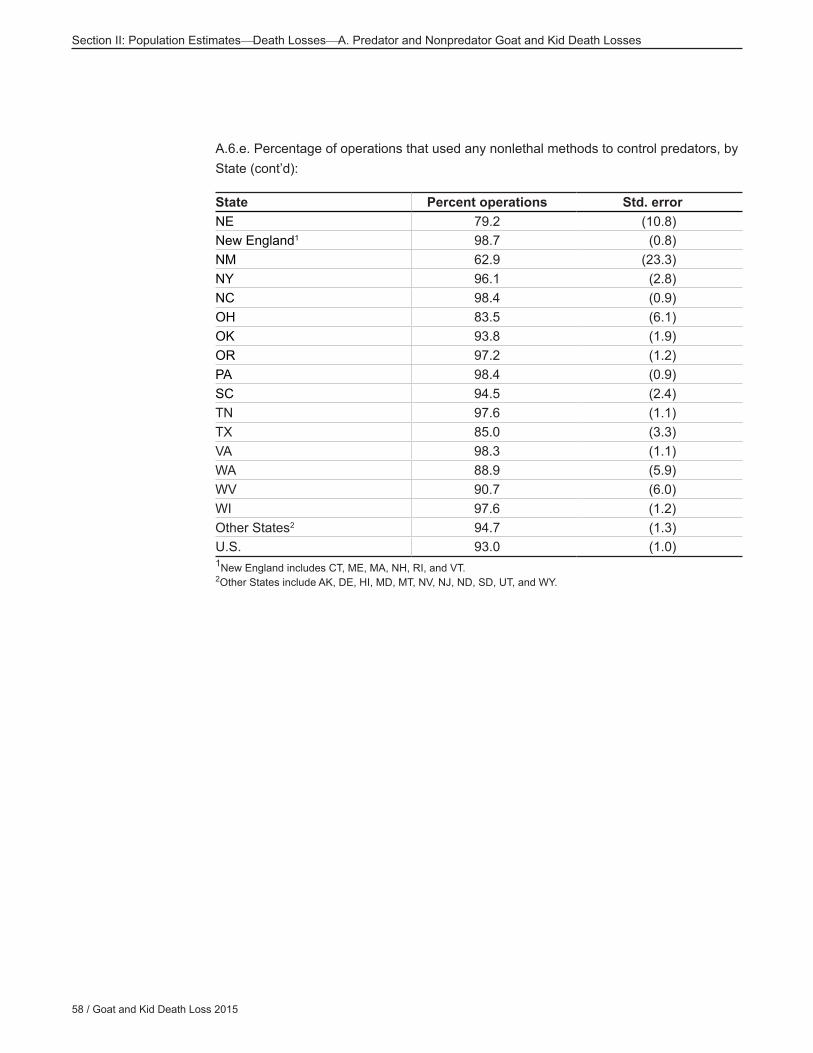
A.6.e. Percentage of operations that used any nonlethal methods to control predators, by State (cont’d):
State Percent operations Std. errorNE 79.2 (10.8)New England1 98.7 (0.8)NM 62.9 (23.3)NY 96.1 (2.8)NC 98.4 (0.9)OH 83.5 (6.1)OK 93.8 (1.9)OR 97.2 (1.2)PA 98.4 (0.9)SC 94.5 (2.4)TN 97.6 (1.1)TX 85.0 (3.3)VA 98.3 (1.1)WA 88.9 (5.9)WV 90.7 (6.0)WI 97.6 (1.2)Other States2 94.7 (1.3)U.S. 93.0 (1.0)1New England includes CT, ME, MA, NH, RI, and VT. 2Other States include AK, DE, HI, MD, MT, NV, NJ, ND, SD, UT, and WY.
USDA APHIS VS / 59
Section II: Population EstimatesDeath LossesA. Predator and Nonpredator Goat and Kid Death Losses
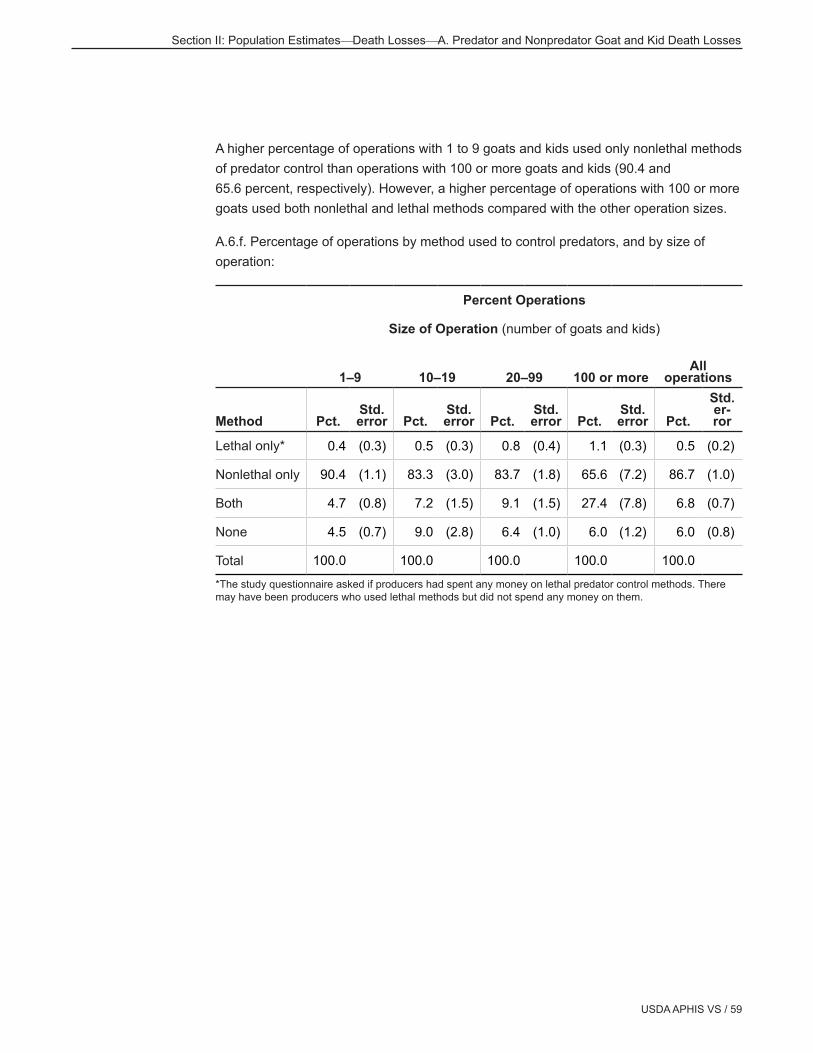
A higher percentage of operations with 1 to 9 goats and kids used only nonlethal methods of predator control than operations with 100 or more goats and kids (90.4 and 65.6 percent, respectively). However, a higher percentage of operations with 100 or more goats used both nonlethal and lethal methods compared with the other operation sizes.
A.6.f. Percentage of operations by method used to control predators, and by size of operation:
*The study questionnaire asked if producers had spent any money on lethal predator control methods. There may have been producers who used lethal methods but did not spend any money on them.
60 / Goat and Kid Death Loss 2015
Section II: Population EstimatesDeath LossesA. Predator and Nonpredator Goat and Kid Death Losses
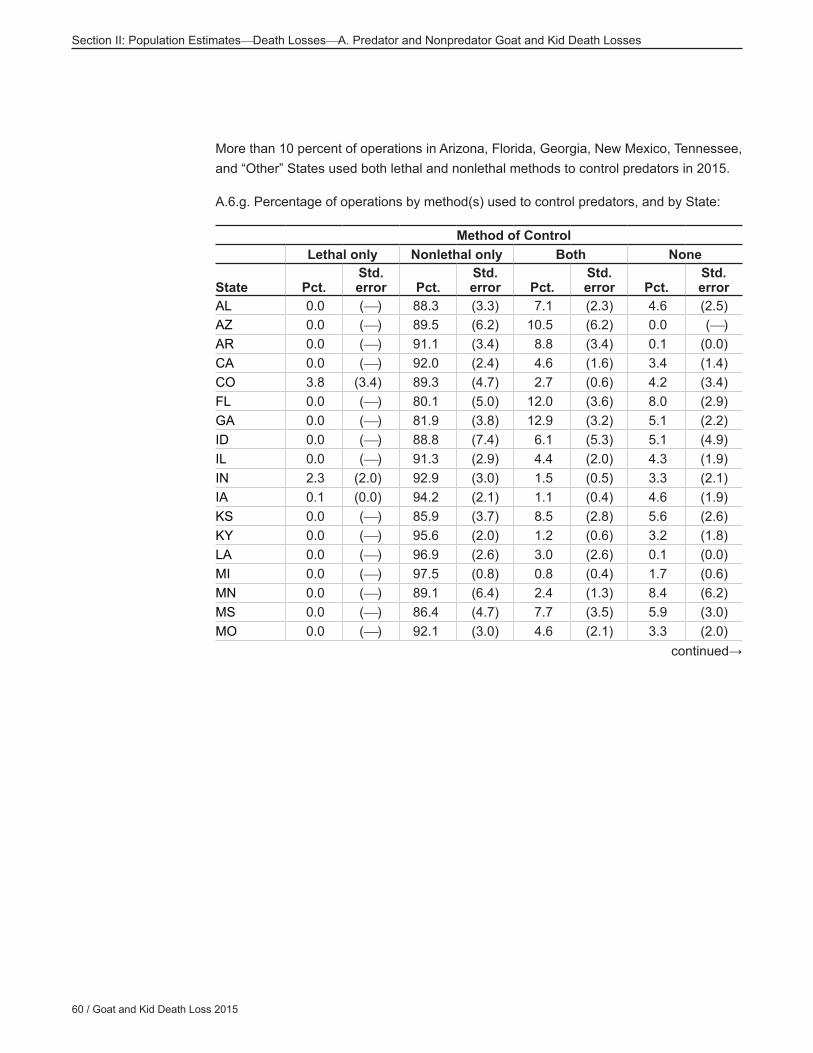
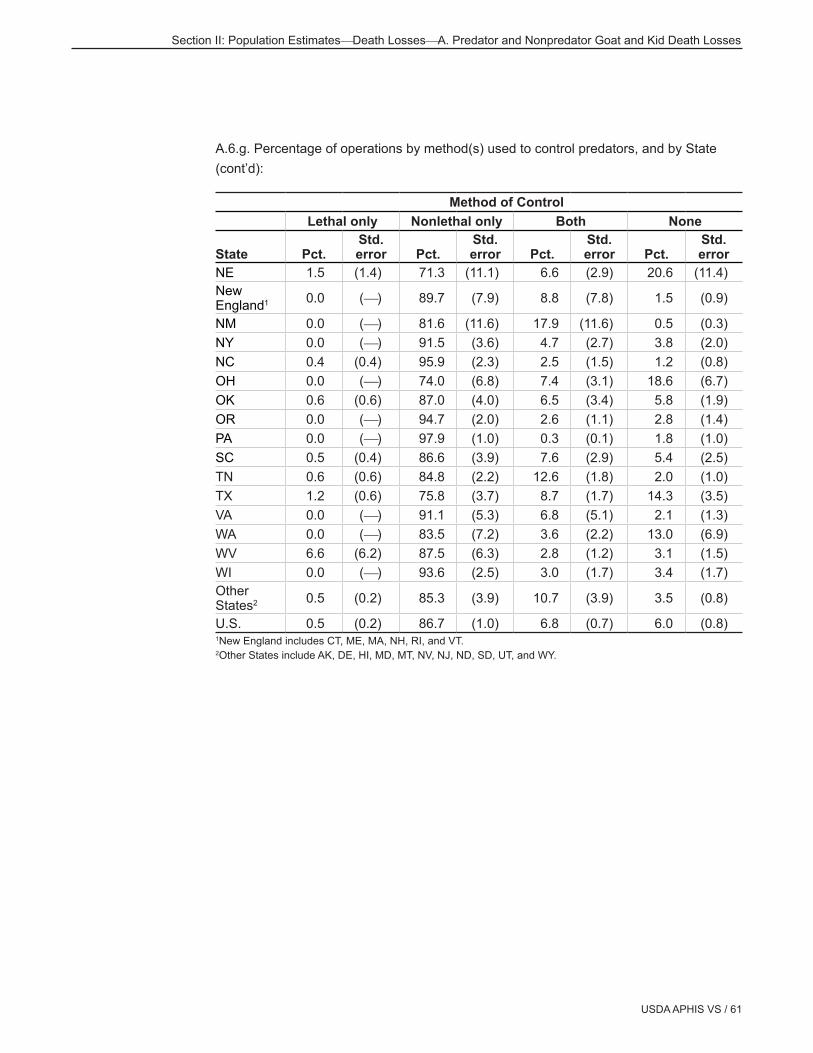
More than 10 percent of operations in Arizona, Florida, Georgia, New Mexico, Tennessee, and “Other” States used both lethal and nonlethal methods to control predators in 2015.
A.6.g. Percentage of operations by method(s) used to control predators, and by State:
Method of ControlLethal only Nonlethal only Both None
U.S. 0.5 (0.2) 86.7 (1.0) 6.8 (0.7) 6.0 (0.8)1New England includes CT, ME, MA, NH, RI, and VT. 2Other States include AK, DE, HI, MD, MT, NV, NJ, ND, SD, UT, and WY.
62 / Goat and Kid Death Loss 2015
Section II: Population EstimatesDeath LossesA. Predator and Nonpredator Goat and Kid Death Losses
Only 6.9 percent of operations spent any money on lethal predator control ($444 on average). A higher percentage of operations with 100 or more goats and kids spent money on lethal predator control than operations with 1 to 9 or 10 to 19 goats and kids; however, there was no statistical difference when standard errors are considered.
A.6.h. Percentage of operations that spent any money on lethal predator control methods, by size of operation:
A.6.i. For operations that spent any money on lethal predator control methods, average amount spent on these measures, by size of operation:
Average Amount ($)
Size of Operation (number of goats and kids)
1–9 10–19 20–99 100 or moreAll
operations
Avg.Std. error Avg.
Std. error Avg.
Std. error Avg.
Std. error Avg.
Std. error
597 (312) 215 (46) 237 (33) 831 (310) 444 (132)
USDA APHIS VS / 63
Section II: Population EstimatesDeath LossesA. Predator and Nonpredator Goat and Kid Death Losses
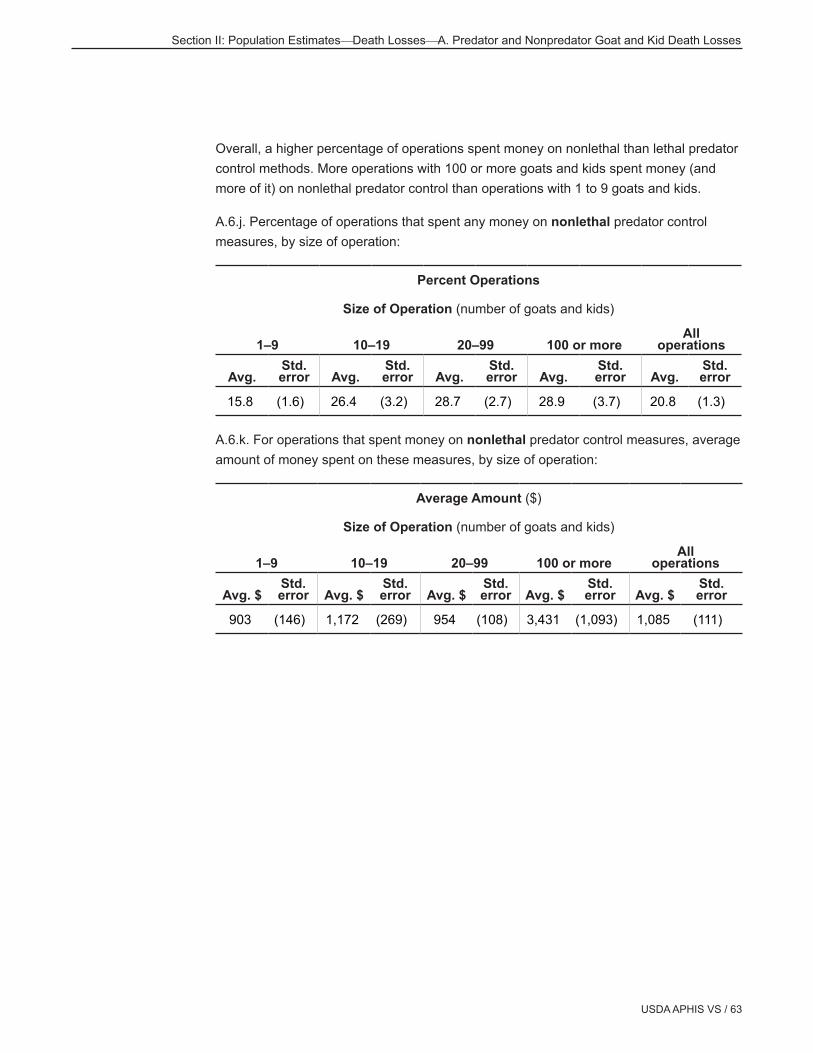
Overall, a higher percentage of operations spent money on nonlethal than lethal predator control methods. More operations with 100 or more goats and kids spent money (and more of it) on nonlethal predator control than operations with 1 to 9 goats and kids.
A.6.j. Percentage of operations that spent any money on nonlethal predator control measures, by size of operation:
Section II: Population EstimatesDeath LossesA. Predator and Nonpredator Goat and Kid Death Losses
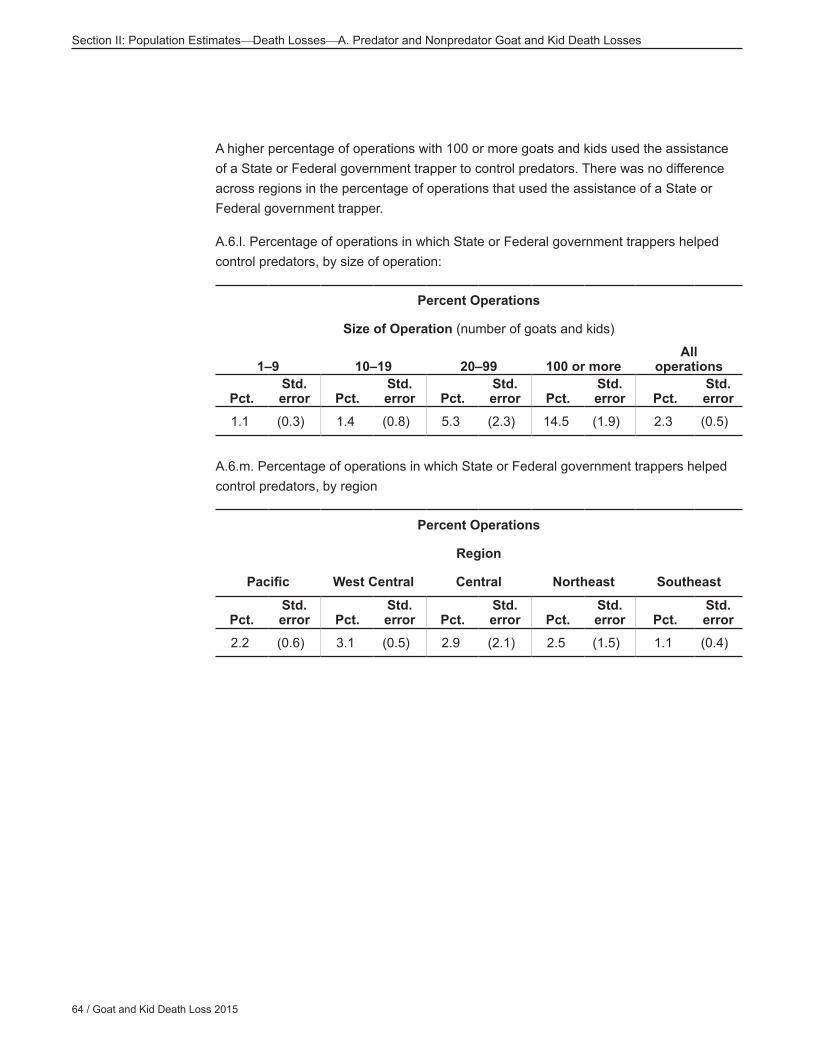
A higher percentage of operations with 100 or more goats and kids used the assistance of a State or Federal government trapper to control predators. There was no difference across regions in the percentage of operations that used the assistance of a State or Federal government trapper.
A.6.l. Percentage of operations in which State or Federal government trappers helped control predators, by size of operation:
A.6.m. Percentage of operations in which State or Federal government trappers helped control predators, by region
Percent Operations
Region
Pacific West Central Central Northeast Southeast
Pct.Std. error Pct.
Std. error Pct.
Std. error Pct.
Std. error Pct.
Std. error
2.2 (0.6) 3.1 (0.5) 2.9 (2.1) 2.5 (1.5) 1.1 (0.4)
USDA APHIS VS / 65
Section II: Population EstimatesDeath LossesA. Predator and Nonpredator Goat and Kid Death Losses
7. Operations not raising goats in the future
Overall, 7.7 percent of operations quit raising goats and kids in 2015. A higher percentage of operations with 1 to 9 goats and kids than operations in the other size categories quit raising goats in 2015.
A.7.a. Percentage of operations that quit raising goats in 2015, by size of operation:
Section II: Population EstimatesDeath LossesA. Predator and Nonpredator Goat and Kid Death Losses
For the 7.7 percent of operations that quit raising goats in 2015, “other” was the main reason for quitting on the highest percentage of operations, followed by retirement.
A.7.c. For operations that quit raising goats in 2015 (table A.7.a), percentage of operations by main reason for quitting and by size of operation:
Reason Percent operations Std. error
Disease 6.2 (2.2)
Predator loss 6.0 (1.6)
Price of meat or milk 1.5 (0.7)
Retirement 25.5 (6.5)
Parasites or worms 5.3 (1.8)
Other 55.4 (5.6)
Total 100.0
USDA APHIS VS / 67
Section III: Methodology
1. Survey procedures
A random sample of U.S. goat and kid producers was surveyed by NASS to provide data for estimates in this report. Detailed goat death loss questions were included in NASS’ annual “Sheep and Goat” survey, which is administered every January. Survey procedures ensured that all goat producers, regardless of operation size, had an opportunity to be included in the survey. Large operations were sampled more heavily than small operations. About 26,500 operators were contacted during the first half of January 2016 by mail, telephone, and/or face-to-face interviews; information provided by 63.0 percent of those contacts was usable.
2. Estimation procedures
Data were weighted to allow inference to the population of all U.S. goat and kid producers. For estimates generated by NAHMS, SAS and SUDAAN® software were used. Standard errors account for the stratified sample design with unequal weights.
3. Revision policy
There are no planned revisions for estimates in this report.


![ANIMAL LEGAL DEFENSE FUND ANIMAL EQUALITY ANIMAL …...Aug 25, 2020 · animals[.]”129 In pursuing this mission, “APHIS works in a variety of ways to protect and improve the health](https://static.documents.pub/doc/80x56/5fe0af360d9f7d6f55797006/animal-legal-defense-fund-animal-equality-animal-aug-25-2020-animalsa129.jpg)

