1 Goblej Plant ( Near Ahmedabad) Gujarat, India 1 All the numbers are represented are masked considering business confidentiality • Coca-Cola was formulated in 1886 by John F Pemberton • We Operate In more countries than UN • Its most Recognized word after “OK” • One of the Most value Brands in the world To Refresh the World Inspire moments of optimism and happiness Create value and make a difference Missio n THE COCA-COLA COMPANY (TCCC) 2
Transcript
1
Goblej Plant ( Near Ahmedabad) Gujarat, India
1 All the numbers are represented are masked considering business confidentiality
• Coca-Cola was formulated in 1886 by John F Pemberton • We Operate In more countries than UN • Its most Recognized word after “OK” • One of the Most value Brands in the world
To Refresh the World Inspire moments of optimism and happiness Create value and make a difference
Mis
sio
n
THE COCA-COLA COMPANY (TCCC)
2
2
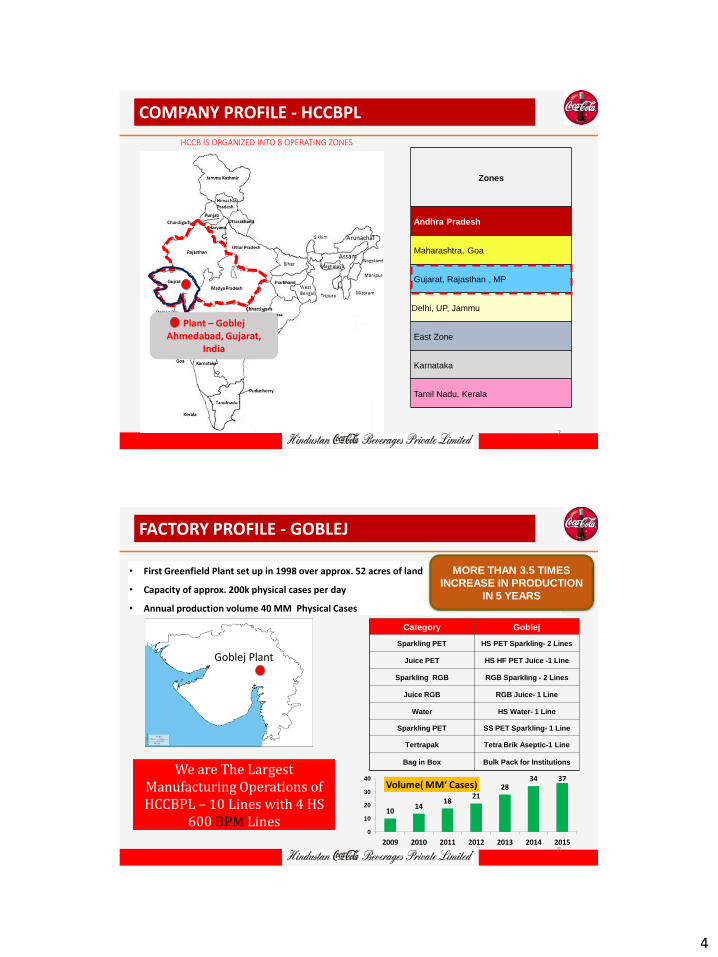
HCCBPL is the largest bottling partner of The Coca-Cola Company in India. It is a part of The Coca-Cola Company’s Bottling Investments Group (BIG) and responsible for the manufacture, package, sale and distribution of beverages under the trademarks of The Coca-Cola Company.
• First Greenfield Plant set up in 1998 over approx. 52 acres of land
• Capacity of approx. 200k physical cases per day
• Annual production volume 40 MM Physical Cases
10 14
18 21
28 34 37
0
10
20
30
40
2009 2010 2011 2012 2013 2014 2015
Volume( MM‘ Cases)
MORE THAN 3.5 TIMES
INCREASE IN PRODUCTION
IN 5 YEARS
We are The Largest Manufacturing Operations of HCCBPL – 10 Lines with 4 HS
600 BPM Lines
Goblej Plant
FACTORY PROFILE - GOBLEJ
8
5
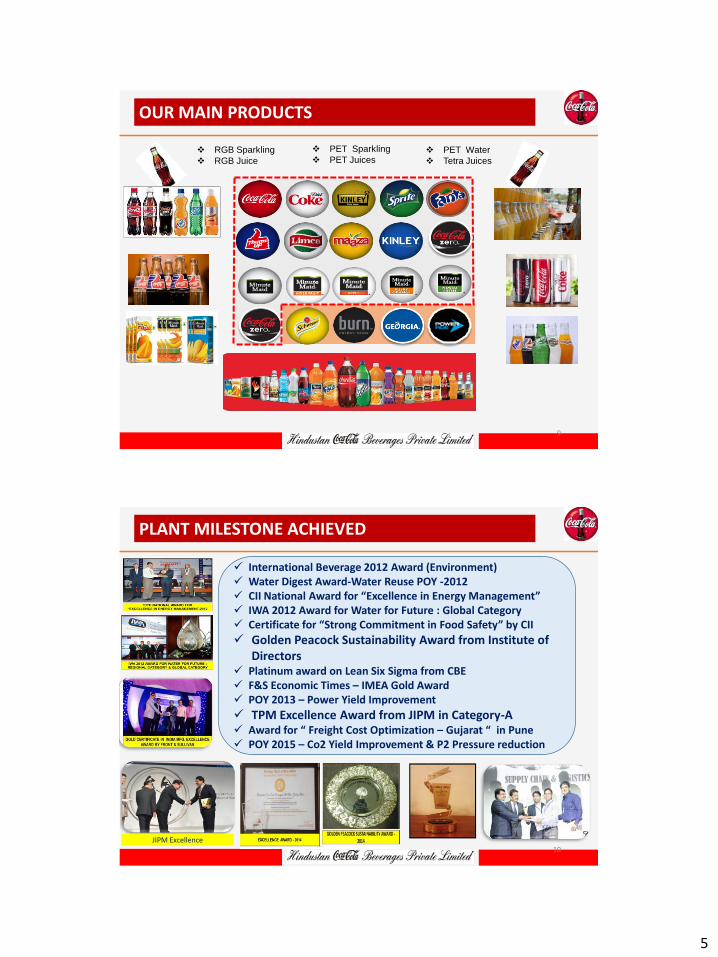
RGB Sparkling
RGB Juice
PET Sparkling
PET Juices PET Water
Tetra Juices
OUR MAIN PRODUCTS
9
International Beverage 2012 Award (Environment) Water Digest Award-Water Reuse POY -2012 CII National Award for “Excellence in Energy Management” IWA 2012 Award for Water for Future : Global Category Certificate for “Strong Commitment in Food Safety” by CII
Golden Peacock Sustainability Award from Institute of Directors
Platinum award on Lean Six Sigma from CBE F&S Economic Times – IMEA Gold Award POY 2013 – Power Yield Improvement
TPM Excellence Award from JIPM in Category-A Award for “ Freight Cost Optimization – Gujarat “ in Pune POY 2015 – Co2 Yield Improvement & P2 Pressure reduction
JIPM Excellence
PLANT MILESTONE ACHIEVED
10
6
01
Section : 1 Project & Team Selection
11 All the numbers are represented are masked considering business confidentiality
1.1.1 Who was responsible for selecting the Project ? (1/2)
HCCBPL - National Steering Committee
Global Vision 2020
Business Diagnostic
Improvement Opportunities Identification
Project Execution – Training and
OE tool usage
Leadership Report Out
Certification, R&R
Voice of Customer
Voice of Business
Profit & Loss Analysis
KPI Trend & Benchmarking
Project selection Committee
Supply Chain Transformation Defining the Performance Gaps – Big “Y’s”
Idea Generation workshop
SCOR Model
PlanPlan PlanCustomer Channel &
Product Line Reqm’ts ComponentsComponents
Components
Laurel, MS
Components
Laurel, MS
Interior Doors:
Haleyville, AL
Interior Doors:
Haleyville, AL
Specialty:
Brampton, Ont.
Specialty:
Brampton, Ont.
Exterior Doors
Dickson, TN
Exterior Doors
Dickson, TN
DorFab:
Lawrenceville, GA
DorFab:
Lawrenceville, GA
Door GroupDoor GroupSuppliersSuppliers CustomersCustomers
Cohesive Supply Chain View Eliminates Disconnects
Retail• Home Depot
• Lowes
Competitors• ??
• ??
Distribution: 1-Stepper• ??
• ??
Distribution: 2-Stepper• ??
• ??
Internal
Suppliers• ??
• ??
External
Suppliers• ??
• ??
12
7
1.1.1 What Background Information of the Company or those who selected the
project is needed to better Understand the context of the project? (2/2)
Raw Syrup
Sugar
Water
Ready Syrup
Carbonated Beverages
CO2
Raw Materials
QSPECS Executive Summary review
- Monthly in National Steering
Committee
Low Yield
Concentrate
(Dissolved CO2)
Material Loss
Internal benchmarking
(VA) 13
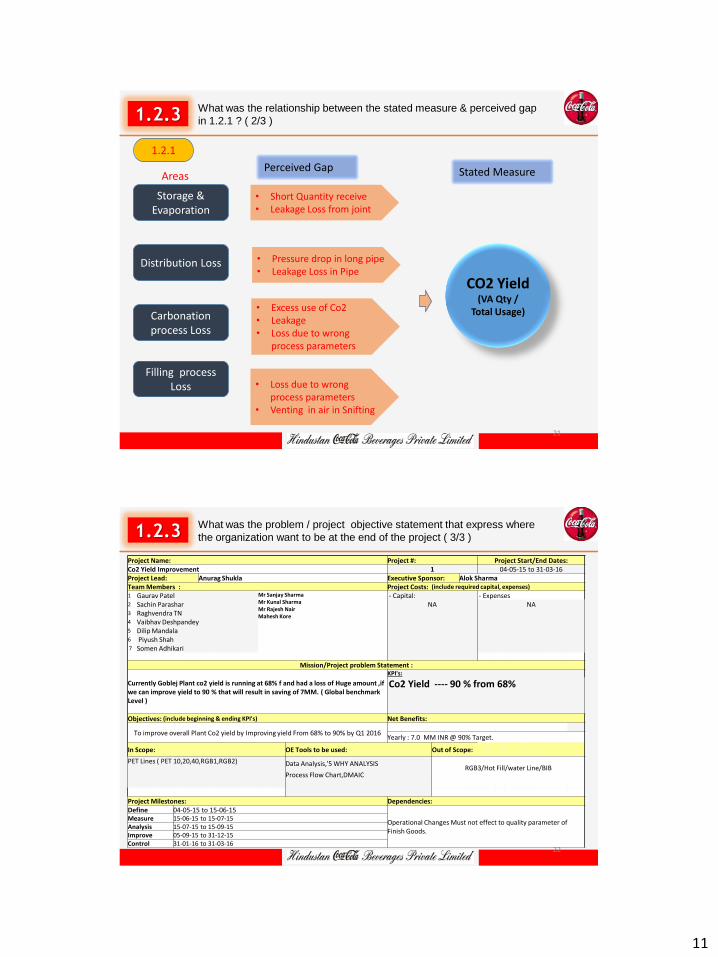
1.2.1 How was the Gap or Opportunity brought to the attention of the project
- Capital: - Expenses 2 Sachin Parashar NA NA 3 Raghvendra TN 4 Vaibhav Deshpandey 5 Dilip Mandala 6 Piyush Shah 7 Somen Adhikari
Mission/Project problem Statement :
Currently Goblej Plant co2 yield is running at 68% f and had a loss of Huge amount ,if we can improve yield to 90 % that will result in saving of 7MM. ( Global benchmark Level )
KPI's:
Co2 Yield ---- 90 % from 68%
Objectives: (include beginning & ending KPI's) Net Benefits:
To improve overall Plant Co2 yield by Improving yield From 68% to 90% by Q1 2016
Yearly : 7.0 MM INR @ 90% Target.
In Scope: OE Tools to be used: Out of Scope:
PET Lines ( PET 10,20,40,RGB1,RGB2) Data Analysis,'5 WHY ANALYSIS RGB3/Hot Fill/water Line/BIB
Process Flow Chart,DMAIC
Project Milestones: Dependencies: Define 04-05-15 to 15-06-15
Operational Changes Must not effect to quality parameter of Finish Goods.
Measure 15-06-15 to 15-07-15 Analysis 15-07-15 to 15-09-15 Improve 05-09-15 to 31-12-15 Control 31-01-16 to 31-03-16
22
12
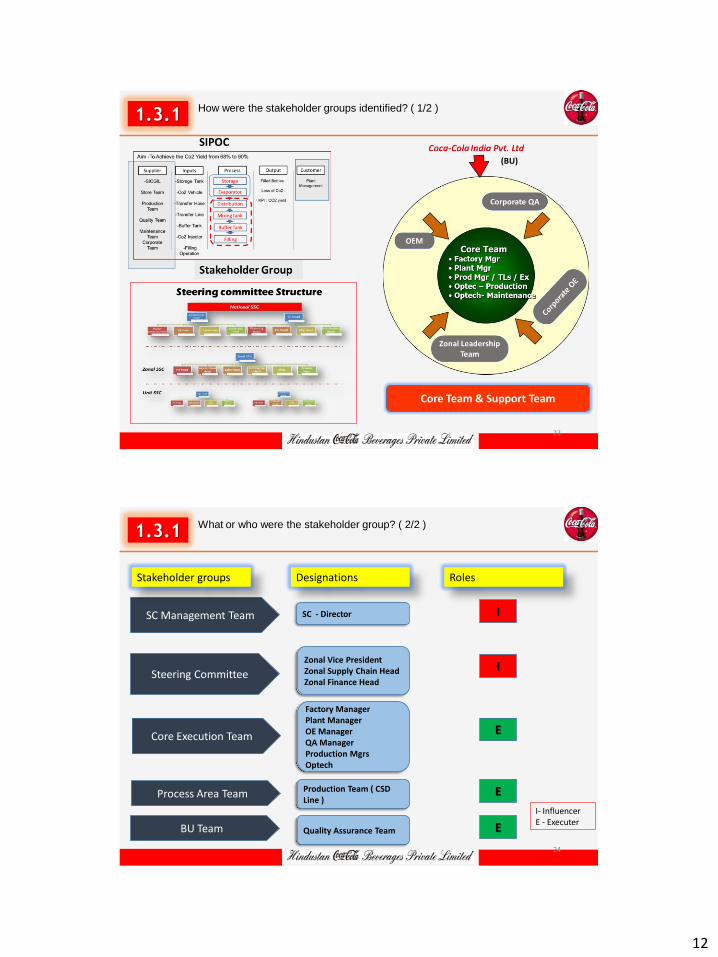
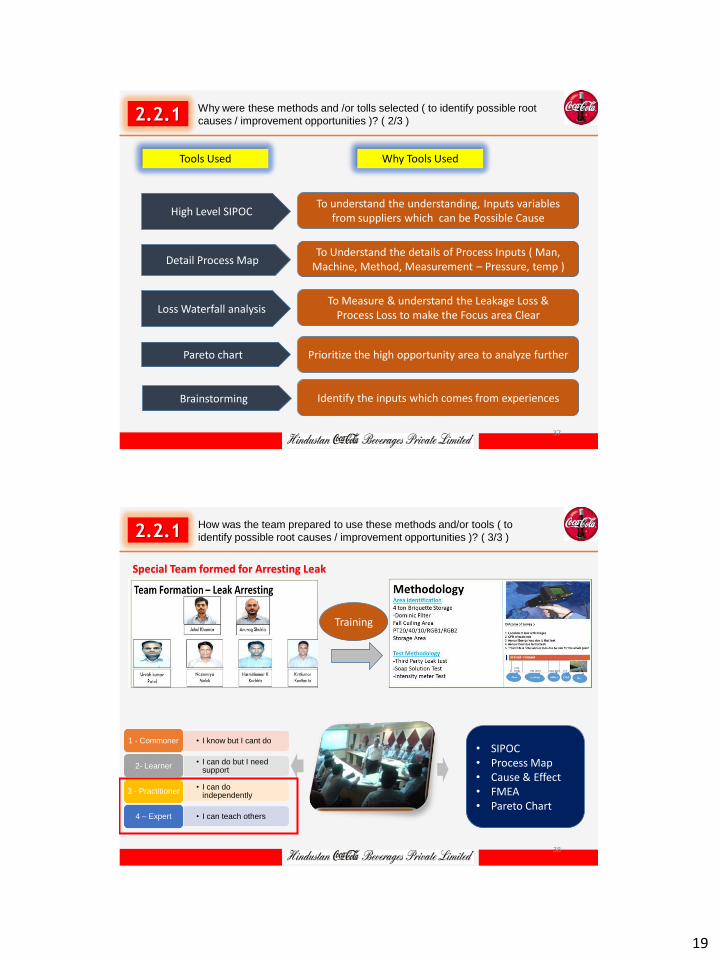
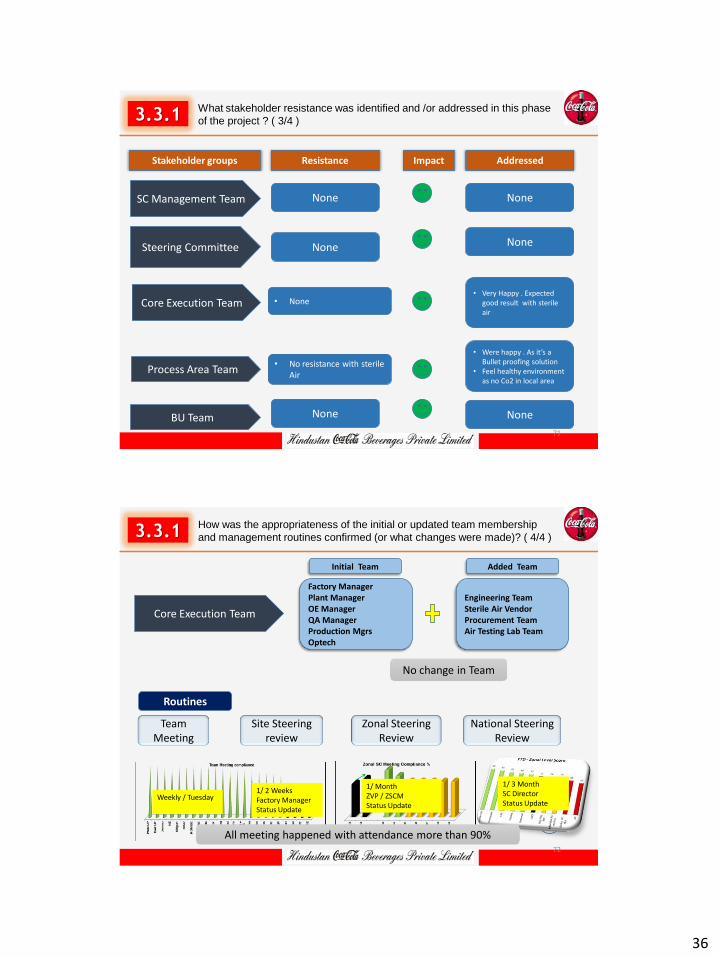
1.3.1 How were the stakeholder groups identified? ( 1/2 )
Core Team & Support Team
(BU)
23
1.3.1 What or who were the stakeholder group? ( 2/2 )
SC - Director SC Management Team
Core Execution Team
Steering Committee
Process Area Team
Stakeholder groups Designations Roles
Zonal Vice President Zonal Supply Chain Head Zonal Finance Head
• SIPOC • Process Map • Cause & Effect • FMEA • Pareto Chart
38
20
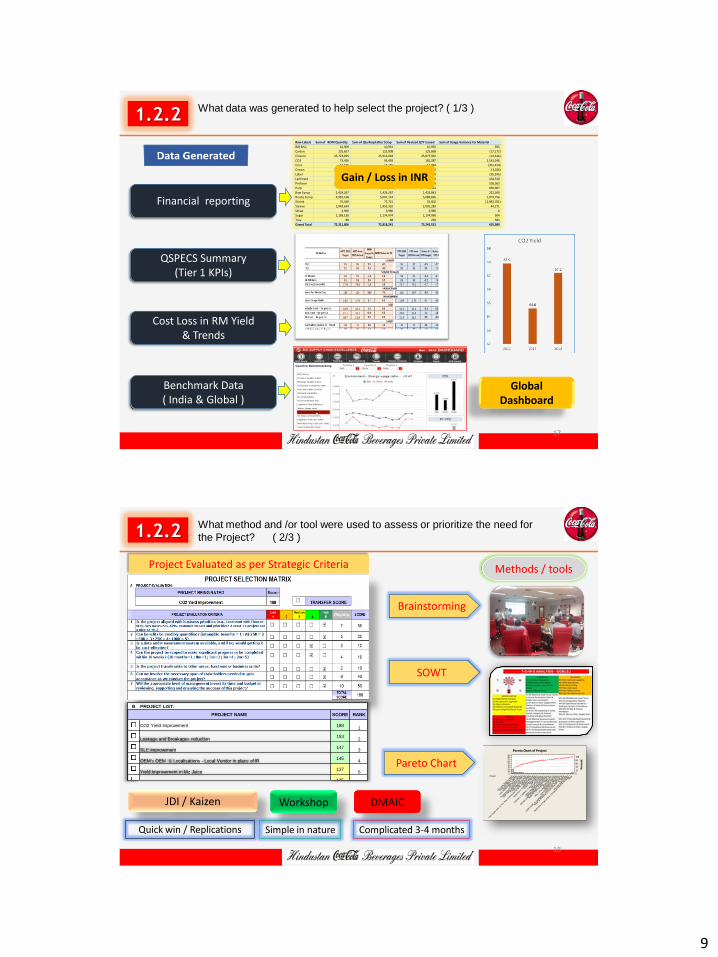
2.2.2 What data was generated and how was the data analyzed to identify the
possible root cause/improvement opportunities? ( 1/2 )
Leak test & Loss Measurement
High Priority Area
39
2.2.2 What were possible root cause/improvement opportunities? ( 2/2 )
C & E Matrix FMEA
Inputs parameters / Potential X’s Total 32 Points were identified
X1 Run Speed
X2 Flavor
X3 sku
X4 GV
X5 Snifting Pressure
X6 Return Gas Pressure
X7 Bowl Pressure
X8 Pressurization
X9 Becalm
X10 Co2 Ratio
X11 Paramix Pressure
X12 Flow RATE (T/h)
X13 Temperature at PHE
X14 Product Temperature At filler
X15 Booster Pump
X 16 Bowl Level
40
21
2.3.1 What methods and /or tools were used to identify the final root cause(s)/
improvement opportunity (ies)? ( 1/3 )
Method / Tools
ANOVA Analysis 2 sample t - test
Regression Analysis
Multi Regression with VIF
X3 Impact of SKU size
ThuSpriteSodaLimcaFantaCoke
90.00%
80.00%
70.00%
60.00%
50.00%
40.00%
Flavour 1
Da
ily C
o2
Yie
ld
72.31%
69.55%69.53%
62.02%63.57%
57.73%
Boxplot of Daily Co2 Yield
X2 Impact of Flavor
onOff
90.00%
85.00%
80.00%
75.00%
70.00%
Booster Pump
Co
2 Y
ield
74.81%
78.14%
Boxplot of Co2 YieldImpact of Booster Pump
X15
120.00%100.00%80.00%60.00%40.00%20.00%
90.00%
80.00%
70.00%
60.00%
50.00%
40.00%
30.00%
SLE
Yie
ld
S 0.0712509
R-Sq 82.4%
R-Sq(adj) 81.0%
Fitted Line PlotYield = 0.2958 + 0.4733 SLE
Impact of SLE
41
2.3.1 What methods and /or tools were used to identify the final root cause(s)/
improvement opportunity (ies)? ( 1/3 )
Method / Tools Screening DOE – Main Effect Study
BC
C
ACD
ABCD
ABD
ABC
BD
AD
CD
D
AC
BCD
AB
B
A
0.090.080.070.060.050.040.030.020.010.00
Te
rm
Effect
0.01270
A Bow l F iller Lev el
B Snifting Pressure
C Bow l Pressure
D Paramix Pressure
Factor Name
Pareto Chart of the Effects(response is Yield, Alpha = 0.05)
Lenth's PSE = 0.00494087
Full factorial DOE
42
22
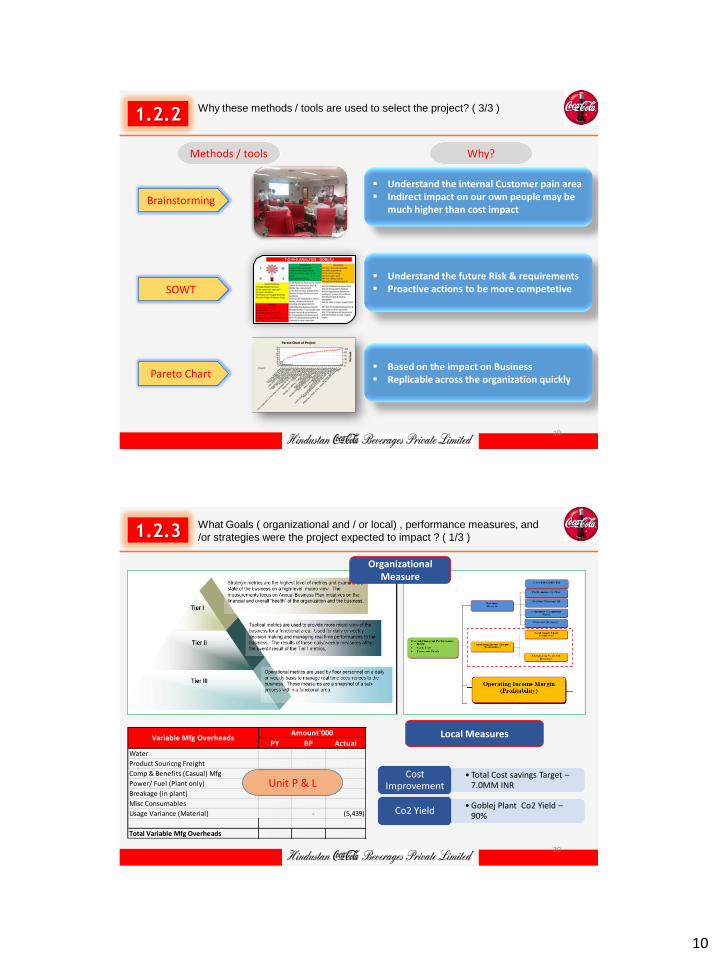
2.3.1 Why were these methods and /or tools selected ( to identify the final root
cause(s) / Opportunity ( ies)? ( 2/3 )
Method / Tools WHY ?
• By variation of SKU size • By variation of Different Flavors • Change Booster pump On/OFF
Impact on Co2 Yield
• By Change in Snifting pressure • By Change in Bowl Pressure • By Change in Pressurization • By Change in Paramix pressure. • By change Temperature at PHE • By Change in Bowl Level
• Screening of Significant Causes
• To understand the interaction impact of significant Causes
43
2.3.1 How was the team prepared to use these methods and /or tools ( to
identify the final root cause(s) / Opportunity ( ies)? ( 3/3 )
Method / Tools Team Preparedness
SPC & Capability (1 day )
Process Area Team
Six Sigma GB ( 4 days )
Core Execution Team Steering Committee
DOE ( 1 day ) Core Execution Team Steering Committee
All Experiments are supported & Guided by Zonal OE / National OE Team
44
23
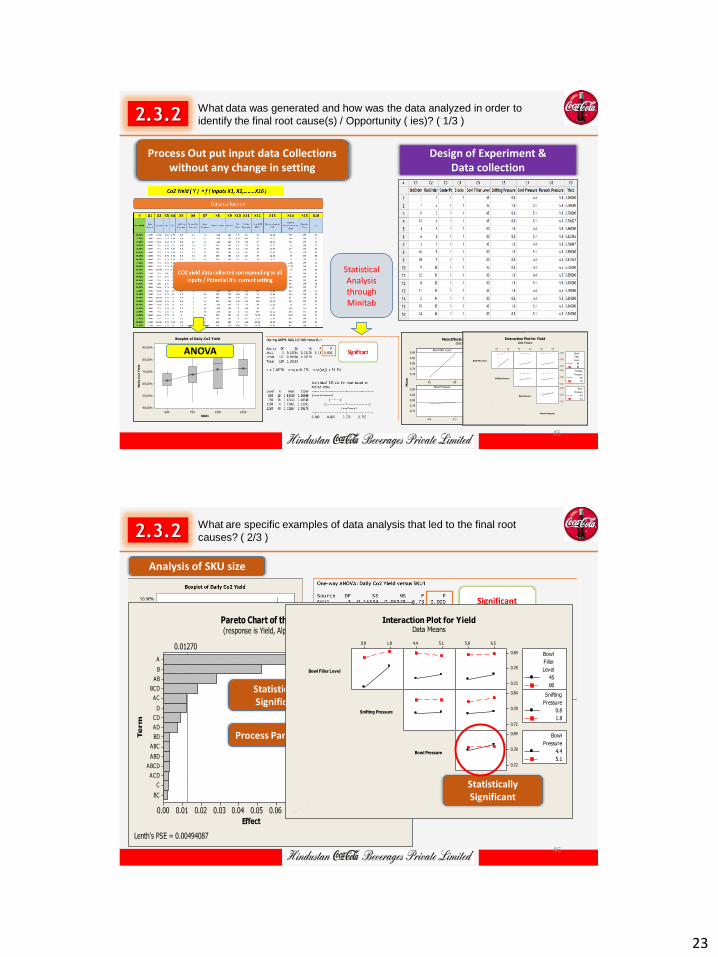
2.3.2 What data was generated and how was the data analyzed in order to
identify the final root cause(s) / Opportunity ( ies)? ( 1/3 )
Design of Experiment & Data collection
Process Out put input data Collections without any change in setting
22501250750600
90.00%
80.00%
70.00%
60.00%
50.00%
40.00%
SKU1
Da
ily C
o2
Yie
ld
Boxplot of Daily Co2 Yield
ANOVA
8045
0.84
0.82
0.80
0.78
0.76
1.80.8
5.14.4
0.84
0.82
0.80
0.78
0.76
6.55.8
Bowl Filler Level
Me
an
Snifting Pressure
Bowl Pressure Paramix Pressure
Main Effects Plot for YieldData Means
1.80.8 5.14.4 6.55.8
0.84
0.78
0.72
0.84
0.78
0.72
0.84
0.78
0.72
Bowl Filler Level
Snifting Pressure
Bowl Pressure
Paramix Pressure
45
80
Level
Filler
Bowl
0.8
1.8
Pressure
Snifting
4.4
5.1
Pressure
Bowl
Interaction Plot for YieldData Means
Statistical Analysis through Minitab
45
2.3.2 What are specific examples of data analysis that led to the final root
causes? ( 2/3 )
Analysis of SKU size
BC
C
ACD
ABCD
ABD
ABC
BD
AD
CD
D
AC
BCD
AB
B
A
0.090.080.070.060.050.040.030.020.010.00
Te
rm
Effect
0.01270
A Bow l F iller Lev el
B Snifting Pressure
C Bow l Pressure
D Paramix Pressure
Factor Name
Pareto Chart of the Effects(response is Yield, Alpha = 0.05)
Lenth's PSE = 0.00494087
Statistically Significant
Process Parameters
1.80.8 5.14.4 6.55.8
0.84
0.78
0.72
0.84
0.78
0.72
0.84
0.78
0.72
Bowl Filler Level
Snifting Pressure
Bowl Pressure
Paramix Pressure
45
80
Level
Filler
Bowl
0.8
1.8
Pressure
Snifting
4.4
5.1
Pressure
Bowl
Interaction Plot for YieldData Means
Statistically Significant
46
24
2.3.2 What was (were) the final root cause(s) / improvement opportunity (ies) ?
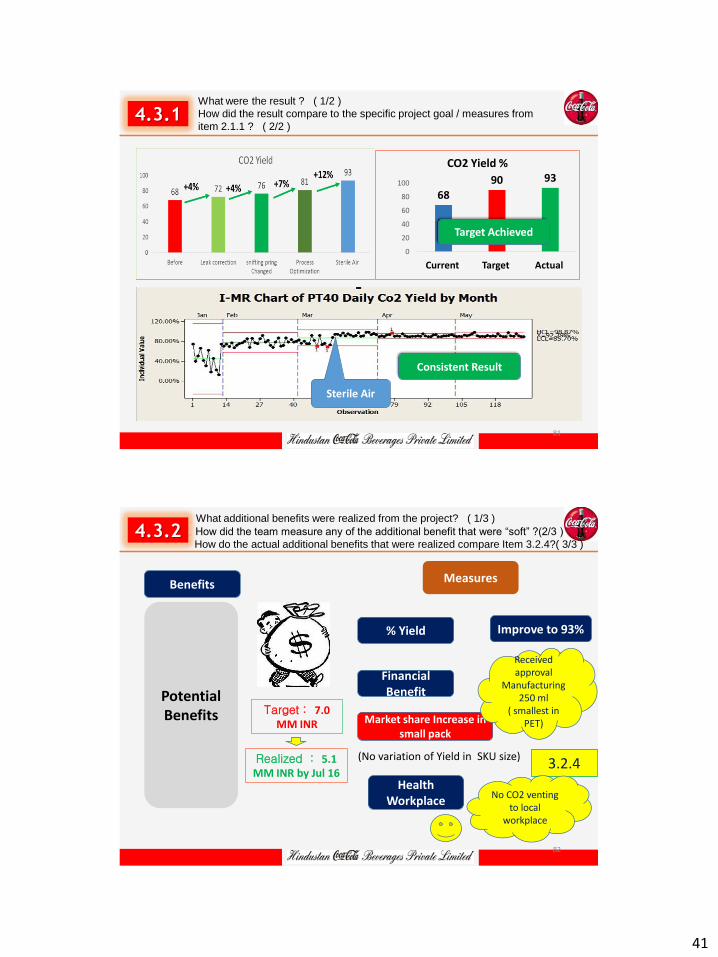
Currently Goblej Plant co2 yield is running at 68% f and had a loss of Huge amount ,if we can improve yield to 90 % that will result in saving of 7MM. ( Global benchmark Level )
KPI's:
Co2 Yield ---- 90 % from 68%
Objectives: (include beginning & ending KPI's) Net Benefits:
To improve overall Plant Co2 yield by Improving yield From 68% to 90% by Q1 2016
Yearly : 7.0 MM INR @ 90% Target.
In Scope: OE Tools to be used: Out of Scope:
PET Lines ( PET 10,20,40,RGB1,RGB2) Data Analysis,'5 WHY ANALYSIS RGB3/Hot Fill/water Line/BIB
Process Flow Chart,DMAIC
Project Milestones: Dependencies: Define 04-05-15 to 15-06-15
Operational Changes Must not effect to quality parameter of Finish Goods.
Measure 15-06-15 to 15-07-15 Analysis 15-07-15 to 15-09-15 Improve 05-09-15 to 31-12-15 Control 31-01-16 to 31-03-16
( Sterile Filters included in Scope )
( As Future is in small size SKUs)
50
26
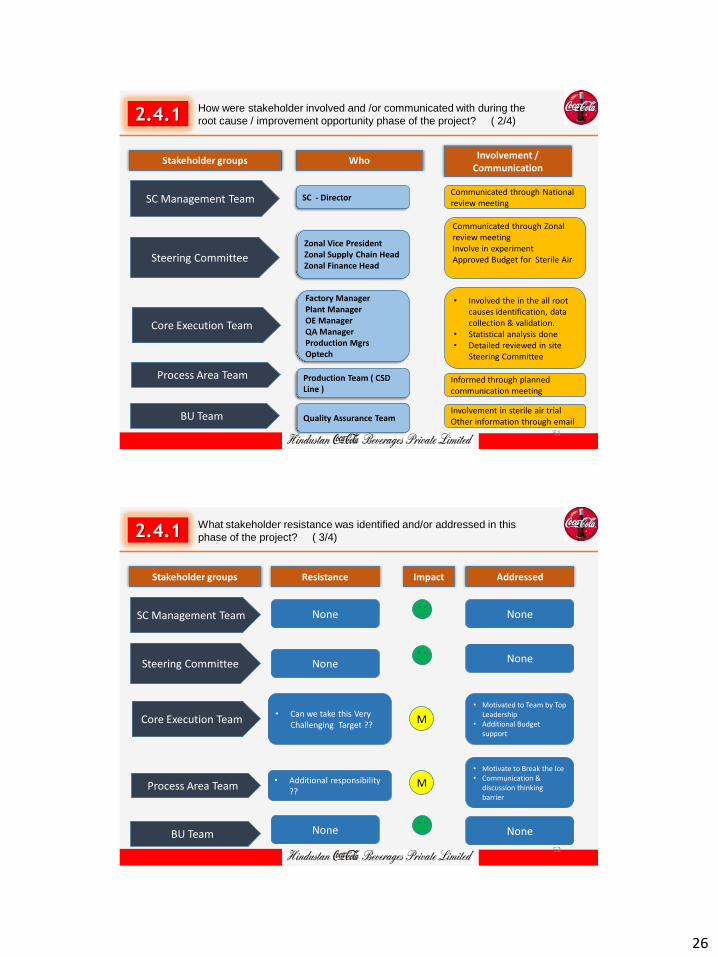
2.4.1 How were stakeholder involved and /or communicated with during the
root cause / improvement opportunity phase of the project? ( 2/4)
SC Management Team
Core Execution Team
Steering Committee
Process Area Team
Stakeholder groups
BU Team
Who
SC - Director
Zonal Vice President Zonal Supply Chain Head Zonal Finance Head
Engineering Team Sterile Air Vendor Procurement Team Air Testing Lab Team
Initial Team Added Team
Team Meeting
Site Steering review
Zonal Steering Review
National Steering Review
Routines
53
01
Section : 3
Solution / Improvement Development
54 All the numbers are represented are masked considering business confidentiality
28
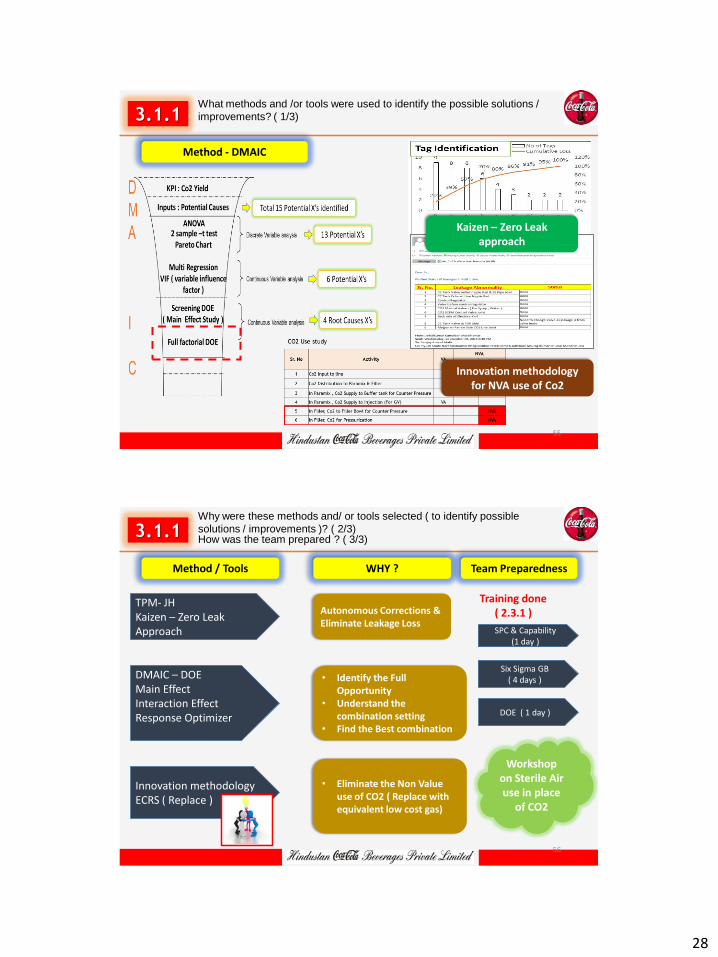
3.1.1 What methods and /or tools were used to identify the possible solutions /
improvements? ( 1/3)
Method - DMAIC
Innovation methodology for NVA use of Co2
Kaizen – Zero Leak approach
55
3.1.1 Why were these methods and/ or tools selected ( to identify possible
solutions / improvements )? ( 2/3) How was the team prepared ? ( 3/3)
TPM- JH Kaizen – Zero Leak Approach
DMAIC – DOE Main Effect Interaction Effect Response Optimizer
Innovation methodology ECRS ( Replace )
Method / Tools WHY ?
Autonomous Corrections & Eliminate Leakage Loss
• Identify the Full Opportunity
• Understand the combination setting
• Find the Best combination
• Eliminate the Non Value use of CO2 ( Replace with equivalent low cost gas)
Team Preparedness
SPC & Capability (1 day )
Six Sigma GB ( 4 days )
DOE ( 1 day )
Training done ( 2.3.1 )
Workshop on Sterile Air use in place
of CO2
56
29
3.1.2 What data was generated and how was the data analyzed to determine
the possible solutions / improvements? ( 1/3)
Experiment & Data collection
6.55.8
5.1
4.4
1.8
0.8
8045
Paramix Pressure
Bow l Pressure
Snifting Pressure
Bow l F iller Lev el
0.85000
0.810000.70653
0.81000
0.85000
0.841620.72000
0.79000
0.83000
0.832990.72000
0.78000
0.86000
0.810000.68000
0.76849
Cube Plot (data means) for Yield
CurHigh
Low0.00000D
New
d = 0.00000
Maximum
Yield
y = 0.8599
0.00000
Desirability
Composite
5.80
6.50
4.40
5.10
0.80
1.80
45.0
80.0Snifting Bowl Pre Paramix Bowl Fil
[80.0] [1.80] [4.40] [5.8053]
Response Optimizer
8045
0.84
0.82
0.80
0.78
0.76
1.80.8
5.14.4
0.84
0.82
0.80
0.78
0.76
6.55.8
Bowl Filler Level
Me
an
Snifting Pressure
Bowl Pressure Paramix Pressure
Main Effects Plot for YieldData MeansTrial data with Sterile Air
DOE data
Global Benchmarking
57
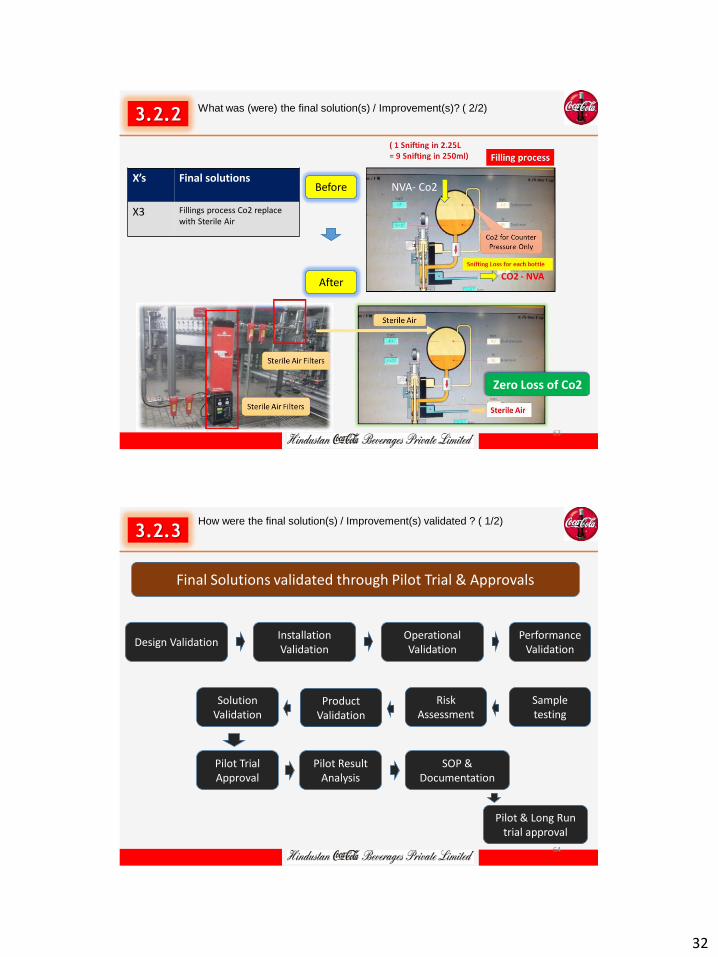
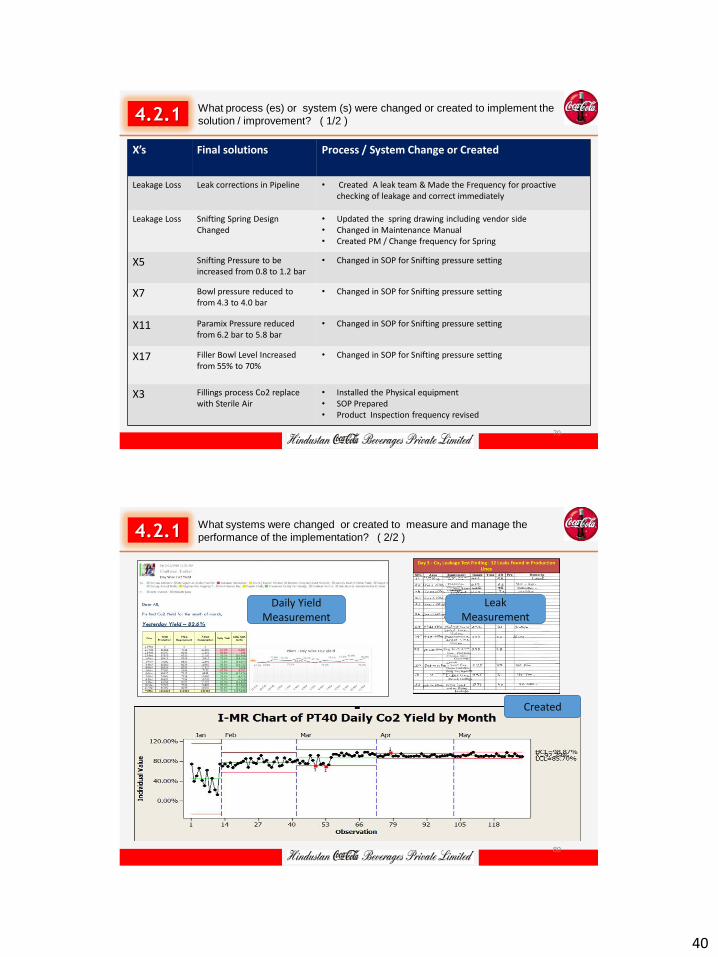
3.1.2 What are the possible solutions / improvements? ( 2/3)
Significant X’s ( )
S
S
S
S
S
S X’s Possible solutions Remarks
X3 Produce only Higher size SKUs Replace with N2 gas Innovative solution in filling process ( Stop Co2 venting in filling process Replace with Sterile Air
Depends upon Consumer requirements ( low SKU size demand is high ( 200/250ml ) Low cost than Co2 Using in Global Coca-Cola Plant
X5 Snifting Pressure to be increased to reduce the venting Co2 in air
Change from 0.8bar to 1.8bar
X7 Bowl pressure to be reduced to reduce loss
Reduce pressure from 4.3 bar to 4.0 bar
X11 Paramix Pressure to be reduced to reduce loss in Paramix
Reduce pressure from 6.2 to 5.8 bar
X17 Filler Bowl Level to be increased to get higher Yield
Increase from 55% to 80% level in Filler bowl
Leakage Loss
Change the Snifting spring Material Reduce Co2 Loss due the damage of the spring in Snifting valve
58
30
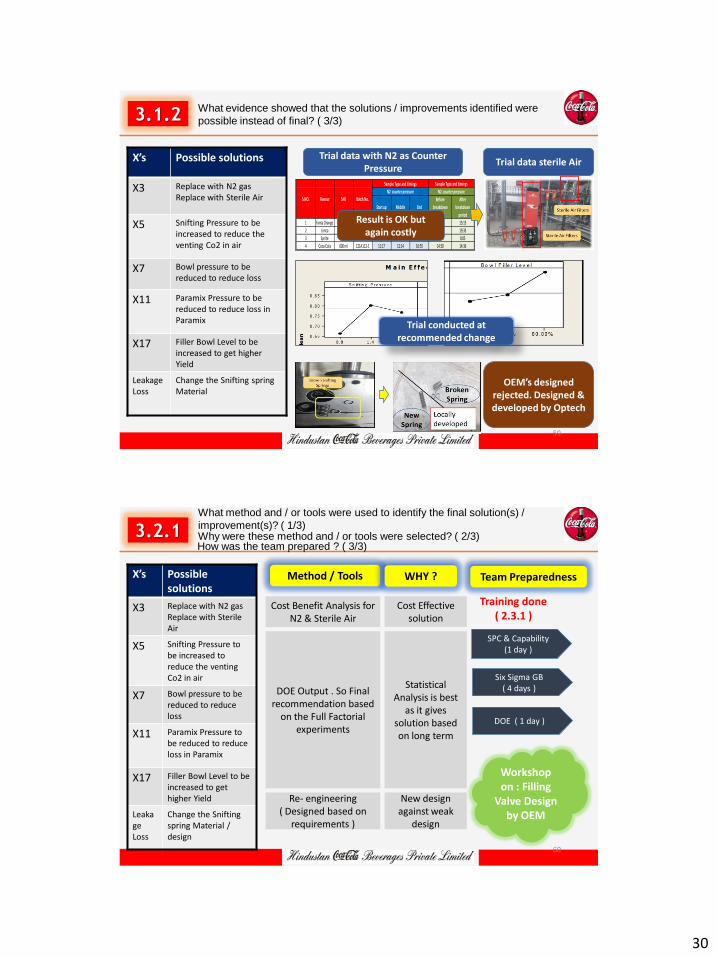
3.1.2 What evidence showed that the solutions / improvements identified were
possible instead of final? ( 3/3)
X’s Possible solutions
X3 Replace with N2 gas Replace with Sterile Air
X5 Snifting Pressure to be increased to reduce the venting Co2 in air
X7 Bowl pressure to be reduced to reduce loss
X11 Paramix Pressure to be reduced to reduce loss in Paramix
X17 Filler Bowl Level to be increased to get higher Yield
Currently Goblej Plant co2 yield is running at 68% f and had a loss of Huge amount ,if we can improve yield to 90 % that will result in saving of 7MM. ( Global benchmark Level )
KPI's:
Co2 Yield ---- 90 % from 68%
Objectives: (include beginning & ending KPI's) Net Benefits:
To improve overall Plant Co2 yield by Improving yield From 68% to 90% by Q1 2016
Yearly : 7.0 MM INR @ 90% Target.
In Scope: OE Tools to be used: Out of Scope:
PET Lines ( PET 10,20,40,RGB1,RGB2) Data Analysis,'5 WHY ANALYSIS RGB3/Hot Fill/water Line/BIB
Process Flow Chart,DMAIC
Project Milestones: Dependencies: Define 04-05-15 to 15-06-15
Operational Changes Must not effect to quality parameter of Finish Goods.
Measure 15-06-15 to 15-07-15 Analysis 15-07-15 to 15-09-15 Improve 05-09-15 to 31-12-15 Control 31-01-16 to 31-03-16
( Sterile Filters included in Scope )
( As Future is in small size SKUs)
No Change
69
3.3.1 How were stakeholders involved and /or communicated with during the
solution / improvement phase of the project ?( 2/4 )
SC Management Team
Core Execution Team
Steering Committee
Process Area Team
Stakeholder groups
BU Team
Who
SC - Director
Zonal Vice President Zonal Supply Chain Head Zonal Finance Head