41
Going Global – How Much is Enough? William (Bill) H. Hill, RBC Asset Management
| Date post: | 23-Dec-2015 |
| Category: |
Documents |
| Upload: | claud-samuel-harvey |
| View: | 216 times |
| Download: | 1 times |
Going Global – How Much is Enough?
William (Bill) H. Hill, RBC Asset Management

CIFP June 2007 2
What we talked about last year
The importance of investor behaviourUnderstanding it so you can help manage it
The Case for America
International Investing
Our 2006 Outlook
How to keep clients on track

CIFP June 2007 3
What’s changed since last year?
What products are selling today vs. last year
Global Flows$11 Billion to Foreign Equity (International & Global)
$533 million to US Equity
$22 Billion to Balanced Funds
$11 billion in Cdn Equity Fund Redemptions
Product launchesMore than 60 global mandates launched since June 2006
Almost $4 billion in assets in those new funds
CIFP June 2007 4
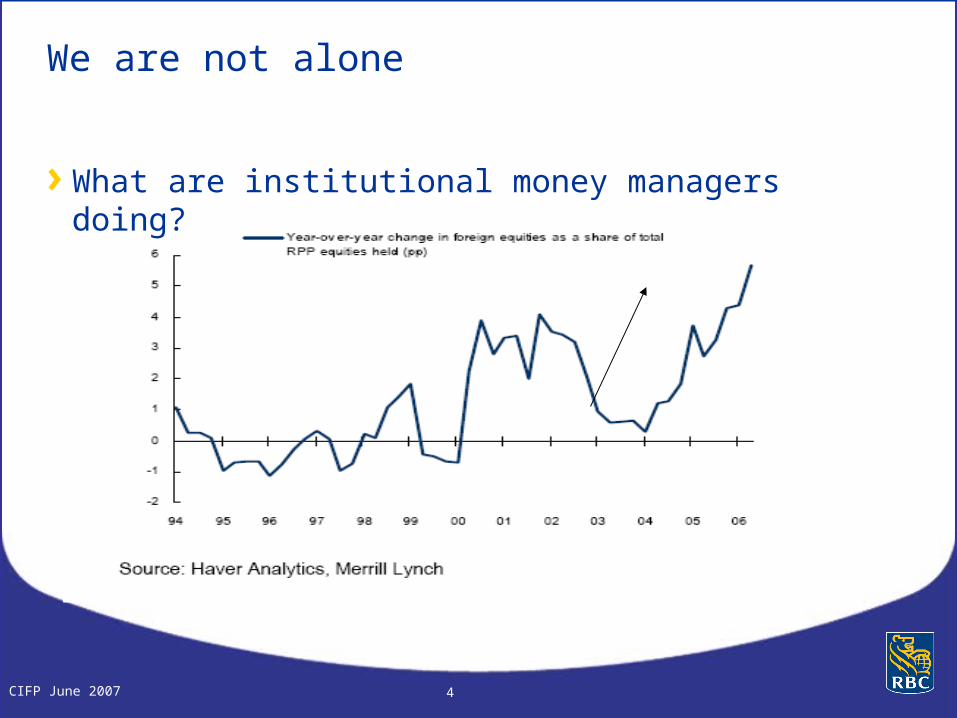
We are not alone
What are institutional money managers doing?

CIFP June 2007 5
What hasn’t changed
Client behaviour
Diversification is still key
Global investing should be the focus

CIFP June 2007 6
Going Global
So how much is enough?
35%

CIFP June 2007 7
Global investing challenges
Knowledge / exposure
Currency
Behavioural

CIFP June 2007 8
Global investing challenges – knowledge/exposure
Where’s Waldo?
Royal Bank of Canada
CIBC
Bank of MontrealCanadian Natural Resources
Suncor Energy
EnCana Corp.
TD Bank
Bank of Nova Scotia
Manulife
Sun Life Financial
Total S.A.
Procter & Gamble
UnitedHealth Group
Groupe Danone
Cemex
CVS Caremark Corp.
BBVA
Continental AG
Atlas Copco
Royal Bank of Scotland Group

CIFP June 2007 9
Global investing challenges – knowledge/exposure
Easier to be more familiar with Cdn / NA companies
Canada
Royal Bank of Canada
Manulife
Bank of Nova Scotia
TD Bank
EnCana Corp.
Suncor Energy
Canadian Natural Resources
Bank of Montreal
CIBC
Sun Life Financial
Which list do your clients know?
RBC Global Titans Fund
CVS Caremark Corp. (US)
Total S.A (France)
Groupe Danone (France)
Procter & Gamble (US)
Cemex (Mexico)
BBVA (Spain)
UnitedHealth Group (US)
Royal Bank of Scotland Group
Continental AG (Germany)
Atlas Copco (Sweden)

CIFP June 2007 10
$161
$357
$168
$319
$98
$465
$131
$416
$-
$100
$200
$300
$400
$500
1990 1995 2000 2005
Canadian Investment Abroad Foreign Investment in Canada
As countries become more economically integrated, global economies are looking beyond their borders for opportunities
Global Investing – The Realities
It’s not only Canadians who are investing more globally. Foreign investors are investing more here too.
CIFP June 2007 11
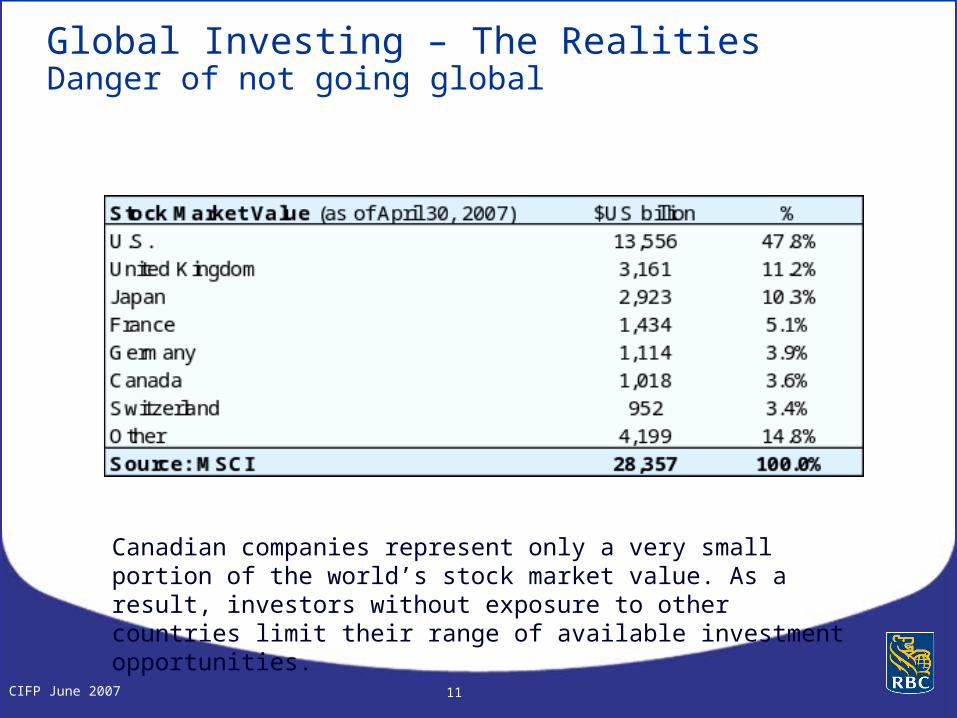
Global Investing – The RealitiesDanger of not going global
Canadian companies represent only a very small portion of the world’s stock market value. As a result, investors without exposure to other countries limit their range of available investment opportunities.

CIFP June 2007 12
Global Investing – The RealitiesCanada only offers exposure to a couple of sectors
Compared to the global economy, Canada’s economy is dominated by Financials and Resources companies.

CIFP June 2007 13
Global investing challenges – Knowledge/exposure
17.3%14.1%
9.7% 9.1%7.3%
4.6%1.3%
Emerging Mkts Canada Germany France U.K. Japan U.S.
Remember, you w ant to position your portfolio for the future - don't get caught looking in the rear view mirror.
Outperfomance of Canadian marketI don’t need to invest anywhere else – look at my amazing returns over the past 5 yrs!
Source: TSX, S&P, MSCI at April 30, 2007

CIFP June 2007 14
Global Investing – Geographical Outlook
S&P/TSX Composite EquilibriumNormalized Earnings & Valuations
398
600
903
1359
2047
3082
4642
6989
10524
15849
1960 1965 1970 1975 1980 1985 1990 1995 2000 2005 2010
Source: Bloomberg, RBC AM
May '07 Range: 7696 - 11435 (Mid: 9566)May '08 Range: 8090 - 12022 (Mid: 10056)Current (22-May-07): 14112
Canadian equities remain expensive
After strong gains since 2003, Canadian equities are trading above fair value.Source: Bloomberg, RBC Asset Management

CIFP June 2007 15
Strong upside in Natural Resources for a
prolonged period!
•China driving demand, & just getting started
•India, Russia & Brazil add to pressure
DEMAND
Pressure Increasing
•Underinvestment in exploration &
development for past two decades
•Restrained capital spending due to high costs
relative to commodity prices
SUPPLY
Lagging for awhile
Global Investing – The Realities
The Canada story

CIFP June 2007 16
Across the Huangpu River to Pudong, Shanghai, 1984

CIFP June 2007 17
Across the River Now…
CIFP June 2007 18
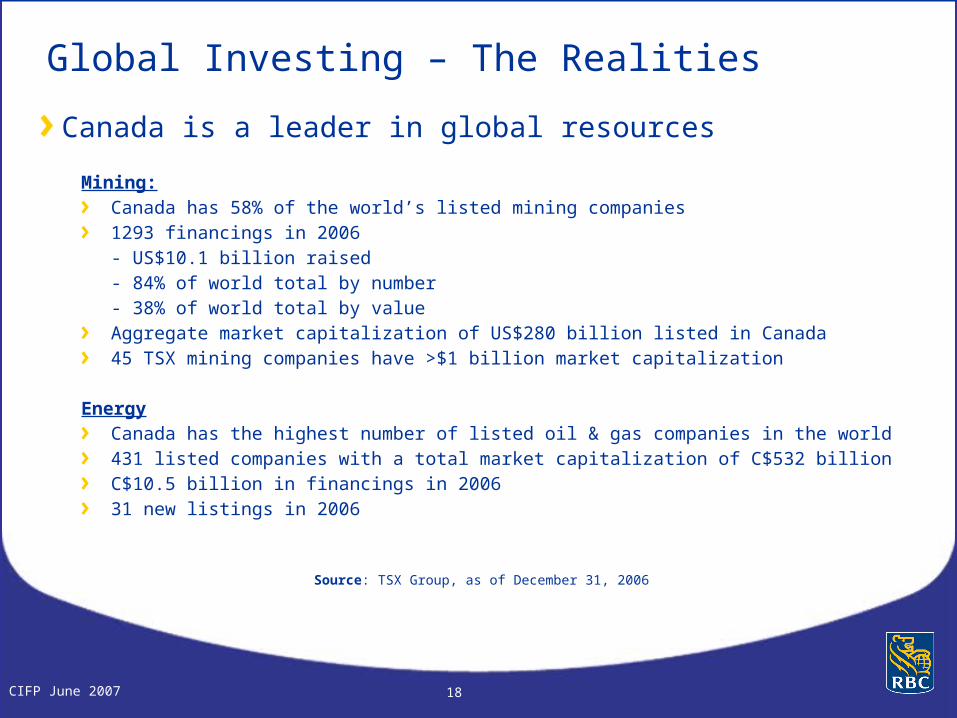
Source: TSX Group, as of December 31, 2006
Mining:Canada has 58% of the world’s listed mining companies 1293 financings in 2006- US$10.1 billion raised- 84% of world total by number- 38% of world total by valueAggregate market capitalization of US$280 billion listed in Canada45 TSX mining companies have >$1 billion market capitalization
EnergyCanada has the highest number of listed oil & gas companies in the world431 listed companies with a total market capitalization of C$532 billionC$10.5 billion in financings in 200631 new listings in 2006
Global Investing – The Realities
Canada is a leader in global resources
CIFP June 2007 19
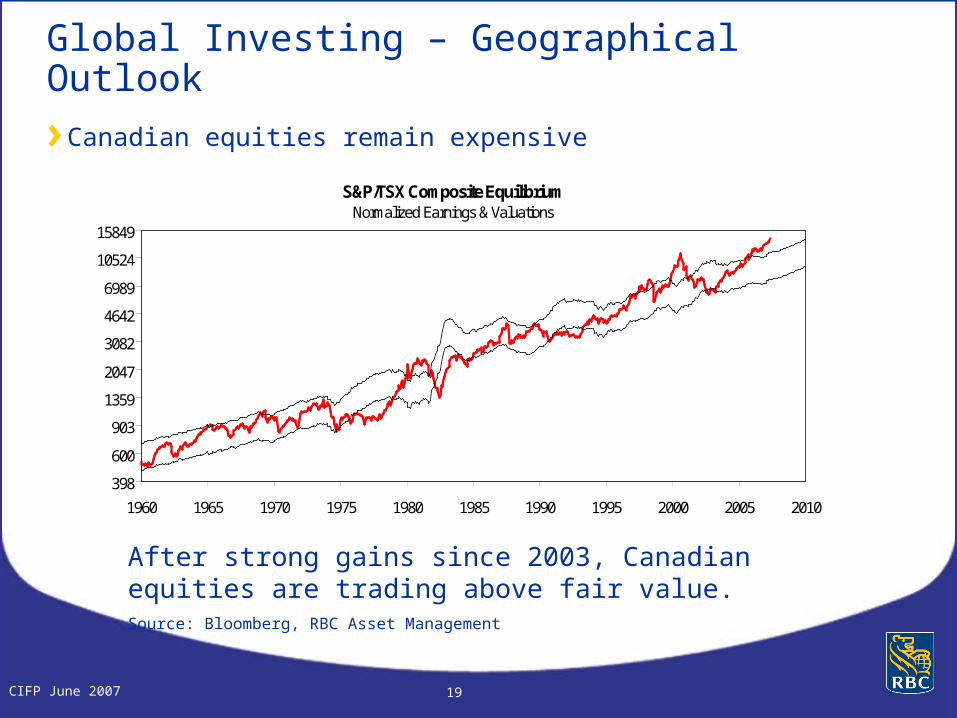
Global Investing – Geographical Outlook
S&P/TSX Composite EquilibriumNormalized Earnings & Valuations
398
600
903
1359
2047
3082
4642
6989
10524
15849
1960 1965 1970 1975 1980 1985 1990 1995 2000 2005 2010
Source: Bloomberg, RBC AM
May '07 Range: 7696 - 11435 (Mid: 9566)May '08 Range: 8090 - 12022 (Mid: 10056)Current (22-May-07): 14112
Canadian equities remain expensive
After strong gains since 2003, Canadian equities are trading above fair value.Source: Bloomberg, RBC Asset Management
CIFP June 2007 20
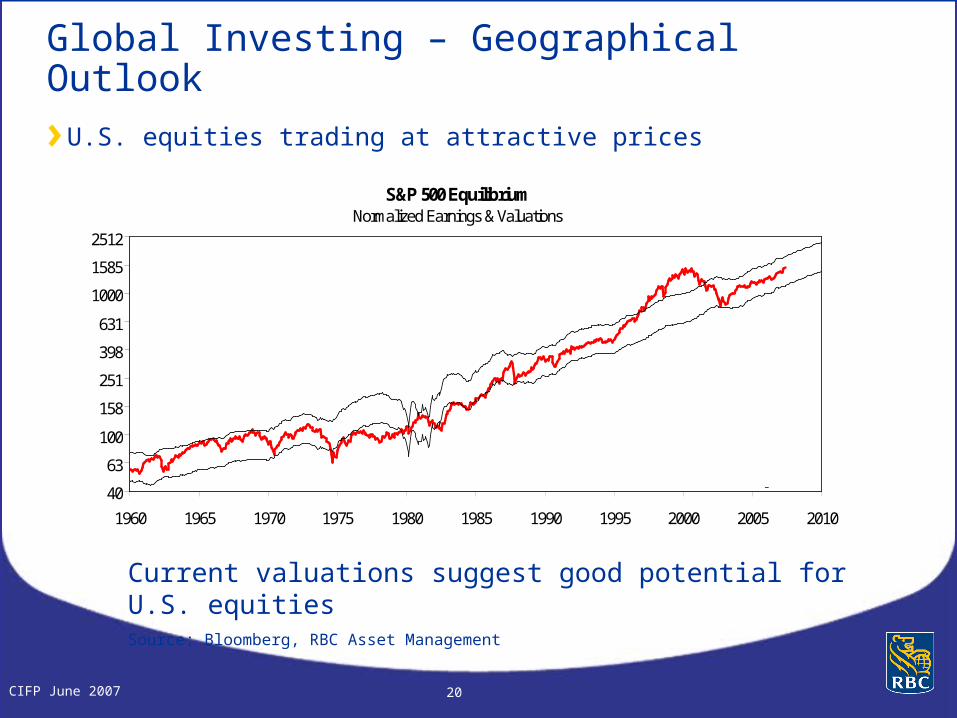
Global Investing – Geographical Outlook
U.S. equities trading at attractive pricesS&P 500 Equilibrium
Normalized Earnings & Valuations
40
63
100
158
251
398
631
1000
1585
2512
1960 1965 1970 1975 1980 1985 1990 1995 2000 2005 2010
Source: Bloomberg, RBC AM
May '07 Range: 1134 - 1822 (Mid: 1478)May '08 Range: 1245 - 2002 (Mid: 1624)Current (22-May-07): 1524
Current valuations suggest good potential for U.S. equitiesSource: Bloomberg, RBC Asset Management
CIFP June 2007 21
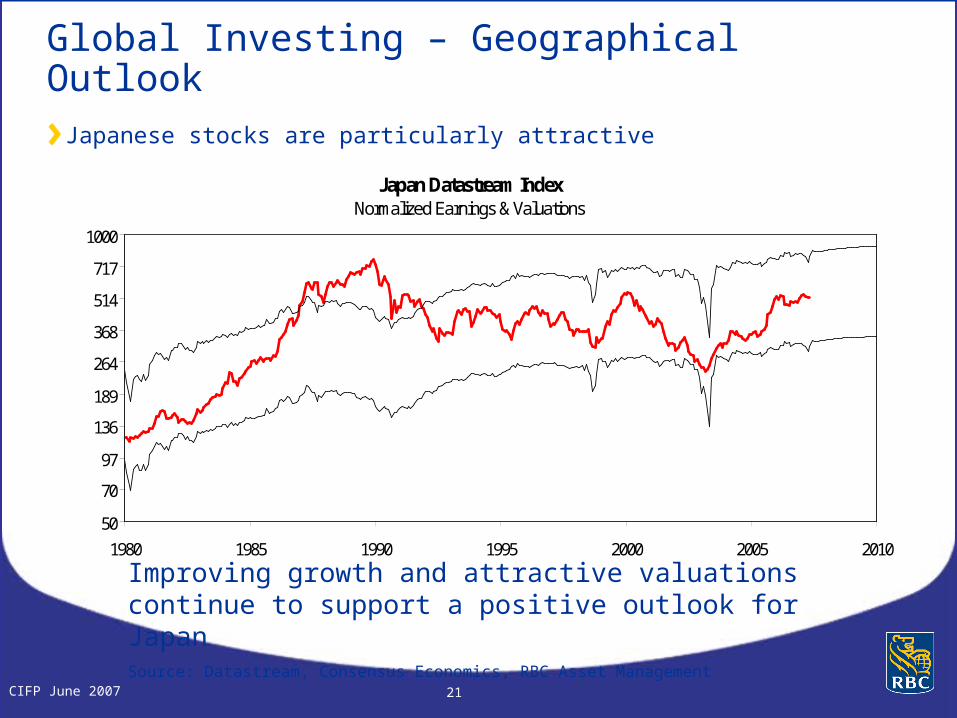
Global Investing – Geographical Outlook
Japanese stocks are particularly attractive
Improving growth and attractive valuations continue to support a positive outlook for JapanSource: Datastream, Consensus Economics, RBC Asset Management
Japan Datastream IndexNormalized Earnings & Valuations
50
70
97
136
189
264
368
514
717
1000
1980 1985 1990 1995 2000 2005 2010
Source: Datastream, Consensus Economics, RBC AM
May '07 Range: 312 - 798 (Mid: 555) May '08 Range: 337 - 861 (Mid: 599)Current (22-May-07): 518

CIFP June 2007 22
Global investing challenges - Currency
0.7%
5.8%9.1%
-6.9%
3.6% 5.4%
-0.6%
-23.4%
-7.6%-3.3%
-0.1%
1996 1997 1998 1999 2000 2001 2002 2003 2004 2005 2006
In 2003 and 2004, the decline in the U.S. dollar (and rise in the Canadian dollar) had a significant impact on returns for Canadian investors holding U.S dollar securities
Difference in Canadian investor returns and U.S. investor returnsS&P 500 Index

CIFP June 2007 23
Global investing challenges - Behavioural
People see what they want to see.
It’s just the way we’re built…and conditioned.
The size of the bowl or plate biases how much a person eats by an average of 20-30%.
You'll eat 35% more dining with a friend than when eating alone and double the amount of food ingested when dining with 7 or more people.
About 1 in 5 employees have more than 50% of their work-related investment plans in company stock
One third of Canadians have no foreign content in their RRSPs

CIFP June 2007 24
Canadian government bond market is shrinking
-
50
100
150
200
250
300
350
De
c-8
4
De
c-8
5
De
c-8
6
De
c-8
7
De
c-8
8
De
c-8
9
De
c-9
0
De
c-9
1
De
c-9
2
De
c-9
3
De
c-9
4
De
c-9
5
De
c-9
6
De
c-9
7
De
c-9
8
De
c-9
9
De
c-0
0
De
c-0
1
De
c-0
2
De
c-0
3
De
c-0
4
De
c-0
5
De
c-0
6
Go
ve
rnm
en
t B
on
d O
uts
tan
din
g (
CA
D$
bill
ion
)
1.5
2.0
2.5
3.0
3.5
4.0
4.5
5.0
% o
f W
orl
d G
ov
ern
me
nt
Bo
nd
Canadian Govt Bond (CAD$ bil)
Canadian Govt Bond % Global GovtBond (rhs)
Source: Citigroup WGBI

CIFP June 2007 25
The Case For Hedging Global Bonds
Risk (STD)
Return (GM)January 1987 - December 2006
Risk vs. Return
3.0% 10.0%4.0% 5.0% 6.0% 7.0% 8.0% 9.0%5.0%
9.0%
5.2%5.4%5.6%5.8%6.0%6.2%6.4%6.6%6.8%7.0%7.2%7.4%7.6%7.8%8.0%8.2%8.4%8.6%8.8%
Citigroup Canada 1+ Yr Gvt TR
Citigroup Canadian $ Hedged Wld Gvt TR
Citigroup World 1+ Yr Gvt TR CADHedged global bonds have provided better returns at much lower risk levels
Source: RBC Asset Management with data provided by Ibbotson EnCorr
CIFP June 2007 26
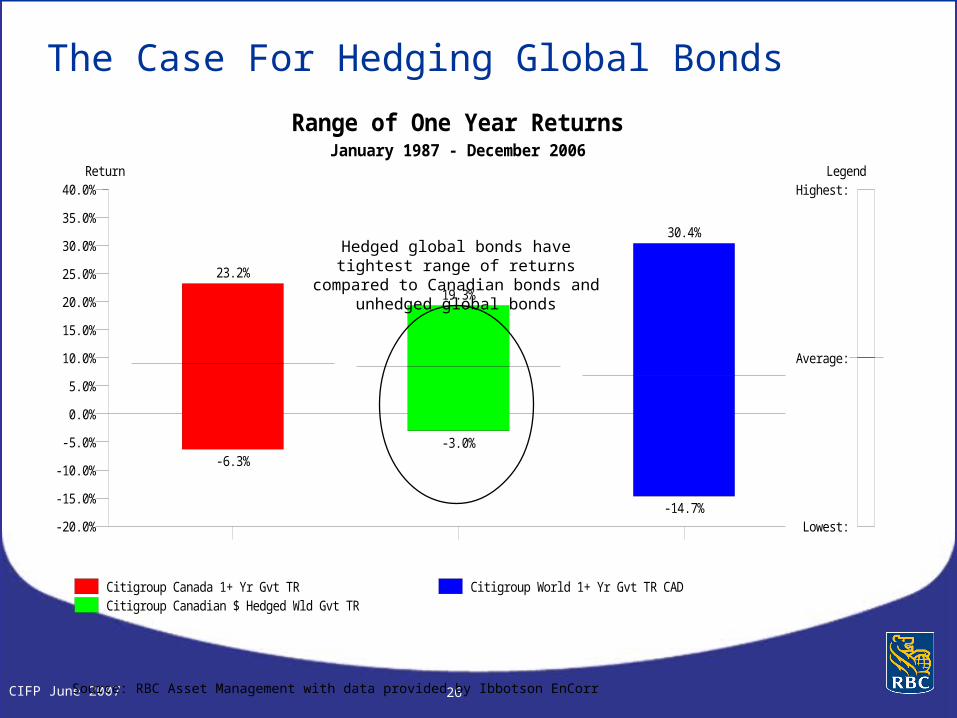
The Case For Hedging Global Bonds
Source: RBC Asset Management with data provided by Ibbotson EnCorr
ReturnJanuary 1987 - December 2006
Range of One Year Returns
-20.0%
40.0%
-15.0%
-10.0%
-5.0%
0.0%
5.0%
10.0%
15.0%
20.0%
25.0%
30.0%
35.0%
23.2%
-6.3%
19.3%
-3.0%
30.4%
-14.7%
Citigroup Canada 1+ Yr Gvt TRCitigroup Canadian $ Hedged Wld Gvt TR
Citigroup World 1+ Yr Gvt TR CAD
Highest:
Average:
Lowest:
Legend
Hedged global bonds have tightest range of returns compared to Canadian bonds
and unhedged global bonds
CIFP June 2007 27
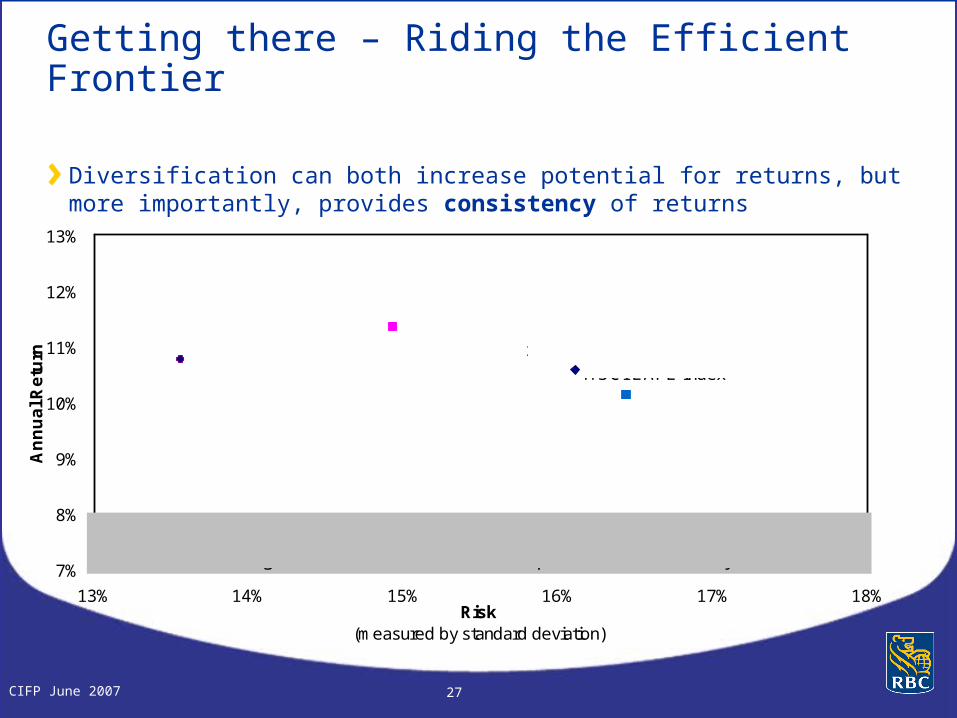
Getting there – Riding the Efficient Frontier
Diversification can both increase potential for returns, but more importantly, provides consistency of returns
7%
8%
9%
10%
11%
12%
13%
13% 14% 15% 16% 17% 18%Risk
(measured by standard deviation)
An
nu
al R
etu
rn
Canadian EquitiesS&P / TSX Composite Index
International Equities MSCI EAFE Index
U.S. EquitiesS&P 500 Index
A combination of Canadian, U.S. and International equities has historically provided investors with higher returns and less risk than a portfolio invested solely in Canada.
Diversified Portfolio40% Canada40% U.S.20% International

CIFP June 2007 28
How much is enough?
Criteria to considerInvestor characteristics – risk and return
Currency needs – income, expenses, retirement
Risk management – diversification benefits
Your own asset mix approachFamiliarity with client situation and needs
Your style – prefer standalone funds or managed solutions?
Level of ongoing involvement – rebalancing requirements

CIFP June 2007 29
How much is enough?
What is the RBC Asset Management approach?
RBC Investment Strategy CommitteeFirm wide asset allocation recommendations
Investor profile recommendationsBased on strategy committee recommendations
Implementation in investor portfoliosModel portfolios, fund-of-funds
CIFP June 2007 30
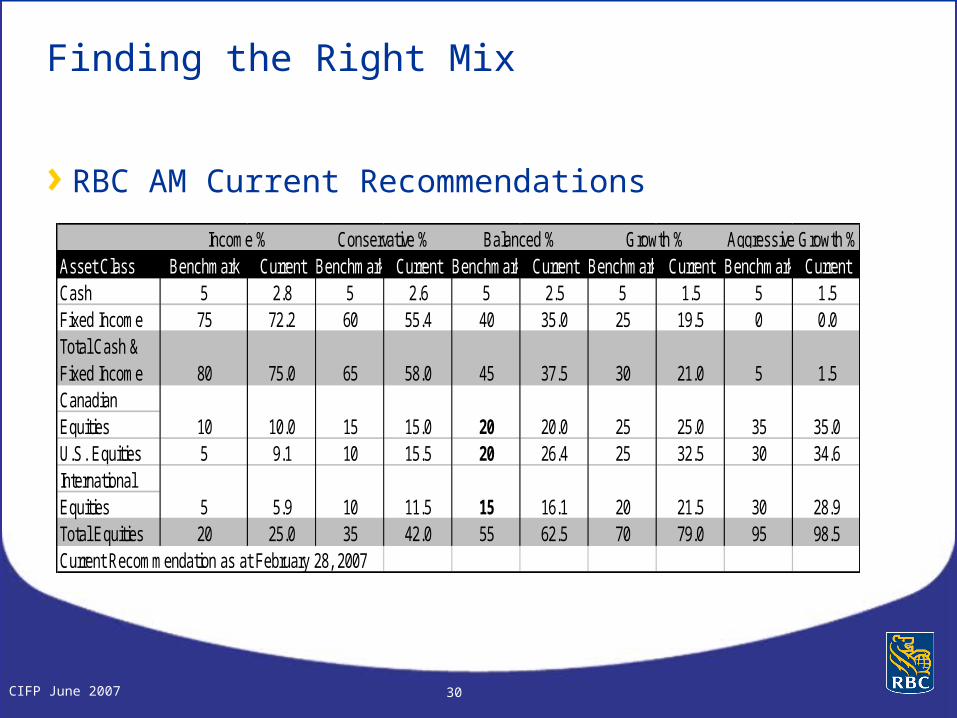
Finding the Right Mix
RBC AM Current Recommendations
Asset Class Benchmark Current Benchmark Current Benchmark Current Benchmark Current Benchmark CurrentCash 5 2.8 5 2.6 5 2.5 5 1.5 5 1.5Fixed Income 75 72.2 60 55.4 40 35.0 25 19.5 0 0.0Total Cash &Fixed IncomeCanadianEquitiesU.S. Equities 5 9.1 10 15.5 20 26.4 25 32.5 30 34.6InternationalEquitiesTotal Equities 20 25.0 35 42.0 55 62.5 70 79.0 95 98.5Current Recommendation as at February 28, 2007
Aggressive Growth %
21.0
25.0
Income % Conservative % Balanced % Growth %
5
35
30
1.5
35.0
28.9
30
25
20 21.5
45
20
15
37.5
20.0
16.1
80
10
5
75.0
10.0
5.9
65
15
10
58.0
15.0
11.5
CIFP June 2007 31
And now for the HOW…
Individual securities
ETFs
Individual funds
Fund of Funds
Combination of all of the above

32CIFP June 2007 32
Trade Execution
Diversification
Managing Currency
Access to research
Reporting
Challenges involved with investing in global segregated securities
Global Investing – Additional Challenges
CIFP June 2007 33
Global Investing – The Realities
Challenges identified: currency, execution, fixed income, are all difficult to take on as an individual investor…
But can be efficiently and effectively managed through mutual funds
Funds even help manage behavioural challengesStaying investedNot chasing performanceRebalancingdiversification

CIFP June 2007 34
One way or another
Different solutions can mean very different results

CIFP June 2007 35
Clients Succeed with Packaged Solutions
15.714.7
11.69.6
-3.8 -5.1
200220042003
Self-directed Investors in 401 k Investor in "Premixed Funds" in 401k
“Premixed Funds” target date and target risk funds/ portfolios
Source: Hewitt Associates, January 2006
Money Magazine, October 2006
Good for you…and good for them.

CIFP June 2007 36
If you’re looking at mutual funds, here are some things to consider when hiring an asset management company
… always important investment considerations but especially critical for a global strategy
CIFP June 2007 37
Value
Experienced managers
Consistent discipline
Track record of performance
Value for moneyA shop that can deliver:
Global opportunities through global footprint
Currency experience and expertise– Size and scale enables us to have dedicated team
Trading execution excellence
CIFP June 2007 38
Choice
Broad spectrum of fundsGlobalInternationalRegionalSectorStyleCurrency hedged or un-hedged options
Single fund or portfolio solution
Purchase options to suit client needs and advisor style
CIFP June 2007 39
Transparency
Know what you’re getting
The importance of clear investment mandates in portfolio construction
Confidence that a fund will do what it says it’s going to do
Are Canadian equity funds truly Canadian?
Apples to apples comparisons becoming difficult
The importance of clear, predictable fees

CIFP June 2007 40
Success
Serious about ours
Committed to yours
CIFP June 2007 41
Disclosure
The information contained in this report has been compiled by RBC Asset Management Inc. (“RBC AM”) from sources believed to be reliable, but no representations or warranty, express or implied, are made by RBC AM, its affiliates or any other person as to its accuracy, completeness or correctness. All opinions and estimates contained in this report constitute RBC AM’s judgement as of the date of this report, are subject to change without notice and are provided in good faith but without legal responsibility. This report may not be reproduced, distributed or published without the written consent of RBC Asset Management.To the full extent permitted by law neither RBC AM nor any of its affiliates, nor any other person, accepts any liability whatsoever for any direct or consequential loss arising from any use of this report or the information contained herein. Past performance does not indicate future performance.RBC Asset Management Inc. provides global wealth management services. RBC Asset Management Inc. and Royal Bank of Canada are separate corporate entities, which are affiliated. ® Registered trademark of Royal Bank of Canada. Used under license. © Copyright 2007. All rights reserved.


