Tonnes Year-on-year Year-to-date Gold demand Ð -12% Ð -6% Jewellery Ð -14% Ð -8% Technology Ð -1% Ð -1% Investment Ð -11% Ð -3% Central banks and other institutions Ð -13% Ð -6% Supply Ð -5% Ð -3% Source: Metals Focus; World Gold Council Gold Demand Trends Second quarter 2015 August 2015 Key changes Testing times for gold Gold demand dropped 12% to a six-year low of 914.9 tonnes in a challenging quarter. Despite pockets of strength, demand was down in all sectors. Supply declined by 5% year-on-year. Key themes of Q2 2015 (more detail page 2-4) Consumer demand falls in India and China. These markets accounted for almost half the fall in global demand. Eurozone issues bolster local investment. Investors in Europe focussed on issues close to home as the Greek crisis dominated the headlines. Facing forward: H2 outlook. Prospects for the remainder of the year are more encouraging, with consumers responding to the recent price drop. Featured Q2 2015 Chart *ROG GHPDQG LQ WKH ƮUVW VL[ PRQWKV E\ FDWHJRU\ On a half-yearly basis, the year-on-year decline in global gold demand was a more modest 6%. ETFs and similar products Central banks and other institutions Source: Metals Focus; GFMS, Thomson Reuters; World Gold Council Jewellery Technology Total bar and coin demand H1’10 H1’11 H1’12 H1’13 H1’14 H1’15 -1,000 -500 0 500 1,000 1,500 2,000 2,500 3,000 3,500 Tonnes Embargo: Not for release before 13 August 2015, 05.00 hrs BST Contents Key themes of Q2 2015 02 Demand disrupted during difficult quarter… 02 …but a smoother path lies ahead 05 Market commentary 06 Jewellery 06 Investment 10 Central banks and other institutions 13 Technology 15 Supply 16 Gold demand statistics 18 Notes and definitions 26 &RQWULEXWRUV Louise Street [email protected]Krishan Gopaul [email protected]Mukesh Kumar [email protected]Carol Lu [email protected]Alistair Hewitt Director, Market Intelligence [email protected]www.gold.org
Transcript
Tonnes Year-on-year Year-to-date
Gold demand ETH-12 ETH -6
Jewellery ETH-14 ETH -8
Technology ETH-1 ETH -1
Investment ETH-11 ETH -3
Central banks and other institutions ETH-13 ETH -6
Supply ETH -5 ETH -3
Source Metals Focus World Gold Council
Gold Demand TrendsSecond quarter 2015 August 2015
Key changes Testing times for gold Gold demand dropped 12 to a six-year low of 9149 tonnes in a challenging quarter Despite pockets of strength demand was down in all sectors Supply declined by 5 year-on-year Key themes of Q2 2015 (more detail page 2-4)
Consumer demand falls in India and China These markets accounted for almost half the fall in global demand
Eurozone issues bolster local investment Investors in Europe focussed on issues close to home as the Greek crisis dominated the headlines
Facing forward H2 outlook Prospects for the remainder of the year are more encouraging with consumers responding to the recent price drop
Featured Q2 2015 Chart ROGGHPDQGLQWKHƮUVWVL[PRQWKVEFDWHJRU
On a half-yearly basis the year-on-year decline in global gold demand was a more modest 6
Year-on-year gold demand changes by category in tonnes
ETFs and similar products Central banks and other institutions
Source Metals Focus GFMS Thomson Reuters World Gold Council
Gold demand in the first six months by category since 2010
Tonnes
Embargo Not for release before 13 August 2015
0500 hrs BST
Contents
Key themes of Q2 2015 02 Demand disrupted during
difficult quarterhellip 02 hellipbut a smoother path lies ahead 05
Market commentary 06 Jewellery 06 Investment 10 Central banks and other institutions 13 Technology 15 Supply 16
Gold demand statistics 18
Notes and definitions 26
ampRQWULEXWRUV
Louise Street louisestreetgoldorgKrishan Gopaul krishangopaulgoldorgMukesh Kumar mukeshkumargoldorgCarol Lu carollugoldorgAlistair Hewitt Director Market Intelligence alistairhewittgoldorg
wwwgoldorg
02Gold Demand Trends | Second quarter 2015
Key themes of Q2 2015
Demand disrupted during GLƱFXOWTXDUWHUŦJewellery demand came under pressure from negative consumer sentiment while investment was a casualty of directionless prices and stock market gains
Gold prices were largely directionless between March and June This was both the cause and effect of weak demand In US dollar terms gold traded within a narrow
Table 1 Data highlights for Q2 2015 (see full details on pages 18 ndash 25)
Source Metals Focus GFMS Thomson Reuters ICE Benchmark Administration World Gold Council
US$70 range Volatility was just 13 compared with its 5-year average of 18 Such sideways price movement meant that consumers in a number of markets were discouraged from buying gold as they were uncertain as to whether there would be an opportunity to buy at lower levels
In volume terms the jewellery sector faced the biggest decline in demand ndash Q2 was down 811 tonnes (t) year-on-year The fall was chiefly due to the weakness in the key markets of India and China both of which were dictated by market-specific issues
03Gold Demand Trends | Second quarter 2015
Comparing H1 2015 to H1 2014 Indian jewellery demand fell just 3 But the decline was more dramatic when we look at the second quarter The 23 year-on-year fall in Q2 jewellery demand can largely be traced to the unseasonal rainfall that damaged crops in Q1 and the consequent impact on incomes among the all-important rural population Additionally a relative dearth of auspicious days for marriages in June and July hit wedding-related demand in Q2 Wedding purchases are usually made 2-3 months in advance of the event which meant that this element of demand was unusually slow during the second quarter See Jewellery for further detail
Jewellery demand in China dropped 5 Continued economic slowdown and severe fluctuations in the domestic stock market knocked consumer sentiment The consumer environment in China has been overshadowed
by the deceleration in domestic GDP growth and the jewellery market has been a notable casualty of this trend the decline in network expansion into Tier 3 and 4 cities1 by jewellery retail chains bears witness to this
Stock market turbulence also impeded demand On the one hand rallying equities drew attention away from discretionary purchases of items such as gold jewellery (a phenomenon we discussed in Gold Demand Trends First quarter 2015 ) as consumers poured disposable income into chasing stocks higher On the other hand the sharp reversal in stock markets in late June damaged sentiment wiping out the capital gains made by late joiners to the rally and leaving consumers less inclined to spend their disposable income on jewellery among other things
1 Chinese cities are divided into four (sometimes five) tiers depending upon various economic political and social factors For more information please see World Gold Council China progress and prospects April 2014
04Gold Demand Trends | Second quarter 2015
European investors turn to gold at time of crisisThe effect of localised issues driving demand was clearly apparent in European investment trends Gold investors in Europe ndash in both retail and institutional camps ndash adopted a more positive stance towards gold than those in most other markets (Chart 1)
Demand for bars coins and ETFs was boosted by the Greek crisis and the possible threat to the stability of the euro area The positive impact on gold investment was confined to European markets as they were the most likely to be directly affected by any contagion
Outside of Europe investors did not seem to view the risks associated with Greece as systemic Bar and coin demand for the region expanded by 73t compared with average declines of 17t across all other markets
Patterns of ETF demand in Europe were similarly telling After marginal inflows during the first quarter (+03t) as the Greek crisis began to re-emerge investment in European ETFs increased by 66t during the second quarter as it built towards its July crescendo This outperformed the ETF universe as a whole which saw modest outflows of just under 23t in Q2
European bar and coin demand European ETF demand European investment demand
Source Metals Focus GFMS Thomson Reuters Respective ETFETC providers World Gold Council
Chart 1 Re-emergence of Greek crisis has seen investors turn to gold
European investors increased their gold exposure as the situation in Greece deteriorated German gold ETFs had net inflows during both Q1 and Q2 similar to when the European
debt crisis started to unfold in 2010-2011The positive effect on investment demand was localised as investors in other markets
did not see the crisis posing a systemic risk
05Gold Demand Trends | Second quarter 2015
2 World Gold Council Understanding Chinarsquos gold market July 2014
ŦEXWDVPRRWKHUSDWK lies aheadSecond half evolution and outlook
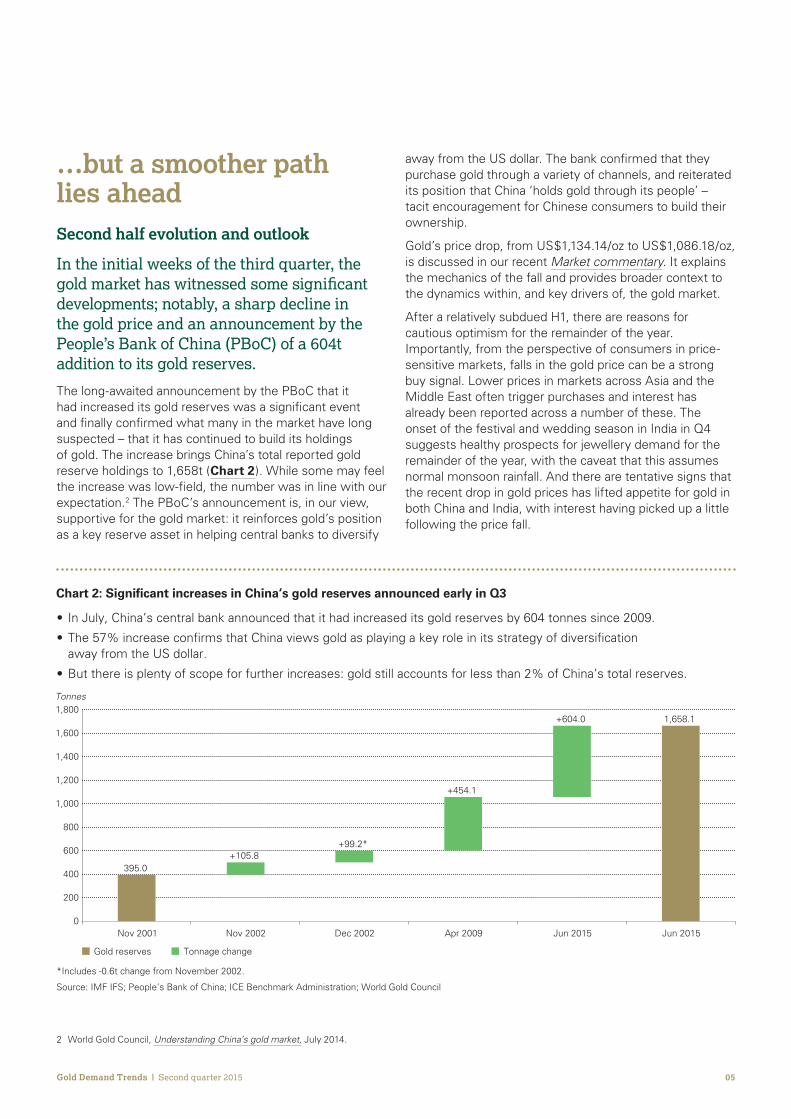
In the initial weeks of the third quarter the JROGPDUNHWKDVZLWQHVVHGVRPHVLJQLƮFDQWdevelopments notably a sharp decline in the gold price and an announcement by the Peoplersquos Bank of China (PBoC) of a 604t addition to its gold reserves
The long-awaited announcement by the PBoC that it had increased its gold reserves was a significant event and finally confirmed what many in the market have long suspected ndash that it has continued to build its holdings of gold The increase brings Chinarsquos total reported gold reserve holdings to 1658t (Chart 2) While some may feel the increase was low-field the number was in line with our expectation2 The PBoCrsquos announcement is in our view supportive for the gold market it reinforces goldrsquos position as a key reserve asset in helping central banks to diversify
away from the US dollar The bank confirmed that they purchase gold through a variety of channels and reiterated its position that China lsquoholds gold through its peoplersquo ndash tacit encouragement for Chinese consumers to build their ownership
Goldrsquos price drop from US$113414oz to US$108618oz is discussed in our recent Market commentary It explains the mechanics of the fall and provides broader context to the dynamics within and key drivers of the gold market
After a relatively subdued H1 there are reasons for cautious optimism for the remainder of the year Importantly from the perspective of consumers in price-sensitive markets falls in the gold price can be a strong buy signal Lower prices in markets across Asia and the Middle East often trigger purchases and interest has already been reported across a number of these The onset of the festival and wedding season in India in Q4 suggests healthy prospects for jewellery demand for the remainder of the year with the caveat that this assumes normal monsoon rainfall And there are tentative signs that the recent drop in gold prices has lifted appetite for gold in both China and India with interest having picked up a little following the price fall
Tonnes
Chart 2 Significant increases in Chinarsquos gold reserves announced early in Q3
06Gold Demand Trends | Second quarter 2015
Market commentary
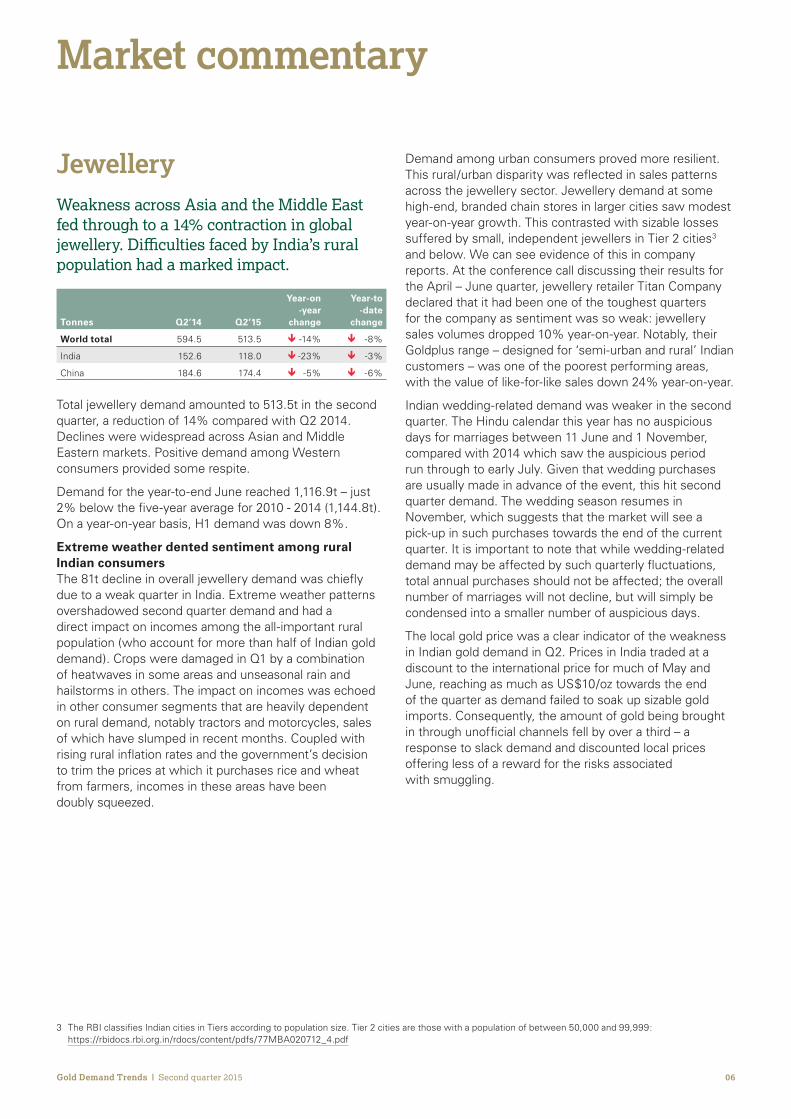
Total jewellery demand amounted to 5135t in the second quarter a reduction of 14 compared with Q2 2014 Declines were widespread across Asian and Middle Eastern markets Positive demand among Western consumers provided some respite
Demand for the year-to-end June reached 11169t ndash just 2 below the five-year average for 2010 - 2014 (11448t) On a year-on-year basis H1 demand was down 8
Extreme weather dented sentiment among rural Indian consumersThe 81t decline in overall jewellery demand was chiefly due to a weak quarter in India Extreme weather patterns overshadowed second quarter demand and had a direct impact on incomes among the all-important rural population (who account for more than half of Indian gold demand) Crops were damaged in Q1 by a combination of heatwaves in some areas and unseasonal rain and hailstorms in others The impact on incomes was echoed in other consumer segments that are heavily dependent on rural demand notably tractors and motorcycles sales of which have slumped in recent months Coupled with rising rural inflation rates and the governmentrsquos decision to trim the prices at which it purchases rice and wheat from farmers incomes in these areas have been doubly squeezed
JewelleryWeakness across Asia and the Middle East fed through to a 14 contraction in global MHZHOOHULƱFXOWLHVIDFHGEQGLDŞVUXUDOpopulation had a marked impact
Tonnes Q2rsquo14 Q2rsquo15
Year-on -year
change
Year-to -date
change
World total 5945 5135 ETH-14 ETH-8
India 1526 1180 ETH-23 ETH-3
China 1846 1744 ETH-5 ETH-6
3 The RBI classifies Indian cities in Tiers according to population size Tier 2 cities are those with a population of between 50000 and 99999 httpsrbidocsrbiorginrdocscontentpdfs77MBA020712_4pdf
Demand among urban consumers proved more resilient This ruralurban disparity was reflected in sales patterns across the jewellery sector Jewellery demand at some high-end branded chain stores in larger cities saw modest year-on-year growth This contrasted with sizable losses suffered by small independent jewellers in Tier 2 cities3 and below We can see evidence of this in company reports At the conference call discussing their results for the April ndash June quarter jewellery retailer Titan Company declared that it had been one of the toughest quarters for the company as sentiment was so weak jewellery sales volumes dropped 10 year-on-year Notably their Goldplus range ndash designed for lsquosemi-urban and ruralrsquo Indian customers ndash was one of the poorest performing areas with the value of like-for-like sales down 24 year-on-year
Indian wedding-related demand was weaker in the second quarter The Hindu calendar this year has no auspicious days for marriages between 11 June and 1 November compared with 2014 which saw the auspicious period run through to early July Given that wedding purchases are usually made in advance of the event this hit second quarter demand The wedding season resumes in November which suggests that the market will see a pick-up in such purchases towards the end of the current quarter It is important to note that while wedding-related demand may be affected by such quarterly fluctuations total annual purchases should not be affected the overall number of marriages will not decline but will simply be condensed into a smaller number of auspicious days
The local gold price was a clear indicator of the weakness in Indian gold demand in Q2 Prices in India traded at a discount to the international price for much of May and June reaching as much as US$10oz towards the end of the quarter as demand failed to soak up sizable gold imports Consequently the amount of gold being brought in through unofficial channels fell by over a third ndash a response to slack demand and discounted local prices offering less of a reward for the risks associated with smuggling
07Gold Demand Trends | Second quarter 2015
4 India Ratings and Research Monsoon and agriculture 19 June 2015
5 Reserve Bank of India Second Bi-monthly Monetary Policy Statement 2015-16 httpsrbiorginScriptsBS_PressReleaseDisplayaspxprid=34073
Imports in April and May overshot demand considerably jewellery manufacturers and wholesalers had anticipated healthier levels of demand Much of the surplus gold is currently languishing in bloated inventories waiting to be absorbed as demand picks up in H2 An interesting trend is the rapid growth of doreacute as a proportion of imports this element of gold imports grew five-fold over the year from 92t in Q2 2014 to 558t This may have been driven by refiners actively seeking out supplies of doreacute to make the most of the difference between duties on doreacute and bullion imports In any case the groundswell of these imports have contributed to the inventory overhang in the market
Looking at Indian jewellery demand on a half-yearly basis the net impact is a modest decline of just over 7t With Diwali heralding the onset of the Q4 wedding season in mid-November the prospects for H2 are supportive ndash particularly with the local gold price having dropped substantially in recent weeks A risk to this scenario is the monsoon rainfall which is projected by the meteorological
department to be below normal for the second consecutive year Although research by India Ratings and Research4 suggests that the government has a strategy to minimise agricultural losses in the case of a deficient monsoon the central bank has identified a shortfall in monsoon rains as a key risk to its inflation outlook5
China cracks decelerating GDP growth and stock market fluctuations hurt sentimentChinese demand sank 5 to 1744t in the second quarter This equated to a 6 drop in first half demand ndash to 3956t from 4206t As discussed in Key Themes the domestic economic backdrop and stock market volatility both contributed to reduced demand
Demand for 24 carat lsquopurersquo gold was worst affected while 18 carat jewellery was contrastingly resilient Mirroring the pattern seen in India Chinarsquos large retail brands were far better able to withstand the slowdown which was concentrated among smaller secondary retailers
Chart 3 Slowing economic growth has affected Chinese consumer sentiment and gold
Index level
08Gold Demand Trends | Second quarter 2015
For much of the quarter Chinese stock markets continued to rally ndash the Shanghai Composite Index surged to 7-year highs in June This again drew consumerrsquos attention away from gold jewellery However when equities took a turn for the worse and fell sharply in June the reverse was not the case In fact the negative effect on jewellery demand was compounded by the detrimental impact on sentiment among consumers (Chart 3)
The Chinese jewellery industry faced a challenging time as manufacturers and retailers chased a smaller pool of consumers leading to excess capacity Such increased competition has forced a number of small workshops to close and many wholesalers are facing debt problems with banks tightening up their lines of credit to the jewellery industry This partly helps to explain the increased market share of 18 carat jewellery as manufacturers reallocated resources towards promoting this higher-margin product
Mixed results across Asia broadly cancelled outAmong the smaller Asian markets demand was mixed weakness in Thailand was a reaction to continued economic contraction following last yearrsquos military coup which has eroded consumer confidence Malaysiarsquos introduction of a 6 Goods and Services Tax in April caused demand to drop to its lowest quarterly total since 2011 In contrast demand in Japan edged higher aided at the margin by higher numbers of Chinese tourists Demand grew 02t reversing the year-earlier decline which was triggered by an increase in Value Added Tax (VAT)
Vietnam outperformed the rest of the region with a 22 year-on-year jump Lower prices triggered buying interest Improved GDP growth ndash a boon to consumer sentiment ndash offered further support First half demand across these markets was broadly neutral with the exception of strong (20) growth in Vietnam and an opposite 18 contraction in Singapore
Turkish consumers priced out by near-record lira goldIn Turkey currency depreciation pushed local prices out of reach of many consumers The local price reached its highest levels for almost four years as the surprise election result sent the lira plummeting Recycling volumes normalised however following the spike seen in the previous quarter
Negative forces dominate Middle Eastern demandTurning the spotlight to the Middle East the second quarter was a period of widespread weakness Consumers in Iran battled a raft of negative forces including an increase in VAT lower oil prices currency weakness and international economic sanctions With regards to the latter the lifting of sanctions sparked an improvement in demand in recent weeks which was evident in premiums rising close to US$22oz although the higher VAT burden and weak oil prices remain headwinds
Jewellery demand in the UAE slid 22 with losses attributed to lower spending by European tourists (on the back of the weaker euro) and regional geo-political tensions The timing of Ramadan ndash encroaching further into Q2 compared with last year ndash was a further obstacle
09Gold Demand Trends | Second quarter 2015
6 Latest export data available at time of writing Source GTIS and GFMS Thomson Reuters
US jewellery demand remains on gentle upward course The atmosphere in Western gold jewellery markets was more positive The US remains a slow and steady engine for jewellery demand posting another small (2) year-on-year increase in demand Consumers were encouraged by lower prices as verified by an 11 year-on-year rise in gold jewellery imports for April and May6 The rolling four-quarter total of US jewellery demand reached 1176t ndash its highest level since Q3 2011 ndash as the market extended its recent cautious uptrend
The slightly erratic nature of US economic recovery has proved a headwind to more convincing growth but we expect the recovery in demand to gain momentum as yet lower prices feed through to consumers This is backed up by comments from the National Retail Federationrsquos chief economist Jack Kleinhenz who said that ldquoWhile consumer spending continues to be erratic and varied going forward I expect to see improvements in retail sales supported mostly by the USrsquos healthy labor market improving housing markets and easier access to consumer creditrdquo
Marginal improvement in European regional demand was driven by modest gains in the UK Spain and Germany outweighing minor declines in France and Italy While Italyrsquos export sector benefitted again from the upturn in the US domestic demand continues to stagnate ndash hit by the weaker euro UK jewellery demand continued to build on the solid base established in 2012 Total first half demand of 82t was the highest since 2010 and the recent gold price declines point towards further improvement over the remainder of the year
10Gold Demand Trends | Second quarter 2015
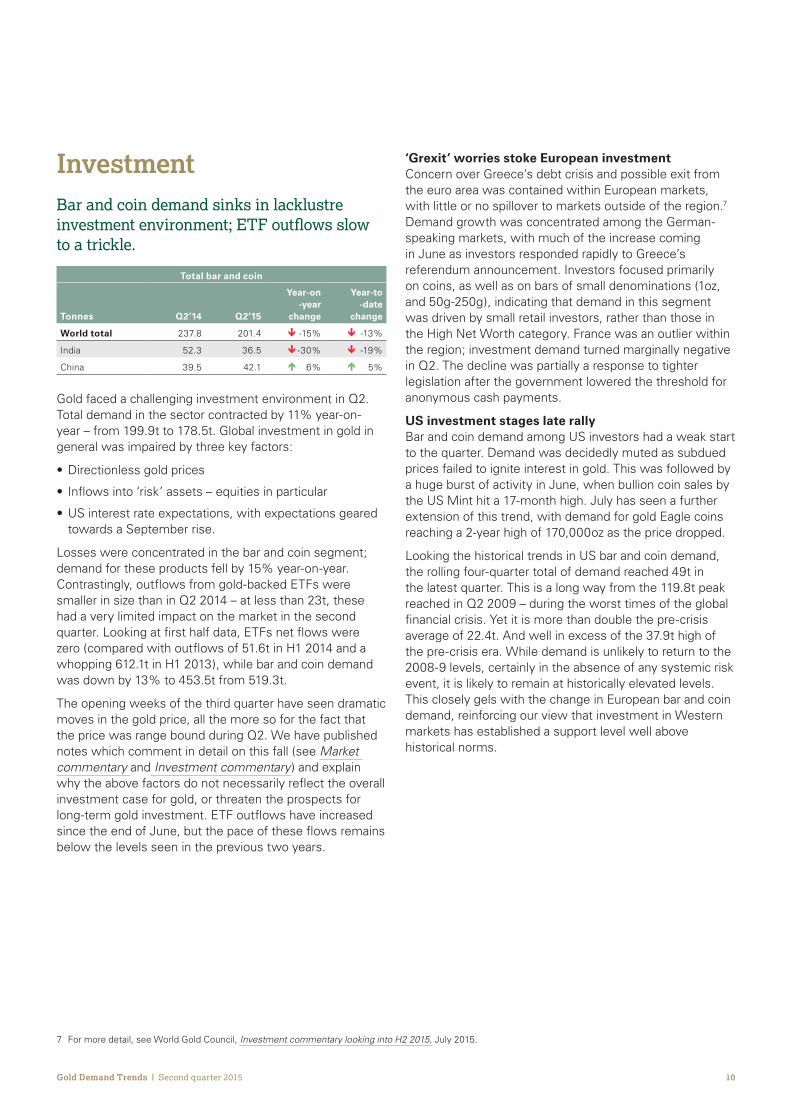
InvestmentBar and coin demand sinks in lacklustre LQYHVWPHQWHQYLURQPHQW(7)RXWưRZVVORZto a trickle
Total bar and coin
Tonnes Q2rsquo14 Q2rsquo15
Year-on -year
change
Year-to -date
change
World total 2378 2014 ETH-15 ETH-13
India 523 365 ETH-30 ETH-19
China 395 421 Iuml6 Iuml 5
Gold faced a challenging investment environment in Q2 Total demand in the sector contracted by 11 year-on-year ndash from 1999t to 1785t Global investment in gold in general was impaired by three key factors
Directionless gold prices
Inflows into lsquoriskrsquo assets ndash equities in particular
US interest rate expectations with expectations geared towards a September rise
Losses were concentrated in the bar and coin segment demand for these products fell by 15 year-on-year Contrastingly outflows from gold-backed ETFs were smaller in size than in Q2 2014 ndash at less than 23t these had a very limited impact on the market in the second quarter Looking at first half data ETFs net flows were zero (compared with outflows of 516t in H1 2014 and a whopping 6121t in H1 2013) while bar and coin demand was down by 13 to 4535t from 5193t
The opening weeks of the third quarter have seen dramatic moves in the gold price all the more so for the fact that the price was range bound during Q2 We have published notes which comment in detail on this fall (see Market commentary and Investment commentary) and explain why the above factors do not necessarily reflect the overall investment case for gold or threaten the prospects for long-term gold investment ETF outflows have increased since the end of June but the pace of these flows remains below the levels seen in the previous two years
lsquoGrexitrsquo worries stoke European investment Concern over Greecersquos debt crisis and possible exit from the euro area was contained within European markets with little or no spillover to markets outside of the region7 Demand growth was concentrated among the German-speaking markets with much of the increase coming in June as investors responded rapidly to Greecersquos referendum announcement Investors focused primarily on coins as well as on bars of small denominations (1oz and 50g-250g) indicating that demand in this segment was driven by small retail investors rather than those in the High Net Worth category France was an outlier within the region investment demand turned marginally negative in Q2 The decline was partially a response to tighter legislation after the government lowered the threshold for anonymous cash payments
US investment stages late rally Bar and coin demand among US investors had a weak start to the quarter Demand was decidedly muted as subdued prices failed to ignite interest in gold This was followed by a huge burst of activity in June when bullion coin sales by the US Mint hit a 17-month high July has seen a further extension of this trend with demand for gold Eagle coins reaching a 2-year high of 170000oz as the price dropped
Looking the historical trends in US bar and coin demand the rolling four-quarter total of demand reached 49t in the latest quarter This is a long way from the 1198t peak reached in Q2 2009 ndash during the worst times of the global financial crisis Yet it is more than double the pre-crisis average of 224t And well in excess of the 379t high of the pre-crisis era While demand is unlikely to return to the 2008-9 levels certainly in the absence of any systemic risk event it is likely to remain at historically elevated levels This closely gels with the change in European bar and coin demand reinforcing our view that investment in Western markets has established a support level well above historical norms
7 For more detail see World Gold Council Investment commentary looking into H2 2015 July 2015
11Gold Demand Trends | Second quarter 2015
Chinese bar and coin demand broadly stable ndash up 6 but from a low basePurchases of gold bars and coins in China were sidelined for much of the second quarter in favour of investing in the stock market The 6 year-on-year increase in investment demand was largely reflective of the low base of demand in Q2 2014 although price expectations also played their part ndash the lack of direction in gold prices meant investors were uncertain as to the likely future trend
Demand for gold bars and coins picked up towards the end of the quarter in response to the sharp drop in Chinese equities in the latter half of June This was also mirrored by a rise in demand for gold accounts
Investment demand in India down to a 6-year lowDespite reasonable levels of interest around Akshaya Tritiya in April investment demand for gold in India contracted for a third successive quarter declining by 30 to a fresh six-year low of 365t Uncertain price expectations were a factor as was the stock market which has continued to capture the attention of investors with its continued strong performance The weak rural economy played a further role Those rural investors most affected by the Q1 rains were more inclined to sell gold to supplement declining incomes than make fresh purchases
The lack of demand was such that unusually India exported a small amount of bullion during the quarter The local market price discount (discussed in Key themes) provided a profit-making opportunity ndash and around 10-15t of bullion was exported to capitalise on that (Chart 4)
Chart 4 Lacklustre demand in Q2 has led to a discount in local Indian prices (22-day moving average)
US$oz
12Gold Demand Trends | Second quarter 2015
East-Asian investment weakness broadly reflects price expectationsThe smaller East Asian markets cumulatively accounted for a 61t drop in demand for gold bars and coins Uncertainty over the future direction of gold prices was a general theme across the region The 12 decline in Vietnamese investment was also a function of very high premiums on gold tael bars which hovered around US$100-150oz over the international gold price In comparison gold chi rings with premiums of around US$40-50oz were a more attractive investment tool In Japan activity picked up in terms of both buying and selling but the net impact was broadly neutral with just 02t of disinvestment
Turkish investors held off waiting for the opportunity to buy at lower prices High local gold prices in Turkey ndash a consequence of the sharp depreciation in the lira ndash were off-putting to investors who preferred to wait for the opportunity to buy gold bars and coins at slightly lower prices rather than invest at prices not far from record levels Some investment buying has re-emerged since the end of the quarter in response to the fall in the gold price This has been reflected in a modest rise in the local premium to around US$3oz in recent weeks
13Gold Demand Trends | Second quarter 2015
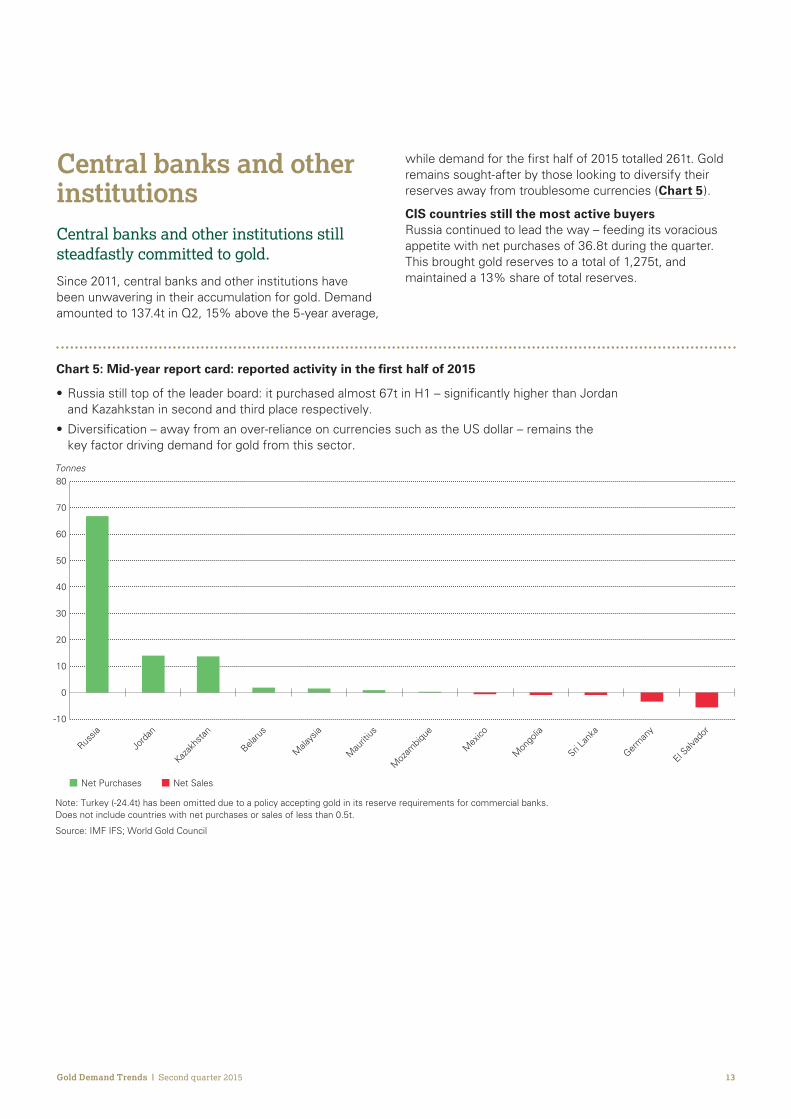
ampHQWUDOEDQNVDQGRWKHUinstitutionsCentral banks and other institutions still steadfastly committed to gold
Since 2011 central banks and other institutions have been unwavering in their accumulation for gold Demand amounted to 1374t in Q2 15 above the 5-year average
while demand for the first half of 2015 totalled 261t Gold remains sought-after by those looking to diversify their reserves away from troublesome currencies (Chart 5)
CIS countries still the most active buyers Russia continued to lead the way ndash feeding its voracious appetite with net purchases of 368t during the quarter This brought gold reserves to a total of 1275t and maintained a 13 share of total reserves
Russia s a s a
Tonnes
Chart 5 Mid-year report card reported activity in the first half of 2015
14Gold Demand Trends | Second quarter 2015
Aside from Russia significant fresh demand came from Kazakhstan whose central bank purchased a further 73t between April ndash June The country has now increased its gold reserves for 33 consecutive months
Iran repatriates 13t of historically-purchased goldThe Central Bank of Iran declared that it had taken delivery of 13t of gold from South Africa having stored it there for the past two years The announcement was concrete evidence that Iran has bought gold to bolster its reserves in recent years albeit that the seller remains unidentified As part of talks towards a nuclear agreement Iran was permitted to move the gold from South Africa to its own domestic vault Little is published about the level of Iranian gold reserves but it is clear that Iran sees gold as a prominent part of its total reserves
China reports a jump in gold holdingsWithout doubt the most significant announcement came shortly after the end of the quarter The PBoC revealed that it had increased its gold reserves by 57 since its last announcement in 2009 bringing its total to 1658t
Following the 604t increase gold reserves still only represent 2 of total reserves and we believe have ample room to grow
Reaction to the announcement was cool among investors in the West who voiced disappointment that the figure was not in line with their higher and in some cases unrealistic expectations Despite this the increase in gold reserves was overwhelmingly supportive for the gold market reaffirming that China remains committed to gold as a reserve asset8
And the case for an increased allocation to gold in Chinarsquos reserves is reinforced in the context of Chinarsquos macro-economic fundamentals China accounts for about 13 of global GDP and 32 of global foreign reserves The purchase of 604t brings Chinarsquos share of global gold reserves to about 5
8 World Gold Council Market commentary 23 July 2015
15Gold Demand Trends | Second quarter 2015
TechnologySubstitution and thrifting remain the key challenges for gold demand within the technology sector
Goldrsquos use in technological applications saw a marginal decline in the second quarter down less than 1 to 855t The recurring theme of substitution away from gold is still prominent despite its superior qualities gold remains relatively expensive to cost-conscious manufacturers
Gold in electronics under pressure down 1 in second quarterGoldrsquos use in electronics remains subdued as rising unit sales are offset by declining gold volumes due to substitution and thrifting Demand of 682t in the second quarter was down 1 year-on-year Owing to the growing trend of consumers changing electronic devices (such as smartphones) more regularly manufacturers are beginning to place less emphasis on materials which provide greater longevity This will exacerbate the substitutionthrifting that has been seen in electronics as manufacturers move from gold to less costly materials although the effect of such thrifting should be mitigated by increased sales of consumer electronics Global semiconductor sales reached near-record levels in the second quarter up 2 year-on-year to US$84bn Sales for the first half year were 4 up on the same period in 2014 as demand for smartphones etc continues to grow albeit at a slowing rate
Gold bonding wire witnessed further losses in Q2 2015 Demand fell 10-15 in South Korea Taiwan and China all key manufacturing hubs in the electronics sector Within the first six months of 2015 copper bonding wire penetration in non-memory packages has risen from 70 to 75 with most of this taking share away from gold And while gold bonding wire is still used in memory packages key manufacturers are working on gold reduction projects
For plating the second quarter saw tentative signs that the trend in substitutionthrifting away from gold may be reversing There were indications that some manufacturers might be moving away from palladium-nickel (PdNi) alloys back to gold This was mostly seen in higher-end goods where concerns over performance and reliability are highest
Other industrial and decorative applications relatively flat rising less than 1Demand for gold in other industrial and decorative applications remained relatively flat year-on-year A reduction in demand from Chinese (slowing economic growth) and Russian (sanctions and rouble weakness) consumers did little to derail growth in costume jewellery and gold-plated accessories Further pressure on manufacturers to thrift has lifted owing to a lower current gold price
Dental demand continues to erode down 4 year-on-yearGold used in dental applications fell 4 to 47t in Q2 2015 its lowest quarterly level in our records The long-term trend of ceramics replacing gold continues unabated as consumers still place a greater emphasis on cosmetic as well as financial considerations
16Gold Demand Trends | Second quarter 2015
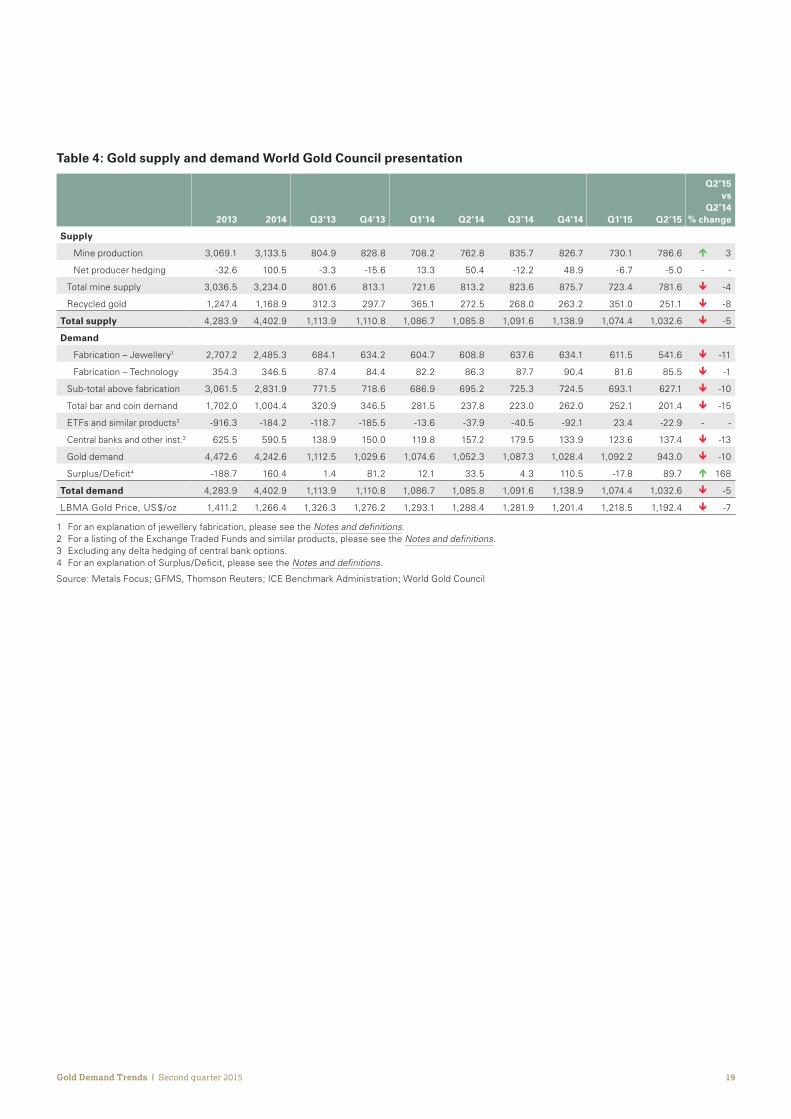
SupplyTotal supply contracted by 5 year-on-year to 10326t in Q2 ndash despite another quarter of modest growth in mine production ndash as recycling activity diminished again
Year-to-date mine production hedging and recycling have generated a combined 21071t of supply 3 less than in the same period of 2014 Lower levels of recycling account for a good portion of this decline
Mine production edged higher pipeline activity shrinksMine production increased by 3 to 7866t in the second quarter Growth was again scattered across the globe as mines in a number of countries were able to generate minor increases in output
Indonesia made the largest contribution to the growth in mine production Mining entered a high-grade area at Newmontrsquos Batu Hijau mine accounting for around 5t of additional output relative to Q2 2014 Grasberg also generated a modest increase (+25t)
Increased output at Goldstrikersquos Twin Creeks surface mine in Nevada helped towards year-on-year growth for the US as a whole although this was largely due to comparisons with a poor 2014
In Africa continued ramping up of the Kibali mine and the start of Otjikoto were positive for the Democratic Republic of Congo (DRC) and Namibia respectively Production in Ghana on the other hand was lower year-on-year due to a decline in output at Newmontrsquos Ahafo mine
0
200
400
600
800
US$oz
Chart 6 Gold explorationdevelopment activity continues to decline
Index level
17Gold Demand Trends | Second quarter 2015
There are differing forces at play in the mining industry which have implications for future production levels Mining companies have certainly made great strides in reducing their costs over the last year or two And recent strength in the dollar has been a tangible benefit in reducing the burden of dollar-denominated costs in particular lower oil prices are of enormous help given that they typically account for around 10 of mining costs
However there is only so much more scope for producers to implement cost-cutting measures and many remain at the mercy of foreign exchange fluctuations Coupled with the sharp drop in the gold price in July producer margins have deteriorated further and we continue to expect that mine production will taper off levelling out over the next year
This view is supported by a three-year decline in levels of exploration and development activity in the gold mining industry The Pipeline Activity Index constructed by SNL Metals amp Mining shows that activity in the gold supply pipeline peaked in Q1 2012 and has been in decline ever since falling to a new low below 60 for the first time in Q2 this year (Chart 6)
Recycling ebbs to 8-year lowRecycling activity subsided following the burst of activity seen in Q1 which had flushed out much of the readily available supplies The result was an 8 drop in this element of supply from 2725t to 2511t For the January ndash June period recycling declined 6 to just 602t ndash the lowest first half since 2007
Supply from Western markets continued to dwindle ndash a trend that shows no sign of stopping albeit that supply from these markets has halved in the last two years and the pace of decline is likely to slow
Recycling in Turkey was seen to lsquonormalisersquo after the sharp spike in the first quarter Despite the surge in local prices they fell just short of the level many consumers were targeting as a sell signal and hence recycling was relatively well contained The fall in the price since the end of the quarter has further dampened the propensity for Turkish consumers to sell their existing holdings
Amid a broad contraction in recycling India was an outlier The fragile state of Indian gold demand was reflected in a 7 rise in recycling activity as the rural population looked to supplement their shrinking incomes ndash one of the key reasons for investing in gold among this contingent
Hedging continues to impact supply only at the marginYear-on-year comparisons of producer hedging show a marked swing The relatively sizable hedge position initiated by Polyus Gold in Q2 2014 contrasts with 5t of net de-hedging in the most recent quarter Year-to-date the comparison is starker still ndash 638t of net hedging in H1 2014 vs 117t of net de-hedging in the first half of 2015
The trivial de-hedging of Q2 was due to continued deliveries into existing positions although we expect that minor hedging activity (mostly for the purposes of aiding cashflow in debt repayment) may outweigh such deliveries for the year as a whole
Hedging continues to have only a marginal bearing on the total supply of gold Since Q1 2010 the net total impact of hedging on overall gold supply is -753t This compares with total cumulative gold supply over the same period of over 24000t Given that shareholders continue to express a preference for mining companies not to engage in hedging supply from this category is unlikely to increase in the coming quarters
1 For an explanation of jewellery fabrication please see the Notes and definitions 2 For a listing of the Exchange Traded Funds and similar products please see the Notes and definitions 3 Excluding any delta hedging of central bank options 4 For an explanation of SurplusDeficit please see the Notes and definitions
Source Metals Focus GFMS Thomson Reuters ICE Benchmark Administration World Gold Council
20Gold Demand Trends | Second quarter 2015
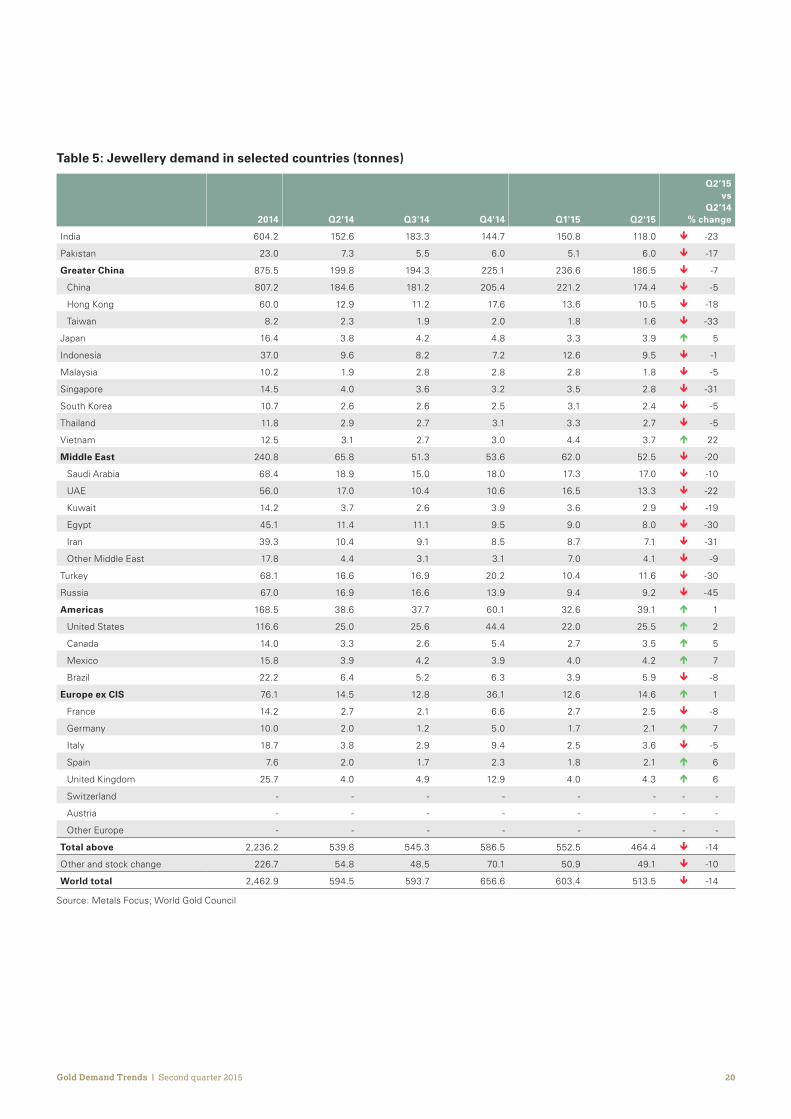
Table 5 Jewellery demand in selected countries (tonnes)
2014 Q214 Q314 Q414 Q115 Q215
Q2rsquo15 vs
Q2rsquo14 change
India 6042 1526 1833 1447 1508 1180 ETH -23
Pakistan 230 73 55 60 51 60 ETH -17
Greater China 8755 1998 1943 2251 2366 1865 ETH -7
China 8072 1846 1812 2054 2212 1744 ETH -5
Hong Kong 600 129 112 176 136 105 ETH -18
Taiwan 82 23 19 20 18 16 ETH -33
Japan 164 38 42 48 33 39 Iuml 5
Indonesia 370 96 82 72 126 95 ETH -1
Malaysia 102 19 28 28 28 18 ETH -5
Singapore 145 40 36 32 35 28 ETH -31
South Korea 107 26 26 25 31 24 ETH -5
Thailand 118 29 27 31 33 27 ETH -5
Vietnam 125 31 27 30 44 37 Iuml 22
Middle East 2408 658 513 536 620 525 ETH -20
Saudi Arabia 684 189 150 180 173 170 ETH -10
UAE 560 170 104 106 165 133 ETH -22
Kuwait 142 37 26 39 36 29 ETH -19
Egypt 451 114 111 95 90 80 ETH -30
Iran 393 104 91 85 87 71 ETH -31
Other Middle East 178 44 31 31 70 41 ETH -9
Turkey 681 166 169 202 104 116 ETH -30
Russia 670 169 166 139 94 92 ETH -45
Americas 1685 386 377 601 326 391 Iuml 1
United States 1166 250 256 444 220 255 Iuml 2
Canada 140 33 26 54 27 35 Iuml 5
Mexico 158 39 42 39 40 42 Iuml 7
Brazil 222 64 52 63 39 59 ETH -8
Europe ex CIS 761 145 128 361 126 146 Iuml 1
France 142 27 21 66 27 25 ETH -8
Germany 100 20 12 50 17 21 Iuml 7
Italy 187 38 29 94 25 36 ETH -5
Spain 76 20 17 23 18 21 Iuml 6
United Kingdom 257 40 49 129 40 43 Iuml 6
Switzerland - - - - - - - -
Austria - - - - - - - -
Other Europe - - - - - - - -
Total above 22362 5398 5453 5865 5525 4644 ETH -14
Other and stock change 2267 548 485 701 509 491 ETH -10
World total 24629 5945 5937 6566 6034 5135 ETH -14
Source Metals Focus World Gold Council
21Gold Demand Trends | Second quarter 2015
Table 6 Total bar and coin demand in selected countries (tonnes)
2014 Q214 Q314 Q414 Q115 Q215
Q2rsquo15 vs
Q2rsquo14 change
India 2069 523 540 569 409 365 ETH -30
Pakistan 147 50 32 36 32 35 ETH -30
Greater China 1761 425 329 407 618 436 Iuml 3
China 1664 395 308 383 597 421 Iuml 6
Hong Kong 14 03 03 03 04 03 Iuml 3
Taiwan 83 27 18 21 17 13 ETH -52
Japan -27 -11 -10 -82 -32 -02 - -
Indonesia 285 67 75 87 57 45 ETH -33
Malaysia 88 22 22 20 25 15 ETH -32
Singapore 75 21 20 18 18 13 ETH -36
South Korea 61 16 15 14 16 13 ETH -20
Thailand 964 180 256 283 195 164 ETH -8
Vietnam 542 123 132 128 144 108 ETH -12
Middle East 719 175 127 112 190 110 ETH -37
Saudi Arabia 156 37 32 38 51 31 ETH -16
UAE 99 27 21 20 33 20 ETH -25
Kuwait 10 03 02 02 02 02 ETH -20
Egypt 60 16 14 13 10 09 ETH -44
Iran 361 85 50 30 83 41 ETH -52
Other Middle East 32 08 07 08 10 07 ETH -14
Turkey 486 155 55 151 52 45 ETH -71
Russia 79 22 21 15 13 13 ETH -43
Americas 550 130 121 164 133 135 Iuml 4
United States 477 116 106 142 118 124 Iuml 7
Canada 37 08 07 12 07 05 ETH -44
Mexico 22 04 05 07 05 04 Iuml 2
Brazil 13 03 03 03 04 04 Iuml 34
Europe ex CIS 1990 392 453 622 593 465 Iuml 19
France 10 02 02 06 13 -06 - -
Germany 1016 195 239 314 308 241 Iuml 24
Italy - - - - - - - -
Spain - - - - - - - -
United Kingdom 76 16 15 20 20 19 Iuml 18
Switzerland 477 98 104 150 138 110 Iuml 13
Austria 110 19 23 38 32 25 Iuml 28
Other Europe 301 62 70 94 83 77 Iuml 23
Total above 9787 2290 2185 2544 2463 1961 ETH -14
Other and stock change 256 89 45 76 58 53 ETH -40
World total 10044 2378 2230 2620 2521 2014 ETH -15
Source Metals Focus World Gold Council
22Gold Demand Trends | Second quarter 2015
Table 7 Consumer demand in selected countries (tonnes)
2014 Q214 Q314 Q414 Q115 Q215
Q2rsquo15 vs
Q2rsquo14 change
India 8111 2049 2373 2017 1917 1545 ETH -25
Pakistan 378 123 87 96 83 95 ETH -23
Greater China 10516 2423 2272 2658 2984 2302 ETH -5
China 9736 2241 2120 2437 2808 2165 ETH -3
Hong Kong 614 132 115 179 140 108 ETH -18
Taiwan 165 50 37 42 36 29 ETH -43
Japan 137 26 32 -34 01 37 Iuml 40
Indonesia 655 163 157 159 183 140 ETH -14
Malaysia 190 41 50 48 53 33 ETH -20
Singapore 220 61 55 51 52 41 ETH -33
South Korea 168 42 41 39 46 37 ETH -11
Thailand 1081 208 283 314 228 191 ETH -8
Vietnam 667 153 159 158 189 145 ETH -5
Middle East 3126 833 640 648 810 635 ETH -24
Saudi Arabia 840 226 182 218 224 201 ETH -11
UAE 660 197 124 126 198 153 ETH -22
Kuwait 152 39 28 41 38 32 ETH -19
Egypt 511 130 125 109 100 89 ETH -32
Iran 754 189 141 115 170 112 ETH -40
Other Middle East 210 52 39 39 80 47 ETH -10
Turkey 1167 321 223 353 156 161 ETH -50
Russia 749 190 187 153 107 105 ETH -45
Americas 2235 516 497 765 459 526 Iuml 2
United States 1643 366 363 586 338 379 Iuml 3
Canada 177 41 33 67 34 39 ETH -4
Mexico 180 43 46 46 45 45 Iuml 7
Brazil 235 67 55 67 42 63 ETH -6
Europe ex CIS 2751 537 581 984 719 611 Iuml 14
France 151 28 22 72 39 19 ETH -35
Germany 1116 215 251 365 325 262 Iuml 22
Italy 187 38 29 94 25 36 ETH -5
Spain 76 20 17 23 18 21 Iuml 6
United Kingdom 333 56 64 149 59 61 Iuml 9
Switzerland 477 98 104 150 138 110 Iuml 13
Austria 110 19 23 38 32 25 Iuml 28
Other Europe 301 62 70 94 83 77 Iuml 23
Total above 32149 7687 7638 8409 7988 6605 ETH -14
Other and stock change 2524 636 530 777 567 544 ETH -15
World total 34673 8324 8168 9186 8554 7149 ETH -14
Source Metals Focus World Gold Council
23Gold Demand Trends | Second quarter 2015
Table 8 Quarterly average price
2014 Q214 Q314 Q414 Q115 Q215
Q2rsquo15 vs
Q2rsquo14 change
US$oz 12664 12884 12819 12014 12185 11924 ETH -7
oz 9528 9397 9670 9603 10831 10780 Iuml15
poundoz 7681 7654 7676 7582 8049 7777 Iuml 2
CHFkg 372059 368315 376683 371895 372925 360827 ETH -2
yeng 42975 42289 42824 44074 46668 46564 Iuml10
Rs10g 248351 247779 249708 238990 243779 243328 ETH -2
RMBg 2508 2581 2541 2373 2443 2378 ETH -8
TLg 890 875 891 872 965 1023 Iuml17
Source ICE Benchmark Administration Thomson Reuters Datastream World Gold Council
Table 9 Indian supply estimates
2014 Q214 Q314 Q414 Q115 Q215
Q2rsquo15 vs
Q2rsquo14 change
Supply
Net bullion imports 8915 2062 2252 2822 2270 2050 ETH -1
Scrap 925 225 175 225 180 240 Iuml 7
Domestic supply from other sources1 112 27 25 25 25 25 ETH -7
Total supply2 9952 2314 2452 3072 2475 2315 Icirc 0
1 Domestic supply from local mine production recovery from imported copper concentrates and disinvestment 2 This supply can be consumed across the three sectors ndash jewellery investment and technology Consequently the total supply figure in the table will
not add to jewellery plus investment demand for India
Source Metals Focus World Gold Council
24Gold Demand Trends | Second quarter 2015
Tonnes of reserves
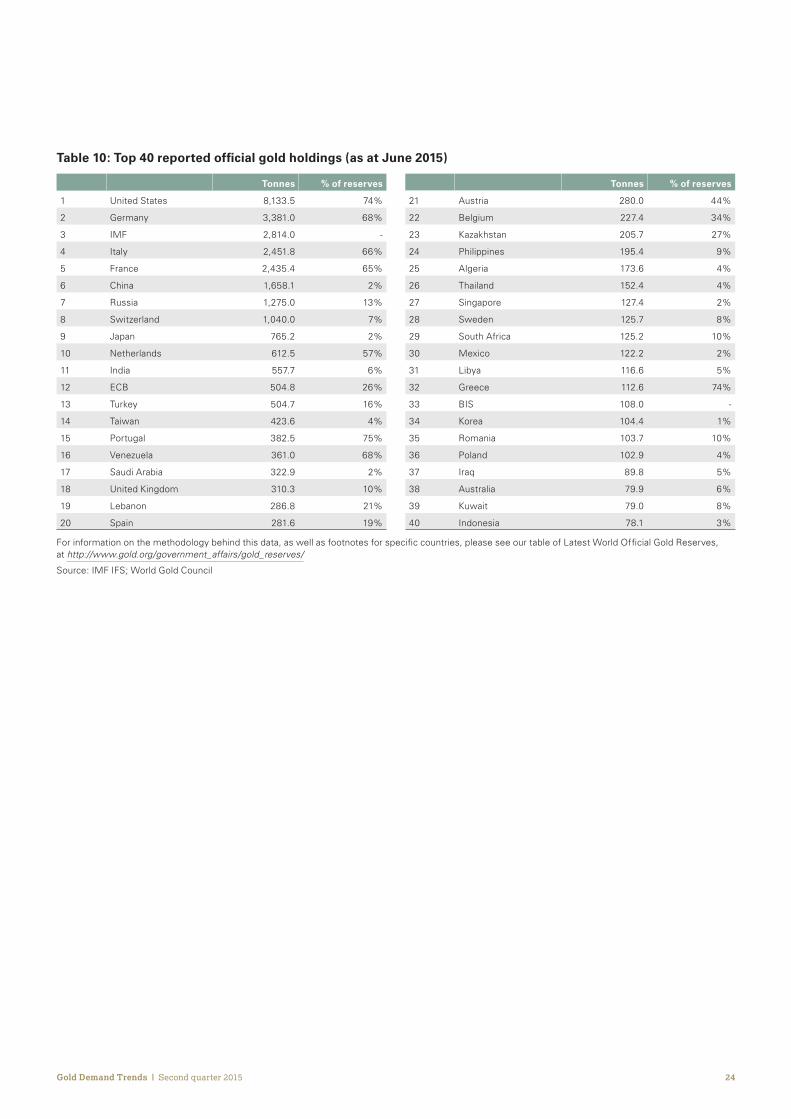
21 Austria 2800 44
22 Belgium 2274 34
23 Kazakhstan 2057 27
24 Philippines 1954 9
25 Algeria 1736 4
26 Thailand 1524 4
27 Singapore 1274 2
28 Sweden 1257 8
29 South Africa 1252 10
30 Mexico 1222 2
31 Libya 1166 5
32 Greece 1126 74
33 BIS 1080 -
34 Korea 1044 1
35 Romania 1037 10
36 Poland 1029 4
37 Iraq 898 5
38 Australia 799 6
39 Kuwait 790 8
40 Indonesia 781 3
Tonnes of reserves
1 United States 81335 74
2 Germany 33810 68
3 IMF 28140 -
4 Italy 24518 66
5 France 24354 65
6 China 16581 2
7 Russia 12750 13
8 Switzerland 10400 7
9 Japan 7652 2
10 Netherlands 6125 57
11 India 5577 6
12 ECB 5048 26
13 Turkey 5047 16
14 Taiwan 4236 4
15 Portugal 3825 75
16 Venezuela 3610 68
17 Saudi Arabia 3229 2
18 United Kingdom 3103 10
19 Lebanon 2868 21
20 Spain 2816 19
Table 10 Top 40 reported official gold holdings (as at June 2015)
For information on the methodology behind this data as well as footnotes for specific countries please see our table of Latest World Official Gold Reserves at httpwwwgoldorggovernment_affairsgold_reserves
Source IMF IFS World Gold Council
25Gold Demand Trends | Second quarter 2015
Table 11 Historical data for gold demand
Tonnes
JewelleryTotal bar and coin
investmentETFs and similar Technology Central banks Total
2005 27210 4181 2111 4404 -6634 31272
2006 23014 4298 2585 4717 -3654 30960
2007 24249 4375 2588 4777 -4838 31151
2008 23062 9179 3240 4647 -2354 37773
2009 18163 8323 6442 4144 -336 36737
2010 20513 12005 4211 4599 792 42119
2011 20904 14899 2364 4270 4808 47245
2012 21363 12938 3063 3791 5693 46848
2013 26732 17020 -9163 3543 6255 44386
2014 24629 10044 -1842 3465 5905 42201
Q3rsquo13 6284 3209 -1187 874 1389 10568
Q4rsquo13 6160 3465 -1855 844 1500 10115
Q1rsquo14 6181 2815 -136 822 1198 10879
Q2rsquo14 5945 2378 -379 863 1572 10380
Q3rsquo14 5937 2230 -405 877 1795 10435
Q4rsquo14 6566 2620 -921 904 1339 10508
Q1rsquo15 6034 2521 234 816 1236 10840
Q2rsquo15 5135 2014 -229 855 1374 9149
For a listing of the Exchange Traded Funds and similar products please see the Notes and definitions
Source Metals Focus GFMS Thomson Reuters ICE Benchmark Administration World Gold Council
26Gold Demand Trends | Second quarter 2015
1RWHVDQGGHƮQLWLRQV
All statistics (except where specified) are in weights of fine gold
Notes
Revisions to dataAll data is subject to revision in the light of new information
Historical data seriesDemand and supply data from Q1 2014 are provided by Metals Focus Data between Q1 2010 and Q4 2013 is a synthesis of Metals Focus and GFMS Thomson Reuters data which was created using relatively simple statistical techniques For more information on this process please see Creating a consistent data series by Dr James Abdey (wwwgoldorgsupply-and-demandgold-demand-trends )
HƮQLWLRQV
Central banks and other institutionsNet purchases (ie gross purchases less gross sales) by central banks and other official sector institutions including supra national entities such as the IMF Swaps and the effects of delta hedging are excluded
Consumer demandThe sum of jewellery consumption and total bar and coin investment occurring within a country ie the amount (in fine weight) of gold purchased directly by individuals
ElectronicsThis measures fabrication of gold into components used in the production of electronics including ndash but not limited to ndash semiconductors and bonding wire
DentistryThe first transformation of raw gold into intermediate or final products destined for dental applications such as dental alloys
ETFs and similar productsExchange Traded Funds and similar products including but not limited to SPDR Gold Shares iShares Gold Trust ZKB Gold ETF ETFS Physical GoldJersey Gold Bullion Securities Ltd Central Fund of Canada Ltd Xetra-Gold Julius Baer Precious Metals Fund ndash JB Physical Gold Fund Source Physical Gold P-ETC Sprott Physical Gold Trust Over time new products may be included when appropriate Gold holdings are as reported by the ETFETC issuers and where data is unavailable holdings have been calculated using reported AUM numbers
FabricationFabrication is the first transformation of gold bullion into a semi-finished or finished product
Gold demandThe total of jewellery fabrication technology total bar and coin demand and demand for ETFs and similar products
Jewellery End-user demand for all newly-made carat jewellery and gold watches whether plain gold or combined with other materials Excluded are second-hand jewellery other metals plated with gold coins and bars used as jewellery and purchases funded by the trading-in of existing carat gold jewellery
Jewellery fabricationFigures for jewellery fabrication ndash the first transformation of gold bullion into semi-finished or finished jewellery ndash are included in Table 4 Differs from jewellery consumption as it excludes the impact of importsexports and stockingde-stocking by manufacturers and distributors
LBMA Gold price PMUnless otherwise specified gold price values from 20 March 2015 are based on the LBMA Gold price PM administered by ICE Benchmark Administration (IBA) with prior values being based on the London PM Fix
London PM FixUnless otherwise specified gold price values prior to 20 March 2015 are based on the London PM Fix with subsequent values being based on the LBMA Gold price PM administered by ICE Benchmark Administration (IBA)
Medalsimitation coinFabrication of gold coins without a face value produced by both private and national mints India dominates this category with on average around 90 of the total lsquoMedallionrsquo is the name given to unofficial coins in India Medals of at least 99 purity wires and lumps sold in small quantities are also included
Mine productionThe volume (in fine weight) of gold mined globally This includes an estimate for gold produced as a result of artisanal and small scale mining (ASM) which is largely informal
27Gold Demand Trends | Second quarter 2015
Net producer hedgingThis measures the impact in the physical market of mining companiesrsquo gold forward sales loans and options positions Hedging accelerates the sale of gold a transaction which releases gold (from existing stocks) to the market Over time hedging activity does not generate a net increase in the supply of gold De-hedging ndash the process of closing out hedged positions ndash has the opposite impact and will reduce the amount of gold available to the market in any given quarter
Official coin demandInvestment by individuals in gold bullion coins It equates to the fabrication by national mints of coins which are or have been legal tender in the country of issue It is measured at the country of consumption rather than at the country of origin (for example the Perth Mint in Australia sells the majority of the coins it produces through its global distribution network) and is measured on a net basis In practice it includes the initial sale of many coins destined ultimately to be considered as numismatic rather than bullion
Other industrialGold used in the production of compounds such as Gold Potassium Cyanide for electro-plating in industrial applications as well as in the production of gold-plated jewellery and other decorative items such as gold thread India accounts for the bulk of demand in this category
Over-the-counterOver-the-counter (OTC) transactions (also referred to as lsquooff exchangersquo trading) take place directly between two parties unlike exchange trading which is conducted via an exchange
Physical bar demandInvestment by individuals in small (1kg and below) gold bars in a form widely accepted in the countries represented within Gold Demand Trends This also includes where identifiable gold bought and stored via online vendors It is measured as net purchases
Recycled goldGold sourced from fabricated products that have been sold or made ready for sale which is refined back into bullion This specifically refers to gold sold for cash It does not include gold traded-in for other gold products (for example by consumers at jewellery stores) or process scrap (working gold that never becomes part of a fabricated product but instead returns as scrap to a refiner) The vast majority ndash around 90 ndash of recycled gold is high-value gold (largely jewellery) and the remainder is gold recovered from industrial waste including laptops mobile phones circuit boards etc For more detail on recycling refer to The Ups and Downs of Gold Recycling Boston Consulting Group and World Gold Council March 2015 (wwwgoldorgsupply-and-demand )
SurplusdeficitThis is the difference between total supply and gold demand Partly a statistical residual this number also captures demand in the OTC market and changes to inventories on commodity exchanges with an additional contribution from changes to fabrication inventories
TechnologyThis captures all gold used in the fabrication of electronics dental medical decorative and other technological applications with electronics representing the largest component of this category It includes gold destined for plating jewellery
Tonne (Metric)1000 kg or 32151 troy oz of fine gold
Total bar and coin investmentThe total of physical bar demand official coin demand and demand for medalsimitation coin
Total supplyThe total of mine production net producer hedging and recycling
I101201508
Copyright and other rightscopy 2015 World Gold Council All rights reserved World Gold Council and the Circle device are trademarks of the World Gold Council or its affiliates
All references to LBMA Gold Price are used with the permission of ICE Benchmark Administration Limited and have been provided for informational purposes only ICE Benchmark Administration Limited accepts no liability or responsibility for the accuracy of the prices or the underlying product to which the prices may be referenced
Other third party data and content is the intellectual property of the respective third party and all rights are reserved to them
Any copying republication or redistribution of content to reproduce distribute or otherwise use the statistics and information in this report including by framing or similar means is expressly prohibited without the prior written consent of the World Gold Council or the appropriate copyright owners except as provided below
The use of the statistics in this report is permitted for the purposes of review and commentary (including media commentary) in line with fair industry practice subject to the following two pre-conditions (i) only limited extracts of data or analysis be used and (ii) any and all use of these statistics is accompanied by a clear acknowledgement of the World Gold Council and where appropriate of Thomson Reuters as their source Brief extracts from the analysis commentary and other World Gold Council material are permitted provided World Gold Council is cited as the source It is not permitted to reproduce distribute or otherwise use the whole or a substantial part of this report or the statistics contained within it
While every effort has been made to ensure the accuracy of the information in this document the World Gold Council does not warrant or guarantee the accuracy completeness or reliability of this information The World Gold Council does not accept responsibility for any losses or damages arising directly or indirectly from the use of this document
The material contained in this document is provided solely for general information and educational purposes and is not and should not be construed as an offer to buy or sell or as a solicitation of an offer to buy or sell gold any gold related products or any other products securities or investments Nothing in this document should be taken as making any recommendations or providing any investment or other advice with respect to the purchase sale
or other disposition of gold any gold related products or any other products securities or investments including without limitation any advice to the effect that any gold related transaction is appropriate for any investment objective or financial situation of a prospective investor A decision to invest in gold any gold related products or any other products securities or investments should not be made in reliance on any of the statements in this document Before making any investment decision prospective investors should seek advice from their financial advisers take into account their individual financial needs and circumstances and carefully consider the risks associated with such investment decision
Without limiting any of the foregoing in no event will the World Gold Council or any of its affiliates be liable for any decision made or action taken in reliance on the information in this document and in any event the World Gold Council and its affiliates shall not be liable for any consequential special punitive incidental indirect or similar damages arising from related to or connected with this document even if notified of the possibility of such damages
This document contains forward-looking statements The use of the words ldquobelievesrdquo ldquoexpectsrdquo ldquomayrdquo or ldquosuggestsrdquo or similar terminology identifies a statement as ldquoforward-lookingrdquo The forward-looking statements included in this document are based on current expectations that involve a number of risks and uncertainties These forward-looking statements are based on the analysis of World Gold Council of the statistics available to it Assumptions relating to the forward-looking statement involve judgments with respect to among other things future economic competitive and market conditions all of which are difficult or impossible to predict accurately In addition the demand for gold and the international gold markets are subject to substantial risks which increase the uncertainty inherent in the forward-looking statements In light of the significant uncertainties inherent in the forward-looking information included herein the inclusion of such information should not be regarded as a representation by the World Gold Council that the forward-looking statements will be achieved
The World Gold Council cautions you not to place undue reliance on its forward-looking statements Except in the normal course of our publication cycle we do not intend to update or revise any forward-looking statements whether as a result of new information future events or otherwise and we assume no responsibility for updating any forward-looking statements
World Gold Council10 Old Bailey London EC4M 7NG United Kingdom
E marketintelligencegoldorg T +44 20 7826 4700 F +44 20 7826 4799 W wwwgoldorg
3XEOLVKHG$XJXVW
02Gold Demand Trends | Second quarter 2015
Key themes of Q2 2015
Demand disrupted during GLƱFXOWTXDUWHUŦJewellery demand came under pressure from negative consumer sentiment while investment was a casualty of directionless prices and stock market gains
Gold prices were largely directionless between March and June This was both the cause and effect of weak demand In US dollar terms gold traded within a narrow
Table 1 Data highlights for Q2 2015 (see full details on pages 18 ndash 25)
Source Metals Focus GFMS Thomson Reuters ICE Benchmark Administration World Gold Council
US$70 range Volatility was just 13 compared with its 5-year average of 18 Such sideways price movement meant that consumers in a number of markets were discouraged from buying gold as they were uncertain as to whether there would be an opportunity to buy at lower levels
In volume terms the jewellery sector faced the biggest decline in demand ndash Q2 was down 811 tonnes (t) year-on-year The fall was chiefly due to the weakness in the key markets of India and China both of which were dictated by market-specific issues
03Gold Demand Trends | Second quarter 2015
Comparing H1 2015 to H1 2014 Indian jewellery demand fell just 3 But the decline was more dramatic when we look at the second quarter The 23 year-on-year fall in Q2 jewellery demand can largely be traced to the unseasonal rainfall that damaged crops in Q1 and the consequent impact on incomes among the all-important rural population Additionally a relative dearth of auspicious days for marriages in June and July hit wedding-related demand in Q2 Wedding purchases are usually made 2-3 months in advance of the event which meant that this element of demand was unusually slow during the second quarter See Jewellery for further detail
Jewellery demand in China dropped 5 Continued economic slowdown and severe fluctuations in the domestic stock market knocked consumer sentiment The consumer environment in China has been overshadowed
by the deceleration in domestic GDP growth and the jewellery market has been a notable casualty of this trend the decline in network expansion into Tier 3 and 4 cities1 by jewellery retail chains bears witness to this
Stock market turbulence also impeded demand On the one hand rallying equities drew attention away from discretionary purchases of items such as gold jewellery (a phenomenon we discussed in Gold Demand Trends First quarter 2015 ) as consumers poured disposable income into chasing stocks higher On the other hand the sharp reversal in stock markets in late June damaged sentiment wiping out the capital gains made by late joiners to the rally and leaving consumers less inclined to spend their disposable income on jewellery among other things
1 Chinese cities are divided into four (sometimes five) tiers depending upon various economic political and social factors For more information please see World Gold Council China progress and prospects April 2014
04Gold Demand Trends | Second quarter 2015
European investors turn to gold at time of crisisThe effect of localised issues driving demand was clearly apparent in European investment trends Gold investors in Europe ndash in both retail and institutional camps ndash adopted a more positive stance towards gold than those in most other markets (Chart 1)
Demand for bars coins and ETFs was boosted by the Greek crisis and the possible threat to the stability of the euro area The positive impact on gold investment was confined to European markets as they were the most likely to be directly affected by any contagion
Outside of Europe investors did not seem to view the risks associated with Greece as systemic Bar and coin demand for the region expanded by 73t compared with average declines of 17t across all other markets
Patterns of ETF demand in Europe were similarly telling After marginal inflows during the first quarter (+03t) as the Greek crisis began to re-emerge investment in European ETFs increased by 66t during the second quarter as it built towards its July crescendo This outperformed the ETF universe as a whole which saw modest outflows of just under 23t in Q2
European bar and coin demand European ETF demand European investment demand
Source Metals Focus GFMS Thomson Reuters Respective ETFETC providers World Gold Council
Chart 1 Re-emergence of Greek crisis has seen investors turn to gold
European investors increased their gold exposure as the situation in Greece deteriorated German gold ETFs had net inflows during both Q1 and Q2 similar to when the European
debt crisis started to unfold in 2010-2011The positive effect on investment demand was localised as investors in other markets
did not see the crisis posing a systemic risk
05Gold Demand Trends | Second quarter 2015
2 World Gold Council Understanding Chinarsquos gold market July 2014
ŦEXWDVPRRWKHUSDWK lies aheadSecond half evolution and outlook
In the initial weeks of the third quarter the JROGPDUNHWKDVZLWQHVVHGVRPHVLJQLƮFDQWdevelopments notably a sharp decline in the gold price and an announcement by the Peoplersquos Bank of China (PBoC) of a 604t addition to its gold reserves
The long-awaited announcement by the PBoC that it had increased its gold reserves was a significant event and finally confirmed what many in the market have long suspected ndash that it has continued to build its holdings of gold The increase brings Chinarsquos total reported gold reserve holdings to 1658t (Chart 2) While some may feel the increase was low-field the number was in line with our expectation2 The PBoCrsquos announcement is in our view supportive for the gold market it reinforces goldrsquos position as a key reserve asset in helping central banks to diversify
away from the US dollar The bank confirmed that they purchase gold through a variety of channels and reiterated its position that China lsquoholds gold through its peoplersquo ndash tacit encouragement for Chinese consumers to build their ownership
Goldrsquos price drop from US$113414oz to US$108618oz is discussed in our recent Market commentary It explains the mechanics of the fall and provides broader context to the dynamics within and key drivers of the gold market
After a relatively subdued H1 there are reasons for cautious optimism for the remainder of the year Importantly from the perspective of consumers in price-sensitive markets falls in the gold price can be a strong buy signal Lower prices in markets across Asia and the Middle East often trigger purchases and interest has already been reported across a number of these The onset of the festival and wedding season in India in Q4 suggests healthy prospects for jewellery demand for the remainder of the year with the caveat that this assumes normal monsoon rainfall And there are tentative signs that the recent drop in gold prices has lifted appetite for gold in both China and India with interest having picked up a little following the price fall
Tonnes
Chart 2 Significant increases in Chinarsquos gold reserves announced early in Q3
06Gold Demand Trends | Second quarter 2015
Market commentary
Total jewellery demand amounted to 5135t in the second quarter a reduction of 14 compared with Q2 2014 Declines were widespread across Asian and Middle Eastern markets Positive demand among Western consumers provided some respite
Demand for the year-to-end June reached 11169t ndash just 2 below the five-year average for 2010 - 2014 (11448t) On a year-on-year basis H1 demand was down 8
Extreme weather dented sentiment among rural Indian consumersThe 81t decline in overall jewellery demand was chiefly due to a weak quarter in India Extreme weather patterns overshadowed second quarter demand and had a direct impact on incomes among the all-important rural population (who account for more than half of Indian gold demand) Crops were damaged in Q1 by a combination of heatwaves in some areas and unseasonal rain and hailstorms in others The impact on incomes was echoed in other consumer segments that are heavily dependent on rural demand notably tractors and motorcycles sales of which have slumped in recent months Coupled with rising rural inflation rates and the governmentrsquos decision to trim the prices at which it purchases rice and wheat from farmers incomes in these areas have been doubly squeezed
JewelleryWeakness across Asia and the Middle East fed through to a 14 contraction in global MHZHOOHULƱFXOWLHVIDFHGEQGLDŞVUXUDOpopulation had a marked impact
Tonnes Q2rsquo14 Q2rsquo15
Year-on -year
change
Year-to -date
change
World total 5945 5135 ETH-14 ETH-8
India 1526 1180 ETH-23 ETH-3
China 1846 1744 ETH-5 ETH-6
3 The RBI classifies Indian cities in Tiers according to population size Tier 2 cities are those with a population of between 50000 and 99999 httpsrbidocsrbiorginrdocscontentpdfs77MBA020712_4pdf
Demand among urban consumers proved more resilient This ruralurban disparity was reflected in sales patterns across the jewellery sector Jewellery demand at some high-end branded chain stores in larger cities saw modest year-on-year growth This contrasted with sizable losses suffered by small independent jewellers in Tier 2 cities3 and below We can see evidence of this in company reports At the conference call discussing their results for the April ndash June quarter jewellery retailer Titan Company declared that it had been one of the toughest quarters for the company as sentiment was so weak jewellery sales volumes dropped 10 year-on-year Notably their Goldplus range ndash designed for lsquosemi-urban and ruralrsquo Indian customers ndash was one of the poorest performing areas with the value of like-for-like sales down 24 year-on-year
Indian wedding-related demand was weaker in the second quarter The Hindu calendar this year has no auspicious days for marriages between 11 June and 1 November compared with 2014 which saw the auspicious period run through to early July Given that wedding purchases are usually made in advance of the event this hit second quarter demand The wedding season resumes in November which suggests that the market will see a pick-up in such purchases towards the end of the current quarter It is important to note that while wedding-related demand may be affected by such quarterly fluctuations total annual purchases should not be affected the overall number of marriages will not decline but will simply be condensed into a smaller number of auspicious days
The local gold price was a clear indicator of the weakness in Indian gold demand in Q2 Prices in India traded at a discount to the international price for much of May and June reaching as much as US$10oz towards the end of the quarter as demand failed to soak up sizable gold imports Consequently the amount of gold being brought in through unofficial channels fell by over a third ndash a response to slack demand and discounted local prices offering less of a reward for the risks associated with smuggling
07Gold Demand Trends | Second quarter 2015
4 India Ratings and Research Monsoon and agriculture 19 June 2015
5 Reserve Bank of India Second Bi-monthly Monetary Policy Statement 2015-16 httpsrbiorginScriptsBS_PressReleaseDisplayaspxprid=34073
Imports in April and May overshot demand considerably jewellery manufacturers and wholesalers had anticipated healthier levels of demand Much of the surplus gold is currently languishing in bloated inventories waiting to be absorbed as demand picks up in H2 An interesting trend is the rapid growth of doreacute as a proportion of imports this element of gold imports grew five-fold over the year from 92t in Q2 2014 to 558t This may have been driven by refiners actively seeking out supplies of doreacute to make the most of the difference between duties on doreacute and bullion imports In any case the groundswell of these imports have contributed to the inventory overhang in the market
Looking at Indian jewellery demand on a half-yearly basis the net impact is a modest decline of just over 7t With Diwali heralding the onset of the Q4 wedding season in mid-November the prospects for H2 are supportive ndash particularly with the local gold price having dropped substantially in recent weeks A risk to this scenario is the monsoon rainfall which is projected by the meteorological
department to be below normal for the second consecutive year Although research by India Ratings and Research4 suggests that the government has a strategy to minimise agricultural losses in the case of a deficient monsoon the central bank has identified a shortfall in monsoon rains as a key risk to its inflation outlook5
China cracks decelerating GDP growth and stock market fluctuations hurt sentimentChinese demand sank 5 to 1744t in the second quarter This equated to a 6 drop in first half demand ndash to 3956t from 4206t As discussed in Key Themes the domestic economic backdrop and stock market volatility both contributed to reduced demand
Demand for 24 carat lsquopurersquo gold was worst affected while 18 carat jewellery was contrastingly resilient Mirroring the pattern seen in India Chinarsquos large retail brands were far better able to withstand the slowdown which was concentrated among smaller secondary retailers
Chart 3 Slowing economic growth has affected Chinese consumer sentiment and gold
Index level
08Gold Demand Trends | Second quarter 2015
For much of the quarter Chinese stock markets continued to rally ndash the Shanghai Composite Index surged to 7-year highs in June This again drew consumerrsquos attention away from gold jewellery However when equities took a turn for the worse and fell sharply in June the reverse was not the case In fact the negative effect on jewellery demand was compounded by the detrimental impact on sentiment among consumers (Chart 3)
The Chinese jewellery industry faced a challenging time as manufacturers and retailers chased a smaller pool of consumers leading to excess capacity Such increased competition has forced a number of small workshops to close and many wholesalers are facing debt problems with banks tightening up their lines of credit to the jewellery industry This partly helps to explain the increased market share of 18 carat jewellery as manufacturers reallocated resources towards promoting this higher-margin product
Mixed results across Asia broadly cancelled outAmong the smaller Asian markets demand was mixed weakness in Thailand was a reaction to continued economic contraction following last yearrsquos military coup which has eroded consumer confidence Malaysiarsquos introduction of a 6 Goods and Services Tax in April caused demand to drop to its lowest quarterly total since 2011 In contrast demand in Japan edged higher aided at the margin by higher numbers of Chinese tourists Demand grew 02t reversing the year-earlier decline which was triggered by an increase in Value Added Tax (VAT)
Vietnam outperformed the rest of the region with a 22 year-on-year jump Lower prices triggered buying interest Improved GDP growth ndash a boon to consumer sentiment ndash offered further support First half demand across these markets was broadly neutral with the exception of strong (20) growth in Vietnam and an opposite 18 contraction in Singapore
Turkish consumers priced out by near-record lira goldIn Turkey currency depreciation pushed local prices out of reach of many consumers The local price reached its highest levels for almost four years as the surprise election result sent the lira plummeting Recycling volumes normalised however following the spike seen in the previous quarter
Negative forces dominate Middle Eastern demandTurning the spotlight to the Middle East the second quarter was a period of widespread weakness Consumers in Iran battled a raft of negative forces including an increase in VAT lower oil prices currency weakness and international economic sanctions With regards to the latter the lifting of sanctions sparked an improvement in demand in recent weeks which was evident in premiums rising close to US$22oz although the higher VAT burden and weak oil prices remain headwinds
Jewellery demand in the UAE slid 22 with losses attributed to lower spending by European tourists (on the back of the weaker euro) and regional geo-political tensions The timing of Ramadan ndash encroaching further into Q2 compared with last year ndash was a further obstacle
09Gold Demand Trends | Second quarter 2015
6 Latest export data available at time of writing Source GTIS and GFMS Thomson Reuters
US jewellery demand remains on gentle upward course The atmosphere in Western gold jewellery markets was more positive The US remains a slow and steady engine for jewellery demand posting another small (2) year-on-year increase in demand Consumers were encouraged by lower prices as verified by an 11 year-on-year rise in gold jewellery imports for April and May6 The rolling four-quarter total of US jewellery demand reached 1176t ndash its highest level since Q3 2011 ndash as the market extended its recent cautious uptrend
The slightly erratic nature of US economic recovery has proved a headwind to more convincing growth but we expect the recovery in demand to gain momentum as yet lower prices feed through to consumers This is backed up by comments from the National Retail Federationrsquos chief economist Jack Kleinhenz who said that ldquoWhile consumer spending continues to be erratic and varied going forward I expect to see improvements in retail sales supported mostly by the USrsquos healthy labor market improving housing markets and easier access to consumer creditrdquo
Marginal improvement in European regional demand was driven by modest gains in the UK Spain and Germany outweighing minor declines in France and Italy While Italyrsquos export sector benefitted again from the upturn in the US domestic demand continues to stagnate ndash hit by the weaker euro UK jewellery demand continued to build on the solid base established in 2012 Total first half demand of 82t was the highest since 2010 and the recent gold price declines point towards further improvement over the remainder of the year
10Gold Demand Trends | Second quarter 2015
InvestmentBar and coin demand sinks in lacklustre LQYHVWPHQWHQYLURQPHQW(7)RXWưRZVVORZto a trickle
Total bar and coin
Tonnes Q2rsquo14 Q2rsquo15
Year-on -year
change
Year-to -date
change
World total 2378 2014 ETH-15 ETH-13
India 523 365 ETH-30 ETH-19
China 395 421 Iuml6 Iuml 5
Gold faced a challenging investment environment in Q2 Total demand in the sector contracted by 11 year-on-year ndash from 1999t to 1785t Global investment in gold in general was impaired by three key factors
Directionless gold prices
Inflows into lsquoriskrsquo assets ndash equities in particular
US interest rate expectations with expectations geared towards a September rise
Losses were concentrated in the bar and coin segment demand for these products fell by 15 year-on-year Contrastingly outflows from gold-backed ETFs were smaller in size than in Q2 2014 ndash at less than 23t these had a very limited impact on the market in the second quarter Looking at first half data ETFs net flows were zero (compared with outflows of 516t in H1 2014 and a whopping 6121t in H1 2013) while bar and coin demand was down by 13 to 4535t from 5193t
The opening weeks of the third quarter have seen dramatic moves in the gold price all the more so for the fact that the price was range bound during Q2 We have published notes which comment in detail on this fall (see Market commentary and Investment commentary) and explain why the above factors do not necessarily reflect the overall investment case for gold or threaten the prospects for long-term gold investment ETF outflows have increased since the end of June but the pace of these flows remains below the levels seen in the previous two years
lsquoGrexitrsquo worries stoke European investment Concern over Greecersquos debt crisis and possible exit from the euro area was contained within European markets with little or no spillover to markets outside of the region7 Demand growth was concentrated among the German-speaking markets with much of the increase coming in June as investors responded rapidly to Greecersquos referendum announcement Investors focused primarily on coins as well as on bars of small denominations (1oz and 50g-250g) indicating that demand in this segment was driven by small retail investors rather than those in the High Net Worth category France was an outlier within the region investment demand turned marginally negative in Q2 The decline was partially a response to tighter legislation after the government lowered the threshold for anonymous cash payments
US investment stages late rally Bar and coin demand among US investors had a weak start to the quarter Demand was decidedly muted as subdued prices failed to ignite interest in gold This was followed by a huge burst of activity in June when bullion coin sales by the US Mint hit a 17-month high July has seen a further extension of this trend with demand for gold Eagle coins reaching a 2-year high of 170000oz as the price dropped
Looking the historical trends in US bar and coin demand the rolling four-quarter total of demand reached 49t in the latest quarter This is a long way from the 1198t peak reached in Q2 2009 ndash during the worst times of the global financial crisis Yet it is more than double the pre-crisis average of 224t And well in excess of the 379t high of the pre-crisis era While demand is unlikely to return to the 2008-9 levels certainly in the absence of any systemic risk event it is likely to remain at historically elevated levels This closely gels with the change in European bar and coin demand reinforcing our view that investment in Western markets has established a support level well above historical norms
7 For more detail see World Gold Council Investment commentary looking into H2 2015 July 2015
11Gold Demand Trends | Second quarter 2015
Chinese bar and coin demand broadly stable ndash up 6 but from a low basePurchases of gold bars and coins in China were sidelined for much of the second quarter in favour of investing in the stock market The 6 year-on-year increase in investment demand was largely reflective of the low base of demand in Q2 2014 although price expectations also played their part ndash the lack of direction in gold prices meant investors were uncertain as to the likely future trend
Demand for gold bars and coins picked up towards the end of the quarter in response to the sharp drop in Chinese equities in the latter half of June This was also mirrored by a rise in demand for gold accounts
Investment demand in India down to a 6-year lowDespite reasonable levels of interest around Akshaya Tritiya in April investment demand for gold in India contracted for a third successive quarter declining by 30 to a fresh six-year low of 365t Uncertain price expectations were a factor as was the stock market which has continued to capture the attention of investors with its continued strong performance The weak rural economy played a further role Those rural investors most affected by the Q1 rains were more inclined to sell gold to supplement declining incomes than make fresh purchases
The lack of demand was such that unusually India exported a small amount of bullion during the quarter The local market price discount (discussed in Key themes) provided a profit-making opportunity ndash and around 10-15t of bullion was exported to capitalise on that (Chart 4)
Chart 4 Lacklustre demand in Q2 has led to a discount in local Indian prices (22-day moving average)
US$oz
12Gold Demand Trends | Second quarter 2015
East-Asian investment weakness broadly reflects price expectationsThe smaller East Asian markets cumulatively accounted for a 61t drop in demand for gold bars and coins Uncertainty over the future direction of gold prices was a general theme across the region The 12 decline in Vietnamese investment was also a function of very high premiums on gold tael bars which hovered around US$100-150oz over the international gold price In comparison gold chi rings with premiums of around US$40-50oz were a more attractive investment tool In Japan activity picked up in terms of both buying and selling but the net impact was broadly neutral with just 02t of disinvestment
Turkish investors held off waiting for the opportunity to buy at lower prices High local gold prices in Turkey ndash a consequence of the sharp depreciation in the lira ndash were off-putting to investors who preferred to wait for the opportunity to buy gold bars and coins at slightly lower prices rather than invest at prices not far from record levels Some investment buying has re-emerged since the end of the quarter in response to the fall in the gold price This has been reflected in a modest rise in the local premium to around US$3oz in recent weeks
13Gold Demand Trends | Second quarter 2015
ampHQWUDOEDQNVDQGRWKHUinstitutionsCentral banks and other institutions still steadfastly committed to gold
Since 2011 central banks and other institutions have been unwavering in their accumulation for gold Demand amounted to 1374t in Q2 15 above the 5-year average
while demand for the first half of 2015 totalled 261t Gold remains sought-after by those looking to diversify their reserves away from troublesome currencies (Chart 5)
CIS countries still the most active buyers Russia continued to lead the way ndash feeding its voracious appetite with net purchases of 368t during the quarter This brought gold reserves to a total of 1275t and maintained a 13 share of total reserves
Russia s a s a
Tonnes
Chart 5 Mid-year report card reported activity in the first half of 2015
14Gold Demand Trends | Second quarter 2015
Aside from Russia significant fresh demand came from Kazakhstan whose central bank purchased a further 73t between April ndash June The country has now increased its gold reserves for 33 consecutive months
Iran repatriates 13t of historically-purchased goldThe Central Bank of Iran declared that it had taken delivery of 13t of gold from South Africa having stored it there for the past two years The announcement was concrete evidence that Iran has bought gold to bolster its reserves in recent years albeit that the seller remains unidentified As part of talks towards a nuclear agreement Iran was permitted to move the gold from South Africa to its own domestic vault Little is published about the level of Iranian gold reserves but it is clear that Iran sees gold as a prominent part of its total reserves
China reports a jump in gold holdingsWithout doubt the most significant announcement came shortly after the end of the quarter The PBoC revealed that it had increased its gold reserves by 57 since its last announcement in 2009 bringing its total to 1658t
Following the 604t increase gold reserves still only represent 2 of total reserves and we believe have ample room to grow
Reaction to the announcement was cool among investors in the West who voiced disappointment that the figure was not in line with their higher and in some cases unrealistic expectations Despite this the increase in gold reserves was overwhelmingly supportive for the gold market reaffirming that China remains committed to gold as a reserve asset8
And the case for an increased allocation to gold in Chinarsquos reserves is reinforced in the context of Chinarsquos macro-economic fundamentals China accounts for about 13 of global GDP and 32 of global foreign reserves The purchase of 604t brings Chinarsquos share of global gold reserves to about 5
8 World Gold Council Market commentary 23 July 2015
15Gold Demand Trends | Second quarter 2015
TechnologySubstitution and thrifting remain the key challenges for gold demand within the technology sector
Goldrsquos use in technological applications saw a marginal decline in the second quarter down less than 1 to 855t The recurring theme of substitution away from gold is still prominent despite its superior qualities gold remains relatively expensive to cost-conscious manufacturers
Gold in electronics under pressure down 1 in second quarterGoldrsquos use in electronics remains subdued as rising unit sales are offset by declining gold volumes due to substitution and thrifting Demand of 682t in the second quarter was down 1 year-on-year Owing to the growing trend of consumers changing electronic devices (such as smartphones) more regularly manufacturers are beginning to place less emphasis on materials which provide greater longevity This will exacerbate the substitutionthrifting that has been seen in electronics as manufacturers move from gold to less costly materials although the effect of such thrifting should be mitigated by increased sales of consumer electronics Global semiconductor sales reached near-record levels in the second quarter up 2 year-on-year to US$84bn Sales for the first half year were 4 up on the same period in 2014 as demand for smartphones etc continues to grow albeit at a slowing rate
Gold bonding wire witnessed further losses in Q2 2015 Demand fell 10-15 in South Korea Taiwan and China all key manufacturing hubs in the electronics sector Within the first six months of 2015 copper bonding wire penetration in non-memory packages has risen from 70 to 75 with most of this taking share away from gold And while gold bonding wire is still used in memory packages key manufacturers are working on gold reduction projects
For plating the second quarter saw tentative signs that the trend in substitutionthrifting away from gold may be reversing There were indications that some manufacturers might be moving away from palladium-nickel (PdNi) alloys back to gold This was mostly seen in higher-end goods where concerns over performance and reliability are highest
Other industrial and decorative applications relatively flat rising less than 1Demand for gold in other industrial and decorative applications remained relatively flat year-on-year A reduction in demand from Chinese (slowing economic growth) and Russian (sanctions and rouble weakness) consumers did little to derail growth in costume jewellery and gold-plated accessories Further pressure on manufacturers to thrift has lifted owing to a lower current gold price
Dental demand continues to erode down 4 year-on-yearGold used in dental applications fell 4 to 47t in Q2 2015 its lowest quarterly level in our records The long-term trend of ceramics replacing gold continues unabated as consumers still place a greater emphasis on cosmetic as well as financial considerations
16Gold Demand Trends | Second quarter 2015
SupplyTotal supply contracted by 5 year-on-year to 10326t in Q2 ndash despite another quarter of modest growth in mine production ndash as recycling activity diminished again
Year-to-date mine production hedging and recycling have generated a combined 21071t of supply 3 less than in the same period of 2014 Lower levels of recycling account for a good portion of this decline
Mine production edged higher pipeline activity shrinksMine production increased by 3 to 7866t in the second quarter Growth was again scattered across the globe as mines in a number of countries were able to generate minor increases in output
Indonesia made the largest contribution to the growth in mine production Mining entered a high-grade area at Newmontrsquos Batu Hijau mine accounting for around 5t of additional output relative to Q2 2014 Grasberg also generated a modest increase (+25t)
Increased output at Goldstrikersquos Twin Creeks surface mine in Nevada helped towards year-on-year growth for the US as a whole although this was largely due to comparisons with a poor 2014
In Africa continued ramping up of the Kibali mine and the start of Otjikoto were positive for the Democratic Republic of Congo (DRC) and Namibia respectively Production in Ghana on the other hand was lower year-on-year due to a decline in output at Newmontrsquos Ahafo mine
0
200
400
600
800
US$oz
Chart 6 Gold explorationdevelopment activity continues to decline
Index level
17Gold Demand Trends | Second quarter 2015
There are differing forces at play in the mining industry which have implications for future production levels Mining companies have certainly made great strides in reducing their costs over the last year or two And recent strength in the dollar has been a tangible benefit in reducing the burden of dollar-denominated costs in particular lower oil prices are of enormous help given that they typically account for around 10 of mining costs
However there is only so much more scope for producers to implement cost-cutting measures and many remain at the mercy of foreign exchange fluctuations Coupled with the sharp drop in the gold price in July producer margins have deteriorated further and we continue to expect that mine production will taper off levelling out over the next year
This view is supported by a three-year decline in levels of exploration and development activity in the gold mining industry The Pipeline Activity Index constructed by SNL Metals amp Mining shows that activity in the gold supply pipeline peaked in Q1 2012 and has been in decline ever since falling to a new low below 60 for the first time in Q2 this year (Chart 6)
Recycling ebbs to 8-year lowRecycling activity subsided following the burst of activity seen in Q1 which had flushed out much of the readily available supplies The result was an 8 drop in this element of supply from 2725t to 2511t For the January ndash June period recycling declined 6 to just 602t ndash the lowest first half since 2007
Supply from Western markets continued to dwindle ndash a trend that shows no sign of stopping albeit that supply from these markets has halved in the last two years and the pace of decline is likely to slow
Recycling in Turkey was seen to lsquonormalisersquo after the sharp spike in the first quarter Despite the surge in local prices they fell just short of the level many consumers were targeting as a sell signal and hence recycling was relatively well contained The fall in the price since the end of the quarter has further dampened the propensity for Turkish consumers to sell their existing holdings
Amid a broad contraction in recycling India was an outlier The fragile state of Indian gold demand was reflected in a 7 rise in recycling activity as the rural population looked to supplement their shrinking incomes ndash one of the key reasons for investing in gold among this contingent
Hedging continues to impact supply only at the marginYear-on-year comparisons of producer hedging show a marked swing The relatively sizable hedge position initiated by Polyus Gold in Q2 2014 contrasts with 5t of net de-hedging in the most recent quarter Year-to-date the comparison is starker still ndash 638t of net hedging in H1 2014 vs 117t of net de-hedging in the first half of 2015
The trivial de-hedging of Q2 was due to continued deliveries into existing positions although we expect that minor hedging activity (mostly for the purposes of aiding cashflow in debt repayment) may outweigh such deliveries for the year as a whole
Hedging continues to have only a marginal bearing on the total supply of gold Since Q1 2010 the net total impact of hedging on overall gold supply is -753t This compares with total cumulative gold supply over the same period of over 24000t Given that shareholders continue to express a preference for mining companies not to engage in hedging supply from this category is unlikely to increase in the coming quarters
1 For an explanation of jewellery fabrication please see the Notes and definitions 2 For a listing of the Exchange Traded Funds and similar products please see the Notes and definitions 3 Excluding any delta hedging of central bank options 4 For an explanation of SurplusDeficit please see the Notes and definitions
Source Metals Focus GFMS Thomson Reuters ICE Benchmark Administration World Gold Council
20Gold Demand Trends | Second quarter 2015
Table 5 Jewellery demand in selected countries (tonnes)
2014 Q214 Q314 Q414 Q115 Q215
Q2rsquo15 vs
Q2rsquo14 change
India 6042 1526 1833 1447 1508 1180 ETH -23
Pakistan 230 73 55 60 51 60 ETH -17
Greater China 8755 1998 1943 2251 2366 1865 ETH -7
China 8072 1846 1812 2054 2212 1744 ETH -5
Hong Kong 600 129 112 176 136 105 ETH -18
Taiwan 82 23 19 20 18 16 ETH -33
Japan 164 38 42 48 33 39 Iuml 5
Indonesia 370 96 82 72 126 95 ETH -1
Malaysia 102 19 28 28 28 18 ETH -5
Singapore 145 40 36 32 35 28 ETH -31
South Korea 107 26 26 25 31 24 ETH -5
Thailand 118 29 27 31 33 27 ETH -5
Vietnam 125 31 27 30 44 37 Iuml 22
Middle East 2408 658 513 536 620 525 ETH -20
Saudi Arabia 684 189 150 180 173 170 ETH -10
UAE 560 170 104 106 165 133 ETH -22
Kuwait 142 37 26 39 36 29 ETH -19
Egypt 451 114 111 95 90 80 ETH -30
Iran 393 104 91 85 87 71 ETH -31
Other Middle East 178 44 31 31 70 41 ETH -9
Turkey 681 166 169 202 104 116 ETH -30
Russia 670 169 166 139 94 92 ETH -45
Americas 1685 386 377 601 326 391 Iuml 1
United States 1166 250 256 444 220 255 Iuml 2
Canada 140 33 26 54 27 35 Iuml 5
Mexico 158 39 42 39 40 42 Iuml 7
Brazil 222 64 52 63 39 59 ETH -8
Europe ex CIS 761 145 128 361 126 146 Iuml 1
France 142 27 21 66 27 25 ETH -8
Germany 100 20 12 50 17 21 Iuml 7
Italy 187 38 29 94 25 36 ETH -5
Spain 76 20 17 23 18 21 Iuml 6
United Kingdom 257 40 49 129 40 43 Iuml 6
Switzerland - - - - - - - -
Austria - - - - - - - -
Other Europe - - - - - - - -
Total above 22362 5398 5453 5865 5525 4644 ETH -14
Other and stock change 2267 548 485 701 509 491 ETH -10
World total 24629 5945 5937 6566 6034 5135 ETH -14
Source Metals Focus World Gold Council
21Gold Demand Trends | Second quarter 2015
Table 6 Total bar and coin demand in selected countries (tonnes)
2014 Q214 Q314 Q414 Q115 Q215
Q2rsquo15 vs
Q2rsquo14 change
India 2069 523 540 569 409 365 ETH -30
Pakistan 147 50 32 36 32 35 ETH -30
Greater China 1761 425 329 407 618 436 Iuml 3
China 1664 395 308 383 597 421 Iuml 6
Hong Kong 14 03 03 03 04 03 Iuml 3
Taiwan 83 27 18 21 17 13 ETH -52
Japan -27 -11 -10 -82 -32 -02 - -
Indonesia 285 67 75 87 57 45 ETH -33
Malaysia 88 22 22 20 25 15 ETH -32
Singapore 75 21 20 18 18 13 ETH -36
South Korea 61 16 15 14 16 13 ETH -20
Thailand 964 180 256 283 195 164 ETH -8
Vietnam 542 123 132 128 144 108 ETH -12
Middle East 719 175 127 112 190 110 ETH -37
Saudi Arabia 156 37 32 38 51 31 ETH -16
UAE 99 27 21 20 33 20 ETH -25
Kuwait 10 03 02 02 02 02 ETH -20
Egypt 60 16 14 13 10 09 ETH -44
Iran 361 85 50 30 83 41 ETH -52
Other Middle East 32 08 07 08 10 07 ETH -14
Turkey 486 155 55 151 52 45 ETH -71
Russia 79 22 21 15 13 13 ETH -43
Americas 550 130 121 164 133 135 Iuml 4
United States 477 116 106 142 118 124 Iuml 7
Canada 37 08 07 12 07 05 ETH -44
Mexico 22 04 05 07 05 04 Iuml 2
Brazil 13 03 03 03 04 04 Iuml 34
Europe ex CIS 1990 392 453 622 593 465 Iuml 19
France 10 02 02 06 13 -06 - -
Germany 1016 195 239 314 308 241 Iuml 24
Italy - - - - - - - -
Spain - - - - - - - -
United Kingdom 76 16 15 20 20 19 Iuml 18
Switzerland 477 98 104 150 138 110 Iuml 13
Austria 110 19 23 38 32 25 Iuml 28
Other Europe 301 62 70 94 83 77 Iuml 23
Total above 9787 2290 2185 2544 2463 1961 ETH -14
Other and stock change 256 89 45 76 58 53 ETH -40
World total 10044 2378 2230 2620 2521 2014 ETH -15
Source Metals Focus World Gold Council
22Gold Demand Trends | Second quarter 2015
Table 7 Consumer demand in selected countries (tonnes)
2014 Q214 Q314 Q414 Q115 Q215
Q2rsquo15 vs
Q2rsquo14 change
India 8111 2049 2373 2017 1917 1545 ETH -25
Pakistan 378 123 87 96 83 95 ETH -23
Greater China 10516 2423 2272 2658 2984 2302 ETH -5
China 9736 2241 2120 2437 2808 2165 ETH -3
Hong Kong 614 132 115 179 140 108 ETH -18
Taiwan 165 50 37 42 36 29 ETH -43
Japan 137 26 32 -34 01 37 Iuml 40
Indonesia 655 163 157 159 183 140 ETH -14
Malaysia 190 41 50 48 53 33 ETH -20
Singapore 220 61 55 51 52 41 ETH -33
South Korea 168 42 41 39 46 37 ETH -11
Thailand 1081 208 283 314 228 191 ETH -8
Vietnam 667 153 159 158 189 145 ETH -5
Middle East 3126 833 640 648 810 635 ETH -24
Saudi Arabia 840 226 182 218 224 201 ETH -11
UAE 660 197 124 126 198 153 ETH -22
Kuwait 152 39 28 41 38 32 ETH -19
Egypt 511 130 125 109 100 89 ETH -32
Iran 754 189 141 115 170 112 ETH -40
Other Middle East 210 52 39 39 80 47 ETH -10
Turkey 1167 321 223 353 156 161 ETH -50
Russia 749 190 187 153 107 105 ETH -45
Americas 2235 516 497 765 459 526 Iuml 2
United States 1643 366 363 586 338 379 Iuml 3
Canada 177 41 33 67 34 39 ETH -4
Mexico 180 43 46 46 45 45 Iuml 7
Brazil 235 67 55 67 42 63 ETH -6
Europe ex CIS 2751 537 581 984 719 611 Iuml 14
France 151 28 22 72 39 19 ETH -35
Germany 1116 215 251 365 325 262 Iuml 22
Italy 187 38 29 94 25 36 ETH -5
Spain 76 20 17 23 18 21 Iuml 6
United Kingdom 333 56 64 149 59 61 Iuml 9
Switzerland 477 98 104 150 138 110 Iuml 13
Austria 110 19 23 38 32 25 Iuml 28
Other Europe 301 62 70 94 83 77 Iuml 23
Total above 32149 7687 7638 8409 7988 6605 ETH -14
Other and stock change 2524 636 530 777 567 544 ETH -15
World total 34673 8324 8168 9186 8554 7149 ETH -14
Source Metals Focus World Gold Council
23Gold Demand Trends | Second quarter 2015
Table 8 Quarterly average price
2014 Q214 Q314 Q414 Q115 Q215
Q2rsquo15 vs
Q2rsquo14 change
US$oz 12664 12884 12819 12014 12185 11924 ETH -7
oz 9528 9397 9670 9603 10831 10780 Iuml15
poundoz 7681 7654 7676 7582 8049 7777 Iuml 2
CHFkg 372059 368315 376683 371895 372925 360827 ETH -2
yeng 42975 42289 42824 44074 46668 46564 Iuml10
Rs10g 248351 247779 249708 238990 243779 243328 ETH -2
RMBg 2508 2581 2541 2373 2443 2378 ETH -8
TLg 890 875 891 872 965 1023 Iuml17
Source ICE Benchmark Administration Thomson Reuters Datastream World Gold Council
Table 9 Indian supply estimates
2014 Q214 Q314 Q414 Q115 Q215
Q2rsquo15 vs
Q2rsquo14 change
Supply
Net bullion imports 8915 2062 2252 2822 2270 2050 ETH -1
Scrap 925 225 175 225 180 240 Iuml 7
Domestic supply from other sources1 112 27 25 25 25 25 ETH -7
Total supply2 9952 2314 2452 3072 2475 2315 Icirc 0
1 Domestic supply from local mine production recovery from imported copper concentrates and disinvestment 2 This supply can be consumed across the three sectors ndash jewellery investment and technology Consequently the total supply figure in the table will
not add to jewellery plus investment demand for India
Source Metals Focus World Gold Council
24Gold Demand Trends | Second quarter 2015
Tonnes of reserves
21 Austria 2800 44
22 Belgium 2274 34
23 Kazakhstan 2057 27
24 Philippines 1954 9
25 Algeria 1736 4
26 Thailand 1524 4
27 Singapore 1274 2
28 Sweden 1257 8
29 South Africa 1252 10
30 Mexico 1222 2
31 Libya 1166 5
32 Greece 1126 74
33 BIS 1080 -
34 Korea 1044 1
35 Romania 1037 10
36 Poland 1029 4
37 Iraq 898 5
38 Australia 799 6
39 Kuwait 790 8
40 Indonesia 781 3
Tonnes of reserves
1 United States 81335 74
2 Germany 33810 68
3 IMF 28140 -
4 Italy 24518 66
5 France 24354 65
6 China 16581 2
7 Russia 12750 13
8 Switzerland 10400 7
9 Japan 7652 2
10 Netherlands 6125 57
11 India 5577 6
12 ECB 5048 26
13 Turkey 5047 16
14 Taiwan 4236 4
15 Portugal 3825 75
16 Venezuela 3610 68
17 Saudi Arabia 3229 2
18 United Kingdom 3103 10
19 Lebanon 2868 21
20 Spain 2816 19
Table 10 Top 40 reported official gold holdings (as at June 2015)
For information on the methodology behind this data as well as footnotes for specific countries please see our table of Latest World Official Gold Reserves at httpwwwgoldorggovernment_affairsgold_reserves
Source IMF IFS World Gold Council
25Gold Demand Trends | Second quarter 2015
Table 11 Historical data for gold demand
Tonnes
JewelleryTotal bar and coin
investmentETFs and similar Technology Central banks Total
2005 27210 4181 2111 4404 -6634 31272
2006 23014 4298 2585 4717 -3654 30960
2007 24249 4375 2588 4777 -4838 31151
2008 23062 9179 3240 4647 -2354 37773
2009 18163 8323 6442 4144 -336 36737
2010 20513 12005 4211 4599 792 42119
2011 20904 14899 2364 4270 4808 47245
2012 21363 12938 3063 3791 5693 46848
2013 26732 17020 -9163 3543 6255 44386
2014 24629 10044 -1842 3465 5905 42201
Q3rsquo13 6284 3209 -1187 874 1389 10568
Q4rsquo13 6160 3465 -1855 844 1500 10115
Q1rsquo14 6181 2815 -136 822 1198 10879
Q2rsquo14 5945 2378 -379 863 1572 10380
Q3rsquo14 5937 2230 -405 877 1795 10435
Q4rsquo14 6566 2620 -921 904 1339 10508
Q1rsquo15 6034 2521 234 816 1236 10840
Q2rsquo15 5135 2014 -229 855 1374 9149
For a listing of the Exchange Traded Funds and similar products please see the Notes and definitions
Source Metals Focus GFMS Thomson Reuters ICE Benchmark Administration World Gold Council
26Gold Demand Trends | Second quarter 2015
1RWHVDQGGHƮQLWLRQV
All statistics (except where specified) are in weights of fine gold
Notes
Revisions to dataAll data is subject to revision in the light of new information
Historical data seriesDemand and supply data from Q1 2014 are provided by Metals Focus Data between Q1 2010 and Q4 2013 is a synthesis of Metals Focus and GFMS Thomson Reuters data which was created using relatively simple statistical techniques For more information on this process please see Creating a consistent data series by Dr James Abdey (wwwgoldorgsupply-and-demandgold-demand-trends )
HƮQLWLRQV
Central banks and other institutionsNet purchases (ie gross purchases less gross sales) by central banks and other official sector institutions including supra national entities such as the IMF Swaps and the effects of delta hedging are excluded
Consumer demandThe sum of jewellery consumption and total bar and coin investment occurring within a country ie the amount (in fine weight) of gold purchased directly by individuals
ElectronicsThis measures fabrication of gold into components used in the production of electronics including ndash but not limited to ndash semiconductors and bonding wire
DentistryThe first transformation of raw gold into intermediate or final products destined for dental applications such as dental alloys
ETFs and similar productsExchange Traded Funds and similar products including but not limited to SPDR Gold Shares iShares Gold Trust ZKB Gold ETF ETFS Physical GoldJersey Gold Bullion Securities Ltd Central Fund of Canada Ltd Xetra-Gold Julius Baer Precious Metals Fund ndash JB Physical Gold Fund Source Physical Gold P-ETC Sprott Physical Gold Trust Over time new products may be included when appropriate Gold holdings are as reported by the ETFETC issuers and where data is unavailable holdings have been calculated using reported AUM numbers
FabricationFabrication is the first transformation of gold bullion into a semi-finished or finished product
Gold demandThe total of jewellery fabrication technology total bar and coin demand and demand for ETFs and similar products
Jewellery End-user demand for all newly-made carat jewellery and gold watches whether plain gold or combined with other materials Excluded are second-hand jewellery other metals plated with gold coins and bars used as jewellery and purchases funded by the trading-in of existing carat gold jewellery
Jewellery fabricationFigures for jewellery fabrication ndash the first transformation of gold bullion into semi-finished or finished jewellery ndash are included in Table 4 Differs from jewellery consumption as it excludes the impact of importsexports and stockingde-stocking by manufacturers and distributors
LBMA Gold price PMUnless otherwise specified gold price values from 20 March 2015 are based on the LBMA Gold price PM administered by ICE Benchmark Administration (IBA) with prior values being based on the London PM Fix
London PM FixUnless otherwise specified gold price values prior to 20 March 2015 are based on the London PM Fix with subsequent values being based on the LBMA Gold price PM administered by ICE Benchmark Administration (IBA)
Medalsimitation coinFabrication of gold coins without a face value produced by both private and national mints India dominates this category with on average around 90 of the total lsquoMedallionrsquo is the name given to unofficial coins in India Medals of at least 99 purity wires and lumps sold in small quantities are also included
Mine productionThe volume (in fine weight) of gold mined globally This includes an estimate for gold produced as a result of artisanal and small scale mining (ASM) which is largely informal
27Gold Demand Trends | Second quarter 2015
Net producer hedgingThis measures the impact in the physical market of mining companiesrsquo gold forward sales loans and options positions Hedging accelerates the sale of gold a transaction which releases gold (from existing stocks) to the market Over time hedging activity does not generate a net increase in the supply of gold De-hedging ndash the process of closing out hedged positions ndash has the opposite impact and will reduce the amount of gold available to the market in any given quarter
Official coin demandInvestment by individuals in gold bullion coins It equates to the fabrication by national mints of coins which are or have been legal tender in the country of issue It is measured at the country of consumption rather than at the country of origin (for example the Perth Mint in Australia sells the majority of the coins it produces through its global distribution network) and is measured on a net basis In practice it includes the initial sale of many coins destined ultimately to be considered as numismatic rather than bullion
Other industrialGold used in the production of compounds such as Gold Potassium Cyanide for electro-plating in industrial applications as well as in the production of gold-plated jewellery and other decorative items such as gold thread India accounts for the bulk of demand in this category
Over-the-counterOver-the-counter (OTC) transactions (also referred to as lsquooff exchangersquo trading) take place directly between two parties unlike exchange trading which is conducted via an exchange
Physical bar demandInvestment by individuals in small (1kg and below) gold bars in a form widely accepted in the countries represented within Gold Demand Trends This also includes where identifiable gold bought and stored via online vendors It is measured as net purchases
Recycled goldGold sourced from fabricated products that have been sold or made ready for sale which is refined back into bullion This specifically refers to gold sold for cash It does not include gold traded-in for other gold products (for example by consumers at jewellery stores) or process scrap (working gold that never becomes part of a fabricated product but instead returns as scrap to a refiner) The vast majority ndash around 90 ndash of recycled gold is high-value gold (largely jewellery) and the remainder is gold recovered from industrial waste including laptops mobile phones circuit boards etc For more detail on recycling refer to The Ups and Downs of Gold Recycling Boston Consulting Group and World Gold Council March 2015 (wwwgoldorgsupply-and-demand )
SurplusdeficitThis is the difference between total supply and gold demand Partly a statistical residual this number also captures demand in the OTC market and changes to inventories on commodity exchanges with an additional contribution from changes to fabrication inventories
TechnologyThis captures all gold used in the fabrication of electronics dental medical decorative and other technological applications with electronics representing the largest component of this category It includes gold destined for plating jewellery
Tonne (Metric)1000 kg or 32151 troy oz of fine gold
Total bar and coin investmentThe total of physical bar demand official coin demand and demand for medalsimitation coin
Total supplyThe total of mine production net producer hedging and recycling
I101201508
Copyright and other rightscopy 2015 World Gold Council All rights reserved World Gold Council and the Circle device are trademarks of the World Gold Council or its affiliates
All references to LBMA Gold Price are used with the permission of ICE Benchmark Administration Limited and have been provided for informational purposes only ICE Benchmark Administration Limited accepts no liability or responsibility for the accuracy of the prices or the underlying product to which the prices may be referenced
Other third party data and content is the intellectual property of the respective third party and all rights are reserved to them
Any copying republication or redistribution of content to reproduce distribute or otherwise use the statistics and information in this report including by framing or similar means is expressly prohibited without the prior written consent of the World Gold Council or the appropriate copyright owners except as provided below
The use of the statistics in this report is permitted for the purposes of review and commentary (including media commentary) in line with fair industry practice subject to the following two pre-conditions (i) only limited extracts of data or analysis be used and (ii) any and all use of these statistics is accompanied by a clear acknowledgement of the World Gold Council and where appropriate of Thomson Reuters as their source Brief extracts from the analysis commentary and other World Gold Council material are permitted provided World Gold Council is cited as the source It is not permitted to reproduce distribute or otherwise use the whole or a substantial part of this report or the statistics contained within it
While every effort has been made to ensure the accuracy of the information in this document the World Gold Council does not warrant or guarantee the accuracy completeness or reliability of this information The World Gold Council does not accept responsibility for any losses or damages arising directly or indirectly from the use of this document
The material contained in this document is provided solely for general information and educational purposes and is not and should not be construed as an offer to buy or sell or as a solicitation of an offer to buy or sell gold any gold related products or any other products securities or investments Nothing in this document should be taken as making any recommendations or providing any investment or other advice with respect to the purchase sale
or other disposition of gold any gold related products or any other products securities or investments including without limitation any advice to the effect that any gold related transaction is appropriate for any investment objective or financial situation of a prospective investor A decision to invest in gold any gold related products or any other products securities or investments should not be made in reliance on any of the statements in this document Before making any investment decision prospective investors should seek advice from their financial advisers take into account their individual financial needs and circumstances and carefully consider the risks associated with such investment decision
Without limiting any of the foregoing in no event will the World Gold Council or any of its affiliates be liable for any decision made or action taken in reliance on the information in this document and in any event the World Gold Council and its affiliates shall not be liable for any consequential special punitive incidental indirect or similar damages arising from related to or connected with this document even if notified of the possibility of such damages
This document contains forward-looking statements The use of the words ldquobelievesrdquo ldquoexpectsrdquo ldquomayrdquo or ldquosuggestsrdquo or similar terminology identifies a statement as ldquoforward-lookingrdquo The forward-looking statements included in this document are based on current expectations that involve a number of risks and uncertainties These forward-looking statements are based on the analysis of World Gold Council of the statistics available to it Assumptions relating to the forward-looking statement involve judgments with respect to among other things future economic competitive and market conditions all of which are difficult or impossible to predict accurately In addition the demand for gold and the international gold markets are subject to substantial risks which increase the uncertainty inherent in the forward-looking statements In light of the significant uncertainties inherent in the forward-looking information included herein the inclusion of such information should not be regarded as a representation by the World Gold Council that the forward-looking statements will be achieved
The World Gold Council cautions you not to place undue reliance on its forward-looking statements Except in the normal course of our publication cycle we do not intend to update or revise any forward-looking statements whether as a result of new information future events or otherwise and we assume no responsibility for updating any forward-looking statements
World Gold Council10 Old Bailey London EC4M 7NG United Kingdom
E marketintelligencegoldorg T +44 20 7826 4700 F +44 20 7826 4799 W wwwgoldorg
3XEOLVKHG$XJXVW
17Gold Demand Trends | Second quarter 2015
There are differing forces at play in the mining industry which have implications for future production levels Mining companies have certainly made great strides in reducing their costs over the last year or two And recent strength in the dollar has been a tangible benefit in reducing the burden of dollar-denominated costs in particular lower oil prices are of enormous help given that they typically account for around 10 of mining costs
However there is only so much more scope for producers to implement cost-cutting measures and many remain at the mercy of foreign exchange fluctuations Coupled with the sharp drop in the gold price in July producer margins have deteriorated further and we continue to expect that mine production will taper off levelling out over the next year
This view is supported by a three-year decline in levels of exploration and development activity in the gold mining industry The Pipeline Activity Index constructed by SNL Metals amp Mining shows that activity in the gold supply pipeline peaked in Q1 2012 and has been in decline ever since falling to a new low below 60 for the first time in Q2 this year (Chart 6)
Recycling ebbs to 8-year lowRecycling activity subsided following the burst of activity seen in Q1 which had flushed out much of the readily available supplies The result was an 8 drop in this element of supply from 2725t to 2511t For the January ndash June period recycling declined 6 to just 602t ndash the lowest first half since 2007
Supply from Western markets continued to dwindle ndash a trend that shows no sign of stopping albeit that supply from these markets has halved in the last two years and the pace of decline is likely to slow
Recycling in Turkey was seen to lsquonormalisersquo after the sharp spike in the first quarter Despite the surge in local prices they fell just short of the level many consumers were targeting as a sell signal and hence recycling was relatively well contained The fall in the price since the end of the quarter has further dampened the propensity for Turkish consumers to sell their existing holdings
Amid a broad contraction in recycling India was an outlier The fragile state of Indian gold demand was reflected in a 7 rise in recycling activity as the rural population looked to supplement their shrinking incomes ndash one of the key reasons for investing in gold among this contingent
Hedging continues to impact supply only at the marginYear-on-year comparisons of producer hedging show a marked swing The relatively sizable hedge position initiated by Polyus Gold in Q2 2014 contrasts with 5t of net de-hedging in the most recent quarter Year-to-date the comparison is starker still ndash 638t of net hedging in H1 2014 vs 117t of net de-hedging in the first half of 2015
The trivial de-hedging of Q2 was due to continued deliveries into existing positions although we expect that minor hedging activity (mostly for the purposes of aiding cashflow in debt repayment) may outweigh such deliveries for the year as a whole
Hedging continues to have only a marginal bearing on the total supply of gold Since Q1 2010 the net total impact of hedging on overall gold supply is -753t This compares with total cumulative gold supply over the same period of over 24000t Given that shareholders continue to express a preference for mining companies not to engage in hedging supply from this category is unlikely to increase in the coming quarters
1 For an explanation of jewellery fabrication please see the Notes and definitions 2 For a listing of the Exchange Traded Funds and similar products please see the Notes and definitions 3 Excluding any delta hedging of central bank options 4 For an explanation of SurplusDeficit please see the Notes and definitions
Source Metals Focus GFMS Thomson Reuters ICE Benchmark Administration World Gold Council
20Gold Demand Trends | Second quarter 2015
Table 5 Jewellery demand in selected countries (tonnes)
2014 Q214 Q314 Q414 Q115 Q215
Q2rsquo15 vs
Q2rsquo14 change
India 6042 1526 1833 1447 1508 1180 ETH -23
Pakistan 230 73 55 60 51 60 ETH -17
Greater China 8755 1998 1943 2251 2366 1865 ETH -7
China 8072 1846 1812 2054 2212 1744 ETH -5
Hong Kong 600 129 112 176 136 105 ETH -18
Taiwan 82 23 19 20 18 16 ETH -33
Japan 164 38 42 48 33 39 Iuml 5
Indonesia 370 96 82 72 126 95 ETH -1
Malaysia 102 19 28 28 28 18 ETH -5
Singapore 145 40 36 32 35 28 ETH -31
South Korea 107 26 26 25 31 24 ETH -5
Thailand 118 29 27 31 33 27 ETH -5
Vietnam 125 31 27 30 44 37 Iuml 22
Middle East 2408 658 513 536 620 525 ETH -20
Saudi Arabia 684 189 150 180 173 170 ETH -10
UAE 560 170 104 106 165 133 ETH -22
Kuwait 142 37 26 39 36 29 ETH -19
Egypt 451 114 111 95 90 80 ETH -30
Iran 393 104 91 85 87 71 ETH -31
Other Middle East 178 44 31 31 70 41 ETH -9
Turkey 681 166 169 202 104 116 ETH -30
Russia 670 169 166 139 94 92 ETH -45
Americas 1685 386 377 601 326 391 Iuml 1
United States 1166 250 256 444 220 255 Iuml 2
Canada 140 33 26 54 27 35 Iuml 5
Mexico 158 39 42 39 40 42 Iuml 7
Brazil 222 64 52 63 39 59 ETH -8
Europe ex CIS 761 145 128 361 126 146 Iuml 1
France 142 27 21 66 27 25 ETH -8
Germany 100 20 12 50 17 21 Iuml 7
Italy 187 38 29 94 25 36 ETH -5
Spain 76 20 17 23 18 21 Iuml 6
United Kingdom 257 40 49 129 40 43 Iuml 6
Switzerland - - - - - - - -
Austria - - - - - - - -
Other Europe - - - - - - - -
Total above 22362 5398 5453 5865 5525 4644 ETH -14
Other and stock change 2267 548 485 701 509 491 ETH -10
World total 24629 5945 5937 6566 6034 5135 ETH -14
Source Metals Focus World Gold Council
21Gold Demand Trends | Second quarter 2015
Table 6 Total bar and coin demand in selected countries (tonnes)
2014 Q214 Q314 Q414 Q115 Q215
Q2rsquo15 vs
Q2rsquo14 change
India 2069 523 540 569 409 365 ETH -30
Pakistan 147 50 32 36 32 35 ETH -30
Greater China 1761 425 329 407 618 436 Iuml 3
China 1664 395 308 383 597 421 Iuml 6
Hong Kong 14 03 03 03 04 03 Iuml 3
Taiwan 83 27 18 21 17 13 ETH -52
Japan -27 -11 -10 -82 -32 -02 - -
Indonesia 285 67 75 87 57 45 ETH -33
Malaysia 88 22 22 20 25 15 ETH -32
Singapore 75 21 20 18 18 13 ETH -36
South Korea 61 16 15 14 16 13 ETH -20
Thailand 964 180 256 283 195 164 ETH -8
Vietnam 542 123 132 128 144 108 ETH -12
Middle East 719 175 127 112 190 110 ETH -37
Saudi Arabia 156 37 32 38 51 31 ETH -16
UAE 99 27 21 20 33 20 ETH -25
Kuwait 10 03 02 02 02 02 ETH -20
Egypt 60 16 14 13 10 09 ETH -44
Iran 361 85 50 30 83 41 ETH -52
Other Middle East 32 08 07 08 10 07 ETH -14
Turkey 486 155 55 151 52 45 ETH -71
Russia 79 22 21 15 13 13 ETH -43
Americas 550 130 121 164 133 135 Iuml 4
United States 477 116 106 142 118 124 Iuml 7
Canada 37 08 07 12 07 05 ETH -44
Mexico 22 04 05 07 05 04 Iuml 2
Brazil 13 03 03 03 04 04 Iuml 34
Europe ex CIS 1990 392 453 622 593 465 Iuml 19
France 10 02 02 06 13 -06 - -
Germany 1016 195 239 314 308 241 Iuml 24
Italy - - - - - - - -
Spain - - - - - - - -
United Kingdom 76 16 15 20 20 19 Iuml 18
Switzerland 477 98 104 150 138 110 Iuml 13
Austria 110 19 23 38 32 25 Iuml 28
Other Europe 301 62 70 94 83 77 Iuml 23
Total above 9787 2290 2185 2544 2463 1961 ETH -14
Other and stock change 256 89 45 76 58 53 ETH -40
World total 10044 2378 2230 2620 2521 2014 ETH -15
Source Metals Focus World Gold Council
22Gold Demand Trends | Second quarter 2015
Table 7 Consumer demand in selected countries (tonnes)
2014 Q214 Q314 Q414 Q115 Q215
Q2rsquo15 vs
Q2rsquo14 change
India 8111 2049 2373 2017 1917 1545 ETH -25
Pakistan 378 123 87 96 83 95 ETH -23
Greater China 10516 2423 2272 2658 2984 2302 ETH -5
China 9736 2241 2120 2437 2808 2165 ETH -3
Hong Kong 614 132 115 179 140 108 ETH -18
Taiwan 165 50 37 42 36 29 ETH -43
Japan 137 26 32 -34 01 37 Iuml 40
Indonesia 655 163 157 159 183 140 ETH -14
Malaysia 190 41 50 48 53 33 ETH -20
Singapore 220 61 55 51 52 41 ETH -33
South Korea 168 42 41 39 46 37 ETH -11
Thailand 1081 208 283 314 228 191 ETH -8
Vietnam 667 153 159 158 189 145 ETH -5
Middle East 3126 833 640 648 810 635 ETH -24
Saudi Arabia 840 226 182 218 224 201 ETH -11
UAE 660 197 124 126 198 153 ETH -22
Kuwait 152 39 28 41 38 32 ETH -19
Egypt 511 130 125 109 100 89 ETH -32
Iran 754 189 141 115 170 112 ETH -40
Other Middle East 210 52 39 39 80 47 ETH -10
Turkey 1167 321 223 353 156 161 ETH -50
Russia 749 190 187 153 107 105 ETH -45
Americas 2235 516 497 765 459 526 Iuml 2
United States 1643 366 363 586 338 379 Iuml 3
Canada 177 41 33 67 34 39 ETH -4
Mexico 180 43 46 46 45 45 Iuml 7
Brazil 235 67 55 67 42 63 ETH -6
Europe ex CIS 2751 537 581 984 719 611 Iuml 14
France 151 28 22 72 39 19 ETH -35
Germany 1116 215 251 365 325 262 Iuml 22
Italy 187 38 29 94 25 36 ETH -5
Spain 76 20 17 23 18 21 Iuml 6
United Kingdom 333 56 64 149 59 61 Iuml 9
Switzerland 477 98 104 150 138 110 Iuml 13
Austria 110 19 23 38 32 25 Iuml 28
Other Europe 301 62 70 94 83 77 Iuml 23
Total above 32149 7687 7638 8409 7988 6605 ETH -14
Other and stock change 2524 636 530 777 567 544 ETH -15
World total 34673 8324 8168 9186 8554 7149 ETH -14
Source Metals Focus World Gold Council
23Gold Demand Trends | Second quarter 2015
Table 8 Quarterly average price
2014 Q214 Q314 Q414 Q115 Q215
Q2rsquo15 vs
Q2rsquo14 change
US$oz 12664 12884 12819 12014 12185 11924 ETH -7
oz 9528 9397 9670 9603 10831 10780 Iuml15
poundoz 7681 7654 7676 7582 8049 7777 Iuml 2
CHFkg 372059 368315 376683 371895 372925 360827 ETH -2
yeng 42975 42289 42824 44074 46668 46564 Iuml10
Rs10g 248351 247779 249708 238990 243779 243328 ETH -2
RMBg 2508 2581 2541 2373 2443 2378 ETH -8
TLg 890 875 891 872 965 1023 Iuml17
Source ICE Benchmark Administration Thomson Reuters Datastream World Gold Council
Table 9 Indian supply estimates
2014 Q214 Q314 Q414 Q115 Q215
Q2rsquo15 vs
Q2rsquo14 change
Supply
Net bullion imports 8915 2062 2252 2822 2270 2050 ETH -1
Scrap 925 225 175 225 180 240 Iuml 7
Domestic supply from other sources1 112 27 25 25 25 25 ETH -7
Total supply2 9952 2314 2452 3072 2475 2315 Icirc 0
1 Domestic supply from local mine production recovery from imported copper concentrates and disinvestment 2 This supply can be consumed across the three sectors ndash jewellery investment and technology Consequently the total supply figure in the table will
not add to jewellery plus investment demand for India
Source Metals Focus World Gold Council
24Gold Demand Trends | Second quarter 2015
Tonnes of reserves
21 Austria 2800 44
22 Belgium 2274 34
23 Kazakhstan 2057 27
24 Philippines 1954 9
25 Algeria 1736 4
26 Thailand 1524 4
27 Singapore 1274 2
28 Sweden 1257 8
29 South Africa 1252 10
30 Mexico 1222 2
31 Libya 1166 5
32 Greece 1126 74
33 BIS 1080 -
34 Korea 1044 1
35 Romania 1037 10
36 Poland 1029 4
37 Iraq 898 5
38 Australia 799 6
39 Kuwait 790 8
40 Indonesia 781 3
Tonnes of reserves
1 United States 81335 74
2 Germany 33810 68
3 IMF 28140 -
4 Italy 24518 66
5 France 24354 65
6 China 16581 2
7 Russia 12750 13
8 Switzerland 10400 7
9 Japan 7652 2
10 Netherlands 6125 57
11 India 5577 6
12 ECB 5048 26
13 Turkey 5047 16
14 Taiwan 4236 4
15 Portugal 3825 75
16 Venezuela 3610 68
17 Saudi Arabia 3229 2
18 United Kingdom 3103 10
19 Lebanon 2868 21
20 Spain 2816 19
Table 10 Top 40 reported official gold holdings (as at June 2015)
For information on the methodology behind this data as well as footnotes for specific countries please see our table of Latest World Official Gold Reserves at httpwwwgoldorggovernment_affairsgold_reserves
Source IMF IFS World Gold Council
25Gold Demand Trends | Second quarter 2015
Table 11 Historical data for gold demand
Tonnes
JewelleryTotal bar and coin
investmentETFs and similar Technology Central banks Total
2005 27210 4181 2111 4404 -6634 31272
2006 23014 4298 2585 4717 -3654 30960
2007 24249 4375 2588 4777 -4838 31151
2008 23062 9179 3240 4647 -2354 37773
2009 18163 8323 6442 4144 -336 36737
2010 20513 12005 4211 4599 792 42119
2011 20904 14899 2364 4270 4808 47245
2012 21363 12938 3063 3791 5693 46848
2013 26732 17020 -9163 3543 6255 44386
2014 24629 10044 -1842 3465 5905 42201
Q3rsquo13 6284 3209 -1187 874 1389 10568
Q4rsquo13 6160 3465 -1855 844 1500 10115
Q1rsquo14 6181 2815 -136 822 1198 10879
Q2rsquo14 5945 2378 -379 863 1572 10380
Q3rsquo14 5937 2230 -405 877 1795 10435
Q4rsquo14 6566 2620 -921 904 1339 10508
Q1rsquo15 6034 2521 234 816 1236 10840
Q2rsquo15 5135 2014 -229 855 1374 9149
For a listing of the Exchange Traded Funds and similar products please see the Notes and definitions
Source Metals Focus GFMS Thomson Reuters ICE Benchmark Administration World Gold Council
26Gold Demand Trends | Second quarter 2015
1RWHVDQGGHƮQLWLRQV
All statistics (except where specified) are in weights of fine gold
Notes
Revisions to dataAll data is subject to revision in the light of new information
Historical data seriesDemand and supply data from Q1 2014 are provided by Metals Focus Data between Q1 2010 and Q4 2013 is a synthesis of Metals Focus and GFMS Thomson Reuters data which was created using relatively simple statistical techniques For more information on this process please see Creating a consistent data series by Dr James Abdey (wwwgoldorgsupply-and-demandgold-demand-trends )
HƮQLWLRQV
Central banks and other institutionsNet purchases (ie gross purchases less gross sales) by central banks and other official sector institutions including supra national entities such as the IMF Swaps and the effects of delta hedging are excluded
Consumer demandThe sum of jewellery consumption and total bar and coin investment occurring within a country ie the amount (in fine weight) of gold purchased directly by individuals
ElectronicsThis measures fabrication of gold into components used in the production of electronics including ndash but not limited to ndash semiconductors and bonding wire
DentistryThe first transformation of raw gold into intermediate or final products destined for dental applications such as dental alloys
ETFs and similar productsExchange Traded Funds and similar products including but not limited to SPDR Gold Shares iShares Gold Trust ZKB Gold ETF ETFS Physical GoldJersey Gold Bullion Securities Ltd Central Fund of Canada Ltd Xetra-Gold Julius Baer Precious Metals Fund ndash JB Physical Gold Fund Source Physical Gold P-ETC Sprott Physical Gold Trust Over time new products may be included when appropriate Gold holdings are as reported by the ETFETC issuers and where data is unavailable holdings have been calculated using reported AUM numbers
FabricationFabrication is the first transformation of gold bullion into a semi-finished or finished product
Gold demandThe total of jewellery fabrication technology total bar and coin demand and demand for ETFs and similar products
Jewellery End-user demand for all newly-made carat jewellery and gold watches whether plain gold or combined with other materials Excluded are second-hand jewellery other metals plated with gold coins and bars used as jewellery and purchases funded by the trading-in of existing carat gold jewellery
Jewellery fabricationFigures for jewellery fabrication ndash the first transformation of gold bullion into semi-finished or finished jewellery ndash are included in Table 4 Differs from jewellery consumption as it excludes the impact of importsexports and stockingde-stocking by manufacturers and distributors
LBMA Gold price PMUnless otherwise specified gold price values from 20 March 2015 are based on the LBMA Gold price PM administered by ICE Benchmark Administration (IBA) with prior values being based on the London PM Fix
London PM FixUnless otherwise specified gold price values prior to 20 March 2015 are based on the London PM Fix with subsequent values being based on the LBMA Gold price PM administered by ICE Benchmark Administration (IBA)
Medalsimitation coinFabrication of gold coins without a face value produced by both private and national mints India dominates this category with on average around 90 of the total lsquoMedallionrsquo is the name given to unofficial coins in India Medals of at least 99 purity wires and lumps sold in small quantities are also included
Mine productionThe volume (in fine weight) of gold mined globally This includes an estimate for gold produced as a result of artisanal and small scale mining (ASM) which is largely informal
27Gold Demand Trends | Second quarter 2015
Net producer hedgingThis measures the impact in the physical market of mining companiesrsquo gold forward sales loans and options positions Hedging accelerates the sale of gold a transaction which releases gold (from existing stocks) to the market Over time hedging activity does not generate a net increase in the supply of gold De-hedging ndash the process of closing out hedged positions ndash has the opposite impact and will reduce the amount of gold available to the market in any given quarter
Official coin demandInvestment by individuals in gold bullion coins It equates to the fabrication by national mints of coins which are or have been legal tender in the country of issue It is measured at the country of consumption rather than at the country of origin (for example the Perth Mint in Australia sells the majority of the coins it produces through its global distribution network) and is measured on a net basis In practice it includes the initial sale of many coins destined ultimately to be considered as numismatic rather than bullion
Other industrialGold used in the production of compounds such as Gold Potassium Cyanide for electro-plating in industrial applications as well as in the production of gold-plated jewellery and other decorative items such as gold thread India accounts for the bulk of demand in this category
Over-the-counterOver-the-counter (OTC) transactions (also referred to as lsquooff exchangersquo trading) take place directly between two parties unlike exchange trading which is conducted via an exchange
Physical bar demandInvestment by individuals in small (1kg and below) gold bars in a form widely accepted in the countries represented within Gold Demand Trends This also includes where identifiable gold bought and stored via online vendors It is measured as net purchases
Recycled goldGold sourced from fabricated products that have been sold or made ready for sale which is refined back into bullion This specifically refers to gold sold for cash It does not include gold traded-in for other gold products (for example by consumers at jewellery stores) or process scrap (working gold that never becomes part of a fabricated product but instead returns as scrap to a refiner) The vast majority ndash around 90 ndash of recycled gold is high-value gold (largely jewellery) and the remainder is gold recovered from industrial waste including laptops mobile phones circuit boards etc For more detail on recycling refer to The Ups and Downs of Gold Recycling Boston Consulting Group and World Gold Council March 2015 (wwwgoldorgsupply-and-demand )
SurplusdeficitThis is the difference between total supply and gold demand Partly a statistical residual this number also captures demand in the OTC market and changes to inventories on commodity exchanges with an additional contribution from changes to fabrication inventories
TechnologyThis captures all gold used in the fabrication of electronics dental medical decorative and other technological applications with electronics representing the largest component of this category It includes gold destined for plating jewellery
Tonne (Metric)1000 kg or 32151 troy oz of fine gold
Total bar and coin investmentThe total of physical bar demand official coin demand and demand for medalsimitation coin
Total supplyThe total of mine production net producer hedging and recycling
I101201508
Copyright and other rightscopy 2015 World Gold Council All rights reserved World Gold Council and the Circle device are trademarks of the World Gold Council or its affiliates
All references to LBMA Gold Price are used with the permission of ICE Benchmark Administration Limited and have been provided for informational purposes only ICE Benchmark Administration Limited accepts no liability or responsibility for the accuracy of the prices or the underlying product to which the prices may be referenced
Other third party data and content is the intellectual property of the respective third party and all rights are reserved to them
Any copying republication or redistribution of content to reproduce distribute or otherwise use the statistics and information in this report including by framing or similar means is expressly prohibited without the prior written consent of the World Gold Council or the appropriate copyright owners except as provided below
The use of the statistics in this report is permitted for the purposes of review and commentary (including media commentary) in line with fair industry practice subject to the following two pre-conditions (i) only limited extracts of data or analysis be used and (ii) any and all use of these statistics is accompanied by a clear acknowledgement of the World Gold Council and where appropriate of Thomson Reuters as their source Brief extracts from the analysis commentary and other World Gold Council material are permitted provided World Gold Council is cited as the source It is not permitted to reproduce distribute or otherwise use the whole or a substantial part of this report or the statistics contained within it
While every effort has been made to ensure the accuracy of the information in this document the World Gold Council does not warrant or guarantee the accuracy completeness or reliability of this information The World Gold Council does not accept responsibility for any losses or damages arising directly or indirectly from the use of this document
The material contained in this document is provided solely for general information and educational purposes and is not and should not be construed as an offer to buy or sell or as a solicitation of an offer to buy or sell gold any gold related products or any other products securities or investments Nothing in this document should be taken as making any recommendations or providing any investment or other advice with respect to the purchase sale
or other disposition of gold any gold related products or any other products securities or investments including without limitation any advice to the effect that any gold related transaction is appropriate for any investment objective or financial situation of a prospective investor A decision to invest in gold any gold related products or any other products securities or investments should not be made in reliance on any of the statements in this document Before making any investment decision prospective investors should seek advice from their financial advisers take into account their individual financial needs and circumstances and carefully consider the risks associated with such investment decision
Without limiting any of the foregoing in no event will the World Gold Council or any of its affiliates be liable for any decision made or action taken in reliance on the information in this document and in any event the World Gold Council and its affiliates shall not be liable for any consequential special punitive incidental indirect or similar damages arising from related to or connected with this document even if notified of the possibility of such damages
This document contains forward-looking statements The use of the words ldquobelievesrdquo ldquoexpectsrdquo ldquomayrdquo or ldquosuggestsrdquo or similar terminology identifies a statement as ldquoforward-lookingrdquo The forward-looking statements included in this document are based on current expectations that involve a number of risks and uncertainties These forward-looking statements are based on the analysis of World Gold Council of the statistics available to it Assumptions relating to the forward-looking statement involve judgments with respect to among other things future economic competitive and market conditions all of which are difficult or impossible to predict accurately In addition the demand for gold and the international gold markets are subject to substantial risks which increase the uncertainty inherent in the forward-looking statements In light of the significant uncertainties inherent in the forward-looking information included herein the inclusion of such information should not be regarded as a representation by the World Gold Council that the forward-looking statements will be achieved
The World Gold Council cautions you not to place undue reliance on its forward-looking statements Except in the normal course of our publication cycle we do not intend to update or revise any forward-looking statements whether as a result of new information future events or otherwise and we assume no responsibility for updating any forward-looking statements
World Gold Council10 Old Bailey London EC4M 7NG United Kingdom
E marketintelligencegoldorg T +44 20 7826 4700 F +44 20 7826 4799 W wwwgoldorg
3XEOLVKHG$XJXVW
19Gold Demand Trends | Second quarter 2015
Table 4 Gold supply and demand World Gold Council presentation
1 For an explanation of jewellery fabrication please see the Notes and definitions 2 For a listing of the Exchange Traded Funds and similar products please see the Notes and definitions 3 Excluding any delta hedging of central bank options 4 For an explanation of SurplusDeficit please see the Notes and definitions
Source Metals Focus GFMS Thomson Reuters ICE Benchmark Administration World Gold Council
20Gold Demand Trends | Second quarter 2015
Table 5 Jewellery demand in selected countries (tonnes)
2014 Q214 Q314 Q414 Q115 Q215
Q2rsquo15 vs
Q2rsquo14 change
India 6042 1526 1833 1447 1508 1180 ETH -23
Pakistan 230 73 55 60 51 60 ETH -17
Greater China 8755 1998 1943 2251 2366 1865 ETH -7
China 8072 1846 1812 2054 2212 1744 ETH -5
Hong Kong 600 129 112 176 136 105 ETH -18
Taiwan 82 23 19 20 18 16 ETH -33
Japan 164 38 42 48 33 39 Iuml 5
Indonesia 370 96 82 72 126 95 ETH -1
Malaysia 102 19 28 28 28 18 ETH -5
Singapore 145 40 36 32 35 28 ETH -31
South Korea 107 26 26 25 31 24 ETH -5
Thailand 118 29 27 31 33 27 ETH -5
Vietnam 125 31 27 30 44 37 Iuml 22
Middle East 2408 658 513 536 620 525 ETH -20
Saudi Arabia 684 189 150 180 173 170 ETH -10
UAE 560 170 104 106 165 133 ETH -22
Kuwait 142 37 26 39 36 29 ETH -19
Egypt 451 114 111 95 90 80 ETH -30
Iran 393 104 91 85 87 71 ETH -31
Other Middle East 178 44 31 31 70 41 ETH -9
Turkey 681 166 169 202 104 116 ETH -30
Russia 670 169 166 139 94 92 ETH -45
Americas 1685 386 377 601 326 391 Iuml 1
United States 1166 250 256 444 220 255 Iuml 2
Canada 140 33 26 54 27 35 Iuml 5
Mexico 158 39 42 39 40 42 Iuml 7
Brazil 222 64 52 63 39 59 ETH -8
Europe ex CIS 761 145 128 361 126 146 Iuml 1
France 142 27 21 66 27 25 ETH -8
Germany 100 20 12 50 17 21 Iuml 7
Italy 187 38 29 94 25 36 ETH -5
Spain 76 20 17 23 18 21 Iuml 6
United Kingdom 257 40 49 129 40 43 Iuml 6
Switzerland - - - - - - - -
Austria - - - - - - - -
Other Europe - - - - - - - -
Total above 22362 5398 5453 5865 5525 4644 ETH -14
Other and stock change 2267 548 485 701 509 491 ETH -10
World total 24629 5945 5937 6566 6034 5135 ETH -14
Source Metals Focus World Gold Council
21Gold Demand Trends | Second quarter 2015
Table 6 Total bar and coin demand in selected countries (tonnes)
2014 Q214 Q314 Q414 Q115 Q215
Q2rsquo15 vs
Q2rsquo14 change
India 2069 523 540 569 409 365 ETH -30
Pakistan 147 50 32 36 32 35 ETH -30
Greater China 1761 425 329 407 618 436 Iuml 3
China 1664 395 308 383 597 421 Iuml 6
Hong Kong 14 03 03 03 04 03 Iuml 3
Taiwan 83 27 18 21 17 13 ETH -52
Japan -27 -11 -10 -82 -32 -02 - -
Indonesia 285 67 75 87 57 45 ETH -33
Malaysia 88 22 22 20 25 15 ETH -32
Singapore 75 21 20 18 18 13 ETH -36
South Korea 61 16 15 14 16 13 ETH -20
Thailand 964 180 256 283 195 164 ETH -8
Vietnam 542 123 132 128 144 108 ETH -12
Middle East 719 175 127 112 190 110 ETH -37
Saudi Arabia 156 37 32 38 51 31 ETH -16
UAE 99 27 21 20 33 20 ETH -25
Kuwait 10 03 02 02 02 02 ETH -20
Egypt 60 16 14 13 10 09 ETH -44
Iran 361 85 50 30 83 41 ETH -52
Other Middle East 32 08 07 08 10 07 ETH -14
Turkey 486 155 55 151 52 45 ETH -71
Russia 79 22 21 15 13 13 ETH -43
Americas 550 130 121 164 133 135 Iuml 4
United States 477 116 106 142 118 124 Iuml 7
Canada 37 08 07 12 07 05 ETH -44
Mexico 22 04 05 07 05 04 Iuml 2
Brazil 13 03 03 03 04 04 Iuml 34
Europe ex CIS 1990 392 453 622 593 465 Iuml 19
France 10 02 02 06 13 -06 - -
Germany 1016 195 239 314 308 241 Iuml 24
Italy - - - - - - - -
Spain - - - - - - - -
United Kingdom 76 16 15 20 20 19 Iuml 18
Switzerland 477 98 104 150 138 110 Iuml 13
Austria 110 19 23 38 32 25 Iuml 28
Other Europe 301 62 70 94 83 77 Iuml 23
Total above 9787 2290 2185 2544 2463 1961 ETH -14
Other and stock change 256 89 45 76 58 53 ETH -40
World total 10044 2378 2230 2620 2521 2014 ETH -15
Source Metals Focus World Gold Council
22Gold Demand Trends | Second quarter 2015
Table 7 Consumer demand in selected countries (tonnes)
2014 Q214 Q314 Q414 Q115 Q215
Q2rsquo15 vs
Q2rsquo14 change
India 8111 2049 2373 2017 1917 1545 ETH -25
Pakistan 378 123 87 96 83 95 ETH -23
Greater China 10516 2423 2272 2658 2984 2302 ETH -5
China 9736 2241 2120 2437 2808 2165 ETH -3
Hong Kong 614 132 115 179 140 108 ETH -18
Taiwan 165 50 37 42 36 29 ETH -43
Japan 137 26 32 -34 01 37 Iuml 40
Indonesia 655 163 157 159 183 140 ETH -14
Malaysia 190 41 50 48 53 33 ETH -20
Singapore 220 61 55 51 52 41 ETH -33
South Korea 168 42 41 39 46 37 ETH -11
Thailand 1081 208 283 314 228 191 ETH -8
Vietnam 667 153 159 158 189 145 ETH -5
Middle East 3126 833 640 648 810 635 ETH -24
Saudi Arabia 840 226 182 218 224 201 ETH -11
UAE 660 197 124 126 198 153 ETH -22
Kuwait 152 39 28 41 38 32 ETH -19
Egypt 511 130 125 109 100 89 ETH -32
Iran 754 189 141 115 170 112 ETH -40
Other Middle East 210 52 39 39 80 47 ETH -10
Turkey 1167 321 223 353 156 161 ETH -50
Russia 749 190 187 153 107 105 ETH -45
Americas 2235 516 497 765 459 526 Iuml 2
United States 1643 366 363 586 338 379 Iuml 3
Canada 177 41 33 67 34 39 ETH -4
Mexico 180 43 46 46 45 45 Iuml 7
Brazil 235 67 55 67 42 63 ETH -6
Europe ex CIS 2751 537 581 984 719 611 Iuml 14
France 151 28 22 72 39 19 ETH -35
Germany 1116 215 251 365 325 262 Iuml 22
Italy 187 38 29 94 25 36 ETH -5
Spain 76 20 17 23 18 21 Iuml 6
United Kingdom 333 56 64 149 59 61 Iuml 9
Switzerland 477 98 104 150 138 110 Iuml 13
Austria 110 19 23 38 32 25 Iuml 28
Other Europe 301 62 70 94 83 77 Iuml 23
Total above 32149 7687 7638 8409 7988 6605 ETH -14
Other and stock change 2524 636 530 777 567 544 ETH -15
World total 34673 8324 8168 9186 8554 7149 ETH -14
Source Metals Focus World Gold Council
23Gold Demand Trends | Second quarter 2015
Table 8 Quarterly average price
2014 Q214 Q314 Q414 Q115 Q215
Q2rsquo15 vs
Q2rsquo14 change
US$oz 12664 12884 12819 12014 12185 11924 ETH -7
oz 9528 9397 9670 9603 10831 10780 Iuml15
poundoz 7681 7654 7676 7582 8049 7777 Iuml 2
CHFkg 372059 368315 376683 371895 372925 360827 ETH -2
yeng 42975 42289 42824 44074 46668 46564 Iuml10
Rs10g 248351 247779 249708 238990 243779 243328 ETH -2
RMBg 2508 2581 2541 2373 2443 2378 ETH -8
TLg 890 875 891 872 965 1023 Iuml17
Source ICE Benchmark Administration Thomson Reuters Datastream World Gold Council
Table 9 Indian supply estimates
2014 Q214 Q314 Q414 Q115 Q215
Q2rsquo15 vs
Q2rsquo14 change
Supply
Net bullion imports 8915 2062 2252 2822 2270 2050 ETH -1
Scrap 925 225 175 225 180 240 Iuml 7
Domestic supply from other sources1 112 27 25 25 25 25 ETH -7
Total supply2 9952 2314 2452 3072 2475 2315 Icirc 0
1 Domestic supply from local mine production recovery from imported copper concentrates and disinvestment 2 This supply can be consumed across the three sectors ndash jewellery investment and technology Consequently the total supply figure in the table will
not add to jewellery plus investment demand for India
Source Metals Focus World Gold Council
24Gold Demand Trends | Second quarter 2015
Tonnes of reserves
21 Austria 2800 44
22 Belgium 2274 34
23 Kazakhstan 2057 27
24 Philippines 1954 9
25 Algeria 1736 4
26 Thailand 1524 4
27 Singapore 1274 2
28 Sweden 1257 8
29 South Africa 1252 10
30 Mexico 1222 2
31 Libya 1166 5
32 Greece 1126 74
33 BIS 1080 -
34 Korea 1044 1
35 Romania 1037 10
36 Poland 1029 4
37 Iraq 898 5
38 Australia 799 6
39 Kuwait 790 8
40 Indonesia 781 3
Tonnes of reserves
1 United States 81335 74
2 Germany 33810 68
3 IMF 28140 -
4 Italy 24518 66
5 France 24354 65
6 China 16581 2
7 Russia 12750 13
8 Switzerland 10400 7
9 Japan 7652 2
10 Netherlands 6125 57
11 India 5577 6
12 ECB 5048 26
13 Turkey 5047 16
14 Taiwan 4236 4
15 Portugal 3825 75
16 Venezuela 3610 68
17 Saudi Arabia 3229 2
18 United Kingdom 3103 10
19 Lebanon 2868 21
20 Spain 2816 19
Table 10 Top 40 reported official gold holdings (as at June 2015)
For information on the methodology behind this data as well as footnotes for specific countries please see our table of Latest World Official Gold Reserves at httpwwwgoldorggovernment_affairsgold_reserves
Source IMF IFS World Gold Council
25Gold Demand Trends | Second quarter 2015
Table 11 Historical data for gold demand
Tonnes
JewelleryTotal bar and coin
investmentETFs and similar Technology Central banks Total
2005 27210 4181 2111 4404 -6634 31272
2006 23014 4298 2585 4717 -3654 30960
2007 24249 4375 2588 4777 -4838 31151
2008 23062 9179 3240 4647 -2354 37773
2009 18163 8323 6442 4144 -336 36737
2010 20513 12005 4211 4599 792 42119
2011 20904 14899 2364 4270 4808 47245
2012 21363 12938 3063 3791 5693 46848
2013 26732 17020 -9163 3543 6255 44386
2014 24629 10044 -1842 3465 5905 42201
Q3rsquo13 6284 3209 -1187 874 1389 10568
Q4rsquo13 6160 3465 -1855 844 1500 10115
Q1rsquo14 6181 2815 -136 822 1198 10879
Q2rsquo14 5945 2378 -379 863 1572 10380
Q3rsquo14 5937 2230 -405 877 1795 10435
Q4rsquo14 6566 2620 -921 904 1339 10508
Q1rsquo15 6034 2521 234 816 1236 10840
Q2rsquo15 5135 2014 -229 855 1374 9149
For a listing of the Exchange Traded Funds and similar products please see the Notes and definitions
Source Metals Focus GFMS Thomson Reuters ICE Benchmark Administration World Gold Council
26Gold Demand Trends | Second quarter 2015
1RWHVDQGGHƮQLWLRQV
All statistics (except where specified) are in weights of fine gold
Notes
Revisions to dataAll data is subject to revision in the light of new information
Historical data seriesDemand and supply data from Q1 2014 are provided by Metals Focus Data between Q1 2010 and Q4 2013 is a synthesis of Metals Focus and GFMS Thomson Reuters data which was created using relatively simple statistical techniques For more information on this process please see Creating a consistent data series by Dr James Abdey (wwwgoldorgsupply-and-demandgold-demand-trends )
HƮQLWLRQV
Central banks and other institutionsNet purchases (ie gross purchases less gross sales) by central banks and other official sector institutions including supra national entities such as the IMF Swaps and the effects of delta hedging are excluded
Consumer demandThe sum of jewellery consumption and total bar and coin investment occurring within a country ie the amount (in fine weight) of gold purchased directly by individuals
ElectronicsThis measures fabrication of gold into components used in the production of electronics including ndash but not limited to ndash semiconductors and bonding wire
DentistryThe first transformation of raw gold into intermediate or final products destined for dental applications such as dental alloys
ETFs and similar productsExchange Traded Funds and similar products including but not limited to SPDR Gold Shares iShares Gold Trust ZKB Gold ETF ETFS Physical GoldJersey Gold Bullion Securities Ltd Central Fund of Canada Ltd Xetra-Gold Julius Baer Precious Metals Fund ndash JB Physical Gold Fund Source Physical Gold P-ETC Sprott Physical Gold Trust Over time new products may be included when appropriate Gold holdings are as reported by the ETFETC issuers and where data is unavailable holdings have been calculated using reported AUM numbers
FabricationFabrication is the first transformation of gold bullion into a semi-finished or finished product
Gold demandThe total of jewellery fabrication technology total bar and coin demand and demand for ETFs and similar products
Jewellery End-user demand for all newly-made carat jewellery and gold watches whether plain gold or combined with other materials Excluded are second-hand jewellery other metals plated with gold coins and bars used as jewellery and purchases funded by the trading-in of existing carat gold jewellery
Jewellery fabricationFigures for jewellery fabrication ndash the first transformation of gold bullion into semi-finished or finished jewellery ndash are included in Table 4 Differs from jewellery consumption as it excludes the impact of importsexports and stockingde-stocking by manufacturers and distributors
LBMA Gold price PMUnless otherwise specified gold price values from 20 March 2015 are based on the LBMA Gold price PM administered by ICE Benchmark Administration (IBA) with prior values being based on the London PM Fix
London PM FixUnless otherwise specified gold price values prior to 20 March 2015 are based on the London PM Fix with subsequent values being based on the LBMA Gold price PM administered by ICE Benchmark Administration (IBA)
Medalsimitation coinFabrication of gold coins without a face value produced by both private and national mints India dominates this category with on average around 90 of the total lsquoMedallionrsquo is the name given to unofficial coins in India Medals of at least 99 purity wires and lumps sold in small quantities are also included
Mine productionThe volume (in fine weight) of gold mined globally This includes an estimate for gold produced as a result of artisanal and small scale mining (ASM) which is largely informal
27Gold Demand Trends | Second quarter 2015
Net producer hedgingThis measures the impact in the physical market of mining companiesrsquo gold forward sales loans and options positions Hedging accelerates the sale of gold a transaction which releases gold (from existing stocks) to the market Over time hedging activity does not generate a net increase in the supply of gold De-hedging ndash the process of closing out hedged positions ndash has the opposite impact and will reduce the amount of gold available to the market in any given quarter
Official coin demandInvestment by individuals in gold bullion coins It equates to the fabrication by national mints of coins which are or have been legal tender in the country of issue It is measured at the country of consumption rather than at the country of origin (for example the Perth Mint in Australia sells the majority of the coins it produces through its global distribution network) and is measured on a net basis In practice it includes the initial sale of many coins destined ultimately to be considered as numismatic rather than bullion
Other industrialGold used in the production of compounds such as Gold Potassium Cyanide for electro-plating in industrial applications as well as in the production of gold-plated jewellery and other decorative items such as gold thread India accounts for the bulk of demand in this category
Over-the-counterOver-the-counter (OTC) transactions (also referred to as lsquooff exchangersquo trading) take place directly between two parties unlike exchange trading which is conducted via an exchange
Physical bar demandInvestment by individuals in small (1kg and below) gold bars in a form widely accepted in the countries represented within Gold Demand Trends This also includes where identifiable gold bought and stored via online vendors It is measured as net purchases
Recycled goldGold sourced from fabricated products that have been sold or made ready for sale which is refined back into bullion This specifically refers to gold sold for cash It does not include gold traded-in for other gold products (for example by consumers at jewellery stores) or process scrap (working gold that never becomes part of a fabricated product but instead returns as scrap to a refiner) The vast majority ndash around 90 ndash of recycled gold is high-value gold (largely jewellery) and the remainder is gold recovered from industrial waste including laptops mobile phones circuit boards etc For more detail on recycling refer to The Ups and Downs of Gold Recycling Boston Consulting Group and World Gold Council March 2015 (wwwgoldorgsupply-and-demand )
SurplusdeficitThis is the difference between total supply and gold demand Partly a statistical residual this number also captures demand in the OTC market and changes to inventories on commodity exchanges with an additional contribution from changes to fabrication inventories
TechnologyThis captures all gold used in the fabrication of electronics dental medical decorative and other technological applications with electronics representing the largest component of this category It includes gold destined for plating jewellery
Tonne (Metric)1000 kg or 32151 troy oz of fine gold
Total bar and coin investmentThe total of physical bar demand official coin demand and demand for medalsimitation coin
Total supplyThe total of mine production net producer hedging and recycling
I101201508
Copyright and other rightscopy 2015 World Gold Council All rights reserved World Gold Council and the Circle device are trademarks of the World Gold Council or its affiliates
All references to LBMA Gold Price are used with the permission of ICE Benchmark Administration Limited and have been provided for informational purposes only ICE Benchmark Administration Limited accepts no liability or responsibility for the accuracy of the prices or the underlying product to which the prices may be referenced
Other third party data and content is the intellectual property of the respective third party and all rights are reserved to them
Any copying republication or redistribution of content to reproduce distribute or otherwise use the statistics and information in this report including by framing or similar means is expressly prohibited without the prior written consent of the World Gold Council or the appropriate copyright owners except as provided below
The use of the statistics in this report is permitted for the purposes of review and commentary (including media commentary) in line with fair industry practice subject to the following two pre-conditions (i) only limited extracts of data or analysis be used and (ii) any and all use of these statistics is accompanied by a clear acknowledgement of the World Gold Council and where appropriate of Thomson Reuters as their source Brief extracts from the analysis commentary and other World Gold Council material are permitted provided World Gold Council is cited as the source It is not permitted to reproduce distribute or otherwise use the whole or a substantial part of this report or the statistics contained within it
While every effort has been made to ensure the accuracy of the information in this document the World Gold Council does not warrant or guarantee the accuracy completeness or reliability of this information The World Gold Council does not accept responsibility for any losses or damages arising directly or indirectly from the use of this document
The material contained in this document is provided solely for general information and educational purposes and is not and should not be construed as an offer to buy or sell or as a solicitation of an offer to buy or sell gold any gold related products or any other products securities or investments Nothing in this document should be taken as making any recommendations or providing any investment or other advice with respect to the purchase sale
or other disposition of gold any gold related products or any other products securities or investments including without limitation any advice to the effect that any gold related transaction is appropriate for any investment objective or financial situation of a prospective investor A decision to invest in gold any gold related products or any other products securities or investments should not be made in reliance on any of the statements in this document Before making any investment decision prospective investors should seek advice from their financial advisers take into account their individual financial needs and circumstances and carefully consider the risks associated with such investment decision
Without limiting any of the foregoing in no event will the World Gold Council or any of its affiliates be liable for any decision made or action taken in reliance on the information in this document and in any event the World Gold Council and its affiliates shall not be liable for any consequential special punitive incidental indirect or similar damages arising from related to or connected with this document even if notified of the possibility of such damages
This document contains forward-looking statements The use of the words ldquobelievesrdquo ldquoexpectsrdquo ldquomayrdquo or ldquosuggestsrdquo or similar terminology identifies a statement as ldquoforward-lookingrdquo The forward-looking statements included in this document are based on current expectations that involve a number of risks and uncertainties These forward-looking statements are based on the analysis of World Gold Council of the statistics available to it Assumptions relating to the forward-looking statement involve judgments with respect to among other things future economic competitive and market conditions all of which are difficult or impossible to predict accurately In addition the demand for gold and the international gold markets are subject to substantial risks which increase the uncertainty inherent in the forward-looking statements In light of the significant uncertainties inherent in the forward-looking information included herein the inclusion of such information should not be regarded as a representation by the World Gold Council that the forward-looking statements will be achieved
The World Gold Council cautions you not to place undue reliance on its forward-looking statements Except in the normal course of our publication cycle we do not intend to update or revise any forward-looking statements whether as a result of new information future events or otherwise and we assume no responsibility for updating any forward-looking statements
World Gold Council10 Old Bailey London EC4M 7NG United Kingdom
E marketintelligencegoldorg T +44 20 7826 4700 F +44 20 7826 4799 W wwwgoldorg
3XEOLVKHG$XJXVW
World Gold Council10 Old Bailey London EC4M 7NG United Kingdom
E marketintelligencegoldorg T +44 20 7826 4700 F +44 20 7826 4799 W wwwgoldorg