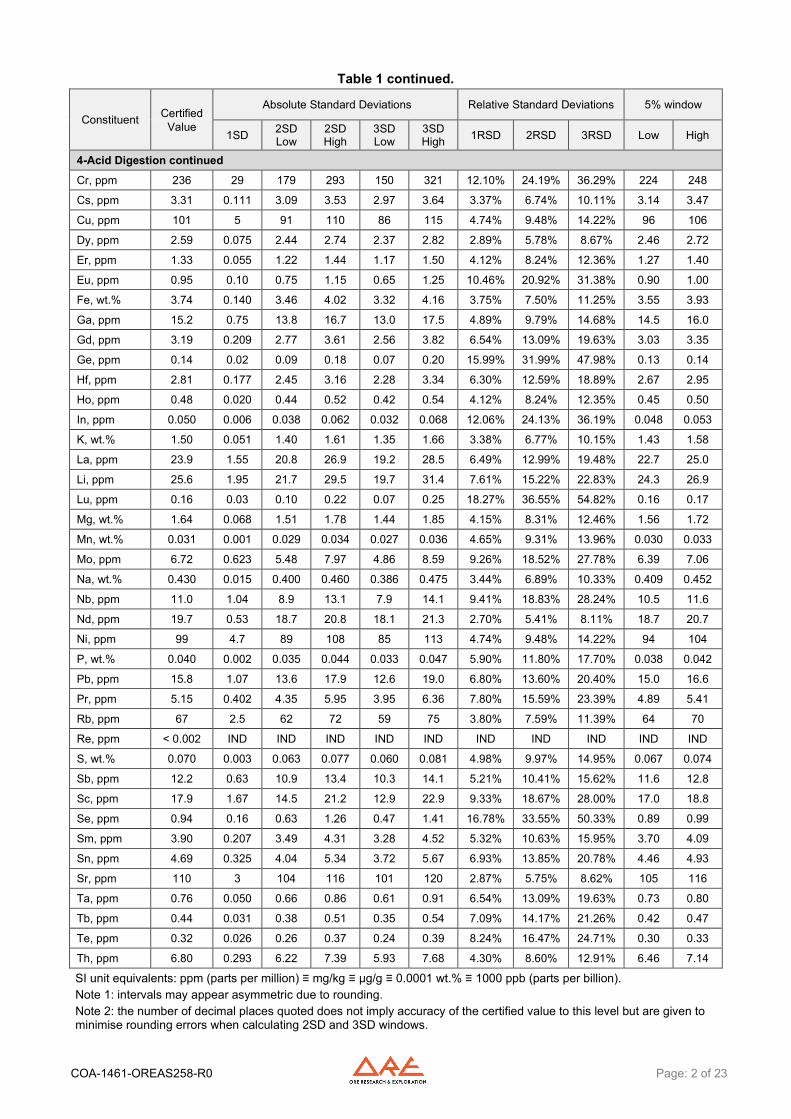
SI unit equivalents: ppm (parts per million) ≡ mg/kg ≡ µg/g ≡ 0.0001 wt.% ≡ 1000 ppb (parts per billion). Note 1: intervals may appear asymmetric due to rounding. Note 2: the number of decimal places quoted does not imply accuracy of the certified value to this level but are given to minimise rounding errors when calculating 2SD and 3SD windows.
SI unit equivalents: ppm (parts per million) ≡ mg/kg ≡ µg/g ≡ 0.0001 wt.% ≡ 1000 ppb (parts per billion). Note 1: intervals may appear asymmetric due to rounding. Note 2: the number of decimal places quoted does not imply accuracy of the certified value to this level but are given to minimise rounding errors when calculating 2SD and 3SD windows.
COA-1461-OREAS258-R0 Page: 3 of 23
Table 1 continued.
Constituent Certified Absolute Standard Deviations Relative Standard Deviations 5% window
SI unit equivalents: ppm (parts per million) ≡ mg/kg ≡ µg/g ≡ 0.0001 wt.% ≡ 1000 ppb (parts per billion). Note 1: intervals may appear asymmetric due to rounding. Note 2: the number of decimal places quoted does not imply accuracy of the certified value to this level but are given to minimise rounding errors when calculating 2SD and 3SD windows.
COA-1461-OREAS258-R0 Page: 4 of 23
Table 1 continued.
Constituent Certified Absolute Standard Deviations Relative Standard Deviations 5% window
Value 1SD 2SD
Low 2SD High
3SD Low
3SD High 1RSD 2RSD 3RSD Low High
Aqua Regia Digestion continued Mo, ppm 5.62 0.369 4.88 6.35 4.51 6.72 6.56% 13.13% 19.69% 5.33 5.90
SI unit equivalents: ppm (parts per million) ≡ mg/kg ≡ µg/g ≡ 0.0001 wt.% ≡ 1000 ppb (parts per billion). Note 1: intervals may appear asymmetric due to rounding. Note 2: the number of decimal places quoted does not imply accuracy of the certified value to this level but are given to minimise rounding errors when calculating 2SD and 3SD windows.
Table 5. Neutron Activation Analysis of Au (in ppm) on 20 x 85mg subsamples ............... 15
LIST OF FIGURES
Figure 1. Au by Fire Assay in OREAS 258 ........................................................................ 17
Figure 2. Au by aqua regia digestion in OREAS 258 ......................................................... 18
Figure 3. Au by cyanide leach in OREAS 258 ................................................................... 19
COA-1461-OREAS258-R0 Page: 6 of 23
INTRODUCTION OREAS reference materials are intended to provide a low-cost method of evaluating and improving the quality of analysis of geological samples. To the geologist they provide a means of implementing quality control in analytical data sets generated in exploration from the grass roots level through to prospect evaluation, and in grade control at mining operations. To the analyst they provide an effective means of calibrating analytical equipment, assessing new techniques and routinely monitoring in-house procedures. OREAS reference materials enable users to successfully achieve process control of these tasks because the observed variance from repeated analysis has its origin almost exclusively in the analytical process rather than the reference material itself. In evaluating laboratory performance with this CRM, the section headed ‘Intended Use’ should be read carefully.
SOURCE MATERIAL Certified Reference Material (CRM) OREAS 258 was prepared from a blend of gold-bearing oxide ore and barren materials (sedimentary rocks and basaltic scoria). The ore (Wilber Lode) was sourced from the Andy Well Gold Project located approximately 45km north of Meekatharra in the Murchison region of Western Australia. The Wilber Lode is a shear-hosted, narrow vein, quartz lode-style gold deposit situated within the Meekatharra-Wydgee greenstone belt in the Archaean Yilgarn Craton of Western Australia. The common primary mineral assemblage as stated by Mason and Harris (2011, 2012, cited in Hingston et al, 2014) is quartz, calcite, chlorite, fuchsite, pyrite, galena, sphalerite, chalcopyrite and gold. The host rock consists of a complex sequence of weathered Archaean meta-basalt and meta-porphyritic rocks derived from a primary mineralogy of albite, actinolite, chlorite, sericite, biotite, calcite, zoisite, muscovite, quartz and titanate. The approximate major and trace element composition of OREAS 258 is provided in Table 2.
PERFORMANCE GATES Table 1 above shows intervals calculated for two and three standard deviations. As a guide these intervals may be regarded as warning or rejection for multiple 2SD outliers, or rejection for individual 3SD outliers in QC monitoring, although their precise application should be at the discretion of the QC manager concerned (also see ‘Intended Use’ section below). Westgard Rules extend the basics of single-rule QC monitoring using multi-rules (for more information visit www.westgard.com/mltirule.htm). A second method utilises a 5% window calculated directly from the certified value. Standard deviation is also shown in relative percent for one, two and three relative standard deviations (1RSD, 2RSD and 3RSD) to facilitate an appreciation of the magnitude of these numbers and a comparison with the 5% window. Caution should be exercised when concentration levels approach lower limits of detection of the analytical methods employed as performance gates calculated from standard deviations tend to be excessively wide whereas those determined by the 5% method are too narrow. One approach used at commercial laboratories is to set the acceptance criteria at twice the detection level (DL) ± 10%.
i.e. Certified Value ± 10% ± 2DL (adapted from Govett, 1983).
COA-1461-OREAS258-R0 Page: 7 of 23
Table 2. Indicative Values for OREAS 258.
Constituent Unit Value Constituent Unit Value Constituent Unit Value
Laser Ablation ICP-MS Ag ppm 1.80 Hf ppm 3.86 Sm ppm 3.91 As ppm 246 Ho ppm 0.63 Sn ppm 5.27 Ba ppm 429 In ppm < 0.05 Sr ppm 107 Be ppm 1.80 La ppm 24.3 Ta ppm 0.88 Bi ppm 5.05 Lu ppm 0.24 Tb ppm 0.57 Cd ppm 0.12 Mn wt.% 0.031 Te ppm 0.27 Ce ppm 44.4 Mo ppm 6.73 Th ppm 7.10 Co ppm 20.7 Nb ppm 12.8 Ti wt.% 0.374 Cr ppm 290 Nd ppm 20.3 Tl ppm 0.47 Cs ppm 3.31 Ni ppm 101 Tm ppm 0.25 Cu ppm 99 Pb ppm 16.0 U ppm 1.53 Dy ppm 3.07 Pr ppm 5.51 V ppm 131 Er ppm 1.72 Rb ppm 67 W ppm 54 Eu ppm 0.96 Re ppm 0.010 Y ppm 16.7 Ga ppm 15.2 Sb ppm 12.5 Yb ppm 1.65 Gd ppm 3.45 Sc ppm 18.0 Zn ppm 75 Ge ppm 1.35 Se ppm < 5 Zr ppm 141
SI unit equivalents: ppm (parts per million) ≡ mg/kg ≡ µg/g ≡ 0.0001 wt.% ≡ 1000 ppb (parts per billion). Note: the number of significant figures reported is not a reflection of the level of certainty of stated values. They are instead an artefact of ORE’s in-house CRM-specific LIMS.
COA-1461-OREAS258-R0 Page: 8 of 23
COMMINUTION AND HOMOGENISATION PROCEDURES The material constituting OREAS 258 was prepared in the following manner:
• Drying of ore and barren materials to constant mass at 105°C; • Crushing and milling of the barren materials to >98% minus 75 microns; • Crushing and milling of the ore material to 100% minus 30 microns; • Blending in appropriate proportions to achieve the desired grade; • Packaging in 60g units sealed in laminated foil pouches and 500g units in plastic
jars.
PHYSICAL PROPERTIES OREAS 258 was tested at ORE Research & Exploration Pty Ltd’s onsite facility for various physical properties. Table 3 presents these findings that should be used for informational purposes only.
Table 3. Physical properties of OREAS 258.
Bulk Density (g/L) Moisture% Munsell Notation‡ Munsell Color‡
654 0.79 10YR 8/2 Very PaleOrange ‡The Munsell Rock Color Chart helps geologists and archeologists communicate with colour more effectively by cross-referencing ISCC-NBS colour names with unique Munsell alpha-numeric colour notations for rock colour samples.
ANALYTICAL PROGRAM Twenty-six commercial analytical laboratories participated in the program to certify the elements reported in Table 1. The following methods were employed:
• Gold by fire assay (15-50g charge weight) with AAS (18 laboratories) and ICP-OES (7 laboratories) finish;
• Gold by 10-50g aqua regia digestion with ICP-MS (11 laboratories) and AAS (8 laboratories) finish;
• Gold by cyanide leach; a variety of cyanide leach methods were undertaken by 20 participating laboratories including the use of LeachWELL tablets, alkaline added sodium cyanide solution as well as sodium cyanide liquor with LeachWELL powder. The sample weights included:
o 200g (8 laboratories by AAS finish and 1 laboratory by ICP-MS finish) o 30g (6 laboratories by AAS finish and 1 laboratory by ICP-OES finish) o 50g (1 laboratory by ICP-MS finish and 1 laboratory by AAS finish) o 15g (1 laboratory by AAS finish) and o 5g (1 laboratory by AAS finish);
• Full ICP-OES and ICP-MS elemental suites by 4-acid (HNO3-HF-HClO4-HCl) digestion (up to 20 laboratories depending on the element);
• Full ICP-OES and ICP-MS elemental suites by aqua regia digestion using 0.2 to 50g sample weights (up to 21 laboratories depending on the element).
COA-1461-OREAS258-R0 Page: 9 of 23
To confirm homogeneity, gold by instrumental neutron activation analysis (INAA) was undertaken on 20 x 85mg subsamples by the Australian Nuclear Science and Technology Organisation (ANSTO) located in Lucas Heights, NSW, Australia (see Table 5 in the ‘Homogeneity Evaluation’ section below). For the round robin certification program twenty 2kg test units were taken at predetermined intervals during the bagging stage, immediately following homogenisation and are considered representative of the entire prepared batch. Six pulp samples were submitted to each laboratory for analysis (the weight provided depended on whether the laboratory was anticipated to undertake assays by gold cyanide leach). The samples received by each laboratory were obtained by taking two samples from each of three separate 2kg test units. This format enabled a nested ANOVA treatment of the results to evaluate homogeneity, i.e. to ascertain whether between-unit variance is greater than within-unit variance (see ‘nested ANOVA’ section). Table 1 provides performance gate intervals for the 120 certified values based on their pooled 1SD’s. Table 2 shows 86 indicative values including major and trace element characterisation by Bureau Veritas in Perth, Western Australia which includes:
• Major oxides by lithium borate fusion with X-ray fluorescence; • LOI at 1000°C by thermogravimetric analyser; • Total Carbon and Sulphur by Infrared combustion furnace; • Trace element characterisation by laser ablation (of the fused disc) with ICP-MS
finish. Table 3 provides some indicative physical properties and Table 4 presents the 95% confidence and tolerance limits for all certified values. Gold homogeneity (via INAA) is shown in Table 5. Tabulated results of all elements (including Au INAA analyses) together with uncorrected means, medians, standard deviations, relative standard deviations and percent deviation of lab means from the corrected mean of means (PDM3) are presented in the detailed certification data for this CRM (OREAS 258-DataPack.1.0.200925_195328.xlsx). Results are also presented in scatter plots for gold by fire assay, gold be aqua regia digestion and gold by cyanide leach (Figures 1 to 3, respectively) together with ±3SD (magenta) and ±5% (yellow) control lines and certified value (green line). Accepted individual results are coloured blue and individual and dataset outliers are identified in red and violet, respectively.
STATISTICAL ANALYSIS Standard Deviation intervals (see Table 1) provide an indication of a level of performance that might reasonably be expected from a laboratory being monitored by this CRM in a QA/QC program. They take into account errors attributable to measurement uncertainty and CRM variability. For an effective CRM the contribution of the latter should be negligible in comparison to measurement errors. The Standard Deviation values include all sources of measurement uncertainty: between-lab variance, within-run variance (precision errors) and CRM variability.
COA-1461-OREAS258-R0 Page: 10 of 23
In the application of SD’s in monitoring performance it is important to note that not all laboratories function at the same level of proficiency and that different methods in use at a particular laboratory have differing levels of precision. Each laboratory has its own inherent SD (for a specific concentration level and analyte-method pair) based on the analytical process and this SD is not directly related to the round robin program (see Intended Use section for more detail). The SD for each analyte’s certified value is calculated from the same filtered data set used to determine the certified value, i.e. after removal of all individual, lab dataset (batch) and 3SD outliers (single iteration). These outliers can only be removed after the absolute homogeneity of the CRM has been independently established, i.e. the outliers must be confidently deemed to be analytical rather than arising from inhomogeneity of the CRM. The standard deviation is then calculated for each analyte from the pooled accepted analyses generated from the certification program. Certified Values, Standard Deviations, Confidence Limits and Tolerance Limits (Table 4) have been determined for each analyte following removal of individual, laboratory dataset (batch) and 3SD outliers (single iteration). For individual outliers within a laboratory batch the z-score test is used in combination with a second method that determines the per cent deviation of the individual value from the batch median. Outliers in general are selected on the basis of z-scores > 2.5 and with per cent deviations (i) > 3 and (ii) more than three times the average absolute per cent deviation for the batch. In certain instances, statistician’s prerogative has been employed in discriminating outliers. Each laboratory data set mean is tested for outlying status based on z-score discrimination and rejected if > 2.5. After individual and laboratory data set (batch) outliers have been eliminated a non-iterative 3 standard deviation filter is applied, with those values lying outside this window also relegated to outlying status. Certified Values are the means of accepted laboratory means after outlier filtering. The INAA data (see Table 5) is omitted from determination of the certified value for Au and is used solely for the calculation of Tolerance Limits and homogeneity evaluation of OREAS 258 (see ‘Homogeneity Evaluation’ section below). 95% Confidence Limits are inversely proportional to the number of participating laboratories and inter-laboratory agreement. It is a measure of the reliability of the certified value. A 95% confidence interval indicates a 95% probability that the true value of the analyte under consideration lies between the upper and lower limits. 95% Confidence Limits should not be used as control limits for laboratory performance. Indicative (uncertified) Values (Table 2) are present where the number of laboratories reporting a particular analyte is insufficient (< 5) to support certification or where inter-laboratory consensus is poor.
COA-1461-OREAS258-R0 Page: 11 of 23
Table 4. 95% Confidence & Tolerance Limits for OREAS 258.
Sr, Strontium (ppm) 22.0 20.8 23.3 21.5 22.6 Ta, Tantalum (ppm) < 0.05 IND IND IND IND SI unit equivalents: ppm (parts per million) ≡ mg/kg ≡ µg/g ≡ 0.0001 wt.% ≡ 1000 ppb (parts per billion). Note: intervals may appear asymmetric due to rounding.
Y, Yttrium (ppm) 7.15 7.04 7.27 6.99 7.32 Yb, Ytterbium (ppm) 0.57 0.51 0.62 0.55 0.59 Zn, Zinc (ppm) 59 56 61 57 60 Zr, Zirconium (ppm) 18.8 17.9 19.6 18.2 19.4 SI unit equivalents: ppm (parts per million) ≡ mg/kg ≡ µg/g ≡ 0.0001 wt.% ≡ 1000 ppb (parts per billion). Note: intervals may appear asymmetric due to rounding. Homogeneity Evaluation For analytes other than gold the tolerance limits (ISO 16269:2014) shown in Table 4 were determined using an analysis of precision errors method and are considered a conservative estimate of true homogeneity. The meaning of tolerance limits may be illustrated for copper by 4-acid digestion, where 99% of the time (1-α=0.99) at least 95% of subsamples (ρ=0.95) will have concentrations lying between 99 and 103 ppm. Put more precisely, this means that if the same number of subsamples were taken and analysed in the same manner repeatedly, 99% of the tolerance intervals so constructed would cover at least 95% of the total population, and 1% of the tolerance intervals would cover less than 95% of the total population (ISO Guide 35). Please note that tolerance limits pertain to the homogeneity of the CRM only and should not be used as control limits for laboratory performance. Table 5 below shows the gold INAA data determined on 20 x 85mg subsamples of OREAS 258. An equivalent scaled version of the results is also provided to demonstrate the level of repeatability that would be achieved if 30g fire assay determinations were undertaken without the normal measurement error associated with this methodology. The homogeneity of gold has been determined by INAA using the reduced analytical subsample method which utilises the known relationship between standard deviation and analytical subsample weight (Ingamells and Switzer, 1973). In this approach the sample aliquot is substantially reduced to a point where most of the variability in replicate assays should be due to inhomogeneity of the reference material (i.e. sampling error) and measurement error becomes negligible. In this instance a subsample weight of 85 milligrams was employed and the 1RSD of 0.148% was calculated for a 30g fire assay sample (2.78% at 85mg weights) and confirms the high level of gold homogeneity in OREAS 258. The homogeneity of OREAS 258 has also been evaluated in a nested ANOVA of the round robin program. Each of the forty-two round robin laboratories received six samples per CRM and these samples were made up of paired samples from three different, non-adjacent sampling intervals. The purpose of the ANOVA evaluation is to test that no
COA-1461-OREAS258-R0 Page: 15 of 23
statistically significant difference exists in the variance between units to that of the variance within units. This allows an assessment of homogeneity across the entire prepared batch of OREAS 258. The test was performed using the following parameters:
• Gold fire assay – 150 samples (25 laboratories each providing analyses on 3 pairs of samples);
• Gold aqua regia digestion – 114 samples (19 laboratories each providing analyses on 3 pairs of samples);
• Gold cyanide leach – 120 samples (20 laboratories each providing analyses on 3 pairs of samples);
• Null Hypothesis, H0: Between-unit variance is no greater than within-unit variance (reject H0 if p-value < 0.05);
• Alternative Hypothesis, H1: Between-unit variance is greater than within-unit variance.
Table 5. Neutron Activation Analysis of Au (in ppm) on 20 x 85mg subsamples and showing the
equivalent results scaled to a 30g sample mass typical of fire assay determination. Replicate Au Au
Mean 11.51 11.51 Median 11.50 11.51 Std Dev. 0.320 0.017 Rel.Std.Dev. 2.78% 0.148%
*Results calculated for a 30g equivalent sample mass using the formula: 𝑥𝑥30𝑔𝑔 𝐸𝐸𝐸𝐸 = �𝑥𝑥𝐼𝐼𝐼𝐼𝐼𝐼𝐼𝐼− 𝑋𝑋�� × 𝑅𝑅𝑅𝑅𝑅𝑅@30𝑔𝑔
𝑅𝑅𝑅𝑅𝑅𝑅@85𝑚𝑚𝑔𝑔+ 𝑋𝑋�
where 𝑥𝑥30𝑔𝑔 𝐸𝐸𝐸𝐸 = equivalent result calculated for a 30g sample mass (𝑥𝑥𝐼𝐼𝐼𝐼𝐼𝐼𝐼𝐼) = raw INAA result at 85mg 𝑋𝑋� = mean of 85mg INAA results P-values are a measure of probability where values less than 0.05 indicate a greater than 95% probability that the observed differences in within-unit and between-unit variances are
COA-1461-OREAS258-R0 Page: 16 of 23
real. The datasets were filtered for both individual and laboratory data set (batch) outliers prior to the calculation of the p-value. This process derived p-values of 1.00 for Au by fire assay, 0.99 for Au by aqua regia digestion and 1.00 for Au by cyanide leach. All three p-values are insignificant and the Null Hypothesis is retained. Additionally, none of the other certified values showed significant p-values. Please note that only results for constituents present in concentrations well above the detection levels (i.e. >20 x Lower Limit of Detection) for the various methods undertaken were considered for the objective of evaluating homogeneity. It is important to note that ANOVA is not an absolute measure of homogeneity. Rather, it establishes whether or not the analytes are distributed in a similar manner throughout the packaging run of OREAS 258 and whether the variance between two subsamples from the same unit is statistically distinguishable from the variance of two subsamples taken from any two separate units. A reference material therefore can possess poor absolute homogeneity yet still pass a relative homogeneity (ANOVA) test if the within-unit heterogeneity is large and similar across all units. Based on the statistical analysis of the results of the inter-laboratory certification program it can be concluded that OREAS 258 is fit-for-purpose as a certified reference material (see ‘Intended Use’ below).
PARTICIPATING LABORATORIES
1. Actlabs, Ancaster, Ontario, Canada 2. Actlabs, Kamloops, BC, Canada 3. Alex Stewart International, Mendoza, Argentina 4. ALS, Lima, Peru 5. ALS, Loughrea, Galway, Ireland 6. ALS, Perth, WA, Australia 7. ALS, Vancouver, BC, Canada 8. American Assay Laboratories, Sparks, Nevada, USA 9. ANSTO, Lucas Heights, NSW, Australia 10. ARGETEST Mineral Processing, Ankara, Central Anatolia, Turkey 11. Bureau Veritas Commodities and Trade, Inc., Sparks, Nevada, USA 12. Bureau Veritas Commodities Canada Ltd, Vancouver, BC, Canada 13. Bureau Veritas Geoanalytical, Adelaide, SA, Australia 14. Bureau Veritas Geoanalytical, Perth, WA, Australia 15. Gekko Assay Labs, Ballarat, VIC, Australia 16. Inspectorate (BV), Lima, Peru 17. Intertek Genalysis, Perth, WA, Australia 18. Intertek Tarkwa, Tarkwa, Ghana 19. PT Intertek Utama Services, Jakarta Timur, DKI Jakarta, Indonesia 20. Reminex Centre de Recherche, Marrakesh, Marrakesh-Safi, Morocco 21. Saskatchewan Research Council, Saskatoon, Saskatchewan, Canada 22. SGS, Randfontein, Gauteng, South Africa 23. SGS Australia Mineral Services, Kalgoorlie, WA, Australia 24. SGS Canada Inc., Vancouver, BC, Canada 25. SGS Tarkwa, Tarkwa, Western Region, Ghana 26. Shiva Analyticals Ltd, Bangalore North, Karnataka, India
Please note: To preserve anonymity, the above numbered alphabetical list of participating laboratories does not correspond with the Lab ID numbering on the scatter plots below.
COA-1461-OREAS258-R0 Page: 17 of 23
Figure 1. Au by Fire Assay in OREAS 258
COA-1461-OREAS258-R0 Page: 18 of 23
Figure 2. Au by aqua regia digestion in OREAS 258
COA-1461-OREAS258-R0 Page: 19 of 23
Figure 3. Au by cyanide leach in OREAS 258
COA-1461-OREAS258-R0 Page: 20 of 23
PREPARER AND SUPPLIER Certified reference material OREAS 258 was prepared, certified and supplied by: ORE Research & Exploration Pty Ltd Tel: +613-9729 0333 37A Hosie Street Fax: +613-9729 8338 Bayswater North VIC 3153 Web: www.ore.com.au AUSTRALIA Email: [email protected]
METROLOGICAL TRACEABILITY The analytical samples were selected in a manner representative of the entire batch of the prepared CRM. This ‘representivity’ was maintained in each submitted laboratory sample batch and ensures the user that the data is traceable from sample selection through to the analytical results that underlie the consensus values. Each analytical data set has been validated by its assayer through the inclusion of internal reference materials and QC checks during analysis. The laboratories were chosen on the basis of their competence (from past performance in inter-laboratory programs undertaken by ORE Pty Ltd) for a particular analytical method, analyte or analyte suite and sample matrix. Most of these laboratories have and maintain ISO 17025 accreditation. The certified values presented in this report are calculated from the means of accepted data following robust statistical treatment, as detailed in this report. Guide ISO/TR 16476:2016, section 5.3.1 describes metrological traceability in reference materials as it pertains to the transformation of the measurand. In this section it states, “Although the determination of the property value itself can be made traceable to appropriate units through, for example, calibration of the measurement equipment used, steps like the transformation of the sample from one physical (chemical) state to another cannot. Such transformations may only be compared with a reference (when available), or among themselves. For some transformations, reference methods have been defined and may be used in certification projects to evaluate the uncertainty associated with such a transformation. In other cases, only a comparison among different laboratories using the same method is possible. In this case, certification takes place on the basis of agreement among independent measurement results (see ISO Guide 35:2006, Clause 10).”
COMMUTABILITY The measurements of the results that underlie the certified values contained in this report were undertaken by methods involving pre-treatment (digestion/fusion) of the sample. This served to reduce the sample to a simple and well understood form permitting calibration using simple solutions of the CRM. Due to these methods being well understood and highly effective, commutability is not an issue for this CRM. All OREAS CRMs are sourced from natural ore minerals meaning they will display similar behaviour as routine ‘field’ samples in the relevant measurement process. Care should be taken to ensure ‘matrix matching’ as close as practically achievable. The matrix and mineralisation style of the CRM is described in the ‘Source Material’ section and users should select appropriate CRMs matching these attributes to their field samples.
COA-1461-OREAS258-R0 Page: 21 of 23
INTENDED USE OREAS 258 is intended to cover all activities needed to produce a measurement result. This includes extraction, possible separation steps and the actual measurement process (the signal producing step). OREAS 258 may be used to calibrate the entire procedure by producing a pure substance CRM transformed into a calibration solution. OREAS 258 is intended for the following uses:
• For the monitoring of laboratory performance in the analysis of analytes reported in Table 1 in geological samples;
• For the verification of analytical methods for analytes reported in Table 1; • For the calibration of instruments used in the determination of the concentration
of analytes reported in Table 1. QC monitoring using multiples of the Standard Deviation (SD) In the application of SD’s in monitoring performance it is important to note that not all laboratories function at the same level of proficiency and that different methods in use at a particular laboratory have differing levels of precision. Each laboratory has its own inherent SD (for a specific concentration level and analyte-method pair) based on the analytical process and this SD is not directly related to the round robin program. The majority of data generated in the round robin program was produced by a selection of world class laboratories. The SD’s thus generated are more constrained than those that would be produced across a randomly selected group of laboratories. To produce more generally achievable SD’s the ‘pooled’ SD’s provided in this report include inter-laboratory bias. This ‘one size fits all’ approach may require revision at the discretion of the QC manager concerned following careful scrutiny of QC control charts.
STABILITY AND STORAGE INSTRUCTIONS
OREAS 258 has been prepared from gold oxide ore blended with barren materials (sedimentary rocks and basaltic scoria). It is very low in reactive sulphide (0.07 wt.% S) and in its unopened state and under normal conditions of storage has a shelf life beyond ten years. Its stability will be monitored at regular intervals and purchasers notified if any changes are observed.
INSTRUCTIONS FOR CORRECT USE The certified values for OREAS 258 refer to the concentration level in its packaged state. It should not be dried prior to weighing and analysis.
HANDLING INSTRUCTIONS Fine powders pose a risk to eyes and lungs and therefore standard precautions including the use of safety glasses and dust masks are advised.
COA-1461-OREAS258-R0 Page: 22 of 23
LEGAL NOTICE Ore Research & Exploration Pty Ltd has prepared and statistically evaluated the property values of this reference material to the best of its ability. The Purchaser by receipt hereof releases and indemnifies Ore Research & Exploration Pty Ltd from and against all liability and costs arising from the use of this material and information.
DOCUMENT HISTORY Revision No. Date Changes applied
0 28th September, 2020 First publication.
QMS CERTIFICATION ORE Pty Ltd is ISO 9001:2015 certified by Lloyd’s Register Quality Assurance Ltd for its quality management system including development, manufacturing, certification and supply of CRMs.
REFERENCES Govett, G.J.S. (1983). Handbook of Exploration Geochemistry, Volume 2: Statistics and Data Analysis in Geochemical Prospecting (Variations of accuracy and precision). Hingston, R., Wellman, T. and Sternadt, G. (2014), The Geology of the Wilber Deposit, Andy Well Gold Project, Murchison District, Western Australia (pages 55-63, 9th International Mining Geology Conference 2014 - Proceedings - AusIMM). Ingamells, C. O. and Switzer, P. (1973). A Proposed Sampling Constant for Use in Geochemical Analysis, Talanta 20, 547-568. ISO Guide 30:2015. Terms and definitions used in connection with reference materials. ISO Guide 31:2015. Reference materials – Contents of certificates and labels. ISO Guide 35:2017. Certification of reference materials - General and statistical principals.
COA-1461-OREAS258-R0 Page: 23 of 23
ISO 16269:2014. Statistical interpretation of data – Part 6: Determination of statistical tolerance intervals. ISO/TR 16476:2016, Reference Materials – Establishing and expressing metrological traceability of quantity values assigned to reference materials. Munsell Rock Color Book (2014). Rock-Color Chart Committee, Geological Society of America (GSA), 4300 44th Street SE, Grand Rapids, MI 49512.