19
1 © Copyright 2021 Gold Standard MARKET REPORT 2020 Gold Standard Market report 2020 May 2021

1© Copyright 2021 Gold Standard
market report 2020
Gold Standard
Market report 2020May 2021

2© Copyright 2021 Gold Standard
market report 2020
Foreword
Executive summary
Gold Standard project pipeline
Scope of certified projects
A closer look at 2020
3
4
5
7
17
Table of contents

3© Copyright 2021 Gold Standard
market report 2020
Foreword
Growth, despite all odds
The year 2020 started with skyrocketing demand, building on momentum for climate action that had increased since 2018. The COVID crisis introduced new challenges, specifically on the supply side, as the certification process required in-person consultations and often travel – both made impossible by the pandemic. Gold Standard responded by introducing flexibility measures that allowed projects to continue with alternative means to engage stakeholders, monitor progress, and verify results.
Thus, despite an unprecedented global pandemic, we saw a record year of credit issuances, thanks to our project developers and auditors who adapted and continued delivering impact to communities and ecosystems worldwide.
On the demand side, concerns that the economic slowdown would damper climate commitments were proven unfounded. Gold Standard recorded another record year of retirements. We applaud companies who continued to take responsibility for their climate impact by financing emission reductions beyond their boundaries in the face of business disruption.
2020 also marked the launch of the Task Force to Scale the Voluntary Carbon Market, which seeks to mainstream high-quality carbon offsetting. While it remains to be seen whether the Task Force defines quality in line with Gold Standard’s expectations, we will do our part to ensure that this scaling does not come at the expense of integrity and that project developers are incentivised to continue to go the extra mile to deliver greater impact toward climate security and sustainable development.
4© Copyright 2021 Gold Standard
market report 2020
151M
Total issued Carbon Credits
23.5B Total
Shared Value
+87% vs 2019
+75% vs 2019
+28% vs 201975.8M
Total retired VERs + CERs
Total issued VERs
Total issued CERs
126.1M 24.9M
34M
Carbon Credits issued in 2020
5.7B Shared Value
in 2020
15.8M Retired VERs + CERs
in 2020
Issued VERs Issued CERs
28.5M 5.6M
Executive summary
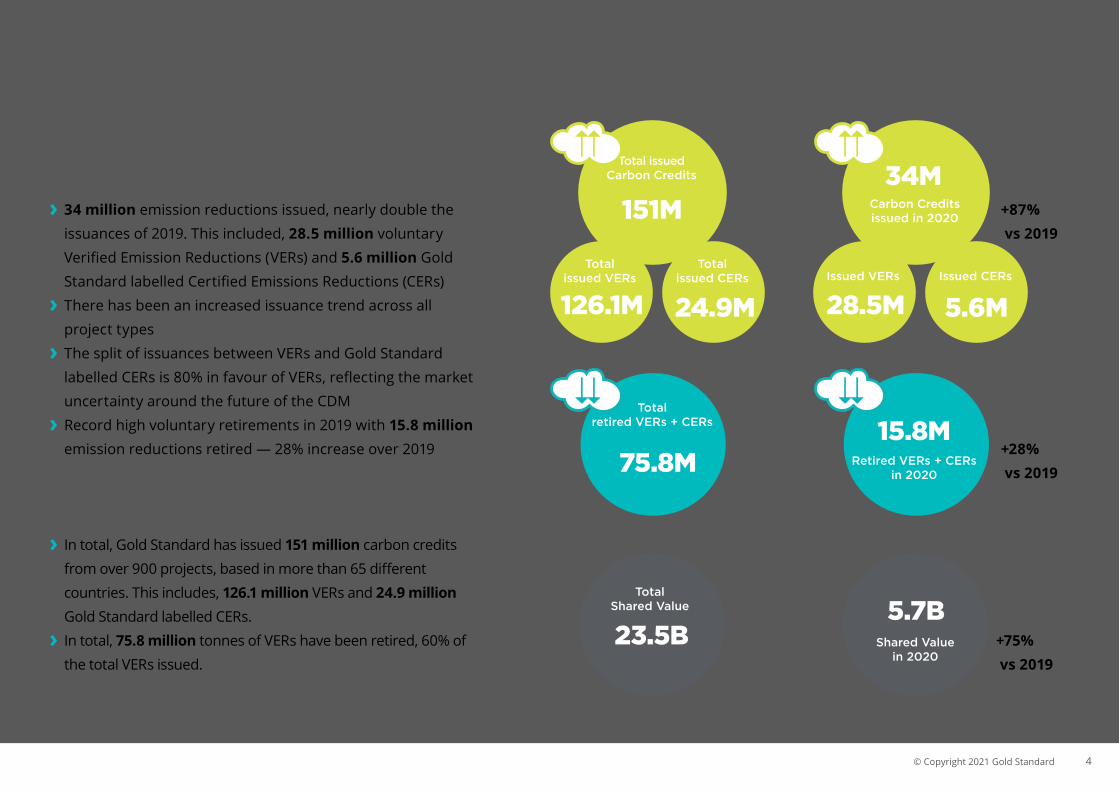
IN 2020
› 34 million emission reductions issued, nearly double the issuances of 2019. This included, 28.5 million voluntary Verified Emission Reductions (VERs) and 5.6 million Gold Standard labelled Certified Emissions Reductions (CERs)
› There has been an increased issuance trend across all project types
› The split of issuances between VERs and Gold Standard labelled CERs is 80% in favour of VERs, reflecting the market uncertainty around the future of the CDM
› Record high voluntary retirements in 2019 with 15.8 million emission reductions retired — 28% increase over 2019
IN TOTAL
› In total, Gold Standard has issued 151 million carbon credits from over 900 projects, based in more than 65 different countries. This includes, 126.1 million VERs and 24.9 million Gold Standard labelled CERs.
› In total, 75.8 million tonnes of VERs have been retired, 60% of the total VERs issued.

5© Copyright 2021 Gold Standard
In total, Gold Standard projects have saved 151 million tonnes of CO2 – nearly four times the annual emissions released by Switzerland.
Gold Standard
Project pipeline

6© Copyright 2021 Gold Standard
market report 2020
Project pipeline
When applying our standard, projects move through a project certification cycle. This page provides an overview of where projects are within this cycle. Over 60% of our projects are fully certified and already issuing credits or at the design certified stage – the final stage before issuance is approved. Definitions
› New Project – Project concept submitted to Gold Standard
› Project Listed – Preliminary review to check conformance successfully completed
› Design Certified (Registered) – Validation audit complete and all documents reviewed and approved
› Performance Certified (Issued) – Project cycle and verification audit successfully completed; Project is issued with relevant product (e.g. carbon credits)
401Design Certified
18M
estimated annual emission reduction
980Performance Certified
47M
estimated annual emission reduction
585Project Listed
66M
estimated annual emission reduction
325New Project
31M
estimated annual emission reduction
figure 1 – Overview of projects in our project certification process

7© Copyright 2021 Gold Standard
Gold Standard saw record high voluntary retirements in 2020, with retirements up by nearly 30% and totaling 15.8 million.
Gold Standard
Scope of certified projects

8© Copyright 2021 Gold Standard
market report 2020
Scope of certified projects
figure 2 – shows the volume of Gold Standard certified projects and issuances by issued and project type, including VER and CERs.
151,028,809tonnes emissions reduced
TOTAL
965number of certified projects
TOTAL
ton
nes
emis
sio
ns r
edu
ced
nu
mbe
r o
f cer
tifi
ed p
roje
cts

9© Copyright 2021 Gold Standard
market report 2020
Global distribution of emissions reductions
151,028,809151 M
emissions reduced
TOTAL
latin america
171'063
1'403'711
2'268'401
903'563
34'911
76'140
1'079'625
43'823
2'604'997
172'720
905'724
455'670
2'035'853
BOLIVIA
BRAZIL
CHILE
COLOMBIA
COSTA RICA
DOMINICAN REPUBLIC
GUATEMALA
HAITI
HONDURAS
MEXICO
NICARAGUA
PANAMA
PERU
north america 1.1m
1'075'844 ARUBA
UNITED STATES 5'526
europe804'087
62'903
477'710
171'049
BULGARIA
ROMANIA
RUSSIAN FEDERATION
SWITZERLAND
1.5m
36.2mafrica8'008
266'111
81'517
52'271
267'635
795'242
612'798
6'357'931
11'779
10'905'750
179'072
1'467'824
2'069'626
1'182'935
34'439
79'710
967'494
2'406'256
134'225
237'993
270'019
354'969
7'792
7'352'174
3'481
58'631
BENIN
BURKINA FASO
CAMEROON
CHAD
CONGO D.R.
ERITREA
ETHIOPIA
GHANA
GUINEA
KENYA
LESOTHO
MADAGASCAR
MALAWI
MALI
MOROCCO
MOZAMBIQUE
NIGERIA
RWANDA
SENEGAL
SOUTH AFRICA
SUDAN
TANZANIA
TOGO
UGANDA
ZAMBIA
ZIMBABWE
98.2masia
318'673
1'714'073
21'090'173
16'973'439
530'610
174
715'503
260'920
198'678
2'857'758
246'294
100'552
393'839
14'479
5'142'249
3'658'250
42'672
39'014'119
4'905'164
BANGLADESH
CAMBODIA
CHINA
INDIA
INDONESIA
IRAQ
LAO P.D.R.
MONGOLIA
MYANMAR
NEPAL
PAKISTAN
PAPUA NEW GUINEA
PHILIPPINES
SRI LANKA
TAIWAN
THAILAND
TIMOR-LESTE
TURKEY
VIET NAM
12.9m
oceania 1.2m130'794
383'225
637'706
AUSTRALIA
NEW CALEDONIA
NEW ZEALAND
figure 3 – Overview of emission reductions by location
In total, Gold Standard has issued 151 million carbon credits from projects based in more than 65 different countries around the world.

10© Copyright 2021 Gold Standard
market report 2020
VER Issuances + retirement ratios
emissions issued and retired
TOTAL
Figure 4 shows the total VER issuance and retirement volumes by project sector. It was a record high year for Gold Standard issuances in 2020, providing more supply to meet an expected increase in demand in 2021 and beyond.
issued emissions reductions
retired emissions reductions

11© Copyright 2021 Gold Standard
market report 2020
VER Issuances by project sector
Figure 5 shows VER issuances over the past five years by project sector. In 2020, there was an increased issuance trend across all project types. Renewable energy projects issued more credits than community service projects. Afforestation/Reforestation projects had a record high issuance of over a million VERs in 2020.
12© Copyright 2021 Gold Standard
market report 2020
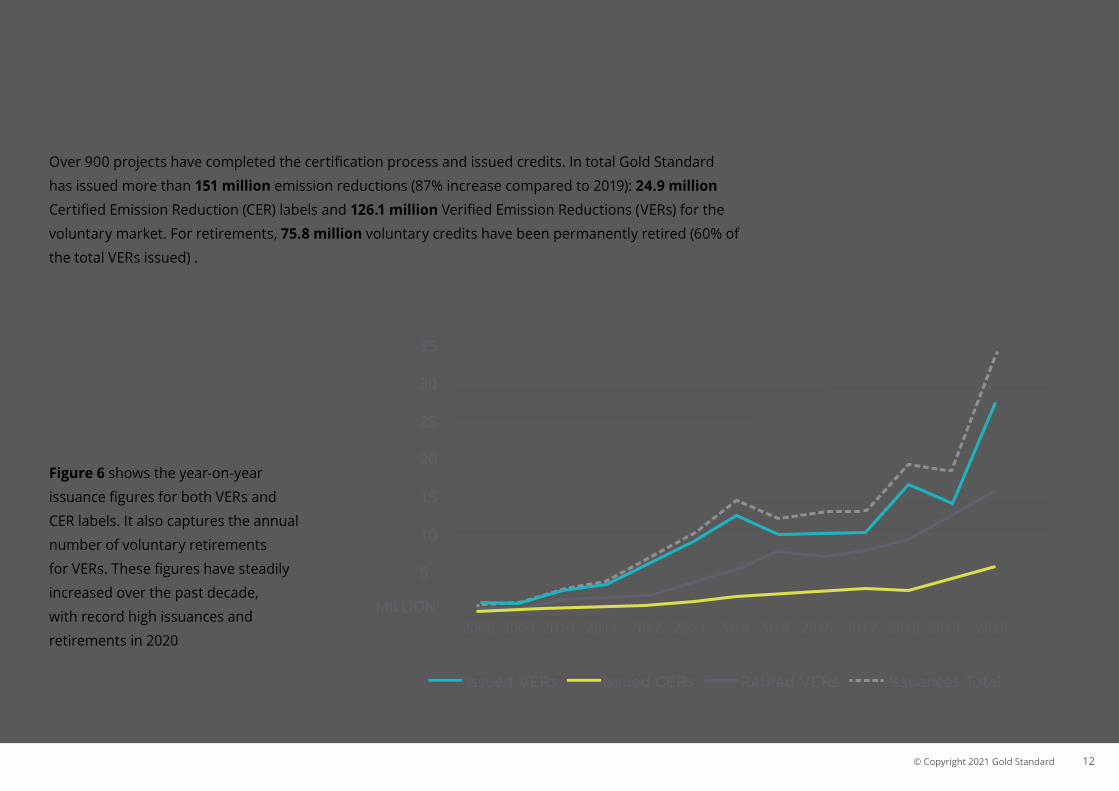
Annual trends
Over 900 projects have completed the certification process and issued credits. In total Gold Standard has issued more than 151 million emission reductions (87% increase compared to 2019): 24.9 million Certified Emission Reduction (CER) labels and 126.1 million Verified Emission Reductions (VERs) for the voluntary market. For retirements, 75.8 million voluntary credits have been permanently retired (60% of the total VERs issued) .
Figure 6 shows the year-on-year issuance figures for both VERs and CER labels. It also captures the annual number of voluntary retirements for VERs. These figures have steadily increased over the past decade, with record high issuances and retirements in 2020
35
30
25
20
15
10
5
2008 2009 2010 2011 2012 2013 2014 2015 2016 2017 2018 2019 2020 MILLION
Issued VERs Issued CERs Retired VERs Issuances Total

13© Copyright 2021 Gold Standard
market report 2020
Shared value delivered
total number of emissions reducedvalue created by sdg for 1 emission reductiontotal value created (in us dollars)
project type
Using the findings from the Vivid Economic report Valuating the benefits of improved cooking solutions and the Net Balance report The Real Value of Robust Climate Action, at the end of December 2020 our issued projects have created nearly 23.5 billion US dollars of value in benefits beyond carbon (see Figure 6). This calculation considers only those project types studied within the report (e.g. household biogas, cookstove, water purification, wind and forestry (A/R) projects). It covers both the voluntary (VERs) and the compliance market (CER labels), and accounts for just over 70% of our issued portfolio.
figure 7 – Total value created by the additional environmental + socio-economic benefits delivered by a Gold Standard certified project.
$4 $161 $199 $101 › $465 Biogas
$1 $117 $65 › $183 Safe Water supply
$9 $84 $63 $111 › $267 Cookstoves
$19 $2 $65 › $86 Wind
$150 $27 $65 › $242 Forestry (A/R)
› $6.8 B
› $2.0 B
› $9.5 B
› $4.2 B
› $0.8 B
Bio
div
ers
ity
Bala
nce
o
f P
aym
en
ts
Em
plo
ym
en
t
Liv
elih
oo
d
He
alt
h
Imp
acts
Clim
ate
A
cti
on

14© Copyright 2021 Gold Standard
market report 2020
Shared value delivered - year on years comparaison
Gold Standard certified projects have created $23.5 BILLION dollars in shared value for climate action + sustainable development.
figure 8 - shows how much shared value projects are delivering year-on-year`.
› $5.8 B
› $3.2 B
› $3.6 B
› $2.0 B
› $2.3 B
› $1.6 B

15© Copyright 2021 Gold Standard
market report 2020
Domestic markets schemes
emissions reductions eligible for corsia
TOTAL
51.3 M
48.2 M
14.3 M
1.3 M
115.2 M
CORSIA
In 2016, the Assembly of the International Civil Aviation Organization (ICAO) established the Carbon Offsetting and Reduction Scheme for International Aviation (CORSIA) to help achieve its aspirational goal of carbon-neutral growth starting in 2021. Under the CORSIA, airplane operators will be required to purchase eligible emissions units to meet their carbon offsetting requirements. Credits from Gold Standard and five other standards will be eligible for CORSIA for the pilot phase 2021-2023. This creates a great opportunity for Gold Standard projects. The below highlights the number of issued credits eligible for CORSIA.
Approximately 115M issued credits eligible for CORSIA from over 300 projects.

16© Copyright 2021 Gold Standard
market report 2020
credits for south africa
TOTAL
credits for colobmia
TOTAL
10'355
227'638
835'818
237'993 903'563
67'745
credits availale from south africa credits availale from colombia
SOUTH AFRICA
In June 2019, South Africa’s Carbon Tax Act went into effect to help the country meet its climate commitments under the Paris Agreement. The South Africa carbon tax will drive reductions in greenhouse gas (GHG) emissions across the economy. It includes an offset component to drive investment directly into emission reduction and/or removal activities throughout South Africa.
To date, there are 18 South African projects certified to Gold Standard
COLOMBIA
In December 2016, as part of an overall tax reform package, Colombia approved a tax on fossil fuels (Part IX, Impuesto Nacional al Carbono) equivalent to approximately US$5/tCO2e payable by producers and importers of fuels. It also allows high-quality carbon credits to be used against the new carbon tax. Unlike other proposals, where the use of carbon credits is limited, Colombia allows entities to offset 100% of their tax liability, which provides great incentives for projects generating credible GHG emission reductions. In total, 174'000 Colombian based carbon credits have been retired against this initiative.
17© Copyright 2021 Gold Standard
In 2020, Gold Standard issued credits for 34 million emission reductions – the equivalent of taking 7.4 million cars off the road for an entire year.
Gold Standard
A closer look at 2020

18© Copyright 2021 Gold Standard
market report 2020
A closer look at 2020
Quarterly issuances and retirements for 2020
› 2020 › Q1 › Q2 › Q3 › Q4 › TOTAL 2020 › TOTAL 2019 › TOTAL
Issuance of CERs (compliance market)
› 2.2 M
› 0.3 M › 2.0 M › 1.0 M › 5.6 M
+29% › 4.3 M › 24.9 M
Issuance of VERs (voluntary market) › 6.5 M › 8 M › 5.8 M › 8.2 M › 28.5 M
+105% › 13.9 M › 126.1 M
TOTAL ISSUANCES › 8.7 M › 8.4 M › 7.8 M › 9.2 M › 34 M
+87% › 18.2 M › 151 M
VERs+CERs retirements
› 3.9 M › 4.2 M › 2.9 M › 4.8 M › 15.8 M
+28% › 12.3 M › 75.8 M
Shared value › 1.9 B › $1.6 B › $1.2 B › $1.1 B › $5.8 B
+75% › $3.2 B › $23.5 B
Prepared by Claire Willers and Ema Cima
We hope you find this data of value.
We would like to evolve and improve this report over time and welcome your comments or suggestions.
Please send any feedback to [email protected]
For previous versions of this report, please visit our publications page.
+41 (0) 22 788 7080
@goldstandard
International Environment House 2
Chemin de Balexert 7-9
1219 Châtelaine - Switzerland


