232 FAMILY INSTAB IL I TY AND PATHWAYS TO ADULTHOOD I N CAPE TOWN
I use these pathways to investigate how family instability in childhood is
associated with the manner in which young people experience the transition
to adulthood. High levels of adult labor migration, union volatility, and HIV/
AIDS–related morbidity and mortality have produced instability in parentalco-residence for many young people in South Africa in recent decades. To
date, research has focused on links between static measures of family structure
and child wellbeing. A substantial literature in the United States indicates that
changes in family circumstances produce stresses for young people, and needs
for adjustment, that are distinct from family structure itself (Brown 2010;
Cavanagh and Huston 2006; Fomby and Cherlin 2007; Wu 1996). Several
recent studies suggest that family instability may also have strong independent
associations with individual measures of adolescent wellbeing in sub-Saharan
Africa (Goldberg 2013; Marteleto et al. 2012). Use of life pathways may pro-vide a more complete understanding of the influence of family instability on
the way young people’s lives unfold during the transition to adulthood.
Transition to adulthood in South Africa
Several distinct features characterize the transition to adulthood in South Af-
rica. First, educational attainment is among the highest in sub-Saharan Africa,
with virtually no differences by sex (Anderson, Case, and Lam 2001; Statistics
South Africa 2005). School fees and continuing residential segregation in the
post-apartheid era, however, perpetuate inequalities among schools (Lam,
Ardington, and Leibbrandt 2011; Lemon and Battersby-Lennard 2009), and
large racial differences remain in children’s progress through school and
their ultimate educational attainment (Anderson et al. 2001; Ardington et al.
2011; Lam, Ardington, and Leibbrandt 2011). For example, in a study in Cape
Town, 82 percent of white students in grades 8 and 9 in 2002 successfully
advanced three grades by 2005, compared to 34 percent of Coloured (mixed-
race) students and 27 percent of African students (Ardington et al. 2011; Lam
et al. 2011).1 Although African young people experienced higher levels of
grade repetition than Coloured youth, they were more likely to remain insecondary school (ibid.).
Second, unemployment rates are high among young people in South
Africa and vary greatly by race. Census data from 2001 indicate that 38 per-
cent of African and 29 percent of Coloured young people aged 20–24 were
unemployed, compared with 8 percent of whites of the same ages (Statistics
South Africa 2005). Lam and colleagues (2011) suggested that the limited
labor market opportunities for African youth, driven in part by continuing
spatial segregation, may help explain their relatively high secondary school
enrollment.With regard to family formation, marriage rates in South Africa are low,
particularly among Africans, and have declined post-apartheid (Hosegood,
McGrath, and Moultrie 2009; Posel, Rudwick, and Casale 2011). Women and
men who marry do so late, particularly when compared to their counterparts
elsewhere in sub-Saharan Africa (Garenne 2004). The median age at first
marriage for women aged 25–49 in South Africa is 27 years (Departmentof Health, Medical Research Council, and ORC Macro 2007). Census data
indicate that 61 percent and 75 percent of 25–29-year-old African women
and men, respectively, were never married in 2001, compared to 49 percent
and 58 percent of Coloured women and men, and 27 percent and 44 percent
of white women and men (Statistics South Africa 2005). In contrast to other
parts of the world, declines in marriage in South Africa have not been accom-
panied by a pronounced transition toward nonmarital cohabitation (Hose-
good, McGrath, and Moultrie 2009; Posel, Rudwick, and Casale 2011).
Finally, rates of fertility among young people are very high in SouthAfrica despite low overall fertility, particularly in the African population
(Moultrie and Dorrington 2004). In 2001, 31 percent of 19-year-old women
had borne at least one child (Statistics South Africa 2005). Given the late age
at first marriage in the country, most of this childbearing is nonmarital. In
contrast to some other sub-Saharan countries, South African schoolgirls who
become pregnant are not expelled and are allowed to return to school after
giving birth (Kaufman, de Wet, and Stadler 2001). It is not uncommon for
girls to attend school after becoming mothers (Madhavan and Thomas 2005;
Marteleto, Lam, and Ranchhod 2008).
Family life in South Africa
Young people’s experiences of family life in South Africa have been shaped by
a combination of political, social, epidemiological, and economic factors. For
example, the policies associated with apartheid fostered the geographic sepa-
ration of family life from places of employment. Under apartheid, a substantial
fraction of the African population was restricted to remote rural reserves from
which the only legal departure was for the purpose of labor migration. Family
members who were not employed had to remain in rural areas, and men andsometimes women were separated from their children for extended periods
(Posel and Casale 2003; Townsend, Madhavan, and Garey 2006). In the post-
apartheid era, patterns of circular labor migration have continued (Posel and
Casale 2003; Townsend, Madhavan, and Garey 2006), accompanied by a rise
in female labor migration (Posel and Casale 2003). Children still rarely ac-
company migrants, owing to the precarious nature of employment, high cost
of living in migrant destinations, and limited accessibility and poor quality
of accommodation at places of employment (Posel and van der Stoep 2008).
The availability of extended kin to provide care and support to children oftenpermits parents to migrate alone for work (Madhavan et al. 2012b; Posel and
234 FAMILY INSTAB IL I TY AND PATHWAYS TO ADULTHOOD I N CAPE TOWN
Marriage trends have also affected young people’s family circumstances.
Because of high levels of nonmarital fertility, many children grow up never
co-residing with their father, although research highlights the long-term social
and financial involvement that many non-co-resident fathers maintain withtheir children (Madhavan, Townsend, and Garey 2008; Madhavan et al. 2012a;
Townsend, Madhavan, and Garey 2006). Divorce has been primarily a white
phenomenon in South Africa, but the proportion of African couples divorcing
has increased over the past decade, with the converse occurring in white fami-
lies (Statistics South Africa 2011a). Divorce is still relatively uncommon among
Coloured couples. Finally, when never-married or divorced mothers form new
unions, children are sometimes sent to live with their father (Madhavan et al.
2012a) or with a maternal grandmother or other kin (Hosegood et al. 2007;
Schatz 2007). South African children are also sometimes sent to live with non-parental caregivers for other reasons, such as to attend a particular school or to
provide help to kin (Hosegood et al. 2007; Madhavan 2004).
Lastly, the HIV/AIDS epidemic has shaped family life in South Africa,
the country with the greatest number of infected individuals in the world
(Republic of South Africa 2010). Estimates from 2011 indicate that over 5
million adults aged 15–49 in South Africa were living with HIV, representing
19 percent of women and 17 percent of men (Statistics South Africa 2011b).
The most extreme way HIV/AIDS affects children’s lives is through the death
of a parent or other caregiver: estimates from 2011 indicated that South Africa
has over 2 million AIDS orphans (ibid.). Additional HIV/AIDS–related family
change can occur when children’s parents or other caregivers are too ill to care
for them or when ill migrants return home for care (Clark et al. 2007).
Childhood family instability and wellbeingduring the transition to adulthood
To investigate the relationship between instability in parental co-residence
and the pathways to adulthood among young people in Cape Town, I build
on a large body of literature on family instability in the United States. In ad-
dition to examining the wellbeing of children in particular family types (e.g.,
two-biological-parent married, single-parent, stepfamily), this literature asks
whether there is something about shifts in parental partnership that dimin-
ishes child wellbeing (Brown 2010; Cavanagh and Huston 2006; Fomby and
Cherlin 2007; Thomson and McLanahan 2012). The theoretical case gener-
ally rests on the idea that changes in a parent’s partnership history produce
stresses affecting parents and children, which may accumulate with each
partnership transition (Osborne and McLanahan 2007).
Family instability is most commonly measured as the number of part-nership transitions experienced by the child’s mother or the number of
transitions experienced by the child in co-residence with parents and their
partners. Family instability is also measured as exposure to a particular fam-
ily type (e.g., a single-mother family) (Magnuson and Berger 2009; Ryan et
al. 2009).
Recent research has extended the family instability perspective to sub-
Saharan Africa. These studies use broad measures to investigate the multiplesources of family instability that coexist in this region, rather than focusing
on a particular source like parental partnership change. Goldberg (2013) pro-
vided evidence from Kenya of a positive relationship between recent caregiver
change and the likelihood of early sexual initiation. Marteleto and colleagues
(2012) found that young people in Cape Town who experienced instability in
co-residence with their mother during childhood and early adolescence were
at higher risk of early sexual initiation and secondary school dropout.
In general, associations between family instability and pathways to
adulthood might be direct, as a function of emotional or financial distresspersisting from the time of family change. Alternatively, family instability
in childhood could set in motion a series of events that are linked to the
timing and sequencing of later transitions. For example, if family instability
is associated with early sexual initiation for a youth, the consequences of
family change could ripple across his or her transition to adulthood through
associations between early sexual initiation and increased risk of unintended
pregnancy or school withdrawal (Biddlecom et al. 2008; Smith 1997).
Pathways to adulthood in Cape Town
I investigate links between family instability and pathways to adulthood
separately for young women and men in Cape Town. Distinguishing between
change in co-residence with mothers and fathers is also important, as prior
literature in the region suggests that children are differentially affected by the
loss or absence of each. For example, research on orphan wellbeing has more
consistently found child disadvantage to be associated with maternal death
rather than paternal death (Beegle, De Weerdt, and Dercon 2010; Case and
Ardington 2006; Evans and Miguel 2007). Explanations include the lower
propensity of maternal orphans to live with a surviving parent (Case, Pax-son, and Ableidinger 2004) and the unique role mothers play in children’s
lives with regard to emotional and/or instrumental support, including as
gatekeepers for children’s schooling (Goldberg and Short 2012; Nyamukapa
and Gregson 2005). Nonetheless, several studies found links between father’s
presence and indicators of child wellbeing such as school progress and
delayed sexual initiation (e.g., Ngom, Magadi, and Omuor 2003; Timaeus
and Boler 2007). In South Africa, Townsend and colleagues (2002) found
gender differences with regard to both parent and child. They showed that
having a father who is away as a migrant benefits the school progress of boysin early adolescence, likely through remittances, although it does not benefit
girls. Conversely, having a migrant mother is detrimental to the completed
236 FAMILY INSTAB IL I TY AND PATHWAYS TO ADULTHOOD I N CAPE TOWN
I anticipate that change in co-residence with mothers during childhood
and early adolescence will be associated with pathways to adulthood consid-
ered disadvantageous, such as premature school departure, early childbearing,
and/or grade repetition. This may be particularly salient for young women.The direction of the effect for change in co-residence with fathers is less easily
anticipated. If migration is a major source of paternal residential instability,
and migration of fathers is beneficial to children, change in co-residence with
fathers may be associated with pathways that involve high levels of completed
schooling, particularly for young men. On the other hand, if separation from
fathers, or paternal death, is associated with lower levels of schooling or early
sexual activity, changes in co-residence with fathers may be associated with
less advantageous pathways to adulthood.
Data, measures, and methods
Data
Investigating the relationship between family instability and pathways to
adulthood requires detailed family histories and complete information on the
timing of key events. My analysis draws on data from the Cape Area Panel
Study (CAPS). CAPS is a longitudinal study of young people in Cape Town,
the second most populous city in South Africa and the provincial capital of
Western Cape. It is the only major city in South Africa to have substantialnumbers of white, Coloured, and African residents, with a 2001 population
that was 32 percent African, 48 percent Coloured, and 19 percent white
(Lam et al. 2008). The sample was stratified on the predominant population
group of the census enumeration area (see Lam et al. 2008 on study design
and sampling).
In the first wave of CAPS in 2002, interviews were conducted with
4,752 young people who were aged 14–22 at the time of the survey. Subse-
quent survey waves occurred in 2003–04, 2005, and 2006. In 2002, histories
on school, work, family formation, and familial co-residence were obtainedfor each year from birth using a life-history calendar. I use a combination of
retrospective reports from this calendar and prospective reports from house-
hold and individual questionnaires at various survey waves. At Wave 4 in
2006, 3,439 adolescents were interviewed. Because initial non-response and
attrition between waves were very high for the small sample of white youth
(N = 249), I exclude them from the analysis.2
Measures
Pathways to adulthood. The pathways to adulthood I identify encompass school,
work, and parenthood. I exclude marital status because only 10 percent of
female and 3 percent of male study participants were ever married by age 22,
consistent with South African marriage trends noted earlier.
To construct the pathways, I use information observed yearly for each
respondent between ages 15 and 22. Young people are considered in schoolat a given age if they were enrolled at any point of the year in “school or any
kind of training program or post-secondary education.” At each age I mea-
sure whether respondents were in primary school, secondary school, tertiary
school, or not in school. For work, I use a broad definition that includes any
full- or part-time employment during the year for money or payment in kind.
Finally, respondents who experienced childbearing are coded as parents for
the age at first parenthood and for all subsequent ages. Unlike school and
work, parenthood is treated as a non-reversible state.
Family instability. The Wave 1 life-history calendar specifies, for eachyear through 2002, whether a respondent co-resided with his or her biological
mother, biological father, a grandparent, and/or other guardian for six months
or longer during the year. I define a transition in parental co-residence to have
occurred when a respondent lived with his or her mother or father for most of
one year, but not the next, or when a respondent did not live with a mother
or father for most of one year but did so in the next. I first create continu-
ous measures of the number of transitions in co-residence with mothers and
fathers through age 14. Because one transition may be qualitatively different
from multiple transitions (Marteleto et al. 2012), I also create categorical mea-sures of whether the respondent experienced no transition in co-residence
with mother/father, one transition, or two or more transitions.
Controls. I include controls for household structure in the first year of life
and household structure at age 14 to isolate the effects of family instability from
the living arrangements in which young people begin life and the particular
family structure in the year before observation of the pathways. From the Wave
1 calendar, I create a four-category measure indicating whether a respondent
lived with both parents (the reference category), a mother but not a father,
grandparents but not parents, or another family structure. The “other” categoryconsists mainly of young people living with neither grandparents nor parents,
but also includes a very small percentage living with fathers but not mothers.
For family structure in the year of birth, I combine the grandparent-only and
“other” categories, since the number living in each category at this life stage is
too small to justify separate categories. I also control for orphan status at age
14, with orphanhood defined as having lost one or both parents.3
I control for socioeconomic status in two ways. First, I create a di-
chotomous measure of childhood economic circumstances by aggregating
responses from a question asking respondents to characterize their family’scircumstances when they were children: comfortable (including “very com-
fortable” or “comfortable”) or not comfortable (including “just getting by,”
238 FAMILY INSTAB IL I TY AND PATHWAYS TO ADULTHOOD I N CAPE TOWN
“poor,” or “very poor”). Second, I create indicators of whether mothers and
fathers completed at least secondary school. Because data on parents’ edu-
cation are missing for a nontrivial proportion of respondents (see Table 1), I
also include dichotomous variables measuring whether data are missing foreach of these variables.4
I measure race as African or Coloured (mixed race). Finally, I also in-
clude age at Wave 1, modeled as a continuous variable, to adjust for the fact
that some reports of transitions were entirely retrospective (i.e., those of
respondents aged 22 at Wave 1), while others were a combination of retro-
spective and prospective reports.
Methods
Latent class analysis. I use latent class cluster analysis to identify the predomi-
nant pathways to adulthood in the study population. Latent class cluster
analysis is used to discover subtypes of related cases using observed data
(Macmillan and Copher 2005). In this analysis, it allows the identification
of latent life paths based on observed categorical data on school, work, and
childbearing. Latent class methods have been used in several recent studies
(e.g., Amato et al. 2008; Macmillan, Billari, and Furstenberg 2012; Macmillan
and Copher 2005; Oesterle et al. 2010) to describe the transition to adulthood
in the United States. I limit the analytic sample to the 898 young women and
715 young men who were aged 18 or older at Wave 1 in 2002 to ensure that
all respondents reached age 22 by Wave 4 in 2006, and I use sample weights
provided by CAPS to adjust for sample design and attrition.5
Multinomial logit models. After conducting latent class analysis, I use mul-
tinomial logit models to examine whether childhood family instability is as-
sociated with the particular pathways to adulthood identified. I assign young
men and women to the pathway from the latent class analysis that they have
the highest probability of following. I employ robust standard errors to adjust
for some clustering of young people within households.
Results
Transition to adulthood
Figure 1 displays the proportion of women and men within each role status
(i.e., student, worker, parent) at each age. Only 6 percent of girls and 4 percent
of boys were not in school at age 15. Secondary school attendance dropped
rapidly for young women and men between ages 16 and 18. Nevertheless,
almost 20 percent of 20-year-olds and about 10 percent of 21-year-olds werestill in secondary school, suggesting nontrivial levels of grade repetition and/
or late entry into primary school. Tertiary school attendance reached a high of
around 12 percent for women and men at age 19. Women were much more
likely than men to have become parents at all ages; by age 22, more than 40
percent of women had given birth. Participation in work increased steadily
with age, with more men than women employed at all ages.
Family instability
Table 1 presents descriptive statistics for the independent variables used in the
regressions. Changes in co-residence with parents during childhood and early
adolescence were common among young people in the CAPS survey. By age 15,
G
G
G
G
G
G
G
G
H
HH H H H H H
B B
B
B
B
B
B
B
F F
F
F F F
F F
É
É
É
É
É
É
É
É
15 16 17 18 19 20 21 22
0
10
20
30
40
50
60
70
80
90
P e r c e n t
Age
GNot inschool
H Primary
B Secondary
F Tertiary
Working
É Ever birth
FIGURE 1 Role statuses for young women and men, age 15 to 22
Women (N = 898)
Men (N = 715)
NOTE: Proportions are based on data weighted to adjust for sample design and for individualnon-response in waves 2, 3, and 4. Sample is limited to African and Coloured respondents.SOURCE: Cape Area Panel Study, 2002–2006.
240 FAMILY INSTAB IL I TY AND PATHWAYS TO ADULTHOOD I N CAPE TOWN
over one-third of young women and men had experienced at least one change
in co-residence with a parent lasting six months or longer. Twenty-one percent
of young people experienced one transition in co-residence with their father
and about 16 percent with their mother. Multiple changes in co-residence were
much less common, with about 4 percent of respondents reporting two or more
paternal transitions and 6 percent reporting multiple maternal transitions.
Supplementary analyses indicate that most single transitions (over 80 percent)
were departures without a subsequent return of the parent.
6
During their first year of life, almost two-thirds of the sample lived with
both parents, and over a quarter resided with a mother but not a father. At
age 14, immediately prior to the start of the life paths, about half lived with
TABLE 1 Characteristics of young women and men (aged 18–22 in 2002) inCape Town, South Africa (percentages unless otherwise noted)
Female Male
Transitions in co-residence with parents lasting 6 monthsor longer (birth to age 14)
Ever experienced transition in co-residence with mother or father 37.2 34.8
1 change in co-residence with mother 17.3 15.5
2+ changes in co-residence with mother 6.7 5.2
Mean number of transitions in co-residence with mother 0.3 0.3
1 change in co-residence with father 20.9 21.1
2+ changes in co-residence with father 3.9 4.2
Mean number of transitions in co-residence with father 0.3 0.3
Household structure in first year of life and at age 14
Both parents in first year 63.2 65.3Mother, no father in first year 27.9 26.2
Other household structure in first year 8.9 8.6
Both parents at age 14 47.9 52.1
Mother, no father at age 14 31.0 30.9
Grandparents, no parents at age 14 7.3 7.3
Other household structure at age 14 13.8 9.7
Other socio-demographic controls
Mean age at time of interview (2002) 19.8 19.9
Coloured 61.8 64.7
Mother’s completed education secondary plus 55.3 57.5Father’s completed education secondary plus 41.7 41.4
Mother’s completed education missing 11.4 12.4
Father’s completed education missing 35.7 33.5
Comfortable economic situation as child 41.4 44.7
Orphaned before age 15 12.3 13.5
No. of respondents 898 715
NOTES: Proportions are based on data weighted to adjust for sample design and for individual non-response in waves 2,3, and 4. Sample is limited to African and Coloured respondents only.SOURCE: Cape Area Panel Study, 2002–2006
both parents. The proportion living with a mother only increased very little.
A larger increase occurred in the percentage living with neither parent, with
7 percent living only with grandparents and 14 percent of girls and 10 percent
of boys living in other arrangements.Finally, about 13 percent of respondents experienced the death of a par-
ent before age 15. Separate analyses indicated that of those who experienced
at least one change in parental co-residence before age 15, 30 percent were
orphans. This suggests that for at least 70 percent of young people, transitions in
parental co-residence were the result of factors other than a parent’s death.
Pathways to adulthood
Figures 2 and 3 display results from the analysis identifying latent pathways toadulthood for women and men, respectively. For women, I used a six-pathway
model, and for men a five-pathway model. I selected these models based on
evaluations of the BIC statistic and classification error, with an eye to achieving
parsimony as well as easily defined and unique classes. Each pathway has its
own graph, with the y-axes representing the estimated probability of being in
a given social role at a given age for that path. The estimated population preva-
lence of each pathway is given in parentheses next to the graph title.
An estimated 25 percent of the female sample followed a pathway to
adulthood labeled secondary school to work. In this path, the probability of being
in secondary school is around 1.0 at age 15 and begins to decline between ages
16 and 17. The worker role predominates beginning at age 18. By age 22, the
probability of working is 0.9. The likelihood of being in tertiary education and
of having given birth is low across all ages. A smaller proportion of women (9
percent) is estimated to follow the pathway of tertiary school . What distinguishes
this pathway from the secondary school to work path is that the likelihood of be-
ing in tertiary school increases rapidly beginning at age 17 and becomes the
dominant role soon after. The likelihood of working at some point in the year
is also nontrivial in this path, reaching almost 0.5 by age 22.
The third pathway to adulthood, labeled secondary school through early 20s,is one of protracted enrollment in secondary school, likely a result of grade
repetition and/or late starting age. This pathway characterizes an estimated
20 percent of the female sample. The probability of being in primary school
is 0.3 at age 15. At age 21, the probability of still being in secondary school
is 0.4. The probabilities of tertiary school, work, and motherhood are all low
across this life path.
In the early school departure to underemployment path, the out-of-school role
status overtakes the secondary school status at age 16, suggesting an earlier
departure from school than in the secondary school to work pathway. In addition,the probability of work remains low through age 22, never exceeding 0.4. At
age 20, the likelihood of having given birth begins to increase, reaching 0.4 by
age 22. An estimated 12 percent of young women follow this pathway.7
244 FAMILY INSTAB IL I TY AND PATHWAYS TO ADULTHOOD I N CAPE TOWN
Parenthood dominates the fifth and sixth pathways to adulthood, which
together characterize an estimated 34 percent of women. The key distinction
between the two is the age at which motherhood becomes the dominant role
status. In the early motherhood pathway, the maternal role becomes dominantat age 16. In the motherhood in early adulthood path, the likelihood of giving
birth is low through age 18, with the motherhood role overtaking the other
roles at around age 19. In the early motherhood path, the motherhood role
begins to dominate about a year before the out-of-school role overtakes the
secondary role, suggesting some school-going after childbearing; however,
there is a high likelihood of leaving secondary school before age 17. The
motherhood in early adulthood path reflects a more orderly progression from
completing secondary school to family formation, often with work before
and after the motherhood transition.Among young men, approximately one-quarter of the sample is esti-
mated to follow a secondary school to work pathway in which the work role
begins to dominate at around age 17, slightly before the majority of men
leave secondary school. The likelihood of working reaches 1.0 at age 20. The
probability of being a father is very low throughout this path. The tertiary
school pathway characterizes a high proportion of men (25 percent), but it
differs in substance from the corresponding female pathway. The likelihood
of attending tertiary school, though reaching higher levels in this path than
in any of the others, never exceeds 0.5, and declines substantially from age
20. Beginning at age 19, the worker role dominates.
The secondary school through early 20s and early school departure to under-
employment pathways are similar to the corresponding female paths, charac-
terizing an estimated 21 and 17 percent of males, respectively. In the former
pathway, the probability of being in primary school at age 15, at almost 0.5,
is even higher than in the female path. The secondary school role is occupied
to a similarly late age. The latter pathway differs for young men only in the
very low probabilities of ever being a parent throughout.
The fatherhood role dominates in only one of the male pathways, the
least common of the five. In the fatherhood pathway, the likelihood of beingin secondary school drops below 0.5 between ages 17 and 18. The probability
of having fathered a child begins to increase at age 16 and rises sharply from
18 through 20, reaching 1.0 by age 21. The likelihood of working is relatively
high in this pathway, while the likelihood of being in tertiary school is very
low.
Links between family instability and pathwaysto adulthood
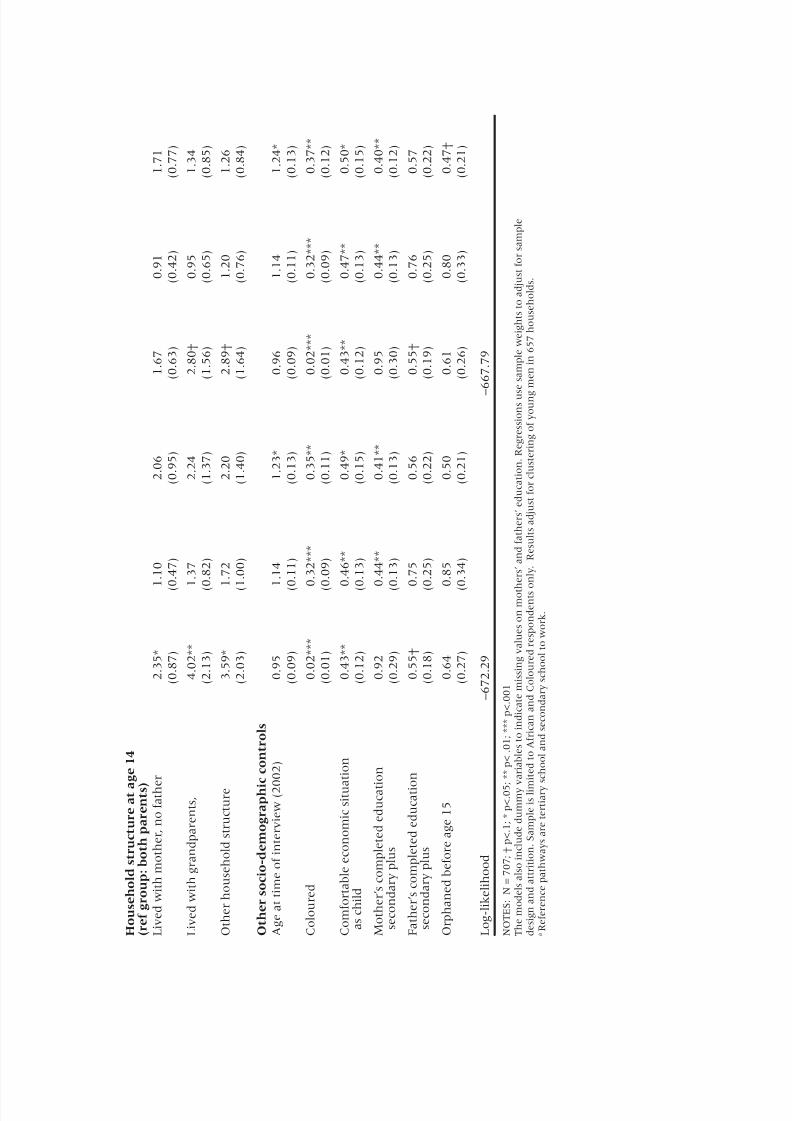
Two Appendix tables provide estimates from multinomial logit models for
young women and men in the form of relative risk ratios. For women and
men separately, I combine the tertiary school and secondary school to work path-
ways to create the reference category for the dependent variable because both
can be considered successful pathways to adulthood in this setting.8 For young
women, I also include the motherhood in early adulthood pathway in the refer-
ence category because this life path is also normative in Cape Town. Usingthese groupings allows me to succinctly compare pathways considered suc-
cessful with pathways that are likely to be associated with adult disadvantage,
without requiring multiple models with different comparison groups.
For women, family instability is consistently associated with a higher
likelihood of following the early motherhood pathway to adulthood, as shown
in Table A.1. Each transition in a woman’s co-residence with her mother in-
creases the likelihood of following the early motherhood pathway by 78 percent
relative to the reference category combining the life paths of tertiary school,
secondary school to work, and motherhood in early adulthood . Both one change andmultiple changes in co-residence with a mother are associated with a roughly
threefold increase in the likelihood of occupying this pathway compared with
not experiencing any change in co-residence with a mother. In addition, a
single change in co-residence with a father doubles the likelihood of experi-
encing the early school departure to underemployment pathway.
With regard to family structure, living in “other” household structures
in the first year of life is associated with a higher likelihood of following the
early school departure to underemployment life path. Living with a mother and
not a father at age 14 is associated with a marginally significant increased
likelihood of entering the early motherhood pathway.
Turning to results for men, presented in Table A.2, each transition in
co-residence with a father before age 15 increases the likelihood of following
the secondary school through early 20s path by 67 percent relative to the category
combining the pathways of tertiary school and secondary school to work. Young
men who experienced one change in co-residence with a father are three
times more likely to follow the secondary school through early 20s pathway than
those with no transitions in co-residence with a father. Experiencing multiple
transitions in living with a father is not statistically different from experienc-
ing none. Finally, there is a doubling of the likelihood of entering the father-hood life path for young men experiencing one change in co-residence with
their father compared to those experiencing no such change.
With regard to household structure, living arrangements in the first year
of life are not significantly associated with young men’s pathways to adult-
hood. Young men who lived in non-intact household structures at age 14 are
more likely than those who lived with both parents to experience the second-
ary school through early 20s life path compared to the reference pathways.9
Finally, orphan status is not independently associated with the life paths
of young women or men. The results for the other socio-demographic controlsunderscore the importance of race and socioeconomic status in determining
the manner in which young women and men experience transitions to adult-
246 FAMILY INSTAB IL I TY AND PATHWAYS TO ADULTHOOD I N CAPE TOWN
Discussion
As a result of epidemiological, economic, political, and social conditions over
recent decades, many young people making the transition to adulthood inSouth Africa at the beginning of the new millennium experienced instability
in family structure during their childhood. In this study, I used longitudinal
data to investigate how childhood instability in co-residence with parents is
associated with the subsequent life paths of young people in Cape Town. I
modeled the transition to adulthood as multi-dimensional pathways, which
allowed me to consider multiple social roles simultaneously and to explicitly
consider the timing and sequencing of role transitions.
The results revealed great diversity in the way young people in Cape
Town experience the transition to adulthood, with no one pathway captur-
ing the experience of more than one quarter of young people. There are five
distinct life paths for the transition to adulthood for men and six for women.
I found that family instability in childhood plays a major role in setting
young people on pathways to adulthood that potentially compromise their
life chances. Compared with young women who did not experience changes
in co-residence with parents before age 15, those who did so were more
likely to follow pathways that included adolescent childbearing, early school
dropout, and underemployment, relative to pathways involving completion
of secondary school, attendance at tertiary institutions, work, and mother-
hood at a later age. Young men who experienced childhood family instabilitywere more likely to follow pathways that included grade repetition and early
fatherhood.
The relationship between family instability and young people’s life
paths differed by sex. Although both young women and young men were
disadvantaged by instability in co-residence with parents, changes in co-
residence with mothers were consistently more salient for the life paths of
young women, and changes in co-residence with fathers for those of young
men. Thus, stability in co-residence with the parent of the same sex appears
to be particularly important. In addition, whereas single and multiple transi-tions in co-residence with mothers were associated with less advantageous
life paths, the same was true of only single transitions in co-residence with
fathers. Single transitions likely reflect mortality, morbidity, or union dissolu-
tion, whereas multiple transitions are more likely to represent circular migra-
tion. The fact that multiple transitions in co-residence with fathers were not
associated with disadvantageous life paths suggests that fathers’ remittances
accompanying labor migration might cancel out any detrimental influence
of instability in co-residence with fathers.
The study has several limitations. The data lacked time-varying informa-
tion on young people’s financial and psychosocial wellbeing, economic and
emotional support from parents and other caregivers, and supervision and
monitoring of youth. Such data could provide further insight into specific
mechanisms through which family change is associated with pathways to
adulthood.10 In addition, information on the specific reason for each family
change would reveal whether certain types of change, such as disruption ofparental union, are more detrimental than others. Finally, the data lacked
retrospective information on household exposure to policies that could poten-
tially mitigate the relationship between family instability and young people’s
life paths. For example, researchers have found associations in South Africa
between indicators of child wellbeing and household receipt of social grants,
such as the old-age pension (Case and Deaton 1998; Duflo 2003) and the
Child Support Grant (Case, Hosegood, and Lund 2005; Richter 2010).11
These limitations notwithstanding, my findings underscore the impor-
tance of considering family instability as a dimension of family context dis-tinct from family structure and orphanhood. In addition, the results provide
evidence that family instability influences not only specific outcomes for
young people, such as the timing of sexual initiation or likelihood of school
dropout, but also the way life paths unfold across multiple life domains. More
generally, the study illustrates the value of a holistic conceptualization of the
O t h e r s o c i o - d e m o g r a p h i c c o n t r o l s
A g e a t t
i m e o f i n t e r v i e w ( 2 0 0 2 )
0 . 9 4
0 . 9 7
1 . 0 4
0 . 9 4
0 . 9 6
1 . 0 5
( 0 . 0 7 )
( 0 . 0 8 )
( 0 . 0 8 )
( 0 . 0 7 )
( 0 . 0 8 )
(
0 . 0 8 )
C o l o u r e
d
0 . 0 6 * * *
0 . 6 9
0 . 5 5 *
0 . 0 6 * * *
0 . 7 1
0 . 5 5 * *
( 0 . 0 1 )
( 0 . 1 7 )
( 0 . 1 3 )
( 0 . 0 2 )
( 0 . 1 8 )
(
0 . 1 3 )
C o m f o r t a b l e e c o n o m i c s i t u a t i o n
0 . 7 1
0 . 3 3
0 . 6 5 †
0 . 7 1
0 . 3 3 * * *
0 . 6 4 †
a s c h i l d
( 0 . 1 6 )
( 0 . 1 0 )
( 0 . 1 5 )
( 0 . 1 6 )
( 0 . 1 0 )
(
0 . 1 5 )
M o t h e r ’ s c o m p l e t e d e d u c a t i o n
0 . 7 3
0 . 6 2 †
0 . 4 2 * * *
0 . 7 3
0 . 6 2 †
0 . 4 2 * * *
s e c o n d
a r y p l u s
( 0 . 1 6 )
( 0 . 1 7 )
( 0 . 1 0 )
( 0 . 1 6 )
( 0 . 1 7 )
( 0 . 1 0 )
F a t h e r ’ s
c o m p l e t e d e d u c a t i o n
0 . 6 1 †
0 . 4 9 *
0 . 7 9
0 . 6 2 †
0 . 4 9 *
0 . 8 0
s e c o n d
a r y p l u s
( 0 . 1 7 )
( 0 . 1 6 )
( 0 . 2 3 )
( 0 . 1 8 )
( 0 . 1 6 )
( 0 . 2 3 )
O r p h a n
e d b e f o r e a g e 1 5
0 . 9 7
1 . 7 9
0 . 7 2
0 . 9 6
1 . 8 0
0 . 7 1
( 0 . 2 9 )
( 0 . 6 8 )
( 0 . 2 3 )
( 0 . 2 9 )
( 0 . 7 0 )
( 0 . 2 2 )
L o g - l i k e
l i h o o d
– 9 1 6 . 1 0
– 9 1 2 . 0 6
N O T E S : N
= 8 8 9 ; † p < . 1 ; * p < . 0 5 ; * * p < . 0 1 ; * * * p < . 0 0 1
T h e m o d e l s a l s o i n c l u d e d u m m y v a r i a b l e s t o i n d i c a t e m i s s i n g v a l u e s o n m o t h e r s ’ a n d f a t h e r s ’ e d u c a t i o n . R e g r e s s i o n s u s e s a m p l e w e i g h t s t o a d j u s t f o r s a m p l e
d e s i g n a n
d a t t r i t i o n . S a m p l e i s l i m i t e d t o A f r i c a n
a n d C o l o u r e d r e s p o n d e n t s o n l y . R e s u l
t s a d j u s t f o r c l u s t e r i n g o f y o u n g w o m e n
i n 8 2 1 h o u s e h o l d s .
a R e f e r e n c e p a t h w a y s a r e t e r t i a r y s c h o o l , s e c o n d a r y s c h o o l t o w o r k , a n d m o t h e r h o o d i n
O t h e r s o c i o - d e m o g r a p h i c c o n t r o l s
A g e a t t
i m e o f i n t e r v i e w ( 2 0 0 2 )
0 . 9 5
1 . 1 4
1 . 2 3 *
0 . 9 6
1 . 1 4
1 . 2 4 *
( 0 . 0 9 )
( 0 . 1 1 )
( 0 . 1 3 )
( 0 . 0 9 )
( 0 . 1 1 )
(
0 . 1 3 )
C o l o u r e
d
0 . 0 2 * * *
0 . 3 2 * * *
0 . 3 5 * *
0 . 0 2 * * *
0 . 3 2 * * *
0 . 3 7 * *
( 0 . 0 1 )
( 0 . 0 9 )
( 0 . 1 1 )
( 0 . 0 1 )
( 0 . 0 9 )
(
0 . 1 2 )
C o m f o r t a b l e e c o n o m i c s i t u a t i o n
0 . 4 3 * *
0 . 4 6 * *
0 . 4 9 *
0 . 4 3 * *
0 . 4 7 * *
0 . 5 0 *
a s c h i l d
( 0 . 1 2 )
( 0 . 1 3 )
( 0 . 1 5 )
( 0 . 1 2 )
( 0 . 1 3 )
(
0 . 1 5 )
M o t h e r ’ s c o m p l e t e d e d u c a t i o n
0 . 9 2
0 . 4 4 * *
0 . 4 1 * *
0 . 9 5
0 . 4 4 * *
0 . 4 0 * *
s e c o n d
a r y p l u s
( 0 . 2 9 )
( 0 . 1 3 )
( 0 . 1 3 )
( 0 . 3 0 )
( 0 . 1 3 )
( 0 . 1 2 )
F a t h e r ’ s
c o m p l e t e d e d u c a t i o n
0 . 5 5 †
0 . 7 5
0 . 5 6
0 . 5 5 †
0 . 7 6
0 . 5 7
s e c o n d
a r y p l u s
( 0 . 1 8 )
( 0 . 2 5 )
( 0 . 2 2 )
( 0 . 1 9 )
( 0 . 2 5 )
( 0 . 2 2 )
O r p h a n
e d b e f o r e a g e 1 5
0 . 6 4
0 . 8 5
0 . 5 0
0 . 6 1
0 . 8 0
0 . 4 7 †
( 0 . 2 7 )
( 0 . 3 4 )
( 0 . 2 1 )
( 0 . 2 6 )
( 0 . 3 3 )
( 0 . 2 1 )
L o g - l i k e
l i h o o d
– 6 7 2 . 2 9
– 6 6 7 . 7 9
N O T E S : N = 7 0 7 ; † p < . 1 ; * p < . 0 5 ; * * p < . 0 1 ; * * * p < . 0 0 1
T h e m o d e l s a l s o i n c l u d e d u m m y v a r i a b l e s t o i n d i c a t e m i s s i n g v a l u e s o n m o t h e r s ’ a n d f a t h e r s ’ e d u c a t i o n . R e g r e s s i o n s u s e s a m p l e w e i g h t s t o a d j u s t f o r s a m p l e
d e s i g n a n
d a t t r i t i o n . S a m p l e i s l i m i t e d t o A f r i c a n
a n d C o l o u r e d r e s p o n d e n t s o n l y . R e s u l
t s a d j u s t f o r c l u s t e r i n g o f y o u n g m e n i n
6 5 7 h o u s e h o l d s .
a R e f e r e n c e p a t h w a y s a r e t e r t i a r y s c h o o l a n d s e c o
found that young women living stably in non-intact household structures through age 14
were no more likely than those living stably
with both parents to occupy any of the less
advantageous life paths. These findings under-
score the benefit of stable living arrangements
for young women, regardless of particular
family structure. Young men who lived stably
with a mother and not a father from birth to
age 14 were more likely than those who lived
stably with both parents to occupy the second-
ary school through early 20s pathway relative tothe reference pathways.
10 Data collected prospectively over the
course of childhood and adolescence would
be ideal, given the potential for recall bias. One
potentially valuable source of such data is the
Birth to Twenty Study in Johannesburg (Rich-
ter et al. 2007), particularly if the young people
in the sample (aged 18 at last data release) are
followed into early adulthood. New research
on links between family instability and youth
outcomes in sub-Saharan Africa should also
aim to include more detailed information on
caregivers’ behavior and attributes because
their emotional and physical wellbeing could
affect both their ability to maintain a stablehome environment and the pathways to adult-
hood followed by their children (Fomby and
Cherlin 2007; Goldberg 2013).
11 The Child Support Grant is of limited
relevance to the CAPS study, given that the
grant was introduced in 1998 for children be-
low age 7, at a time when young people in the
CAPS sample were aged 14–18. However, an
important empirical question is whether, giv-
en the expansion of the grant since that time,
linkages between family instability and the lifepaths young people follow have diminished.
This outcome might be expected if one of the
principal drivers of the observed associations is
a decrease in financial wellbeing. With regard
to the old-age pension, although information
on pension receipt over time is not available in
the CAPS, supplementary analyses indicated
that the presence of a grandparent in the
household was not independently associated
with any of the life paths.
References
Amato, Paul R. et al. 2008. “Precursors of young women’s family formation pathways,” Journal
of Marriage and Family 70(December): 1271–1286.
Anderson, Kermyt G., Anne Case, and David Lam. 2001. “Causes and consequences of school-
ing outcomes in South Africa: Evidence from survey data,” Social Dynamics 27: 37–59.
Ardington, Cally, Nicola Branson, David Lam, and Murray Leibbrandt. 2011. “Explaining
the persistence of racial gaps in schooling in South Africa,” African Population Studies 25:
509–542.
Beegle, Kathleen, Joachim De Weerdt, and Stefan Dercon. 2010. “Orphanhood and humancapital destruction: Is there persistence into adulthood?” Demography 47: 163–180.
Biddlecom, Anne, Richard Gregory, Cynthia B. Lloyd, and Barbara S. Mensch. 2008. “Associa-
tions between premarital sex and leaving school in four sub-Saharan African countries,”
Studies in Family Planning 39: 337–350.
Brown, Susan L. 2010. “Marriage and child well-being: Research and policy perspectives,”
Journal of Marriage and Family 72: 1059–1077.
Bzostek, Sharon H. and Audrey N. Beck. 2011. “Familial instability and young children’s physi-
cal health,” Social Science & Medicine 73: 282-292.
Case, Anne and Cally Ardington. 2006. “The impact of parental death on school outcomes:
Longitudinal evidence from South Africa,” Demography 43: 401–420.
Case, Anne and Angus Deaton. 1998. “Large cash transfers to the elderly in South Africa,” The
Economic Journal 108: 1330–1361.Case, Anne, Victoria Hosegood, and Frances Lund. 2005. “The reach and impact of child sup-
port grants: Evidence from KwaZulu-Natal,” Development Southern Africa 22: 467–482.
254 FAMILY INSTAB IL I TY AND PATHWAYS TO ADULTHOOD I N CAPE TOWN
Case, Anne, Christina Paxson, and Joseph Ableidinger. 2004. “Orphans in Africa: Parental
death, poverty, and school enrollment,” Demography 41: 483–508.
Cavanagh, Shannon E. and Aletha C. Huston. 2006. “Family instability and children’s early
problem behavior,” Social Forces 85: 551–581.
Clark, Samuel C., Mark A. Collinson, Kathleen Kahn, Kyle Drullinger, and Stephen M. Toll-man. 2007. “Returning home to die: Circular labour migration and mortality in South
Africa,” Scandinavian Journal of Public Health 35(Supp.): 35–44.
Dariotis, Jacinda K., Joseph H. Pleck, Nan M. Astone, and Freya L. Sonenstein. 2011. “Path-
ways of early fatherhood, marriage, and employment: A latent class growth analysis,”
Demography 48(2): 593–623.
Department of Health, Medical Research Council, and ORC Macro. 2007. South Africa Demo-
graphic and Health Survey 2003. Pretoria: Department of Health.
Dinkelman, Taryn, David Lam, and Murray Leibbrandt. 2007. “Household and community
income, economic shocks, and risky sexual behavior of young adults: Evidence from the
Cape Area Panel Study 2002 and 2005,” AIDS 21(S7): S49–S56.
Duflo, Esther. 2003. “Grandmothers and granddaughters: Old age pensions and intrahouseholdallocation in South Africa,” World Bank Economic Review 17: 1–25.
Elder, Glen H. Jr. 1998. “The life course as development theory,” Child Development 69: 1–12.
Evans, David K. and Edward Miguel. 2007. “Orphans and schooling in Africa: A longitudinal
analysis,” Demography 44: 35–57.
Fomby, Paula and Andrew J. Cherlin. 2007. “Family instability and child well-being,” American
Sociological Review 72: 181–204.
Garenne, Michel. 2004. “Age at marriage and modernization in sub-Saharan Africa,” Southern
African Journal of Demography 9: 59–80.
Goldberg, Rachel E. 2013. “Family instability and early initiation of sexual activity in Western
Kenya,” Demography 50: 725–750.
Goldberg, Rachel E. and Susan E. Short. 2012. “‘The luggage that isn’t theirs is too heavy…’:
Understandings of orphan disadvantage in Lesotho,” Population Research and Policy Review 31: 67–83.
Grant, Monica J. and Frank F. Furstenberg. 2007. “Changes in the transition to adulthood in less
developed countries,” European Journal of Population 23: 415–428.
Hosegood, Victoria, Nuala McGrath, and Tom Moultrie. 2009. “Dispensing with marriage:
Marital and partnership trends in rural KwaZulu-Natal, South Africa 2000–2006,” De-
mographic Research 20: 279–312.
Hosegood, Victoria et al. 2007. “The effects of high HIV prevalence on orphanhood and living
arrangements of children in Malawi, Tanzania, and South Africa,” Population Studies 61:
327–336.
Kaufman, Carol E., Thea de Wet, and Jonathan Stadler. 2001. “Adolescent pregnancy and
parenthood in South Africa,” Studies in Family Planning 32: 147–160.Lam, David, Cally Ardington, and Murray Leibbrandt. 2011. “Schooling as a lottery: Racial
differences in school advancement in urban South Africa,” Journal of Development Econom-
ics 95: 121–136.
Lam, David et al. 2008. The Cape Area Panel Study: A Very Short Introduction to The Integrated Waves
1-2-3-4 Data. University of Cape Town.
Lemon, Anthony and Jane Battersby-Lennard. 2009. “Overcoming the apartheid legacy in
Cape Town schools,” The Geographical Review 99: 517–538.
Macmillan, Ross. 2005. “The structure of the life course: Classic issues and current controver-
sies,” Advances in Life Course Research 9: 3–24.
Macmillan, Ross, Francesco Billari, and Frank Furstenberg. 2012. “Stability and change in the
transition to adulthood: Latent structure analysis of three generations in the National
Longitudinal Surveys,” paper presented at the Annual Meeting of the Population As-sociation of America, San Francisco, CA, 2–6 May.
Macmillan, Ross and Ronda Copher. 2005. “Families in the life course: Interdependency of
roles, role configurations, and pathways,” Journal of Marriage and Family 67: 858–879.
Madhavan, Sangeetha. 2004. “Fosterage patterns in the age of AIDS: Continuity and change,”
Social Science & Medicine 58: 1443–1454.
Madhavan, Sangeetha, Mark C. Gross, Linda Richter, Shane Norris, and Victoria Hosegood.
2012a. “Mothers, kin, and father involvement in urban South Africa,” Maryland Popula-
tion Research Center Working Paper.Madhavan, Sangeetha, Enid Schatz, Samuel Clark, and Mark Collinson. 2012b. “Child mobil-
ity, maternal status, and household composition in rural South Africa,” Demography 49:
699–718.
Madhavan, Sangeetha and Kevin J.A. Thomas. 2005. “Childbearing and schooling: New evi-
dence from South Africa,” Comparative Education Review 49: 452–467.
Madhavan, Sangeetha, Nicholas W. Townsend, and Anita I. Garey. 2008. “‘Absent breadwin-
ners’: Father–child connections and paternal support in rural South Africa,” Journal of
Southern African Studies 34: 647–663.
Magnuson, Katherine and Lawrence M. Berger. 2009. “Family structure states and transitions:
Associations with children’s well-being during middle childhood,” Journal of Marriage and
Family 71: 575–591.Marteleto, Leticia, Shannon Cavanagh, Kate Prickett, and Shelley Clark. 2012. “The importance
of family structures and instability in shaping adolescent transitions to adulthood in South
Africa,” paper presented at the Population Association of America Annual Meeting, San
Francisco, CA, 2–6 May.
Marteleto, Leticia, David Lam, and Vimal Ranchhod. 2008. “Sexual behavior, pregnancy, and
schooling among young people in urban South Africa,” Studies in Family Planning 39:
351–368.
Moultrie, Tom A. and Rob Dorrington. 2004. Estimation of Fertility from the 2001 South Africa
Census Data. Cape Town: Centre for Actuarial Research for Statistics South Africa.
Moultrie, Tom A. and Ian M. Timaeus. 2003. “The South African fertility decline: Evidence from
two censuses and a Demographic Health Survey,” Population Studies 57: 265–283.
Ngom, Pierre, Monica A. Magadi, and Tom Omuor. 2003. “Parental presence and adolescentreproductive health among the Nairobi urban poor,” Journal of Adolescent Health 33:
369–377.
Nyamukapa, Constance and Simon Gregson. 2005. “Extended family’s and women’s roles
in safeguarding orphans’ education in AIDS-afflicted rural Zimbabwe,” Social Science &
Medicine 60: 2155–2167.
Oesterle, Sabrina, J. David Hawkins, Karl G. Hill, and Jennifer A. Bailey. 2010. “Men’s and
women’s pathways to adulthood and their adolescent precursors,” Journal of Marriage
and Family 72: 1436–1453.
Osborne, Cynthia and Sara McLanahan. 2007. “Partnership instability and child well-being,”
Journal of Marriage & Family 69: 1065–1083.
Posel, Dorrit and Daniela Casale. 2003. “What has been happening to internal labour migrationin South Africa, 1993–1999?” The South African Journal of Economics 71: 455 – 479.
Posel, Dorrit, Stephanie Rudwick, and Daniela Casale. 2011. “Is marriage a dying institution in
South Africa? Exploring changes in marriage in the context of ilobolo payments,” Agenda:
Empowering Women for Gender Equity 25: 102–111.
Posel, Dorrit and Gabrielle van der Stoep. 2008. “Co-resident and absent mothers: Mothers
and labour force participation in South Africa,” paper presented at the Annual African
Econometrics Society Conference, Pretoria, South Africa.
Republic of South Africa. 2010. UNGASS Country Progress Report on the Declaration of Commit-
ment on HIV/AIDS. «http://data.unaids.org/pub/Report/2008/south_africa_2008_coun-
try_progress_report_en.pdf».
Richter, Linda. 2010. “Social cash transfers to support children and families affected by HIV/
AIDS,” Vulnerable Children and Youth Studies 5(S1): 81–91.Richter, Linda, Shane Norris, John Pettifor, Derek Yach, and Noel Cameron. 2007. “Cohort
profile: Mandela’s children: The 1990 birth to twenty study in South Africa,” International
256 FAMILY INSTAB IL I TY AND PATHWAYS TO ADULTHOOD I N CAPE TOWN
Rindfuss, Ronald R. 1991. “The young adult years: Diversity, structural change, and fertility,”
Demography 28(4): 493–512.
Rindfuss, Ronald. R., C. Gray Swicegood, and Rachel A. Rosenfield. 1987. “Disorder in the life
course: How common and does it matter?” American Sociological Review 52: 785–801.
Ryan, Suzanne, Kerry Franzetta, Erin Schelar, and Jennifer Manlove. 2009. “Family structurehistory: Links to relationship formation behaviors in young adulthood,” Journal of Mar-
riage and Family 71: 935–953.
Schatz, Enid. 2007. “‘Taking care of my own blood’: Older women’s relationships to their house-
holds in rural South Africa,” Scandinavian Journal of Public Health, 35(S69): 147–154.
Smith, Carolyn A. 1997. “Factors associated with early sexual activity among urban teenag-
ers,” Social Work 42: 334–346.
Statistics South Africa. 2005. Census 2001: Stages in the Life Cycle of South Africans. Pretoria. «http://
C o p y r i g h t o f P o p u l a t i o n & D e v e l o p m e n t R e v i e w i s t h e p r o p e r t y o f W i l e y - B l a c k w e l l a n d i t s
c o n t e n t m a y n o t b e c o p i e d o r e m a i l e d t o m u l t i p l e s i t e s o r p o s t e d t o a l i s t s e r v w i t h o u t t h e
c o p y r i g h t h o l d e r ' s e x p r e s s w r i t t e n p e r m i s s i o n . H o w e v e r , u s e r s m a y p r i n t , d o w n l o a d , o r e m a i l