,\ECOLOGICAL AND TAXONOMIC STUDIES OF '1'IE RUSSULACEAE
AND OTIER ECTOMYCORRHIZAL BASIDIOMYCETE} IN TIE ‘
HIGIPELEVATION FORESTS OF TIE SOUTIERN APPALACHIANS
bv‘ Gerald F. Bills
dissertation submitted to the Faculty of the —
‘ Virginia Polytechnic Institute and State University
in partial fulfillment of the requirements for the degree of
DOCTOR OF PHILOSOPHY
in .
- Botany
APPROVED: ‘
4 ” 6 ·//5*
¤» /4//./ß’”)., '/’*
’ ’— \·—L«
Orson K. Miller, Jr. , Chairman Khidir W. Hilu
6 . A rx ·
e. 2 VÄ' M/u-}
Golde I. Häzman W. Carter JvnsonI
I
1RobertA. Peterson Jzy Stiges K
May 24, 1985
Blackburg, Virginia
ECOLOGICAL AND TAXONOMIC STUDIES OF THE RUSSULACEAE
AND OTHR ECTOMYCORRHIZAL BASIDIOMYCETES IN THEHIGH-ELEVATION FORESTS OF TH SOUTHERN APPALACHIANS
éä n by
Gerald F. Bills
Orson K. Miller, Jr., Chairman
Botany
(ABSTRACT)A
Temperate and boreal fungal floras indicate that species of the
Russulaceae (the genera Rgggglg and Lggtßgjgg) are among the dominant
ectomycorrhizal fungi in forest communities. The contribution of the
Russulaceae to the communities of ectomycorrhizal Basidiomycetes fruiting
in red spruce and adjacent northern hardwood forests in.West Virginia was
evaluated and compared with other ectomycorrhizal Basidiomycetes
occupying the same habitats. The Russulaceae exhibited the greatest
species diversity of any family of ectomycorrhizal fungi fruiting in the
stands studied (44 X of the species in spruce, 39 X of the species in
hardwoods). Species of Lagtagigg and Ryggylg were among the most
productive in both forests.
Species diversity, productivity, and fruiting phenology of all
ectomycorrhizal Basidiomycetes were compared between red spruce and
northern hardwood stands for a 3-year period. Sporocarp numbers and
sporocarp frequency in 384 four mz quadrats in each forest type was used
to estimate productivity. Species richness was greater in hardwoods (36
species) than in spruce (27 species). Nine species were common to both
forests. Most productivity was coneentrated in a few species, while most
species were rare. Speeies·area curves were constructed for both forests.
Fungal species and tree species eomposition in both forests were compared
by principal component analysis.
Fungi in spruce forests were more produetive than in hardwood forests.
Productivity was highly variable among the three seasons studied because
of climatie variability. Sporocarp abundance and frequency wereV
positively correlated with basal area and density of mycorrhizal trees
and were negatively correlated with fern cover in hardwood forersts. .
Fruiting seasons extended from early July to late September or early .
October.
_ Numbers of species fruiting from the same four mz quadrats ranged from
0 to 7 in spruce forests and O to 5 in hardwood forests. Spatial patterns
of sporocarps of major species were eharaeterized by the variance·to-mean
ratio, mean erowding, patehiness, and spatial autocorrelation and were
found to exhiblt highly aggregated, contagious patterns. Interspecific
associations between pairs of major species were measured by 2 ¤ 2
eontingency tables and Cole's index of association.
A taxonomie and geographie survey of Rggsylg and Lggtggjygloeeurring
in both the quantitative study areas and in similar habitats in the
Southern Appalaehians was presented.
I would like to thank Dr. Orson K. Miller, Jr. for his teaching,
guidance, logistic support, and patience during the course of my graduates
studies. Drs. Golde I. Holtzman and W. Carter Johnson provided
indespensible assistance and guidance in the design, execution, and
analysis of the quantitative aspects of this study. The teaching,'
professional guidance, and personal advice of the other members of my
advisory comittee, Drs. Khidir W. Hilu, Robert A. Peterson, and R. Jay _
Stipes is greetly appreciated. The friendship, assistance, suggestions,”_
and logistic support of fellow graduate students, technical staff, and
faculty, past and present, at VPI & SU is also appreciated.
Financial support was provided by a graduate teaching assistantship
from the Department of Biology, VPI & SU. The Jeffress Memorial Trust
provided me with summer support and with a unique opportunity to learn
the higher fungi of Virginia. A Gertrude S. Burlingham Fellowship from
the New York Botanical Garden supported me during the spring of 1984 and
allowed me to study first-hand many of the Russulas and Lactarii described
by G. S. Burlingham, C. H. Peck, H. C. Beardslee, C. H. Keuffman, W. A.
Murrill, and R. Singer.
Finally, my education could not have been completed without moral and
financial support from my family and my wife, Nancy. Many thanks to all.
Acknowledgements iv
TABLE QB SQNIENIS
INTRODUCTION ........................... 1
CHAPTER 1. COMPARISON OF FRUITING OF ECTOMYCORRHIZAL BASIDIOMYCETES
BETWEEN RED SPRUCE AND NORTHERN HARDWOOD FORESTS ........ 4
Introduction ........................... 4
The study areas ......................... 8
Methods and materials ...................... 11
Results ............................. 14
Species diversity ....................... 14
Inter·plot relationships .................... 25
Sporocarp frequency and density ................ 30
Fruiting Phenology ....................... 33
Length of sampling period ................... 36
Discussion ............................ 37
CHAPTER 2. SPATIAL PATTERNS AND INTERSPECIFIC ASSOCIATIONS OF
ECTOMYCORRHIZAL BASIDIOMYCETES IN RED SPRUCE AND HARDWOOD FORESTS 47
Introduction ........................... 47
Methods .................... . ........ 49
Results ............................. 52
Sporocarp patterns ....................... 52
Interspecific associations ................... 60
Discussion ............................ 70
Table of Contents V
CHAPTER 3. SYNOPSIS OF RUSSULA IN THE HIGH-ELEVATION FORESTS OF THE
SOUTHRN APPALACHIANS ...................... 76
Introduction ........................... 76
Synopsis of Russula in the high·elevation forests ........ 79
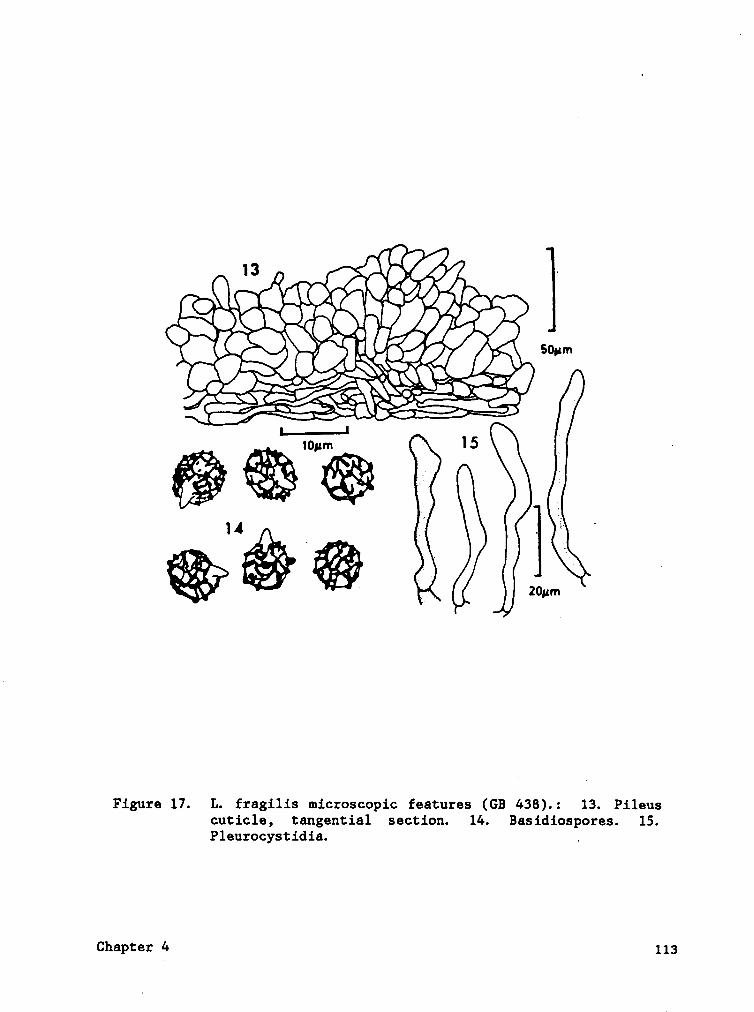
CHAPTER 4. NOTES ON LACTARIUS IN THE HIGH-ELEVATION FORESTS OF THE
SOUTHRN APPALACHIANS ...................... 97
Introduction ........................... 97
Descript ions of taxa .......................98
CHAPTER 5. DISTRIBUTION OF LACTARIUS IN THE HIGH-ELEVATION FORESTS
OF THE SOUTHRN APPALACHIANS ................. 118
Introduction .......................... 118
Habitats and distribution ................... 121
Discussion ........................... 124
APPENDIX A. LOCATION OF SPRUCE AND HARDWOOD PLOTS, POCAHONTAS CO.,
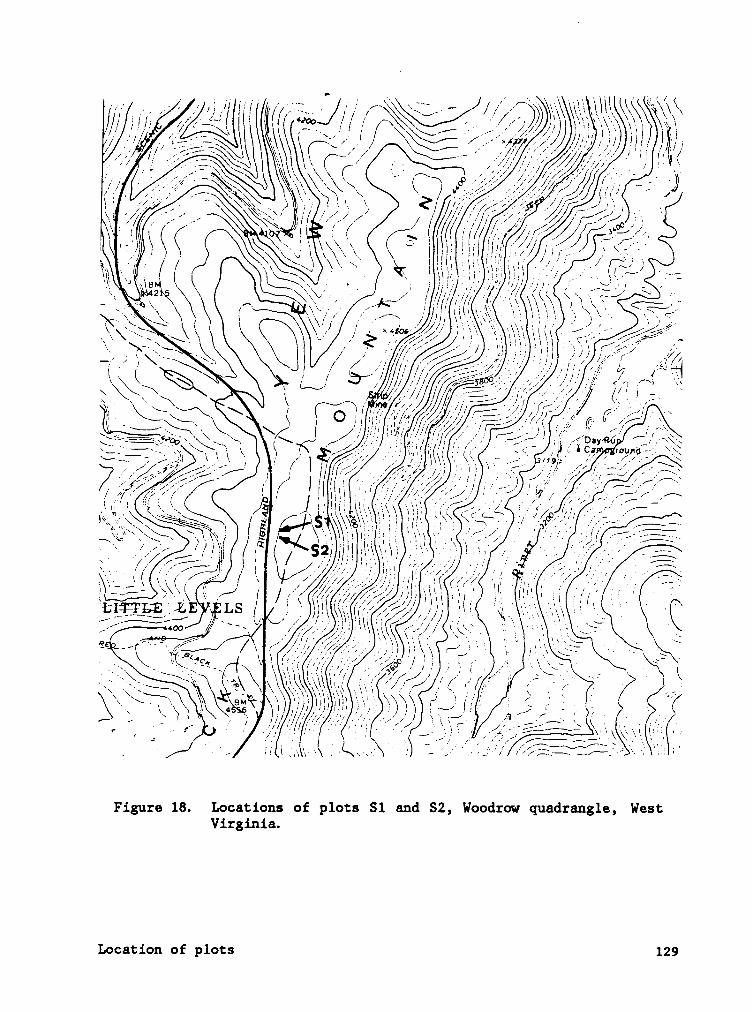
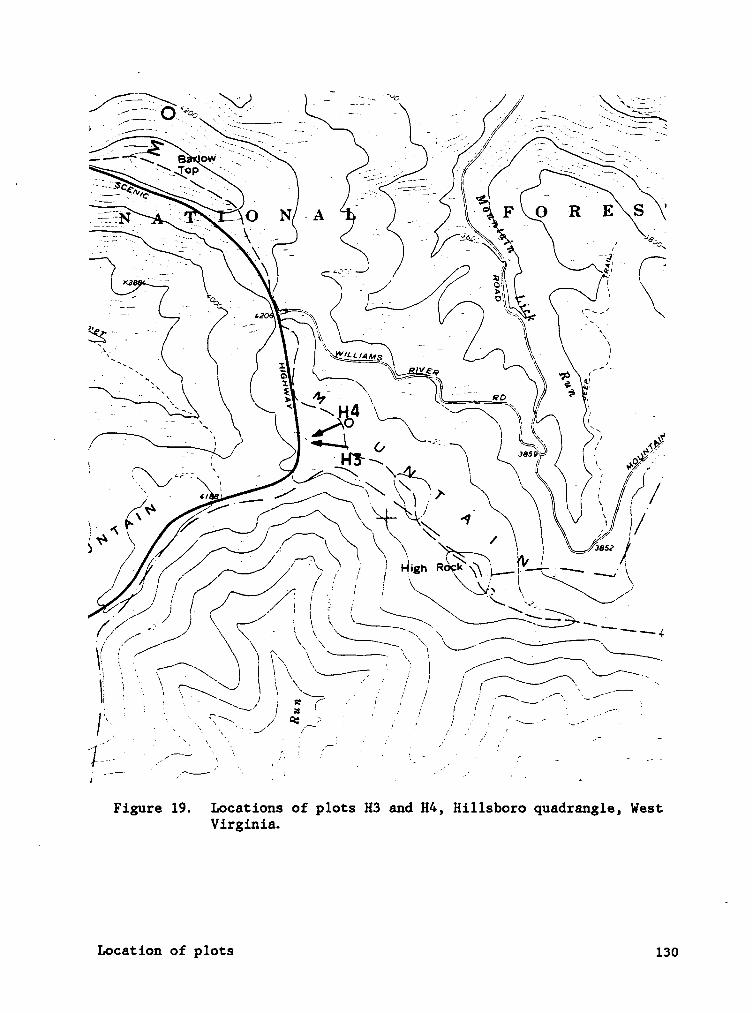
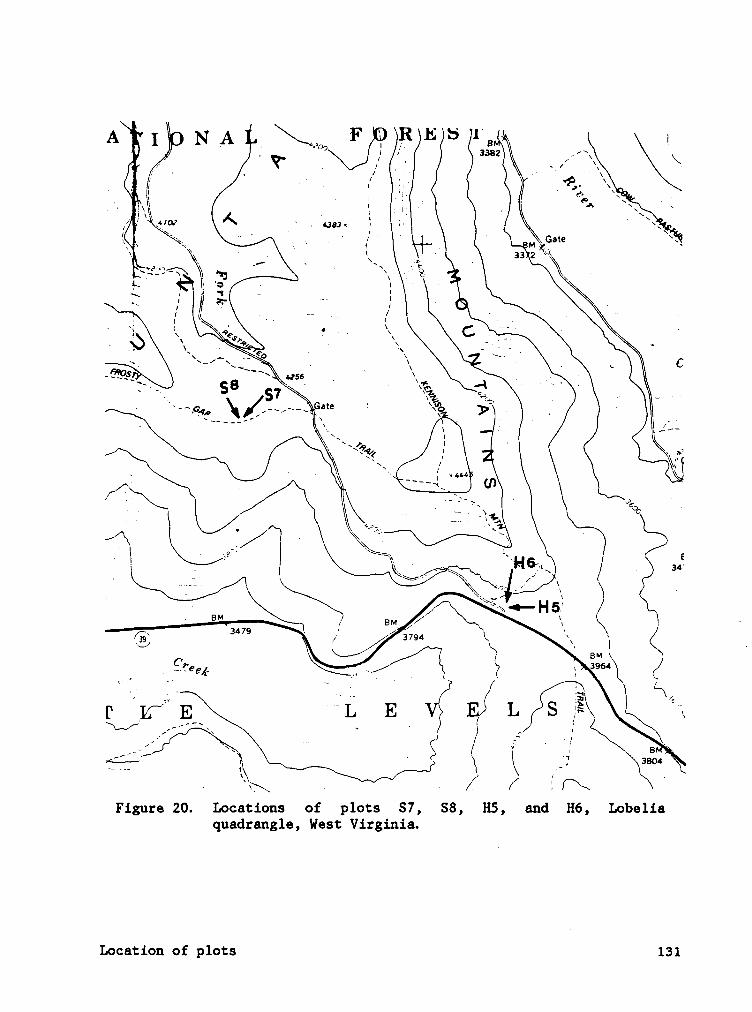
WEST VIRGINIA. ........................ 128
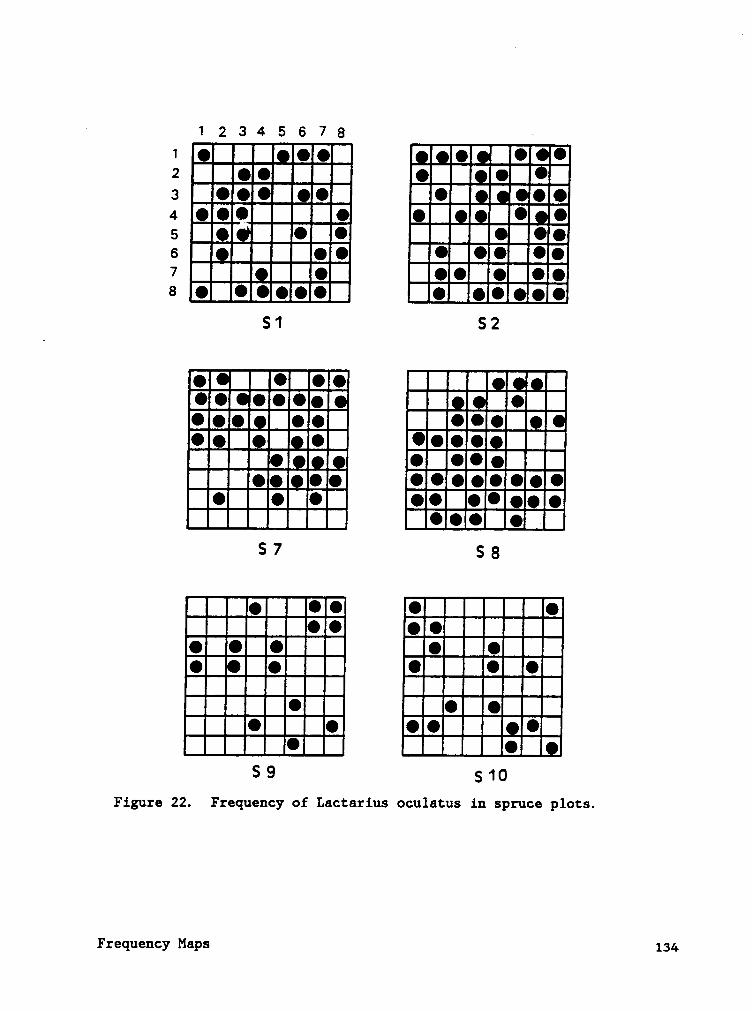
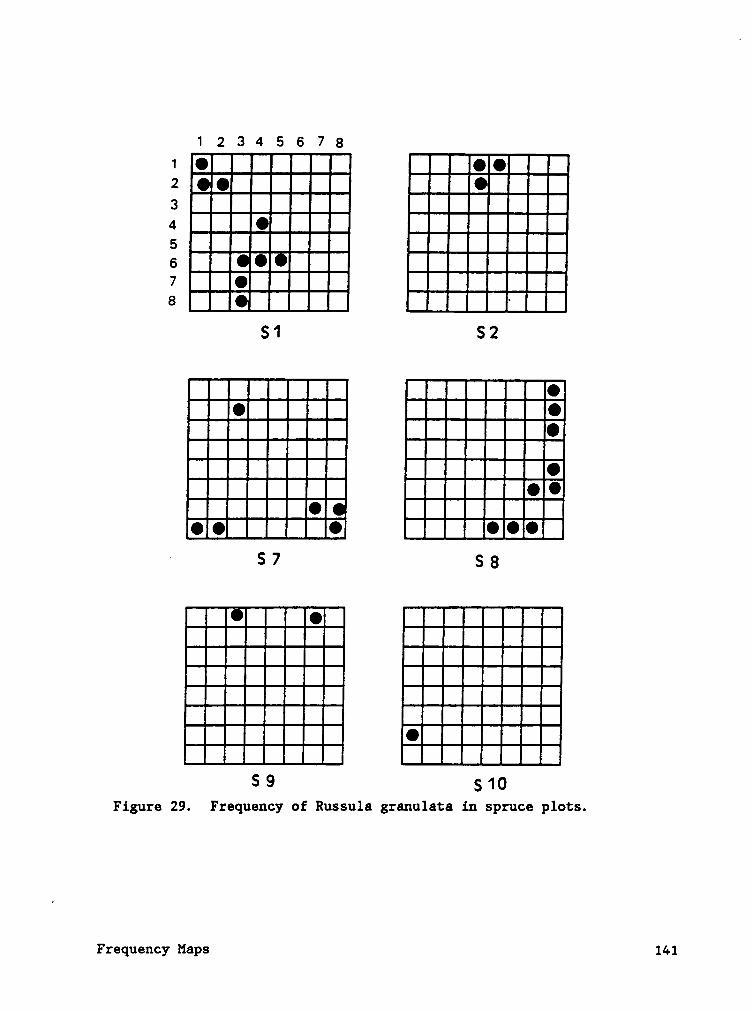
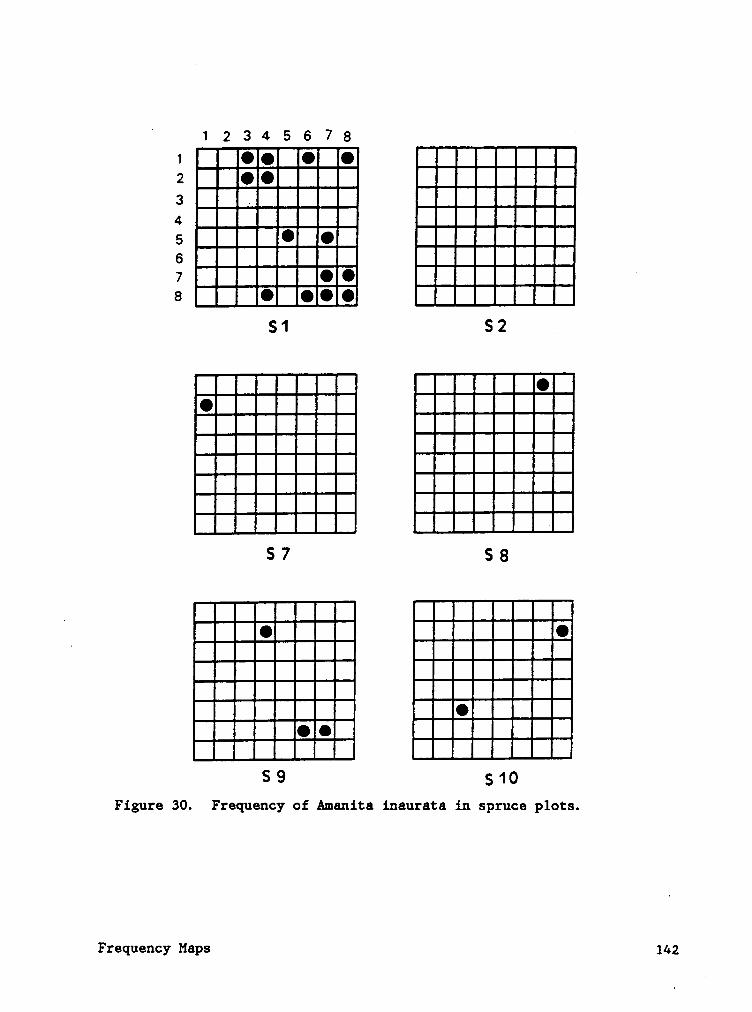
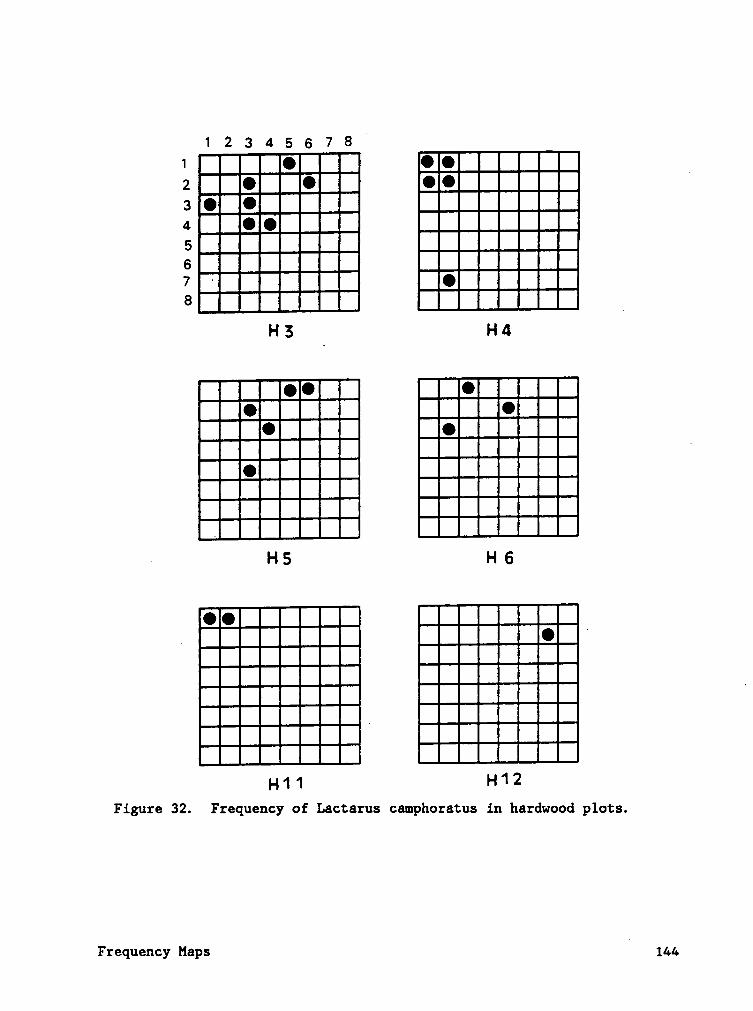
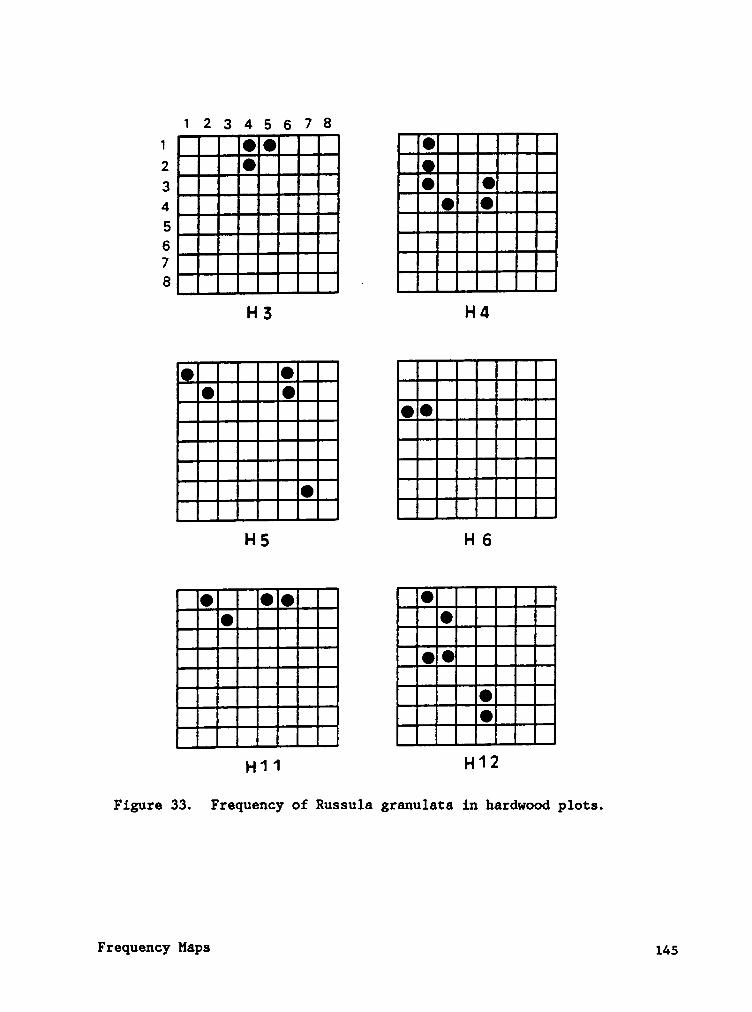
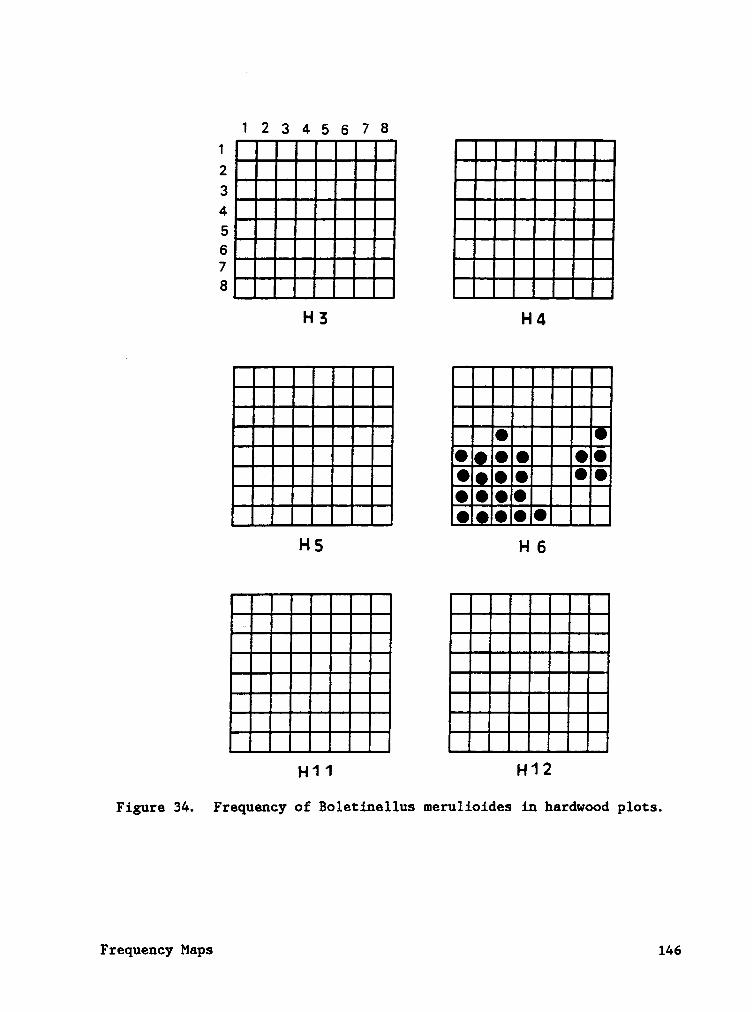
APPENDIX B. FREQUENCY MAPS OF MAJOR SPRUCE AND HARDWOOD
BASIDIOMYCETES. ........................ 133
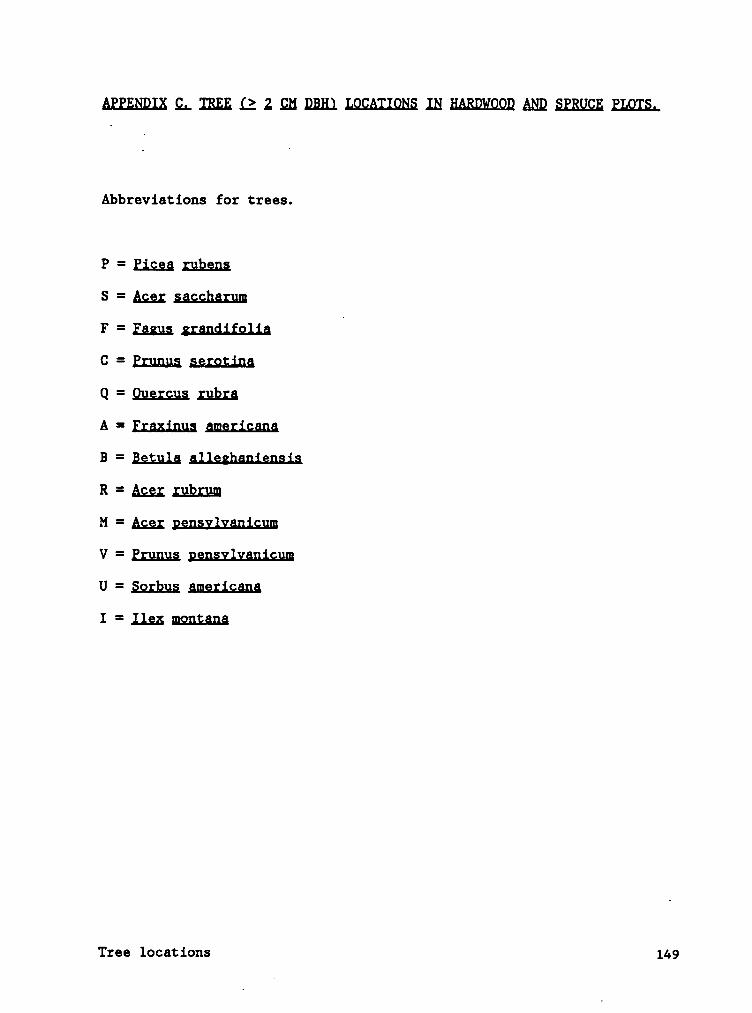
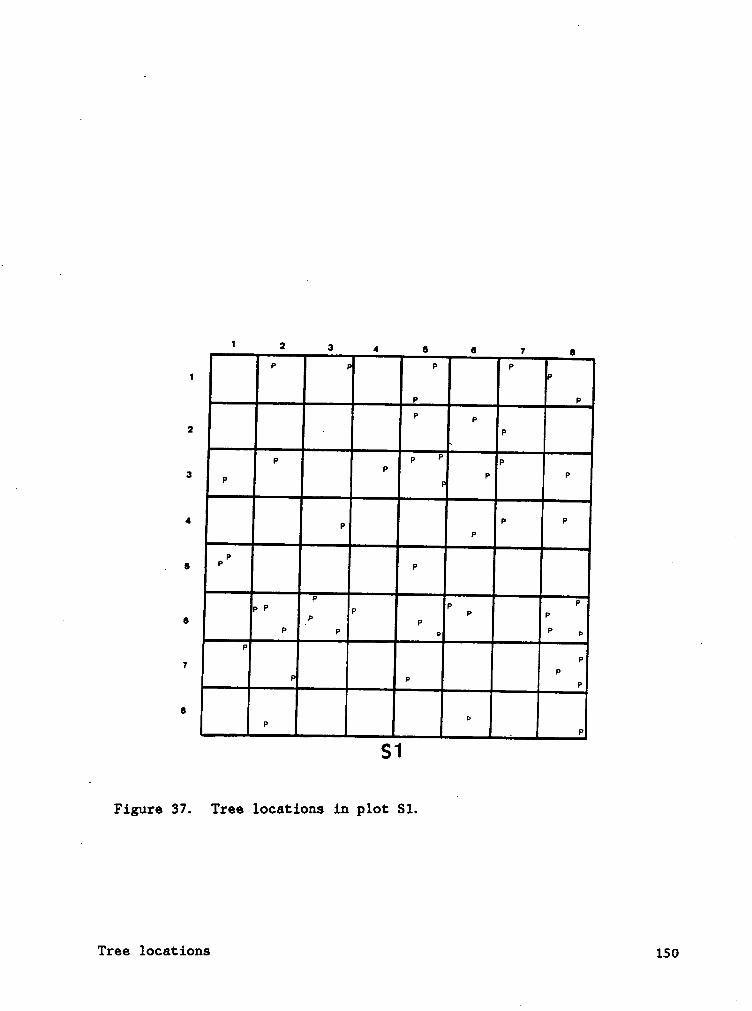
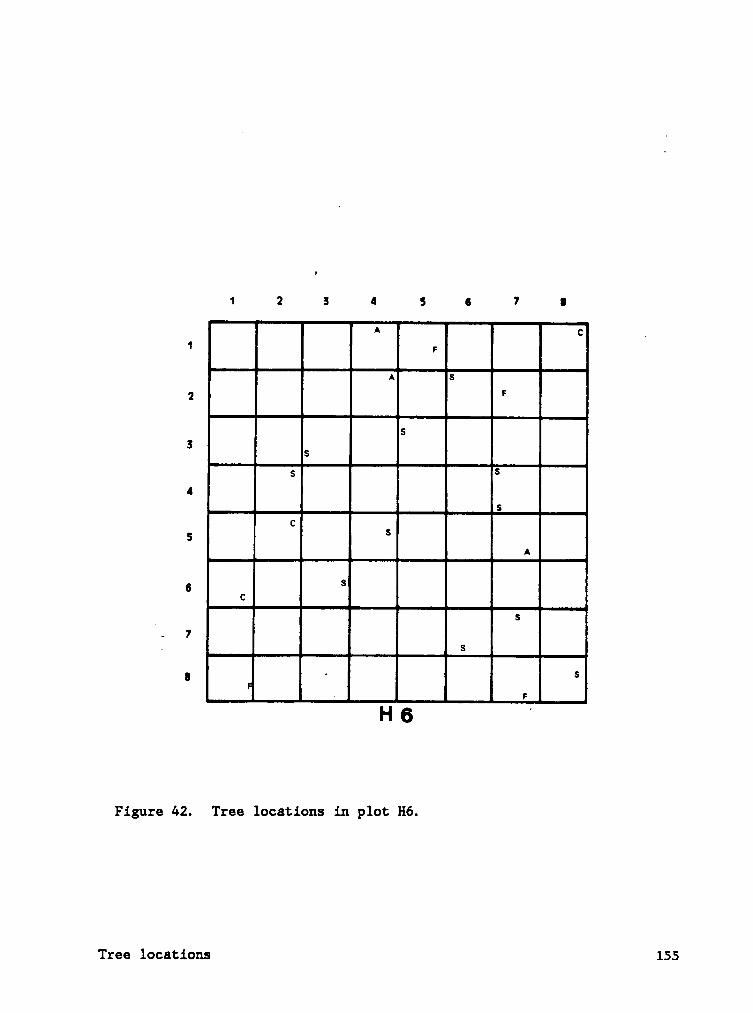
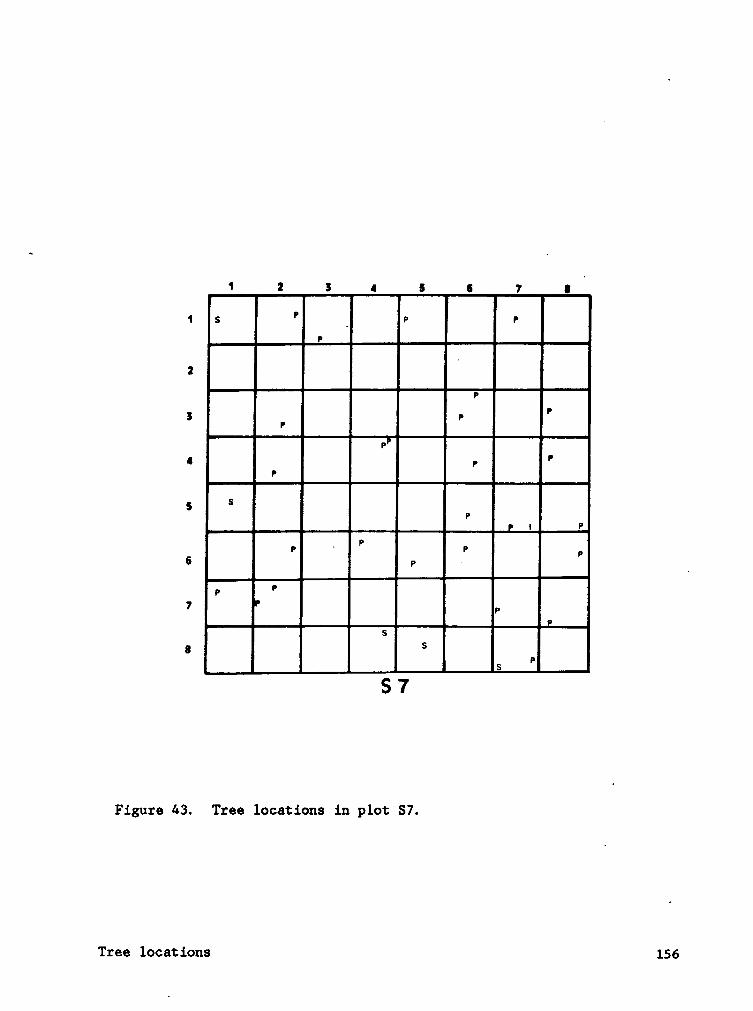
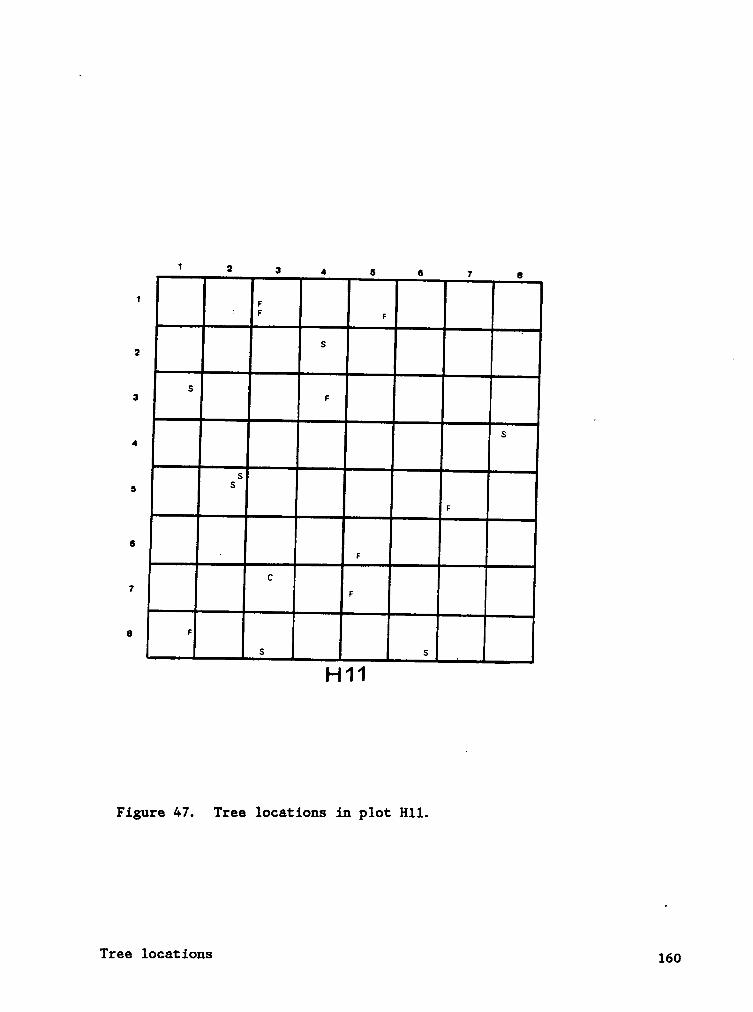
APPENDIX C. TREE (> 2 CM DBH) LOCATIONS IN HARDWOOD AND SPRUCE PLOTS. 149
APPENDIX D. RAW DATA 1981-83. ................. 162
Table of Contents Vi
BIBLIOGRAPHY .......................... 163
BIBLIOGRAPHY .......................... 164
VITA 173
Table of Contents v;|_;|_
LI§IQEFigure1. Red spruce and northern hardwood transition zone on thesouth end of Gauley Mt., Webster Co., West Virginia. . 6
Figure 2. Dominance·diversity curve for spruce ( ¤ ) and hardwood (u ) plots. ...................... 17
Figure 3. Species-area curve for spruce ( A ) and hardwood ( 0 )plots. ........................ 23
Figure 4. Ordination of spruce ( 0 ) and hardwood ( • ) plots byfungal frequency. ................... 29
Figure S. Ordination of spruce ( 0 ) and hardwood ( • ) plots by treebasal areas. ..................... 31
Figure 6. Sporocarp phenology of all species in hardwood and spruceplots. ........................ 39
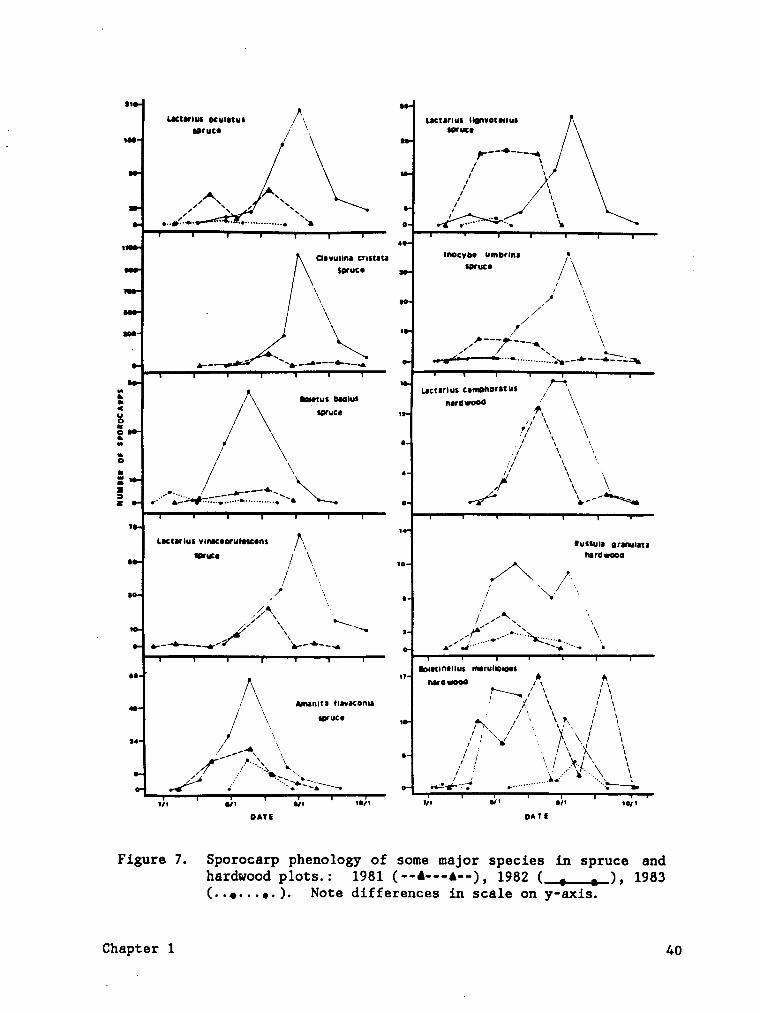
Figure 7. Sporocarp phenology of some major species in spruce andhardwood plots. .................... 40
Figure 8. Log10 V/m ratio of major species in spruce forests. . . S4
Figure 9. Mean crowding of major species in spruce forests. . . . 55
Figure 10. Patchiness of major species in spruce forests. .... 56
Figure 11. Log10 V/m ratio of major species in hardwood forests. . 57
Figure 12. Mean crowding of major species in hardwood forests. . . S8
Figure 13. Patchiness of major species in hardwood forests. . . . 59
Figure 14. Lactarius sporocarps. ..... . ........... 99
Figure 15. L. lignyotellus microscopic features (GB 161). . . . 101
Figure 16. L. oculatus microscopic features(GB S10). ...... 107
Figure 17. L. fragilis microscopic features (GB 438). ..... 113
Figure 18. Locations of plots S1 and S2, Woodrow quadrangle, WestVirginia. ...................... 129
lFigure 19. Locations of plots H3 and H4, Hillsboro quadrangle, West
Virginia. ................... 130
List of Illustrations viii
Figure 20. Locations of plots S7, S8, H5, and H6, Lobelia quadrangle,West Virginia. ................... 131 ·
Figure 21. Locations ef plots S9, S10, H11, and H12, Lobelia1
quadrangle, West Virginia. ............. 132
Figure 22. Frequency of Lactarius oculatus in spruce plots. . . 134
Figure 23. Frequency of Clavulina cristata in spruce plots. . . 135
Figure 24. Frequency of Lactarius vinaceorufescens in spruce plots. 136
Figure 25. Frequency of Boletus badius in spruce plots. .... 137·
Figure 26. Frequency of Amanita flavaconia in spruce plots. . . 138
Figure 27. Frequency of Lactarius lignyotellus in spruce plots. 139
Figure 28. Frequency of Inocybe umbrina in spruce plots. .... 140
Figure 29. Frequency of Russula granulata in spruce plots. . . . 141
Figure 30. Frequency of Amanita inaurata in spruce plots. . . . 142
Figure 31. Frequency of Lactarus camphoratus in spruce plots. . 143
Figure 32. Frequency of Lactarus camphoratus in hardwood plets. 144
Figure 33. Frequency of Russula granulata in hardwood plots. 4. . 145
Figure 34. Frequency of Boletinellus merulioides in hardwood plots. 146
Figure 35. Frequency of Scleroderma citrinum in hardwood plots. 147 .
Figure 36. Frequency of Laccaria laccata in hardwood plots. . . 148
Figure 37. Tree locations in plot S1. ............. 150
Figure 38. Tree locations in plot S2. ............. 151
Figure 39. Tree locations in plot H3. ............. 152
Figure 40. Tree locations in plot H4. ............. 153 _
Figure 41. Tree locations in plot H5. ............. 154
Figure 42. Tree locations in plot H6. ............. 155 .
Figure 43. Tree locations in plot S7. ............. 156
Figure 44. Tree locations in plot S8. ............. 157
List of Illustrations ix
Figure 45. Tree locations in plot S9. ............. 158
Figure 46. Tree locations in plot S10. ............. 159
Figure 47. Tree locations in plot H11. ............. 160
Figure 48. Tree locations in plot H12. .....—........ 161
List of Illustrations x
The main objective of this study was to evaluate the participation of
Russulaceae in the communities of ectomycorrhizal fungi in the
high-elevation spruce and northern hardwood forests of the Southern
Appalachians. The Russulaceae is one of the largest and most common
families of mushrooms with hundreds of species occurring in boreal and
temperate forests. Species of the Russulaceae and other ectomycorrhizal
fungi depend on the composition of the vegetation because they are
nutritionally dependent upon trees of the Pinaceae, Fagaceae, Betulaceae,
Salicaceae, and possibly the Juglandaceae (Trappe, 1962; Miller, 1982).
The Russulaceae are presumed to be among the most important mycorrhizal
symbionts of forest trees because of the abundance and ubiquity of their
sporocarps in forests.
Most knowledge about the composition, productivity, and fruiting
phenology of Basidiomycetes is based on studies of European forests,
grasslands, and tundra. Most of the European studies have been floristic,
however, simply listing species in different vegetation types. Another
group of predominately continental European investigators has applied
association analysis and the Braun-Blanquet method of community sampling,
data reduction, and association nomenclature to macrofungal communities.
American, British, and some Scandanavian researchers have relied on
random sampling methods to obtain quantitative estimates of species
diversity, sporocarp densities, biomass, and sporocarp longevity for
Introduction 1
deseribing and comparing macrofungal eommunities. The last group of
investigations has served as the basic model for my community studies.
In my studies, a descriptive approach has been taken to determine the
components of ecosystems rather than a modelling approach to elucidate
ecosystem processes. An inventory and understanding of the basic
components of an ecosystem are required before the components can be
integrated into a working model.
The higher fungi of the Southern Appalachians have never been the focus
of a community·oriented study. Nearly all the literature on the
Basidiomycetes of this geographie province has been taxonomic. Many
studies have scrutinized taxonomic groups across a broad spectrum of plant
eommunities but rarely presented anything more than cursory data on
fungal-vegetation relationships.
This dissertation is divided into five chapters. The first chapter
describes and compares the ectomycorrhizal Basidiomycete eommunities of
red spruce (including the Russulaceae) and northern hardwood forests in
West Virginia. The fungal species composition, richness, and diversity
are related to the diversity of the dominant trees of both forests
types. Species•area relationships between the forests are compared.
Relative dominance of the fungi is compared by the sporocarp frequencies
and densities. Finally, fruiting phenology is compared between the two
forest types and among the major species.
Introduction 2
In the second chapter, pattern analysis based on quadrat sampling and
the recently developed techniques of spatial autocorrelation are employed
to describe and compare the spatial patterns of sporocarps of the major
species. Also, two questions commonly asked in plant ecological studies
are addressed: "are species distributed randomly" and "are species
associated?"
One of the main reasons fungal ecology remains an underdeveloped branch
of ecology is the taxonomic complexity of fungi. Systematic
specialization and extensive research are often needed to accurately
determine and document the taxa involved. A large effort is directed toU
a rlgorous taxonomic survey of the genera Rggsglg (Chapter 3; Bills and
Miller, 1984; Bills, 1984) and Lggtggjgg (Chapter 4) in the quantitative
study areas and in comparable habitats throughout the region.
Lgggggjgg is a relatively well-known genus taxonomically. In Chapter
S, a comparison of the Lgggggigg flora of the high-elevations of the
Southern Appalachians with those known to occur in boreal forests of
northeastern North America is presented to demonstrate how geographic
distributions and community structure of mycorrhizal fungi in the
Southern Appalachian spruce-fir forests might differ from those in a true
boreal conifer forest.
Introduction3
QHAHIERL.
QEEBLlIIIN§Q£BEIHEENREDSERLLQEANDNQRHIERNHARRWQQDEQREEIS
Community studies of higher fungi have relied largely on quantitative
descriptions of fruiting. The limitations of studying fungal communities
based upon observation of sporocarps have been discussed by Hueck (1953),
Arnolds (1981), and Fogel (1981). Sporocarp productivity has been
estimated in one type of higher plant community (Richardson, 1970; Fogel,
1976) or has been compared among different plant communities (Lange, 1948;
Hering, 1966; Petersen, 1977; Wasterlund and Inglelog, 1981; Arnolds,
1981). Sporocarp presence, frequency, or productivity have been used
alone or in conjunction with the higher plants to compare vegetation
samples (Lange, 1948; Hering, 1966; Petersen, 1977; Arnolds, 1981). The
influence of precipitation and temperature on the phenology and
productivity of fruiting has been investigated to understand the
environmental conditions influencing the physiology of the fruiting
(wilkins and Patrick, 1940; Wilkins and Harris, 1946; Fogel, 1976).
Monitoring sporocarp productivity of different fungal species in a forest
dominated by a single ectomycorrhizal host has indicated possible
ectomycorrhizal associates of the dominant tree (Trappe, 1962;
Richardson, 1970; Fogel, 1976). Observation of the spatial pattern and
relative numbers of sporocarps in permanent reference areas over extended
time periods has elucidated the spatial pattern and relative abundance
Chapter 1 4
of vegetative mycelia in the forest rhizosphere (Last gg gl., 1983;
Newell, 1984; Cotter and Bills, in press).
_ Quantitative studies of macrofungal communities have usually focused
on sporocarp numbers or sporocarp biomass in standard reference areas.
The critical assumption of many of these studies was that the relative
productivity of sporocarps among fungal species in some way reflected
their relative dominance, mycelial biomass, or resource utilization.
Naturally occurring mycelia cannot be delimited in a direct manner, except
in rare cases. Presently there is no basis for correlating sporocarp
biomass or sporocarp numbers with mycelia biomass. However, sporocarp
density is a useful parameter because it can be applied objectively in
any study, and if sampling intervals and methods are comparable, sporocarp
densities can be compared among communities. This parameter is included
in this study to provide continuity with previous investigations. Rather
than emphasizing sporocarp numbers as a measure of mycelial activity, we
estimated the frequency with which sporocarps were present in relatively
small contiguous quadrats. lf the quadrats are small enough, frequency
' can show that sporocarps in widely separated quadrats at one sampling _
time may be part of a single zone of contiguous fruiting when sporocarps
are sampled in quadrats in intermediate positions. Therefore, frequency
provides an estimate of the spatial extent or ubiquity of the fungal
mycelium.
Species concepts of Basidiomycetes are based upon sporocarp
morphology, but rarely on habitat preferences. Statistical relationships
Chapter 1 5
between the distribution of fungal species and their associated higher
Vegetation may refine these concepts. In many "modern" taxonomic
treatments of Basidiomycetes, little attention is devoted to habitat
descriptions. Often fungi are described simply as fruiting "underA
conifers" or "in mixed woods". A species that appears to be "rare" or
is "poorly known" may be common locally in specialized habitats. This
local abundance may not be recognized by conventional collecting methods
but can be detected by periodic, systematic sampling of local communities_
(Arnolds, 1982; Fogel, 1982).
The ectomycorrhizal fungal community of pure red spruce forests was
chosen for study because the fungi could be assumed to form
ectomycorrhizae with only a single host and that niches for
ectomycorrhizal fungi would be limited by the availability of a singleA
tree species. Variations in tree age, root age, root size, litter and
soil depth, etc. could contribute, however, to niche diversification
among fungal species that occupied a similar substrate. To identify
properties of the community and species unique to the red spruce stands
we compared them to surrounding northern hardwood stands (Braun, 1950;
Whittaker, 1956; Core, 1966) of mixed ectomycorrhizal and endomycorrhizal
trees.
No comprehensive source of information on Basidiomycetes associated
with the red spruce forests of eastern North America exists, and few
mycorrhizal associates of red spruce are known (Treppe, 1962; Homola and
Mistretta, 1977). The stands of red spruce in this study are part of the
Chapter 1 7
disjunct southern extension of the boreal coniferous forest. The
structure and floristic composition of the Southern Appalachian and
Allegheny red spruce-Fraser fir-balsam fir forests are similar to those
in New York and New England (Oosting and Billings, 1951; Mclntosh and
Hurley, 1964; Stephenson and Clovis, 1983). Are the Basidiomycetes
associated with red spruce similar throughout its geographical range?
Presently, the only way to answer this question is by examining the
usually incomplete habitat descriptions of Basidiomycetes to determine
whether they were collected in the vicinity of red spruce.
The main objectives of this study were (1) to determine how species
composition, diversity, and density of ectomycorrhizal Basidiomycetes
fruiting in forest stands dominated by a single ectomycorrhizal host tree,
red spruce, differed from those of nearby forest stands of mixed
ectomycorrhizal and endomycorrhizal hardwood trees, (2) to describe the
inter-year variation in fruiting and sporocarp density in both forest
types and to characterize the fruiting phenology of major Basidiomycete
species of both forest types, and (3) to provide a basis for comparing
Basidiomycete communities in similar coniferous and hardwood forests in
eastern North America.
IHE.S§I1ZD.YAREA§
The study areas were located near the eastern edge of the unglaciated
Allegheny Plateau in Pocahontas Co., WV, within the Monongahela National
Chapter 1 8
Forest (boundaries 38° l7° N latitude, 38° 07° N latitude, 80° 22° W
longitude, 80° 12° W longitude). Sites were located on ridge crests
(elev. 1200-1350 m) on shallow, rocky well-drained, sandy-loam or
clay-loam soils. Within the spruce stands, soil pH (n = 23) ranged from
3.3 to 3.8 with an average of 3.5, and soil organic matter content was
12.3 % i 3.6 % S. D. Within the hardwood stands (n = 20), soil pH ranged
from 3.3 to 4.5 with an average of 3.6, and soil organic matter content
was 10.6 % i 3.4 % S. D.
Annual precipitation in the vicinity of the study sites during a
five-year period in 1967-72 ranged from 144 cm/yr to 160 cm/yr (Edens,
1973). Precipitation patterns for each growing season were estimated from
data collected by the U. S. Forest Service, Marlinton, WV, (elev. 650 m)
about 15-20 km west of the study areas (Table 1). Extended periods of
high humidity and fog are partially responsible for the persistance of
red spruce at these southern latitudes (Core, 1966). Frost-free periods
A range from 88 to 145 days (Edens, 1973).
Both spruce and hardwood stands were second-growth (55-75 years old).
Floristically and structurally the spruce stands were similar to stands
described by Stephenson and Clovis (1983). Spruce stands were nearly pure
red spruce with a sparse to dense shrub layer of ygggjgjgg
ggythgggggpgg, suppressed spruce seedlings, and ferns. An extensive
ground cover of bryophytes, especially the leafy liverwort ßgzzggjg
ggilgbgtg (L.) S. F. Gray, was often present. Composition of the hardwood
Chapter 1 9
Table 1. Biweekly summary of average (cm/day) and total (cm) rainfallfor growing seasons of 1981-3 based on U. S. Forest Servicedata, Marlinton, WV.
1981 1982 1983weeks average total average total average total
Jun 1-15 0.53 7.85 0.79 12.01 0.25 3.71
Jun 16-30 0.20 3.00 0.10 1.55 0.23 3.58
Jul 1-15 0.97 14.27 0.54 8.05 0.27 4.04
Jul 16-31 0.48 7.54 0.28 4.45 0.25 3.81
Aug 1-15 0.28 4.29 0.25 3.76 0.12 1.80
Aug 16-31 0.03 0.51 0.25 3.76 0.01 0.10
Sep 1-15 0.71 10.52 0.08 1.09 0.02 0.25
Sep 16-30 0.09 1.40 0.16 2.42 0.20 3.07
total (cm/season) 49.38 40.82 20.37
Chapter 1 1Q
stands are listed in Table 3. Herbaceous plants, including ferns, and
young Age; stems were abundant in the understories of the hardwood stands.
MEIHQQSANDHAIERIALS
This study was conducted during the growing seasons of l98l•3. Twelve
permanent 16 X 16 m (256 mz) plots were established on ridge crests of
three different mountains. On each mountain, two plots were located in
V a spruce forest and two in a hardwood forest (Table 2). Each plot was
subdivided into 64 2 X 2 m (4mz) quadrats.
Spruce plots were selected to exclude as many other woody species as
possible. Hardwood plots were selected to be as physically close to the
spruce plots on the same ridge crest, without including any red spruce.
In each plot, DBH (diameter at breast height) of all stems greater than
two cm was estimated and mapped, and fern, bryophyte, and spruce seedling
cover was estimated. Hardwood plot H3 was destroyed by a survey crew in
the spring of 1983. Sporocarp density and frequency estimates for 1983
were based only ou the five remaining hardwood plots.
Only sporocarps of fungi of families known to form ectomycorrhizae
(Watling, 1982; Miller, 1983) and some whose ecological role is uncertain
me;g1jgjgee, Eggglgge spp., and some Hyg;gphg;ee spp.) were counted.
Litter decomposers (e.g. Qgllyhie, Me;eemig;, or Mygege spp.) or
Chapter 1 11
Table 2. Location, forest type, and plot label.
forest typelocation spruce hardwood
Black Mountain Sl & S2 H3 & H4
Kennison Mountain S7 & S8 H5 8: H6
Rocky Knob S9 & S10 H11 & H12
Chapter 1 12
bryophyte-associated species (e.g. as Qglering spp.) were not counted.
Sporocarps of agarics and boletes were easily defined, but the coral
fungus, Qlgygliga ggistgtg, forms multiple, fused stems. A single
sporocarp of this fungus was defined as a separate stem completely
surrounded by the surface of the litter or the bryophyte layer, although
the stems may have been fused below ground. From examination of records
of sporocarp positions from previous sampling times, it was evident that
nearly all sporocarps deteriorated between sampling periods. Only
sporocarps that were long-lived and could have been counted twice (e.g.
ßglggggggmg gitringm, large Lggggrigg spp.), those needed for
identification, and those needed for Voucher specimens were removed from
the plots. Sporocarp numbers were prcbably underestimated because
sporocarps of fleshy fungi are usually short-lived (Richardson, 1970;
Lacy, 1984) and could have fruited and deteriorated between sampling
times. Representative Voucher specimens of all fungi are deposited at
VPI. Vascular plant nomenclature follows that of Strausbaugh and Core
(1978). Fungal nomenclature is listed in Table 4.
Individual sporocarps were counted within each 2 ¤ 2 quadrat at each
visit. Plots were visited eight to ten times per growing season at 7-
to 17-day intervals with the average time interval between visits 13.1 i
3.2 days S. D. (n = 23).
_ Density is the number of sporocarps per unit of area (either in all
plots of a forest type or in each plot). Frequency is the number of
quadrats in which a species occurred summed over the entire the study.
Chapter 1 13
Percent frequency is the percentage of the total number of quadrats (384)
in each forest type in which a species is present. The total number ofl
quadrats in which a species occurs in any given year is yearly frequency.
Frequency of a species is not the sum of its yearly frequencies.
BE§LJLI§
S.2EQIE§ IZIYERSJIY
Forests with several possible mycorrhizal hosts might have a greater
diversity of fungal associates than a forest composed of a single
mycorrhizal host. Two elements of species diversity are usually
considered, (1) species richness, the number of species, and (2)
equitability, the evenness of the contributions of different species to
the community. Fungal species richness was comparable between both forest
types (Tables 4, 5), but the two forest types exhibited little overlap
in fungal species composition (Tables 4, 7). A total of 54 species was
encountered over the three years, 27 species in the spruce plots, 36 in
the hardwood plots (Table 5). Nine (17 Z) species occurred in both forest
types. The family Russulaceae accounted for more species than any other
family in both forest types, 39 Z of the species in the hardwoods and 44 ‘
Z of the species in spruce. The total number of species occurring only
in one forest type or the other (19 only in spruce, 26 only in hardwoods) _
were not significantly different from what would be expected assuming the
two forest types were equally likely habitats (22.5 in each forest type),
Chapter 1 14
Tab1• 3. Basal ar••s lmz7ha) of tr•• sp•ci•s in spruco and
hardnood plots. Plots ar• ord•r•d from laft to ridut by ascanding _ ‘first principal couponant scoras. $p•ci•s ar• ordorad by dascandingfirst principal couponant scoros from a sp•ci•s ordination.Plot labals ar• indicatad in Tabla 2.
plot”
spacias $7 $2 S8 S10 $9 $1 H6 H5 H11 H12 H4 H3
Picea nbens 53 43 57 46 43 42
Acor saccharuu 4 >1 16 13 35 20 >1 >1
Fagus grandifolia 3 _>1 6 7 15 37Prusus sarotina 16 24 5 5
Quarcus nbra 37Fraxinus amoricana 11 2
Batula alladwaniussis >1 1 2 >1· Acar nbnn 3 >1
Acar pansylvanicuu >1 >1
Pruxus pensylvanicmn >1Sorbus amaricana >1 ’
I1•x montana >1
Total 58 45 57 46 43 42 47 40 48 36 54 38
Chapter 1 15
(Table 5). Likewise, the mean number of species per plot was not
. significantly different between spruce and hardwood plots (Table 5). The
similarity in slopes of the species-area curves, (Fig. 2) also indicated
comparability in species richness, although the initial slope of the
hardwood curve was slightly steeper because of the encounter of more
species in hardwood plots than in spruce plots.
Species equitability was greater in the hardwood plots than the spruce
plots. The Shannon-Wiener index (Shannon and Weaver, 1949), H'= -2 PiV
log2 Pi, was used to compare both species richness and equitability
between both forest types (Table 5). Where Pi is the probability of
sampling the ith species among all species. Shannon-Wiener diversity (H')
was greater for hardwood plots than spruce plots using both sporocarp
frequency and density (Table 5) because of the greater number of species
and greater equitability among species. Equitability or eveness of a
community (J') (Pielou, 1974, p. 300) can be measured directly from the
ratio of the observed species diversity (H') to the maximum value of H'
(H°max) in a completely equal community with the same number of species
(S). Therefore, equitability (J') is given by H'/ log 2 S. As expected,
higher (H') values were obtained using sporocarp density because density
measurements were more equally distributed among species. The
dominance-diversity curve (Greig-Smith, 1983), (Fig. 1) indicated that a
high proportion of the frequency in both forest types was concentrated
in relatively few species, that a high proportion of the species appear
rarely, and equitability was greater among the hardwood species. Greater
Chapter 1 16
III1• El
' "UIo
S :1 • §= o= - I5 NQIIOE
InA
5Q Ü u QE l • „„a C10 I 3S
••cx lu; 2nn g ¤¢
"' ¤ nun "‘CI II »
¤¤ =KIIIIII0 ¤¤¤¤¤¤¤¤Ü¤¤ 1:1:1 IIIIIIII 0• no II ao zu ao es
SPICIIS Stoutuct
Figure 2. Dominance-diversity curve for spruce ( ¤ ) and hardwood (• ) plots. : Most frequent species to least frequentspecies are ordered from left to right.
Chapter 1 17
T•b1• 4. ßasidianyeatss balonging ta •ata«•yearrhiz•1 f•••il.i•s aeaurringin spruea ls) and harchaad Ih! faust typ•s.
F••i1y• sp•ci•s faust typ•
IMANITACEAEAmnib ilmuszmin Atk. •
muib hlx: |$ah••ff.l •¤•«·•. •, InÄllüil S•¢•-. s, h
ßemuib sasiliu ts. a •«·.1¤••1mmib s.t¤n¤u1.•b Fr.• smsu sm. hgi}; gig}; lBu11.:Fr.) Vitt. h .
BOLETACEAEuisjimiisa mmlinidu «s¤+ui•n.1 Hurrill. hBzlßm !.f.f.i¤sa1 PK- 1 hklein Indian rr. •„ h
l
Mina szbmumbuzn re-. hEhxlimamm daszäaznilyg ssen.) am. hIxisniisn 1111191 u=•·.1x•«~•1. •
cm‘n•ARELLAcEAEQmilmmlhm ishniemb re-. •
CLAVARIACEAESbxuiim snisbb m~.r s¢•«~¤•e. •
Chapter 1 18
Teble 4. Con'!.
Feeily. •p•¤i•eplct
CORTINARIACEAEGsdimnige alnsgn Fr- •§.¤Lti¤e:iyg •¤• 1 •§2Lti¤:¤1;i.u.; •¤- 3 •Immda sadzcim ¤•·••• •Ingame so-
hENTOLGIATACEAEEniszlm limisaujig N••l·
hEnielsm •¤~ 2 •
ggü IB. I C.) Seec. I1Enjglg IPR.) Seee. I1Enisism •¤-
h
HYGROPHORACEAE
|$cI·••ien.I Fr. I1Iknuff.) Smith I Heel. I1(Fr.) Fr. I1
(Fr.) Fr. I1Uamnanbzug sp- bTRICHOLGIATACEAE§.¥!$&r:gmi1¤§1im¤¤Fr•)F•y¤d •.h Ilgggjg lggg I$o¤p.ZFr.) Berk. I Bree. e, I1
SCLERODERHATICEAESslncszsang süzimn P••·••
h
19.Chapter 1
T•b1• 4. Cant.
Fnnily, •p•ci•• lplot
PAXILLACEAE
ggging; imgigg Ißatseh.) Fr. •
RUSSULACEAEFr. uh
Lasimim magnlixm Pk- • .Lasizcius simusn Pk- H
L1s$.u;iy1 m.¤.¤üi Pk- •• HLgsigdm ndmm Pk- H
lLasiuzisn limxsztnllus Smith I M••1- •
Lgjggigg gglgjgg IPR.) Burl.•
Imizciua mcdistn Pk- •
],;g_g;_;ig; ghgjgggig; IBu11.) Fr. h
Lasxgcisa Smith •
ßgggß; gg; L•C1•i•· •
· Bsasula slemtlma S•·¤v• •t
ßmub sanmm Pk- HB!-!.t§.ul.! mi.f.21il
$•¤r-• 3;:;;; Sh•ff••· •
ßggggi; IPR.) PR.•• h
ßggggi; Fr. ? h
Basale Iszzmäxzkii SH•f*••· Hauml: mm ¤•-•r1- Hmmala mlm ¤¤•·1- hBiggi]; ;j_],yj,gg_],; $h•ff•r ag h
eByssyla sgtatm Smith 1 H&;;_;g_],; gigggg I$eh••ff.) Fr. In
Chapter 1 20
Table 5. Comparison of species richness, species diversity, species
equitability, and species density of ectomycorrhizal
fungi between hardwood amd spruce plots
(n=6 plots/forest type). Shannon-Wiener index (H') and
z
equitability (J') calculated from sporocarp density and frequency.
spruce hardwood
number of species 27 36
number of species 188 27a
unique to each
mean i S. D. of
A
species/plot (256 mz) 15.7b i 2.2 13.2b i 4.3
' maximum number of
species/plot (256 mz) 19A 19
A
minimum number of I
species/plot (256 mz) 13 7
H'(frequency) 2.39 4.11
H'(density) 3.59 4.52
J'(frequency) 0.50 0.76
J'(density) 0.79 0.87 ·
a Not significantly dlfferent, P>0.10, xz = 1.8, 1 d.f.
b Not significantly different, P>O.10, T = 1.0, 10 d.f.
Chapter 1 21
equitabilty in the hardwood forests was indicated by direct measurement
of J!. .
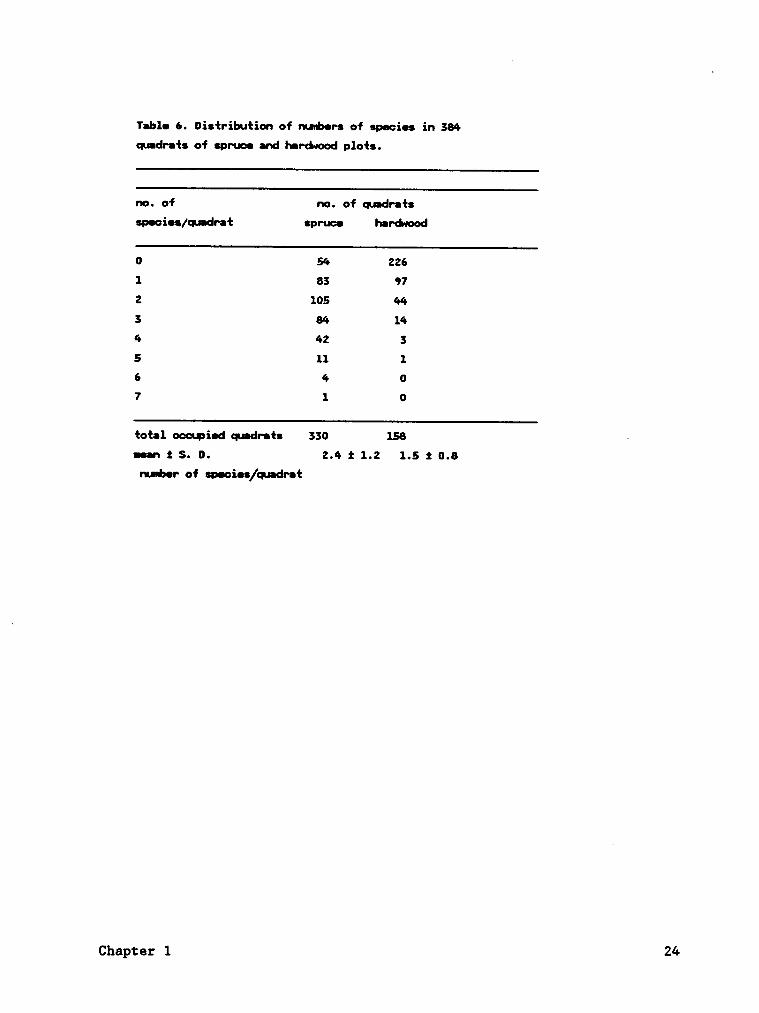
The total number of species fruiting in a quadrat estimates the minimal'
number of ectomycorrhizal species that may be occupying the rhizosphere
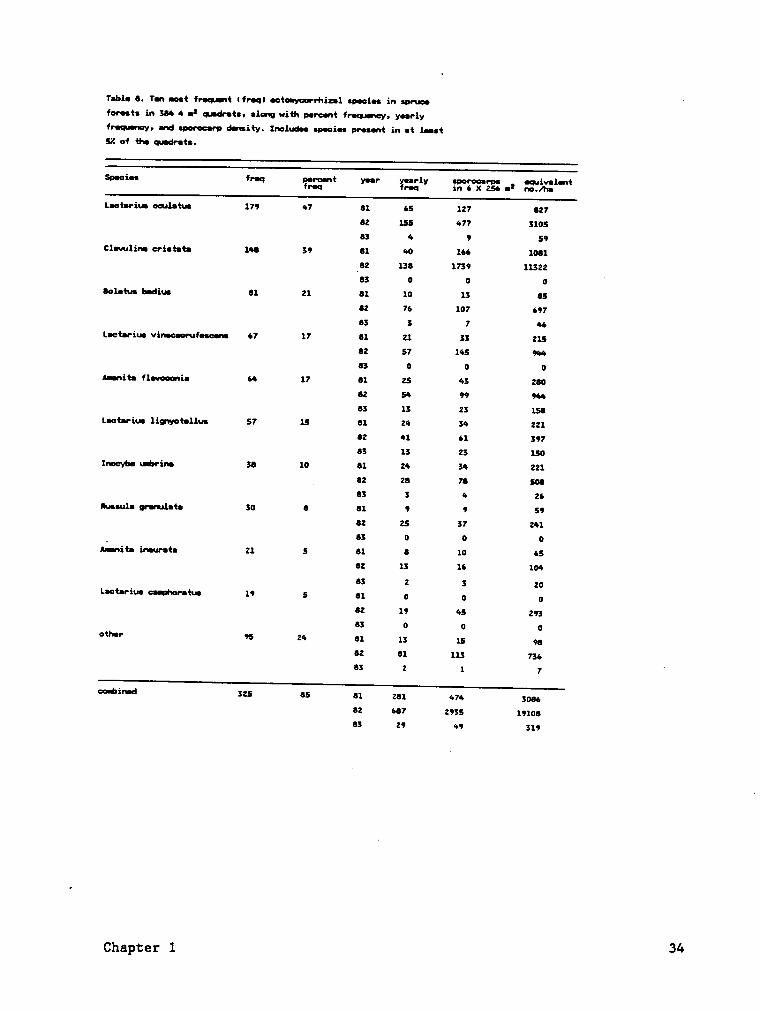
within these small areas (Table 6). Species density was much higher in
the spruce plots than in the hardwoods. The proportion of the quadrats
with no sporocarps was much higher than those with sporocarps, 225 (59'%)
in the hardwoods compared to 59 (15 %) in the spruce. Two species
fruited in most (85 %) of the occupied spruce quadrats, and as many as
seven species fruited in a single quadrat. One species fruited in most
(25 X) of the occupied hardwood quadrats, and as many as five species
fruited in a single quadrat.
The concept of minimal area (Cain, 1938), or the smallest area in which
the species composition of a community is adequately represented, is
impossible to apply prior to sampling macrofungi because sporocarp
densities are in a state of continual flux. However, the possibility of
achieving a minimal sampling area was examined in retrospect by
constructing the species·area curve (Greig·Smith, 1983) (Fig. 2) from
accumulated data on sporocarp locations. One criterion for minimal area
(Mueller-Dombois and Ellenberg, 1974) is a sample size that contains 90
to 95 % of the maximum number of species encountered in the largest sample
unit. This criterion is impractical for fungi because the maximum number
· of species cannot be determined. Cain (1938) considered the minimal area
Chapter 1 22
'
35
m 30Lu A
{3 25 ,9
Eth 20 °U- AO
‘
O 15•
_ •Oz 10
• ‘
O‘A
5
0 zoo 600 600 000 1000 1200 v•0¤ 16¤¤
AREA MZ
Figure 3. Species-area curve for spruce ( A ) and hardwood ( • )plots.: The total number of species in the sample areaswas plotted against increasing areas of contiguousquadrats. When 256 mz, the size of one contiguous plot,was reached additional plots were chosen randomly andtheir species added.
Chapter l 23
Tabla 6. Distribution af nuebars af sp•ci••in 384
quadrafs af spruea and hardnaod plats.
na. af na. af quadrafa
spaciaa/qeadraf spruaa harcbaaad
0 54 2261 83 97
2 105 443 84 144 42 35 ll 16 4 07 l 0
fatal aeenpiad qnndrafs 330 158 ·uaan 2 S. 0. 2.4 rt 1.2 1.5 t 0.8
nurbar af sp•ei••/cpadraf
Chapter 1 24
to be the point on the species·area curve at which an increase of 10 %
in the sample area yields only 10 % more species of the total number
recorded. Using this criterion, the minimal area for the spruce forests
is approximately 250 mz and approximately 150 mz for the hardwood forests.
However, Rice and Kelting (1955) demonstrated that this 10 X point wlll
shift continually to the right as greater total areas are sampled.
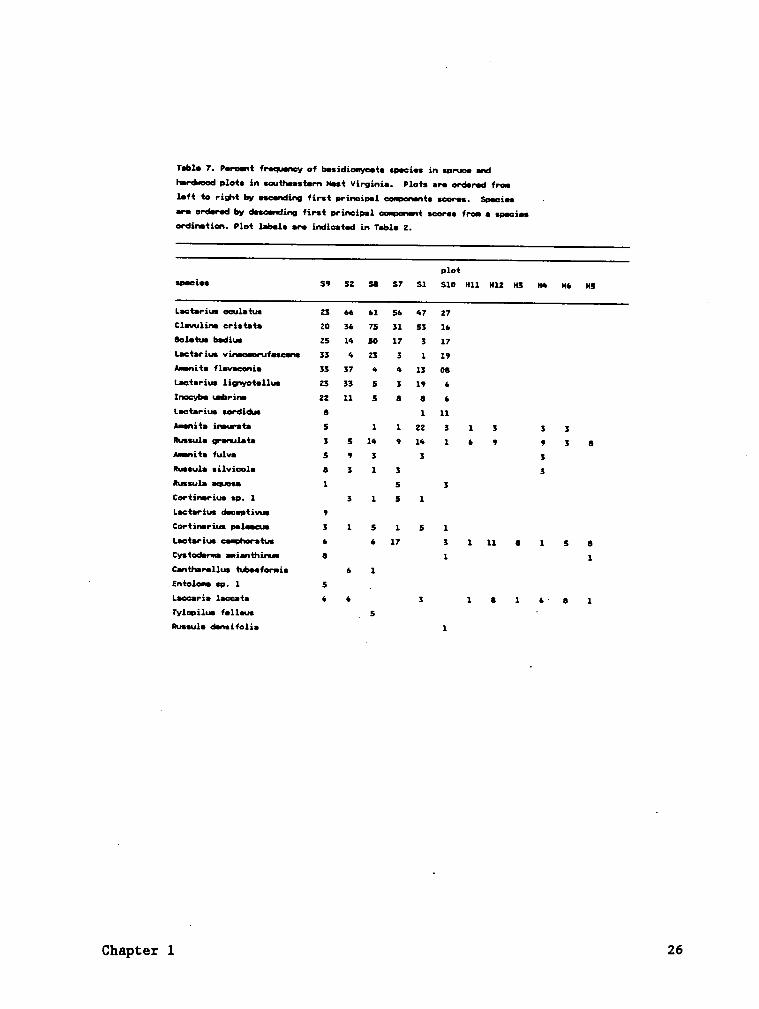
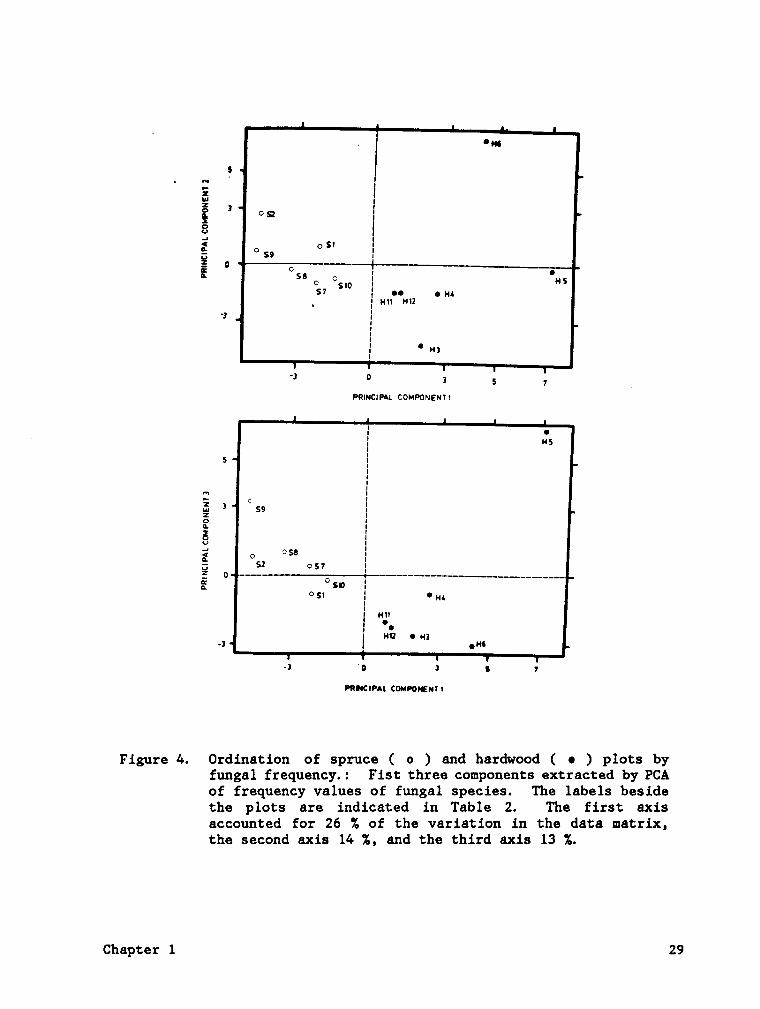
To compare and to summarize variation in fungal and tree species
composition among the plots, principal component analysis (PCA) (Gauch,
1982, chap. 4) was used to order the plots x species data matrices for
fungi and trees separately. The hardwood plots appeared to be distinctly
different from the spruce plots because of the taxonomic discontinuity
in fungal species between the two forest types (Fig. 4). Ordination
indicated a closer relationship among the fungal samples in spruce forests
than among hardwood forests. The spruce plots were relatively uniform
in fungal composition having nine fungal species in common. The wide
separation among hardwood samples along all three axes indicated a high
degree of taxonomic discontinuity. Hardwood plots H6 and H5 were the most
different from the rest, probably due to the high frequency of
ßglgtjggllgg mgggljgjggg in H6 and Lgg;g;1gs gigggggg in H5. In addition,
Hygggphgggg spp. and Engglgmg spp. were largely restricted to these two
plots (Table 7).
Chapter 1 25
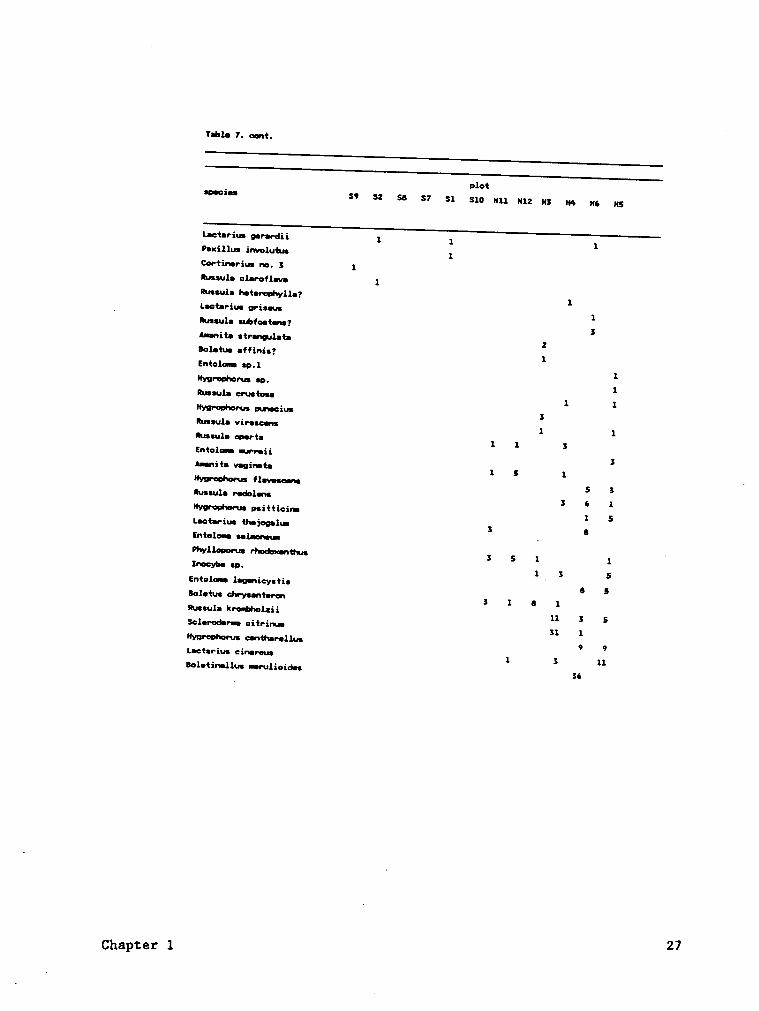
T•b1•7. Pareant frnqaucy of basidionyuata sp•¤i•s in spruea and
Inrénood plots in southnastnrn Hast Virginia. Plots ars ordnrad fron1•ft to n·i¢1t by asoanding first principal cannvonnnts scoros. Spncix ·arn ordarnd by dasacnding first principal couponmt scoras fron a spnciasordirctiun. Plot labais are indieatad in Tsbla 2.
p1¤tS¤•¤ix $9 S2 S8 S7 $1 $10 H11 H12 H3 N4 M6 M5
Lactarius oculatus 23 66 61 56 47 27
Clavulina cristata 20 36 75 31 53 16
Bolatus badiua 25 14 50 17 3 17
Lactarius vinncaonafascuns 33 4 23 3 1 19
Annnita flarvaconia 33 37 4 4 13 08Laetarius 1ig·ny¤t•11us 23 33 5 3 19 6
Inocyba ubrina 22 11 5 8 8 6
Lactarius sordidn 8 1 11Annusita incurata 5 1 1 22 3 1 3 3 3Rusaula granulata 3 5 14 9 14 1 6 9 9 3 8Mlnita fulva 5 9 3 3 3 i
Russula eilvioola 8 3 1 3 3Iussula aqnsa 1 5 3
Cortinarius sp. 1 3 1 5 1Lactarius dacnptivus 9
Ccrtinariu painacus 3 1 5 1 5 1Lactarius canuhoratus 6 6 17 3 1 11 0 1 5 8
Cystodarnnna anianthinuu 6 1 1Cantharallus txbaafornnis 6
u1
' Entolonna sp. 1 5 _
Laccaria laceata 6 6 3 1 8 1 6* 8 1
Tylopilua fallnus _ 5 'Russula dansifolia 1
Chapter 1 26
Tab].! 7. cent.
plotspeeiu S9 $2 $8 S7 $1 $10 H11 M12 M3 M4 H6 HS
LIC*!Pi\ß gererdii 1 1 1Pexillue involutue1
Certinerius ne. 3 1Russule clerofleve 1Ruesole heterophylla?
1Leeteriue griseus1
IRussel! ubfoetens?
3Aunnite strengulate2loletue nffinie?1Entolenn so.1
1Hygreehorus sp.1Russula crueteee
1 1Nygroohems enneeius3Russule virosctu1 1Russo]! eperta
1 1 3Entolene ¤u•—•-eü
3Älütl vegirnte1 S 1 _Nygrepherus flavoscrse
S 3Iussul! r•de1•1s3 6 1Nyuronhorue psitticirh
1 SLaetsrius thejogelue3 8Enteloun sellunenn ‘
Phyllooerun r+¤d¤xu•thu•3 S 1 1
RInecybe sp.
1 _ 3 SEntoleun lsgmicystis8 SBoletus d*••·ys•nt•r¤s
3 1 8 1Russuls krcnbholzii11 3 SSclerodenn citrinn31 1Mygrophorus centherollue
9 9Lactarius cinerous1 3 11Boletinellus nerulioidee
36
27Chapter 1
Ordination of plots by tree basal areas (Fig. 4) also indicated
discontinuity between spruce and hardwood plots. A strong disjunction
among the hardwood plots was evident along both the first and second axis.
This disjunction was probably caused by the high basal area of Qge;eye
and Iggy; in H4 and the high basal area of Iegye in H3 (Teble 3). Plots
H5, H6, H11, and H12 were strongly dominated by £;ggge and Age; and wereU
not widely separated along any principal component.
The main similarities between the ordinations of plots by fungal
species and tree species were (1) the polarization of the spruce stands
at the negative end of the first axis because of the taxonomic
discontinuity between spruce and hardwood plots, (2) the limited
separation of spruce stands by additional axes because of their relative
homogeneity, and (3) the wide separation of hardwood plots on all three
axes because of their relative heterogeneity. However, the most
dissimilar hardwood plots based upon fungal species (H5 and H6) did not
correspond with the most dissimilar plots based on tree species (H3 and
H4). Principal component analysis is usually applied to continuous
vegetation samples but can estimate the number and distinctness of the
discontinuities in the data matrix (Noy-Meir, 1973). If the
discontinuities are not absolute, as are those between spruce and hardwood
plots, the discontinuities can be detected by asymmetry of the positive
or negative values of the various components.
The fungal communities were more similiar to each other than the tree
communities because nine fungal species occurred in both forests types.
Chapter 1 28
?
§ ’os {
ä I°ss
Os, {E Osa
' °27
Os")
E•• • yu
Hs
_{ H11 H12
.3 IIII ° waI
—a o , S 7 lPRINCIPAL COMPONENH
I O‘ I us5 E
I9 E
E J css Iä Ié aE <> °$° IG S2 Og1 I°*··———·······—
OS1I
•H‘
iMg!
' Nr! ••43'J { •"‘
·J”0
J [ 1
•·¤•6c•m couwuusnn
Figure /6. Ordination of spruce ( 0 ) and hardwood ( • ) plots byfungal frequency.: Fist three components extracted by PCAof frequency values of fungal species. The labels besidethe plots are indicated in Table 2. The first axisaccounted for 26 74 of the variation in the data matrix,the second axis 1/6 %, and the third axis 13 %.
Chapter 1 29
Some of the species common to both forests were among the most ubiquitous
(a-s-Las1:.a1:.1.u.1. Bsmsnlaxramuasa, Amanisalnmarasa, and
Lgggggjg lggggtg). These species are widely distributed in many forests
types and thought to have a broad ectomycorrhizal host ranges.
AND11EN.S.I1'X
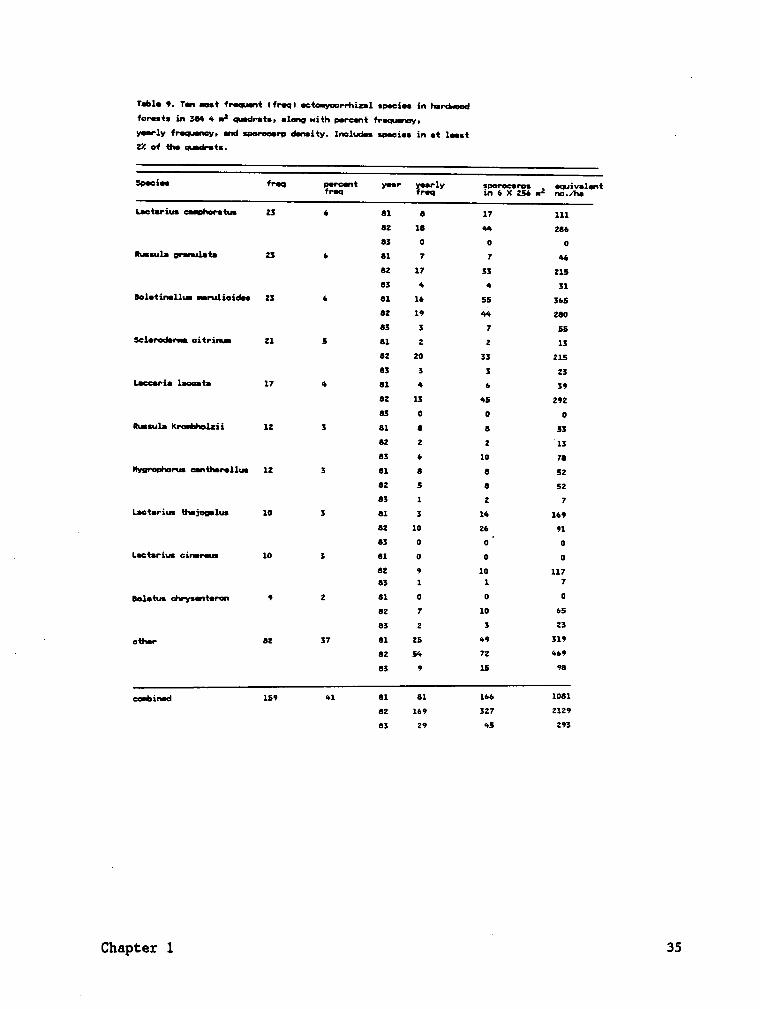
The frequency of major species is a measure of their relative ubiquity
within the plots (Tables 8, 9). These major species accounted for 88 Z
of the total frequency values, 96 Z of the total sporocarps in the spruce
plots, 66 Z of the total frequency values, and 75 Z of total sporocarps
in the hardwood plots during the three years.
Sporocarp frequency and density were highly variable among years.
Sporocarp frequencies and densities were consistently higher during the
second year for nearly all species, while the lowest values usually
occurred during the third year (Tables 8, 9; Fig. 5). Some species did
not fruit every year, especially the third year (Tables 8, 9; Fig. 6).
Species with the greatest sporocarp frequency or density were not the same
every year. Comparison of sporocarp frequency and density indicates that
the list of major species would be somewhat different if species were
ranked by density. For example, the sporocarp density of Qjgyyling
ggistgtg was greater than Lggtgrjgs ggglgtgs during the study, but L.
i
Chapter 1 30
E <
§E 0
OHLäE äbsr I
I
S7 %•"° I °°" „°¤s2 I
·2 0 3 5mmcnm commsurw
· II OH4
· II
·; IE I •HI2S20 S‘@°:$‘
MsIä ° S7 Sßsg
••_, • un}E
"‘I
ä'E OH)-a
I ~s‘ -2 0 a s
r¤••cum0¤u•=0••s»m
Figure S. Ordination of spruce ( 0 ) and hardwood ( • ) plots by treebasal areas.: The first three components extracted byPCA of basal area values of tree species. The labelsbeside the plots are indicated in Table 2. The first axisaccounted for 29 % of the variation in the data matrix,
I the second axis 22 %, and the third axis 16 %.
Chapter 1 31
ggglgtys was more frequently encountered and therefore was more
ubiquitous throughout the spruce plots.
Sporocarp frequency and density were much higher in both the spruce
and hardwood plots during 1981 and 1982. (Tables 8, 9; Fig. 5). Fruiting
was severely suppressed by the extreme drought conditions during July and
August of 1983 (Table 1). July and August of 1983 were the driest in
eastern North America in nearly 50 years (Wagner, 1984). Sporocarp
frequency and density was greater in spruce plots than hardwood plots
during the first two seasons but not the third.
The higher sporocarp frequency and density in the spruce plots may be
due partially to the greater number of trees providing a substrate for
ectomycorrhizal fungi. Spearman°s rank correlation coefficient (p) was
. used to measure the association of vegetation parameters with sporocarp
density and frequency. When all twelve plots were considered, the density
of ectomycorrhizal canopy trees (£;gxing; included to account for
frequency and density of ßglgtjngljgg mgrgljgjggg) was positively
correlated with sporocarp density (p = 0.69; P = 0.01), the basal area
of ectomycorrhizal canopy trees (lggxingg included) was positively —
correlated with sporocarp density (p = 0.75; P = 0.005), the density of
ectomycorrhizal canopy trees was positively correlated with sporocarp
frequency (p = 0.63; P = 0.006), and the basal area of ectomycorrhizal
canopy trees with sporocarp frequency (p = 0.73; P = 0.007). When the
six spruce plots or the six hardwood plots were analyzed separately,
Chapter 1 32
I
neither tree basal area nor tree density was correlated with sporocarp
density or sporocarp frequency. ‘
. Several investigators have observed an inhibitory effect of ferns and
herbaceous vegetation on sporocarp productivity (Wilkins and Harris,
1946; Wasterlund and Ingelog, 1981). This effect was observed in some
of the hardwood plots where fern cover ranged from 1.5-58 %. Within the
hardwood plots, there was a negative correlation between fern cover and
sporocarp density (p = -0.87; P = 0.05) and fern cover and sporocarp
frequency (p = -0.90; P = 0.04).
ERHIIINQThe
fruiting season for ectomycorrhizal fungi begins in early July and
extends into late September or early October for both forest types (Fig.
5). Sporocarps were observed for 89, 91, and 75 days for the three years,
respectively. The end of the first two fruiting seasons coincided with
·theadvent of heavy frosts or snowfall. In the third year, prolonged
drought in combination with cold temperature prematurely ended the
fruiting season. In both forests during the first and third years,
sporocarp density declined sharply after the first of August because of
late summer drought (Fig. 5). Both forests exhibited a strong peak of
sporocarp density in early September of the second season. During the
second half of August, 1982, rainfall was much greater than the same time
Chapter 1 33
T•b1•8. Tan nat faqnnt Ifr•q| •¤t¤¤yarrhi¤1 so•¤i••
in soruaf¤r••ts
in 386 6 6* ande-ots, dung with areunt fr•¤u•rn¤=y» y••r1y
fN•I¤'¤¤¥» und •o•r0¤•rodunsity. 1n¤1ud•• •o•ci••
oaunt in nt lastSZ of Hu qndntn.
2:::*** '··* ¥::;‘=' zrzvm .· •„:1ix:*··‘*Lactnria o¤u1•tu• 179 67 81 65 127 827
82 155 677 310583 6 9 59
C1•vu1in• crishta 168 39 81 60 166 1081-82 138 1739 1132283 0 0 0
I
8o1•Qu• bndius 81 21 81 10 13 8582 76 107 69783 3 7 66
L•ct•riu• vir•¢•¤n.•f••an•67 17 81 21 33 215
82 57 165 96683 0 0 0
Ianih f1•v¤¢«ni• 66 17 81 25 63 28082 56 99 96683 13 23 150
Loctarius 1ig••y¤t•11u• 57 15 81 26 36 22182 61 61 39783 13 23 150
!n¤cyb• sérirl 38 10 81 26 36 221_ 82 28 78 508
83 3 6 26|N••u1• g•·uu1¤t•
30 8 81 9 9 59
82 25 37 26183 0 0 0
lanih i•n•ur•t• 21 5 81 8 10 6582 13 16 106
83 2 3 zuLactnrim 19 5 81 0 0 0
82 19 65 29383 0 0 0
other 95 26 81 13 15 9882 81 113 73683 2 1 7
l
82 687 2935 1910883 29 69 319
Chapter 1 34
‘I’•b1•9. T•n •¤•t fr•v.·n•nt lfr•qI •¤to¤y¤¤rrhiz·a1 ••>•ei••
in Iurdvoodfor••h
in 304 4 ••‘ mndr•h• •1¤ng nüh p•r¢•nt fr•q.••1cy,y•••·1y fr·•qu•ncy•
md sooroarp dnnsity. In¤1ud•• •p•ci••in at 1••st
·ZZ of Hu qndrnh.
„= ä2‘f$§."""uehrius a¤¤h¤•·•tu• 23 6 01 0 17 111
02 10 M 20603 0 0 0
luuub grnnubh 23 6 01 7 7 46- 02 17 33 215
03 4 4 310o1•tin•11u• n•ru1i0id•• 23 6 01 16 55 365
02 x• 64 zao03 3 7 55 -
Sc1•ro&r—, cifrinn 21 5 01 2 2 1302 20 33 21503 3 3 23
L•¤ari• boah 17 4 01 4 6 3902 13 45 29203 0 0 0
Runsula kr¤••t|·••lzii 12 3 01 0 0 5302 2 2 -13
03 6 10 70Hygruohonee a·•{h•r•11u• 12 3 01 0 0 52
02 5 0 5203 1 2 7
Lsohrius !h•jop1u•10 3 01 3 14 169
02 10 26 91-03 0 0 - 0
_ Lachriuscin••·•u•
10 3 01 0 0 0
02 9 10 117sx 1 1 7
loloiusd·••·ys•·•hr¤·• 9 2 01 0 0 0
az 1 10 65
as 2 s Z3. oh, 02 37 01 Z5 49 319
. sz sa 72 46903 9 15 90
02 169 327 2129
03 29 45 293
Chapter 1 35
period in 1981 and 1983 (Table 1). Heavy rainfall in late August appears
to be necessary for dense late summer fruiting.
Fruiting phenology was comparable among major species in spruce and
hardwood plots (Fig. 6). Based on 1982, most sporocarps of most species
fruited in late August and early September. However, some species tended
to have their peak density earlier in the season, e.g. Amggjgg
.flmm.¢.¤n.La„ Bnlsmshadixu, Kusaylazzamllßta. a¤dRus.mzl.a-
LENQIH Q2 SAMBLING BERIQD
More than one year was needed to observe all the species included in
this study, and the number of species sampled varied among years.
Seventeen of the total species in the hardwood plots (47 Z) and 15 of the
total species in the spruce (56 Z) plots were found in 1981. If only 1982,
the year with the greatest density and frequency, had been observed, 30
(89 Z) of the hardwood species and 24 (89 Z) of the spruce species would
have been found. Only 12 (33 Z) of the total species of the hardwood plots
and seven (26 Z) of the total species in the spruce plots were found in
1983. No additional species were found during 1983. This may be
partially because of the low sporocarps density during this year. Limited
observations of the plots during a fourth year (1984) yielded one
sporocarp of an indetermined Rgssglg that had not been found in 1981-83.
Chapter 1 36
The fruiting habitats of both well known and poorly known Basidiomycete
species were analyzed in this study. Several of the species found in our
spruce plots had been described earlier in the mycological literature as
fruiting under "spruce", presumably red spruce, in eastern North America.
These species include Amgnitg flgygggßjg (Hesler, 1960), ßglgtyg hggig;
(Snell and Dick, 1970), Iylgpilgg fgllgug (Snell and Dick, 1970),
Lggtggjgg dgggptiygg (Hesler, 1945; Hesler and Smith, 1979), L. ggg1g;gg'
(Burlingham, 1908), L. sgrdijgs (Burlingham, 1908; as Lgg;g;;g ggggig
(Weinm.) Fr.), L. yigggggggjggggng (Burlingham,1908; as Lggyggjg
ghgjggglg (Bull.) Fr.), Kggsylg gggnglgtg (Singer, 1957; Bills, 1984),
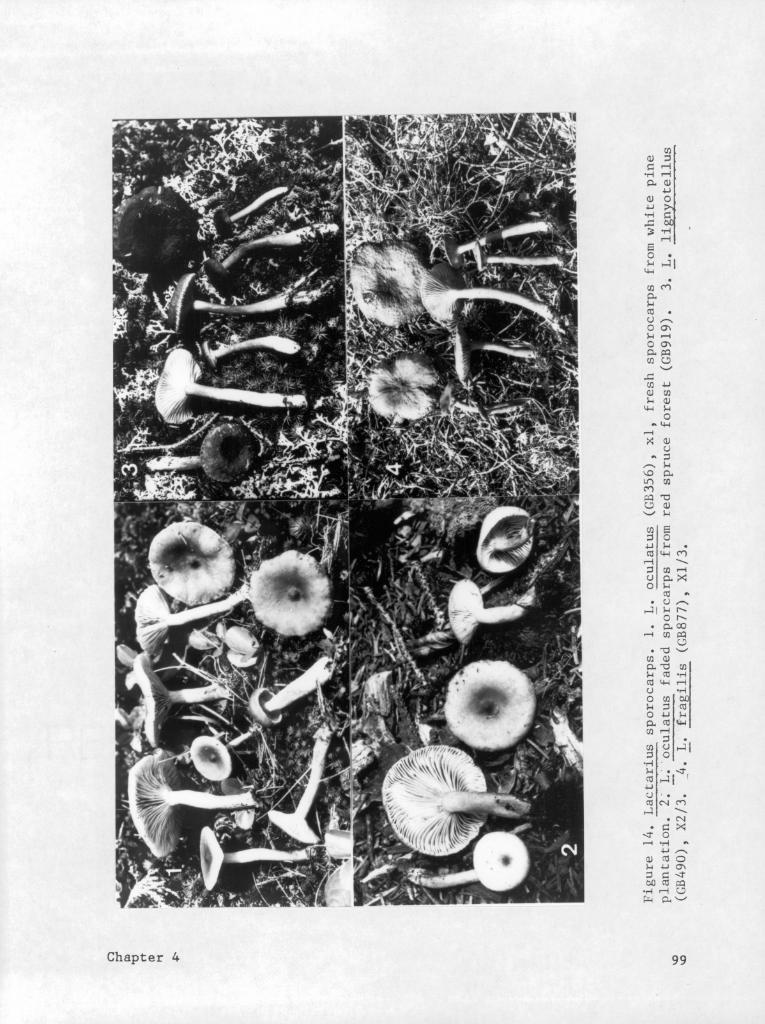
and Kgggyjg (Bills and Miller, 1984).Lg_g_t_g;_j,g_5_was
described from a red spruce forest on Clingman°s Dome, Tennessee
(Hesler and Smith, 1979) and has not been reported elsewhere. The
remainder of the species in the spruce plots apparently never have been
reported fruiting in association with red spruce.
A high proportion of the species diversity in both the spruce and
hardwoods was attributable to species of the Russulaceae. This would
probably be the case in most boreal or temperate forests dominated by
ectomycorrhizal trees. Certain genera of ectomycorrhizal Basidiomycetes
commonly found in other coniferous forests (especially Ring; or Lggig)
were absent from the red spruce forests. Among these are species in the .
genera Irishclnma. Hxzmuhnmla (S¤<=ti¤¤¤
Hxzmnhoma.Chapter1 37
Qgmphjgjgg, Qhgggggmphgg, and Sgjllgs. There are no reports of hypogeous
Basidiomycetes in red spruce forests.
Most of the species of the hardwood plots are co«~on in the deciduous
forests of northeastern North America. Entglgmg lgggnigygtjg is known
only from North Carolina and Tennessee (Hesler, 1967). Prior to this
study, Kgsgglg gggglgns was known only from the type locality in Vermont
(Bills, 1984). Kg5;g1g.gpg;;5 is a poorly known species described from
northern hardwood forests of Vermont and may be synonymous with Buggy];
pggillg Peck (Singer, 1957). A few of the species from the hardwoods have
been reported to be associated with specific woody hosts; e.g.
ßglggjggllgg mgggligjggg with Egggjngs spp. (Snell and Dick, 1970),
Lastaxiuasinezmawith F.az¤1szz.a¤s1i.f.o.1i¤„ and Lastariusthsrinaalus with
ßgtyla spp. (Hesler and Smith, 1979). These associations were evident
in this study because plots with high density of these species either had
these trees in the plots or near the edge of the plots (Table 7).
§glg;ggg;mg giggjggm which fruits in association with many woody plants,
consistently produced sporocarps near Qggggyg gghgg in plot H4. Lgggggig
lgggggg, Lgggggigg ggmphgrgggs, and ßggsglg ggggylgtg had the widest
amplitudes in habitat of any of the major species, and both were found
fruiting in most plots.
The number of species found in spruce (27) and hardwoods (36) compares
favorably with numbers of species reported by other investigators. Hora
Chapter 1 38
120HARD? ·
100
I0
[Q .
Q soEä
’°g
0.V1ILO
g‘$°
svnucsIDg 12soZ
1000
7
500
250........ ....... \
07/1 8/1 9/1 10/1
DATE”
Figure 6. Sporocarp phenology of all species in hardwood and spruceplots.: 1981 (-4--+-), 1982 ( • • ), 1983(...•....•. ). Note differences in scales on y-axis.
Chapter 1 39
II gutunus •cu1•un
N/Axucuruus 1••11v•t•nu•
\· Ilvuco /’ \, W'“¢•1•• 1
11/ ‘
A’,
Ä’,A\\
I "\z x·“
--•·¤--„....,,,•
\\
QClavulllucnsuu "'°‘V°' '“"°'"" 1°- ‘Slutl•¤vuc•\N
{/ ".\/
f\1
n"*
\‘N---.:1,
/*-1„ ugunus ¢•rn01•¤•‘•¢•ß //' x1
GUNS! 1 fx \9 /1
‘/ \~\1
/f \‘N
‘•A1"
1LEKINIIS VHI¢OWIHI§¢O|‘\$ ߤ\ |u§|y|; °yg-luga
gg, / \ 1¤r¤•100¤! N
_IO
_/I, ‘,
,/\•
hnctnnmus
1, I1 1N• 1/ \\ Anunnu Havacoma \N
\:” I \N \ I/
"~··II I]
‘¥AN
‘x
\NU, vg U1 1011 111
I/‘II' 1011
A
uu MY!
Figure 7. Sporocarp phenology of some major species in spruce andhardwood plots.: 1981 (··l•--A--) , 1982 ( , , ), 1983(. .•. . . •. ). Note differences in scale on y-axis.
Chapter 1 40
(1959) reported 25 species and Richardson (1970) 12 species belonging to
ectomycorrhizal families fruiting in Scots pine plantations. Fogel
(1976) found 24 putatively ectomycorrhizal hypogeous fungi in a Douglas
fir stand. A Swedish stand of Norway spruce had 25 species fruiting
(Wasterlund and Ingelog, 1981). Stands of Qggrgggandin
Great Britain produced 4 to 11 species (Hering, 1966). In addition,
the numbers of epigeous species fruiting in various spruce stands is
comparable to the number of types of ectomycorrhizae observed on spruce.
Worjciechowska (1960) described 16 "form genera" of ectomycorrhizae on
Norway spruce within its northern range in Poland. Thirty·seven ”form
genera" of ectomycorrhizae were observed throughout the range of Norway
spruce in Poland (Dominik, 1961). Thomas gg gl. (1983) observed 25 types
of ectomycorrhizae in English Sitka spruce plantations.
_ We believe the stands described here are representative of other red
spruce and northern hardwood stands in the Southern Appalachians. Most
of the major species reported here have been observed fruiting abundantly
in other red spruce and northern hardwood stands in West Virginia,
Virginia, and North Carolina. However, many other Basidiomycetes
belonging to ectomycorrhizal families have been collected in spruce
andnorthernhardwood forests throughout the Southern Appalachians.
Therefore, my results do not represent the entire mycorrhizal fungal
flora.
Some doubt exists as to whether the concept of minimal area can be
applied to fungal communities (Christensen, 1981). An adequate
Chapter 1 41
species·area curve for macrofungi cannot be determined at a single point’
in time. The species·area curves derived from retrospective examination
of the frequency data resembles Christiansen°s (1981) species-isolates
curves for soil fungi. In her studies, repeated isolations of soil fungi
within one plant community continued to yield additional species with no
tendency for the species·area curve to level off. Fogel (1976) determined
the minimal sampling area for hypogeous fungi in a Douglas fir stand
during peak sporocarp production to be 100 mz. Arnolds (1981) concluded
that fungal species numbers continued to increase in grasslands at plot
sizes up to 400 mz and that a plot size of 1000 mz may be preferable to
ensure an adequate sample size.
The number of ectomycorrhizal species fruiting in a small area may
reflect the minimal number of available niches in the rhizosphere. But
few estimates of ectomycorrhizal species density in small (<10 mz) areas
are available. Several species of ectomycorrhizal fungi can occupy a very
small root surface area (Zak and Marx, 1964). Up to seven ectomycorrhizal
fungi have been isolated from a single four-year old Ring; glljggtji tree
(Zak and Marx, 1964). Deacon gt gl. (1983) reported at least five types
of ectomycorrhizae occurring within a seven m radius of a young birch.
These estimates of species density are within the range of the maximum
of seven species of fungi fruiting in a single 2 x 2 m quadrat reported
here.
Direct and indirect gradient analysis, and other multivariate
techniques could be adapted readily to the description of macrofungal
Chapter 1 42
communities. Ordination has been used to compare communities of yeasts
(Bow1es and Lachance, 1983) and soil fungi (Christensen, 1982). In this
study, PCA ordination clearly differentiated between the fungal
communities of spruce and hardwood forests, emphasized the similarities
in species composition among spruce plots and the dissimilarities in
fungal species composition among hardwood plots. In addition, it
demonstrated how strongly fungal species composition of the plots was
influenced by tree species composition.
Frequency estimates must be interpreted with caution. Frequency
depends upon the pattern and density of the individuals (or in this case
sporocarps), the size and shape of the quadrats (Greig-Smith, 1983), and
in this study the duration of the observations of the quadrats. The
resolution achieved by frequency can be increased or decreased by varying
the quadrat size. Sporocarp frequency cannot measure the true extent of
a mycelium or distinguish between sporocarps produced by a large
continuous mycelium or many cluster of small localized mycelia. Sporocarp
frequency does not provide information on fungi that do not produce
epigeous sporocarps. Frequency may give an impression of the horizontal
distribution of mycelia but indicates nothing about their vertical
distribution.
Sporocarp densities of the spruce plots were within the range for
sporocarp densities of ectomycorrhizal fungi in other coniferous forests.
Sporocarp density in the spruce plots ranged from 319 to 19,180 sporocarps
ha" yr". Richardson°s (1970) estimates ranged from 8750 to 20250
Chapter 1 43
sporocarps ha" yr°‘, and Fogel°s (1976) estimates ranged from 11052 to
16753 sporocarps ha"yr'“
The sporocarp densities of the hardwood plots
in this study were lower than for other coniferous forests. Sporocarp
density in the hardwood plot ranged from 352 to 1081 sporocarps ha°‘yr°‘.
An impression of the overall pattern of fruiting phenology is difficult
to gain from comparison of the three years. The late summer drought of
1981 and 1983 contributed to the high Variation in phenology. The 1982
season had adequate rainfall during July and August and presented a
phenology pattern similar to those described for other temperate and
boreal plant communities (Wilkins and Harris, 1946; Lange, 1948;
Richardson, 1970; Petersen, 1977). All these studies show the typical
strong peak of productivity near the end of the season.
_l
The length of the fruiting season for ectomycorrhizal fungi at
high-elevations in West Virginia appears to be relatively short compared
to fruiting seasons of ectomycorrhizal fungi at lower elevations or in
Amaritime climates but is commensurate with those in high-latitude,
low-elevation communities. Sporocarps of ectomycorrhizal fungi were
observed in both spruce and hardwood plots from July to early October
(75-91 days). Wilkins and Harris (1946) reported a fruiting season
lasting from August to November in an English pinewood and from June to
November in a beechwood. In Scotland, ectomycorrhizal fungi fruited from
June to December in a Scots pine plantation (Richardson, 1970). In.R1ggg
yiggigiggg stands in southwestern Virginia (elev. 450-750 m),
ectomycorrhizal fungi fruit from June to December (author°s unpublished
Chapter 1 44
data). The fruiting season is much shorter in Greenland tundra (Petersen,
1977), where ectomycorrhizal fungi fruit from July to mid-September.
Although only one additional species was found after the third year,
it is difficult to judge how many additional species would be found if
more years had been sampled. Fogel (1976) sampled 98 % of the
hypothetical number of hypogeous species of a Douglas fir forest in a
three year period. Arnolds (1981) observed most of his grassland sites
for three years but observed some selected sites up to six years. Based
upon these six year observation periods, he concluded that three years
of sampling yielded 75-92 % of the total species. However, during these
extended sampling periods, the Vegetation of these grasslands changed
significantly, which may have contributed to subsequent additions to the
mycoflora. Lange (1978) recorded 266 mycorrhizal species in a series of
Vegetation types over a ten-year period in the Beech Wood District of
Denmark. During any given season, 21-S9 % of these species were observed
to fruit.
In summary, this study provides baseline data on the diversity,
density, frequency, and phenology of ectomycorrhizal fungi fruiting in
red spruce and northern hardwood forest types. The fungal species
composition and sporocarp density of the two forest types were distinctly
different because of a strong dependence of fungi species composition on
the composition of tree present. Inter-plot similarities and differences
in fungal species composition and the dependence of fungal species
composition on the tree composition was emphasized by PCA, one of many
Chapter 1 45
ordination techniques which may be adapted to future studies of fungal
communities in response to vegetational or environmental gradients or
identifying fungal community structure in complex Vegetation landscapes.
Fungal species composition and relative abundance of fungal species in
other red spruce or northern hardwood communities may shift with changing
latitude, or with slight changes in tree composition.
Species species richness was not significantly different between
‘spruce and hardwood plots, the hardwood plots were more diverse because
of greater equitability among species. Evidence for this greater
diversity included the Shannon-Wiener index, the dominance diversity
curve, species area curve (indicating more species among hardwood plots,
and PCA ordination.
The results suggest that estimating sporocarp frequency in small
contiguous quadrats may be a more appropriate method than estimating
sporocarp density for comparing the the relative activity or ubiquity of
fungal species in plot studies. Fruiting phenology was comparable between
the two forest types, and the fruiting season was relatively short. The
fruiting season at this southern latitude was compressed because of the
short growing season at high-elevation. Variation in fruiting season is
assumed to occur in response gradients of altitude or latitude, but
quantitative, comparative studies are needed to measure the extent of this
Variation. _
Chapter 1 46
QHAHIEBL. S.BAI1AL2AIII":1RhJ§ANDQE
IHKE12$.BB§l£EAhIDIüBHW9QDEQRE§IS
Basidiomycetes usually fruit in spatially and temporally aggregated
patterns. Spatial aggregation is caused by multiple sporocarp production
by a single or a series of localized mycelia. Heterogeneity of habitat,
inoculum density, and non—random occurrence of host plants and substrates
contribute to the non-random patterns of mycelial occurrence. Temporal
aggregation is caused by repeated sporocarp production by perennating
mycelia. Basidiomycete fruiting is often described in the literature as
gregarious, clustered, in groups, or caespitose. The perennial nature
· of fruiting is best exemplified by the mushroom collector who returns
year-after-year to the same location for edible fungi. Perennial fruiting
has been expressed quantitatively as "constancy" (Lange, 1948) or as an
"index of specific fluctuation" (Arnolds, 1982). The spatially
aggregated, perennial, fairy ring fruiting pattern of certain grassland
fungi has been thoroughly investigated (Ingold, 1974; Smith, 1980;
Edwards, 1984). However, relatively little is known about the spatial
patterns of terrestrial sporocarps in forests, and variation of these
patterns within or among species (Fogel, 1981)
Observation of spatial patterns of sporocarps in reference plots
yields several kinds of information related to the biology of the fungus
Chapter 2 47
and its associated organisms. Sporocarps verify the presence of the
vegetative mycelium, and sometimes sporocarps numbers and their patterns
have indicated the spatial pattern and relative abundance of the
vegetative mycelia (Laiho, 1970; Thompson and Rayner, 1982; Last gg gl.,
1983; Edwards, 1984; Newell, 1984; Cotter and Bills, in press). In
addition, the spatial patterns of sporocarps may influence the spatial
patterns of animals that utilize sporocarps as feeding or breeding sites
(Shorrocks and Charlesworth, 1982; Ashe, 1984; Lacy, 1984). Knowledge
of spatial patterns of sporocarps is essential to the understanding
inoculum density and dispersal, and of the establishment of °
Basidiomycetes in forests.
How should fungal communities be sampled to yield maximum information?
Ideally, as in plant or animal communities, quadrat sizes and placement
would be determined by the species-area relationships within the
community, the relative sizes of the organisms, and the Variation in the
spatial patterns of the organisms. These critera are difficult to apply
to fungi because the composition of the community and its spatial pattern
based on sporocarps is continually varying (Fogel, 1981). Repeated and
prolonged observations of fungal communities are needed because of the
temporal Variation in their compositions. In addition, the lack of
knowledge of variation in sporocarp density and the unpredictable nature
of species density has prevented the application of consistent sampling
methods with subsequent difficulties in comparing and interpreting
results of different investigators (Hueck, 1953). Knowledge of spatial
Chapter 2 48
variation of fruiting patterns can be applied to further improve sampling
· methods for fungal communities.
Quantitative methods for describing spatial patterns of plants or
animals have rarely been applied to higher fungi (Fogel, 1981). Recently,
the spatial patterns of plant pathogenic fungi and diseased plants have
been investigated in several agricultural systems (Campell and
Pennypacker, 1980; Taylor gt al., 1981; Nicot gt gl., 1984; Shew gt al.,
1984). The objectives of this study were to describe and compare
quantitatively the spatial patterns of sporocarps of terrestrial,
presumably ectomycorrhizal, basidiomycetes commonly found in
high-elevation red spruce and northern hardwood forests of West Virginia
and to determine whether interspecific associations or antagonisms among
fungi occupying a similar trophic level could be detected based on
sporocarp observations alone.”
MEIHDDS
Both temporal and spatial aggregation were combined by summing the
cumulative sporocarp densities and frequencies for 1981-1983. From
cumulative sporocarp densities in each 2 x 2 quadrat in each plot, the
variance-to-mean ratio (V/m) (Pielou, 1974) was calculated for each major
(frequency Z 5 %) species in each plot and for each major species in each
forest type. .The biological null hypothesis that sporocarps fruit at
random among the quadrats of a plot is tested as the statistical null
Chapter 2 49
hypothesis that sporocarps are equally likely to occur in each quadrt.
Greig-Smith (1983, p. 62) explains that under this null hypothesis the
V/m is 1 and its statistical significance is tested by a
goodness-of·fit-test of the form:
x= = (n-1)(V/m)l
where v is the unbiased estimate of variance, m is the sample mean, and
n—1 is the degrees of freedom. The number of quadrats, n, is the sample
size. A V/m not significantly different from one is expected if the
sporocarps are distributed at random among the quadrats.'
Mean crowding (m* = m + V/m · 1) measures the mean number of neighbors
of the same species per individual sporocarp in a single quadrat.
Lloyd°s index of patchiness (m*/m) also characterizes sporocarp
aggregation by measuring the intensity of the pattern. In other words,
patchiness is high when the pattern shows strong density contrasts andl
is nearly one or less if density contrasts are low (Pielou, 1974). The
patchiness index is independent of density under certain conditions.
Random removal of individuals from sampling units does not effect its
value, therefore patchiness is recommended for comparing the intensity
of fruiting patterns among sample sites or among species.
Spatial autocorrelation (Cliff and Ord, 1973; Sokal and Oden, 1978)
determines whether at one location is correlated with the value of a
variate depends on the values of the variate at neighboring locations.
This technique was employed to determine whether the presence of each ·
major species depended on its location in neighboring quadrats. Expected
Chapter 2 50
join counts of occupied quadrats were calculated under the null hypothesis
that occupied quadrats were randomly distributed and that they could be
joined as queen moves in chess or weighted by the inverse of the distance
squared between centers of occupied quadrats. lf the observed joins of
occupied quadrats significantly exceeds the expected, then they are
positively autocorrelated indicating aggregation or clumping. If the
observed joined are significantly less than the expected joins, then the
occupied quadrats are negatively autocorrelated indicating uniform or
regular patterning.
When a large number of species occupy a similar trophic level of a
comunity, a natural question is, are they associated or do they occur
independently of each other? When the number of species (k) is large the
number of possible interspecific interactions increases geometrically.
Conceivably these interactions could be tested by constructing a 2k
contingency table, but this is impractical. An alternative test was
developed by Barton and David (1959) and illustrated by Pielou (1974).
If species are distributed independently, the frequency distribution of
species densities should approximate a binomial distribution. The
deviation of the observed frequency distribution can be tested for
significance by a X2 goodness·of-fit test.
To test for possible interspecific associations or antagonisms, the
statistical significance for all co-occurrences for major species the X2
values using Yate°s correction for continuity was calulated for the 2 x
2 contingency table (Pielou, 1974). In addition, Cole°s index ofI
Chapter 2 51
interspecific association (Cole, 1949) was calculated for pairs of major
species. Values for Cole°s index range from +1 when two species are
always associated to -1 when they never co-occur. A value of 0 indicates
random association.
KE§llLI§
BAIIERNS ·
Sporocarps of all major species in both forest types were aggregated
(Figs. 8, 9, 11, 12; Table 11). The degree of aggregation varied among
species (Figs. 8, 9, 11, 12) and among plots for a single species (Tables
10, ll) as indicated by the V/m, mean crowding, and patchiness. Low,
insignificant V/m°s occurred only when sporcarp density was low
(<7/plot). Also as expected, when enough frequency classes were
available, the frequencies of sporocarp densities/quadrat exhibited poor
fits to expected values derived from a Poisson distribution.
In most cases, deviations from the expected values occurred because more
quadrats had no sporocarps and more had high densities than expected
indicating aggregation within quadrats.
The degree of aggregation of sporocarps based on the entire forest
samples differed among the major species as indicated by the V/m, mean
crowding, and patchiness indices (Figs. 8, 9, 11, 12). The V/m and mean
crowding were highest in the coral fungus, Qlaygligg ggistggg, because
Chapter 2 52
it formed dense clusters of sporocarps (up to 261/quadrat/3 yr). Some
species. e- s· Russula xramlla:1. Lastarius lizn1o.ts.l1us„ Balems b.¤su.us,
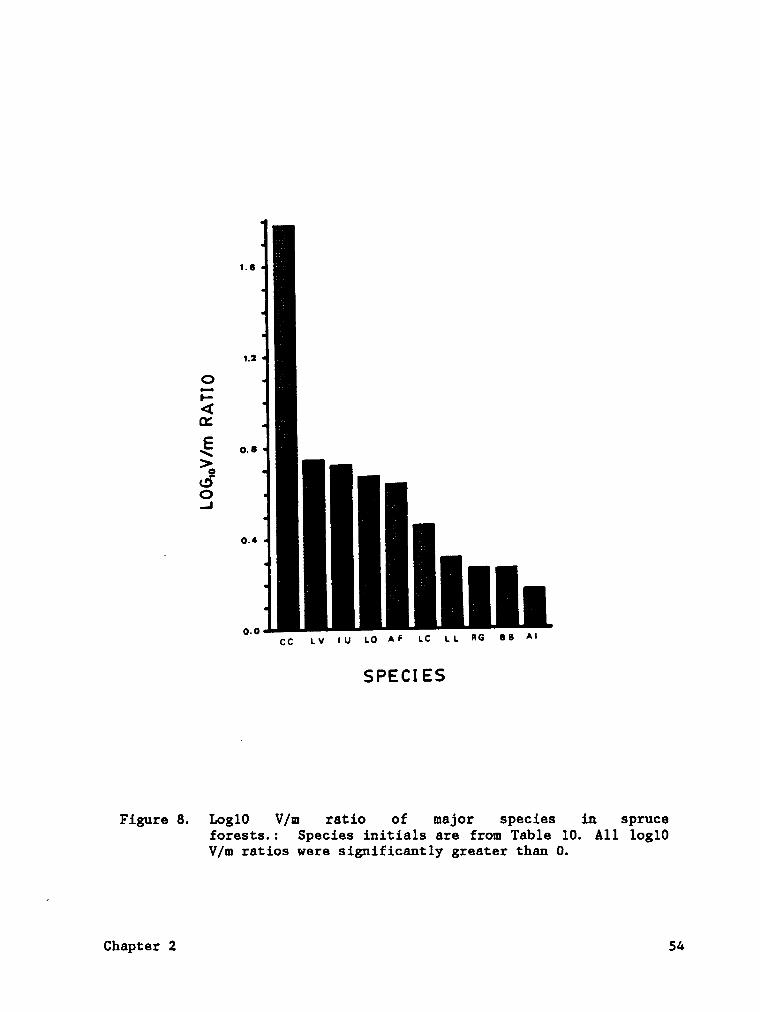
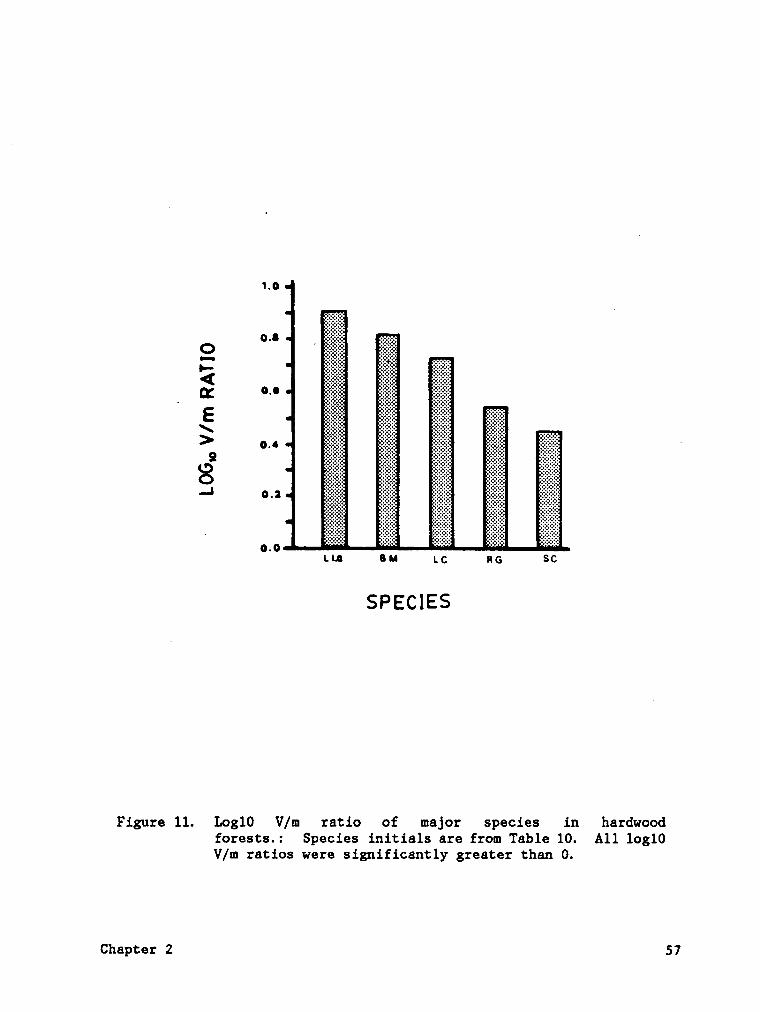
and Amggjgg igggrggg usually fruited singly or in small groups. High
patchiness was characteristic of species producing localized, dense
clusters of sporocarps with the clusters separated by large intervening
areas where either sporocarps were absent (e.g. Lgggggigg ggmphgggggg,
lgggyhg gghgjng) or uniformly present at low densities (e.g. Qlgggljgg
g;i;;g;g) (Figs. ll, 13). Species with a low uniform sporocarp density
(e.g. Amggjgg jggggggg) or high uniform density (e.g. Lgggggigg
ggglgggg) were characterized by low patchiness indices.
With the exception of Qlgggligg grjggggg, the V/m and mean crowding
of the major hardwood and spruce species were comparable. However, the
patchiness indices were much higher for all hardwood species because the
gregarious sporocarp production of Lgggggjg lgggggg, Rg;;g1g ggggglggg,
Lgggggjgg gggphg;g;g;, and Sglgrgggrmg gigrjggm was restricted to thel
rhizospheres of the few {ggg; and Qgggggg trees and ßglggjggllg;
mgggligigg; around the {rggiggg trees. Conversely, exclusion of
ectomycorrhizae from the areas dominated by endomycorrhizal tree species
and ferns may have contributed to the patchy distribution of sporocarps
in the hardwood forests.
Frequency maps (Appendix B) indicate that species often occured in
contagious patterns. The contagious sporocarp frequency of ßglggjggllgg
ggggljgiggg (plot H6) was caused by two individual mycelial patches
producing sporocarps (Cotter and Bills, in press). Sporocarp density of
Chapter 2 53
1.6
1.2
OE<IZ
0.6>o6O.J
0.•
Orocc LV nu LO AF LC LL HG 88 ^*
SPECIES
Figure 8. Logl0 V/m ratio of major species in spruceforests.: Species initials are from Table 10. A11 log10V/m ratios were significantly greater than 0.
Chapter 2 S4
00
es
OEO2O so1UZ<LU2
es
V0‘ cc LO LV uu AF LC LL as nc; AI
SPECIES
Figure 9. Mean crowding of major species in spruceforests.: Species initials are from Table 10.
Chapter 2 55
II
10
U7V7 .UJZI
_ UI-g | .
0 LC nu cc LV AF R AI LL es LO
SPECIES
Figure 10. Patchiness of major species in spruce forests.: Speciesixxitials are from Table 10. .
Chapter 2 56
1.0
\‘
°_ 0 aésséaäsLw¤M LC nc Sc
SP ECIES
Figure 11. Logl0 V/m ratio of major species in hardwoodforests.: Species initials are from Table 10. All log10V/m ratios were significantly greater than 0.
Chapter 2W
57
s
z ’-,;;:;L-<L
Lg am L c n 6 s c
S PE C I E S
Figure 12. Mean crowding of major species in hardwoodforests. : Species initials are from Table 10.
Chapter 2 58
•c
E man‘°0•-¤
Eiägigä =E=i;E;E3E =E=E=E=E=· :i=i=i=E=Lg L c n 6 a M s 6SPECI ES
Figure 13. Patchiness of major species in hardwoodforests.: Species initials are from Table 10.
Chapter 2 59
ß. mgggljgiggs in one quadrat was clearly dependent on sporocarp density
in nearby quadrats. Although the mycelial pattern was not be directly
mapped for other species, the hypothesis that the occurrence of sporocarps
in a quadrat depended on the presence of sporocarps in nearby quadrats
rather than being randomly or regularly dispersed was tested using spatial
autocorrelation. Each major species, except ßglggggggm giggjggm, in both
hardwood and spruce forests was positively autocorrelated in at least one
of the plots in which it occurred (Tables 13, 15).
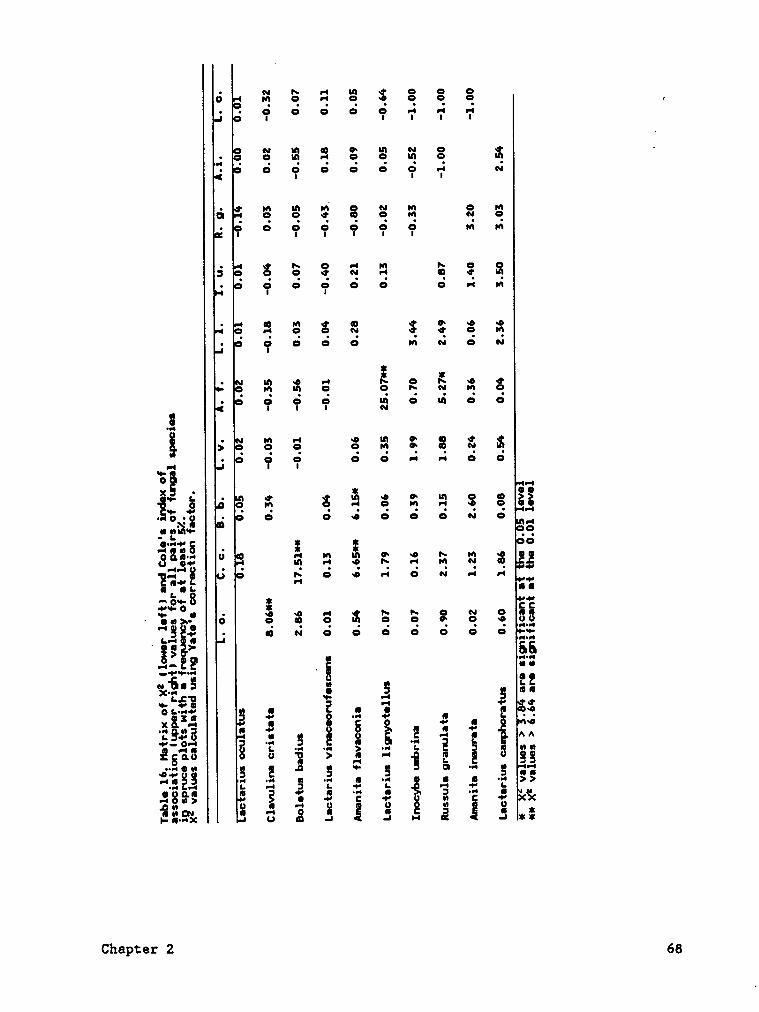
Most pairs of major species in the spruce forest were distributed
independently of each other as indicated by the X2 of the 2 ¤ 2
contingency tables and Cole's index (Table 16). However, :ignificantly
more co·occurrences than expected were detected in three speciespairsA.
flgyggggig). Significantly fewer co·occurrences than expected were
detected in three other species pairs (A. flgyggggjg - Q. ggjstggg, A.
tlmzsaszuia · E- b.¤dJ.u.s. A- flaysmnla · K- z:.¤11ula:.a>- Significant x'
for association were always accompanied by Cole's indices equal to or
greater than 0.18. Insignificant or low X2 values indicating random or
negative association were not always matched by low values of Cole's
indices. Low values for Cole's index were often the result of species
being so rare that their co-occurrences were improbable.
Chapter 2 60
Tabl•_10. Characferization cf_th• spatial patterns gf ferrastrialbasgdxomyceta sporocarps xn sxx spr-uce ploßs by var1anc•—·to-mean
raho (Y/nl. nean_cs-owdxng lm-!). and pafchxnass
ln!/ml xn 64 conhguous 2 X 2 n quadrafs._
specxas pIo¥ ¥¤¥alspororcarps V/an uu! vu!/a
Clavulina crisfata $1 500 46.79c 53.61 6.86
Clavulgna crrstaia $2 163 13.07c 14.62 5.74
Clavulgna crgstata $7 515 141.51c 148.56 18.46
Clavulgna crgstafa $8 605 20.68c 29.13 3.08
Clavulgna crgstata $9 60 9.00c 8.94 9.53
Clavulxna crxstata S10 62 13.23c 13.21 13.62
Lactarjus cculatus $1 64 1.72c 1.75 1.75
Lactarrus oculafus $2 159 3.09c 4.58 1.84
Lacfaqus oculafus $7 170 6.31c 7.97 3.00
Lacfargus oculafus $8 140 4.49c 5.68 2.60
Lacfaqus oculatus $9 43 4.11c 3.79 5.63
Lacfarxus oculatus $10 37 2.68c 2.26 3.90
Bclefus badjus $1 2 0.98 0.02 0.49
Bolefus badgus S2 14 1.66c 0.88 4.03
Boletus badgus $7 20 2.73c 2.04 6.53
Boleius bad;us S8 55 1.44b 1.30 1.51
Boletus badgus S9 22 1.41b 0.75 2.18
Bolatus badxus $10 14 1.37b 0.59 2.71
Lactarjus vjnaceorufescens $1 1— 0.02 1.00
Laciargus vgnaceorufescens $2 4 - 0.52 8.36
Lacfargus vgnaceorufescens S7 28 6.38: 1.89 4.33
Lactaqus vgnaceorufescens $8 42 18.95c 4.55 6.94
Lacfargus vgnaceorufescens S9 68 37.75c 5.01 4.72
Lactarxus vxnaceorufescens S10 35 17.55c 9.24 16.89
Lactarius ljgvyofellus S1 17 0.75 0.72 2.74
Lac{ar;us lrgsyofellus S2 39 7.35b 1.52 2.49
Lactargus lggnyotellus S7 3 - 0.69 14.77
Lacfargus lrgnyofellus $8 4 - 0.55 8.37
Lactargus lggvyotellus S9 28 6.42: 1.75 4.00
Lactarxus lzgsyoiellus 6 $10 _ _ 17 0.75 0.69 7.37
Amanjta flavoconia S1 24 3.60c 2.97 7.93
Amangta flavoconga S2 91 5.13c 5.55 3.91
Amangfa flavoconya $7 4 1.46b 0.52 8.36
Amanyk: flavoconp $8 3 0.98 0.02 0.33
Amangia flavocong.: $9 35 1.68c 1.22 2.24
Amanzfa flavoconxa $1 8 1.65c 0.77 6.20
Inocyb• uubrjna $1 8 1.90c 1.03 8.23
Inocyb• unbrgna $2 15 3.08c 2.31 9.88
Inocybe uvbrgna $7 13 3.46c 2.67 13.14
Inocybe urbrgna S8 5 1.75c 0.83 10.59
Inocybe unbrgna $9 54 6.82c 6.66 7.89
Inocybe uubrxna $10 11 4.90c 4.08 23.72
Russula granulata $1 15 1.86c 1.09 4.67
Russula granulata S2 7 2.93c 2.04 18.71 '
Russula granulafa S7 7 1.19 0.30 2.78
Russula granulaf: S8 13 1.59b 0.79 3.91
Russula granulaf: $9 3 1.64b 0.69 14.77
Russula granulat: S10 1 1.00 0.02 1.00
Amanjia Qnaurafa $1 20 1.31: 0.62 1.99
Amangfa xnaurafa $7 1 1.00 0.02 1.00
Amangta Qnaurat: $8 1 1.00 0.02 1.00
Amangia gnaurata S9 4 1.46b 0.52 8.36
Amamta znaurafa S10 3 1.64c 0.69 14.77
Lacfarjus eanphoratus $7 24 2.41c 1.78 0.76
Lactargus camphoratus S8 13 3.62c 2.83 13.91
Lactarxus cauphoratus S9 8 2.16b 1.28 10.27
3 5,ÖI < F < =< Ü,Ö§
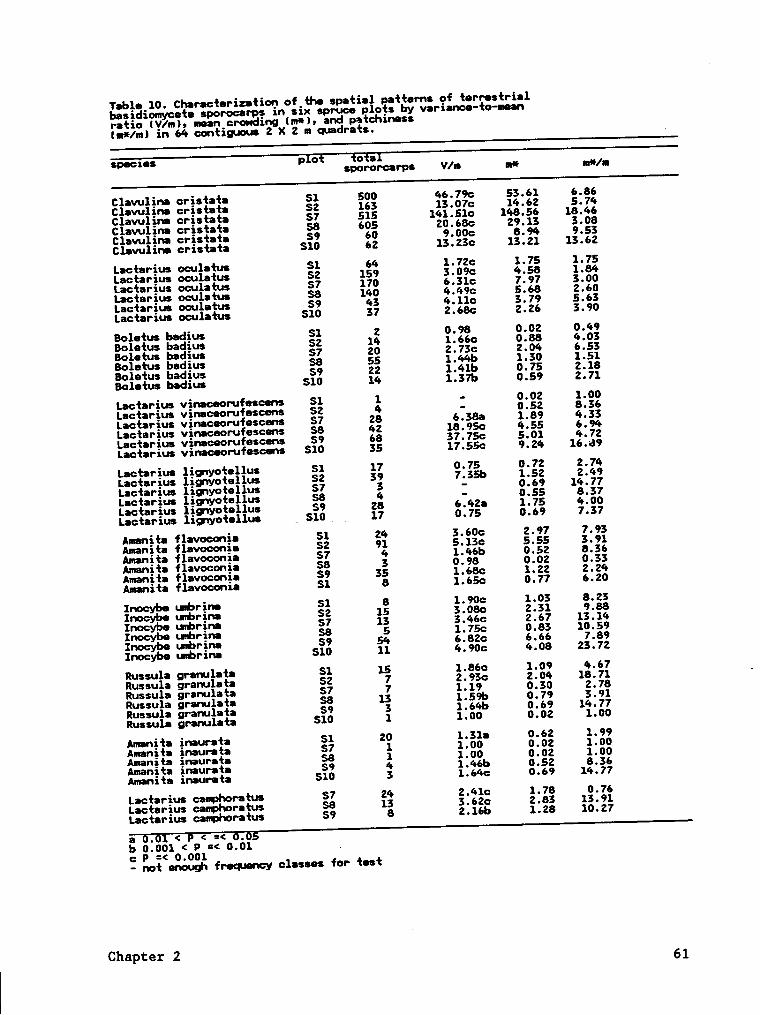
b 0.001 < P =< 0.01 .c P =< 0.001· nof enoudu frequency classes for test
Chapter 2
i61
Tab1•_11. Charachrizafiop of_fh0 spafial Yntfems of_hrr•s·!ri•1bas;d1omyce‘l:• gporocarps xn sgx harduoogl p ots_b¥ yar~1;n0•-fo-mean·_ raho IV/nl, X ?o0<h•ss·ofyf1·I:_of ag Poxsson dxs rxbufxon _on {hs obs•rv0d_ raqusncy dgsirzbufxoq of sporocarpm mean crcwdxng(nä), and p•t0h1.n•ssI¤e*/ml xn 64 contxguous 2 X 2 n quadrats.
specxas pIo¥ ¥o¥aIspororcarps V/n nl nl/n
L•0hrjus canphorafus H3 11 1.750 0.94 5.45Lachrgus canphorafus H4 27 9.020 8.44 19.99Lachrgus camphorafus H5 12 2.680 1.87 10.00Lachrgus camphorafus H6 7 2.940 2.04 18.70Lachrgus ¢8lI!h0|‘I*U$ H11 3 1.650 0.69 14.77Lach:-aus caunhoratus H12 1 1.00 0.02 1.00Russuln granulah H4 17 5.530 4.79 18.04Russula granulah H5 6 1.26 0.35 3.76Russula granubta H6 4 2.480 1.54 24.62Russub granubh H11 11 3.060 2.23 12.97Russula granulah H12 - 6 0.92 0.01 0.15 _Bo-1•·tin•11us ¤••ru1ioid•• H6 106 5.040 5.70 3.44 _Sclsroderma cifrirun H4 37 2.400 1.98 3.43
ISclaroderma citrinun H6 1 1.00 0.02 1.00La00•ria bccah H3 1 1.00 0.02 1.00 .Laccaria 1•00af• H4 8 2.410 1.50 12.30Laccaria bccah H5 1 1.00 0.02 1.00 «Laccaria laccafa H6 32 11.430 10.93 21.86Laccaria bccah H11 1 1.00 0.02 1.00Laccaria bccah H12 8 1.650 0.78 6.21a 0.01 < F =< 0.05b 0.001 < P =< 0.010 P =< 0.001
Chapter 2 62
Table 12. Significance tests for spatial autocorrelation of- major basidiomycete species in spruce plots.
Frequency (freq) is the number of quadrats a species occupies.S.N.D. is the standard normal deviate.Occupied quadrats (BB), occupied and empty quadrats (BW),and empty quadrats (WW) were joined by queen°s moves.
species freq no. of S.N.D.plots BB BW WW
Lggtggigg ggglgggg 179 6 2.92c -3.19c 1.64a
Qlgygligg ggiggggg 148 6 4.46c -6.52c 4.81c
ßglgggg hggjgg 79 6 1.90a -4.32c 3.93c
Las:.a:.um 67 6 7-35<= ·S•21<= 1.916
Aggjtg flgyggggjg 64 6 2.44b -4.31c 3.64c
ljggygtgllgg 57 6 5.80c -2.51b -0.17
lgggygg gmbgjgg 38 6 4.28c -1.12 -0.36
Rgggglg gggglgtg 30 6 4.54c -5.56c 4.36cl
Amggita jgggggtg 21 5 1.90a -2.48a 1.89a
Lggtggigg ggmphgggggg 19 3 2.15b -2.39b 1.78a
a 0.05 < P S 0.10 ·b 0.01 < P S 0.05c P S 0.01
Chapter 2 63
Table 13. Significance tests for spatial autocorrelation ofmajor basidiomycete species in hardwood plots.Frequency is the number of quadrats a species occupies.S.N.D. is the standard normal deviate.Occupied quadrats (BB), occupied and empty quadrats (BW),and empty quadrats (WW) were joined by queen°s moves.
species freq no. of S.N.D.plots BB BW WW
Lggtggiggyggmphgggggg 23 6 4.69c -2.72c 1.57
Rgggglg ggggglggg 23 6 3.49c -0.91 0.01
ßglggjggllgg mg;g1;gi§g5 23 1 6.47c -7.92c 5.08c
Sslsmdema szitxinum 21 2 1- 47 -1- 20 0- 46
Lgggggjg lggggtg ° 17 6 4.13c -2.51b 1.54
a 0.05 < P S 0.10b 0.01 < P S 0.05c P S 0.01
Chapter 2’
64
Table 14. Significance tests for spatial autocorrelation ofmajor basidiomycete species in spruce plots.
_Frequency (freq) is the number of quadrats a species occupies.S.N.D. is the standard normal deviate.Occupied quadrats (BB), occupied and empty quadrats (BW),and empty quadrats (WW) were joined by the inverse of thedistance squared between their centers.
species freq no. of S.N.D.plots BB BW WW
· Lggtggigg ggglgtgg 179 6 2.37b -2.17b -0.07
Qlgygligg ggjggggg 148 6 3.33c -4.86c 3.72c
ßglgtgg hgjigg 79 6 0.99 -3.03b 3.04b
Lasxarius 67 6 4-95<= -3- 33c 1- 10 -Amggjgg f1gygggn1g 64 6 1.86a -3.69c 3.29c
Lgggggjgg ljgnggtgjlgg 57 6 4.84c -2.17b -0.07
Lggggbg gmhgigg 38 6 3.70c -0.19 -1.19
Rgggglg ggggglggg 30 6 3.64c -5.14c 4.24c
Amggjgg jngygggg 21 5 1.16 -2.26b 2.00b
Lggtggjgg ggmphgggtgg 19 3 1.72a -2.16b 1.70aK
a 0.05 < P S 0.10b 0.01 < P S 0.05c P S 0.01
Chapter 2 65
Table 15. Significance tests for spatial autocorrelation ofmajor basidiomycete species in hardwood plots.Frequency is the number of quadrats a species occupies.S.N.D. is the standard normal deviate.Occupied quadrats (BB), occupied and empty quadrats (BW),and empty quadrats (WW) were joined by the inverse of the ,
. distance squared between their centers.
species freq no. of S.N.D.plots BB BW WW
Lagtggigg ggmghgrgggs 23 6 3.75c -2.51c 1.58
Ryggylg ggggglgtg 23 6 2.71c -1.05 0.34
ßglgtjggllgg mgggligjjgg 23 1 6.47c •5.88c 3.76c
ßglgggggggg gjtgjggm 21 2 » 1.66a -0.64 -0.33
Lgggagjg lggggtg 17 6 3.19c 3.19c 1.34
a 0.05 < P S 0.10b 0.01 < P S 0.05c P S 0.01
Chapter 2 66
Only one species pair (L. gamphgrgtus - R. grgnylgtg) in the hardwood
forests was positively associated (Table 17). However, quadrats occupied
by L- samvlxuamu. E- z:.¤m1l¤.ta„ L- lasaeata. and S- sitrinum after:
occurred near each other in plots H4, H11, and H12 probably because their
sporocarps arose from mycelia associated with the same [ggg; and Qgggggg
trees. The lack of co-occurrence among these species might have been
because the quadrats were too small include more than one or two species.
When 2 x 2 quadrats were combined into 4 x 4 quadrats, the co-occurrence
of these species still did not deviate appreciably from expected values.
The statistical significance for co-occurrence could not be tested‘
because of low expected values obtained when the quadrats were combined
(1 to 3).
The hypotheses that all species of the spruce forest type (27) and all
the species of the hardwood forests type (36) were distributed
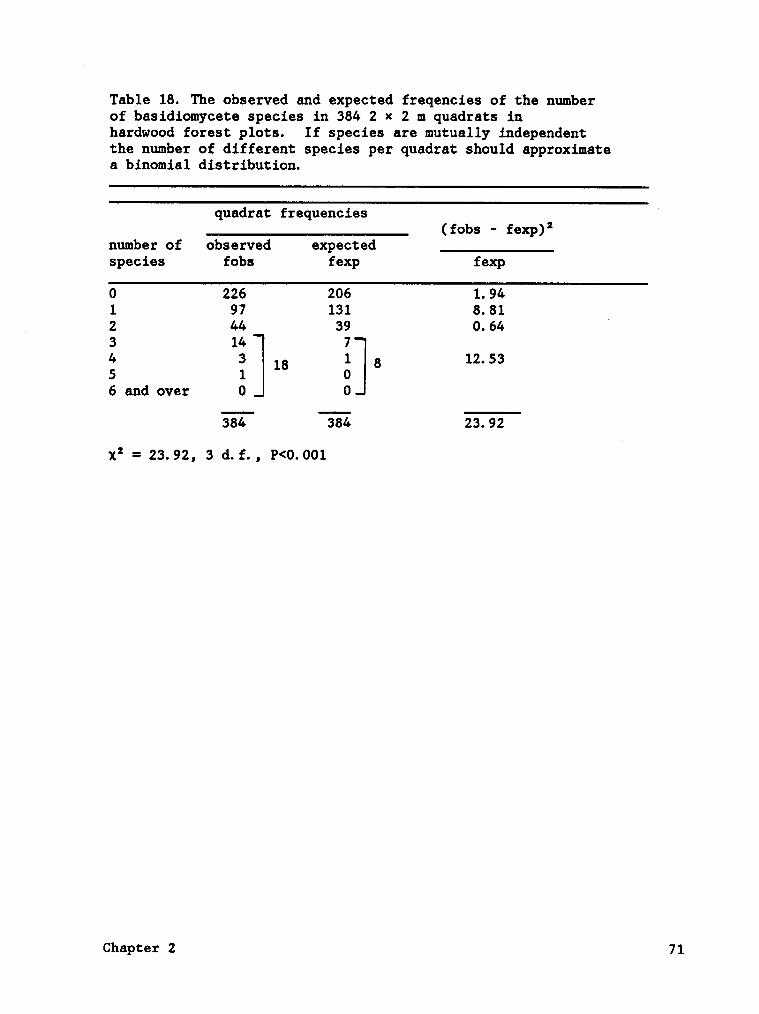
independently among the quadrats were rejected (Tables 18, 19). In the
spruce forest, fungi were absent in more quadrats (54) than expected under
the null hypothesis and fewer quadrats had four or more species than
expected (Table 18). The species of the hardwood forest type appeared
to be aggregated in certain locations and absent in others because no
fungi occurred in more quadrats than expected and two or more species
occurred more quadrats than expected (Table 19).
Chapter 2 67
°r· S'. '6 S ä Q
°
• • •
6
°
H,,‘
T, •
9Ü
°4 I I
_
N III ¢ Q2,0 In -1 Q , , . J1‘
6 => Q° 9 9
.Q NI. ··· ··· 2 S 2 2 Q QÜ Q Q • • •
6 Ü 44. ' Q 9 9 9 9 ¤I
A 0 ¤. S 'a S a' 2 Q Q Q¤ • , • •6
°
pl Ü. 9 ° 9
0 ~• ~0. 2 ä S 2 $ Q Q -2, • •° N
_ ' 6 0 0 ¤ '^ N QI
{ zu 0. Ih ~¤ •'*S Ä Z InIn G , • •
'°
, • • •In
°In Q. 9 Q Q u••
•••
Q. 0. an g S :2 °;QH. I I4-4gg
=· Q ää0 III ¢x_•_
c , g g 2 -1 *2 Q •-•°§,•_ ,3 •6 6 J
°Q Q N Ö
S•••¤•O
°••
.·•0:}+{ ä °
'.A M *2-2:*58 ' ·•
-^ Ä 3 M °f Q fg°¤_Q•« U gg H *0 , •*4 , • •
,4 rlQ-I3
· ' rl ¤ ·• "‘ Q Q ·‘°§.-IEgtäga0 N
°
$—•Q°6· _ ä ~e g 5 S '6 vg Q *2 S.;~ $0 - °Q Q
·‘
6 6 ¤° ° ..3-°•
MSE: ° ° N ° ° ssg.-I R«.••
' gß > ·g>-·:....§ ° Ü„
g ÜNan I ,2 •-I 4-• 0"°C.c"' [ ‘°••— ·•-.2
Q ·•Q •‘ .~Ä°"'?‘·-
Ü T- Ü § ° E Q 3 Ü ^^.5 0%
'l:
U E ••• Iä2 00
L 'V un U·
.;• L = 8+--0-** I. ·•• "‘> I-I*‘¤I
1 > Ü L ,.4••••°U:
·
,,-
·L
0-H „ .••Ü ‘:
*4, "I 2:
·
N-***7 L -·• 7 ...• • Q -•« X...• •-·• +• n 0 C
¤.•
"g • ·•·* ¢
" eo°
080 U
E Q I
—• ¢> Q •• ··• „ • 7< .; xx
JW g H ,4 H Ünum U -¤}.·••¤•X
68Chapter 2
Table};. Hafrix of $2 l•f$) •n•i|1Co1q'• igdex afl _ _-assocxa mn ¤.pp•r rx va ues or a aus o mga s usig hardnood {lots wifgia frequency of at IeasfpxX
values ca culated usmg Yate's correchon factor.
E. c. E. 9. E. nn. S. c. C. I.
Lachrius cauphoratus 0.21 -1.00 -1.00 -1.00
Russula grnnulata I3.96! -1.00 -1.00 0.02
Bolefimllus narulioides 2.90 2.90 -1.00 -1.00
$cl•r0der¤•• eifrimn 2.76 2.76 2.76 0.13 _
Laccaria laccata 2.52 0.29 2.52 2.94
·l Rz vaIu•s > 6.04••·•
$1§11¥l¢3h{ a¥ TF: 0.0I I•v•I
Chapter 2 69
Mosaics are patterns resulting from different areas of a plane having
different properties (Pielou, 1974). Continuous colonies of vegetatively
propagating plants are often considered as vegetation mosaics. The
spatial patterns of sporocarps can also be envisioned as species forming
overlapping mosaics of different sizes with different densities of
sporocarps within the mosaics. The presence and absence of a mushroom
species forms a two-phase mosaic while the combined presence and absence
of several species forms a multi-phase mosaic. The boundaries of the
mosaic phases are not well·defined because of the variation in sporocarp
densities and, as with the vegetative clones of higher plants, mosaics
of mushrooms were variable in size and shape. The clonal nature of
adjacent sporocarps was not obvious, however, because scattered, widely
separated individual sporocarps may be connected by a continuous
widespread mycelium or they may arise from small widely scattered mycelia.
Mosaic patterns may form in response to either the heterogeneity of
the biotic or abiotic environment. Abiotic factors might include
subsurface rock, soil depth, soil moisture, or canopy cover. Biotic
factors might include the availability of colonizable host tree roots,
physical exclusion by large tree roots or rhizomes of herbaceous plants,4
predation by soil invertebrates, or antagonistic or synergistic
interactions with other rhizosphere organisms. Measurement of the size
of the fruiting mosaics was often limited by plot boundaries.
Chapter 2 70
Table 18. The observed and expected freqencies of the numberof basidiomycete species in 384 2 ¤ 2 m quadrats inhardwood forest plots. If species are mutually independentthe number of different species per quadrat should approximatea binomial distribution.
quadrat frequencies '
(fobs - fexp):number of observed expectedspecies fobs fexp fexp
0 226 206 1. 941 97 131 8. 81
7 2 44 39 0. 64”
3 14 74 3 1 8 12.53S 1
180
6 and over 0 0
384 384 23.92
X2 = 23.92, 3 d. f. , P<0. 001
Chapter 2 71
Table 19. The observed and expected freqencies of the numberof basidiomycete species in 384 2 x 2 m quadrats inspruce forest plots. If species are mutually independentthe number of different species per quadrat should approximatea binomial distribution.
qllßdfßt frequencies(fobs • fexp)‘
number of observed expected _____i
species fobs fexp fexp
0 54 36 9. 011 83 100 2.892 105 119 1. 653 84 82 0. 054
”42 35 1.45
5 ll 10 1. 336 4 2 127 1 16 0 .8 and over 0 0
‘
EZ E 16. 38X2 = 16.38, 5 d. f. , 0.01>P>0. 001
Chapter 2 72
The spatial patterns of the fungi were different between the two
forests and were highly dependent of the distribution of the canopy trees.
The mosaics formed by major species in the spruce forests often approached
the size of a single plot. Extrapolating to the scale of an entire spruce
forest, fruiting mosaics, and presumably the corresponding mycelia, of
common species can occur over extensive continuous areas. These patterns
indicate that a large percentage of the spruce trees in these homogeneous
forests have the same fungal species associated with their root zones.
At the finer scale of the quadrat in the spruce forest, extensive overlap
or intermingling of mosaics occurs, probably because single trees can
support several species of fungi. In contrast, fruiting patterns in the
hardwood forests indicate that only a relatively small proportion of the
rhizosphere was occupied by ectomycorrhizal fungi. The fruiting mosaics
· were relatively small and restricted to the vicinity of ectomycorrhizal
trees or were·excluded from the rhizospheres of endomycorrhizal trees and
ferns.
Indices of spatial aggregation based on heterogeneity of mean
densities not only demonstrated that sporocarps occurred non-randomly but
appeared to be useful for describing and comparing the degree of sporocarp
aggregation and the dispersion of the sporocarps aggregates. The indices
confirmed mathematically the investigator's intuitive perception of
sporocarps patterns and the differences in patterns among species. The
patchiness index was especially useful for illustrating the differences
in sporocarp dispersion between the more structurally homogeneous spruce
forest and the more structurally heterogeneous hardwood forest. ‘
Chapter 2 73
Spatial autocorrelation was of limited value for describing the
spatial patterns of sporocarps. Large areas where sporocarps occurred
in contiguous quadrats were often not autocorrelated probably because of
the small plot size relative to the size of the fruiting mosaics (Tables
12, 13, 14, 15). A more satisfactory impression of spatial pattern was
provided by inspection of the frequency maps (Appendix B). For example,
inspection of the frequency of S. gitgingm in plot H4 indicates an
occupied quadrats are closely associated with the root zones of Qgggggg
ggbgg. However, the join count statistics were not significantly greater
than expected under the null hypothesis of random pattern.
Statistically positive or negative associations between two species
could occur for several reasons. The two species could be mutually
beneficial on inhibitory or one could exert a synergistic or antagonistic
influence on the other. When environment is variable, the two species
may have similar or exclusive tolerance ranges for environmental
conditions (Pielou, 1974). When a large number of 2 X 2 comparisons are
made, the results of a few (5 Z if the significance level is 0.05) will
correspond to a low probability simply by chance. In the 45 comparisons
of major spruce species, two or three or the associations could have been
chance events. In the 20 comparisons of major hardwood species, one
association could have been a chance event. Rejection of the null
hypotheses of independence of species might mean that the quadrats are
dependent. This kind of positive association might be observed when a
coarse·grained mosaic of two species is sampled with closely spaced
quadrats (Pielou, 1974). If the mosaics of both are large relative to
Chapter 2 74
the study area, then extensive overlap of the large mosaics of each
species will result in greater joint occurrence than expected. When
viewed at a larger scale over the entire forest, the overlap of could be
a chance event without assuming mutual benefit or heterogeneous habitat.
The three positive associations in the spruce forest could have been
caused by overlapping mosaics because all the species that were positively
associated had high freqencies. The involvement of one species, Amnjgg
flgyggggjg, in all the negative associations seems more than
coincidental. Fruiting of Amanitg flgygggnig was noticeably constant in
certain quadrats over the three years. Further studies designed to test
the hypothesis that root zones colonized by A. flgyggggig cannot be
infected by other mycorrhizal fungi might be profitable.
Chapter 2 75
QHAEIERL. S.INQES.I§QERH§§LlI«AlN1lIEEQBE§.'L&QE1llEnS9Ll'lliEM
Most North Amercian Russulas remain inadequately described or are
without descriptions readily available in the North American literature.
Most North American taxa were described in the late 1800°s or early 1900°s
by C. H. Peck, C. H. Kauffman, H. C. Beardslee, G. S. Burlingham, W. A.
Murrill, and R. Singer. These mycologists were largely unaware of the
complexity of the genus, the need for detailed macroscopic descriptions
~accompanied by accurate illustrations, and the usefulness of comparative
micromorphology for consistent delimititation of taxa. Kgsgglg, perhaps
_ more than any other genus of agarics in North America, has suffered from V
wholesale misappllcation and overextension of names of European taxa by
both early and modern mycologists.
The first attempt of any comprehensive treatment of North America
Russulas employing modern morphological descriptions was by Singer
(1957). He provided descriptions for about 80 Russulas of North America.
No keys to taxa were included, but the taxa were arranged in a systematic
framework as outlined in other works (Singer 1949, 1962). The
investigator willing to collect the necessary macroscopic data and to
examine the micromorphology of the pileus cuticle, hymenial cystidia,
spore ornamentation etc. could determine many North American taxa with
Chapter 3 76
some degree of certainty. However, Singer°s descriptions were
- unillustrated and often based on examination of limited numbers of fresh
specimens. Futhermore many descriptions were based on populations from
widely separated geographic without indication of which specimens the
descriptions were based on. As a result, Singer°s treatment has been
difficult to utilize and his conclusions on specific taxa must be
interpreted cautieusly.
The first truely usable and methodologically sound treatments of North
American Russulas were those of R. L. Shaffer (1962, 1964, 1970a, 10970b,
1972, 1975). Shaffer provided meticuously detailed descriptions, keys,
and illustrations in monographic form for several subsections of
Kgggglg. Most Russulas encountered in northeastern North Amercia
belonging to subsections treated by Shaffer can now be determined with a
high degree of confidence.
Studies of Russulas in the Southern Appalachians are limited.
Burlingham (1915) mentioned the occurrence of a few taxa in the mountains
of southwestern North Carolina. Beardslee (1918) provided brief
macroscopic descriptions for a few taxa in the vicinity of Asheville,
North Carolina. L. R. Hesler°s series of papers on fleshy fungi of the
Southern Appalachians and his book, Mgggggggg gf ggg Qgggg ßmggggg
(Hesler, 1960), contain brief descripticns and photographs of a few taxa.
Hesler's greatest contribution to the knowledge of the Southern
Appalachian Russulas was his accumulation of collections, notes, and
photographs of specimens from eastern Tennessee and western North
Chapter 3 77
Carolina. Hesler°s attention to recording fresh characters combined with
his type concepts of Rggsglg (Hesler, 1960; Hesler, 1961) made his
specimens an invaluable resource. He was able to apply names to many of
his specimens, often accurately, and these specimens are the basis for
the checklist of the Russulas of the Great Smoky Mountains National Park
(GSMP) (Petersen, 1979). Hesler went so far as to compile a key to
Kggsglg based on his field observations anu notes from his type studies.
The inclusion of large numbers of taxa known to Hesler only from dried
materlal (especially taxa described by W. A. Murrill) limited the ·
usefulness of this key.
Singer (1938, 1939) described several Russulas, including some new
species, from the GSMNP based on specimens and notes of A. H. Smith. The
descriptions were very brief, published in French, and therefore largely
ignored by North American mycologists. During the 1940°s, Singer spent
two summers at Mt. Lake, Virginia. Descriptions of some of the Russulas
collected during these visits were included in his treatment of North
American Russulas (1957). One new species, R. gpgglgghjgggig Singer,
(1948, 1957) was described from Mt. Lake, Virginia.
Finally, in his monographs (1962, 1964, 1970a, 1970b, 1972, 1975),
Shaffer cited several specimens of Russulas as occurring in the Southern
Appalachians based on his visits to the GSMP and material from Hesler°s
herbarium.
Chapter 3 78
I present here a sumary of the taxa that I have determined to date
from the higher elevations of the Southern Appalachians. The taxa are
arrranged by the sections of Romagnesi (1967) except for the subsections
Aruhaainaa, Amaeninaa, Mudastinaa, and which are either
absent in Europe or which I choose to recognize at a lower taxonomic level
than Romagnesi.
ß QE BSÄÄSLZLA IN IHLE EQRESIS
RUSSULA (Pers.) S. F. Gray
Subsection ARCHAEINAE Heim
RUSSULA EARLEI Peck, Neg Xggk ßggtg Mg;. Bull. No. 67: 24, pl. N.,
figs. 5-10. 1903.
This unusual species occurs in high elevations of the Allegheny
Plateau, the Valley and Ridge province, and the Blue Ridge Mountains.
See Bills and Miller (1984) for a description and discussion.
Section PLORANTINAE Bataille
RUSSULA BREVIPES Peck, Annual Ban- Hau Xszzls §.t.a1;.e Muaeum
43: 20. pl. 2, figs. 5-8. 1890.
Chapter 3 79
Rggggla hggyjpgg and its varieties are common throughout the region.
See Shaffer (1964) for descriptions and discussions.
Section NIGRICANTINAE Bataille
RUSSULA DENSIFOLIA (Secretan) Gillet, Hymgn. p. 231. 1874.
. Romagnesi (1967) indicated the taxon referred to as R. gggsijglig by
American authors may not be the same as Agagiggg ggnsjjglig Secretan and
perhaps should referred to R. aggifglia Romagnesi. Rggsglg Qgggjfglig
and its variants are commonly encountered in the Appalachians. See Shaffer
(1962) for an account of North American populations.
Section INDOLENTINAE Melzer and Zvära
RUSSULA VARIATA Benning, ßg;. Qgz. 6: 166. 1881.
I have never seen this species in spruce—fir forests, but it is
extremely common in various hardwood forest types. See Singer (1957) and
Shaffer (1970a) for descriptions and discussion. Neither Singer (1957),
Hesler (1960), nor Shaffer (1970a) mentioned examining a type specimen
for the name K. yggigtg determined by Mary Benning. During a visit to
NYS in the spring of 1984, I was unable to locate a type specimen. The
original painting of R. ygrigtg by Mary Benning, however, was deposited
at NYS.
· Section VIRESCENTINAE Singer
Chapter 3 80
RUSSULA CRUSTOSTA Peck, Annual Reg. New Xggk ßtgtg Mg;. ·
39: 41. 1886.
To my knowledge, R. grggtggg does not occur in the spruce-fir forest
type, but it is common in various hardwood forests. See Singer (1957)
and Shaffer (1970b) for descriptions and comparison with the closely
related K. yjrgsgggs.
RUSSULA VIRESCENS (Schaffer : Secretan) Fries. Epjggjgjs
Sys;. Myggl p. 355. 1838.
Bgsgglg yjggsgeng appears to be restricted to forests dominated by the
Fagaceae (Romagnesi, 1967). My observations in the Appalachians agree.
See Romagnesi (1967) and Shaffer (1970b) for descriptions and
discussions.
RUSSULA POLYCYSTIS Singer, ßyll. §gg._Mygg1. Zgngg 55: 238. 1939.
7Prior to this study, Rgggglg gglygygtis had never been reported
occurring beyond the type locality under spruce on Mt. LeConte, Tennessee.
Presently, it is known only from high mountain regions of West Virginia,
Virginia, and Tennessee, but probably occurring throughout Southern
Appalachian Piggg rghggs comunities. It may represent a Buggy}; species
Chapter 3 81
truely endemic to the high•elevatiou forests of the Southern
Appalachians. See Bills (1984) for description and discussion.
Subsection AMOENINAE Singer
RUSSULA MARIAE Peck, Annggl Rgn. Egg Xgrk Sgggg Eng. 24: 74. 1872.
Rxmsnla alashuana Murrill. M1¢.o.1szg;La 3¤= 362- 1938-
Russia M¤rri11„ Llsmua 6= 217- 1943-
Russyla Murrill. Llmia 6= 218- 1943-
ßgggnlg mggigg is the most common and widespread member of the
subsection Amggnjngg Singer in eastern North America. A complete
description and taxonomic discussion can be found in Bills and Miller
(1984).
It occurs singlely to gregarious on soil or humus in deciduous forests
or mixed deciduous-coniferous forests. The author has observed
itfruitingin association with a variety of ectomycorrhizal trees including
2e.¤1.lal.au1;.a„ Eazuazrandiiella, mazmumimu, Issagaaanadmxais, and
ornamental Riggg ghigg. Habitat notes with herbarium specimens indicate
frequent associations with Qngggng species.
RUSSULA ACICULOCYSTIS Kauffman ex Bills & Miller, Eggglggig76: 990. 1984. -Keuffman ex Singer um am-
ßyl], Sg;. Egggj,. Zggngg S5: 243. 1939.
Chapter 3 82
Rgggglg mgrigg Peck, ;gg;g Singer, Sygggig
11: 185. 1957.
This taxon is only known from the Appalachian Mountains of West
Virginia, Virginia, North Carolina and Tennessee and nearby Piedmont
regions where it is very common. It fruits single to gregarious on soil
or bryophytes, especially in disturbed habitats, e.g. eroded areas, road
or stream banks, trails, or surface mines. It has been noted fruiting
under Quazmla minus,. Q., s.o.<;.c.in;La and athar app- . Batnln laura.
lisnza sanauansls. Blnua uizxiniaua. Biss: ahiaa. and athar Binuu spp- .and Qggyg spp. from June to September. See Bills and Miller (1984) for
description and taxonomic discussion.
RUSSULA FLAVIDA Frost an Peck, Annual Kan um Karls Slaßn Mus-
32: 32. 1880.V
Rgggglg mggigg var. flggjgg (Frost in Peck) Singer,
ßgll. Sg;. Myggl. [ggggg 55: 244. 1943.
ßgggglg flggigg fruits singly to gregarious on soil or humus, in
forests dominated by Qgggggg spp. such as Q. p;jgg;, Q. ggggiggg, [ggg;
xranslif.o.l.La.mu.1.a. l1aunaaanadansla¤nd£lmlaspp~Known from New York southward to Florida and westward to eastern Texas.
lt has been reported from eastern Asia (Chiu, 1945; Hongo, 1960).
Fruiting July to November. See Bills and Miller (1984) for description
and discussion. ·
Chapter 3 83
RUSSULA OCHROLEUCOIDES Kauffman, Mggglggig 9: 165. 1917.
— Russula maria: var- snbilmzida Singer. Bull- Sm- Mysel-
{gggg 55: 244. 1939.
Bg;;g1g dggg Burlingham, Mggglggig 16: 19. 1924.
Busäula suhgghrglggga Murrill, Mxgglggig 30: 363. 1938.
Bg;;g1g 1;g1;pg;g Murrill, Llgggjg 6: 212. 1943.
Kg;;g1g 1ggj;g;;ifg;mj; Murrill, Llgygjg 8: 266. 1945.
. Buääulß lßlääääßiifgliß Murrill, Llgggig 8: 267. 1945.
Rg;;g1g gghgglgggggdgg fruits solitary to gregarious on soil or humus
in forests dominated by Qgggggg spp., Qgggg spp., {ggg; ggggdifglig Ehrh.,
B.a1u:.La, B- laura. Isszgananadsnsia. Assxsasshamm. and
ßhgggggggggg spp. It has been reported from Newfoundland to Florida,
westward to Michigan from June to October. Dr. Richard Homola informs
me that it is fairly common under American beech in Maine. In Virginia
and West Virginia, it is also common under American beech but can also
be found in thin, dry oak-hickory forests. Although this species never
fruited in the quantitative study areas it was found under beech within
20•50 m of plots H5 and H6. See Bills (1984) for description and
discussion.
Subsection MODESTINAE Singer
RUSSULA MODESTA Peck, Mgg Xggk $3;;; Mg;. ßgll. 116: 78. 1907.
Chapter 3 84
Rgggglg mggggtg is one of the most common Russulas in the mixed
northern hardwood-red spruce forests of West Virginia and Virginia. It
fruits singlely to gregarious on humus under Eggg; gggngifgljg, ßgtglg
gggghgggm and Rhgggggggggn mgxjggm from July to September. Known from
New England southward to mountainous regions of West Virginia, Virginia
and Tennessee. This taxon was found in close proximity to all the
quantitative hardwood plots but never fruited within their boundaries.
See Bills (1984) for description and discussion.
Section HETEROPHYLLINAE Maire
RUSSULA VESCA Fries, Epiggigig $3;;. Myggl. p. 352, 1838.
Romagnesi (1967) indicated this was perhaps the most common Rgggylg
in central Europe. Singer (1957) and Shaffer (1970b) indicated it is
common in northeastern North America. QI have observed it fruiting
abundantly in yellow birch, beech, and eastern hemlock forests on the
Allegheny Plateau and in the Blue Ridge Mountains.
RUSSULA BRUNNEOLA Burlingham, N. Age;. E1. 9: 233. 1915.
This species has been described in detail by Singer (1957) and Shaffer
(1970). Shaffer also provided excellent illustrations of its important
microscopic features. Bgssglg hrgnngglg has been reported from
Washington State and throughout the northeastern United States and
Chapter 3 85
southeastern Canada. This species has now been observed in the higher
elevations of the Southern Appalachian Mountains. I have collected it
in forests of Biggg ggbgns and mixed forests of R. ggbggs, Ahigg
.f.r.es.e:.:L, Bssnla and Bamm xzandifalia- It prvbably ¤<=<=¤r¤
throughout these forests types from West Virginia to southern North
Carolina. The southernmost specimen I have seen was collected under Igggg
gggggggsis at Highlands, North Carolina (L. R. Hesler 24698). See Bills
(1984) for a photograph and discussion. -
RUSSULA HETEROPHYLLLA (Fries) Fries, Epigrisis $3;;. Myggl.
p. 352. 1838. ·
This is a tenative determination of a partially decayed specimen that
fruited one time in plot H4 (see Chap. 1, Table 7). I referred this
specimen to R. hgggggphgllg because of its pale lamellae (a spore print
was unobtainable), green to pale greenish yellow pileus, radially
streaked pileus surface, dermato- and hymenial cystidia with contents
inert in SV, ciliate epicuticular hyphae, and low isolated spore
ornamentation.
Section GRISEINAE J. Schaeffer
RUSSULA REDOLENS Burlingham, Mygglggig 13: 133. pl. 7, fig. 6
. & fig. 6. 1921.
Chapter 3 86
ßyggylg gggglgn; can be found fruiting solitary to gregarious on humus
in mesic northern hardwood forests or northern hardwood·red spruce
transition zones dominated by Iggy; ggngjfglig, ßgyylg g11gghgyjg¤;j;,
Qalemuambra, Iiliaamsriaana. Asarsasshaum. A- humus
ggggyjng, and Iggginyg mgglggna from late July until late August.
Presently it is known only from Vermont, eastern West Virginia and
southwestern Virginia, but probably more widely distributed within the
above forest types in eastern North America. See Bills (1984) for
description and discussion.
Section FOETENTINAE Melzer and Zvéra
RUSSULA GRANULATA (Peck) Peck, Annual Kan- Hau Xazk Staia Muaaum
53: 843. pl. C, figs. 1-5. 1901.
Ry;;y1g gggnylgyg is widely distributed in southeastern Canada and
northeastern United States and extends southward through the higher -
elevations of the Southern Appalachian Mountains. It has been reported
from the higher elevations of the GSMNP (Singer, 1957; Shaffer, 1972) and
from near the summit of White Top Mt. which is covered by a red spruce
forest in southwestern Virginia (Singer, 1957). Ry;;ylg gggyylgyg is the
most abundantly fruiting Kugaulg in high·elevation red spruce and
northern hardwood forests in southeastern West Virginia occuring with
nearly the same frequency in both forests types. In this area, its
fruiting season starts in late June and extends into early September with
the peak sporocarp production in late July and early August. I have
Chapter 3 87
observed it fruiting abundantly on surface mines reforested with £;ggg
gbjgg. Rnggnlg ggnnnlggg also fruits in cove eastern hemlock forests at
lower elevations (about 850 m). Singer (1957) noted that this species
was non-selective in its habitat and fruited in both coniferous and
hardwood forests. Personal observations and notes with herbarium
specimens indicate K. gngnglggg may be associated with Eigen gnhgng, B.
maziaua, i¤tr¤d¤<=ed 2- ahiaa. Ahias Ialsasaa. A- fxasari, Issxa
aanadaxaia. Eamazrandifalia, B- ¤.¤.¤1z1£ar.a, and
Osama rslzra-
Shaffer (1972) provided a thorough and detailed description of B.
ggnnnlgtg. See Bills (1984) for photograph and discussion.
RUSSULA SUBFOETENS W. G. Smith, lgngn. ßgg., Lgnggn
11: 337. 1873.
Rnggnlg gnbfggtgng is one of the most conspicuous Russulas of the high
mountain areas. It is often misdetermined as R. lgngggggggi Melzer or
R. fggtgng (Pers.) Fr. See Romagnesi (1967) and Shaffer (1972) for
descriptions and discussion.
Section FELLEINAE Romagnesi
RUSSULA SIMILLIMA Peck, Annngl Ren. New Xg;k Stagg Mg;. 24: 75.
1872.
Chapter 3 88
Kussula .f.e.1.1.e.a subsp• simillima (Peck) Singer, L.1.119.a
22: 707. 1951.
Ry;;y1g ;imi1ljng Peck, fruits in association with Iggy; gggngifglig
at high elevations in August and September. It was reported previously
in the Southern Appalachians by Singer (1939), Hesler (1949), and and
Shaffer (1970a). Ry;;y1g gimjllimg is almost identical morphologically
with.ßy;;y1g_fg11gg (Fries) Fries which is associated with Iggy;_;glgg;jgg
in Europe. A critical study is needed to determine the relations of these
two Russulas to each other and to the genus Iggy; in the Northern
Hemisphere. E
RUSSULA COMPACTA Frost in Peck, Annygl Rgn. Egg Xggk ßgggg Ey;.
32: 32. 1879.
Ry;;y1g gggpgggg is one of the best known Russulas in eastern North
America. It was well described by Shaffer (1970). It occurs commonly
in various hardwood forests types in the Appalachians. On two occasions,
on Canaan Mt., Tucker Co., West Virginia, and on Briery Knob, Pocahontas
Co., West Virginia, I observed it fruiting in red spruce or red
spruce-yellow birch stands.
Section ROSEINAE SingerI
RUSSULA PECKII Singer, Eygglggig 35: 147. 1943.
Chapter 3 89
This species is widespread in the northeastern United States and
southeastern Canada. It reaches its most southern distribution in the
red spruce-Fraser fir and red spruce-northern hardwood forests of the
Southern Appalachian Mountains. Rgssglg pggkii has been collected in the·
higher elevations of the GSMNP near the southern limits of the red
spruce-Fraser fir forests (Hesler, 1945, in part, as K. pggpggjgg Quel.
& Schulz.; Shaffer, 1970). In addition to herbarium material, I have seen
fresh material from the red spruce·Fraser fir zone of Roan Mt., Northn
Carolina-Tennessee. I agree with Singer°s observations (1943) that it
is constantly associated with conifers, specifically Ahjgg and Rjggg.
Shaffer (1970) provided a detailed description of this species. As he
pointed out, this fungus can be easily recognized by the dry, velvety,
dark red to pink pileus, crenulate lamellar edges, long, clavate, red to
pink, white-based stipe, mild taste and strong red reaction of the
incrusted cuticular hyphae with SV. See Bills (1984) for a discussion
and photograph.
Section EMETICINAE Melzer and Zvara
RUSSULA EMETICA (Schaeffer) Persoon, Qhs. Myggl. 1: 100. 1796.
Buggy]; gmgtjgg is perhaps the most misused epithet in agaricology.
The circumscription of this taxon has been concisely limited by Romagnesi
(1967) and Shaffer (1975). It appears to be rare in the Southern
Appalachians. After four seasons of active searching, it was found once
Chapter 3 90
on a hummock in a bog under red spruce, Dolly Sods, Tucker Co. West
Virginia (GB 837).
RUSSULA SILVICOLA Shaffer, ß91h. Ngyg H9Qg;9g;9 51: 229. 1975.
figs. 13-18.
Shaffer (1975) stated that this is the most common species of the
Eßgßigißßß in eastern North America. Numerous collections of R. 911919919
were made during this study. Its fruits in a variety of habitats ranging
from high-elevation spruce-fir forests and reforested surface mines to
low-elevation oak-hickory forests.”My
collections agreed well with
Shaffer°s description (1975) and specimens collected and determined by
him (MICH).
RUSSULA BETULARUM Hora, Igggg. ßgig. My;91. $9;. 43:456.1960.
Rgggglg 9999199 var. 999919rgm (Hora) Romagnesi, L9;
BQ§§§l§§, p. 401. 1967.
Bills (1984) was the first report of this species in North America where
it was found in eastern West Virginia and southwestern Virginia. It is
known from birch and birch-spruce forests of western Europe. Most of the
collections described were solitary to scattered on humus in forests of
spp. or in stands of ß9;g19 ßllßghßßigßßiß and BhQ§Qd§ßQIQß spp. One of
the collections (GB 906) fruited on a reforested surface mine under Zi;99
Chapter 3 91
gpjg; and young ßgtnlg gllgghgnjgnsis. Fruiting from late July to lateAugust. °RUSSULA KROMBHOLZII Shaffer, Llgydig 33: 82. 1970. .
A Azazism Abbild- Bbssbmlb-
ßghnmmg 9: 6. pl. 64, fig. 5-6. 1845.
Rnsgnlg ggggnngnnggg (Kromb.) Britz., Rg;. Zhl. 54: 99.
1893. non. Peck. Annngl Ren. Neg Xggk §;g;g Mg;. 41: 75.
1888.
Rnggnlg yingggg Burlingham, N. Ang;. E1. 9: 217. 1915.
In my experience, B. krgmbhglzii is one of the most common and most
confusing Russulas in eastern North America. I have recognized at least
three "types" based on fruiting pattern, phenology, and macroscopic
characters. Microscopically, these forms were indistinguishable. But
they all exhibited the essential morphological features described by
Romagnesi (1967) and Shaffer (1975). These forms may represent
"ecotypes", genetically distinct populations adapted to specific
habitats. Further biosystematic studies might be warranted to determine
how distinct genetically these populations are. Below are my general
impressions of these three forms.
Type 1. This form is comon in the vicinity of Blacksburg and in the Blue1
Ridge Mountains._ Sporocarps characteristically occur in large gregarious
fruitings with as many as 20-40 sporocarps. Fruiting is associated with
Qngggns species in the late spring or early summer (late May to mid-June
Chapter 3 92
in Virginia). Sporocarps range from yellowish green (rarely) to blackish
‘ purple to blackish red. Sporocarps arre often massive with pilei up to
18 cm broad and stipes up to 3-5 cm wide. The stipes range from
non-cinerescent to strongly cinerescent. Hesler (1945; as R. giggggg)
probably described this form.
Type 2. A form that fruits singly or in small gregarious clusters (2-10
sporocarps) occurs at higher elevations. It is ususally associated with
beech or northern red oak during late June to early August. The pileus
is medium to large, dark purple, but often partly or entirely yellowish
green or grayish green. The stipe is strongly cinerescent. Rolf Singer
collected this form at Mt. Lake, Virginia (FH) and determined it as "K.
yjnagga, half-green form". This is the form that occurred in the
quantitative study areas.
Type 3. My impressions of this form are based on three or four
observations in West Virginia and northwestern New Jersey. It appears
to be associated with eastern hemlock, but black birch and northern red
oak were present at some of the collection sites. Further observations
are needed to confirm the habitat. The pileus was consistantly purple,
blackish purple to to dark red, often with yellowish discolorations and
medium to large in size. The stipes were not cinerescent. Most of
Burlingham's specimens of R. yingggg from Vermont and the type locality
on Long Island, New York (NY) appear to be this form.
Chapter 3 93
RUSSULA AQUOSA Leclair, ßgll. Sgg. Myggl. Eggggg
48: 303. pl. 34. 1932.
Rggsglg gggtigg ssp. §g§Q§§ (Leclair) Singer,
Rey. Myggl. 1: 292. 1936.
Buggy}; gggggg was treated in detail by Romagnesi (1967) and Shaffer
(1975). It was encountered sporadically in the margins of bogs fruiting
under red spruce, yellow birch, and eastern hemlock and in dense red
spruce forests fruiting on byrophytes and/or rotten wood.
_ Section INTEGROIDINAE Romagnesi
RUSSULA CLAROFLAVA Grove, Miglagg Ngtgggljst 11: 265. 1888.
Buggy}; glgggflgyg is commonly found fruiting singly to gregarious on
soil, humus or bryophytes in forests dominated by Riggg spp., Ahigg spp.,
ßggglg spp., Rgpglgs spp., and.A1ngg spp. This species has a circumboreal
distribution. Populations extend into the higher elevations of the
southern Appalachians where they are associated with Rjggg gyhggg, Abjgg
Fruiting from July to October.
This relatively wel1·known species has been previously described in
the American literature as R. flgyg Romell. Although this species has
been treated in a number of popular works, a complete, modern description,
illustrating microscopic features, has not been available in the North
Chapter 3 94
American literature until Bills and Miller (1984) described Southern
Appalachian material.
Section DECOLORANTINAE Maire, sg.
RUSSULA DECOLORANS (Fries) Fries, Eggrjgjg $3;;. Myggl.
p. 361. 1838.
Buggy}; gggglggggg is one of the best known and most easily recognized
Russulas. It occurs commonly in boreal conifer forests of Europe,
although its presence in North America is poorly documented. I have
collected it at one location under red spruce and yellow birch on Briery
Knob, Pocahontas Co., West Virginia (GB 476). The specimens agreed well
with Romagnesi°s description (1967) and specimens collected in Sweden and
Finland. Beardslee°s (1918) report of it fruiting on Mt. Mitchell, North
Carolina is probably accurete. His macroscopic description was
consistent with the European concept and his cerrespondence with G. S.
Burlingham indicated that he had learned the species first-hand from L.
Romell during a visit to Sweden.
Section RHODELLINAE Romagnesi
RUSSULA OPERTA Burlingham, Mygglggig 16: 18. 1924. pl.4, fig. 2.
ßgggglg gpggtg is a little known taxon described from Windham Co.,
Vermont. Specimens from the quantitative study areas were compared
Chapter 3 95
directly with Bur1ingham°s type specimen (NY) and were found to be
identical. Singer (1957) indicated that R. gpggtg is synonymous with R.
pggillg Peck and that several morphological forms exist throughout North
America. A systematic revision of this taxon is in preparation and will
be published at a later date.
Chapter 3 96
£HAP.'IEB&.. NQIEESMIHIHEEQB£§ISQEI1E
S9LZIHERN
Three taxa of Lggtgrigg of the high-elevation forests of the southern
Appalachian Mountains of North America are redescribed and illustrated
based upon new morphological and habitat information. Taxonomic
discussions are provided to refine further their circumscriptions and
clarify their infrageneric relationships. Among the taxa redescribed are
L. ljggygtgllyg Smith & Hesler and L. ggglgtgs (Peck) Burlingham, two of
the most common agarics in red spruce forests of West Virginia and
Virginia. They were determined only with great difficulty because of the
abundance of similar taxa within their respective infrageneric groups and
lack of comparative, illustrative materials. Lgggggjgg fgggilig
(Burlingham) Hesler & Smith, also redescribed, is a poorly known species
with a restricted distribution and may be endemic to the high elevations
of the Southern Appalachians. In addition, the taxonomic segregation of
L. gjnggggg Peck var. giggrggs and L. ginggggg Peck var. fgggtgggm Hesler
& Smith is reconsidered.
Basidiospore size and shape are from optical sections in side view and
exclude the ornamentation. Capitalized color names are from Ridgway
(1912) and those numerically designated, e.g., 6C7-5, are from Kornerup
and Wanscher (1978). Spore-print and some lamellar colors are fromChapter 4 97
Romagnesi (1967). Macro- and microchemical tests were made according to
the methods of Romagnesi (1967) and Singer (1975). The letters SV stand
for sulfovanillin, and GSMNP for the Great Smoky Mountains National Park.
All specimens are deposited at VPI unless stated otherwise.
QEIAXA
LACTARIUS LIGNYOTELLUS Smith & Hesler, Brittonia 14: 410.
pl. 22, lower fig. 1962.
FIGS. 14: 3, 15: 5-8
Riley; 2-4.5 cm broad, convex to plane with margin inrolled when young,
becoming plane to umbillicate with margin uplifted, or wavy in age; margin
crenate or not, sometimes eroded or slightly rimose in age; surface dry,
dull, velvety, rugulose or radially rugulose, azonate, black, dark
blackish brown to brown, Clove Brown, Seal Brown, 8F8-7, 7F8-5, Vandyke
Brown, 6F8-6, Mummy Brown, 6E8-7; trama thin, brittle, thickest at disc,
1-2 mm thick at midradius, white to slighty yellow, unchanging or
occasionally staining pale vinaceous pink or Vinaceous-Cinnamon
overnight, sometimes brown around larval channels; odor and taste not
distinctive. Lage; white, milk-like, usually abundant, unchanging.
Lgggllgg adnate to subdecurrent, medium to subdistant, with 2-3 tiers of
lamellulae, sometimes forked, up to 7 mm broad at midradius, acute in _
front, white when very young, soon pale yellow, Cream Color, Cream-Buff,
' finally Apricot Buff or pale orange yellow, SA3-2; edges even to minutely
Chapter 4 98
pruinose, pale brown to dark brown, rarely concolorous with lamellar
faces. Sting 3-7 cm tall, 0.4-1 cm wide at midpoint, equal or slightly
flared or fluted at the apex, terete, often curved; surface dry, dull,
velvety, concolorous with pileus or lighter brown, 5D4, white over lower
one-fourth, with white mycelium at base; trama thin.with interior stuffed
or hollow; soft, white to pale yellow, unchanging when cut, or rarely
staining pale vinaceous pink or Pinkish Vinaceous after several hours.
ßggidigspgggg pale yellowish orange (Romagnesi II d-III c) in mass.
7.5-9.5 X 7.5-10.5 um, globose to subglobose; ornamentation amyloid, up
to 2 um high, consisting of large spines, irregular ridges or crests, and
verrucae, connected by low irregular ridges and fine lines, with verrucae W
often forming short catenulate ridges; suprahilar area usually with a
thick, broad, irregular amyloid patch. ßggjgig 55-68 X 10-13.5 um,
clavate, 4-sterigmate. Rlggrgggstidia 5-40 um X 4-6.5 um, filamentous,
flexuous or contorted, occasionally branched or septate, with blunt or
irregularly lobed ends, projecting up to 10 um beyond the basidia, arising
from laticiferous hyphae at various levels of the trama, with or without
refractive contents, hyaline to pale yellow in KOH, inert in SV.
Qhgjlggyggjgjg 20-75 X 4-9 um, abundant, filamentous to narrowly clavate,
0-2 septate, arising as branches from inflated basal cells, pale brown
to hyaline in KOH. Lamgllgr trama pseudoparenchymatous, with abundant
laticifers; laticifers 6-9.5 um in diam, with yellow refractive or
granular contents in KOH. Rjlggg ggtiglg 120-180 um thick, without
gelatinous or incrusting materials, a trichoderm, forming a
"virescens-structure", consisting of filamentous to narrowly clavate
Chapter 4 100
5x[fn~\„_v 6 •¢•»•„ewaxe
7 8gg
Figure 15. L. lignyotellus microscopic features (GB 161).: 5.°‘ P5°“’°°"“"“°‘
dermatocystidia, arising from short chains of inflated calls;
dermatocystidia 20-65 X 6-10 um, pala brown in KOH; inflated calls 9-24
X 8-24, globose to cylindrical or irregularly inflated, often pigmented
as dermatocystidia. Zglggg ttggg consisting of sphaarocysts, connactiva
hyphaa and abundant laticifers; hyphaa 2-4.5 um in diam, laticifers 4.5-10
um in diam, with yellow refractive contents in KOH. §tigg_tgtit1g 70-130
um thick, similar to pileus cuticle, a trichoderm of filamentous to
narrowly clavate caulocystidia arising from short chains of inflated
calls; caulocystidia 35-92 X 7-10 um, pala brown in KOH; inflated calls
8-25 X 7-22 um, globose to cylindrical, sometimes pigmentad as
caulocystidia. ßtjgg tggmg composad of nests of sphaarocysts surroundad
by densaly interwoven connactiva hyphaa, connactiva hyphaa 2-5.5 um in
diam, hyaline in KOH, laticifers abundant, same as in pileus trama. Qlggg
gggggtjggg absent from all tissues.
Hgtjt, hghjtgt, ggg gjgtgghgtjgg. Solitary to subgragarious, often A
fruiting over extensive areas on naedle litter, humus, deep moss and leafy
liverworts [ßggzggig ttilghgtg (L.) S. F. Gray], or rarely on
well-decayed, moss-covered wood. Associated with Rjtgg ggtggg Sarg.,
Apjg; fggggti Poir., or Igggg ggggggggjg (L.) Carr. throughout the
high-elavation forests of North Carolina, Tennessee, Virginia, and West
Virginia. July to September.
Mgtgtjgl ggggjggg. USA: North Carolina: Swain Co.: Nawfound Gap,
GSMNP, L. R. Hesler 11346 - A. H. Smith 7372 (TENN). Tennessee: Sevier
Co.: C1ingman's Dome, GSMNP, L. R. Hesler 20961 (holotype, TENN), L. R.
Chapter 4 102
Hesler 39014 (TENN); Roaring Fork, near Mt. LeConte, GSMP, R. H. Petersen
35126, (TENN); Unicoi Co.: Roan Mt., L. R. Hesler, 27 Sep 1936, L. R.
Hesler, 22 Aug 1937, (both FH). Virginia: Grayson Co.: Mt. Rogers, GB
665; Madison Co.: Limberlost Trail, Shenandoah National Park, V. Cotter
771. West Virginia: Pocahontas Co.: Black Mt., GB 117; Briery Knob, GB
490; Kennison Mt., GB 161; Rocky Knob, GB 387, GB 222; Tucker Co.:
Headwaters of Otter Creek, GB 825.
iv similar tv L· liznxvms Fr•
and L. fgllg; Smith & Hesler with which it could be easily confused.
Macroscopically, L. llgnygggllus is distinguished from L. llggygtgg Fr.
by its smaller stature, absence of lilac or pink staining or only faint
or delayed staining, brown lamellae edges, and paler spore deposit.
Lggggglgg llggygggllgg, L. llgnygggg, L. fgllgg, and the varieties of L.
llgnygggg are so similar that they cannot be distinguished by microscopic
features. All these taxa are usually associated with Rlggg and Ahlgg.
Hesler and Smith (1979) did not consider L. llgnygtgllgg as one of
the varieties of L. llgnygggg because of the apparent absence of lilac
or pink staining of damaged tissues. Based upon examination of dozens
of fresh sporocarps over four seasons, damaged tissues of L. llggygggllgg
rarely stain. Occasionally weak pink or vinaceous stains develop in cut
sporocarps after several hours, especially in the stipe bases. In light
of the variation in staining reported for the other members of the L.
llggygtgg species-complex, the absence of staining or presence of feeble
Chapter 4 103
staining of L. ljgggggellge appears to be insufficient for segregating
it from this species-complex.
Another distinguishing feature of L. ljggyggellge is its
brown·pigmented cheilocystidia which are manifested macroscopically as
brown—margined lamellae. However, brown•margined lamellae have also been
described in L. f;11;3, L. ligngggge var. g;nede¤;ie Smith & Hesler, and
L. ljggygggg var. me;gig;;g; (Smith & Hesler) Hesler & Smith. In
addition, I have seen brown-pigmented cheilocystidia in some European
specimens of L. ljgngggge. The cheilocystidia of these Leggegige species
are morphologically and probably developmentally similar to their pileo—
and caulocystidia. The development of brown pigments in the
cheilocystidia may be under similar regulation as the pigments of the
pileus and stipe. In sumary, L. lignyggellge cannot be clearly delimited
from the L. ljgngggge species—complex based on morphological features.,
Within their geographical range, however, populations of L. ljggyggellge
are relatively uniform, do not exhibit the range of variation reported
for the northern populations, and can be recognized as a distinct
morphological species.
Most of the taxonomic decisions on the L. lignyggge species·complex
in North America appear to have been based upon specimens from outside
the range of {ige; gehen; and within the range of {. m;;i;g; Mill., {.
glegg; (Moench) Voss, and western {ige; species. Leggegjge ljggyggellge
and the L. ljggggggg variants seem to be allopatric populations, A11
specimens determined as L. liggyggge in the Southern Appalachians have
Chapter A 10A
either been L. llgyyegellye or other members of the subgenus
Rllyyhegely;. The Leeyegly; featured as L. llgyyeyy; by Hesler (1960,
p. 98) was a taxon within another species group of the subgenus
Rllyghggely;. Systematic sampling of populations of these Lactarii in .
R. gyheye forests in Pennsylvania, the Catskills, and Adirondacks may
provide information relating the Southern Appalachian variant, L.
llggyeyellye, to the northern populations. Consideration of the
present-day distributions of these variants in light of the history of
distribution of Rleee and Ahle; in the Northern Hemisphere could lead to
the development of hypotheses of how the L. llgyyeyy; species-complex
co-evolved with Rleey and Ayle; species.
LACTARIUS OCULATUS (Peck) Burlingham, Bull. Torrey Bot.
Club 34: 89. 1907.
FIGS. 14: 1-2, 16: 9-12
ELeeye;ly; eybgylel; eeyleyye Peck, New York State Mus.
Bull. 67: 37. pl. 83. 1903.
Rlley; 1-4.5(-5.5) cm broad, convex with sharp papilla and incurved
margin when young, soon plano-convex or plane with papilla, finally
umbillicate with uplifted or wavy margin; margin striate or not, obscurely
striate or translucent·striate, sometimes sulcate, crenulate or
undulatingg striations extending up to one-third way to disc; cuticle not
separable; surface subviscid to lubricous when wet, usually moist to dry,
shiny to silky, dull when faded, smooth to minutely rugulose, glabrous,
Chapter 4 105
lhygrophanous, azonate or obscurely zonate when fading, dark reddish brown
to reddish brown, Chestnut, 9F7-5, 8F7-5, 8E8-5, light reddish brown,
8D6·5, brown, with papilla retaining dark colors upon drying, becoming
pinkish brown or light orange brown, Hazel, 7C7-4, from margin inward upon
fading, finally fading to pinkish orange, pale grayish orange, 6B5-4,
Pinkish Buff, Pinkish Vinaceous, 6A3-2, or pink, 7A3; trama pliant to
brittle, concolorous with faded pileus, often water-soaked, thin, up to
1.5 mm thick at midradius, slowly staining pale yellow or not when cut;
odor not distinct; taste slightly bitter, soapy, or not distinctive.
Late; white, milk·like, unchanging or drying pale yellow on lamellae,
staining white paper yellow or not, sparse. Lgmellag adnate, subdecurrent
to decurrent in age, close to medium, with many lamellulae of various
lengths, faintly intervenose or not, acute to subacute in front, 1-5 mm
broad at midradius, pinkish cream when young, soon concolorous with paler
colors of pileus, i 6A5-4; edges even.—
ßtigg 1.5-5(-5.5) cm tall, 0.4-0.8 cm wide at midpoint, terete or
occasionally compressed, equal or tapered toward the apex; surface moist,
waxy or dry, longitudinally rugulose, sometimes with a faint canescent
bloom, concolorous with paler colors of the pileus, with pinkish buff to
white hairs over the base; trama thin with hollow interior, brittle, often
water-soaked, slowly pale yellow or not when cut. Qhgmiggl ggggtjggg
(pileus trama): FeS04,-no reaction; gum guaiac—slow1y bluish green.
ßggjgjggpgggg white or pale yellowish white (Romagnesi I a-b) in mass,
8-10(-10.5) X 5.5-7(-7.5) um, obovate to broadly ellipticalg
ornamentation amyloid, up to 1.2 um high, mostly 0.5-1 um high, highly
variable, consisting of spines, irregular, conical to obtuse verrucae,
Chapter 4 106
1 9
O1 · éäagäe äy‘
4 z
mm·—
„
10pm
@ *2Il
ä Ä42°¤**·
Figure 16. L. oculatus microscopic features GB 510).: 9. Pileus. cuticle, tangential section. 10. Cheilocystidia. 11.
Basidiospores. 12. Pleurocystidia.
Chapter 4 107
with verrucae often aligned into short ridges, with few to many isolated
particles, with verrucae and particles partially intercounected by fine
lines or short, low ridges, forming a partial reticulum; suprahilar area
depressed or not, usually unornamented or with fine particles or lines
originating from it. ßggjgjg 33-48 X 9-12 um, clavate to broadly clavate,
4-sterigmate. Rlgggggygtjgig of two types: filamentous type 30-45 X 3-4
um, flexuous, embedded among basidia, arising from subhymenium, without
refractive contents; second type 60-110 X 8.5-14 um, projecting up to 65
um beyond the basidia, aciculate, subulate, obclavate to fusoid, with
acuminate, constricted or appendiculate apices, arising from the
subhymenium, completely or partially filled with hyaline to pale yellow
refractive contents in KOH, purple to purplish black in SV.
Qhgjlggyggjgjg similar to larger pleurocystidia, 30-40 X 6.5-9 um,
subulate, obclavate to fusoid, with tapered or acuminate apices, with or
without contents similar to those of larger pleurocystidia. ßghhymggigm
5-20 um thick, pseudoparenchymatous. Lamgllgg tggmg consisting of
tightly interwoven hyphae, pseudoparenchyma, and laticifers; laticifers
3-10 um in diam, with yellow granular or refractive contents in KOH,
strongly SV+, purple to purplish black in SV. Riley; ggtiglg one-layered,
140-180 um thlck, usually with a thin gelatinous zone at the surface
(observe in Melzer°s), consisting of tightly interwoven hyphae,
pseudoparenchyma, and laticifers protruding at various levels, with
ascending to horizontal free hyphal ends at the surface, with lower levels“
poorly differentiated from pileus trama; hyphae cylindrical to
irregularly lobed or inflated, septate, up to 20 um in diam, with
yellowish brown walls and hyaline contents in KOH. Rilggg tggmg
Chapter 4 108
consisting of nests of sphaerocysts, connective hyphae, and scattered to
abundant laticifers; laticifers 4-15 um in diem, similar to those in
lamellar trama. Stiga gatjtla 20-60 um thick, not gelatinous, consisting
of tightly interwoven hyphae and pseudoparenchyma, with ascending or
horizontal free hyphal ends at the surface; hyphae branched or not,
septate, with blunt apices, mostly 3-5 um in diam, but with some inflated
cells up to 15 um diam. §§i§§;§{§m§ consisting of nests of sphaerocysts,
connective hyphae, and laticifers; laticifers similar to those of
lamellar trama but often larger, 4-21 um in diem. Qlamg tbggattjgga
absent from all tissues.
Habit, Habjtat, ang ajatgjbatjbg. Solitary to gregarious on needle
litter, bryophytes, including Sbbaggam spp. and ßaazagaa ttjlgbata, and
sometimes on well-decayed wood. Fruiting in association with Ritaa spp.,
Abjaa spp., Riga; attgbaa L., and 2. gaajngaa Ait. Known from Wisconsin
across southeastern Canada to New England and southward to Georgia in the
mountains. July to September. J
Hatatial agamigad. CANADA: Ontario: Woods west of South March, J. W.
Groves, 15 Aug 1963, DAOM. 93008 (BPI). Quebec: St. Aubert, J. W. Groves,
1 Sep 1958, DAOM. 59905 (BPI). USA: Georgia: Rabun Co.: L. R. Hesler
22079 (TENN). Michigan: Stinchfield Woods, A. H. Smith, 25 Sep 1961
(TENN). New York: Hamilton Co.: Lake Pleasant, D. B. Young, Aug 1909
(NYS); C. H. Peck, 14 Aug (NYS); North Elba, C. H. Peck Sep, (holotype,
NYS). Tennessee: Sevier Co.: Clingman°s Dome, GSMNP, L. R. Hesler 30326
(TENN). Virginia: Grayson Co.: Cabin Ridge, GB 340; Highland Co.:
Chapter 4 109
Headwaters of Buck Run, GB 516; Smyth Co.: Clinch Mt. Wildlife Management
Area, GB 688. West Virginia: Pocahontas Co.: Black Mt., GB 510, GB 924;
Kennison Mt., GB 497; Rocky Knob, G. Bills, 2 Sep 1982, GB 919; Randolph
Co.: Kumbrabow State Forest, GB 356.
Qhgggygtjggs. This is one of the most common agarics fruiting in ßjggg
gghggs or R. ;g§g3g~Ap1g; fgggggi forests and R. gghggg bogs in West
Virginia and Virginia. The distinguishing features of LL ggglgggg are
its (1) reddish brown pileus that soon fades to vinaceous buff or pale
pinkish buff but retains the dark colors on the papilla; (2) fruiting in
association with Rjggg, Ahigs, and northern Rings species; (3) a slightly
gelatinous pileus cuticle consisting of both interwoven, filamentous and
inflated hyphae, and (4) relatively large, subulate to lanceolate, SV+
pleurocystidia. Microscopic examinations is usually needed to identify
L. ggglgtgg because of the difficulty in detecting the gelatinous cuticle
and its similarity to other taxa in sections (Hesler &
Smith) Hesler & Smith (1979) and Ihgjgggli Hesler & Smith (1979).
Microscopic features are illustrated here to facilitate identification
and for comparison with other taxa in subgenus Rgssglggjg.
LACTARIUS FRAGILIS (Burlingham) Hesler & Smith var. FRAGILIS,
North American Species of Lactarius. p. 503. 1979.
FIGS. 1: 4, 17: 13-15
ELgg;g;jg gggphgggtg subsp. fgggjlig Burlingham, Mem.
Bot. Club 14: 99. 1908.
Chapter 4 110
Riley; 2-6.5 cm broad, convex with papilla and incurved margin when
young, soon plane with papilla, finally umbillicate or depressed with
uplifted or wavy margin; margin not striate, sometimes crenulate or
sulcate; surface dry, rugulose, radially rugulose, or concentrically
rugulose towards the margin, sometimes faintly scurfy or concentrically
areolate, subhygrophanous, dark reddish brown, Chestnut, Tawny, 8D7-5,
8C7-5, orange brown or reddish orange brown, Ochraceous Orange, Tawny
Ochraceous, Cinnamon Rufous, 7F7, 7E7, 6D8-6, 608-6, fading to
Ochraceous-Buff, Orange, SA6-5, or grayish orange; trama brittle, 0.5-2
mm thick at midradius, pale yellowish cream to pinkish buff, unchanging”
when cut, or rarely slightly pinkish violet after several hours; odor
fragrant, of fenugreek (Iriggggllg fggngm;g;agggm L.) or Lgggggigs
ggmphgggggg (Bull. : Fr.) Fr.; taste mild or slightly bitter. Lage;
watery or like dilute milk, unchanging, sparse to abundant. Lgmgllgg
adnate, subdecurrent decurrent, medium to subdistant, with many
lamellulae of various lengths, intervenose, often forked near stipe,
sometimes anastomosing, subacute in front, up to 8 mm broad at midradius,
pale orange, 5A4-3, when young, ochraceous, Orange—Rufous, 5B7, in age,
often with faces dusted white from maturing basidiospores; edges thick,
even. ßtigg 2-7 cm tell, 0.4-1 cm wide at midpoint, terete, or sometimes
irregularly compressed, equal or tapered toward the apex, straight or
curved; surface dry, minutely rugulose, sometimes minutely pruinose,
concolorous with pileus, or with pinkish buff base, with a few pink hairs
at the base; trama hard when young, brittle in age, solid to hollow, with
cortex concolorous with surface and inner trama pale pinkish cream,
Chapter 4 111
unchanging when cut. Qhgmiggl gggggjgng (pileus trama): FeSO4 -pale
gray; gum guaiac-slowly dull bluish green. -
ßgsidigspgggg pale yellow (Romagnesi II b-c) in mass, 6.5-8 X 6.5-7.5 um,
globose to subglobose; ornamentation amyloid, up to 1.8 um high,
consisting of thick ridges and crests, medium to fine lines, sharp to
truncate spines, and conical verrucae, with few if any isolated verrucae,
forming a nearly complete to often dense reticulum; suprahilar area
unornamented or ornamented as the rest of the spore. ßggjgig 38-48 X
9.5-11 um, clavate to broadly clavate, 4•sterigmate. Hymggjgl gyggjgjg
35-50 X 4-5 um, filamentous to narrowly clavate, flexuous, embedded among
basidia, arising from hymenium or subhymenium, hyaline to pale yellow in
KOH, inert in SV, without refractive contents. Sgbhymggjgm up to 10 um
thick, pseudoparenchymatous, often indistinguishable from lamellar trama.
Lgmgllgg tggmg composed of tightly interwoven hyphae, pseudoparenchyma,
and laticifers; cells up to 15 um in diam; laticifers 5-15 um in diam,
flexuous, with yellow refractive contents in KOH, greenish yellow in SV.
Rjlggg gggiglg two-layered, 95-145 um thick; epicutis 75-100 um thick,
without gelatinous materials, cellular to pseudoparenchymatous, composed
of globose, subglobose or irregularly inflated or lobed cells, with cells
up to 25 um in diam; subcutis 20-50 um thick, consisting of tightly
interwoven, horizontally oriented hyphae; hyphae septate, highly
branched, 4-10 um in diam, with greenish brown walls in KOH. Rllggg ggggg
composed of nests sphaerocysts, connective hyphae, and abundant
laticifers; laticifers S-22 um in diam, similar to laticifers of lamellar
trama. §;jgg ggtjglg 25-145 um thlck, not gelatinous, similar to pileus
epicutis, consisting of pseudoparenchyma and tightly interwoven hyphae;
Chapter 4 112
¢r13'
.\ Qlllyqgigß 4r
xéähsrgl/'
-~‘ 10um 15 —
14 _ ‘@ ä
@Figure17. L. fragilis microscopic features (GB 438).: 13. Pileus;1£;:|;<1<e§St§;1£gential section. 14. Basidiospores. 15.
Chapter 4 113
hyphae filamentous to irregularly lobed or inflated, mostly 3-6 um in
diam, but with inflated cells up to 15 um in diam. Stiga ttama composed
of nests of sphaerocysts, connective hyphae, and scattered to abundant
laticifers; laticifers 8-20 um in diam, similar to those in lamellar
trama. Qlamp gggnagtigga absent in all tissues.
Habit, hapjtat, gg aiattihatjgn. Solitary to gregarious or
subcaespitose on humus or soil. Noted fruiting under [agga gtagajjglja
Ehrh- , Bamala Britt mmans. Ass.: aasahamm Marsh- .
and Hagamalia yjtgtajaga L. at elevations above 1035 m (3400 ft). Known
from the Blue Ridge Mountains of western North Carolina, eastern
Tennessee, and southwestern Virginia. August.
Matatjal agagjgag. USA: North Carolina: Transylvania Co.: Pink Beds,
G. S. Burlingham 33-1907 (holotype, NY), D. Guravich 493 (MICH).
Tennessee: Sevier Co.: Ramsey Cascades, GSMNP, L. R. Hesler 35242 (coll.
D. Jenkins) (TENN). Virginia: Grayson Co.: Pine Mt., GB 877; Stone Mt.,
GB 438. °
Qtaatyatjgaa. This is one of the most distinctive taxa of the subgenus
Raaaalagaa. It might be confused with L. gamphgtatta which may fruit in
the same forest at the same time. Lagtarita fragilia can be easilyU
distinguished from L. aamphgtatga by its ochraceous to light orange
colors, often larger sporocarps, more distant lamellae, and globose to
subglobose basidiospores ornamented with a heavy, complete to nearly
complete reticulum. These distinctive macroscopic or microscopicI
Chapter 4 114
features have not been illustrated previously. The two-sterigmate
basidia mentioned by Hesler and Smith (1979) were not observed, The
specimen cited by Hesler and Smith (1979) from Knoxville, Tennessee (L.
R. Hesler 35705) was L. gggphggatgs.
Lgggggjgg fgggjlig var, zghiggs Hesler & Smith, a taxon similar to L.
fgggilig var. fgggjljg, is apparently restricted to the Pacific Northwest
(Hesler and Smith, 1979; A. Methven, pers. comm.), It differs from the
Southern Appalachian populations in sporocarp colors, mycorrhizal hosts
(presumably Qygggyg spp.), and spore ornamentation with finer, more
delicate ridges. These differences coupled with the extreme geographic
isolation of the two taxa suggests L. fgggilig var, gyhiggg should be
recognized at the specific level,
LACTARIUS CINEREUS Peck var. CINEREUS, Annual Rep. New York State
Mus. 24: 73. 1872.
=Lgg;g;jg§ ginggggs Peck var. fgggtgggg Hesler & Smith,
North American Species of Lactarius. p. 396, 1979.
The recognition of L, ginggggg var. faggtgrgg (section Igistgg Hesler
& Smith) is an unnecessary taxonomic distinction, Hesler and Smith (1979)
differentiated L. gingrggg var. fgggtggm from the type variety based upon
comparison of their specimens with Peck°s (1870, 1884) brief accounts of
the taxon rather than on living populations that agreed morphologically
with Peck's descriptions. Populations identical with Peck°s descriptions
Chapter 4 115
were never cited by Hesler and Smith (1979). According to Hesler and
Smith, the features delimiting var. faggtgrum from var. gigggggs were
the pale yellow spore deposit rather than.white, olive-gray pileus colors
rather than gray, and longer hymenial cystidia in var. fggeggggm.
Comparison of the holotype of var. faggtgrgm shows it is identical
morphologically with Peck°s type and with specimens of L. gigggggs var.
fgggggggm from a wide geographical area. Hymenial cystidia of Peck's type
were up to 72 um long, certainly in the range described for var.
fgggtgggm. ‘Whi1e comparing var. gjggrggs to L. yietgs (Fr. : Fr.) Fr.,
Peck noted that in var. gjnggegs the "pellicle is separable". Hesler and
Smith (1979) used this character in the key to the stirps Yigtgs to
distinguish var. gingrggs with a "cleanly separable" pileus cuticle from
var. IQZSLQIHE which has a pileus cuticle "not cleanly separable". But
within the description of var. faggtggym, Hesler and Smith described the
pileus as having the "pellicle separable". My observations indicate the
pileus cuticle is separable one·third to two·thirds way to the disc. Dark
gray, light gray, and olive·gray sporocarps occur in close proximity.
Two distinctive characters often present in L. gjngrggs, not mentioned
by Hesler and Smith (1979), are the pale pink cast to the lamellae and
the pale pink to pinkish gray zone at the stipe apex.
The distributions of L. giggrgus and the closely related L. hlgggjgg
(Fr. : Fr.) Fr. coincide with the distribution of Zaggs (Neuhoff, 1956;
Hesler and Smith, 1979; Korhonen, 1984). Lggtgrjgs hlgggigg is associated
with Egggg sylyggjgg L. in Europe. Lggtggigs gingrggs is known to occur
with all ecotypes and varieties of E. gggggjjglig in North America, except
Chapter 4 116
[. gggggjfglig var. mgxigggg (Martinez) Little in Mexico. Chiu (1945)
reported L. gjggggg; under Qggrgg; in southwestern China, although [ggg;
species are in the same area. Chiu's observations need to be reconfirmed.
The genus [ggg; probably evolved in and dispersed from the Indo-Malasean
region during the upper Cretaceous with subsequent migrations eastward
to Europe across Asia and westward to North America via Beringia during
the Tertiary (Takhtajan, 1969; Van Steenis, 1972). The most primative
[ggg; species occur in eastern Asia (Takhtajan, 1969). These two
Lggggrig; may have evolved from a common ancestor associated with [ggg;
in Asia. Studies of Lgggggig; species associated with the [ggg; species
of Eurasia could elucidate a co·evo1utionary pathway of the L.
gigg;gg;·L. hlgggigg group with the genus [ggg;.
Mggggjgl ggggjggg USA: Maryland: Montgomery Co.: Cabin John Woods,
V. K. Charles & E. E. Dicks, 23 Sep 1937 (BPI). Michigan: Washtenaw Co.:
Cedar Lake, A. H. Smith 80716 (holotype of L. giggggg; var. fgggggggg,
MICH). New Jersey: Warren Co.: Delaware Water Gap, GB 476. New York:
Rensselaer Co.: Sandlake, C. H. Peck Jul (holotype of L. gigggggg var.
gigggggg, NYS). Vermont: Windham Co.: Newfane Hill, V. K. Charles & G.
S. Burlingham, 31 Aug 1939 (BPI). Virginia: Grayson Co.: Stone Mt., GB
436; Pittsylvania Co.: near Danville, OKM 6127, OKM 6128 (coll. J.
Lindsey). West Virginia: Pocahontas Co.: Rocky Knob, GB 418, GB 491.
Chapter 4 117
QHAKIEBL. QEIN1liEILQKE§I§QE
IHE '
The distributional patterns of vascular plants of the high elevations
of the Southern Appalachians and their relationship to boreal floras are
well known. The floristic and structural similarities of the Southern
Appalachian spruce-fir·birch forests to those in New England and New York
have been compared by several investigators (Oosting and Billings, 1951;
Stephenson and Clovis, 1983). Likewise, the affinity of the bryophyte
and lichen flora of the high elevations of the Southern Appalachians to
boreal regions has been recognized (Anderson, 1971; Dey, 1976, 1978).
However, the fungal flora of these high-elevation communities and boreal
communities has never been compared.
Biogeographic studies of many groups of higher fungi are impeded by
differences in taxonomic concepts and from the low numbers of taxonomic
specialists. However, enough information is now available on the
ectomycorrhizal species of the agaric genus Lggtgrigg to compare their
distribution in boreal forests with those in the high-elevation forests
of the Southern Appalachians. Four seasons of sampling Lgggggjgg species
in the high-elevation spruce—fir-birch_forests of Virginia and West
Virginia by the author has provided new information relating the
distributions of northern Lggtarigg populations to those of the Southern
Chapter 5 118
Appalachians (Bills, 1985). In addition, monographs of Lggtggggg
(Burlingham,-1908; Neuhoff, 1956; Hesler and Smith; 1979) and regional
treatments of Lggtgrigs species of northern latitudes (Kühner, 1975;
Homola and Czapowskji, 1981; Knudson and Borgen, 1982; Laursen and
Ammirati, 1982; Korhonen, 1984) impart taxonomic consistency and enable
the geographical distributions of many Lggtggigs species to be compared
with the geographical distributions of their potential mycorrhizal hosts.
The Lggtggigg flora of the Southern Appalachians is relatively well
known and is rich in taxa. Approximately one-third of the North American
taxa occur within the Great Smoky Mountains National Park (Petersen,
1979). Hesler's and Smith°s (1979) monograph of North American Lggtggjyg
was based largely on material collected by Hesler in the mountains of
Tennessee, North Carolina, and Georgia, and to a lesser degree on
specimens collected and described by Gertrude S. Burlingham from Brevard
and the Pink Beds in southwestern North Carolina. However, Hesler and
Smith (1979) stressed the preliminary nature of their monograph and
pointed out that geographic distributions of many species were
incompletely known and that many problematic groups of species still
existed.
The main objectives of this study were: (1) to summarize both old and
new information on the geographical distributions of Lggtggjgg species
in the subalpine spruce-fir-birch forests of the Southern Appalachians
and their relationships with higher plant communities; (2) to demonstrate
that the Lggtggigg species exhibit geographical distributions similar to
Chapter 5 119
those of the higher plants of the region, and (3) to present hypotheses
that might explain the observed distributions of these Lgggggiug species.
In this study, the Southern Appalachians were defined as the
unglaciated Allegheny and Blue Ridge Mountain Systems south of 40° N
latitude. In eastern West Virginia and western central Virginia, red
spruce (Zjggg ruhen; Sarg.) and occasionally balsam fir (Abjgg hglggmgg
(L.) Mill.) occur as scattered trees to well developed, extensive stands
at elevations >97S m. Red spruce and Fraser fir (Ahjg; fgggggi Poir.)
are usually restricted to elevations >l375 m in southeastern Virginia,
western North Carolina, and eastern Tennessee. The best development of
spruce-fir forests occurs at elevations >1800 m in Virginia, North
- Carolina, and Tennessee. When spruce and fir co-occur, the canopy is
usually dominated by spruce at lower elevations with the percentage of
fir increasing as altitude increases (Oosting and Billings, 1951; l
Whittaker, 1956). ßgtglg gllgghgnignsig Britt. is the most common
co-dominant of spruce and fir in these subalpine forests. Geographically,
these forests appear to be a southern extension of the boreal and
subalpine spruce-fir forests of the Northeast, but because they differ
in floristic composition and climate, they have been regarded as related
but distinct forest types (Whittaker, 1956).
The literature cited above and the collections and notes of Hesler
(TENN) and of the author (VPI) were used to determine geographical
distributions and potential mycorrhizal host relationships. The two most
intensively sampled areas were the main ridge of the Great Smoky Mountains
Chapter 5 120
from Mt. LeConte to C1ingman's Dome, by Hesler (periodically for over 30
years) and the Cranberry Glades area of southeast West Virginia by the
author. W
HABJIAIS
ANDHabitatsof Lggtagjgs species depend on the composition of the vascular
plant vegetation because they form ectomycorrhizae with members of the
Pinaceae, Fagaceae, Betulaceae, and some Salicaceae (Trappe, 1962;
Giltrap, 1982; Miller, 1983). Native trees of the high elevations
available for mycorrhizal formation with Lggtgrigg species include Rjggg
nmans, Abisa b.a.1s.ams.a (small p¤p¤1¤ti¤¤¤), A- frasau, Tanga aanadensia
(L-) Carr-, Rimlasxxabiu L-, B- laute L-, H-ggpygjjggg Marsh. (small populations), ß. pgpgljjglig Marsh. (small
populations), Alggg gygggg (Du Roi) Spreng., Qgggggg alb; L., Q. ggbgg
L., Rggglgg gggggjgggtgtg Michx., and 2. tggmulgiggg Michx. The
introduction of Riggg ghigg (L.) Karst., Ring; ggsjgggg Ait., B.
gylyggtgig L., and Lg;15 dggiggg Mill. for lumber or reclamation may have
introduced exotic Lggtgriug species and provided new habitats for native
species. Some Lggtggjgg species are characteristic of Sphagggm bogs
(Hesler and Smith, 1979; Korhonen, 1984). Both Sphggggm glades and bog
forests are common in eastern West Virginia but are less common in the
high mountain areas to the south (Core, 1966). Other Lggtggigg species
exhibit fidelity to arctic or subalpine vegetation (Kühner, 1975; Knudson
and Borgen, 1982; Korhonen, 1984). True alpine areas are absent in the
Chapter 5 121
Southern Appalachians, but treeless heath and grass balds resemble
physiognomically tundra or tree lines (Core, 1966), and could permit
arctic species to persist at southern latitudes (Ramseur, 1960; White eb
ag., 1984).
The Laebaggea flora (19 species) of the high~mountain areas is closely
allied with that of northeastern North America (28 species; Table 20).
The geographic distributions follow the same general patterns as those
of vascular plants, bryophytes, and lichens. Laebaggea distribution ‘
patterns were classified as follows: circumboreal (or nearly), extending
partially or throughout the high-mountain areas; northeastern North
America (NE), extending partially or throughout the high-mountain areas;
widespread in the eastern deciduous forest (ENA); widespread in northern
hemisphere, and endemic,
The extension of some boreal Laebaggea species into the
spruce·fir-birch zones of West Virginia, and Virginia, but not of North
Carolina or Tennessee, is consistent with the transitional composition
of the vascular plant flora of the region (Core, 1966; Stephenson and
Clovis, 1983). Laeeargba gbgmgngaa; occurs in ßeeaga
aggegbaggegaga-Alge; ;agg;a bogs in West Virginia and Virginia but rarely
under ßeegga in North Carolina (A. Methven, pers. comm,). Laeeaggg;
hyeggga; has been found on surface mines reforested with Rgeea abge; in
West Virginia and in Eisen man-ms·Ab.i.e.s.£;:.asez.1.·Bet11.laforests
in West Virginia and Virginia. Large populations of Laeeaggg;
hegyg; were found as far south as the spruce-covered mountains surrounding
Chapter S 122
Table 20. 0iaQribuQiun uf Lgiggiyg in burual fur•aQ•
and hida-•1•vaQiun fur•aQa uf Qha SuuQh•rn Auuulachiana IS. A. ).
Suaeiaa Pruaanual•)
ur 0iaQ1-ibutiun AaauciahdQr••
abaunua l-) ganara
in S. A.
ggg l$¢uu. : Fr.) Fr. -Ciranburaal Picua. Abiua. Pinua
L. mgigyg lFr. a Fr.! Fr. ·Ciranburual
B•Qu1•
L. gguggjggg BriQz. • Ciranburual B•Qu1a
L. gggqg l$hcr•d.l Fr. -Circuvburaal. latula
L. (Fr. z Fr.! Fr. -Ciranburaal B•Qu1a
L. lP•ra. : Fr.! Fr.• Ciranhurual Puuulua
L. Ligggjgg Fr. ·Circnnburual Picaa. Abiua
L. ;p_], Haalar I $niQh • NE' cunifara‘!
L. ggg; saw. -NE Thuja ?
L. ggg}; Saiih -R Alnua
L. gjgjgg Pk. -NE Alnua
L, bjpggqgg Pk,•
ME. Qu HV Picua. Tang
„ L. bgagjgg (Fr. : Fr.) Fr.• Ciranburual. Qu NV.VA Picaa. Abiaa. B•Qula
L. ggiggn (Fr. : Fr.) Fr.• Ciraanburual. Qu R B•Qu1•
L. llull. : Fr.! Fr.• Ciranburaal. Qu R. TN B•Qu1a
L. g_igg (Fr.) Fr.• Ciranburual. Qu HV Piuaa. Pinnn
¤=L- amithaa Pk-!L. Ischuaff. : Fr.) Fr.
• Ciranburaal. Qu R l•Qu1a
L. (Fr. : Fr.) Fr.• Circnnburaal. Qu R Pica:. Pinua
L. gg_gg_i_i Pk.• NE. Qu R. TN Picua. Tanaga. Pinua.
Faqua. Quran
L. gqgigg Pk.• NE. Qu R. TN Picua. Abiaa. Pinua
Tang. B•Qula.
L. NE. Qu R. TN Picaa. Abiua. Pinua
L. IPk.lBur1.• NE. Qu R. GA Picuu. Abiaa.PinuaL.
Burl.• NE. Qu R. TN Tang
L. ggiggg Pk.• NE. Qu R. TN Pica. Abiua. Tang.
B•Qu1a. Alnua
L. gggggigg Pk.• Hiduaun-und ENAz Picua. Abiaa. Pinua
Quran. Butula. Tang
L. ggggü Burl.• Miduauruad EMA Pinua. Tauga. Faun.
Quran
L. ginurg Pk.•
Hiduauruad EMA ' Fugua
L. g_=,•_•~;|·;g_gjy; Ißull. : Fr.)• Niduauraad
Q•«••raQ• Piuaa. Qura.n.
S. F. Gray Fagnn
L. $•niQh I N•a1•r• Endunic Qu NV. VA. Picaa. Abiua. Tang
R. TN
L. jggilig lBn.•r1.lH•a1•r
I S•iQh•
Endunic Qu VA. R. TN Picua. Fagua. Tang
‘NE· nurQheaaQ•rn MurQh Aulricl
*ENA - •aaQ•rn NurQh Anurica
Chapter 5 123
the Canaan Valley in north central West Virginia. Lggtgglgg hlhhggggg
was only found once on a surface mine reforested with £lggg,gblgg in West
Virginia and may have been introduced.
The high•mountain Lggtgglgg flora (19 species) appears to be depleted
— compared to the potential Lggtgrigg flora of a boreal spruce•fir-birch
forest (28 species). Several Lggtgrlgg species common in boreal
communities are absent despite the presence of favorable habitats in the
high mountains (Table 20). For this comparison, all the Lggtggjgg species
of both regions were assumed to have been sampled. The depletion in
Lggtgglgg species could be explained by some interrelated hypotheses
originating in island biogeographic theory (MacArthur and Wilson, 1967;
Simberloff, 1974). Mountain peaks, including those of the Southern
Appalachians, have been considered insular islands (Whittaker, 1960;
Vuilleumier, 1970; Johnson, 1975; White gt gl., 1984). The small size
and isolation of the mountain·top spruce·fir-birch communities may have
led to an insular depauperization of their flora. In the Southern
Appalachians, eight of the ten areas higher than 1680 m exhibited a steep
slope for the log vascular plant species·log area curve (White gt gl.,
1984) which is characteristic of sets of insular islands. In addition,
many rare vascular plants of the region exhibited a patchy distribution
among the high peaks. These two lines of evidence indicated the insular
nature of the high peaks. Whittaker (1956) hypothesized that a
post—P1eistocene warming period caused an upward migration of the
Chapter 5 124
spruce-fir·birch zone resulting in extirpation of many boreal species.
Subsequent to a return to modern climate and downward migration of the ·
subalpine forests, reimmigration of boreal species between these peakse
or from the north has not been possible. Insular depauperization may
cause island communities to become overabundant in some species and
impoverished in others compared to mainland communities (Simberloff,
1974). Some Lggtgrjgg species may have been replaced by other species
of the genus or by other mycorrhizal fungi.
Environmental, climatic, or edaphic factors different from those in
the boreal or subalpine forests of the Northeast may have selected for
different Lggtgrigg species or in favor of other ectomycorrhizal
competitors and may have eliminated some Lagtarigs species in the Southern
Appalachians. Mean and minimal temperatures and annual precipitation
tend to be higher in the Southern Appalachians than in the Northeast. A
greater percentage of the precipitation occurs as rainfall in the Southern
Appalachian spruce-fir forests. Greater snowfall and longer snowpack may
insulate the rhizosphere for a longer time in the Northeast. A
significant amount of moisture may accumulate from fog moisture in the
montane and coastal spruce-fir forests of eastern North America. Also,
soil parent materials and soil forming processes vary among the different
regions of the eastern spruce-fir forests.
Some Lggggrigs populations may never have migrated into the Southern
Appalachians or may have continued northward migration beyond the
Appalachians during the Holocene. As the Wisconsin ice sheet retreated,
Chapter 5 125
boreal tree species migrated northward from different population centers
in southern North America (Davis, 1983). Migration rates differed among
trees depending on their individualistic responses to climates, dispersal
rates, and establishment requirements. According to Davis (1983), Lggjg
lggjgjgg (Du Roi) Koch migrated from the Great Plains moving across
Pennsylvania and central New York missing the Southern Appalachians.
Populations of Ahigs hglsgmgg rapidly spread northward from the southeast
along the east side of the Appalachians and then expanded northward and
westward. Rings hggksigng Lamb. and R. ggsingsg moved northward in a
similar pathway but at a much faster rate than other boreal species.
Presumably, Lgggggigs populations associated with these boreal trees
would also migrate northward from different population centers with each
species following different routes at different rates.
Another factor possibly contributing to the depletion of the Lggtggjgg
flora is the reduction in area of the Appalachian spruce•fir·birch forestsA
during the last century. These forests have been reduced from an
estimated one million acres to about 100,000 acres by logging and fires
.(Korstian, 1937; Allard and Leonard, 1952; Core, 1966). Habitats for
Lgggggigg species have also been eliminated by the destruction of Abjg;
jgggggi by balsam wooly aphids (Agglggs piggg Ratz.) (Fedde, 1973).
Do other ectomycorrhizal fungi of the high-mountains areas follow
these distribution patterns? Few other genera are as taxonomically well
known as Lgggggigs making it difficult to judge. However, most Rgggglg
species known from these spruce-fir-birch forests are also northern in
Chapter 5 126
distribution (Bills and Miller, 1984; Bills, 1984). At lower elevations,
the floristic fidelity of higher fungi with boreal communities is lost
rapidly, often with subtropical, tropical or eastern Asia disjunctions
occurring (Petersen, 1976; Hongo and Yokoyama, 1978). Also the number
of endemic species of Lggtggigg and other ectomycorrhizal fungi increases
at lower elevations (Bas, 1969; Hesler and Smith, 1979; Petersen, 1979).
Other components of the fungal communities within these high-elevation
forests are in need of documentation and comparison with fungal
communities of true boreal
forests.Chapter5 127
AERENDJLX A,. LLKZAIIQN QB SBBLEZE M12 PLQ'I§.. $10.,.,. HESI
- 3LI.R§iIN.IA,.
Location of plots 128
. . E ' w Ä JN 'II /{
4 ,' -·~‘
\ \// // .' E, B ag
,« 1//"/ ·/Y(N
1 x(M_—
“·
p ”« ‘— 2/ r'«‘ /“
.‘ _l
,1)r ß 1¤„ ~« sw w \‘2;+ Faw\·
.· ,_‘°xx?
(— L äÜ L · „ X; -— ~y
XQ 2\‘ g'
~_ ‘ ‘— ir / / _/‘\ ,‘ v Z ~'\1 j {5 _· 1LX \— vz ma we ,~j {3”°
/,3/'_\‘
J „· J.\\ Il
·>I
{I UI ,_
·.»— x
Rg Y·‘ <' ¤7
1 ·— ‘_ "« ·Ö » » ,-~yJ, /4, J, . ,.4 „./ __, ,„·' ,1 ‘, wr°‘
/L5_.4 2;- ,3 ,· '» _/,„ XR ig‘T ’“ "; Yi ·ä ,' _¥K‘—‘— il _!
rrIIII
nir , 1 'f· 1, g
,‘. ·'2;*_
, ' 1 ;_ 'Y‘_
5* -_‘~ ;¤ I, .‘7 wY2„‘ r\¥ Yu &"
g?,'
// ‘· ‘~J, jf
,> {ZA; L <; L Y_··t ‘·«‘«·
. -· ·„r, x.» _‘
—·Figure18. Locations of plots S1 and S2, Woodrow quadrangle, WestVirginia.
Location of plots 129
w 1 -};/9 /“LB__
__ézéigv
N E S.· _ L;
__ __3 _'
1
__;,-7
*33,
I‘~E 4/ 3 vv
’{
y l‘ *_3
:‘ 1;
j :_ ,994·/‘-
~ 61 \\3
‘*L*9
.3/' / / / [ *8 \ L" ·' *'
1 K LL[
‘.1[2
g ‘_vi N;
,~Figure19. Locations of plots H3 and H4, Hillsboro quadrangle, WestVirginia.
Location of plots 130
A I.Q
Ä ’v
(Q;
”°’..·‘.
‘~ 6- \
. Ä AÄ I d}II
,9)* \\ '~
3/ Iäw ‘ . IÄJBJX ÄQ \~\
Ä M Gate
I‘° ‘ I
Ö dI I {g t d Q „ ” {
‘ „ . " ·
-1 Q, _°C-f@<>sI \"‘~ I ‘ Ä .
I — QS8
S7
IIf/X
Q a I I. Ä " " QI ‘ Ä};.
.. \
A:% —
L„
\>
Ejagd/
34.
_
kd
<_H
5,,. BM d BM
/_/‘ Id d_
34793794‘/BM L
·, QIF
EJ
L E E L - S
IQ. / I: I
I B Q
, ",._ Ö f\ ”
Figure 20. Locations of plots S7, S8, H5, and H6, Lobeliaquadrangle, West Virginia.
Location of plots 131
I /. II I I \‘
I
I \.s\
460·1
mi ~, · _/I- Ixx 1 ··
__;
II
/ lf 1
I ".
‘L \FI Qß
I
/1/1
1/’
'fäaaxaoH12 I
.1\I L\LF L'
~ „_ F 1 /?“
„_ "'/1
1 ‘_,r’
r I L‘\I ( I -¤ \^I · __ angry \ FQ L
L fl)
-1_’„~
IQ-xyücp
°IIFigure21. Locations of plots S9, S10, H11, and H12, Lobelia
quadrangle, West Virginia.
Location of plots 132
12345678 41¤IllU¤UI UUUCIUEDZIIUUIIII UIIUDIUI6l¤UUIUUI IUIUCCHU4¤UEIIIID DIUUIUEU6I¤ IIDIH IIIIUIDDGIUIIIIUU IEIUUIUUYIIIUIIUI IUUIUIDU8¤I¤UUDU- IUIUUUUU
S1 w
UCIIDIDU IIIIUCHIUUEUUUDC IIUCIUIIDUUUIDUI IIUDUIUEDUIUIUUI UUUUUIIIIIIIDUUU UIDDUIIIIIIHDDDD UUUUUUUEIUIIDIUI UUIDUUUU 6IIIIIIII IUUUIUII
S 7 5 3
IIIDIIDU UIIIIIIUIIIIIIDU HUIIIIIIHIDIUIII IUIIUIIIUIHIUIII UIIIUIUIIIIIIIII IIIIIIIIIIIIIUII IIDIUIIIIIIUIIIU DUIIIUUIIIIIIDII IIIIIDIU
S 9 5 10Figure 22. Frequency of Lactarius oculatus in spruce plots.
Frequency Maps 134
123456781U¤II¤U¤I UIIHIUUEZDDIUDDUU IIIIUIUU6IUI¤UIII UIIUIIUC4I¤I¤IIII IIIICEII6IIUIIIII IIIIIIIISIIIUUDDD IIDDDIIIVIUIIUUUD IIIDUUIISIUUUIUUH IIIUIIUU
M M
DDDDDIII JIDDUUUUUIUHUDDI IIIHCIDUDUUUHUII HDIUUCUDUIIIIIID UIHUUDCUIIIIIIII UIDHUUUUIIIIIIII IIDUUUIIIIIIIIII IUDDHIIIIIIIIIID HDUUCUOD
S7 S8
IIIUIIII IIIUIIIIIIIIIIII IIIIIIIIIIIDUIUH IIIIDIUIUIUIIIUU IUIIIIDIUIIIIIII IDIIIIIDUIIIIIII IIIIIIIIIIIIIIUI IDIIIIIIIHIIIIII IIIIIDII
S 9 5 10Figure 23. Frequency of Clavulina cristata in spruce plots.
FIQQUBIICY MGPS 135
1 2 3 4 5 6 7 8
1IIlIIIII IIIIIIIIZIIIIIIII IIUIIIIIslIIIIIII IIIIIIUI4IIIIIIII IIIIIIIIsIIIIIIII IIIIIIIISUIIIIIII IIIIIIIIYIIIIIIII IIHIIIIISIIIIIIII IIIIIIIIl
S1 w
IIEIUIII UUIIIIII· 6 IIHUIIII IDIDIIIIIUIIUIDI UIUIIIIIIIIIIUUI IIIIIIIIIIIIUUUI IIIIIUIIIIIIDUUI IIIUIIIIIIIIIIII IIIDUUEIIIIIIIII IIIIHDIU
S 7 5 3
IIIIDDII IIIIIDIIIIIDUIDI IIIIIIIEIUIIIUUD UIIIIDUIIIIIUIUI DIIIIDUIIIIIIIIU IUIIIIHIIIIIIIID IIIIUUIIIIIIDUUU IIIIIIIIIIIIDDUU IIIIIIII
5 9 5 10Figure 24. Frequency of Lactarius vinaceorufescens in spruce plots.
Frequency Maps 136
123456781IDIIIII¤ IIIUIIUIZIIIIIIII IIIIDIUD3IIIIIIII IIIIIUID4IIIIIIII IIIIIIII6IIIIIIII IIIIIIIUGIIIIIIII IIIIUIIIYIIIIIIII IIIIIIIISIIIIIIII IIIIIIII
_ M M
HIIIIDUI DDIIIIUDIIIIIIHD UIUIIIUUIDUDIUID UIHIIIUUIIIUIIII UDIUDUUIIIIIIIII ‘UI¤UHIIIIIIIIIII UDIIUUIUIIIIIIII UIIIIIIH ·IIIIIIII DIIIIIUD
S7 1 S8
IIIIIUII IIIIIIIIIIUIIIIU IUIIIIIIIIIUIIID IIIIHIUIUIIUIIII UIIIIUIIDIIIIIID UIIUIIIDHIIIIIIU IIIIIIIIIUDUIIII IIIIIIIUIIDIIIIU IIIIIIUU
S 9 5 1 0Figure 25. Frequency of Boletus badius in spruce plots.
Frequency Maps 137
123456781IIIIIIlI HIUIIIDUZIIIIIIIU UICIIIIIaI¤IIlII¤ IUIUIIII4IlIIUIII OUUDIIII6IIIIUIII DDDIIIIIGIIIIIIII DUUIIIIUYIIIIIIII UIIIIIIUBUUIIIHII DIIDIIIU
S1 w
IIIIIIII IIIIIIIIIIIIIIII IIIIIIIIIIIIIIII IIIIIIIIIIIIIIEI IIIIIIIIIIIIIIII IIIIIIIIIIIIIIIU IIHIIIIIIIIIIIUI IIIIIIII .IIIIIIII IIUUIIII
S 7 5 3
IIIIUIDU IIIIIIIIIIIDIIDD IIIIIIIIIIIIDIII IIIIIIIIIIIIIIII IIIIIIIIIII¤¤¤¤I IIIIIIII
5 IIIUIIII IDDIUIIIIIIHDIGI IIIIUIII¤¤¤II¤¤¤ IIIIIIUI
S9g
510
Figure 26. Frequency of Amanita flavaconia in spruce plots.
Frequency Maps 138
123456781IIIIIIII IIIIIIIIZUUIUIIII UUUIIIII6I¤IIIIII IUHUIUII4I¤EIUIII IHDUDUUI6UIEI¤III HUIIUIUI6DIIII¤II IHIIUUIIVIIIIIIII IDIIIIII ~BIIIIIIII IIIIIIII‘ M M
IIIIUIII IIIIIIIDIIIIIIUI IUUIIIIIIIIIIIII IIIIIIIIIIIIIIII IIIIIIIIIIIIIIII IIIIIIIIIIIIIIII IIIIIIII .IIIIIIII IIIIIIIIIIIIIIII IIIIIIII
S7 S8 y
IIIIIIII -IIIIIIIUIIIIIUU IIIIIIII 9UUIIIIII IIIIIIIIUIIIIIII IIIIIIII·IIIII¤I¤ IUIIIIIIIIIIIIII IIIIUIIIIIUUCUDI IIIIIIIUIIUIIUII IIIIIIHI
$9 510
Figure 27. Frequency of Lactarius lignyotellus in spruce plots.
Frequency Maps 139
12345678 21¤IIIIIII IIIIIIIIZIDDIIIII IIIIEIII6IIIIIIII IIIIUIII4IIUIIIII IIIIUHII6IIIIIIII IIIIHIIU6IIIIIIII IIIIIIUI
. YIIIIIIII IIIIIIII8IIII¤III IIIIIIII
S1 M
IIUIIHII IIIIIIIUIIIIIIDI IIIIIIII
5 UIIIIIII IIIIIIIIIIIIIIII IIIIIIIIIIIIIIII. IIUIIIIIIIIIHIII IIUIIIII.IIIIIIII IIIIIIIIIIIIIIII II-IIIII
S7 _ sa
IIIHIIII IIIIIIIIIIIIIIII IUDIIIIIIIIHHUII IIIIIIIIIIIIIUII IIIIIIIIIIIIUUUH IIIIIIIIIIDUIUII IIIUIIIIIIUIIIII IIIIIIIIIIIIUIII IIIUIIII
S 9 5 10Figure 28. Frequency of Inocybe umbrina in spruce plots.
Frequency Maps 140
1 2 3 4 5 6 7 3
1¤IIIIIIl IIIUUIIIZUUIIIIII IIIUIIIIsIIIIIIII IIIIIIII4IIIEIIII IIIIIIIIsIIIIIIII IIIIIIIIGIICDUIII IIIIIIIIVIIUIIIII IIIIIIII8IIUIIIII IIIIIIII
S1 w
IIIIIIII IIIIIIIDIIUIIIII IIIIIIIUIIIIIIII IIIIIIIDIIIIIIII IIIIIIIIIIIIIIII IIIIIIIDIIIIIIII IIIIIIDUIIIIIIUC IIIIIIIIUUIIIIIU IIIIDUHI
· S7 ss
IIUIIIUI IIIIIIIIIIIIIIII IIIIIIIIIIIIIIII IIIIIIIIIIIIIIII IIIIIIIIIIIIIIII IIIIIIIIIIIIIIII IIIIIIIIIIIIIIII UIIIIIIIIIIIIIII IIIIIIII
ss 510Figure 29. Frequency of Russula granulata in spruce plots.
FIGQIJBIICY MBPS 14],
’ 12345678 ·1II¤¤l¤ID IIIIIIIIZIIUUIIII IIIIIIII6IIIIIIII IIIIIIII4IIIIIIII IIIIIIII6IIIIUIUI IIIIIIIIGIIIIIIII IIIIIIIIYIIIIIIUU IIIIIIIIBIIIDIDUU IIIIIIII
S1 w
IIIIIIII IIIIIIDIUIIIIIII IIIIIIIIIIIIIIII IIIIIIIIIIIIIIII IIIIIIIIIIIIIIII IIIIIIIIIIIIIIII IIIIIIIIIIIIIIII IIIIIIIIIIIIIIII IIIIIIII
S7 S8
7 IIIIIIII IIIIIIII_ IIIUIIII IIIIIIIU
IIIIIIII IIIIIIIIIIIIIIII IIIIIIIIIIIIIIII IIIIIIIIIIIIIIII IIHIIIIIIIIIIDUI IIIIIIIIIIIIIIII IIIIIIII
S 9 5 1 0Figure 30. Frequency of Amanita inaurata in spruce plots.
Frequency Maps 1}*2
12345678 2 3
1lIIIlIII IIIIIIIIZIIIIIIII IIIIIIII6IIIIIIII IIIIIIII4IIIIIIII IIIIIIII6IIIIIIII IIIIIIIIGIIIIIIII IIIIIIIIYIIIIIIII IIIIIIII .8IIIIIIII IIIIIIII
S1 w
IIIIIIDD IIIDIIIIIIIIIIIU IIIIIIIIIUIIIIII IIIIIIIIIHIIDIUD IDIIUIIIUIIIIIDI IIIIIIIIIIIIDIII IIIIIIIIIIIIIIII IIIIIIHIIIIIIIII IIIIIIII
‘ S 7 5 3
IIIIIIII IIIIIIIIIIIIIIII IIIIIIIIIIIIIIII IIIIIIIIIIIIIIII IIIIIIIIIIIIIIII IIIIIIIIIIIIIIII IIIIIIIIUIIIIIII IIIIIIII¤¤¤IIIII IIIIIIII
S 9 5 10_Figure 31. Frequency of Lactarus camphoratus in spruce plots.
Frequency Maps 143
123456784‘IIII¤III UDIIIIII gZIIDIIDII UUIIIIIIa¤IDIIIII IIIIIIII4II¤UIIII IIIIIIIIsIIIIIIII IIIIIIIISIIIIIIII IIIIIIIIVIIIIIIII IUIIIIIISIIIIIIII IIIIIIII g
H3 H4
IIIIUUII IIDIIIIIIIDIIIII IIIIUIIIIIIDIIII IDIIIIIIIIIIIIII IIIIIIII ‘IIUIIIII IIIIIIIIIIIIIIII IIIIIIIIIIIIIIII IIIIIIIIIIIIIIII IIIIIIII
6 H5 H6
UUIIIIII IIIIIIII·IIIIIIII IIIIIIUI°IIIIIIII IIIIIIIIIIIIIIII IIIIIIII gIIIIIIII IIIIIIIIIIIIIIII IIIIIIIIIIIIIIII IIIIIIIIIIIIIIII IIIIIIII
H11 H12Figure 32. Frequency of Lactarus camphoratus in hardwood plots.
Frequency MapsV
144
12345678‘III¤¤III IDIIIIIIZIIIUIIII IUIIIIII3IIIIIIII IDIIEIII4IIIIIIII IIUIDIII6IIIIIIII IIIIIIII6IIIIIIII IIIIIIIIVIIIIIIII IIIIIIII8IIIIIIII F IIIIIIII
H3 H4
DIIIIUII IIIIIIIIIUIIIUII IIIIIIIIIIIIIIII DUIIIIIIIIIIIIII IIIIIIIIIIIIIIII IIIIIIIIIIIIIIII IIIIIIIIIIIIIIUI IIIIIIIIIIIIIIII IIIIIIII
H5 H6
IHIIHCII IUIIIIIIIIDIIIII IIUIIIIIIIIIIIII IIIIIIIIIIIIIIII IUUIIIIIIIIIIIII IIIIIIIIIIIIIIII IIIIUIIIIIIIIIII IIIIUIIIIIIIIIII IIIIIIII
H11 H12
Figure 33. Frequency of Russula granulata in hardweod plots.
Frequency Maps 145
1 2 3 4 5 6 7 8‘IIIIIIII IIIIIIIIZIIIIIIII IIIIIIII3lIIIIIII IIIIIIII4IIIIIIII IIIIIIII6IIIIIIII IIIIIIIIGIIIIIIII IIIIIIII7IIIIIIIl IIIIIIIISIIIIIIII IIIIIIII
H5 H4
IIIIIIII IIIIIIIIIIIIIIII IIIIIIIIIIIIIIII IIIIIIIIIIIIIIII IIDIIIIUIIIIIIII DUDUIIUUIIIIIIII HUUDIIDDIIIIIIII UUUDIIIIIIIIIIII UUUUDIII
H5 H6
IIIIIIII IIIIIIIIIIIIIIII IIIIIIIIIIIIIIII IIIIIIIIIIIIIIII IIIIIIIIIIIIIIII IIIIIIIIIIIIIIII IIIIIIIIIIIIIIII IIIIIIIIIIIIIIII IIIIIIII
H11 H12
Figure 34. Frequency of Boletinellus merulioides in hardwood plots.
Frequency Maps 146
1 2 3 4 5 6 7 8—
‘IIIIIIII IIIDUIIDZIIIIIIII IIIUIIIUSIIIIIIII IIIIUUII4IIIIIIII IIIDIIUDsIIIIIIII UIUDIIIUSIIIIIIII IIIDUUUU7IIIIIIII IIIHIIII8IIIIIIII IIIIIIII
H3 7 H4
IIIIIIII UIIIIIIIIIIIIIII IIIIIIIIIIIIIIII IIIIIIIIIIIIIIII IIIIIIIIIIIIIIII IIIIIIIIIIIIIIII IIIIIIIIIIIIIIII IIIIIIIIIIIIIIII IIIIIIII
1 H5 H6 _
IIIIIIII IIIIIIIIIIIIIIII IIIIIIIIIIIIIIII IIIIIIIIIIIIIIII IIIIIIIIIIIIIIII IIIIIIIIIIIIIIII IIIIIIIIIIIIIIII IIIIIIIIIIIIIIII IIIIIIII
H11 H12Figure 35. Frequency of Scleroderma citrinum in hardwocd plots.
Frequency Maps 147
1 2 3 4 5 6 7 84
‘IIIIIIII IIIIIIIIZIIIIIIII IIIIIIIDSIIIIIIII IIIIIIII4IIIlIIII DUIIIIII6II¤IIIII IIIIIIII6IIIIIIII IIIIIDII7IIIIlIII IIIIIIII8IIIIIIII IIIIIIII
H3 H4
IIIDIIII DUIIIIIIIIIIIIII UUIIIIIIIIIIIIII IIIIIIIIIIIIIIII UIIIIIIIIIIIIIII IIIIIIIIIIIIIIII IIIIIIIIIIIIIIII IIIIIIIIIIIIIIII IIIIIIII
H5 H6
IIIIIIII IIIIIIUI .IIUIIIII IIIIIIII _IIIIIIII IIIIIIII.IIIIIIII IIIIDDIIIIIIIIII IDUIIIIIIIIIIIII IIIIIIIIIIIIIIII IIIIIIIIIIIIIIII IIIIIIII
H11 H12Figure 36. Frequency of Laccaria laccata in hardwood plots.
Frequency MBPS 148
AREEND.IXQ..IBEELz2£MDBHlLQQAIIQN§INlL§RDW£lQDANDSRRLLQERLQIS.„
Abbrev1ac1o¤s for mess.
P=Bis;s.ams.bens
S=Ass1s.a.mh¤mm
F=£¤xusxxuxsii£9.11¤l
C=P.¤ms;s.s.e:9.tina
Q=Q1ez.c1mr1;1zz.¤
A=Eu:sinuaameri:„ana
Tree locations 149
1 2 3 A 6 6 1 g
‘IIIIIIIl=lIIIIIII=lIIIIIII·IIlIIlII=IIIIIIIIP
P P
PIIIIIIII·IlIIIlIl
S1
Figure 37. Tree locations in plot S1.P
Tree locations 150
1 2 2 4 6 6 1 •
·lIIIIIll=IIIIIIlI=IllIlIIl·IlIllIII
P·IIlIIlI*·IlIIIHlI7IlIlIIIl·IlIlIIll
S 2
Figure 38. Tree locations in plot S2.
Tree locations 151
1 2 3 4 S 5 7 I
GIIIIIIIIGIHIIIIIIG IIIIIIIIG IIIIIIIIGIIIIIIIIGIIHIIIIIG G IIIIIIIG G IIIIIII
H3
Figure 39. Tree locations in plot H3.
Tree locations 152
1 2 3 I 5 O 7 Ü _
·IlIIlIIl·IllIIIII·IllIIllI·IllIIIIlSII-II--I·IlIIIlII«IIllIlII·IIIllIlI
H 4
Figure 40. Tree locations in plot H4.
TIQG 1OC8tiOIlS 153
1 2 s e s• 7 •
IIIIIIIH· IEIIIIII7 IIIIIIII· IIIIIIIÜ7 IIIIIIII7 IIIIIIII7 IIIIIIII
C
8
H5
Figure 41. Tree locations in plot HS.
Tree locations 154
1 2
’
3 4 5 s 7 |
*IlIIlIII=lIIIIIII=IIlIIIII·IIIIIIII5 I°IIIllI~llIIIlII»IIIIIlIl•I-I-IIII
H 6 '
Figure 42. Tree locations in plot H6.
Tree locations 155
1 2 3 •6 6 7 6
A
·lIllIlIl·I.-II-.-·IlIIIIII·IllIIlIISHIIIIIII«lIIIIIIl7IIIIIIII·IIIIIIll
· S 7
Figure A3. Tree locations in plot S7.
TISB 10C&tiOI1S 156
1 2 3 4 s 6 7'5IIIIIIII5
ÜIIIIIII 15 IIIIIIII· IIIIIIII5 IIIIIIII5 Ill-IIII5 IIIIIIII5 IIIIIIII
S 8
4Figure 44. Tree locations in plot S8.
Tree locations 157l
1 2 3 4 5 ( 7 g
G IIIIIIIIG IIIIIIIIG IIIIIIII· IIIIIIIIG IIIIIIIIG IIIIIIIIG IIIIIIIIG IIIIIIII
S 9
Figure 45. Tree locations in plot S9.
Tree locations 158
1 2 I 4 I I 7 I
‘lIllIIII·IlIIIlII·lIIIIIII·IlIIIIII·IlIIIIlI·IlIIlIIl7IIIIlIIl·IIIIIIIl
S10
Figure 46. Tree locations in plot S10.
Tree locations 159
‘2 s 4 6 6 1 g
*IIlIlIlI·IlIIIIIl~IlIIIIII·IllIIIII5
F
·IIIIlIlIC7 F
·IIlIllIIH 1 1
Figure /+7. Tree locations in plot H11.
Tree locations 160
1 2 3 4 5 6 7 3
CVIIIIII IVIIIIIIIIVIIIIIIII
B
4F
VIIIIIIIIVIIIIIIII
C
VIII IIIIVIIIIIIIIH12
Figure 48. Tree locations in plot H12.
TIQQ 1OC8tiOIlS 161
AREENDIX IL. BAK DAIA l2§.1i.1„.
Copies of the raw data sets for fungal species and tree species are
obtainable from the author, Dr. Orson K. Miller, Jr. , and Dr. Golde I.
Holtzman. An additional set was deposited in the New York Botanical
Garden Archives.
Appendix D. Raw data 1981-83. 162
I
__l____l_. 1939. Two new species of Rugsggle together with the sporeornamentation of some of our American Russulas. Myeglegie 31:490-498.
Cain, S. A. 1938. The species-area curve. Age;. Mid. Net. 19: 573-581.
Campbell, C. L. and S. P. Pennypacker. 1980. Distribution of hypocotylrct caused in snapbean by Bhizettenie selmi- 70:521-525.
Christensen, M. 1981. Species diversity and dominance in fungalcommunities. ln: Ihe fgngel eegggnjty. Eds D. T. Wicklow and G. C.Carroll. Marcell Dekker, Inc., New York. pp. 201-232.
Chui, W. F. 1945. The Russulaceae of Yunnan. Lleygie 8: 31-59.
Cliff, A. D. and J. K. Ord. 1973. Sgetjgl egtgee;;elet1g¤. Pion, London. ·175 p.
Cole, L. C. 1949. The measurement of interspecific association. Eeglegy30: 411-424.
Core, E. L. 1966. Yegetetjen gf lee; Y1;g1gie. McClain Printing Co.,Parsons. 217 p.
Cotter, H. V. T. and G. F. Bills. in press. Comparison of the spatialpatterns of the sexual and vegetative states of ßeletjgellge
Davis, M. B. 1983. Holocene vegetational history of the eastern UnitedStates- Pp- 166-181- In:. ef theunited Staus,. hl,. 2... Ihe Heletene- Ed- . H- C- Wright- Universityof Minnesota, Minneapolis.
Deacon, J. W., Donaldson, S. J., and F. T. Last. 1983. Sequences andinteractions of mycorrhizal fungi on birch. Ble; gg ßeil.71:257-262.
Dey, J. P. 1976. Phytogeographic relationships of the fructicose andfoliose lichens of the southern Appalachian Mountains. Pp. 398-416.In: hiuerx ef the hieta ef the sedthern
hrt lu- Algae end thai- Eds-. B- 0- Parker and M-K. Roane. University of Virginia, Charlottesville.
. 1978. Fructicose and foliose lichens of the high-mountain areasof the southern Appalachians. ß;gglegjet 81: 1-93.
Dominik, T. 1961. Studium nad mikotrofizmem swierka pospolitego -hp1.Pice excelsa (Lam.) Lk. w Polsce. lnete Bee, Leege £;„ 1961,209: 1-24.
Bibliography 165
\
Edens, D. L. 1973. The ecology and succession of Cranberry Glades, WestVirginia. Ph. D. Dissertation, North Carolina State University,Raleigh.
Edwards, P. J. 1984. The growth of fairy rings of Agggigg; ggggy;}; andtheir effect upon grassland vegetation and soil. J. Egg}. 72:505-513.
Fedde, G. F. 1973. Impact of the balsam wooly aphid (Homoptera:Phylloxeridae) on cones and seed produced by infested Fraser fir.Qgygg. Eyggmg}. 105: 673-680.
Fogel, R. 1976. Ecological studies of hypogeous fungi. II. Sporocarpphenology in a western Oregon Douglas Fir stand. Qgy. J. Egg. 54:1152-1162.
. 1981. Quantification of sporocarps produced by hypogeousfungi. }y Ihg fgygg} gggmgyigy. Ed., D and G. C. Carroll. Marcell
- Dekker, Inc., New York. pp. 553-568.
Gauch, H. G. 1982. Multivariate analysis in community ecology. CambridgeUniversity Press, New York. —
Giltrap, N. J. 1982. Production of polyphenol oxidase by ectomycorrhizalfungi with special reference to Lgggggig; spp. Iggy;. Egig. Mygg}.Egg. 78: 75-81.
Greig-Smith, P. 1983. Quantitative plant ecology. 3rd. Ed. University ofCalifornia Press. Los Angeles. 359p. ~
Hering, T. F. 1966. The terricolous higher fungi of four Lake Districtwoodlands. Iggy;. Eg. Mygg}. Egg. 49: 369-383.
Hesler, L. R. 1945a. Notes on Southern Appalachian fungi. VI. J. Igyyg;;ggAggg. Eg}. 20: 233-2
. 1945b. Notes on Southern Appalachian fungi. VII. J.Igyyg;;gg. Aggg. Eg}. 20: 363-372.
. 1960. Mushrooms of the Great Smokies. University ofTennessee Press, Knoxville. 289 p.
____________. 1960. A study of Eg;;g}g types. Mgm. Iggggy Egg. Q}gg 21:1-59.
. 1967. The genus Eygg}ggg in southeastern North America.B.e.ih- Nam Haduidaia 23= 1·196-
and A- H- Smith- 1979- Nnnth Anuisau sp.¢.¢.i¤ 9.£Lgggggig;. University of Michigan Press, Ann Arbor. 650 p.
Bibliography 166
Homola, R. L., and P. A. Mistretta. 1977. Ectomycorrhizae of Maine, Alisting of Boletaceae with associated hosts. Life Sciences and
A Agriculture Experiment Station Bulletin 735. Univ. Maine, Orono.
____________, and M. M. Czapowskyj. 1981. Ectomycorrhizae of Maine 2. Alisting of Lgggggigg with the associated host AgricultureExperiment Station Bulletin. 779. Univ. Maine, Orono.
Hongo, T. 1960. The Agaricales of Japan I-3. Russulaceae. AgggEhyggggxgg. Geobot. 18: 129-146.
_________, and K. Yokoyama. 1978. Mycofloristic ties of Japan to theA continents. Mgm. ßhigg Qgiy. Egg. Aggg ggi. 28: 76-80. 545-574.
_ Hora, F. B. 1959. Quantitative experiments on toadstool production inwoods. Igggg. E;. Myggl. ßgg. 42: 1-15.
___________. 1960. New checklist of British agarics and boleti part IV.Validations, new species and critical notes.I;ggg. ßgjg. Myggl.§gg. 43: 440-459.
Hueck, H. J. 1953. Myco-sociological methods of investigation. Vggggggig4: 84-101.
Ingold, C. T. 1974. Growth and death of a fairy ring. ßgll. ßgjgg Mgggl.Sgg. 8: 74.
Johnson, N. K. 1975. Controls of numbers of bird species on montaneislands in the Great Basin. Eyglggjgg. 29: 545-57
Kauffman, C. H. 1917. Tennessee and Kentucky fungi. Mggglggjg 9: 159-165.
_....l- 1918- Ih; Aza:.is.¤:&.¤s Qi Mishizan- V¤1s- I. II-Mishizan Gm.1- Biel- $1:;:- Pxbl- 26. hiszl- Sg: 5. 924 p-
Knudson, H., and T. Borgen. 1982. Russulaceae of Greenland. Pp. 216-243.lg: Agggjg ggg gjgjgg gygglggy. Eds., G. A. Laursen and J. A.Ammirati. University of Washington, Seattle.
Korhonen, M. 1984. Sgggggg gggkgg. Otava, Helsinki. 223 p.
Kornerup, A., and J. H. Wanscher. 1978. Mgghggg hggggggk gf gglgg;. 3rdEd. E. Methuen and Co., Ltd., London. 252 p.
Korstian, C. F. 1937. Perpetuation of spruce on cutover and burned lands1
in the higher southern Appalachians. Eggl. Mgggg;. 7: 125-167.
Kühner, R. 1975. Agaricales de la zone alpine. Genre Lgggggigg D. C. exS. F. Gray. ßgll. Sgg. Myggl. Eggggg 91: 5-69.
Bibliography 167
Lacy, R. C. 1984. Ecological and genetic response to mycophagy inDreeephilidee (ßiptere)- ln:
in reales! and e1o.1m.ie¤- Eds- , Q- Wheeler and M-Blackwell. Columbia University Press, New York. pp. 286-301.
Lange, M. 1948. The agarics of Maglemose. De. Bee. Agk. 13: 1-141.
_. 1978. Fungus flora in August, ten years observations :L¤ aDanish beech wood district. ße;. Ileeek;. 73: 21-54.
Last, F. T., P. A. Mason, J. Wilson, and J. W. Deacon. 1983. Fine rootsand sheathing mycorrhizae: their formation, function and dynamics.Elan; end Seil 71: 9-21-
Laursen, G. A. and J. A. Ammirati. 1982. Lactarii in Alaskan arctictundra. le: Ageele ege eleige myeelegy Eds., G. A. Laursen and J.A. Ammirati. University of Washington Press, Seattle. pp. 245-281.
MacArthur, R. H., and E. O. Wilson. 1967. Ihe eheegy ef lelegehlegeeggeehy. Princeton University, Princeton. 61: 909-916.
Mclntosh, R. P., and R. T. Hurley. 1964. The spruce-fir forests of theCatskill Mountains. Eeelegy 45: 314-326.
Miller, 0. K., Jr., 1983. Ectomycorrhizae in the Agaricales andGasteromycetes. Qeg. 1. ßee. 61: 909-916.
Muel1er·Dombois, D., and H. Ellenberg. 1974. Aims and methods ofvegetation study. Wiley, New York.
Neuheff, W- 1956- Die Milehlinze Laereriue)- Bed HeilbrrmnObb., Julius Klinkhardt. 248p.
Newell, K. 1984. lnteraction between two decomposer basidiomycetes and acollembolan under Sitka spruce: distribution, abundance andselective grazing. Sell ßlel. ßleehem. 16: 227-233.
Nicot, P. C., D. I. Rouse, and B. S. Yandall. 1984. Comparison ofstatistical methods for studying spatial patterns of soil bornRhyeeeeehelegy 74: 1399-1402.
Noy-Meir, I. 1973. Data transformation in ecological ordination. I. Someadvantages of non-centering. 1. Eeel. 61: 329-341.
Oosting, H. J., and W. D. Billings. 1951. A comparison of virginspruce-fir forests in the northern and southern Appalachian system.
_ Eeelegy 32: 84-103.
Peck, C. H. 1870 (1872). Report of the state botanist. Ageeel Bee. NegYegk Seeee Me;. 24: 41-108.
Bibliography 168
. 1884 (1885). New York species of Lgggggigg. Aggggl Egg. NggYggk Sgggg Mg;. 38: 111-133. -
Petersen, P. M. 1977. Investigations on the ecology and phenology of themacromycetes in the arctic. Mggg. Qgggg. 199: 1-72. 4
Petersen, R. H. 1976. The southern Appalachian Mountains as a refugiumfor tropical basidiomycetes. Pp. 287-295. lg: Qigggigggigggl
Alxs:2ggg fgggi. Ed. B. C. Parker and M. K. Roane. University ofVirginia, Charlottesville.
_____. 1979. Checklist of fungi of the Great Smoky Mountains„ National Park. Nat. Park Serv. Manage. Rep. No. 29.
Pielou, E. C. 1974. Rggglggigg ggg ggggggigy ggglggg. Gordon and Breach.New York. 424p.
Ramseur, G. S. 1960. The vascular flora of high mountain communities ofthe southern Appalachians. 1. Elighg Miggggll ßgi. ßgg. 76: 82-112.
Rice, E. L., and R. W. Kelting. 1955. The species•area curve. Egglggy 36:7-11.
Richardson, M. J. 1970. Studies on Egggglg gmggjgg and other agarics ina Scots pine plantation. Igggg. B;. Myggl. Sgg. 55: 217-229.
Ridgwey, R- 1912- 9.012: atandaxda and Publ- by the euther,Washington, D. C. 43 p., 53 pl.
”l
Remegnesi. H- 1967- Lea Knsaulsa dlE1::20.e at dLA£:i2¤2 du N2:d- Berdas,Paris. 998 p.
Schaeffer, J. 1952. Egggglg;Mgggg;gghig Bad Heilbrunn Obb., Juliusl
Klinkhardt. 295 p.
Shannon, C. E., and Weaver, W. 1949. Ihg ggghggggjggl ghgggy gfggggggggggjgg. University of Illinois Press, Urbana.
Shaffer, R. L. 1962. The subsection Qgggggggg of Egggglg. ßgjggggjg 14:254-284.
1964- The subseetieh ef Ruasnla- ¤y20.12z;La _56: 202-231.
______________. 1970a. Notes on the subsection Qggggggggigggjggg and otherspecies of Egggglg. Llgygig 33: 49-96. _
. 1970b. Cuticular terminology in Egggglg (Agaricales).ßgjggggig 22: 230-239.
Bibliography 169
. 1972. North American Russulas of the subsectionBzs.t.en1:.;L¤ae- Uxcelsxia 64= 1008-1053-
_____________. 1975. Some common North American species of Egggg}gsubsection Emg;}g}ggg. ßgih. Hggwjdgig 51: 207-237.
Shew, B. B., M. K. Beute, and C. L. Campbell. 1984. Spatial patterns ofsouthern stem rot caused by Sg}g;g;}gm-;g}f5}i in six North Carolinapeanut fields. Rhy;ggg;hg}ggy 74: 730-735.
Shorrocks, B. and P. Charlesworth. 1982. A field study of the associationbetween the stinkhorn Ehg}}gg imggdiggs Pers. and the Britishfungal-breeding D;g5ggh}}g. Big}. 1. Linnggg Sgg. 17: 307-318.
Simberloff, D. S. 1974. Equilibrium theory of island biogeography. Agggg}Egg. Egg}. Sys;. S : 161-182. .
Singer, R. 1939. Contribution a l°etude des Russules 4. Quelques Russulesamericaines et asiatiques. Eg}}. Sgg. Mygg}. Eggggg 55: 226-283.
. 1942. Type studies on basidiomycetes. I. Mygg}gg}g 34: 64-93.
_________. 1943. Type studies on basidiomycetes. II. Mygg}gg}g 35:142-163.
m.-1949-22:5-832.
tl. 1957. New and interesting species of basidiomycetes V. Sy_dg_;g;|,_a11: 141-272.
.....- 1962- The Azar.:I.s.a1s.a in modem Lazssnszmx- 2¤d Ed- J- Cramer.Vaduz. 915p.
m- 1975- The Axazisales in mmm taasmnemx- 3rd Ed- J- Cramer.Vaduz. 912p.
Sokal, R. R. and N. L. Oden. 1978. Spatial autocorrelation in biology.1. Methodology. Ejg}. 1. L}gnggg Sgg. 10: 199-228.
Smith, J. D. 1980. Is biological control of Mgggsmigs ggggggg fairy ringspossible? B}gg; Qiggggg 64: 348-354.
Strausbaugh, P. D., and E. L. Core. 1978. Ihg f}g;g gf Egg; V};g}g}g. 2nded. Seneca Books, Inc. Grantsville.
Stephenson, S. L., and J. F. Clovis. 1983. Spruce forests of the AlleghenyMountains in central West Virginia. Qgg;gggg 48: 1-12.
Takhtajau. A- L- 1969- Elmmrius p.1a¤.Ls.. mrigin ausl siispsmal-Smithsonian Institute Press. Washington, D. C. 310 p. '
Bibliography 170
Taylor, J. D., G. J. Griffen, and K. H. Garren. 1981. Inoculum pattern,inocculum density, disease incidence relationships, and population
. flucuations of of §y}igg;gg}gg}gg g;gyg}g;}gg microsclerotia inpeanut field soil. Bhyygggyhg}ggy 71: 1297-1302.
Thomas, G. W., D. Rogers, and R. M. Jackson. 1983. Changes in themycorrhizal status of Sitka spruce following outplanting. B}ggyggg Sgj} 71: 319-323.
Thompson, W. and A. D. M. Rayner. 1982. Spatial structure of a population¤f nlaaamhxlla in a w¤¤d1d¤d Sitd- Neu Bh1t.212zi¤.t1 92: 103-114.
Treppe, J. M. 1962. Fungus associates of ectotrophic mycorrhizae. Egy.Bgyg. 28: 538-606.
Van Steenis, C. G. G. 1972. Ngyhgfgggg, key genus to plant geography. Pp.275-288- In= and a12l11.t.i2n- Ed- , D- H-Valentine. Academic Press, London.
Vuilleumier, F. 1970. Insular biogeogrephy in continental regions. I. Thenorth Andes of America. Agg;. Ngyg;g}igy. 104: 373-388.
Wagner, A. J. 1984. Why it happened? yggyhgggigg 37: 12-17.
Wasterlund, I., and T. Ingelog. 1981. Fruit body production in some youngSwedish forests with special reference to logging waste. BggggyEgg}. Mggg. 3: 269-294.
Watling, R., 1982. Taxonomic status and ecological identity in thebasididmycetes- In thai: 212191:2 andggg}ggy. Eds., J. C. Frankland, J. N. Hedger, and M. J. Swift.Cambridge University Press, Cambridge. pp. 1-32.
White, P. S., R. I. Miller, and G. S. Ramseur. 1984. The species-arearelationship of the Southern Appalachian high peaks: vascularplant richness and rare plant distributions. gggygggg 49: 47-62.
Whittaker, R. H. 1956. Vegetation of the Great Smoky Mountains. Egg}.Mgggg. 26: l-80.
_______________. 1960. Vegetation of the Siskiyou Mountains, Oregon andCalifornia. Egg}. Mgggg;. 30: 279-338.
Wilkins, W. H., and S. H. M. Patrick. 1940. The ecology of larger fungi.IV. The seasonal frequency of grassland fungi with specialreference to the influence of environmental factors. Agg. Apg}.Big}. 27: 17-34.
, and G. C. M. Harris. 1946. The ecology of larger fungi.V. An investigation in the influence of rainfall and temperature
Bibliography 171
on the seasonal production of fungi in beechwood and pinewood.A33. Aggl. ßigl. 33: 179-188.
Wojciechowska, H. 1960. Studies on the mycotrophy of the spruce (Ejggggxgglgg Lk.) in its northern range with particular regard to themycotrophy of plant communities in the Forest District Sadlowo,Subdistrict Lipowo near Biskupiec Reszilski. Eglig Egg. Egl. Sgg.A. 2: 123-166. (translated from Polish).
Zak, B., and D. H. Marx. 1964. Isolation of mycorrhizal fungi from rootsof individual slash pines. Eggggg Sgj. 10: 214-221.
Bibliography · 172