Golder Associates Md. 1 796 Coumvood Crescent Ottawa, Ontario. Canada K2C 285 Telephone (61 3) 224-5864 FOX (61 3) 224-9928 REPORT ON GROl,rNDWA'TER MONI'I'OK ING PROCilWM FOR THIRD YEAR OF OFEMTION bVF.L,I, SITE NO. 7 VlLI,A(;E OF WINCI-IESTER WAT Eli SlJPPLY Sk STEM EXCJANSIC)N PROJECT Submitted to: North Dundas Township 547 St. Lawrence Street P.O. Box 489 Winchester, Ontario KOC 2K0 DISTRIBUTION: 10 copies - North Dundas Township 2 copies - Golder Associates Ltd. May 2000 OFFICES IN AUSTRALIA. CANADA, GERMANY. HUNGARY, ITALY. SWEDEN. UNITED KINGDOM, UNITED STATES
OFFICES IN AUSTRALIA. CANADA, GERMANY. HUNGARY, ITALY. SWEDEN. UNITED KINGDOM, UNITED STATES
May 2000 -1- 991-2857
EXECUTIVE SUMMARY
This document has been prepared to summarize the results of the groundwater monitoring program associated with the third year of operation of Village of Winchester Well Site No. 7. The objectives of this monitoring program were to monitor groundwater level variations, flow characteristics, and groundwater quality conditions on site and in the vicinity of Well Site No. 7 during the third year of operation, and to compare these to previous trends observed during the pre-operational groundwater monitoring program and during the first two years of operation.
The groundwater levels recorded during the third year of operation at all of the monitors included in the monitoring program appear to reflect continued influence from the pumping activities on Well Site No. 7. Maximum drawdowns in the immediate vicinity of the well are about 1 metre compared to pre-operational conditions. The degree of influence from pumping on the groundwater monitors appears to be inversely proportional to the distance from the well site, as would be expected.
Based on the groundwater level data obtained during the third year of operation, the interpreted general direction of groundwater flow remains consistent with pre-operational flow directions, with slight variations in the immediate vicinity and to the north of the pumping wells.
In general, the ongoing land uses and pumping operations at the Village of Winchester Well Site No. 7 do not appear to have adversely affected groundwater quality to date in the vicinity of the well site.
A proposed monitoring program for the fourth year of operation is provided. Based on the amount of data collected during the first three years of operation and the observed consistency in trends, this proposed program includes reductions to the frequency of groundwater level monitoring and groundwater quality monitoring.
Summary of Groundwater Monitoring Program For On-Site and Off-Site Boreholes, Third Year of Operation
Elevation Data
Water Level Data
Proposed Groundwater Monitoring Program For On-Site and Off-Site Boreholes, Fourth Year of Operation
Key Plan
Site Plan and Study Area
Groundwater Elevations in Vicinity of the Village of Winchester Well Site
Groundwater Elevations in Morewood Esker
Groundwater Elevations in Various Geological Formations
Groundwater Elevations in 96-Series Monitoring Wells
Report of Monitoring Results
Report of Analysis Sheets
Golder Associates
May 2000 -1- 991-2857
1.0 INTRODUCTION
This document has been prepared to summarize the results of the groundwater monitoring
program associated with the third year of operation of the Village of Winchester Well Site No. 7.
The scope of the monitoring program was described in Section 4.0 of Golder Associates (1999).
Well Site No. 7 was put into operation on March 21, 1997. This report presents the results of
monitoring activities conducted between April, 1999 and March, 2000.
The objectives of the groundwater monitoring program for the third year of operation were:
to monitor groundwater level variations and flow characteristics on-site and in the vicinity of
Well Site No. 7 during the third year of operation, and to compare these to previous trends
observed during the pre-operational groundwater monitoring program (Golder Associates,
1996) and during the first two years of operation (Golder Associates, 1998, 1999);
to compare groundwater quality conditions on-site and in the vicinity of Well Site No. 7
during the third year of operation to baseline groundwater quality established in the pre-
operational groundwater monitoring program (Golder Associates, 1996) and to groundwater
quality data collected during the first two years of operation (Golder Associates, 1998,
1999).
The Village of Winchester Well Site No. 7 is located on Lot 15, Concession IX in the former
Township of Winchester, Ontario (see Key Plan, Figure 1). A site plan and overview of the
study area, including the locations of all groundwater monitors included in the groundwater
monitoring program for the third year of operation and the locations of the production wells (i.e.,
wells 7A, 7B and 7C), are shown on Figure 2.
May 2000 -2- 991-2857
2.0 PROCEDURES
A summary of the groundwater monitoring program for the third year of operation is provided in
Table 1 including the sampling dates and locations, and the chemical and physical parameters
that were measured in the field and in the laboratory.
2.1 Groundwater Level Monitoring
Groundwater level measurements were recorded once each month from April, 1990 to March,
2000, inclusive. All groundwater level measurements were conducted by personnel from the
South Nation Conservation (SNC) authority with the exception of water level measurements
made on July 27, 1999, which were recorded by Golder Associates.
Groundwater level measurements included in the proposed program for the third year of
operations (Table 4 of Golder Associates, 1999) that could not be obtained for various reasons
are listed below along with explanations as to why the measurements could not be obtained. In
addition to the proposed program, water level measurements were recorded at several of the
groundwater monitors by Golder Associates on July 27, 1999, as part of a separate study. These
measurements have been included in this report to augment the data collected by SNC.
Golder Associates
May 2000 -3- 991-2857
2.2 Groundwater Quality Monitoring
Groundwater quality monitoring sessions were conducted in June and September 1999 and
March 2000, as indicated in Table 1, in accordance with the proposed program for the third year
of operations (Table 4 of Golder Associates, 1999).
The groundwater monitors included in the monitoring sessions were 94-5, 94-1 1, 96-19, 96-20,
96-21 and 96-22. A groundwater sample could not be collected from monitor 96-21 in March
2000, due to a missing dedicated sampling device in this monitor.
The groundwater monitors were developed through the removal of at least three standing
volumes of water using dedicated sampling devices consisting of a length of flexible low density
polyethylene (LDPE) tubing and a Model D-25 foot valve manufactured by Waterra Pumps Ltd.
of Toronto, Ontario. Groundwater samples were collected from each monitor immediately after
well development.
The temperature, pH and conductivity of the groundwater samples collected during the June
1999 and March 2000 sampling sessions were measured in the field at the time of sample
collection (with the exception of the pH at monitor 96-19 during the March 2000 session, which
was measured by the analytical laboratory due to field equipment malfunction). The pH and
conductivity meters were calibrated prior to use. The temperature of the groundwater samples
collected during the September 1999 session were measured in the field during sample
collection; the pH and conductivity of the September 1999 groundwater samples were recorded
by the analytical laboratory. All samples were entered on a Chain of Custody Form and placed
in coolers with ice packs until they were delivered in person to the private analytical laboratory.
The groundwater samples were collected, prepared and preserved in the field as follows:
one plastic bottle, field filtered to 0.45 microns and preserved to pH<2 with nitric acid for
analysis of sodium and potassium
Golder Associates
one plastic bottle, unfiltered and unpreserved for analysis of chloride and nitrate
May 2000 -4- 991-2857
one plastic bottle, unfiltered and preserved to pH<2 with sulphuric acid for analysis of total
phosphorus
a one amber glass vial with Teflon septum, unfiltered and unpreserved with no headspace for
analysis of BTEX (Benzene, Toluene, Ethylbenzene, Xylenes)
a one amber glass bottle with foil lined cap, unfiltered and unpreserved for analysis of atrazine
All groundwater sampling and field analyses during the groundwater monitoring program for the
third year of operation were conducted by SNC personnel. Golder Associates assisted SNC
during the June 1999 sampling session.
Accutest Laboratories Ltd. in Nepean, Ontario, performed all laboratory chemical and physical
analyses on the groundwater samples.
2.3 Groundwater Monitor Inspection and Repair
Following recommendations in Section 4.0 of Golder Associates (1999), riser pipe extensions
were added to groundwater monitors 94-8A and 94-8B during the June 1999 sampling session on
June 22, 1999. Monitors 94-9A, 94-9B and WESA-16 were also located and marked during
Golder Associates' visit on June 22, 1999. The revised top of casing elevations for monitors
94-8A and 94-8B are indicated in Table 2.
Golder Associates
May 2000 -5- 991-2857
3.0 DISCUSSION
3.1 Groundwater Levels
The groundwater levels measured during the groundwater monitoring program for the third year
of operation are provided in Table 3. The groundwater elevations in Table 3 were calculated
using the elevation data presented in Table 2. These groundwater elevations along with
historical groundwater levels measured during the pre-operational monitoring program and the
first two years of operation are represented graphically on Figures 3,4,5 and 6.
Precipitation data and pumping data have not been provided to Golder Associates. Therefore,
discussion in this report regarding groundwater elevations recorded during the third year of
operation in comparison to the first two years of operation and pre-operating groundwater
elevations is strictly factual. Any suggestions for causes of changes in groundwater elevations
over time are hypothetical and should be evaluated through a comparison to precipitation and
pumping data in order to more thoroughly understand the reasons for changes over time.
Figure 3 shows groundwater level fluctuations on, and in the immediate vicinity of, the Village
of Winchester well site (Well Site No. 7). The screens of these groundwater monitors are
located in the core of the Morewood esker in unconfined fine sand and sand and gravel deposits.
The trend depicted in Figure 3 shows continued seasonal variation with groundwater levels
highest in the spring months. The lowest groundwater levels recorded during the third year of
operation occurred during the late summerlearly fall of 1999. This is similar to the trend
observed during the first year of operation, but in contrast to the second year of operation which
saw the lowest groundwater levels occurring in the late falllearly winter months. The lowest
groundwater levels recorded during the third year of operation were similar to or slightly higher
than the lowest groundwater levels recorded during the second year of operation. The lowest
groundwater levels recorded at the monitors in the immediate vicinity of Well Site No. 7 during
the third year of operation were about 1.0 to 1.2 metres lower than the low water levels recorded
during the pre-operational monitoring program.
Figure 4 shows groundwater level fluctuations in other groundwater monitors located in the core
of the Morewood esker to the south of Well Site No. 7 (with the exception of 94-7, which was on
the road allowance directly north of the well site). The screens of these monitors are all in
Golder Associates
May 2000 -6- 991-2857
unconfined sand and gravel. Groundwater monitor 94-7 was destroyed after November 1996.
Monitor WESA-16 was unable to be located between July 1997 and May 1999. As discussed in
Section 2.3, monitor WESA-16 was found during the June 1999 monitoring session. The trend
depicted in Figure 4 is similar to that in Figure 3 with the lowest groundwater levels during the
third year of operation occurring in the late summerlearly fall of 1999. The lowest groundwater
levels at monitors 94-6 and 94-1 1 were similar to the lowest groundwater levels recorded from
these monitors during the first and second years of operation. The groundwater levels recorded
at monitors 94-6,94- 1 1 and WESA- 16 in the late summerlearly fall of 1999 were approximately
0.7 to 0.8 metres lower than in the late summerlearly fall of 1996 (pre-operation groundwater
levels). It is considered that the groundwater levels in monitors 94-6, 94-1 1 and WESA-16
during the third year of operation continue to reflect influence from the pumping activities on
Well Site No. 7 on the order of about 0.5 to 0.8 metres of drawdown.
Figure 5 depicts groundwater level variations in various other geological formations in the
vicinity of the Morewood esker. Monitors 94-8A and 94-9A are located in a confined (overlain
by clay) silty sand deposit to the west of the core of the esker, while 94-8B and 94-9B are in the
overlying silty clay layer in the same area. Monitor 94-10 is located in a confined glacial till unit
to the east of the core of the Morewood esker. Monitor 94-12 is located northwest of Well Site
No. 7 in a sand and gravel portion of the Morewood esker that is overlain by a thin silty clay
layer. Similar trends to Figure 3 are again seen in Figure 5, with a significantly lower
piezometric surface in 94-9A, 94-9B and 94- 12 than in the other groundwater monitors included
in the groundwater level monitoring program. Riser pipe extensions were added to groundwater
monitors 94-8A and 94-8B in June of 1999. Prior to this these monitors have been frequently
artesian (level above the top of the monitoring well riser pipe). Therefore comparison of
groundwater levels in monitors 94-8A and 94-8B during wetter times of the year has not been
possible. The lowest groundwater levels recorded during the third year of operation at Monitor
94-10 were similar to the lowest groundwater levels recorded in this monitor during the first two
years of operation, but were approximately 0.5 metres lower than in the late summerlearly fall of
1996 (pre-operation). The lowest groundwater levels recorded during the third year of operation
at monitors 94-8A, 94-8B and 94-12 were also similar to the low levels recorded at these
monitors during the first two years of operation. The groundwater levels observed at monitor
94-12 continue to reflect about 0.3 to 0.6 mehes of drawdown in comparison to 1996, pre-
operational groundwater levels at this monitor. The groundwater levels in the monitors included
Golder Associates
May 2000 -7- 991-2857
in Figure 5 may represent a minor degree of influence from the pumping activities on the Village
of Winchester Well Site No. 7.
Figure 6 represents the groundwater levels in the 96-Series groundwater monitors. Monitors
96-20, 96-21 and 96-22 are located in the Morewood esker to the north of Well Site No. 7, in
unconfined fine sand and sand and gravel. Monitor 96-19 is located within the esker to the south
of the well site, in confined fine sand. The trends in Figure 6 are similar to the trends in Figure 3
with groundwater levels highest in the spring months and lowest in the late summerfearly fall to
late falltearly winter (1998199). The lowest groundwater levels recorded in the 96-Series
groundwater monitors during the third year of operation were similar or slightly higher than the
lowest groundwater levels recorded at these monitors during the second year of operation with
the exception of monitor 96-19. The lowest water level recorded at 96-19 during the third year
of operation (in September 1999) was about 0.2 metres lower than the lowest water level
recorded at 96-19 during the second year of operation (in January 1999).
Deviations in groundwater levels in the 96-series groundwater monitors between the late
summerlearly fall of 1996 (pre-operation) and the late summerlearly fall of 1999 range from
about 1.1 metres lower in 1999 at monitor 96-20 (closest to the well site) to about 0.7 metres
lower in 1999 at monitor 96-22 (furthest from the well site). The groundwater levels during the
third year of operation at the 96-Series monitors appear to suggest some influence from the
pumping activities at Well No. 7. The degree of influence from pumping on the 96-Series
groundwater monitors appears to be inversely proportional to the distance from the well site, as
would be expected.
3.2 Flow Directions
Based on the groundwater elevation data available prior to the start of operation of Village of
Winchester Well Site No. 7 on March 21, 1997, the general direction of natural (pre-operation)
groundwater flow within the Morewood esker is to the north, following the long axis of the
esker, as illustrated in Figure 2. As would be expected in permeable coarse grained deposits, the
horizontal hydraulic gradient is quite low and was previously reported to be around (Golder
Associates, 1996).
Golder Associates
May 2000 -8- 991-2857
A component of groundwater flow in a southerly direction was previously reported (Golder
Associates, 1996) in the south portion of the esker, forming a groundwater divide approximately
500 metres north of County Road 3 (see Figure 2). It has been considered that this condition is
likely a result of the topographic high spot that is present in this area (Golder Associates, 1996).
Based on the limited groundwater level data available from monitor WESA-16, the presence of
this groundwater divide does not appear to be altered by the pumping activities at Well Site
No. 7.
In Golder Associates (1998) a decrease in the magnitude of the hydraulic gradient since the start
of operation was described in the Morewood esker to the immediate north of the well site. This
trend continued during the third year of operation, as evidenced by groundwater elevations
recorded in monitors 96-20, 96-21 and 96-22. Periodic southerly components of groundwater
flow in this area is interpreted based on groundwater elevation measurements recorded since the
start of operation. To the north of monitor 96-22, groundwater flow appears to be toward the
north, similar to pre-operation conditions.
Based on the groundwater level data obtained during the third year of operation, the interpreted
general direction of groundwater flow remains consistent with pre-operational flow directions,
with periodic slight variations in the immediate vicinity and to the north of the pumping wells.
The interpreted direction of groundwater flow, based on groundwater elevation measurements
obtained on October 15, 1999, is shown on Figure 2.
3 3 Groundwater Quality
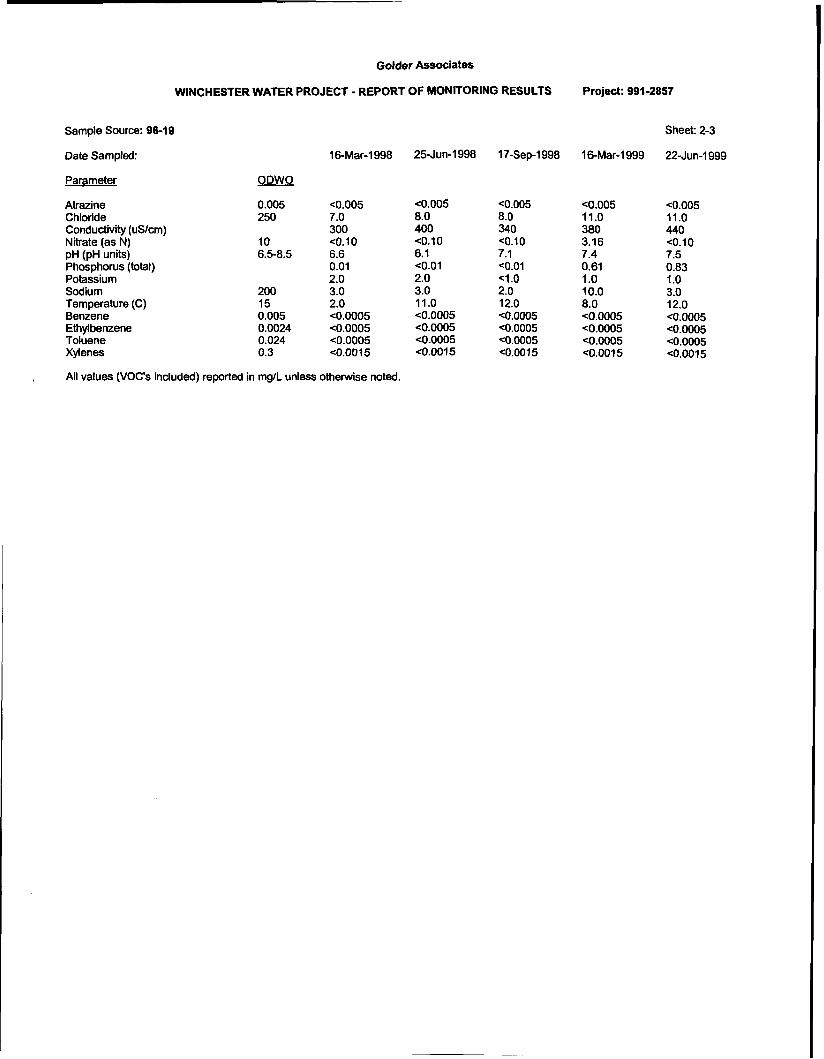
The results of all field and laboratory chemical and physical analyses conducted during the
groundwater monitoring program for the third year of operation, along with the relevant Ontario
Drinking Water Objectives (ODWO) (Ministry of Environment and Energy, 1994) are provided
in Appendix A. Historical results are also provided in Appendix A for the groundwater monitors
included in the groundwater monitoring program for the third year of operation. The Report of
Analyses sheets from Accutest Laboratories Ltd. for all analyses conducted as part of the
groundwater monitoring program for the third year of operation are included in Appendix B.
Golder Associates
May 2000 -9- 991-2857
Discussion relating to compliance with the ODWO relates specifically to non-health related
objectives (i.e. aesthetic parameters) and health related parameters for which a Maximum
Acceptable Concentration (MAC) or Interim Maximum Acceptable Concentration (IMAC) have
been established. The following provides a summary of the apparent trends in groundwater
quality over time with particular attention to any discrepancies or changes in groundwater quality
between the pre-operational monitoring program and the monitoring program for the third year
of operation:
groundwater quality in all of the groundwater monitors included in the monitoring program
for the third year of operation was generally consistent over time and met the ODWO for all
parameters monitored
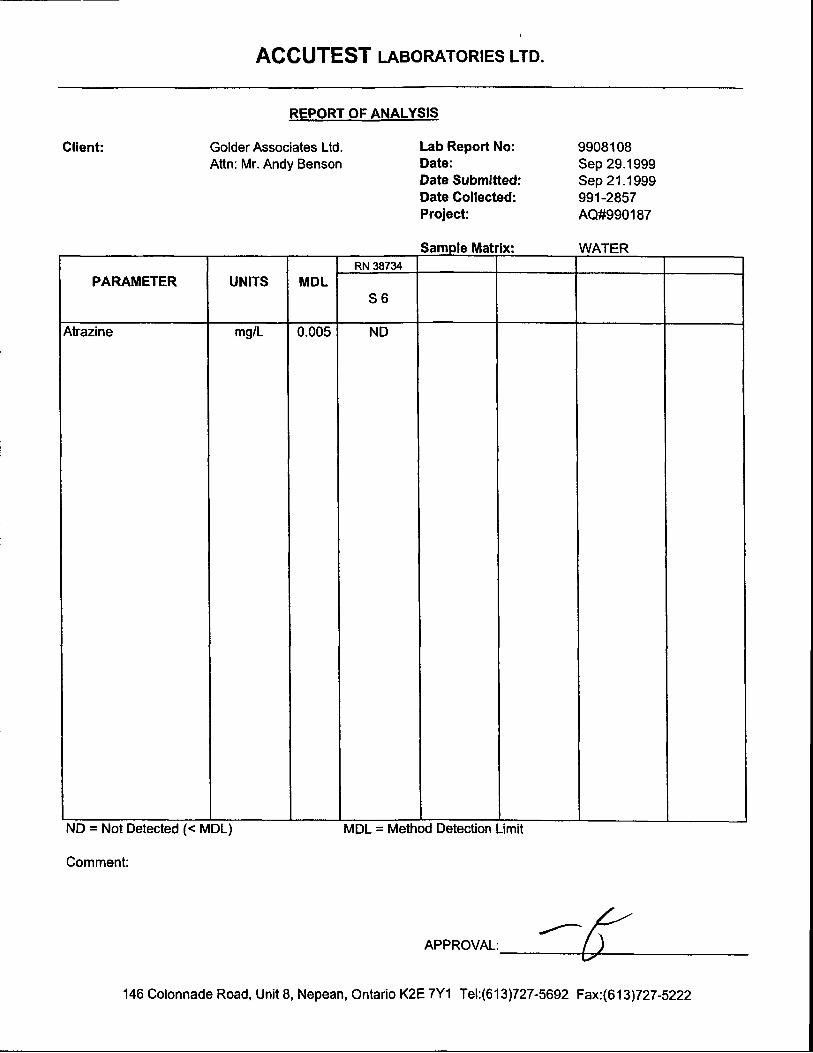
atrazine and BTEX (Benzene, Toluene, Ethylbenzene, Xylenes) were never detected at any
of the monitoring locations included in the monitoring program for the third year of
operation
total phosphorus levels have been variable over time at all of the groundwater monitors
included in the sampling program
nitrate was not detected in any of the groundwater samples collected from monitors 94-5 or
96-1 9 during the third year of operation; the nitrate detections reported in Golder Associates
(1999) in the groundwater samples from 94-5 and 96-19 collected during the March 1999
monitoring session appear to be isolated, and are the only occurrence of nitrate reported to
date at these monitors
nitrate has been consistently present in groundwater samples from monitor 94-1 1 (at levels
between 0.1 1 mg/L and 0.44 m a ) since the September 1997 monitoring session with the
exception of the June 1999 sample from 94-1 1 for which nitrate was not reported above the
method detection limit of 0.10 mg/L
Golder Associates
May 2000 -10- 991-2857
nitrate has been consistently present (at slightly variable levels < 3.1 1 mgL) at monitors
96-20 and 96-21 since the start of monitoring; nitrate was present at similar levels at monitor
96-22 between the start of monitoring and the March 1998 monitoring session, but was not
detected at this monitor in the monitoring sessions conducted during the second year of
operations; nitrate was reported in the groundwater samples collected from monitor 96-22
just at the method detection limit (0.10 mg/L) during the June and September 1999
monitoring sessions but was less than the method detection limit in March 2000
a gradual trend to increasing chloride levels has been observed at monitor 96-20 since May
1997. The 1999 concentration was at about 25 mg/L (compared to the ODWO of 250 mgL)
compared to about 13 mg& in early 1997.
In general, ongoing land uses and the pumping operations at the Village of Winchester Well Site
No. 7 do not appear to have adversely affected groundwater quality to date in the vicinity of the
well site.
Golder Associates
May 2000 -1 1- 991-2857
4.0 PROPOSED MONITORING PROGRAM FOR FOURTH YEAR OF OPERATION
A proposed monitoring program for the fourth year of operation is summarized in Table 4.
Three complete years of monitoring data have been collected since the start of operation in
March 1997, including monthly groundwater level measurements and sampling in the late
springlearly summer, late summerlearly fall and late winterlearly spring of each year. As
discussed in Section 3, very similar trends in groundwater levels have been observed during each
of the three years of operation and no evidence of adverse impacts on groundwater quality has
been observed since the start of operation.
On-going groundwater level monitoring is recommended, particularly during the drier months of
the year, in order to document any significant changes over time. A reduced frequency of water
level monitoring sessions is considered appropriate based on the observed trends and the large
quantity of data collected to date. As such, the recommended program for the fourth year of
operation (Table 4) has reduced the number of groundwater level monitoring sessions from
twelve to seven.
Similarly, on-going groundwater quality monitoring is recommended to document and provide
warning of any adverse changes over time, particularly during the wettest time of the year (late
winterlearly spring) and the driest time of the year (late summerlearly fall). It is considered
appropriate, however, to eliminate the late springlearly summer (June) groundwater quality
monitoring session.
Should any changes be made to the operation of Well Site No. 7, it is recommended that the
frequency of monitoring be adjusted appropriately in order to observe any effects caused as a
result of such changes.
Prior to the September 2000 groundwater quality monitoring session, it is recommended that a
groundwater monitor condition survey be conducted on all of the groundwater monitors included
in the groundwater monitoring program for the fourth year of operation. The purpose of this
condition survey would be to note any necessary repairs or supplies that are required for the
continued use of the groundwater monitors. As discussed in Section 2.2 the dedicated sampling
Golder Associates
May 2000 -12- 991-2857
device in monitor 96-21 was missing during the March 2000 sampling session. Damage to the
dedicated sampling device in monitor 94-5 was also noted in March 2000 and the cap to
groundwater monitor WESA-16 may be missing. Any required groundwater monitor
maintenance should be performed before the September 2000 groundwater quality monitoring
session.
May 2000 -13- 991-2857
5.0 LIMITATIONS AND USE OF REPORT
This report was prepared for the exclusive use of North Dundas Township. The report, which
specifically includes all tables, figures and appendices, is based on data and information
collected by Golder Associates and is based solely on the conditions of the property at the time
of the work, supplemented by historical information and data obtained by Golder Associates as
described in this report. Each of these reports must be read and understood collectively, and can
only be relied upon in their totality.
Golder Associates has relied in good faith on all information provided and does not accept
responsibility for any deficiency, misstatements, or inaccuracies contained in the reports as a
result of omissions, misinterpretation, or fraudulent acts of the persons contacted or errors or
omissions in the reviewed documentation.
The assessment of environmental conditions at this site has been made using the results of
physical measurements and chemical analyses of liquids from a number of locations. The site
conditions between sampling locations have been inferred based on conditions observed at the
borehole locations. Subsurface conditions may vary from these sampled locations.
The services performed, as described in this report, were conducted in a manner consistent with
that level of care and skill normally exercised by other members of the engineering and science
professions currently practising under similar conditions, subject to the time limits and financial
and physical constraints applicable to the services.
Golder Associates
Any use which a third party makes of this report, or any reliance on, or decisions to be made
based on it, are the responsibilities of such third parties. Golder Associates accepts no
responsibility for damages, if any, suffered by any third party as a result of decisions made or
actions based on this report.
May 2000 -14- 991-2857
The findings and conclusions of this report are valid only as of the date of this report. If new
information is discovered in future work, including excavations, borings, or other studies, Golder
Associates should be requested to re-evaluate the conclusions of this report, and to provide
amendments as required. The groundwater monitors installed during the course of this
investigation or previous investigations by Golder Associates have been left in place. These
groundwater monitors are the property of the North Dundas Township and not Golder
Associates.
GOLDER ASSOCIATES LTD. Environ ental Divis P
P.A.S. Benson, P.Eng.
Principal
Golder Associates
Mav 2000 - 15- 991-2857
REFERENCES
Golder Associates Ltd., 1999. Groundwater Monitoring Program For Second Year of Operation, Well Site No. 7, Village of Winchester Water Supply System Expansion Project: Golder Associates Report No. 98 1-2755, April 1999.
Golder Associates Ltd., 1998. Groundwater Monitoring Program For First Twelve Months of Operation, Well Site No. 7, Village of Winchester Water Supply System Expansion Project: Golder Associates Report No. 97 1-2805, April 1998.
Golder Associates Ltd., 1996. Pre-operational Groundwater Monitoring Program, Well Site No. 7, Village of Winchester Water Supply Expansion Project: Golder Associates Report No. 95 1-2878-3, November 1996.
Ministry of the Environment and Energy, 1994. Ontario Drinking Water Objectives, Revised 1994: Ontario Ministry of the Environment and Energy, 68 p.
Golder Associates
May 2000
TABLE l
SUMMARY OF GROUNDWATER MONITORING PROGRAM FOR ON-SITE AND OFF-SITE BOREHOLES
THIRD YEAR OF OPERATION
1.0 WATER LEVEL MONITORING COMPONENT
1.1 Monitoring Sessions
April 1999 May 1999 June 1999 July 1999 August 1999 September 1999
October 1999 November 1999 December 1999 January 2000 February 2000 March 2000
Groundwater Monitors 94-5 and 94-1 1 Monitors 96-19,%-20,96-21 and 96-22
2.3 Field Measured Physical Parameters
Temperature Conductivity PH
2.4 Laboratory Measured Chemical Parameters
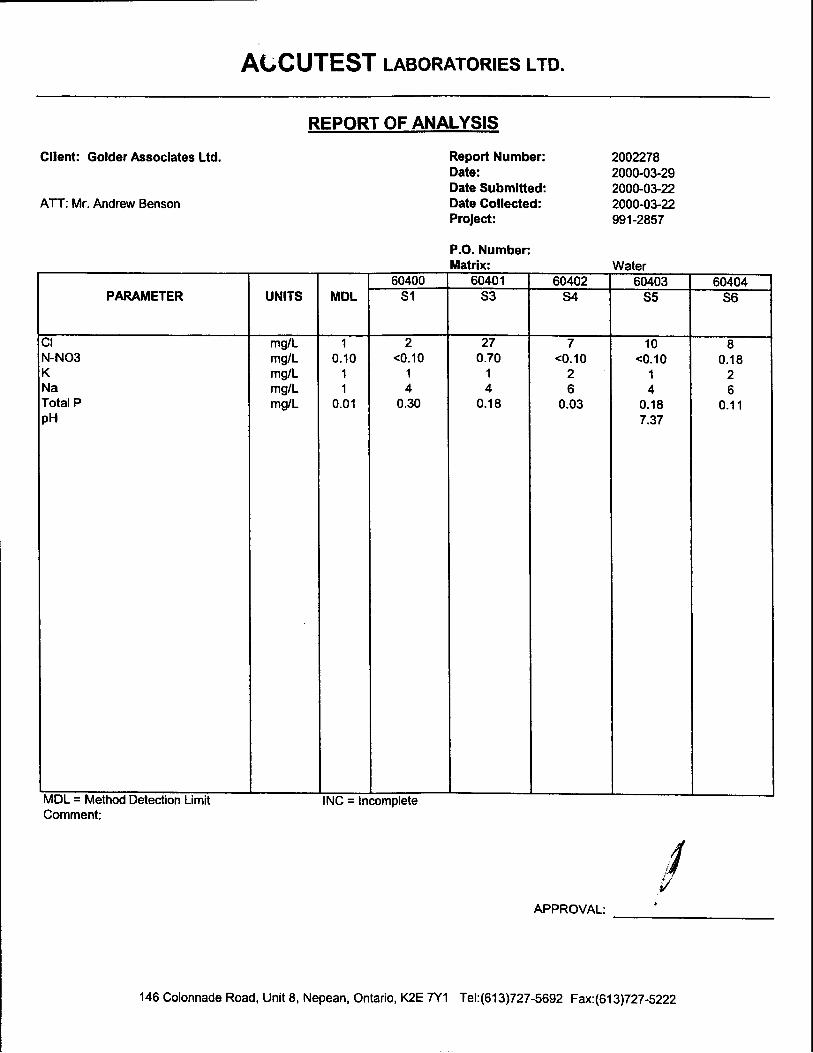
Chloride Nitrate Sodium Potassium Total Phosphorus
March 2000
Benzene Toluene Ethylbenzene Xylenes Atrazine
TBLS 1 &4.DOC
May 2000 TABLE 2
ELEVATION DATA
Note: "-" indicates top of casing is below ground surface. WAT-LV99.XLS
May 2000 TABLE 3
WATER LEVEL DATA
Notes: All elevations are relative to Geodetic datum BGS = "Below Ground Surface" NC = Monitor not yet been constructed nla = Monitor was either inaccessible at time of monitoring, or could not be located. nrn = not measured Negative depth values indicate that groundwater level was above ground surface
May 2000 TABLE 3 (Continued)
WATER LEVEL DATA
Notes: All elevations are relative to Geodetic datum BGS = "Below Ground Surface" NC = Monitor not yet been constructed n/a = Monitor was either inaccessible at time of monitoring, or could not be located. nrn = not measured Negative depth values indicate that groundwater level was above ground surface
May 2000 TABLE 3 (Continued)
WATER LEVEL DATA
Notes: All elevations are relative to Geodetic datum BGS = "Below Ground Surface" NC = Monitor not yet been constructed nla = Monitor was either inaccessible at time of monitoring, or could not be located. nrn = not measured Negative depth values indicate that groundwater level was above ground surface
May 2000
TABLE 4
PROPOSED GROUNDWATER MONITORING PROGRAM FOR ON-SITE AND OFF-SITE BOREHOLES
FIGURE 6 Groundwater Elevations in 96-Series Monitoring Wells
78
77.5 I I
- c % 74.5 . E aa z 74
73.5
73
72.5
72 - - - -. I
I 71.5 - - - . - 1
b m m m m @ a a Q b b b b m W O m Q ) Q ) Q ) Q ) O O o
P o Z a n $ t ~ t t t ~ z ? ? ? n N?ZZ o 0 4 '??ZZm
g g L s < p l ? ~ a z u B a Z L ~ Z S L ~ < ~ L ~ < Date
May 2000
APPENDIX A
REPORT OF MONITORING RESULTS
May 2000
LIST OF ABBREVIATIONS
The abbreviations commonly employed on the "Chemical and Physical Analyses Data Sheets", on the figures, in the tables and in the text of the report as related to the water quality monitoring programs are as follows:
ODWO Ontario Drinking Water Objective (Ministry of the Environment and Energy, 1994)
parameter not detected in concentration at or higher than the analytical laboratory's method detection limit (MDL). Specific MDL concentrations are indicated following "C' sign.
N nitrogen P phosphorus CaCO, calcium carbonate
C degrees Celsius microS/cm microsiemens per centirnetre NTU Nephelometric Turbidity Unit TCU True Colour Unit mL millilitre mgfl, milligrams per litre PPm parts per million
COND. DIS. OXYGEN TKN BOD COD DOC EC TOC TS TSS TDS TC FC FS BKGD
conductivity dissolved oxygen total kjeldahl nitrogen biochemical oxygen demand chemical oxygen demand dissolved organic carbon Escherichia coZi total organic carbon total solids total suspended solids total dissolved solids total coliform faecal coliform faecal streptococcus background
Golder Associates
Golder Associates
WINCHESTER WATER PROJECT - REPORT OF MONrrORlNG RESULTS Project: 991-2857
Sample Source: 94-5 Sheet: 1-4
Date Sampled: 18-Oct-1994 26-Oct-1994 03-Nov-I 994 15-May-1995 19-Sep-1995
Golder Associates Ltd. Report Number: 9905044 Att'n : Mr. Andy Benson Date: Jun 30,1999
Date Submitted: Jun 23,1999 Date Collected: Jun 22,1999 Project: 991 -2857
990187
Matrix: WATER
Petroleum Hvdrocarbon Analvsis
Purgeable Hydrocarbons analysed by Tekmar Purge and Trap with Varian Saturn II GCIMS Extractable Hydrocarbons (GasoIinelDiesel Range Organics) analysed by cold solvent extraction Varian Star 3400 GClFlD TPH Heavy Oils (oil & grease) analysed by gravirnetric solid phase extraction ( water ) or solvent extraction ( sol ) An soil results are reported on a "dry weighr basis, unless otheMlise noted.
Golder Associates Ltd. Report Number: 9905044 Awn : Mr. Andy Benson Date: Jun 30,1999
Date Submitted: Jun 23,1999 Date Collected: Jun 22,1999 Project: 991-2857
990 1 87
Matrix: WATER
Petroleum Hvdrocarbon Analvsis
Purgeable Hydrocarbons analysed by Tekmar Purge and Trap with Varian Saturn II GCMS Extractable Hydrocarbons (GasolinelDiesel Range Organics) analysed by cold solvent extraction Varian Star 3400 GClFlD TPH Heavy Oik (oil & grease) analysed by gravimetric solid phase extraction ( water ) or solvent extraction ( soil ) All soil results are reported on a "dry weight' basis, unless otherwise noted.
Golder Associates Ltd. Lab Report No: 99081 08 Attn: Mr. Andy Benson Date: Sep 29.1 999
Date Submitted: Sep 21.1999 Date Collected: 991 -2857 Project: AQ#990187
Comment:
APPROVAL: v 146 Colonnade Road, Unit 8, Nepean, Ontario K2E 7Y1 Tel:(613)727-5692 Fax:(613)727-5222
ACCUTEST LABORATORIES LID.
ient:
REPORT OF ANALYSIS
Golder Associates Ltd. Report Number: 99081 08 Attn: Mr. Andy Benson Date: Sep 29,1999
Date Submitted: Sep 21 ,I 999 Date Collected: Sep 21,1999 Project: 991 -2857
990 1 87
Matrix: water
Petroleum Hvdrocarbon Analvsis
rgeable Hydrocarbons analysed by Tekmar Purge and Trap with Varian Saturn II GClMS tractable Hydrocarbons (GasolinelDiesel Range Organics) analysed by cold solvent extraction Varian Star 3400 GClFlD
TPH Heavy Oils (oil & grease) analysed by gravimetric solid phase extraction ( water ) or solvent extraction ( soil )
I PARAMETER
I' URGEABLEHYDROCARBONS
snzene ~luene
IEthytbenzene Ip-Xylene Xylene
I
I~oluene d-8 ( surrogate )
1 XTRACTABLE HYDROCARBONS
lgasoline range organics (GRO) < C10 esel range organics (DRO) C10-C24
TOTAL PETROLEUM HYDROCARBONS I l -Ro+DRo
'H (heavy oils) 10il& Grease ( total )
il & Grease ( mineral ) il & Grease ( non-mineral )
( ent: Golder Associates Ltd. Report Number: 99081 08 Attn: Mr. Andy Benson Date: Sep 29,1999
Date Submitted: Sep 21 ,I 999 Date Collected: Sep 21,1999 Project: 991 -2857
990187
Matrix: water
Petroleum Hydrocarbon Analvsis
I geable Hydrocarbons analysed by Tekmar Purge and Trap with Varian Saturn II GCIMS I ractable Hydrocarbons (GasolineIDiesel Range Organics) analysed by cold Solvent extraction Varian Star 3400 GClFlD TPH Heavy Oils (oil & grease) analysed by gravimetric solid phase extraction ( water ) or solvent extraction ( soil )
Client: Golder Associates Ltd. Report Number: Attn: Mr. Andrew Benson Date:
Date Submitted: Date Collected: Project:
Matrix:
2002278 Mar 29,2000 Mar 22,2000 Mar 22,2000 991 -2857
water
~rgeable Hydrocarbons analysed by Tekmar Purge and Trap with Varian Saturn II GClMS :tractable Hydrocarbons (GasolineIDiesel Range Organics) analysed by cold solvent extraction Varian Star 3400 GClFlD
.'H Heavy Oils (oil & grease) analysed by gravimetric solid phase extraction ( water ) or solvent extraction ( soil )
I PARAMETER
RGEABLE HYDROCARBONS
fnzene hene hylbenzene
1 r n ~ ~ - ~ ~ l e n e Xylene
I I oluene d-8 ( surrogate ) I % Rec. I 1
(TRACTABLE HYDROCARBONS I I lgasoline range organics (GRO) < C10 ' ssel range organics (DRO) C10-C24
ITAL PETROLEUM HYDROCARBONS (GRO + DRO
'H (Heavy Oils) "11 & Grease ( total ) mdL I l0i l& Grease ( mineral ) mg/L 1
Client: Golder Associates Ltd. Report Number: 2002278 Attn: Mr. Andrew Benson Date: Mar 29,2000
Date Submitted: Mar 22,2000 Date Collected: Mar 22,2000 Project: 991 -2857
Matrlx: water
'urgeable Hydrocarbons analysed by Tekmar Purge and Trap with Varian Saturn II GClMS ixtractable Hydrocarbons (GasolinelDiesel Range Organics) analysed by cold solvent extraction Varian Star 3400 GCIFID .'pH Heavy Oils (oil & grease) analysed by gravimetric solid phase extraction ( water ) or solvent extraction ( soil )
&CUTEST LABORATORIES LTO.
Client: Golder Associates Ltd. Report Number: 2002278 Attn: Mr. Andrew Benson Date: Mar 29,2000
Date Submitted: Mar 22,2000 Date Collected: Mar 22,2000 Project: 991 -2857