Goldletter International 1 March 2017 Goldletter I N T E R N A T I O N A L the international independent information and advice bulletin for gold and related investments March 2017 Gold Market Outlook Marino G. Pieterse, publisher and editor ► Gold price on its course to new resistance level of $ 1,300 in Q2 2017 Having continued its recovery in February to a high of $ 1,257.20 on 27 February 2017, in the wake of an anticipated interest rate increase for the second time in three months, the gold price dropped to a low of $ 1,198.80 on 15 March 2017, when the Federal Funds rate was raised with another 0.25% to a range of 0.75% to 1.00%. Despite of expecting two further interest increases this year to a level of 1.25% to 1.50% as a result of projected higher economic growth of 2.1% in 2017, compared with 1.9% in 2016, the gold price recov- ered again to a level above $ 1,240 on 21 March. In this respect, it should be noted that against the growth of the economy, inflation is expected to rise from 1.5% in 2016 to 1.9% in 2017 and 2.0% in 2018. This means that real economic growth will decrease from 0.4% in 2016 to 0.2% in 2017 and 0.1% in 2018. Considering inflation in the U.S. economy increasing and President Donald Trump having promised to stimu- late economic growth to 4%, this may lead to an overheated economy, which creates an environment for gold prices to flourish. In addition, growing geopolitical international tensions, particularly within the European Union, which are un- dermining the bureaucratic structure of the European Union, is to be considered as a catalyst for highergold prices. My conclusion is that the gold price will test a new resistance level of $ 1,300 in Q 2 2017, which will clear the way to my price target of $ 1400 – 1,500 by the end of this year. With the gold price having recovered by 7% from $ 1,159 at year-end 2016 to currently $ 1,242, the HUI-Index of leading old producers, increased by 11% from 182.31 to 202.03 as at 21 March 2017, which shows a relatively low leverage compared to the bullion price. Focused on major gold producers and advanced development companies, the average market performance of my 2017 Shortlist of gold investment recommendations was in line with the increase of the HUI-Index to date. Considering profit margins of gold producers expected to stabilize at at least $ 300, this would have a positive impact on the gold equity markets. From this perspective, I intend to add a number of junior gold companies to my shortlist, which based on the quality and prospects of their assets, offer an above average investment leverage potential.
Transcript
Goldletter International 1 March 2017
Goldletter II NN TT EE RR NN AA TT II OO NN AA LL the in terna tional independent in formation and advice bul let in for gold and re lated inves tments
March 2017
Gold Market Outlook Marino G. Pieterse, publisher and editor
► Gold price on its course to new resistance level of $ 1,300 in Q2 2017 Having continued its recovery in February to a high of $ 1,257.20 on 27 February 2017, in the wake of an anticipated interest rate increase for the second time in three months, the gold price dropped to a low of $ 1,198.80 on 15 March 2017, when the Federal Funds rate was raised with another 0.25% to a range of 0.75% to 1.00%. Despite of expecting two further interest increases this year to a level of 1.25% to 1.50% as a result of projected higher economic growth of 2.1% in 2017, compared with 1.9% in 2016, the gold price recov-ered again to a level above $ 1,240 on 21 March. In this respect, it should be noted that against the growth of the economy, inflation is expected to rise from 1.5% in 2016 to 1.9% in 2017 and 2.0% in 2018. This means that real economic growth will decrease from 0.4% in 2016 to 0.2% in 2017 and 0.1% in 2018. Considering inflation in the U.S. economy increasing and President Donald Trump having promised to stimu-late economic growth to 4%, this may lead to an overheated economy, which creates an environment for gold prices to flourish. In addition, growing geopolitical international tensions, particularly within the European Union, which are un-dermining the bureaucratic structure of the European Union, is to be considered as a catalyst for highergold prices.
My conclusion is that the gold price will test a new resistance level of $ 1,300 in Q 2 2017, which will clear the way to my price target of $ 1400 – 1,500 by the end of this year.
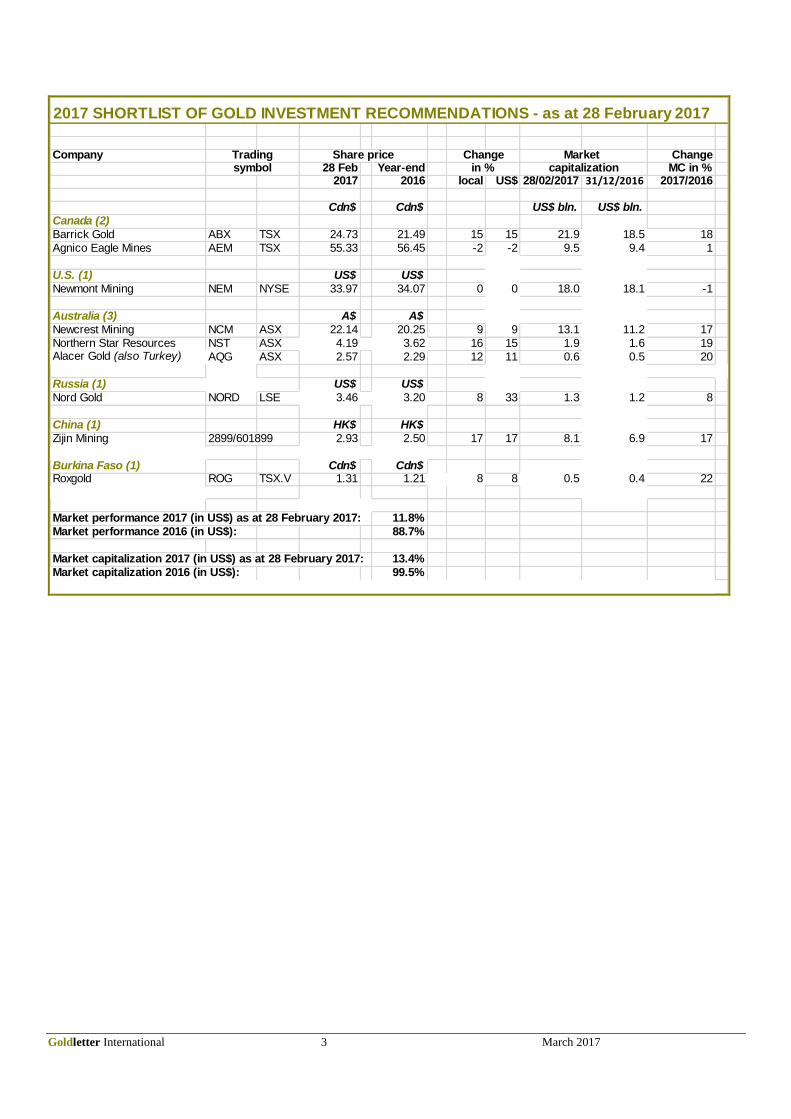
With the gold price having recovered by 7% from $ 1,159 at year-end 2016 to currently $ 1,242, the HUI-Index of leading old producers, increased by 11% from 182.31 to 202.03 as at 21 March 2017, which shows a relatively low leverage compared to the bullion price. Focused on major gold producers and advanced development companies, the average market performance of my 2017 Shortlist of gold investment recommendations was in line with the increase of the HUI-Index to date. Considering profit margins of gold producers expected to stabilize at at least $ 300, this would have a positive impact on the gold equity markets. From this perspective, I intend to add a number of junior gold companies to my shortlist, which based on the quality and prospects of their assets, offer an above average investment leverage potential.
Goldletter International 2 March 2017
Gold price Change HUI-Index Change
in % in %
2017
March 21 2017 1,242 -1 202.03 3
February 28 2017 1,256 4 196.09 -5
January 31 2017 1,213 5 207.45 14
2016
December 31 2016 1,159 0 182.31 2
December 13 2016 1,157 -2 178.46 0
November 30 2016 1,178 -7 178.08 -16
October 31 2016 1,272 1 212.28 7
October 7 2016 1,259 -5 199.26 -14
September 30 2016 1,323 1 231.14 4
August 31 2016 1,309 -2 221.68 -19
July 29 2016 1,342 -2 274.32 1
July 6 (high) 2016 1,370 4 271.75 10
June 30 2016 1,321 9 246.60 22
May 31 2016 1,212 -6 201.32 -14
April 28 2016 1,286 4 233.46 31
March 31 2016 1,237 0 178.24 6
February 29 2016 1,235 11 167.49 39
January 31 2016 1,113 5 120.80 9
Year-end 2016 1,159 9 182.31 64
2015 1,062 -11 111.18 -32
2014 1,199 0 164.03 -17
2013 1,202 -28 197.70 -55
2012 1,664 6 444.20 -11
2011 1,572 11 498.73 -13
2010 1,410 28 573.32 33
2009 1,104 28 429.91 42
2008 865 302.41
Overview gold prices versus HUI-Index
Goldletter International 3 March 2017
Company Change28 Feb Year-end MC in %
2017 2016 local US$ 28/02/2017 31/12/2016 2017/2016
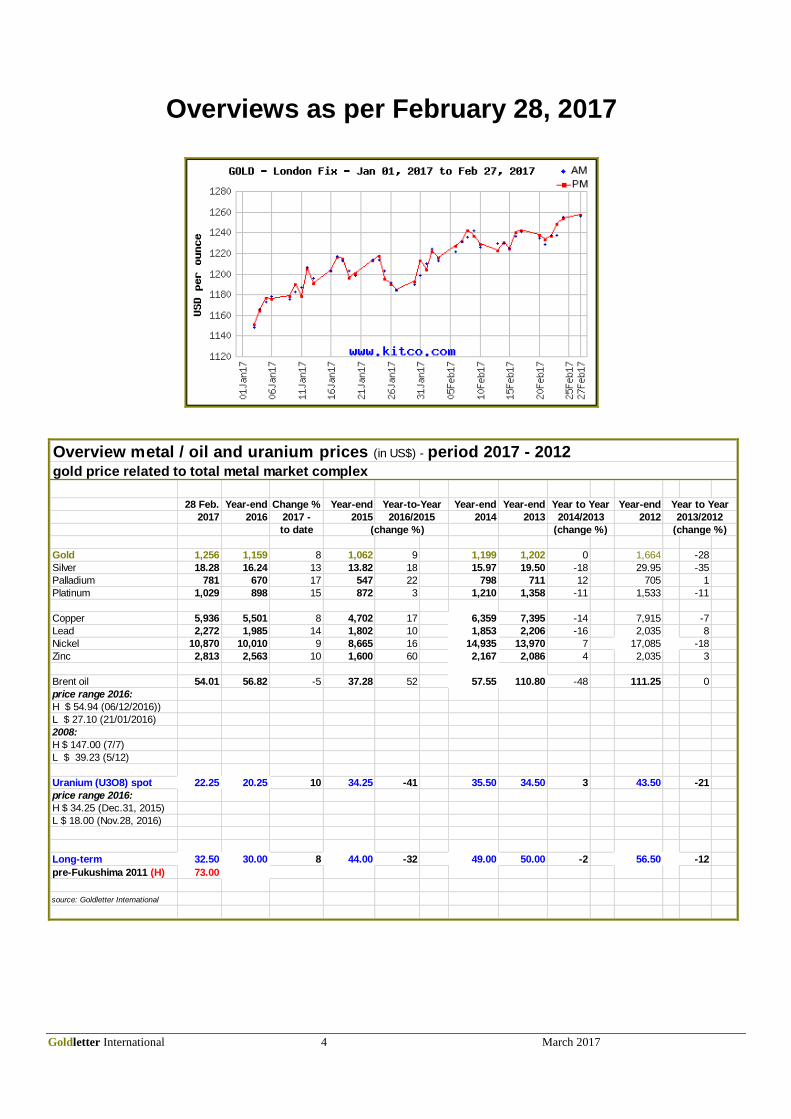
Overview metal / oil and uranium prices (in US$) - period 2017 - 2012gold price related to total metal market complex
(change %)
Year to Year
2013/2012
(change %)
Year to Year
2014/2013
Year-to-Year
2016/2015
Goldletter International 5 March 2017
Gold ($) €/$ Brent Oil Gold/Oil$/barrel ratio
Year-end 2001 276.50 0.88 19.80 14.0
Year-end 2002 342.75 1.05 28.13 12.2
Year-end 2003 417.25 1.26 30.17 13.8
Year-end 2004 438.00 1.36 40.25 10.9
Year-end 2005 513.00 1.18 58.87 8.7
May 12, 2006 1) 725.75 1.29 68.05 10.7
October 6, 2006 2) 560.75 1.27 58.86 9.5
► Year-end 2006 635.70 1.32 60.14 10.6
June 30, 2007 650.50 1.35 72.82 8.9
September 18, 2007 3) 714.75 1.39 77.58 9.2
► Year-end 2007 836.50 1.47 93.89 8.9
March 17, 2008 (High) 1,030.80 1.58 102.82 10.0
April 30, 2008 4) 853.00 1.55 109.78 7.8
June 30, 2008 930.25 1.58 139.30 6.7
July 9, 2008 5) 927.50 1.57 141.70 6.5
July 16, 2008 977.50 1.58 134.54 7.3
September 15, 2008 775.00 1.43 90.38 8.6
October 8, 2008 6) 903.50 1.37 83.18 10.9
October 24, 2008 (Low) 692.50 1.26 60.41 11.5
November 24, 2008 822.50 1.28 52.19 15.8
December 5, 2008 7) 749.00 1.27 39.23 19.1
December 16, 2008 8) 838.25 1.37 44.11 19.0
► Year-end 2008 865.00 1.40 41.76 20.7
January 15, 2009 9) 810.00 1.31 44.50 18.2
March 5, 2009 10) 913.00 1.26 44.16 20.7
April 2, 2009 11) 897.75 1.34 53.14 16.9
May 13, 2009 12) 924.00 1.36 57.26 16.1
June 30, 2009 934.50 1.41 68.21 13.7
September 30, 2009 995.75 1.46 67.72 14.7
December 3, 2009 (High) 1,226.10 1.51 77.56 15.7
► Year-end 2009 1,104.00 1.43 77.20 14.3
May 10, 2010 13) 1,196.50 1.28 80.04 15.0
June 28, 2010 1,261.00 1.23 77.64 16.2
September 30, 2010 1,307.00 1.36 81.01 16.1
► Year-end 2010 1,410.25 1.33 92.59 15.2
April 13, 2011 14) 1,457.50 1.44 122.63 11.9
June 30, 2011 1,505.50 1.45 111.98 13.4
July 13, 2011 15) 1,579.00 1.43 118.57 13.3
September 6, 2011 (High) 1,920.00 1.44 108.70 17.7
September 30, 2011 1,619.77 1.35 102.42 15.8
November 9, 2011 16) 1,784.00 1.36 113.21 15.8
December 14, 2011 17) 1,603.00 1.30 104.10 15.4
► Year-end 2011 1,571.50 1.29 108.58 14.5
July 5, 2012 18) 1,604.00 1.24 100.70 15.9
July 26, 2012 19) 1,618.00 1.23 106.38 15.2
► Year-end 2012 1,664.00 1.32 111.25 15.0
May 8, 2013 20) 1,469.00 1.32 102.37 14.3
June 30, 2013 (Low) 1,192.00 1.30 102.16 11.7
November 11, 2013 21) 1,282.50 1.36 106.40 12.1
► Year-end 2013 1,201.25 1.38 110.80 10.8
June 12, 2014 22) 1,265.75 1.35 106.53 11.9
September 11, 2014 23) 1,241.25 1.29 92.83 13.4
► Year-end 2014 1,199.25 1.21 57.55 20.8
January 22, 2015 24) 1,295.75 1.15 49.69 26.1
December 16, 2015 25) 1,075.25 1.09 38.64 27.8
► Year-end 2015 1,062.25 1.09 37.28 28.5
July 6, 2016 (High) 1,370.00 1.10 48.80 28.1
September 30, 2016 1,322.50 1.12 49.06 27.0
November 8, 2016 26) 1,282.35 1.10 46.04 27.9
December 15, 2016 27) 1,126.95 1.04 54.02 20.9
► Year-end 2016 1,159.10 1.05 56.82 20.4
February 28, 2017 1,255.60 1.06 54.01 23.2
Gold runs its own course against
dollar and oil price
Goldletter International 6 March 2017
1) 2006 high of gold price
2) 2006 second half low of gold price after correction oil price
3) Fed funds rate lowered for the first time (0.50% to 4.75%)
4) Fed funds rate lowered (0.25% to 4.50%)
5) Fed rate lowered (0.25% to 4.25%)
6) Fed funds and ECB rates lowered 0.50% to 3.75% and 1.50%, respectively
7) 2008 low of oil price
8) Fed funds rate lowered (0.75-1.00% to 0.00-0.25%) for the last time in 10 stages from
5.25% to 0.00-0.025 %in the period of June 29, 2007 - December 18, 2008
9) ECB rate lowered 0.50% to 2.00%
10) ECB rate lowered 0.50% to 1.50%
11) ECB rate lowered 0.25% to 1.25%
12) ECB rate lowered 0.25% to 1.00%
13) Euro salvation package announced
14) ECB rate increased 0.25% to 1.25%
15) ECB rate increased 0.25% to 1.50%
16) ECB rate lowered 0.25% to 1.25%
17) ECB rate lowered 0.25% to 1.00%
18) ECB rate lowered 0.25% to 0.75%
19) ECB: whatever it takes to save Euro
20) ECB rate lowered 0.25% to 0.50%
21) ECB rate lowered 0.25% to 0.25%
22) ECB rate lowered 0.10% to 0.15%
23) ECB rate lowered 0.10% to 0.05%
24) ECB announces quantative easing program
25) Fed funds rate increased by 0.25% to 0.25%-0.50% range
26) Donald Trump elected as next US President
27) Fed funds rate increased by 0.25% to 0.50%-0.75% range
Goldletter International 7 March 2017
Change Period of
in % changeDecember 1, 2003 400.00
December 2, 2005 500.00 +25 (2 years)
April 14, 2006 600.00 +20 ( 3½ months)
May 10, 2006 700.00 +17 (- 1 month)
May 12, 2006 725.25 +20 (- 1 month)
October 6, 2006 560.75 -23 (5 months)
►Year-end 2006 635.75 +14 (3 months)
April 20, 2007 691.40 +9 (4 months)
June 27, 2007 642.10 -7 (2 months)
September 18, 2007 714.75 +12 (2½ months)
►Year-end 2007 836.50 +17 (3½ months)
March 17, 2008 (H) 1,030.80 +24 (2½ months)
May 1, 2008 853.00 -16 (1½ months)
July 16, 2008 977.50 +15 (2½ months)
September 11, 2008 740.75 -24 (2 months)
October 10, 2008 918.00 +24 (1 month)
October 24, 2008 (L) 692.50 -25 (2 weeks)
►Year-end 2008 865.00 25 (2 months)
February 20, 2009 989.00 14 (-2 months)
(Interim high New York $ 1,006.30)
April 20, 2009 870.00 -12 (2 months)
June 1, 2009 987.00 +13 (-1½ month)
July 13, 2009 908.50 -8 (+1½ month)
September 17, 2009 1,020.50 12 (2 months)
December 3, 2009 (H) 1,226.10 20 (2½ months)
►Year-end 2009 1,104.00 -10 (1 month)
January 29, 2010 1,078.50 -3 (1 month)
December 7, 2010 (H) 1,426.00 +32 (11 months)
►Year-end 2010 1,410.25 +28 (12 months)
January 31, 2011 1,327.00 -6 (1 month)
May 3, 2011 (H) 1,546.50 17 (3 months)
June 30, 2011 1,505.50 -3 (2 months)
September 6, 2011 (H) 1,920.00 +28 (2 months)
September 30, 2011 1,619.77 -15 (1 month)
►Year-end 2011 1,571.50 -18 (4 months)
February 29, 2012 (H) 1,788.00 +16 (2 months)
July 12, 2012 (L) 1,556.25 -13 (4½ months)
July 26, 2012 1,618.00 -9 (5 months)
►Year-end 2012 1,664.00 +6 (12 months)
April 15, 2013 1,352.60 -19 (3½ months)
May 3, 2013 1,469.25 +9 (1 month)
June 30, 2013 (L) 1,192.00 -19 (1½ months)
►Year-end 2013 1,201.50 +1 (6 months)
March 14, 2014 (H) 1,385.00 +15 (2½ months)
►Year-end 2014 1,199.25 -13 (12 months)
January 21, 2015 (H) 1,298.00 +8 (1 month)
December 3, 2015 (L) 1,050.60 -13 (11 months)
►Year-end 2015 1,062.25 -12 (12 months)
June 30, 2016 1,320.75 +24 (6 months)
July 6, 2016 (H) 1,370.00 +14 (1 week)
November 8, 2016 1,282.35 -6 (4 months)
December 20, 2016 (L) 1,125.70 -12 (1½ months)
►Year-end 2016 1,159.10 +3 (1½ week)
February 28, 2017 1,255.60 +8 (2 months)
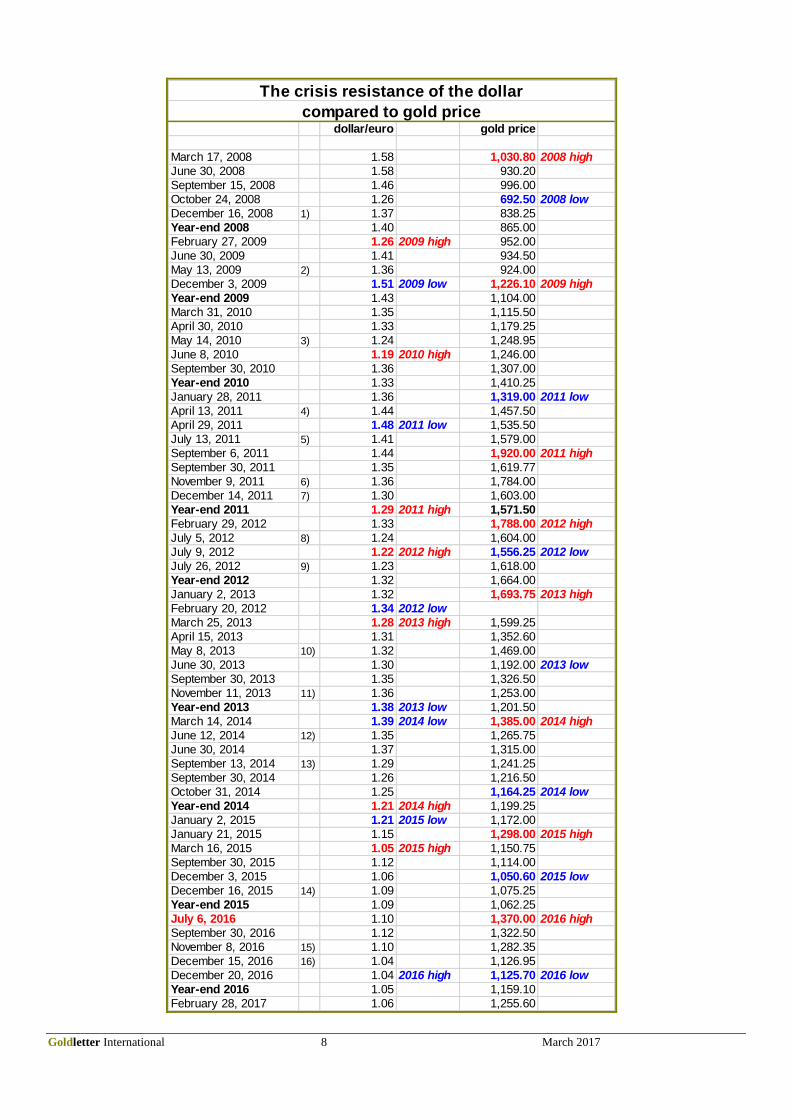
Measuring the gold market as a safe havenLondon trading
in US$
Goldletter International 8 March 2017
dollar/euro gold price
March 17, 2008 1.58 1,030.80 2008 high
June 30, 2008 1.58 930.20
September 15, 2008 1.46 996.00
October 24, 2008 1.26 692.50 2008 low
December 16, 2008 1) 1.37 838.25
Year-end 2008 1.40 865.00
February 27, 2009 1.26 2009 high 952.00
June 30, 2009 1.41 934.50
May 13, 2009 2) 1.36 924.00
December 3, 2009 1.51 2009 low 1,226.10 2009 high
Year-end 2009 1.43 1,104.00
March 31, 2010 1.35 1,115.50
April 30, 2010 1.33 1,179.25
May 14, 2010 3) 1.24 1,248.95
June 8, 2010 1.19 2010 high 1,246.00
September 30, 2010 1.36 1,307.00
Year-end 2010 1.33 1,410.25
January 28, 2011 1.36 1,319.00 2011 low
April 13, 2011 4) 1.44 1,457.50
April 29, 2011 1.48 2011 low 1,535.50
July 13, 2011 5) 1.41 1,579.00
September 6, 2011 1.44 1,920.00 2011 high
September 30, 2011 1.35 1,619.77
November 9, 2011 6) 1.36 1,784.00
December 14, 2011 7) 1.30 1,603.00
Year-end 2011 1.29 2011 high 1,571.50
February 29, 2012 1.33 1,788.00 2012 high
July 5, 2012 8) 1.24 1,604.00
July 9, 2012 1.22 2012 high 1,556.25 2012 low
July 26, 2012 9) 1.23 1,618.00
Year-end 2012 1.32 1,664.00
January 2, 2013 1.32 1,693.75 2013 high
February 20, 2012 1.34 2012 low
March 25, 2013 1.28 2013 high 1,599.25
April 15, 2013 1.31 1,352.60
May 8, 2013 10) 1.32 1,469.00
June 30, 2013 1.30 1,192.00 2013 low
September 30, 2013 1.35 1,326.50
November 11, 2013 11) 1.36 1,253.00
Year-end 2013 1.38 2013 low 1,201.50
March 14, 2014 1.39 2014 low 1,385.00 2014 high
June 12, 2014 12) 1.35 1,265.75
June 30, 2014 1.37 1,315.00
September 13, 2014 13) 1.29 1,241.25
September 30, 2014 1.26 1,216.50
October 31, 2014 1.25 1,164.25 2014 low
Year-end 2014 1.21 2014 high 1,199.25
January 2, 2015 1.21 2015 low 1,172.00
January 21, 2015 1.15 1,298.00 2015 high
March 16, 2015 1.05 2015 high 1,150.75
September 30, 2015 1.12 1,114.00
December 3, 2015 1.06 1,050.60 2015 low
December 16, 2015 14) 1.09 1,075.25
Year-end 2015 1.09 1,062.25
July 6, 2016 1.10 1,370.00 2016 high
September 30, 2016 1.12 1,322.50
November 8, 2016 15) 1.10 1,282.35
December 15, 2016 16) 1.04 1,126.95
December 20, 2016 1.04 2016 high 1,125.70 2016 low
Year-end 2016 1.05 1,159.10
February 28, 2017 1.06 1,255.60
The crisis resistance of the dollar
compared to gold price
Goldletter International 9 March 2017
9) ECB: whatever it takes to save Euro
10) ECB rate lowered 0.25% to 0.50%
11) ECB rate lowered 0.25% to 0.25%
12) ECB rate lowered 0.10% to 0.15%
13) ECB rate lowered 0.10% to 0.05%
14) Fed funds rate increased 0.25% to 0.25%-0.50% range
15) Donald Trump elected as next US President
16) Fed funds rate increased 0.25% to 0.50%-0.75% range
7) ECB rate lowered 0.25% to 1.00%
8) ECB rate lowered 0.25% to 0.75%
2) ECB rate lowered 0.25% to 1.00%
3) Euro salvation package of € 750 billion ($ 955 billion) announced
4) ECB rate increased 0.25% to 1.25%
1) Fed funds rate lowered 0.75%-1.00% to 0.00-0.25% (ECB 2.50%)
5) ECB rate increased 0.25% to 1.50%
6) ECB rate lowered 0.25% to 1.25%
US DOLLAR INDEX
The currency basket of the US dollar Index is divided in 57.6% in Euros, 13.6% in Japanese yen, 11.9% in British pounds, 9.1% in Canadian dollars, 4.2% in Swedish crones and 3.6% in Swiss francs. Since the index went up in 1995 from a long term resistance level of 80 to a high of 120 in 2001. At the time the Euro was introduced (January 1, 2001), it dropped to a low of 72 in March 2008, but was then followed by a strong upward correction to $ 87 well above the historic resistance level. After a new downward correction to 74 in early December 2009, from the second half of 2011 into 2012 there was another strong recovery to above the 80 level and reaching a high of 84 in August 2012. Since then, the index has moved in a relatively stable range before moving up strongly in the course the second half of 2014. In the wake of the European Central Bank’s decision to launch an aggressive quantitative easing plan to buy € 60 billion in bonds from March 2015 until March 2016 every month, the purchase volume was increased to $ 80 billion a month as of April 2016 until the end of March 2017. In the last week of January 2015 the index reached a high above 100 for the first time since 2003. Currently 98.4.
Goldletter International 10 March 2017
1 US$ = Euro Yen RMB Rupee C$ A$ SA Rand
(00) (00)
Year-end 2007 0.68 112 7.31 39.43 0.98 1.14 6.85
June 30, 2008 0.63 106 6.87 42.85 1.01 1.04 7.96
September 30, 2008 0.69 106 6.86 47.35 1.04 1.22 8.20
Year-end 2008 0.71 90 6.85 49.72 1.22 1.45 9.46
March 31, 2009 0.76 97 6.85 52.17 1.25 1.46 9.72
June 30, 2009 0.71 96 6.84 48.64 1.16 1.24 7.88
September 30, 2009 0.68 90 6.84 48.34 1.09 1.15 7.43
Year-end 2009 0.69 92 6.82 46.75 1.05 1.10 7.40
March 31, 2010 0.74 93 6.82 45.00 1.02 1.09 7.37
June 30,2010 0.82 89 6.79 46.46 1.05 1.17 7.63
September 30, 2010 0.73 84 6.68 44.87 1.03 1.03 6.95
Year-end 2010 0.75 82 6.59 45.32 1.00 0.98 6.63
June 30, 2011 0.69 81 6.46 45.33 0.98 0.94 6.83
September 30, 2011 0.74 77 6.39 49.62 1.03 1.02 7.90
Year-end 2011 0.77 77 6.35 54.28 1.02 0.98 8.12
March 30, 2012 0.75 82 6.32 52.10 1.00 0.97 7.70
Year-end 2012 0.76 86 6.30 54.69 1.00 0.96 8.47
June 30, 2013 0.77 99 6.17 59.59 1.05 1.09 9.87
September 30, 2013 0.74 98 6.14 62.70 1.03 1.07 10.06
Year-end 2013 0.73 105 6.11 61.77 1.07 1.13 10.49
June 30, 2014 0.73 101 6.16 59.94 1.06 1.06 10.58
September 30, 2014 0.79 109 6.15 61.48 1.12 1.15 11.26
Year-end 2014 0.82 120 6.14 63.59 1.16 1.23 11.60
September 30, 2015 0.89 120 6.35 66.13 1.34 1.43 14.02
Year-end 2015 0.92 120 6.49 66.20 1.39 1.37 15.39
September 30, 2016 0.89 101 6.67 66.46 1.31 1.30 13.69
Year-end 2016 0.95 116 6.95 67.84 1.35 1.38 13.65
February 28, 2017 0.94 112 6.87 66.66 1.31 1.30 12.94
Dollar against other currencies in % Euro Yen RMB Rupee Cdn$ A$ SA Rand
1) largest individual proucer of gold from South Africa; entered into a definitive agreement to acquire Stillwater Mining, the only US miner of platinum group metals,
for US$ 2.2 million
2) operating four West African mines in Côte d"Ivoire , Mali , Burk ina Faso and Ghana ;
completed acquisition of True Gold (gold prducer in Burk ina Faso) as of April 26, 2016
source: Goldletter International
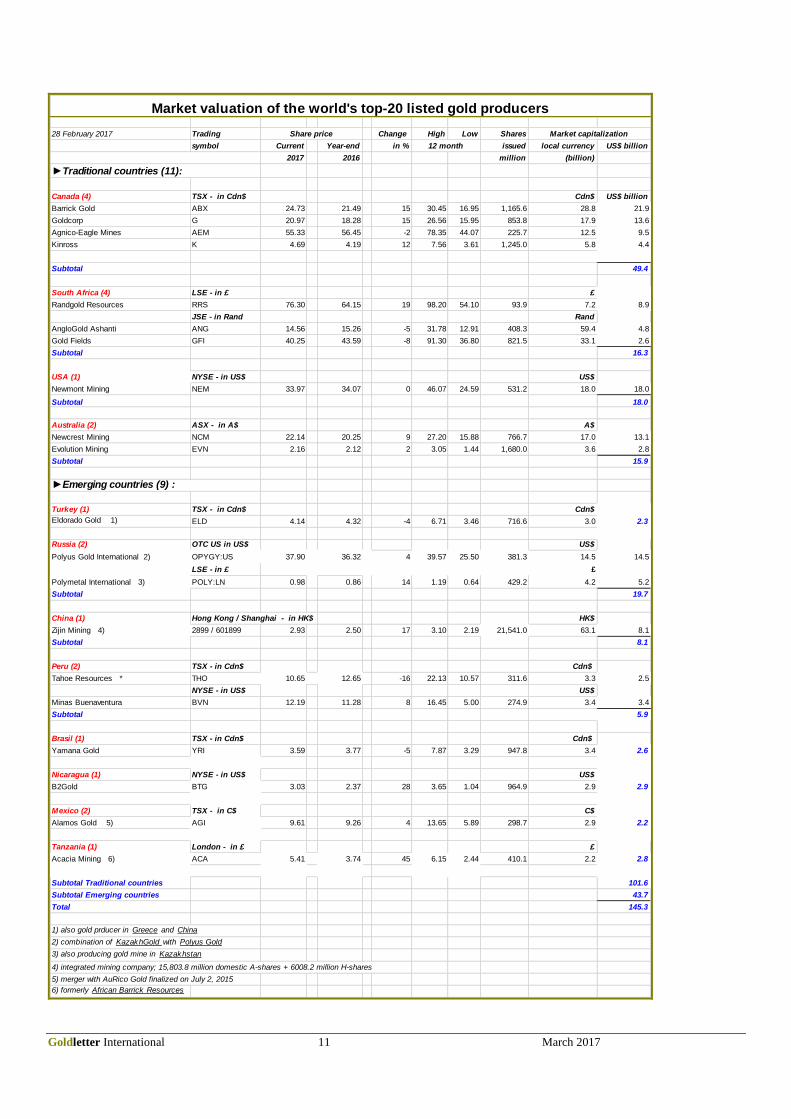
Market valuation of gold companies ($ 500 million plus)
12 month
Market capitalizationShare price
Goldletter International 13 March 2017
CALENDAR OF MINING EVENTS
Goldletter International, Uraniumletter International and Rare Earths & Strategic Metals Letter International as Media Partner
2017 March 28 – 31 Mining Investment Asia – Singapore April 11 – 12 ► Russian Metals & Mining Week – Moscow April 25 – 27 World Nuclear Fuel Cycle – Toronto, Canada May 3 – 5 Mining Investment Africa – Abuja, Nigeria June 11 – 12 Mining Investment Europe – Frankfurt, Germany June 23 – 24 DRC Mining Week - Lubumbashi, DRC July 10 – 11 Investing in LATAM Mining Cumbre – Santiago, Chile August 11 – 13 India International Gold Convention – Goa, India ► Marino G. Pieterse to be a speaker
Goldletter International ● a publication by Metal Commodities Investment Platform, the Netherlands ● Marino G. Pieterse, Publisher and Editor ● Information and investment comments are independently and thoroughly researched and believed correct. No guaranty of absolute accuracy can be given however. ● Investment decisions are fully made for own risk ● tel.: +31-251-828247 ● Chamber of Commerce 58330445 ● www.metalcommodities-ip.com ● e-mail: [email protected]