27
Goldman Sachs Variable Insurance Trust GOLDMAN SACHS ASSET MANAGEMENT, L.P. 32 OLD SLIP, NEW YORK, NEW YORK 10005 Strategic International Equity Fund Annual Report December 31, 2007
GoldmanSachs Variable Insurance TrustGOLDMAN SACHS ASSET MANAGEMENT, L.P. 32 OLD SLIP, NEW YORK, NEW YORK 10005
Strategic International Equity Fund
Annual ReportDecember 31, 2007

Shareholder Letter
Dear Shareholders:
This report provides an overview on the performance of the Goldman Sachs Variable Insurance Trust — Strategic
International Equity Fund (the “Fund”) during the one-year reporting period that ended December 31, 2007.
Market OverviewThe international equity markets began 2007 strongly, despite experiencing increased
volatility when the markets experienced a correction in February. During the first half of the
year, the Morgan Stanley Capital International (“MSCI”) Europe, Australasia and Far East
(“EAFE”) Index returned 11.09%. However, heightened credit market concerns and tighten-
ing liquidity hit the equity markets globally in July. The credit markets deteriorated
significantly as concerns over subprime mortgages, which had initially been contained to
the U.S., began to spread to more conventional loans and to the international markets,
resulting in a re-pricing of risk globally. The VIX Volatility Index, which measures stock
market volatility, reached a four-year high by mid-August and volatility continued through
the remainder of the year. All major equity markets suffered significant setbacks in the
fourth quarter of 2007 as investor confidence continued to be hurt by the fallout from the
turmoil in the credit markets. In addition, there were worries that the U.S. may go into
recession, impacting economic and profit growth globally. Increasing expectations that
losses related to subprime mortgages would grow, combined with record oil and commodity
prices, also weighed on investor sentiment. Despite giving back some earlier gains during
the fourth quarter, the MSCI EAFE Index returned 11.63% in 2007.
Investment Objective
The Fund seeks long-term capital appreciation. The Fund seeks this objective by investing
in the stocks of leading companies within developed and emerging countries around the
world, outside the U.S.
Portfolio CompositionTop 10 Portfolio Holdings as of December 31, 2007*
Holding% of
Net Assets Line of Business Country
Sun Hung Kai Properties Ltd. 3.3 Real Estate Hong KongTaiwan Semiconductor
Manufacturing Co. Ltd. ADR3.3 Semiconductors & Semiconductor
Equipment TaiwanUniCredito Italiano SpA 3.1 Banks ItalyTesco PLC 2.8 Food & Staples Retailing United KingdomAegon NV 2.8 Insurance NetherlandsRoche Holding AG 2.7 Pharmaceuticals, Biotechnology &
Life Sciences SwitzerlandInBev NV 2.7 Food, Beverage & Tobacco BelgiumVodafone Group PLC 2.7 Telecommunication Services United KingdomMerck KGaA 2.7 Pharmaceuticals, Biotechnology &
Life Sciences GermanyBHP Billiton Ltd. 2.6 Materials Australia
* Opinions expressed in this report represent our present opinions only. Reference to individual securities should notbe construed as a commitment that such securities will be retained by the Fund. From time to time, the Fund maychange the individual securities it holds, the number or types of securities held and the markets in which it invests.Fund holdings of securities should not be relied upon in making investment decisions and should not be construed as
1
G O L D M A N S A C H S VA R I A B L E I N S U R A N C E T R U S T S T R AT E G I C I N T E R N AT I O N A L E Q U I T Y F U N D
research or investment advice regarding particular securities. References to individual securities do not constitute arecommendation to the investor to buy, hold or sell such securities. In addition, references to past performance of theFund do not indicate future returns, which are not guaranteed and will vary. Furthermore, the value of shares of theFund may fall as well as rise.
Performance Review
Over the one-year period ended December 31, 2007, the Fund’s Institutional and Service
Shares generated cumulative total returns of 7.88% and 7.86%, respectively. These returns
compare to the 11.63% cumulative total return of the Fund’s benchmark, the MSCI EAFE
Index (unhedged, with dividends reinvested), over the same time period.
While the Fund produced positive performance during the reporting period, it lagged its
benchmark. This was primarily the result of stock selection. Two of the largest detractors
from the Fund’s performance were Financial stocks Xinhua Finance and Sumitomo Mitsui
Financial Group. In addition, weak stock selection within the Materials sector was a
negative contributor to performance.
Xinhua Finance, a Hong Kong-based indices, ratings and financial news provider to the
Chinese financial services industry, was the Fund’s largest detractor from performance
during the period. Its shares fell due to a shareholder lawsuit that claimed the company had
failed to disclose material information regarding its initial public stock offering in March
2007. The lawsuit also stated that the company’s former Chief Financial Officer had worked
for a firm accused by the National Association of Securities Dealers (“NASD”, currently
known as Financial Industry Regulatory Authority, “FINRA”) of violating U.S. securities
regulations. We sold the stock and invested the proceeds in other opportunities that we
believe offered better risk/reward tradeoffs.
Sumitomo Mitsui Financial Group, a Japanese financial services group, also detracted from
performance. Its shares were negatively impacted by an ongoing Financial Services
Authority (“FSA”) review and investors’ fears that this would hurt the company’s sales. The
FSA is a regulator of all financial services providers. The company’s shares had initially
reacted well to the Bank of Japan’s interest rate hike in February 2007, which improved the
outlook for Japanese banks’ earnings in general. However, its shares began to fall in March
2007, due to concerns that Japanese banks may have difficulty raising corporate loan
lending rates as previously expected. These concerns were driven by low demand and an
overall deterioration in consumer finance. As a result of the change in the stock’s risk/
reward profile, we sold the position and invested in other more compelling investment
opportunities.
Within the Materials sector, Japan’s JFE Holdings, Inc., the world’s third largest steel maker,
detracted from performance after announcing disappointing second quarter earnings. Its
profits declined as a result of significantly higher freight charges and higher costs for raw
materials, including nickel, iron ore and manganese. While this could continue to be a near-
term issue, demand for high quality steel remains strong. We believe JFE Holdings is
enjoying improving fundamentals and its investor-focused free cash flow strategy makes it
unique among Japanese corporations. Therefore, we continue to hold the stock. Elsewhere,
BHP Billiton, Ltd., an Australian diversified commodities group, detracted from perfor-
mance after making a $120 billion takeover proposal for rival Rio Tinto, the world’s third
largest mining company. The all-equity bid was rejected by Rio Tinto’s management, but
BHP Billiton’s shares subsequently weakened following their strong run earlier in year. We
2
G O L D M A N S A C H S VA R I A B L E I N S U R A N C E T R U S T S T R AT E G I C I N T E R N AT I O N A L E Q U I T Y F U N D
Shareholder Letter (continued)

continue to believe BHP Billiton can benefit from the current commodity cycle that is
characterized by over-demand and under-supply. Given the emerging markets’ need for steel
and energy, we value BHP Billiton’s pricing power in iron ore and coal and the stability of
its petroleum division.
Several holdings in the Financial sector were positive contributors to performance, including
Garanti Bank, Indiabulls Financial Services Ltd., Sun Hung Kai Properties Ltd., Invesco
PLC and Banco Comercial Portugues. In addition, the Fund’s relative performance benefited
significantly as we did not own any of the Financial stocks that were most impacted by the
credit crunch and ensuing liquidity crisis.
Garanti Bank, Turkey’s third-largest publicly traded bank, performed strongly throughout the
year due to signals from Turkey’s central bank that it may cut interest rates, which would
boost lending and drive economic growth. Record domestic growth and growth in the home-
mortgage market also encouraged a positive outlook for Turkish banks. We took advantage
of the share price appreciation and sold out of the position.
Indiabulls Financials Services, a leading Indian securities company that is partly owned by
Citigroup, rallied towards the end of the year. This occurred as it announced that it would
be entering into a joint venture with MMTC India to set up a commodity exchange. This
helped to raise the earnings outlook for the firm.
The Fund’s positions in Hong Kong property developer Sun Hung Kai Properties and UK
asset manager Invesco performed well in recent months. Sun Hung Kai Properties benefited
from the cut in U.S. interest rates. Invesco’s shares rallied after the company moved its
primary listing from the UK to the U.S., where asset management firms trade at a
significant premium to their UK peers.
Banco Comercial Portugues, a Portuguese commercial and investment banking services
provider, was also a leading contributor to performance. Its share price had been depressed
when we initiated a position in the stock as a result of the company’s pending bid for
smaller domestic rival BPI. However, as we expected, Banco Comercial Portugues’ shares
rallied strongly in May after the bid was rejected by BPI’s key shareholders. As a result of
the failed takeover attempt, there was then speculation that Banco Comercial Portugues
itself may be an attractive takeover target. Following the stock’s very strong performance,
we believed that the share price reflected the fundamental value of the bank, and we exited
our position.
We thank you for your investment and look forward to serving your investment needs in the
future.
Goldman Sachs International Equity Portfolio Management Team
January 16, 2008
3
G O L D M A N S A C H S VA R I A B L E I N S U R A N C E T R U S T S T R AT E G I C I N T E R N AT I O N A L E Q U I T Y F U N D

Shares of the Goldman Sachs Variable Insurance Trust (“VIT”) Strategic International
Equity Fund are offered to separate accounts of participating life insurance companies
for the purpose of funding variable annuity contracts and variable life insurance
policies. Shares of the Fund are not offered directly to the general public. The variable
annuity contracts and variable life insurance policies are described in the separate
prospectuses issued by participating insurance companies. You should refer to those
prospectuses for information about surrender charges, mortality and expense risk fees
and other charges that may be assessed by participating insurance companies under
the variable annuity contracts or variable life insurance policies. Such fees or charges,
if any, may affect the return you may realize with respect to your investments. Ask your
representative for more complete information. Please consider a fund’s objectives, risks
and charges and expenses, and read the prospectus carefully before investing. The
prospectus contains this and other information about the Fund.
Principal Investment Strategies and Risks
The VIT Strategic International Equity Fund invests primarily in a diversified portfolio of
equity investments in companies that are organized outside the United States or whose
securities are principally traded outside the United States. The Fund is subject to market
risk so that the value of the securities in which it invests may go up or down in response to
the prospects of individual companies, particular industry sectors and/or general economic
conditions. Moreover, different investment styles, such as growth or value, tend to shift in
and out of favor depending upon market and economic conditions as well as investor
sentiment. Foreign and emerging market securities may be more volatile than investments in
U.S. securities and will be subject to the risks of currency fluctuations and sudden economic
or political developments. At times, the Fund may be unable to sell certain of its portfolio
securities without a substantial drop in price, if at all. The Fund may also engage in foreign
currency transactions for hedging purposes (including cross hedging) or for speculative
purposes. Forward foreign currency exchange contracts are subject to the risk that the
counterparty to the contract will default on its obligations. The Fund may also invest in
fixed income securities, which are subject to the risks associated with debt securities
generally, including credit, liquidity and interest rate risk. The Fund may make investments
in derivative instruments, including options, futures, swaps, structured securities and other
derivative investments. Derivative instruments may involve a high degree of financial risk.
These risks include the risk that a small movement in the price of the underlying security or
benchmark may result in a disproportionately large movement, unfavorable or favorable, in
the price of the derivative instrument; risks of default by a counterparty, and the risks that
transactions may not be liquid.
4
G O L D M A N S A C H S VA R I A B L E I N S U R A N C E T R U S T S T R AT E G I C I N T E R N AT I O N A L E Q U I T Y F U N D
Shareholder Letter (continued)

Performance SummaryDecember 31, 2007
The following graph shows the value, as of December 31, 2007, of a $10,000 investment made on January 12, 1998
(commencement of operations) in the Institutional Class Shares. For comparative purposes, the performance of the Fund’s
benchmark, the MSCI EAFE Index (unhedged with dividends reinvested), is shown. This performance data represents past
performance and should not be considered indicative of future performance which will fluctuate with changes in market
conditions. These performance fluctuations will cause an investor’s shares, when redeemed, to be worth more or less than
their original cost. Performance reflects Fund level expenses but does not reflect fees and expenses associated with any
variable annuity contract or variable life insurance policy that uses the Fund as an investment option for any contract or
policy. Had performance reflected all of those fees and expenses, performance would have been reduced. Performance also
would have been reduced had expense limitations not been in effect. Performance of Service Class Shares will vary from
Institutional Class Shares due to differences in fees. In addition to the investment adviser’s decisions regarding issuer/
industry/country investment selection and allocation, other factors may affect Fund performance. These factors include, but
are not limited to, Fund operating fees and expenses, portfolio turnover, and subscription and redemption cash flows
affecting the Fund.
Strategic International Equity Fund’s Lifetime Performance
Performance of a $10,000 Investment, with distributions reinvested, from January 12, 1998 through December 31, 2007.
Institutional Class Shares
MSCI EAFE (unhedged)
$6,000
$24,000
$26,000
$22,000
$20,000
$18,000
$16,000
$20,094
$24,410
$14,000
$12,000
$10,000
$8,000
1/12/98 12/98 12/99 12/00 12/01 12/02 12/0712/0612/0512/0412/03
One Year Five Years Since Inception
Average Annual Total Return Through December 31, 2007
Institutional Class (commenced January 12, 1998) 7.88% 18.15% 7.25%
Service Class (commenced January 9, 2006) 7.86% n/a 11.86%
5
G O L D M A N S A C H S VA R I A B L E I N S U R A N C E T R U S T S T R AT E G I C I N T E R N AT I O N A L E Q U I T Y F U N D

Schedule of InvestmentsDecember 31, 2007
Shares Description Value
Common Stocks – 97.0%
Australia – 4.6%269,872 BHP Billiton Ltd. (Materials) $ 9,434,216110,618 Macquarie Group Ltd.(a)
(Diversified Financials) 7,401,164
16,835,380
Belgium – 2.7%118,017 InBev NV (Food, Beverage &
Tobacco) 9,810,853
Cyprus – 2.1%409,740 Bank of Cyprus Public Co. Ltd.
(Banks) 7,407,014
France – 8.1%97,356 Carrefour SA (Food & Staples
Retailing) 7,577,48957,282 Ipsen SA (Pharmaceuticals,
Biotechnology & Life Sciences) 3,454,34330,225 Lafarge SA (Materials) 5,488,48061,227 Renault SA (Automobiles &
Components) 8,683,36051,134 Technip SA (Energy) 4,067,262
29,270,934
Germany – 11.9%55,837 Bilfinger & Berger AG (Capital
Goods) 4,269,842254,400 Deutsche Telekom AG
(Telecommunication Services) 5,599,18774,904 Merck KGaA (Pharmaceuticals,
Biotechnology & Life Sciences) 9,687,14079,827 Rheinmetall AG (Capital Goods) 6,342,673
160,366 SAP AG (Software & Services) 8,254,56656,866 Siemens AG (Registered) (Capital
Goods) 9,041,822
43,195,230
Hong Kong – 5.5%444,500 China Mobile Ltd.
(Telecommunication Services) 7,740,746578,000 Sun Hung Kai Properties Ltd.(b)
(Real Estate) 12,140,055
19,880,801
India – 1.2%174,747 Indiabulls Financial Services Ltd.
GDR (Registered S) (DiversifiedFinancials) 4,193,928
Italy – 3.1%1,347,971 UniCredito Italiano SpA (Banks) 11,087,596
Japan – 14.1%609,000 Asahi Glass Co. Ltd.(a) (Capital
Goods) 8,054,263114,300 JFE Holdings, Inc. (Materials) 5,731,480227,000 Mitsubishi Estate Co. Ltd. (Real
Estate) 5,408,263472,100 Nomura Holdings, Inc.
(Diversified Financials) 7,909,969
Shares Description Value
Common Stocks – (continued)
Japan – (continued)267,500 Seven & I Holdings Co. Ltd.
(Food & Staples Retailing) $ 7,771,526565,300 Sumitomo Electric Industries Ltd.
(Capital Goods) 8,915,650123,400 Takeda Pharmaceutical Co. Ltd.
(Pharmaceuticals, Biotechnology &Life Sciences) 7,209,133
51,000,284
Luxembourg – 0.9%30,050 Millicom International Cellular SA
SDR*(a) (TelecommunicationServices) 3,418,134
Mexico – 1.5%160,717 Wal-Mart de Mexico SAB de CV
ADR (Food & Staples Retailing) 5,528,665
Netherlands – 4.9%576,240 Aegon NV (Insurance) 10,163,90695,765 Akzo Nobel NV (Materials) 7,709,277
17,873,183
Norway – 4.2%258,914 Aker Kvaerner ASA (Energy) 6,833,397379,547 Prosafe ASA (Energy) 6,566,36945,721 Schibsted ASA (Media) 1,973,506
15,373,272
Russia – 4.1%134,603 OAO Gazprom ADR (Energy) 7,578,149
397 Sberbank RF GDR (Banks) 215,34113,193 Sberbank RF GDR* (Registered S)
(Banks) 7,156,154
14,949,644
Singapore – 2.5%634,000 DBS Group Holdings Ltd. (Banks) 8,998,350
South Korea – 0.9%36,060 LG Chem Ltd.* (Materials) 3,411,106
Spain – 1.7%221,475 Indra Sistemas SA (Software &
Services) 6,006,340
Sweden – 0.7%269,546 TeliaSonera AB
(Telecommunication Services) 2,518,254
Switzerland – 2.7%57,216 Roche Holding AG
(Pharmaceuticals, Biotechnology &Life Sciences) 9,890,688
Taiwan – 3.3%1,212,034 Taiwan Semiconductor
Manufacturing Co. Ltd. ADR(c)
(Semiconductors & SemiconductorEquipment) 12,071,859
G O L D M A N S A C H S VA R I A B L E I N S U R A N C E T R U S T S T R AT E G I C I N T E R N AT I O N A L E Q U I T Y F U N D
6 The accompanying notes are an integral part of these financial statements.

Shares Description Value
Common Stocks – (continued)
United Kingdom – 16.3%77,500 Anglo American PLC (Materials) $ 4,704,350
1,367,057 BT Group PLC(Telecommunication Services) 7,384,908
223,981 Invesco PLC (DiversifiedFinancials) 7,028,508
1,865,661 Old Mutual PLC (Insurance) 6,215,895493,509 Prudential PLC (Insurance) 6,948,994298,039 Shire PLC (Pharmaceuticals,
Biotechnology & Life Sciences) 6,853,2941,080,279 Tesco PLC (Food & Staples
Retailing) 10,276,1782,592,893 Vodafone Group PLC
(Telecommunication Services) 9,733,495
59,145,622
TO TA L C O M M O N S TO C K S(Cost $350,682,049) $351,867,137
PrincipalAmount
InterestRate
MaturityDate Value
Short-Term Obligation – 4.2%
JPMorgan Chase Euro – Time Deposit$15,235,286 3.964% 01/02/08 $15,235,286(Cost $15,235,286)
TO TA L I N V E S TM E N T S B EF O R E S E C U R I T I E SLENDI NG C O L L ATER AL(Cost $365,917,335) $367,102,423
SharesInterest
Rate Value
Securities Lending Collateral(d) – 4.0%
Boston Global Investment Trust – Enhanced Portfolio14,490,400 4.941% $14,490,400(Cost $14,490,400)
T O TA L I N V E ST M E N T S – 10 5 . 2 %(Cost $380,407,735) $381,592,823
L I A B I L I T I E S I N E X C E S S O F O T HE RA S S ET S – ( 5 . 2 ) % (18,906,821)
N E T AS S ET S – 1 00 . 0% $362,686,002
The percentage shown for each investment category
reflects the value of investments in that category as a
percentage of net assets.* Non-income producing security.
(a) All or a portion of security is on loan.
(b) Securities are exempt from registration under Rule 144A of theSecurities Act of 1933. Under procedures approved by the Boardof Trustees, such securities have been determined to be liquid bythe Investment Adviser and may be resold, normally to qualifiedinstitutional buyers in transactions exempt from registration. Totalmarket value of Rule 144A securities amounts to $12,140,055,which represents approximately 3.3% of net assets as of Decem-ber 31, 2007.
(c) All or a portion of security is segregated for initial marginrequirements on futures transactions.
(d) Variable rate security. Interest rate disclosed is that which is ineffect at December 31, 2007.
Investment Abbreviations:ADR — American Depositary ReceiptGDR — Global Depositary ReceiptSDR — Special Drawing Rights
G O L D M A N S A C H S VA R I A B L E I N S U R A N C E T R U S T S T R AT E G I C I N T E R N AT I O N A L E Q U I T Y F U N D
The accompanying notes are an integral part of these financial statements. 7

As a % ofNet Assets
Investments Industry Classifications†
Automobiles & Components 2.4%Banks 9.6Capital Goods 10.1Diversified Financials 7.3Energy 6.9Food & Staples Retailing 8.6Food, Beverage & Tobacco 2.7Insurance 6.4Materials 10.1Media 0.6Pharmaceuticals, Biotechnology & Life Sciences 10.2Real Estate 4.9Semiconductors & Semiconductor Equipment 3.3Short-term Investments # 8.2Software & Services 3.9Telecommunication Services 10.0
TO TA L I NV ESTM E NTS 105.2%
† Industry concentrations greater than one-tenth of one percent aredisclosed.
# Short-term investments include a short-term obligation and securi-ties lending collateral.
A D D I T I O N A L I N V E S T M E N T I N F O R M AT I O N
FUTURES CONTRACTS — At December 31, 2007, the following futures contracts were open:
TypeNumber of
Contracts LongSettlement
MonthNotional
ValueUnrealized
Gain
Dow Jones Euro STOXX 50 Index 113 March 2008 $7,327,137 $144,190
G O L D M A N S A C H S VA R I A B L E I N S U R A N C E T R U S T S T R AT E G I C I N T E R N AT I O N A L E Q U I T Y F U N D
8 The accompanying notes are an integral part of these financial statements.
Schedule of Investments (continued)December 31, 2007
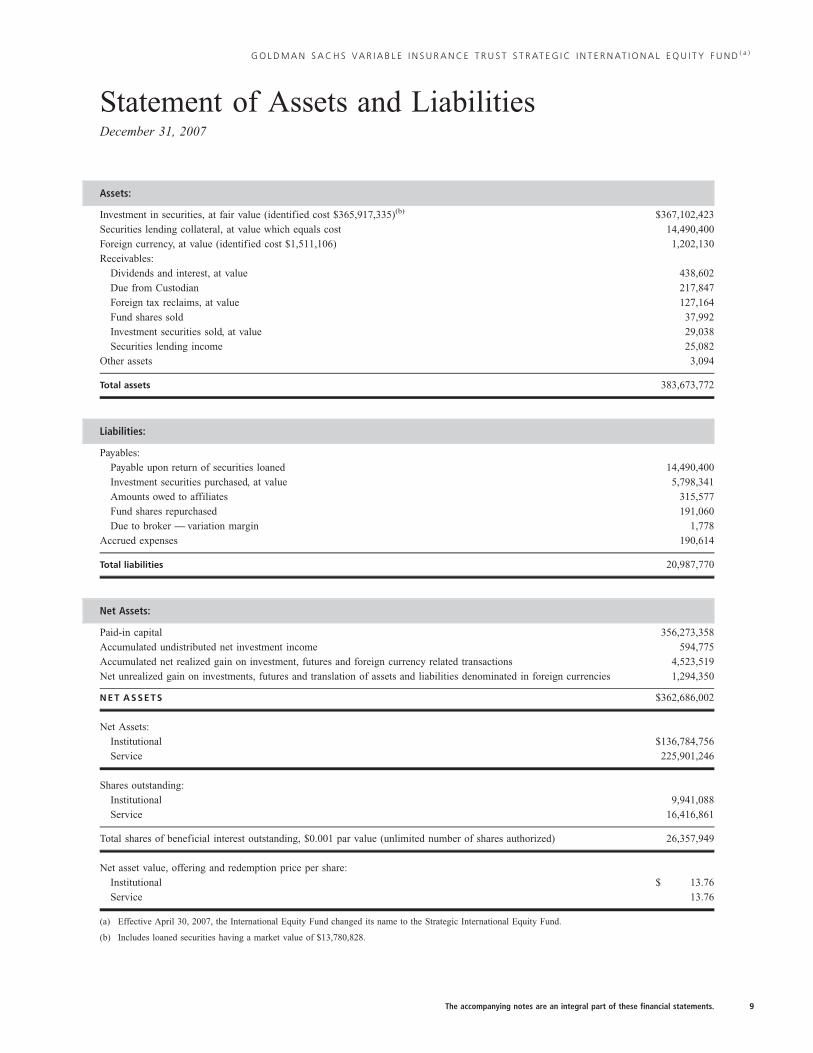
Statement of Assets and LiabilitiesDecember 31, 2007
Assets:
Investment in securities, at fair value (identified cost $365,917,335)(b) $367,102,423
Securities lending collateral, at value which equals cost 14,490,400
Foreign currency, at value (identified cost $1,511,106) 1,202,130
Receivables:
Dividends and interest, at value 438,602
Due from Custodian 217,847
Foreign tax reclaims, at value 127,164
Fund shares sold 37,992
Investment securities sold, at value 29,038
Securities lending income 25,082
Other assets 3,094
Total assets 383,673,772
Liabilities:
Payables:
Payable upon return of securities loaned 14,490,400
Investment securities purchased, at value 5,798,341
Amounts owed to affiliates 315,577
Fund shares repurchased 191,060
Due to broker — variation margin 1,778
Accrued expenses 190,614
Total liabilities 20,987,770
Net Assets:
Paid-in capital 356,273,358
Accumulated undistributed net investment income 594,775
Accumulated net realized gain on investment, futures and foreign currency related transactions 4,523,519
Net unrealized gain on investments, futures and translation of assets and liabilities denominated in foreign currencies 1,294,350
N E T AS S E TS $362,686,002
Net Assets:
Institutional $136,784,756
Service 225,901,246
Shares outstanding:
Institutional 9,941,088
Service 16,416,861
Total shares of beneficial interest outstanding, $0.001 par value (unlimited number of shares authorized) 26,357,949
Net asset value, offering and redemption price per share:
Institutional $ 13.76
Service 13.76
(a) Effective April 30, 2007, the International Equity Fund changed its name to the Strategic International Equity Fund.
(b) Includes loaned securities having a market value of $13,780,828.
The accompanying notes are an integral part of these financial statements. 9
G O L D M A N S A C H S VA R I A B L E I N S U R A N C E T R U S T S T R AT E G I C I N T E R N AT I O N A L E Q U I T Y F U N D ( a )

Statement of OperationsFor the Year Ended December 31, 2007
Investment income:
Dividends(b) $ 8,488,947
Interest (including securities lending income of $436,815) 798,186
Total investment income 9,287,133
Expenses:
Management fees 3,751,769
Distribution and Service fees — Service Class 610,581
Printing fees 163,068
Custody and accounting fees 158,033
Transfer Agent fees(c) 113,240
Professional fees 75,325
Shareholder proxy meeting expense 70,037
Trustee fees 15,970
Registration fees 1,243
Other 12,730
Total expenses 4,971,996
Less — expense reductions (580,194)
Net expenses 4,391,802
NET INVESTMENT INCOME 4,895,331
Realized and unrealized gain (loss) on investments, futures and foreign currency transactions:
Net realized gain (loss) from:
Investment transactions 69,886,576
Futures transactions (532,626)
Foreign currency related transactions (77,655)
Net change in unrealized gain (loss) on:
Investments (45,402,541)
Futures 144,190
Translation of assets and liabilities denominated in foreign currencies (43,412)
Net realized and unrealized gain on investments, futures and foreign currency transactions 23,974,532
N E T I N C R EA S E I N N E T A S S ET S R ES U LT I N G F R O M O P ER AT I O N S $ 28,869,863
(a) Effective April 30, 2007, the International Equity Fund changed its name to the Strategic International Equity Fund.
(b) Foreign taxes withheld on dividends were $944,591.
(c) Institutional and Service Class had Transfer Agent fees of $39,109 and $74,131, respectively.
10 The accompanying notes are an integral part of these financial statements.
G O L D M A N S A C H S VA R I A B L E I N S U R A N C E T R U S T S T R AT E G I C I N T E R N AT I O N A L E Q U I T Y F U N D ( a )
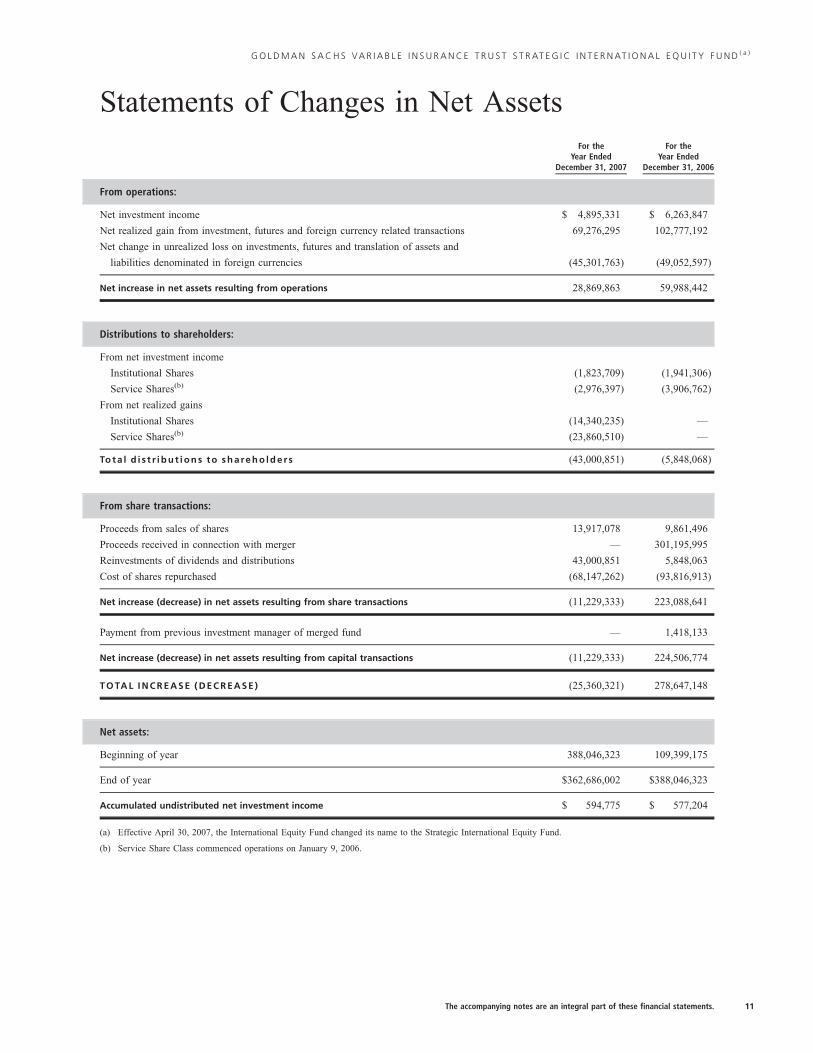
Statements of Changes in Net AssetsFor the
Year EndedDecember 31, 2007
For theYear Ended
December 31, 2006
From operations:
Net investment income $ 4,895,331 $ 6,263,847
Net realized gain from investment, futures and foreign currency related transactions 69,276,295 102,777,192
Net change in unrealized loss on investments, futures and translation of assets and
liabilities denominated in foreign currencies (45,301,763) (49,052,597)
Net increase in net assets resulting from operations 28,869,863 59,988,442
Distributions to shareholders:
From net investment income
Institutional Shares (1,823,709) (1,941,306)
Service Shares(b) (2,976,397) (3,906,762)
From net realized gains
Institutional Shares (14,340,235) —
Service Shares(b) (23,860,510) —
To ta l d i s t r i b u t i o n s to s h a re h o l d e r s (43,000,851) (5,848,068)
From share transactions:
Proceeds from sales of shares 13,917,078 9,861,496
Proceeds received in connection with merger — 301,195,995
Reinvestments of dividends and distributions 43,000,851 5,848,063
Cost of shares repurchased (68,147,262) (93,816,913)
Net increase (decrease) in net assets resulting from share transactions (11,229,333) 223,088,641
Payment from previous investment manager of merged fund — 1,418,133
Net increase (decrease) in net assets resulting from capital transactions (11,229,333) 224,506,774
TO TA L I NC R E ASE ( DEC R EASE ) (25,360,321) 278,647,148
Net assets:
Beginning of year 388,046,323 109,399,175
End of year $362,686,002 $388,046,323
Accumulated undistributed net investment income $ 594,775 $ 577,204
(a) Effective April 30, 2007, the International Equity Fund changed its name to the Strategic International Equity Fund.
(b) Service Share Class commenced operations on January 9, 2006.
The accompanying notes are an integral part of these financial statements. 11
G O L D M A N S A C H S VA R I A B L E I N S U R A N C E T R U S T S T R AT E G I C I N T E R N AT I O N A L E Q U I T Y F U N D ( a )

Fina
ncia
lH
ighl
ight
sSe
lect
edD
ata
for
aSh
are
Out
stan
ding
Thr
ough
out
Eac
hYe
ar
Year
-Sha
reCl
ass
Net
asse
tva
lue,
begi
nnin
gof
year
Net
inve
stm
ent
inco
me(a
)
Net
real
ized
and
unre
aliz
edga
in
Tota
lfro
min
vest
men
top
erat
ions
From
net
inve
stm
ent
inco
me
From ne
tre
aliz
edga
inTo
tal
dist
ribu
tion
s
Net
asse
tva
lue,
end
ofye
arTo
tal
retu
rn(b
)
Net
asse
ts,
end
ofye
ar(in
000s
)
Rati
oof
net
expe
nses
toav
erag
ene
tas
sets
Rati
oof
net
inve
stm
ent
inco
me
toav
erag
ene
tas
sets
Rati
oof
tota
lex
pens
esto
aver
age
net
asse
ts
Rati
oof
net
inve
stm
ent
inco
me
(loss
)to
aver
age
net
asse
ts
Port
folio
turn
over
rate
Inco
me
from
inve
stm
ent
oper
atio
nsD
istr
ibut
ions
tosh
areh
olde
rsRa
tios
assu
min
gno
expe
nse
redu
ctio
ns
Fo
rt
he
Ye
ar
sE
nd
ed
De
ce
mb
er
31
,
2007
-In
stit
utio
nal
$14.
49$0
.20
$0.9
2$1
.12
$(0.
21)
$(1.
64)
(1.8
5)$1
3.76
7.88
%$1
36,7
851.
16%
(c)
1.30
%(c
)1.
16%
(c)
1.30
%(c
)13
4%
2007
-S
ervi
ce14
.49
0.20
0.92
1.12
(0.2
1)(1
.64)
(1.8
5)13
.76
7.86
225,
901
1.18
(c)
1.30
(c)
1.41
(c)
1.07
(c)
134
2006
-In
stit
utio
nal
12.0
50.
222.
44(d
)2.
66(0
.22)
—(0
.22)
14.4
922
.10(e
)12
7,79
51.
151.
641.
161.
6376
2006
-S
ervi
ce(f
)12
.71
0.22
1.78
(d)
2.00
(0.2
2)—
(0.2
2)14
.49
15.7
4(e)
260,
251
1.17
(g)
1.68
(g)
1.41
(g)
1.44
(g)
76
2005
-In
stit
utio
nal
10.6
20.
091.
381.
47(0
.04)
—(0
.04)
12.0
513
.70
109,
399
1.20
0.81
1.36
0.66
56
2004
-In
stit
utio
nal
9.48
0.07
1.18
1.25
(0.1
1)—
(0.1
1)10
.62
13.4
810
8,62
41.
200.
751.
350.
6063
2003
-In
stit
utio
nal
7.25
0.04
2.53
2.57
(0.3
4)—
(0.3
4)9.
4835
.49
106,
792
1.37
0.49
2.60
(0.7
4)49
(a)
Cal
cula
ted
base
don
the
aver
age
shar
esou
tsta
ndin
gm
etho
dolo
gy.
(b)
Ass
umes
inve
stm
ent
atth
ene
tas
set
valu
eat
the
begi
nnin
gof
the
peri
od,
rein
vest
men
tof
all
divi
dend
san
ddi
stri
buti
ons
and
aco
mpl
ete
rede
mpt
ion
ofth
ein
vest
men
tat
the
net
asse
tva
lue
atth
een
dof
the
year
.To
tal
retu
rns
for
peri
ods
less
than
afu
llye
arar
eno
tan
nual
ized
.(c
)In
clud
esno
n-re
curr
ing
expe
nse
for
asp
ecia
lsh
areh
olde
rpr
oxy
mee
ting
whi
cham
ount
edto
appr
oxim
atel
y0.
02%
ofav
erag
ene
tas
sets
.(d
)R
efle
cts
anin
crea
seof
$0.0
5du
eto
paym
ents
bypr
evio
usin
vest
men
tm
anag
erof
am
erge
dfu
ndto
com
pens
ate
for
poss
ible
adve
rse
affe
cts
ofth
etr
adin
gac
tivit
yby
cert
ain
cont
ract
hold
ers
ofth
eac
quir
edfu
ndpr
ior
toJa
nuar
y9,
2006
.(e
)Pe
rfor
man
ceha
sno
tbe
enre
stat
edto
refl
ect
the
impa
ctof
paym
ents
bypr
evio
usin
vest
men
tm
anag
erof
am
erge
dfu
ndre
cord
eddu
ring
the
peri
odre
late
dto
(d)
abov
e.If
rest
ated
,th
epe
rfor
man
cew
ould
have
been
21.6
9%an
d15
.26%
for
Inst
itut
iona
lan
dS
ervi
ceS
hare
s,re
spec
tive
ly.
(f)
Ser
vice
Sha
reC
lass
com
men
ced
oper
atio
nson
Janu
ary
9,20
06.
(g)
Ann
uali
zed.
The
acco
mpa
nyin
gno
tes
are
anin
tegr
alpa
rtof
thes
efin
anci
alst
atem
ents
.
GO
LD
MA
NS
AC
HS
VA
RIA
BL
EIN
SU
RA
NC
ET
RU
ST
ST
RA
TE
GIC
INT
ER
NA
TIO
NA
LE
QU
ITY
FU
ND
12

Notes to Financial StatementsDecember 31, 2007
1 . O R G A N I Z A T I O N
Goldman Sachs Variable Insurance Trust (the “Trust”) is a Delaware statutory trust registered under the Investment Company Actof 1940, as amended (the “Act”), as an open-end management investment company. The Trust includes the Goldman SachsStrategic International Equity Fund (formerly “Goldman Sachs International Equity Fund”) (the “Fund” or “Strategic InternationalEquity Fund”). The Fund is a diversified portfolio under the Act offering two classes of shares — Institutional and Service.
On January 9, 2006, pursuant to an Agreement and Plan of Reorganization (the “Reorganization Agreement”) previously
approved by the Trust’s Board of Trustees, substantially all of the assets, subject to liabilities, of the Select International Equity
Fund of the Allmerica Investment Trust (the “Allmerica Fund”), were reorganized into the Strategic International Equity Fund
in exchange for the Strategic International Equity Fund’s Service Shares. Holders of shares of the Allmerica Fund received
Service Shares of the Strategic International Equity Fund in an amount equal to the aggregate net asset value of their
investment in the Allmerica Fund as of the close of business on January 6, 2006. On the date of the exchange, the Strategic
International Equity Fund began to offer Service Shares. The exchange was a tax-free event to shareholders.
Shares of the Trust may be purchased and held by separate accounts of participating life insurance companies for the
purpose of funding variable annuity contracts and variable life insurance policies. Shares of the Trust are not offered directly
to the general public.
Effective April 30, 2007, the Fund changed its name to the Goldman Sachs Strategic International Equity Fund.
2 . S I G N I F I C A N T A C C O U N T I N G P O L I C I E S
The following is a summary of the significant accounting policies consistently followed by the Fund. The preparation offinancial statements in conformity with U.S. generally accepted accounting principles (“GAAP”) requires management tomake estimates and assumptions that may affect the reported amounts. Actual results could differ from those estimates.
A. Investment Valuation — Investments in equity securities traded on a foreign securities exchange are valued daily atfair value determined by an independent fair value service (if available) under valuation procedures approved by the Boardof Trustees consistent with applicable regulatory guidance. The independent service takes into account multiple factorsincluding, but not limited to, movements in the U.S. securities markets, certain depositary receipts, futures contracts andforeign currency exchange rates that have occurred subsequent to the close of foreign securities exchanges. While theindependent service may not take into account market or security specific information, under the valuation procedures, thesesecurities might also be fair valued by the adviser by taking into consideration market or security specific information,including, but not limited to, corporate actions or events, market disruptions or governmental actions.
Investments in equity securities and investment companies traded on a U.S. securities exchange or the NASDAQ system or
for investments in securities traded on a foreign securities exchange for which an independent fair value service is not available
are valued daily at their last sale price or official closing price on the principal exchange or system on which they are traded. If no
sale occurs, such securities and investment companies are valued at the last bid price. Debt securities are valued at prices supplied
by independent pricing services or broker/dealer-supplied valuations. The pricing services may use valuation models or matrix
pricing, which considers yield or price with respect to comparable bonds, quotations from bond dealers or by reference to other
securities that are considered comparable in such characteristics as rating, interest rate, and maturity date, to determine current
value. Unlisted equity securities for which market quotations are available are valued at the last sale price on valuation date, or if
no sale occurs, at the last bid price. Investments in investment companies (other than those that are exchange traded) are valued at
the net asset value per share on valuation date. Short-term debt obligations maturing in sixty days or less are valued at amortized
cost, which approximates market value. Securities for which quotations are not readily available or deemed not to reflect market
value by the investment adviser are valued at fair value using methods approved by the Trust’s Board of Trustees.
Investing in foreign markets may involve special risks and considerations not typically associated with investing in the
United States. These risks include revaluation of currencies, high rates of inflation, repatriation restrictions on income and
capital, and adverse political and economic developments. Moreover, securities issued in these markets may be less liquid,
subject to government ownership controls and have delayed settlements, and their prices may be more volatile than those of
comparable securities in the United States.
G O L D M A N S A C H S VA R I A B L E I N S U R A N C E T R U S T S T R AT E G I C I N T E R N AT I O N A L E Q U I T Y F U N D
13
2 . S I G N I F I C A N T A C C O U N T I N G P O L I C I E S ( c o n t i n u e d )
B. Security Transactions and Investment Income — Security transactions are reflected for financial reporting purposesas of the trade date. Realized gains and losses on sales of portfolio securities are calculated using the identified-cost basis.Dividend income is recorded on the ex-dividend date, net of foreign withholding taxes, if any, which are reduced by anyamounts reclaimable by the Fund, where applicable. Interest income is recorded on the basis of interest accrued, premiumamortized and discount accreted. In addition, it is the Fund’s policy to accrue for estimated capital gains taxes on foreignsecurities held by the Fund which are subject to such taxes.
Net investment income (other than class-specific expenses) and unrealized and realized gain or losses are allocated
daily to each class of shares of the Fund based upon the relative proportion of net assets of each class.
C. Expenses — Expenses incurred by the Trust that do not specifically relate to an individual fund of the Trust areallocated to the Fund on a straight-line and/or “pro-rata” basis depending upon the nature of the expense. Each class ofshares of the Fund separately bears its respective class-specific Transfer Agency fees. Service Shares bear all expenses andfees relating to their Distribution and Service Plan.
D. Federal Taxes and Distributions to Shareholders — It is the Fund’s policy to comply with the requirements of theInternal Revenue Code of 1986, as amended (the “Code”) applicable to regulated investment companies and to distributeeach year substantially all of its investment company taxable income and capital gains to its shareholders. Accordingly, nofederal tax provisions are required. Dividends and distributions to shareholders are recorded on the ex-dividend date. Incomeand capital gains distributions, if any, are declared and paid annually. Net capital losses are carried forward to future yearsand may be used to the extent allowed by the Code to offset any future capital gains. Utilization of capital loss carryforwardswill reduce the requirement of future capital gain distributions.
The characterization of distributions to shareholders for financial reporting purposes is determined in accordance with
Federal income tax rules, which may differ from GAAP. Therefore, the source of the Fund’s distributions may be shown in
the accompanying financial statements as either from net investment income, net realized gain, or as a tax return of capital.
E. Foreign Currency Translations — The books and records of the Fund are maintained in U.S. dollars. Amountsdenominated in foreign currencies are translated into U.S. dollars on the following basis: (i) investment valuations, foreigncurrency and other assets and liabilities initially expressed in foreign currencies are converted each business day intoU.S. dollars based upon current exchange rates; and (ii) purchases and sales of foreign investments, income and expenses areconverted into U.S. dollars based upon currency exchange rates prevailing on the respective dates of such transactions.
Net realized and unrealized gain (loss) on foreign currency transactions will represent: (i) foreign exchange gains and
losses from the sale and holdings of foreign currencies; (ii) gains and losses from the sale of investments (applicable to
fixed income securities); (iii) currency gains and losses between trade date and settlement date on investment securities
transactions and forward exchange contracts; and (iv) gains and losses from the difference between amounts of interest,
dividends and foreign withholding taxes recorded and the amounts actually received. The effect of changes in foreign
currency exchange rates on securities and derivative instruments are not segregated in the Statement of Operations from the
effects of changes in market prices of those securities and derivative instruments, but are included with the net realized and
unrealized gain (loss) on securities and derivative instruments. Net unrealized foreign exchange gains and losses arising from
changes in the value of other assets and liabilities as a result of changes in foreign exchange rates are included as increases
and decreases in unrealized gain (loss) on foreign currency related transactions.
F. Forward Foreign Currency Exchange Contracts — The Fund may enter into forward foreign currency exchangecontracts for the purchase or sale of a specific foreign currency at a fixed price on a future date as a hedge or cross-hedgeagainst either specific transactions or portfolio positions. The Fund may also purchase and sell forward contracts to seek toincrease total return. All commitments are “marked-to-market” daily at the applicable translation rates and any resultingunrealized gains or losses are recorded in the Fund’s financial statements. The Fund records realized gains or losses at thetime a forward contract is offset by entry into a closing transaction or extinguished by delivery of the currency. Risks mayarise upon entering into these contracts from the potential inability of counterparties to meet the terms of their contracts andfrom unanticipated movements in the value of a foreign currency relative to the U.S. dollar.
G O L D M A N S A C H S VA R I A B L E I N S U R A N C E T R U S T S T R AT E G I C I N T E R N AT I O N A L E Q U I T Y F U N D
14
Notes to Financial Statements (continued)December 31, 2007
2 . S I G N I F I C A N T A C C O U N T I N G P O L I C I E S ( c o n t i n u e d )
The contractual amounts of forward foreign currency exchange contracts do not necessarily represent the amounts
potentially subject to risk. The measurement of the risks associated with these instruments is meaningful only when all
related and offsetting transactions are considered.
G. Futures Contracts — The Fund may enter into futures transactions to hedge against changes in interest rates, securitiesprices, currency exchange rates or to seek to increase total return. Futures contracts are valued at the last settlement price, orin the absence of a sale, the last bid price, at the end of each day on the board of trade or exchange upon which they aretraded. Upon entering into a futures contract, the Fund is required to segregate cash or securities equal to the minimum“initial margin” requirement of the associated futures exchange. Subsequent payments for futures contracts (“variationmargin”) are paid or received by the Fund, dependent on the daily fluctuations in the value of the contracts, and are recordedfor financial reporting purposes as unrealized gains or losses. When contracts are closed, the Fund realizes a gain or losswhich is reported in the Statement of Operations.
The use of futures contracts involves, to varying degrees, elements of market and counterparty risk which may exceed
the amounts recognized in the Statement of Assets and Liabilities. Changes in the value of a futures contract may not
directly correlate with changes in the value of the underlying securities. These risks may decrease the effectiveness of the
Fund’s strategies and potentially result in a loss.
H. Segregation Transactions — The Fund may enter into certain derivative or other transactions to seek to increase totalreturn. Forward foreign currency exchange contracts, futures contracts, written options, when-issued securities and forwardcommitments represent examples of such transactions. As a result of entering into these transactions, the Fund is required tosegregate liquid assets with a current value equal to or greater than the market value of the corresponding transactions.
3 . A G R E E M E N T S
A. Management Agreement — Goldman Sachs Asset Management International (“GSAMI”), an affiliate of Goldman,Sachs & Co. (“Goldman Sachs”), serves as the investment adviser pursuant to a Management Agreement (the “Agreement”)with the Trust on behalf of the Fund. Under the Agreement, GSAMI manages the Fund subject to the general supervision ofthe Trust’s Board of Trustees.
As compensation for the services rendered pursuant to the Agreement, the assumption of the expenses related thereto
and administering the Fund’s business affairs, including providing facilities, GSAMI is entitled to a fee (“Management fee”)
computed daily and payable monthly, equal to an annual percentage rate of the Fund’s average daily net assets.
For the year ended December 31, 2007, GSAMI received a Management fee on a contractual basis at the following
annual rate:
Up to$1 billion
Next$1 billion
Over$2 billion
EffectiveRate
Contractual Management Rate
1.00% 0.90% 0.86% 1.00%
B. Distribution Agreement and Service Plan — The Trust has adopted, on behalf of Service Shares of the Fund, aDistribution and Service Plan (the “Plan”). Under the Plan, Goldman Sachs and/or authorized dealers are entitled to amonthly fee for distribution services equal to, on an annual basis, 0.25% of the Fund’s average daily net assets attributableto Service Shares. Goldman Sachs has voluntarily agreed to waive Distribution and Service fees for Service Shares so as notto exceed 0.02% of the Fund’s average daily net assets attributable to Service Shares. These waivers may be modified orterminated at any time at the option of Goldman Sachs. For the year ended December 31, 2007, Goldman Sachs waivedapproximately $561,700 in Distribution and Service fees for the Fund’s Service Shares.
C. Transfer Agency Agreement — Goldman Sachs also serves as the Transfer Agent of the Fund for a fee. The feescharged for such Transfer Agency services are calculated daily and payable monthly equal to an annual rate of 0.02% forthe average daily net assets of the Institutional and Service Shares.
G O L D M A N S A C H S VA R I A B L E I N S U R A N C E T R U S T S T R AT E G I C I N T E R N AT I O N A L E Q U I T Y F U N D
15

3 . A G R E E M E N T S ( c o n t i n u e d )
Prior to July 2, 2007, this fee as a percentage of the average daily net assets was 0.04% for the Institutional and Service
Shares.
D. Other Agreements — GSAMI has voluntarily agreed to limit certain “Other Expenses” (excluding Management fees,Distribution and Service fees, Transfer Agency fees and expenses, taxes, interest, brokerage fees and litigation, indemnifi-cation cost, shareholder proxy meeting and other extraordinary expenses exclusive of any custody and transfer agent feecredit reductions) to the extent that such expenses exceed, on an annual basis, 0.164% of the average daily net assets of theFund. Such expense reimbursements, if any, are computed daily and paid monthly. In addition, the Fund is not obligated toreimburse GSAMI for prior fiscal year expense reimbursements, if any. For the year ended December 31, 2007, GSAMImade no reimbursements to the Fund.
In connection with the reorganization of the Allmerica Fund into the Fund, GSAMI had contractually agreed to
reimburse the Fund as necessary to limit the total annual operating expenses of the Services Shares of the Fund to an annual
rate of 1.22% until July 2007.
In addition, the Fund has entered into certain offset arrangements with the custodian and transfer agent resulting in a
reduction in the Fund’s expenses. For the year ended December 31, 2007, custody and transfer agent fees were reduced by
approximately $100 and $18,400, respectively.
At December 31, 2007, the amounts owed to affiliates were approximately $305,700, $3,800 and $6,200 for
Management, Distribution and Service, and Transfer Agent fees, respectively.
4 . P O R T F O L I O S E C U R I T I E S T R A N S A C T I O N S
The cost of purchases and proceeds from sales and maturities of long-term securities for the year ended December 31, 2007,were $496,211,474 and $555,643,045, respectively. For the year ended December 31, 2007, Goldman Sachs earnedapproximately $4,800 of brokerage commissions from portfolio transactions, including futures transactions executed withGoldman Sachs as the Futures Commission Merchant, on behalf of the Fund.
5 . S E C U R I T I E S L E N D I N G
Pursuant to exemptive relief granted by the Securities and Exchange Commission (“SEC”) and the terms and conditions containedtherein, the Fund may lend its securities through a securities lending agent, Boston Global Advisers (“BGA”) — a wholly ownedsubsidiary of Goldman Sachs, to certain qualified borrowers including Goldman Sachs and affiliates. In accordance with theFund’s securities lending procedures, the loans are collateralized at all times with cash and/or securities with a market value atleast equal to the securities on loan. The market value of the loaned securities is determined at the close of business of the Fund,at their last sale price or official closing price on the principal exchange or system on which they are traded, and any additionalrequired collateral is delivered to the Fund on the next business day. As with other extensions of credit, the Fund bears the risk ofdelay on recovery or loss of rights in the collateral should the borrower of the securities fail financially.
The Fund invests the cash collateral received in connection with securities lending transactions in the Enhanced
Portfolio of Boston Global Investment Trust (“Enhanced Portfolio”), a Delaware statutory trust. The Enhanced Portfolio is
exempt from registration under Section 3(c)(7) of the Act and is managed by Goldman Sachs Asset Management (“GSAM”),
for which GSAM receives an investment advisory fee of up to 0.10% of the average daily net assets of the Enhanced
Portfolio. The Enhanced Portfolio invests in high quality money market instruments. The Fund bears the risk of incurring a
loss from the investment of cash collateral due to either credit or market factors.
Both the Fund and BGA receive compensation relating to the lending of the Fund’s securities. The amount earned by
the Fund for the year ended December 31, 2007 is reported parenthetically under Investment Income on the Statement of
Operations. A portion of this amount, $2,327, represents compensation earned by the Fund from lending its securities to
Goldman Sachs. For the year ended December 31, 2007, BGA earned $51,637 in fees as securities lending agent.
G O L D M A N S A C H S VA R I A B L E I N S U R A N C E T R U S T S T R AT E G I C I N T E R N AT I O N A L E Q U I T Y F U N D
16
Notes to Financial Statements (continued)December 31, 2007

6 . L I N E O F C R E D I T F A C I L I T Y
The Fund participates in a $450,000,000 committed, unsecured revolving line of credit facility (the “facility”) together with otherregistered investment companies having management agreements with GSAMI or affiliates. Under the most restrictive arrangementunder the facility, the Fund must own securities having a market value in excess of 300% of the total bank borrowings. Thefacility is to be used solely for temporary or emergency purposes. The interest rate on borrowings is based on the federal fundsrate. This committed facility also requires a fee to be paid by the Fund based on the amount of the commitment that has not beenutilized. For the year ended December 31, 2007, the Fund did not have any borrowings under the facility.
7 . TA X I N F O R M AT I O N
The tax character of distributions paid during the fiscal years ended December 31, 2006 and December 31, 2007 was asfollows:
2006 2007
Distributions paid from:
Ordinary income $5,848,068 $ 4,800,106
Net long-term capital gains — 38,200,745
Total taxable distributions $5,848,068 $43,000,851
As of December 31, 2007, the components of accumulated earnings (losses) on a tax basis were as follows:
Undistributed ordinary income — net $ 9,255,397
Undistributed long-term capital gains 7,561,744
Total undistributed earnings $ 16,817,141
Capital loss carryforward:(1)(2)
Expiring 2008 (2,072,911)
Expiring 2009 (2,072,911)
Expiring 2010 (6,928,702)
Expiring 2011 (609,034)
Total capital loss carryforward $(11,683,558)
Unrealized gains — net 1,279,061
Total accumulated earnings — net $ 6,412,644
(1) Expiration occurs on December 31, of the year indicated. Due to fund mergers, utilization of these losses may be limited under the Code.
(2) During the year ended December 31, 2007, the Fund utilized $14,735,560 of capital loss carryforwards.
At December 31, 2007, the Fund’s aggregate security unrealized gains and losses based on cost for U.S. federal incometax purposes were as follows:
Tax cost $380,387,936
Gross unrealized gain 20,988,492
Gross unrealized loss (19,783,605)
Net unrealized security gain $ 1,204,887
Net unrealized gain on other investments 74,174
Net unrealized gain $ 1,279,061
G O L D M A N S A C H S VA R I A B L E I N S U R A N C E T R U S T S T R AT E G I C I N T E R N AT I O N A L E Q U I T Y F U N D
17

7 . TA X I N F O R M AT I O N ( c o n t i n u e d )
The difference between book-basis and tax basis unrealized gains (losses) is attributable primarily to wash sales, net mark tomarket on foreign currency contracts and differences in tax treatment of partnership investments.
In order to present certain components of the Fund’s capital accounts on a tax basis, the Fund has reclassified $77,654
from accumulated undistributed net investment income to accumulated net realized gain on investments. This reclassification
has no impact on the net asset value of the Fund. Reclassifications result primarily from the difference in tax treatment of
foreign currency transactions.
8 . O T H E R M AT T E R S
Mergers and Reorganizations — At a meeting held on July 12, 2005, the Board of Trustees of the Trust approved theReorganization Agreement providing for the tax-free reorganization of the Allmerica Fund (“Acquired Fund”) by theStrategic International Equity Fund (“Survivor Fund”). Following the approval of the Board of Trustees and shareholders ofthe Allmerica Fund, the reorganization was completed on January 9, 2006, as of the close of business on January 6, 2006.
Pursuant to the Reorganization Agreement, the assets and liabilities of the Allmerica Fund Service Class were
transferred into the Strategic International Equity Fund Service Class in a tax-free exchange as follows:
Survivor/Acquired FundExchanged Sharesof Survivor Issued
Value ofExchanged Shares
Acquired Fund’sShares Outstanding
as of January 6,2006
Strategic International Equity Fund Service Class/Allmerica Fund Service Class 23,697,561 $301,195,995 208,893,793
The following chart shows the Survivor Fund’s and Acquired Fund’s aggregate net assets (immediately before and after
the completion of the reorganization) and the Acquired Fund’s unrealized appreciation.
Survivor/Acquired Fund
Survivor Fund’sAggregateNet Assets
before reorganization
Acquired Fund’sAggregateNet Assets
before reorganization
Survivor Fund’sAggregateNet Assets
immediatelyafter reorganization
Acquired Fund’sUnrealized
Appreciation
Acquired Fund’sCapital LossCarryforward
Strategic International Equity
Fund/Allmerica Fund $115,286,200 $301,195,995 $416,482,195 $74,115,402 $(86,962,722)
During the year ended December 31, 2006, Allmerica Financial Life Insurance and Annuity Company and First
Allmerica Financial Life Insurance Company (affiliates of the acquired fund) made voluntary contributions in the amounts
of $437,534 and $980,599, respectively, to compensate for possible adverse effects of trading activity by certain contract
holders on the Acquired Fund prior to the merger on January 9, 2006.
New Accounting Pronouncements — On September 15, 2006, the Financial Accounting Standards Board (“FASB”)released Statement of Financial Accounting Standard No. 157 “Fair Value Measurements” (“FAS 157”) which providesenhanced guidance for using fair value to measure assets and liabilities. FAS 157 requires companies to provide expandedinformation about the assets and liabilities measured at fair value and the potential effect of these fair valuations on anentity’s financial performance. FAS 157 does not expand the use of fair value in any new circumstances, but providesclarification on acceptable fair valuation methods and applications. FAS 157 is effective for financial statements issued forfiscal years beginning after November 15, 2007. GSAMI does not believe the adoption of FAS 157 will impact the amountsreported in the financials statements; however, additional disclosures will be required.
The Fund adopted Financial Accounting Standards Board (FASB) issued FASB Interpretation No. 48, “Accounting forUncertainty in Income Taxes” (FIN 48), on June 29, 2007. FIN 48 establishes financial accounting and disclosurerequirements for recognition and measurement of tax positions taken or expected to be taken on an income tax return.GSAM has reviewed the tax positions for open tax years (tax years ended December 31, 2004-2007) and has determinedthat the implementation of FIN 48 did not have a material impact on the Fund’s financial statements.
G O L D M A N S A C H S VA R I A B L E I N S U R A N C E T R U S T S T R AT E G I C I N T E R N AT I O N A L E Q U I T Y F U N D
18
Notes to Financial Statements (continued)December 31, 2007
9 . C H A N G E I N I N D E P E N D E N T R E G I S T E R E D P U B L I C A C C O U N T I N G F I R M
On December 14, 2006, the Board of Trustees of the Trust, upon the recommendation of the Board’s audit committee,approved a change of the Fund’s independent registered public accounting firm from Ernst & Young LLP toPricewaterhouseCoopers LLP. For the year ended December 31, 2006, Ernst & Young LLP’s audit reports contained noadverse opinion or disclaimer of opinion; nor were their reports qualified or modified as to uncertainty, audit scope, oraccounting principles. Further, there were no disagreements between the Fund and Ernst & Young LLP on accountingprinciples or practices, financial statement disclosure or audit scope or procedures, which if not resolved to the satisfactionof Ernst & Young LLP would have caused them to make reference to the disagreement in their reports.
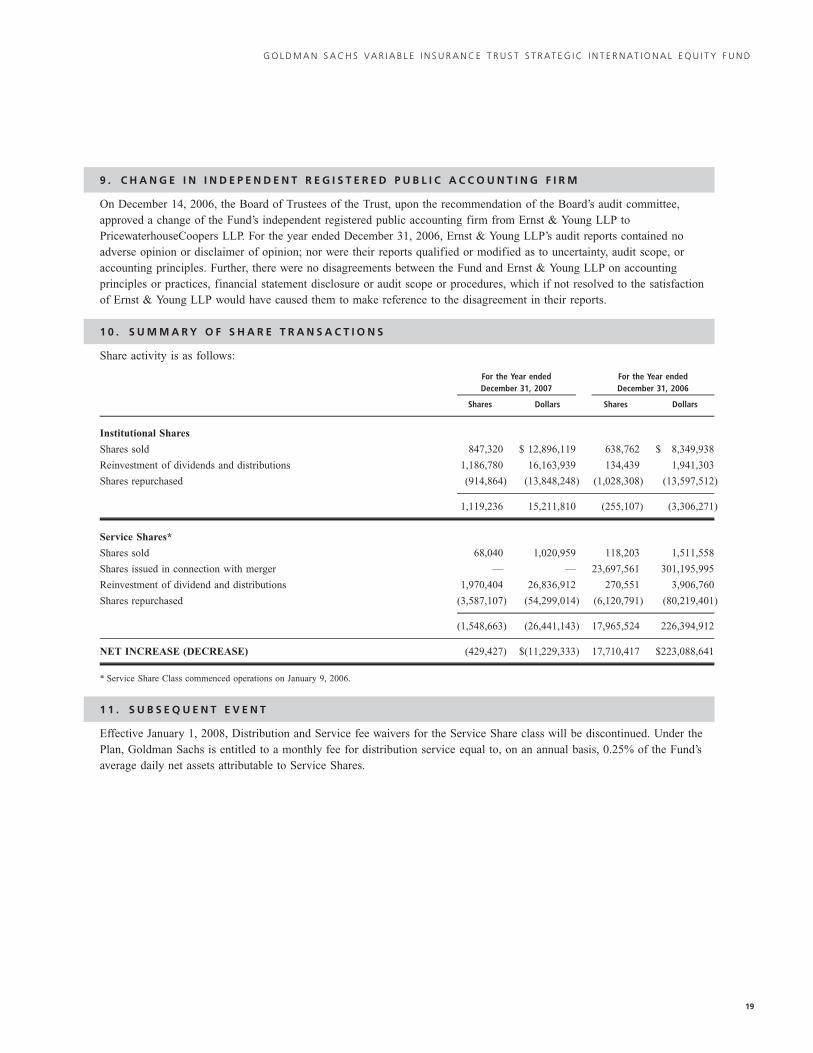
1 0 . S U M M A R Y O F S H A R E T R A N S A C T I O N S
Share activity is as follows:
Shares Dollars Shares Dollars
For the Year endedDecember 31, 2007
For the Year endedDecember 31, 2006
Institutional Shares
Shares sold 847,320 $ 12,896,119 638,762 $ 8,349,938
Reinvestment of dividends and distributions 1,186,780 16,163,939 134,439 1,941,303
Shares repurchased (914,864) (13,848,248) (1,028,308) (13,597,512)
1,119,236 15,211,810 (255,107) (3,306,271)
Service Shares*
Shares sold 68,040 1,020,959 118,203 1,511,558
Shares issued in connection with merger — — 23,697,561 301,195,995
Reinvestment of dividend and distributions 1,970,404 26,836,912 270,551 3,906,760
Shares repurchased (3,587,107) (54,299,014) (6,120,791) (80,219,401)
(1,548,663) (26,441,143) 17,965,524 226,394,912
NET INCREASE (DECREASE) (429,427) $(11,229,333) 17,710,417 $223,088,641
* Service Share Class commenced operations on January 9, 2006.
1 1 . S U B S E Q U E N T E V E N T
Effective January 1, 2008, Distribution and Service fee waivers for the Service Share class will be discontinued. Under thePlan, Goldman Sachs is entitled to a monthly fee for distribution service equal to, on an annual basis, 0.25% of the Fund’saverage daily net assets attributable to Service Shares.
G O L D M A N S A C H S VA R I A B L E I N S U R A N C E T R U S T S T R AT E G I C I N T E R N AT I O N A L E Q U I T Y F U N D
19

Report of Independent Registered PublicAccounting Firm
To the Board of Trustees and Shareholders ofGoldman Sachs Variable Insurance Trust — Strategic International Equity Fund:
In our opinion, the accompanying statement of assets and liabilities, including the schedule of investments, and the relatedstatement of operations and of changes in net assets and the financial highlights present fairly, in all material respects, thefinancial position of Goldman Sachs Variable Insurance Trust — Strategic International Equity Fund (formerly, GoldmanSachs International Equity Fund) (the “Fund”), portfolio of the Goldman Sachs Variable Insurance Trust, at December 31,2007, and the results of its operations, the changes in its net assets and the financial highlights for the period then ended, inconformity with accounting principles generally accepted in the United States of America. These financial statements andfinancial highlights (hereafter referred to as “financial statements”) are the responsibility of the Fund’s management. Ourresponsibility is to express an opinion on these financial statements based on our audit. We conducted our audit of thesefinancial statements in accordance with the standards of the Public Company Accounting Oversight Board (United States).Those standards require that we plan and perform the audit to obtain reasonable assurance about whether the financialstatements are free of material misstatement. An audit includes examining, on a test basis, evidence supporting the amountsand disclosures in the financial statements, assessing the accounting principles used and significant estimates made bymanagement, and evaluating the overall financial statement presentation. We believe that our audit, which includedconfirmation of securities at December 31, 2007 by correspondence with the custodian and brokers, provides a reasonablebasis for our opinion. The financial statements of the Fund as of December 31, 2006 and for the period then ended and thefinancial highlights for the period then ended and prior, were audited by another Independent Registered Public AccountingFirm whose report dated February 14, 2007 expressed an unqualified opinion on those statements.
PricewaterhouseCoopers LLP
Boston, MassachusettsFebruary 14, 2008
20

Fund Expenses (Unaudited) — Six Month Period Ended December 31, 2007
As a shareholder of the Institutional or Service Shares of the Fund, you incur ongoing costs, including management
fees, distribution and service (12b-1) fees (with respect to Service Shares) and other Fund expenses. This example is
intended to help you understand your ongoing costs (in dollars) of investing in the Institutional Shares and Service Shares of
the Fund and to compare these costs with the ongoing costs of investing in other mutual funds.
The example is based on an investment of $1,000 invested at the beginning of the period and held for the entire
period from July 1, 2007 through December 31, 2007.
Actual Expenses — The first line under each share class in the table below provides information about actual
account values and actual expenses. You may use the information in this line, together with the amount you invested, to
estimate the expenses that you paid over the period. Simply divide your account value by $1,000 (for example, an $8,600
account value divided by $1,000=8.6), then multiply the result by the number in the first line under the heading ‘‘Expenses
Paid” to estimate the expenses you paid on your account during this period.
Hypothetical Example for Comparison Purposes — The second line under each share class in the table below
provides information about hypothetical account values and hypothetical expenses based on the Fund’s actual expense ratio
and an assumed rate of return of 5% per year before expenses, which is not the Fund’s actual return. The hypothetical
account values and expenses may not be used to estimate the actual ending account balance or expenses you paid for the
period. You may use this information to compare the ongoing costs of investing in the Fund and other funds. To do so,
compare this 5% hypothetical example with the 5% hypothetical examples that appear in the shareholder reports of the
other funds.
Please note that the expenses shown in the table are meant to highlight your ongoing costs only. As a shareholder of
the Fund, you do not incur any transaction costs, such as sales charges (loads), redemption fees, or exchange fees, but
shareholders of other funds may incur such costs. The second line of the table is useful in comparing ongoing costs only, and
will not help you determine the relative total costs of owning different funds whose shareholders may incur transaction
costs.
Share Class
BeginningAccount Value
7/1/07
EndingAccount Value
12/31/07
Expenses Paidfor the
6 MonthsEnded
12/31/07*
InstitutionalActual $1,000.00 $1,012.50 $5.88Hypothetical 5% return 1,000.00 1,019.36+ 5.90
ServiceActual 1,000.00 1,012.20 5.98Hypothetical 5% return 1,000.00 1,019.26+ 6.01
* Expenses for each share class are calculated using the Fund’s annualized net expense ratio for each class, which represents the ongoingexpenses as a percentage of net assets for the period ended December 31, 2007. Expenses are calculated by multiplying the netannualized expense ratio by the average account value for the period; then multiplying the result by the number of days in the most recentfiscal half year and then dividing that result by the number of days in the fiscal year. Expense ratio for the most recent fiscal half yearmay differ from expense ratio based on one-year data in the financial highlights. The annualized expense ratios for the period were1.16% and 1.18% for Institutional and Service Shares, respectively.
+ Hypothetical expenses are based on the Fund’s actual annualized net expense ratios and an assumed rate of return of 5% per year beforeexpenses.
21
G O L D M A N S A C H S VA R I A B L E I N S U R A N C E T R U S T S T R AT E G I C I N T E R N AT I O N A L E Q U I T Y F U N D
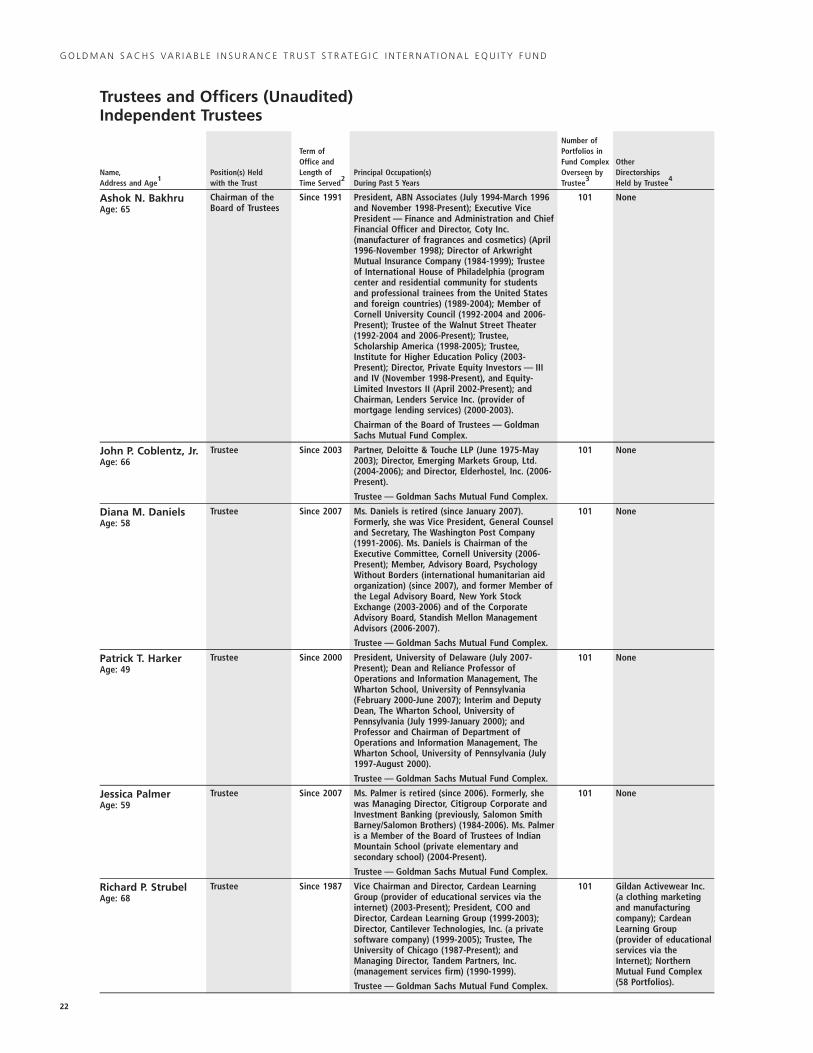
Trustees and Officers (Unaudited)Independent Trustees
Name,Address and Age1
Position(s) Heldwith the Trust
Term ofOffice andLength ofTime Served2
Principal Occupation(s)During Past 5 Years
Number ofPortfolios inFund ComplexOverseen byTrustee3
OtherDirectorshipsHeld by Trustee4
Ashok N. BakhruAge: 65
Chairman of theBoard of Trustees
Since 1991 President, ABN Associates (July 1994-March 1996and November 1998-Present); Executive VicePresident — Finance and Administration and ChiefFinancial Officer and Director, Coty Inc.(manufacturer of fragrances and cosmetics) (April1996-November 1998); Director of ArkwrightMutual Insurance Company (1984-1999); Trusteeof International House of Philadelphia (programcenter and residential community for studentsand professional trainees from the United Statesand foreign countries) (1989-2004); Member ofCornell University Council (1992-2004 and 2006-Present); Trustee of the Walnut Street Theater(1992-2004 and 2006-Present); Trustee,Scholarship America (1998-2005); Trustee,Institute for Higher Education Policy (2003-Present); Director, Private Equity Investors — IIIand IV (November 1998-Present), and Equity-Limited Investors II (April 2002-Present); andChairman, Lenders Service Inc. (provider ofmortgage lending services) (2000-2003).
Chairman of the Board of Trustees — GoldmanSachs Mutual Fund Complex.
101 None
John P. Coblentz, Jr.Age: 66
Trustee Since 2003 Partner, Deloitte & Touche LLP (June 1975-May2003); Director, Emerging Markets Group, Ltd.(2004-2006); and Director, Elderhostel, Inc. (2006-Present).
Trustee — Goldman Sachs Mutual Fund Complex.
101 None
Diana M. DanielsAge: 58
Trustee Since 2007 Ms. Daniels is retired (since January 2007).Formerly, she was Vice President, General Counseland Secretary, The Washington Post Company(1991-2006). Ms. Daniels is Chairman of theExecutive Committee, Cornell University (2006-Present); Member, Advisory Board, PsychologyWithout Borders (international humanitarian aidorganization) (since 2007), and former Member ofthe Legal Advisory Board, New York StockExchange (2003-2006) and of the CorporateAdvisory Board, Standish Mellon ManagementAdvisors (2006-2007).
Trustee — Goldman Sachs Mutual Fund Complex.
101 None
Patrick T. HarkerAge: 49
Trustee Since 2000 President, University of Delaware (July 2007-Present); Dean and Reliance Professor ofOperations and Information Management, TheWharton School, University of Pennsylvania(February 2000-June 2007); Interim and DeputyDean, The Wharton School, University ofPennsylvania (July 1999-January 2000); andProfessor and Chairman of Department ofOperations and Information Management, TheWharton School, University of Pennsylvania (July1997-August 2000).
Trustee — Goldman Sachs Mutual Fund Complex.
101 None
Jessica PalmerAge: 59
Trustee Since 2007 Ms. Palmer is retired (since 2006). Formerly, shewas Managing Director, Citigroup Corporate andInvestment Banking (previously, Salomon SmithBarney/Salomon Brothers) (1984-2006). Ms. Palmeris a Member of the Board of Trustees of IndianMountain School (private elementary andsecondary school) (2004-Present).
Trustee — Goldman Sachs Mutual Fund Complex.
101 None
Richard P. StrubelAge: 68
Trustee Since 1987 Vice Chairman and Director, Cardean LearningGroup (provider of educational services via theinternet) (2003-Present); President, COO andDirector, Cardean Learning Group (1999-2003);Director, Cantilever Technologies, Inc. (a privatesoftware company) (1999-2005); Trustee, TheUniversity of Chicago (1987-Present); andManaging Director, Tandem Partners, Inc.(management services firm) (1990-1999).
Trustee — Goldman Sachs Mutual Fund Complex.
101 Gildan Activewear Inc.(a clothing marketingand manufacturingcompany); CardeanLearning Group(provider of educationalservices via theInternet); NorthernMutual Fund Complex(58 Portfolios).
22
G O L D M A N S A C H S VA R I A B L E I N S U R A N C E T R U S T S T R AT E G I C I N T E R N AT I O N A L E Q U I T Y F U N D

Interested Trustees
Name,Address and Age1
Position(s) Heldwith the Trust
Term ofOffice andLength ofTime Served2
Principal Occupation(s)During Past 5 Years
Number ofPortfolios inFund ComplexOverseen byTrustee3
OtherDirectorshipsHeld by Trustee4
James A. McNamara*Age: 45
President andTrustee
Since 2007 Managing Director, Goldman Sachs (December1998-Present); Director of Institutional Fund Sales,GSAM (April 1998-December 2000); and SeniorVice President and Manager, Dreyfus InstitutionalService Corporation (January 1993-April 1998).
President — Goldman Sachs Mutual Fund Complex(November 2007-Present); Senior VicePresident — Goldman Sachs Mutual Fund Complex(May 2007-November 2007); and Vice President —Goldman Sachs Mutual Fund Complex (2001-2007).
Trustee — Goldman Sachs Mutual Fund Complex(since November 2007 and December 2002-May2004).
101 None
Alan A. Shuch*Age: 58
Trustee Since 1990 Advisory Director — GSAM (May 1999-Present);Consultant to GSAM (December 1994-May 1999);and Limited Partner, Goldman Sachs (December1994-May 1999).
Trustee — Goldman Sachs Mutual Fund Complex.
101 None
* These persons are considered to be “Interested Trustees” because they hold positions with Goldman Sachs and own securities issued by The Goldman SachsGroup, Inc. Each Interested Trustee holds comparable positions with certain other companies of which Goldman Sachs, GSAM or an affiliate thereof is theinvestment adviser, administrator and/or distributor.
1 Each Trustee may be contacted by writing to the Trustee, c/o Goldman Sachs, One New York Plaza, 37th Floor, New York, New York, 10004, Attn: Peter V.Bonanno.
2 Each Trustee holds office for an indefinite term until the earliest of: (a) the election of his or her successor; (b) the date the Trustee resigns or is removed bythe Board of Trustees or shareholders, in accordance with the Trust’s Declaration of Trust; (c) the conclusion of the first Board meeting held subsequent tothe day the Trustee attains the age of 72 years (in accordance with the current resolutions of the Board of Trustees, which may be changed by the Trusteeswithout shareholder vote); or (d) the termination of the Trust.
3 The Goldman Sachs Mutual Fund Complex consists of the Trust and Goldman Sachs Trust. As of December 31, 2007, the Trust consisted of 12 portfolios (ofwhich 11 offer shares to participating life insurance companies), and Goldman Sachs Variable Insurance Trust consisted of 89 portfolios (of which 80 offershares to the public).
4 This column includes only directorships of companies required to report to the SEC under the Securities Exchange Act of 1934 (i.e., “public companies”) orother investment companies registered under the Act.
Additional information about the Trustees is available in the Fund’s Statement of Additional Information which can be obtained from Goldman Sachs free ofcharge by calling this toll-free number (in the United States of America): 1-800-292-4726.
23
G O L D M A N S A C H S VA R I A B L E I N S U R A N C E T R U S T S T R AT E G I C I N T E R N AT I O N A L E Q U I T Y F U N D
Trustees and Officers (Unaudited) (continued)

Officers of the Trust*
Name, Address and AgePosition(s) HeldWith the Trust
Term ofOffice andLength ofTime Served
1Principal Occupation(s) During Past 5 Years
James A. McNamara32 Old SlipNew York, NY 10005Age: 45
Trustee andPresident
Since 2007 Managing Director, Goldman Sachs (December 1998-Present); Director of InstitutionalFund Sales, GSAM (April 1998-December 2000); and Senior Vice President and Manager,Dreyfus Institutional Service Corporation (January 1993-April 1998).
President — Goldman Sachs Mutual Fund Complex (November 2007-Present); Senior VicePresident — Goldman Sachs Mutual Fund Complex (May 2007-November 2007); and VicePresident — Goldman Sachs Mutual Fund Complex (2001-2007).
Trustee — Goldman Sachs Mutual Fund Complex (since November 2007 and December2002-May 2004).
John M. Perlowski32 Old SlipNew York, NY 10005Age: 43
Treasurer and SeniorVice President
Since 1997
Since 2007
Managing Director, Goldman Sachs (November 2003-Present) and Vice President, GoldmanSachs (July 1995-November 2003).
Treasurer and Senior Vice President—Goldman Sachs Mutual Fund Complex.
Peter V. BonannoOne New York PlazaNew York, NY 10004Age: 40
Secretary Since 2003 Managing Director, Goldman Sachs (December 2006-Present); Associate General Counsel,Goldman Sachs (2002-Present); Vice President, Goldman Sachs (1999-2006); and AssistantGeneral Counsel, Goldman Sachs (1999-2002).
Secretary — Goldman Sachs Mutual Fund Complex (2006-Present); and AssistantSecretary — Goldman Sachs Mutual Fund Complex (2003-2006).
1 Officers hold office at the pleasure of the Board of Trustees or until their successors are duly elected and qualified. Each officer holds comparable positionswith certain other companies of which Goldman Sachs, GSAM or an affiliate thereof is the investment adviser, administrator and/or distributor.
* Represents a partial list of officers of the Trust. Additional information about all the officers is available in the Fund’s Statement of Additional Informationwhich can be obtained from Goldman Sachs free of charge by calling this toll-free number (in the United States): 1-800-292-4726.
24
G O L D M A N S A C H S VA R I A B L E I N S U R A N C E T R U S T S T R AT E G I C I N T E R N AT I O N A L E Q U I T Y F U N D
Trustees and Officers (Unaudited) (continued)

Voting Results of Special Meeting of Shareholders (Unaudited)
A Special Meeting of Shareholders of the Goldman Sachs Variable Insurance Trust (the “Trust”) was held on August 3,2007 (the “Meeting”) for the purpose of electing nine trustees of the Trust.
At the Meeting, Ashok N. Bakhru, John P. Coblentz, Jr., Diana M. Daniels, Patrick T. Harker, Jessica Palmer, Alan A.Shuch, Richard P. Strubel, and Kaysie P. Uniacke were elected to the Trust’s Board of Trustees. The Fund has accrued andpaid its pro-rata share of the expenses associated with this shareholder proxy meeting. In electing trustees, the Trust’sshareholders voted as follows:
Trustee For Against Abstain Broker Non-Votes
Ashok N. Bakhru 620,783,093 0 15,536,351 0
John P. Coblentz, Jr. 620,832,628 0 15,486,816 0
Diana M. Daniels 620,979,985 0 15,339,459 0
Patrick T. Harker 621,209,304 0 15,110,140 0
Jessica Palmer 620,976,338 0 15,343,106 0
Alan A. Shuch 620,936,994 0 15,382,450 0
Richard P. Strubel 620,635,221 0 15,684,223 0
Kaysie P. Uniacke 620,941,738 0 15,377,706 0
Goldman Sachs Variable Insurance Trust — Tax Information (Unaudited)
Pursuant to Section 852 of the Internal Revenue Code, the Strategic International Fund designates $38,200,745, or themaximum amount allowable, as capital gain dividends paid during the year ended December 31, 2007.
For the 2007 tax year, the Strategic International Equity Fund has elected to pass through a credit for taxes paid to foreignjurisdictions. From distributions paid during the year ended December 31, 2007, the total amount of income received by theStrategic International Equity Fund from sources within foreign countries and possessions of the United States was $0.1579per share, all of which is attributable to qualified passive income. The total amount of foreign taxes paid by the Fund was$0.0201 per share. The country-by-country components of these totals, reflected as a percentage of total distributions andforeign taxes paid, are provided below.
Source of Income Source of Foreign Taxes
Australia 3.10% 0.00%Belgium 1.26% 3.98%Brazil 2.65% 1.00%France 3.28% 9.95%Germany 2.06% 5.47%Greece 1.17% 0.00%Hong Kong 2.29% 0.00%India 0.36% 0.00%Israel 0.18% 0.00%Italy 1.48% 4.48%Japan 5.83% 8.46%Korea 2.06% 2.99%Netherlands 3.14% 9.45%Norway 2.92% 1.00%Portugal 1.30% 3.98%Russia 0.45% 1.00%Singapore 0.72% 0.00%South Africa 0.63% 0.00%Spain 8.35% 25.37%Sweden 2.11% 6.47%Switzerland 5.34% 16.40%Taiwan 2.60% 0.00%United Kingdom 17.59% 0.00%United States 29.13% 0.00%
TOTAL 100.00% 100.00%
25
G O L D M A N S A C H S VA R I A B L E I N S U R A N C E T R U S T S T R AT E G I C I N T E R N AT I O N A L E Q U I T Y F U N D

TRUSTEES OFFICERSAshok N. Bakhru, ChairmanJohn P. Coblentz, Jr.Diana M. DanielsPatrick T. HarkerJames A. McNamaraJessica PalmerAlan A. ShuchRichard P. Strubel
James A. McNamara, PresidentJohn M. Perlowski, Senior Vice President and
TreasurerPeter V. Bonanno, Secretary
GOLDMAN, SACHS & CO.Distributor and Transfer Agent
GOLDMAN SACHS ASSET MANAGEMENT INTERNATIONALInvestment Adviser
Visit our Web site at www.goldmansachsfunds.com to obtain the most recent month-end returns.
The reports concerning the Fund included in this shareholder report may contain certain forward-looking statements about the factors that may affect the performance of the Fund in the future. Thesestatements are based on Fund management’s predictions and expectations concerning certain futureevents and their expected impact on the Fund, such as performance of the economy as a whole and ofspecific industry sectors, changes in the levels of interest rates, the impact of developing world events,and other factors that may influence the future performance of the Fund. Management believes theseforward-looking statements to be reasonable, although they are inherently uncertain and difficult topredict. Actual events may cause adjustments in portfolio management strategies from those currentlyexpected to be employed.
A description of the policies and procedures that the Fund uses to determine how to vote proxiesrelating to portfolio securities and information regarding how the Fund voted proxies relating toportfolio securities during the most recent 12-month period ended June 30 is available (i) withoutcharge, upon request by calling 1-800-621-2550; and (ii) on the Securities and Exchange Commission(“SEC”) Web site at http://www.sec.gov.
The Fund files its complete schedule of portfolio holdings with the SEC for the first and third quartersof each fiscal year on Form N-Q. The Fund’s Form N-Q is available on the SEC’s website athttp://www.sec.gov within 60 days after the Fund’s first and third fiscal quarters. The Fund’s Forms N-Qmay be reviewed and copied at the SEC’s Public Reference Room in Washington, D.C. and informationon the operation of the Public Reference Room may also be obtained by calling 1-800-SEC-0330.Forms N-Q may be obtained upon request and without charge by calling 1-800-621-2550.
Holdings and allocations shown may not be representative of current or future investments. Holdingsand allocations may not include the Fund’s entire investment portfolio, which may change at any time.Fund holdings should not be relied on in making investment decisions and should not be construed asresearch or investment advice regarding particular securities.
This material is not authorized for distribution to prospective investors unless preceded oraccompanied by a current Prospectus. Please consider a Fund’s objectives, risks, and charges andexpenses, and read the Prospectus carefully before investing. The Prospectus contains this andother information about the Fund.
Toll Free (in U.S.): 800-292-4726
This report is prepared for the general information of contract owners and is not an offer of shares ofthe Goldman Sachs Variable Insurance Trust: Strategic International Equity Fund.
Copyright 2008 Goldman, Sachs & Co. All rights reserved.
VITINLAR/08-4942.MF/02-08


