67
INVESTOR PRESENTATION Good revenue growth in 2017 FEBRUARY 8, 2018

INVESTOR PRESENTATION
Good revenuegrowth in 2017
FEBRUARY 8, 2018

INVESTOR PRESENTATION
FE B RUA RY 2018 INV E S T OR P RE S E NT A T ION 2
# 2-10 Kemira today
# 11-35 Latest news and financials
# 36-46 Pulp & Paper
# 47-52 Industry & Water
# 53-59 Oil & Gas
# 60-66 Appendix

SEGMENT SPLIT PRODUCTS
FE B RUA RY 2018 INV E S T OR P RE S E NT A T ION 3
GEOGRAPHIES
Kemira in briefFY2017: REVENUE EUR 2,486 MILLION, OPERATIVE EBITDA EUR 311.3 MILLION, MARGIN 12.5%
25% Bleaching
and pulping
20%
Polymers
20% Other:
e.g. defoamers,
dispersants,
and biocides
20%
Coagulants
15%
Sizing
and
strength
Revenue by product category rounded to the nearest 5%
39%
AMERICAS
1.USA
2.Canada
3.Brazil
52%
EMEA
1.Finland
2.Sweden
3.Germany
9%
APAC
1.China
2.South
Korea
3. Indonesia
59%Pulp & Paper
41%Industry & Water
CUSTOMERS
8,000 Sold-to customers
16,000 Ship-to customers
EXAMPLES OF
LARGEST CUSTOMERS
Municipalities, e.g.
Frankfurt, London, New York,
Paris, Shanghai, Singapore
#1 in
water
treatment
in NA and
Europe
#1 in shale
in NA #1 globally

REVENUE EUR million
2 229
2 137
2 373 2 363
2 486
2013 2014 2015 2016 2017
OPERATIVE EBITDAOPERATIVE EBITDA MARGINEUR million
252 253
287
303311
11.3%
11.8%12.1%
12.8%
12.5%
2013 2014 2015 2016 2017
INV E S T OR P RE S E NT A T ION 4
Delivering profitable growth
FE B RUA RY 2018

1,0681,170
1,417 1,457 1,477
130137
171195
198
2013 2014 2015 2016 2017
REVENUE ANDOPERATIVE EBITDA
REVENUE BYPRODUCT CATEGORY
INV E S T OR P RE S E NT A T ION 5
REVENUE BY CUSTOMERTYPE AND MARKET GROWTH
Pulp & Paper – market leader with solid track record
MARKET ENVIRONMENT REVENUE BY GEOGRAPHIES AND
MARKET GROWTH BY REGION
CUSTOMER EXAMPLES
35%
Americas
50%
EMEA 15% APAC
35%
Bleaching
& pulping
25%
Sizing &
strength
20%Defoamers,
dispersants,
biocides and
other process
chemicals
10%
Polymers
10% Other 40%
Pulp
20%
Printing &
writing papers
40%
Board &
tissue
-1-2%2-3%1-2%Market
growth
2-3%0-1%0-1%Market
growth
AkzoNobel (pulp) #4
BASF (paper) #2
Solenis (paper) #3
Kemira (pulp and paper) #1
Ecolab (paper) #5
Note: Revenue by industry, product and geography rounded to the nearest 5%
FE B RUA RY 2018

220227 231 228
238248
259 264
Q1 Q2 Q3 Q4 Q1 Q2 Q3 Q4
MARKET POSITION REVENUE BYPRODUCT CATEGORY
INV E S T OR P RE S E NT A T ION 6
REVENUE BY APPLICATIONTYPE AND MARKET GROWTH
Industry & Water – strong positions in chosen categories
REVENUE AND ORGANIC GROWTH
(Y-O-Y) EUR million
REVENUE BY GEOGRAPHIES AND
MARKET GROWTH BY REGION
40%
Coagulants
40%
Polymers
20%
Other
products
such as
defoamers
and biocides
2-3%5-6%2-3%
45%
Americas
50%
EMEA
5%
APAC
70%
Water treatment 10%
Other
20%
Oil & Gas
5-6%3-4%3-4%
MUNICIPAL (40%),
customer examples
Amsterdam
Barcelona
Frankfurt
London
Oslo
Paris
Stockholm
Los Angeles
Montreal
New York City
Toronto
Melbourne
Shanghai
Singapore
INDUSTRIAL (60%),
customer examples
Market share in water
treatment in Europe
and North America
Market share in
polymers used for
friction reduction
in US shale fracking
>30%30%
-7%-5% -5% 0% +6%
+9%
2016 2017
+15%
Note: Revenue by industry, product and geography rounded to the nearest 5%
Market
growth
Market
growth
CUSTOMER EXAMPLES
FE B RUA RY 2018
+20%

Targets:
Above-the-market
growth and operative
EBITDA of 14-16%
Our targets and actions for profitable growth
FE B RUA RY 2018 INV E S T OR P RE S E NT A T ION 7
ORGANIC GROWTH
• Investments in capacity
expansion
• Seize opportunities in growth
pockets
• Shale oil & gas business
• CEOR and oil sands
• Digitalization
• APAC
• R&D, new products
ACQUISITIONS
Very selective approach
• Strategic and synergistic fit
• Accretive to profitability
• Reasonable valuation
EFFICIENCY
• Manufacturing footprint and
utilization optimization
• BOOST – Operational excellence
• Organizational efficiencies
with new structure
• Complexity reduction
• Efficient processes
OPERATING COST
DISCIPLINE
Prudent cost culture

2015 2016 2017 Pulp &Paper
Group Pulp &Paper
Pulp &Paper
Group Industry &Water
Industry &Water
Industry &Water
Volatility &inflation
Mid- to long-term target
Our key actions to improve margins
INV E S T OR P RE S E NT A T ION 8
12.5%
Operative EBITDA
margin 14-16%
New
bleaching
capacity in
Finland
Optimization
of operations:
majority of
savings in
logistics
Oil sandsChemical
Enhanced
Oil Recovery
12.1% New
two segment
structure
12.8%
Estimated end of 2017 run-rate 100% 100% 75% 0% Low 25% Low Low
Full run-rate by EO 2017 EO 2017 2018 2019 1-2 yrs 2-3 yrs 2-5 yrs 3-5 yrs
AkzoNobel’s
paper
chemicals
Advanced
Water
Treatment
Volatility and
inflation
FE B RUA RY 2018
Acquisition
in China

Expansion of
pulp chemicals,
Oulu (FI)
Progress in profitable growth
INV E S T OR P RE S E NT A T ION 9
AcquisitionOpening / expansion of site Operational efficiencies
Opening of Tarragona
coagulant site (ES)
Acquisition BASF
AKD emulsion business
Opening of EMEA
service center
Expansion of dry
and emulsion
polyacrylamide
(US)
Opening of
Nanjing (CN)
site
Closure of
Longview (US)
AkzoNobel’s
paper chemicals
acquisition
Acquisition of Soto
Industries (US)
Closure of
Soave (IT)
Start-up of Ortigueira
(BR) sodium chlorate site
and announcement of
Joutseno (FI) expansion
Acquisition
of Polymer
Services (US)
Botlek (NL)
modernization
BOOST operational
excellence program
launch
Bradford (UK)
expansion
San Giorgio (IT)
expansion
Closures of Ottawa (CA)
and Zaramillo (ES)
Closure of site
Q416
Transportation
agreement with
Odyssey
Q117
Odyssey go-live
in North America
Two segment
structure
operational
Start-up of Joutseno
(FI) chlorate expansion
Announcement
of acquisition
via JV in China
Q114
Q217
Q314
Q414
Q115
Q215
Q415
Q116
Q214
Q317
Q216
11.3%2013 operative
EBITDA
12.5%2017 operative
EBITDA
Q315
Q316
FE B RUA RY 2018
Q417

Market expected to show healthy growth
Long-term drivers for growth, including:
• E-commerce drives the need for packaging material
• Growing middle class, increased standards of living and urbanization leads to higher usage of water, energy, tissue, and board
• Recycling and use of renewables leads to e.g. higher usage of strength chemicals
• Replacement of plastics with biodegradable products
• Regulation increases water treatment
• Scarcity of resources accelerates need to produce more with less
Challenges
• Risks to global GDP growth
• Decline in demand for printing and writing paper demand
• Regulatory changes 2017 2022
FE B RUA RY 2018 INV E S T OR P RE S E NT A T ION 10
MARKET GROWTH BY BUSINESS AREAS:PULP & PAPER 1%, WATER TREATMENT 2-3%, OIL & GAS 5-6% P.A.
~20
~23
APAC
Relevant target market (EUR billion)
Management estimation based on various sources
EMEA
Americas
+ 3%
CAGR
2017-
2022
2-3%
2-3%
3-4%

INVESTOR PRESENTATION
FE B RUA RY 2018 INV E S T OR P RE S E NT A T ION 11
Latest news andfinancials

2017 was tail-weighted as expected
Selected highlights in 2017
• Re-organization completed without disruptions to business
• Strong recovery in oil & gas
• Healthy volume growth in pulp & paper and water treatment
• Sales prices started to offset increasing raw material costs in H2
• Major projects executed
– Acquisition synergy program completed
– Sourcing of logistics with Odyssey commenced
– Start-up of new chlorate capacity in Finland
• CEOR investment for higher demand
Challenges faced in 2017
• Raw material availability and price increasesin certain areas
• Disruptions due to hurricanes Harvey and Irma as well as force majeure by Venator
• EUR/USD swiftly from 1.05 to 1.20
FE B RUA RY 2018 INV E S T OR P RE S E NT A T ION 12
TARGETS:
Above-the-market
growth and operative
EBITDA of 14-16%
ACQUISITIONS ORGANIC GROWTH
OPERATING
COST DISCIPLINE EFFICIENCY

Key financial highlights
FY 2017
• Organic growth +6% driven by volumes
• Operative EBITDA increased according to outlook
– H1 EUR 6 million below prior year, margin 11.9%
– H2 EUR 14 million above prior year, margin 13.1%
• EPS impacted negatively by EUR 12.7 million settlement and prior year EPS includes gainon sale of electricity assets
• Board of Directors proposes a dividend ofEUR 0.53 per share
EUR million
(except ratios)
FY
2017
FY
2016
Δ%
Revenue 2,486 2,363 +5
Operative EBITDA 311.3 302.5 +3
of which margin, % 12.5 12.8 -
Operative EBIT 170.3 170.1 0
of which margin, % 6.9 7.2 -
Net profit 85.2 97.9 -13
EPS, EUR 0.52 0.60 -13
Dividend per share,
proposal by the BoD, EUR 0.53 0.53 0
FE B RUA RY 2018 INV E S T OR P RE S E NT A T ION 13
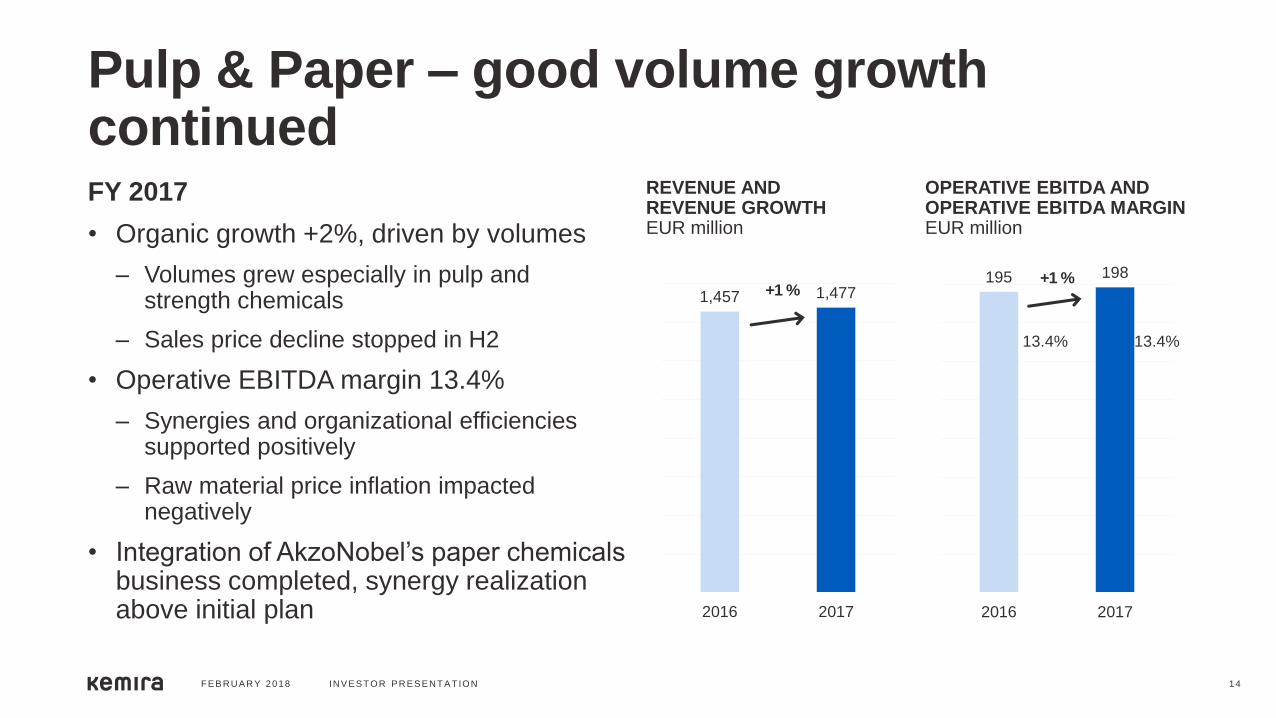
Pulp & Paper – good volume growth continuedFY 2017
• Organic growth +2%, driven by volumes
– Volumes grew especially in pulp andstrength chemicals
– Sales price decline stopped in H2
• Operative EBITDA margin 13.4%
– Synergies and organizational efficiencies supported positively
– Raw material price inflation impacted negatively
• Integration of AkzoNobel’s paper chemicals business completed, synergy realization above initial plan
FE B RUA RY 2018 INV E S T OR P RE S E NT A T ION 14
1,457 1,477
2016 2017
195 198
2016 2017
REVENUE ANDREVENUE GROWTHEUR million
OPERATIVE EBITDA AND OPERATIVE EBITDA MARGINEUR million
+1 %+1 %
13.4% 13.4%

Industry & Water – growth driven by Oil & Gas recoveryFY 2017
• Strong revenue growth as North American oil & gas market recovered
– Oil & Gas revenue +56% to EUR 197 million
– Especially good demand for polymers used in shale oil & gas industry
– Demand for water treatment continued to increase, growth in coagulants +4%
• Operative EBITDA margin declined due to higher raw material prices as well as diluting revenue related to equipment sale and field trial
FE B RUA RY 2018 INV E S T OR P RE S E NT A T ION 15
906
1,009
2016 2017
107114
2016 2017
REVENUE ANDREVENUE GROWTHEUR million
OPERATIVE EBITDA AND OPERATIVE EBITDA MARGINEUR million
+11% +6%
11.8%11.3%

Major actions to support profitability in 2018-2019
• Full contribution of new chlorate capacity in Finland
• Efficiencies from two segment structure
• BOOST program, e.g. transportation costs
• Acquisition / joint venture in China: closing expected in H1 and ramp-up in H2/18
• Focus to improve or reduce currently margin-dilutive businesses
Uncertainties
• Raw material availability and prices
• Regulatory changes, e.g. China
• Currencies
OPERATIVE EBITDAEUR million
287
303311
2015 2016 2017
FE B RUA RY 2018 INV E S T OR P RE S E NT A T ION 16
Drivers for profitability improvement2018 OUTLOOK: KEMIRA EXPECTS ITS OPERATIVE EBITDA TO INCREASE FROM THE PRIOR YEAR

Outlook for 2018
Kemira expects its operative EBITDA to increase from the prior year(2017: EUR 311.3 million).
FE B RUA RY 2018 INV E S T OR P RE S E NT A T ION 17
EUR
million
2013 2014 2015 2016 2017 2018
outlook
Operative
EBITDA
252 253 287 303 311 ”Increase”
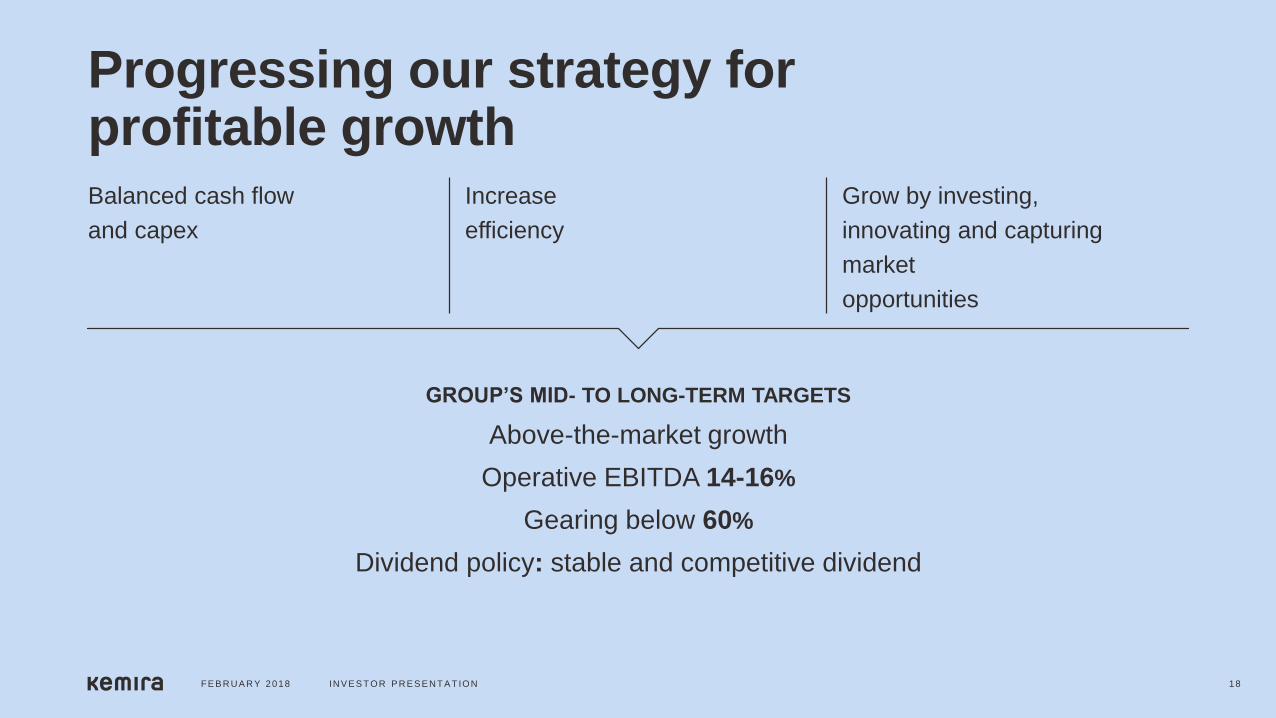
Progressing our strategy forprofitable growth
FE B RUA RY 2018 INV E S T OR P RE S E NT A T ION 18
GROUP’S MID- TO LONG-TERM TARGETS
Above-the-market growth
Operative EBITDA 14-16%
Gearing below 60%
Dividend policy: stable and competitive dividend
Balanced cash flow
and capex
Increase
efficiency
Grow by investing,
innovating and capturing
market
opportunities

Group’s organic revenue growth continued
• Group’s organic growth +11%
– Pulp & Paper +5%
– Industry & Water +20%
• Operative EBITDA margin 12.7%, +100 bps compared to prior year
– Sales prices and volumes main drivers, variable costs and FX were headwinds
596+9% -4% 0% 637
Q4 2016 Salesvolumes
Salesprices
Currencyimpact
Acquisitions Q4 2017
+2% 72.878.9 80.8
70.0 69.077.1
84,5 80,7
12.5% 13.4% 13.6%11.7% 11.3%
12.5%13,6% 12,7%
0
20
40
60
80
Q1 Q2 Q3 Q4 Q1 Q2 Q3 Q4
2016 2017
FE B RUA RY 2018 INV E S T OR P RE S E NT A T ION 19
Q4 2017
Revenue and revenue growthEUR million
Operative EBITDA and operative EBITDA marginEUR million

Pulp & Paper – strong results in Q4
• Volume growth +4%, helped by recent chlorate capacity start-up in Finland and shutdown at major customer mill in comparison period
• Record-high profitability driven by volumes, lower fixed costs, higher utilization rates, and other positive items during the quarter
FE B RUA RY 2018 INV E S T OR P RE S E NT A T ION 20
Revenue and organic revenue growth (y-on-y)EUR million
Operative EBITDA and operative EBITDA margin trendEUR million
362 361 365 369 372 369 363 373
0
100
200
300
400
Q1 Q2 Q3 Q4 Q1 Q2 Q3 Q4
2016 2017
47,9 49,3 51,846,3 46,0 47,8 48,5
55,4
13,2% 13,7% 14,2%12,6% 12,4% 13,0% 13,4%
14,9%
0
20
40
60
80
Q1 Q2 Q3 Q4 Q1 Q2 Q3 Q4
2016 2017
+3% +1% -4% -2% 0% +1% +2% +5%

Industry & Water – good growth continued
• Growth rate exceptionally high, Oil & Gas +54% being the main factor in Q4 2017
– Also water treatment continued on good growth path, high-single digit growth in coagulants
• Profitability impacted due to higher raw material prices and margin-dilutive equipment sale as well as certain manufacturing related items
• Q4 profitability is typically weaker due to seasonality
FE B RUA RY 2018 INV E S T OR P RE S E NT A T ION 21
Revenue and organic revenue growth (y-on-y)EUR million
Operative EBITDA and operative EBITDA margin trendEUR million
24.929.6 29,0
23.7 22.929.3
36,025,3
11,3%13,1% 12,5%
10,4% 9,6%11,8%
13,9%
9,6%
0
20
40
60
80
Q1 Q2 Q3 Q4 Q1 Q2 Q3 Q4
2016 2017
220 227 231 228 238 248 259 264
0
100
200
300
Q1 Q2 Q3 Q4 Q1 Q2 Q3 Q4
2016 2017
-7% -5% 0% +9% +15%-5% +6% +20%

SALES PRICE VS VARIABLE COST TREND
-200
-150
-100
-50
0
50
100
150
200
2008 2009 2010 2011 2012 2013 2014 2015 2016 2017
Brent oil, USD Sales prices* Variable costs*
SALES PRICES AND VARIABLE COSTS ONEBITDA LEVEL (CHANGE Y-O-Y)
9
5
-3-10
-16 -20
-10
-2-9
-18
-26-23
-16
-4
3
11
-18
-23
-23-13
0
1613 13
-30
-20
-10
0
10
20
Q1 Q2 Q3 Q4 Q1 Q2 Q3 Q4
2016 2017
Net impact on EBITDA (sales prices-variable costs)
Sales prices
Variable costs
FE B RUA RY 2018 INV E S T OR P RE S E NT A T ION 22
Gap between variable costs and sales prices narrowing
* 12-month rolling change vs previous year in EUR million

54% 54%
59%
2015 2016 2017
Development of selected key figures
• Net debt EUR 694 million with average cost of debt 2.0% (2016: 2.1%)
• NWC ratio improved to 9.4% (10.2%)
• Reported tax rate in 2017 24.3% (23.5%)
– Going forward the US tax reform will lower income taxes for Kemira in the country, although short-term negative impact from new BEAT* provisions
FE B RUA RY 2018 INV E S T OR P RE S E NT A T ION 23
2.2
NET DEBT / OPERATIVE EBITDA AND GEARING
2.1
Net debt
634m
Net debt
694mNet debt
642m
2.2
* BEAT = Base Erosion and Anti-Abuse Tax

• New chlorate plant in Brazil and new chlorate line in Finland
• Capacity additions due to integration of acq.
• Polymer capacity in Italy and UK
50 60 59
53 58 65
78
95 66
2015 2016 2017
CAPEX guidance 160-200 MEUR in 2018
Expansion Improvement Maintenance
190
CAPITAL EXPENDITURE EXCLUDING
ACQUISITIONSEUR million and share of revenue
213
RECENT LARGEST VALUE CREATING
INVESTMENTS
CAPEX GUIDANCE
• In 2018, capital expenditure estimated to beEUR 160-200 million
– Includes capacity expansion in Oil & Gas
FE B RUA RY 2018 INV E S T OR P RE S E NT A T ION 24
182
7.7%
9.0%7.6%

Dividend proposal EUR 0.53 per share
Kemira’s dividend policy is to pay a stable and competitive dividend
Board of Directors’ proposal to the AGM a dividend of EUR 0.53 per share, totaling EUR 81 million
Kemira has paid dividend every year since listing of shares in 1994
Kemira offers attractive dividend yield
0,53 0,53 0,53 0,53 0,53 0,53 0,53
5.8% 4.5% 4.4% 5.4% 4.9% 4.4% 4.6%
2011 2012 2013 2014 2015 2016 2017
INV E S T OR P RE S E NT A T ION 25
Dividend per share Dividend yield
FE B RUA RY 2018
*
Kemira’s dividend yield calculated using the share price at year-end
*BoD proposal to the AGM 2018

VARIABLE COST SPLIT 2017EUR 1.5 billion
TOP 10 RAW MATERIALSBY SPEND
1. Sodium hydroxide
2. Acrylonitrile
3. Colloidal silica dispersion
4. Amines
5. Aluminium hydrate
6. Petroleum solvents
7. Sodium chloride (salt)
8. Acrylic ester
9. Acrylic acid
10. Fatty acid
Top 10 account for 43%of Kemira’s raw material spend
INV E S T OR P RE S E NT A T ION 26
EXPOSURE TO OIL RELATEDRAW MATERIALS
Kemira’s variable cost split and top raw materials
30%Oil & gas
related
70%Not oil
related
70%Raw materials
10%Electricity & energy
20%Logistics
FE B RUA RY 2018

NET DEBT / OPERATIVE EBITDA AND GEARING
42% 41% 42%
54% 54%59%
2012 2013 2014 2015 2016 2017
GROSS DEBT MATURITY PROFILE,END OF 2017 EUR 861 MILLION
INV E S T OR P RE S E NT A T ION 27
Debt portfolio is well diversified
1.9x2.1x 2.1x2.2x1.8x 2.2x
532m 694m456m 486m 634m642m
NET DEBT
OPERATIVE EBITDA
FE B RUA RY 2018
249m 311m252m 253m 303m287m
0
50
100
150
200
250
300
350
400
450
2018 2019 2020 2021 2022 2023 2024
Bilaterals Bonds Undrawn RCF Others
150
200196
110
205
400

Key figures and ratios – 5-year summary
EUR million (except ratios) 2013 2014 2015 2016 2017
Revenue 2,229.1 2,136.7 2,373.1 2,363.3 2,486.0
Operative EBITDA 251.9 252.9 287.3 302.5 311.3
of which margin 11.3% 11.8% 12.1% 12.8% 12.5%
Operative EBIT 164.2 158.3 163.1 170.1 170.3
of which margin 7.4% 7.4% 6.9% 7.2% 6.9%
Cash flow from operations 200.3 74.2 247.6 270.6 205.1
Capital expenditure, excluding acq. 133.5 140.6 181.7 212.6 190.1
Gearing at period-end 41 42 54 54 59
Inventories 170 197 207 217 224
Personnel at period-end 4,453 4,248 4,685 4,818 4,732
FE B RUA RY 2018 INV E S T OR P RE S E NT A T ION 28
* Restated figures reflect the change of IAS 19, Employee Benefits

Per share figures – 5-year summary
2013 2014 2015 2016 2017
Earnings per share, EUR -0.21 0.59 0.47 0.60 0.52
Cash flow from operating activities
per share, EUR
1.32 0.49 1.63 1.78 1.35
Equity per share, EUR 7.32 7.57 7.76 7.68 7,61
Dividend per share, EUR
(*2017 proposal to the AGM)
0.53 0.53 0.53 0.53 0.53*
Share price, EUR, end of period 12.16 9.89 10.88 12.13 11.50
Market capitalization, EUR million
(excl. treasury shares)
1,849 1,504 1,654 1,848 1,752
Number of shares, million
(excl. treasury shares)
152.0 152.1 152.1 152.4 152.4
P/E ratio - 16.7 23.3 20.1 22.3
P/CF ratio 9.2 20.2 6.7 6.8 8.5
P/B ratio 1.7 1.3 1.4 1.6 1.5
Dividend yield, % 4.4 5.4 4.9 4.4 4.6
INV E S T OR P RE S E NT A T ION 29FE B RUA RY 2018

EUR million Q4 2017 Q4 2016 Δ% 2017 2016 Δ%
Revenue 636.5 596.5 +7 2,486.0 2,363.3 +5
Operative EBITDA 80.7 70.0 +15 311.3 302.5 +3
margin 12.7% 11.7% - 12.5% 12.8% -
Operative EBIT 44.0 36.1 +22 170.3 170.1 0
margin 6.9% 6.1% - 6.9% 7.2% -
Net profit 25.8 18.2 +42 85.2 97.9 -13
Earnings per share, EUR 0.16 0.11 +45 0.52 0.60 -13
Cash flow from operations 71.4 102.4 -30 205.1 270.6 -24
Capex excl. acquisitions 64.2 89.4 -28 190.1 212.6 -11
Net debt 694 634 +10 694 634 +10
NWC ratio (year-end) 9.4% 10.2% - 9.4% 10.2% -
Operative ROCE (rolling 12 months) 9.7% 9.9% - 9.7% 9.9% -
Personnel at period-end 4,732 4,818 -2 4,732 4,818 -2
Key figures
FE B RUA RY 2018 INV E S T OR P RE S E NT A T ION 30

EUR million Q4 2017 Q4 2016 2017 2016
Net profit for the period 26 18 85 98
Total adjustments 37 50 204 187
Change in net working capital 18 48 -34 29
Finance expenses -6 -12 -25 -20
Income taxes paid -4 -2 -25 -23
Net cash gen. from operating activities 71 102 205 271
Purchases of subsidiaries and acquisit. 0 0 0 2
Capital expenditure -64 -89 -190 -213
Proceeds from sale of assets 2 0 3 37
Change in long-term loan receivables -5 0 -5 1
Cash flow after investing activities 4 13 13 98
Cash flow
FE B RUA RY 2018 INV E S T OR P RE S E NT A T ION 31

EUR million Q4 2017 Q4 2016 Δ% 2017 2016 Δ%
Revenue 372.8 368.6 +1 1,476.9 1,457.3 +1
Operative EBITDA 55.4 46.3 +20 197.7 195.3 +1
margin 14.9% 12.6% - 13.4% 13.4% -
Operative EBIT 30.9 24.5 +26 104.8 111.6 -6
margin 8.3% 6.6% - 7.1% 7.7% -
Operative ROCE*, % 9.0% 10.0% 9.0% 10.0%
Capital expenditure 41.1 56.3 -27 138.3 125.1 +11
Cash flow after investing activities 4.4 19.8 -78 15.7 105.7 -85
KEY FINANCIALS
Pulp & Paper
FE B RUA RY 2018 INV E S T OR P RE S E NT A T ION 32
*12-month rolling average
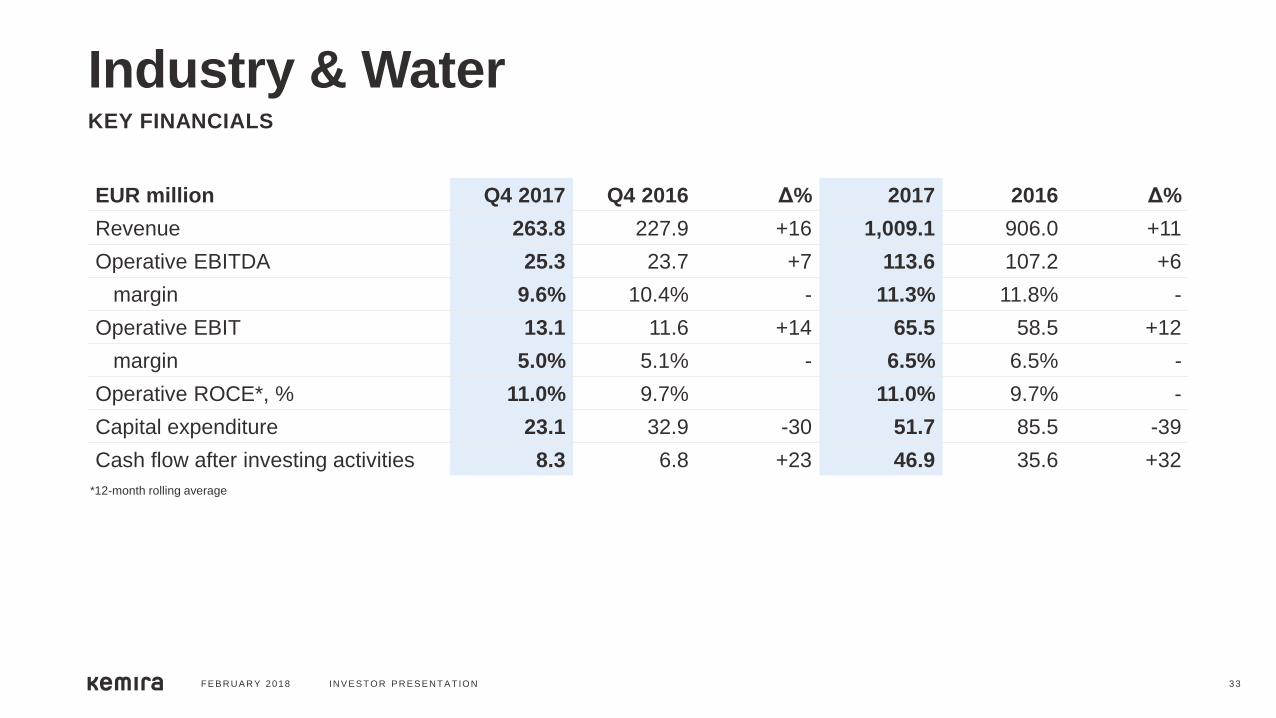
EUR million Q4 2017 Q4 2016 Δ% 2017 2016 Δ%
Revenue 263.8 227.9 +16 1,009.1 906.0 +11
Operative EBITDA 25.3 23.7 +7 113.6 107.2 +6
margin 9.6% 10.4% - 11.3% 11.8% -
Operative EBIT 13.1 11.6 +14 65.5 58.5 +12
margin 5.0% 5.1% - 6.5% 6.5% -
Operative ROCE*, % 11.0% 9.7% 11.0% 9.7% -
Capital expenditure 23.1 32.9 -30 51.7 85.5 -39
Cash flow after investing activities 8.3 6.8 +23 46.9 35.6 +32
KEY FINANCIALS
Industry & Water
FE B RUA RY 2018 INV E S T OR P RE S E NT A T ION 33
*12-month rolling average

FY 2017
Revenue split by country
FE B RUA RY 2018 INV E S T OR P RE S E NT A T ION 34
USA 27%
Canada 6%
Brazil 3%
Uruguay 2%
Other Americas 1%
Finland 14%Sweden 6%
Germany 5%
Poland 3%
UK 3%
Spain 2%
Other APAC 4%
Korea 1%China 4%
Russia 2%
Netherlands 2%
France 2%
Italy 2%
Other EMEA 9%
Norway 2%

Revenue and cost distribution per currency
Currency exchange rates had around EUR +2 million impact on the operative EBITDAin 2017.
Guidance: 10% change in our main foreign currencies would approximately haveEUR 10 million impact on operative EBITDA on an annualized basis
FE B RUA RY 2018 INV E S T OR P RE S E NT A T ION 35
42% EUR 13% Others
KEMIRA REVENUE DISTRIBUTION 2017 KEMIRA COST DISTRIBUTION 2017
3% CNY
2% BRL
5% CAD
35% USD
10% Others
4% CNY
6% CAD
8% SEK
30% USD
42% EUR

INVESTOR PRESENTATION
Pulp & Paper –driving growth as market leader
FE B RUA RY 2018 INV E S T OR P RE S E NT A T ION 36

Above-the-market
growth and operative
EBITDA of 14-16%
Our winning formula to continue growth
FE B RUA RY 2018 INV E S T OR P RE S E NT A T ION 37
INVEST IN GROWTH
AND R&D
• Capacity additions
• More than 10 new products in
2016 and 2017
IMPROVE CUSTOMER
EXPERIENCE
• TOP 50 customers are EUR 1bn
• Customer satisfaction to 98%
MAXIMIZE CAPACITY
UTILIZATION
• Bleaching ran flat out 9 years
• Paper chemicals varying
REDUCE COMPLEXITY
• Group: 240 products out in 2016
• Around 250 products out in 2017
MANAGE FIXED COSTS
• 2017 business overheads
below 2016 level
ENHANCE
PERFORMANCE CULTURE
• New mgmt. structure
• Employee engagement – 15/16
survey items improved since 2015

Board and paper production shiftingto emerging markets
FE B RUA RY 2018 INV E S T OR P RE S E NT A T ION 38
GROWTH OF
BOARD AND PAPER
PRODUCTION
BY REGION 2015-2030
55mt growth in APAC
by 2030
BIGGEST PRODUCERS
ARE:
China, USA, Japan,
Germany, India, Sweden,
Korea, Canada, Finland,
Brazil
BIGGEST GROWTH
AREAS ARE:
China, India, Indonesia,
Brazil, Russia, Vietnam
TOTAL BOARD &
PAPER PRODUCTION:
2015: 402 million tons
2030: 461 million tons
CAGR%: around 1 % / annum
Source: Pöyry
North America
2015: 82 mt
2030: 75 mt
Latin America
2015: 21 mt
2030: 31 mt
. Europe
2015: 85 mt
2030: 78 mt
Oceania
2015: 4 mt
2030: 4 mt
China
2015: 106 mt
2030: 139 mt
E. Europe
2015: 18 mt
2030: 26 mt
Africa
2015: 4 mt
2030: 6 mt
Japan
2015:26 mt
2030:21 mt
Rest of Asia
2015: 55 mt
2030: 82 mt

Strong market positions and strategic investments
FE B RUA RY 2018 INV E S T OR P RE S E NT A T ION 39
REGION MARKET POSITION GROWTH TREND GROWTH STRATEGY
EMEA
North America
APAC
South America
#1
#2/3
#1
#3
Exceptional customer
experience
Transformation from paper
to board
Continue to grow with major
players (TCM) and assess
future investments
Assess future bleaching
investments
TCM = Total Chemistry Management

Board and paper production in APAC willbe bigger than Europe and North America combined by 2020
>90% of global board and paper production growth in APAC
Kemira now #1 with close to 10% share in APAC
• Revenue doubled to aroundEUR 200 million in 3 years
Fragmented market provides good potential for profitable growth
Continue to grow revenue and market share
PULP & PAPER RELEVANT CHEMICALSMARKET 2017
FE B RUA RY 2018 INV E S T OR P RE S E NT A T ION 40
We have become market leader in APAC
EMEA
North
America
APAC
South America 2-3%
2-3%
-1-0%
0-1%
CAGR 2017-2022

Strong demand in pulp market creating growth opportunitiesNew pulp mill projects are driven byincreasing demand for board and tissue
• Food and liquid packaging board isgrowing particularly fast in Asia
• Pulp is produced close to wood sources andthen shipped to board, paper, and tissue mills
• Growth in board = 1 new pulp mill per year
Multiple pulp mill projects realised and expected in Northern Europe creating opportunities for Kemira to grow withthe market
In addition, a few large scale pulp millprojects expected in South America
FE B RUA RY 2018 INV E S T OR P RE S E NT A T ION 41
Confirmed new capacity /
debottlenecking 2016-2020
Possible new mills 2020-2022

• Kemira’s capacity in sodium chlorate was fully utilized, hence the need for additional capacity
• Capacity doubled in Joutseno with around EUR 50 million investment
• Investment realized according to budget and start-up was ahead of schedule in early September 2017
• Part of the production will be shipped to APAC to support the growth in the region
KEMIRA BLEACHING CHEMICALS REVENUE GROWTH
2014 2015 2016 2017
FE B RUA RY 2018 INV E S T OR P RE S E NT A T ION 42
Successful value creating investments –case Joutseno
+7% +10% +6% +5%
CAGR
+ 7%

Acquisition via JV in China
• Agreed to form joint venture with Tiancheng
• NewCo will produce mainly AKD wax and its key raw material fatty acid chloride (FACL)
– AKD is sizing chemical used in board and paper to createresistance against liquid absorption
– NewCo also plans to produce coagulants for water treatment
• Kemira strengthens its position and secures supply of key raw material for AKD wax
• Kemira will have 80% of NewCo
– Investment for 80% around EUR 55 million
– Closing expected in H1 2018
• Ramp-up in H2/18 after completion investments
– Good contribution to P&L in 2019 after ramp-up
FE B RUA RY 2018 INV E S T OR P RE S E NT A T ION 43

AKD WAX SUPPLIED FROM YANZHOU, CHINA TO KEMIRA SITES GLOBALLY
We leverage acquisition synergieswith our global production
FE B RUA RY 2018 INV E S T OR P RE S E NT A T ION 44
Telêmaco
Borba
Washougal
St. CatharinesHelsingborg
Joutseno
Nanjing
Hallam
Gunsan
Pasuruan
Wellgrow
Krems
TarragonaYanzhou
NewCo

Acquisition in China is excellentstrategic fitAcquired asset fulfills our key criteria for acquisitions
GROWTH – End-products in growing markets
APAC – Enables profitable growth in APAC
SUPPLY – Backward integr. & self-sufficiency (FACL)
SUSTAINABILITY – FACL from renewable raw material
LOCATION – Close to our existing production
PROFITABILITY – Accretive in 2019 after ramp-up
FE B RUA RY 2018 INV E S T OR P RE S E NT A T ION 45
END-PRODUCTSWHERE AKD WAXIS USED

Pulp & Paper
FE B RUA RY 2018 INV E S T OR P RE S E NT A T ION 46
TECHNOLOGY AND MARKET LEADER
Value chain part covered by Kemira
RAW
MATERIALSINTERMEDIATES PRODUCTS APPLICATIONS
CUSTOMER
INDUSTRIESCUSTOMERS
Electricity
Sodium chloride(salt)
Crude tall oil
Cationic monomer
Acrylonitrile
Acrylic acid
Olefins
Fatty acids
Maleic anhydride
Sulfur
Tall oil rosin
AKD Wax
Isomerized olefinsAcrylamide
Sodium chlorate
Hydrogen peroxide
Polymers
Defoamers
Coagulants
Biocides
Sizing
Strength Additives
Surface additives
Colorants
Sulfuric acid
Pulping
Bleaching
Retention
Wet-end processcontrol
WQQM
Sizing
Strength
Surface treatment
Coloring
Pulp
Packagingand board
Printingand writing
Tissue
All the major global paper and pulp producers
MAIN COMPETITORS: BASF, Akzo Nobel, Solenis, Ecolab, SNF

INVESTOR PRESENTATION
FE B RUA RY 2018 INV E S T OR P RE S E NT A T ION 47
Industry & Water -stronger platformfor profitable growth

New structure creates growth andefficiency opportunities Leveraging the full potential of new combined segment
• Full geographical reach in all regions
• Global polymer expert network
• Water treatment expertise for O&G and Mining
Structural change means faster decision making
More efficient development and roll-out of new innovations
Important part of segment’s profitability improvement
• On Group-level cost savings EUR 15-20 million
FE B RUA RY 2018 INV E S T OR P RE S E NT A T ION 48
Oil &
Mining
Municipal
& Industrial
70%Water
treatment
20%Oil & Gas
10%Other
applications
Industry
& Water

0
20
40
60
80
2015 2016
Water Treatment Oil & Gas
• Multiple initiatives ongoing to boost growth in both businesses
Profitable growth opportunities ahead...
FE B RUA RY 2018 INV E S T OR P RE S E NT A T ION 49
BUSINESS
AREA
REGION GROWTH INITIATIVES
IN 2015-2017
WATER
TREATMENT
EMEA Desalination
BioGas
Sludge dewatering
Middle East and Africa
NA Odor control
Sludge dewatering
APAC Deep sludge dewatering
OIL & GAS GLOBAL CEOR
Oil sands in Canada
REVENUE IN GROWTH
INITIATIVESEUR million
+ 65%

…fueled by strong innovation pipeline
FE B RUA RY 2018 INV E S T OR P RE S E NT A T ION 50
>20Continuous
ideas inflow
PROJECTS UNDER
EVALUATION
Enhanced Oil Recovery
PROJECTS UNDER DEVELOPMENT AND EARLY
COMMERCIALIZATION
PROJECTED 10-YR
NPV
8
EUR
650 million
Oil sands
Shale oil & gas
Solid liquid separation (incl. AWT)Sludge dewatering, nutrients recovery, mining processes
Desalination, re-use & disinfection(incl. AWT)
2
3
12
1
# OF
PROJECTS
AWT = Advanced Water Treatment

The next generation of sludge treatment will focus on customer performance and value created
KemConnect Smart Dewatering combines a complete chemicals portfolio, continuous chemistry optimizationand real-time monitoring to a new business model
ADVANCED WATER TREATMENT CASE EXAMPLE
Innovation case – KemConnect Smart Dewatering
FE B RUA RY 2018 INV E S T OR P RE S E NT A T ION 51
Dewatering Today Smart DewateringTomorrow
Disposal
Cost
KemConnect
Service Fee
Disposal
Cost
Customer
Net Savings
Chemical Cost

Industry & Water
FE B RUA RY 2018 INV E S T OR P RE S E NT A T ION 52
TECHNOLOGY AND MARKET LEADER IN WATER TREATMENT AS WELLAS IN NICHE APPLICATIONS IN OIL & GAS
MAIN COMPETITORS
Coagulants: mainly local small companies, Feralco, USALCO, Kronos, PVS,
Polymers: SNF, Solvay, Ecolab, Solenis, BASF Value chain part covered by Kemira
INTERMEDIATES PRODUCTS APPLICATIONS SALES CHANNELS CUSTOMERS
Acrylonitrile
Acrylic acid
Sulfuric acid
Hydrochloric acid
Aluminium hydrate
Iron ore
Pickling liquor
Copperas
Various monomers
Acrylamide
Cationic monomer
Polymers (EPAM, DPAM)
Al Coagulants
Fe Coagulants
Dispersants &antiscalants
Biocides
Emulsifiers
Defoamers
Formulations
Raw water & waste water treatment
Sludge treatment
Friction reduction
Enhanced oil recovery
Tailings treatment
Mining processes
Direct sales
Distributor/reseller
Service companies
RAW
MATERIALS
Municipalities
Private operators
Industrial customers
Pumpers
Oil & Gas operators
Service companies
Mine operators

INVESTOR PRESENTATION
Oil & Gas – well positioned for growth in niche areas
FE B RUA RY 2018 INV E S T OR P RE S E NT A T ION 53

Resilient business set for growth
Growing market demand with our selective market diversification assuring growth
Kemira’s offering
• Process efficiencies: polymers that reduce energy consumption by 60% in shale oil fields
• Cost reduction: higher concentrated liquids that make offshore oil recovery more cost effective (CEOR)
• Addressing environmental regulations: tailing treatment in oil sands
New innovative technologies driving expansion
FE B RUA RY 2018 INV E S T OR P RE S E NT A T ION 54
0
50
100
150
200
250
2013 2014 2015 2016 2017
REVENUE IN GROWTH INITIATIVESEUR million
REVENUE IN GROWTH INITIATIVESEUR million
25%Other
50%Shale fracking
25%Oil sands and
Chemical Enhanced
Oil Recovery Figures rounded to closest 5%
Oil
Price
+ 56%
in 2017

Our innovations make shale industrymore efficientSHALE MARKET
• Polymer market size +200M EUR and growing at double digit today
• Polymer more favorable product based on cost/performance
KEMIRA
• Provides unique chemistries, friction reducers,that reduce energy needed during hydraulic fracturing
• Volume growth over 100% in 1-9/2017
• Differentiating from competitors with innovative products
FE B RUA RY 2018 INV E S T OR P RE S E NT A T ION 55
Market shares
in polymers used
for fracking
#1 market
position with
over 30%
market share
KEMIRA
Others
Competitor B
Competitor C
Competitor A

Long-term growth potential in CEOR
CHEMICAL ENHANCEDOIL RECOVERY MARKET
• CEOR market sizeEUR 1bn of whichEUR 500 million accessible to Kemira
• Market growth estimatedto be 5% driven by decline of production from existing fields
KEMIRA
• Kemira’s MaxXtract solution tailored specifically to customer needs, incorporating chemistry, equipment and services
• Kemira’s knowhow in polymers helps oil producers
• Potential for > EUR 100 million revenue in 5 years
FE B RUA RY 2018 INV E S T OR P RE S E NT A T ION 56
Substantial long-term growth
potential within existing
CEOR projects and
through new projects

Growth in CEOR supported by approximately EUR 30 million investment• We will expand our polymer capacity for Chemical
Enhanced Oil Recovery within Oil & Gas business
• After prudent development in R&D and successful field trials, the investment will be done on the basis of anticipated uptake in customer demand
• Additional capacity will be built to Kemira’s existing manufacturing site at Botlek, Netherlands
• New capacity is expected to be in commercial operation by the beginning of 2019
• Investment is part of earlier announcedEUR 160-200 million capital expenditure for 2018
FE B RUA RY 2018 INV E S T OR P RE S E NT A T ION 57

Oil sands has grown from 0 to aboveEUR 30m in 3 yearsOIL SANDS MARKET
• Market size is aroundEUR 400 million
• Projects are capex-heavybut developed projects are considered as sunken costs
KEMIRA
Offers total solutions to reduce environmental concerns
Customer base expanding
Revenue has grown to above EUR 30 million in 3 years
Target to more than double current revenues in 2-3 years
FE B RUA RY 2018 INV E S T OR P RE S E NT A T ION 58
Companies
operating in oil
sands market (examples)

Oil & Gas well positioned for growthin niche areas
FE B RUA RY 2018 INV E S T OR P RE S E NT A T ION 59
Diversification –
EUR 200 million
Growing in shale,
oil sands and CEOR
Bigger and
better
Strong player in three
core areas (shale,
oil sands, CEOR),
including service
capabilities
Oil & Mining Industry & Water:
Global Oil and Gas
2009
PHASE I
2017
PHASE II
2022
PHASE III
New business –
EUR 30 million
Niche position in
niche market

INVESTOR PRESENTATION
Appendix
FE B RUA RY 2018 INV E S T OR P RE S E NT A T ION 60

SHAREHOLDERS ON JANUARY 31, 2018
% OF SHARES
1. Oras Invest 18.2%
2. Solidium (owned by State of Finland) 16.7%
3. Varma Mutual Pension Insurance Company 3.4%
4. Ilmarinen Mutual Pension Insurance Comp. 2.1%
5. Kemira Oyj 1.9%
Total number of shares 155,342,557
Foreign ownership of shares 26.0%
Total number of shareholders 35,542
KEMIRA BOARD OF DIRECTORS
FE B RUA RY 2018 INV E S T OR P RE S E NT A T ION 61
Kemira – largest shareholders andBoard of Directors
JARI PAASIKIVI
Chairman
Member since 2012
Oras Invest Oy, CEO
KERTTU
TUOMAS
Vice Chairman
Member
since 2010
WOLFGANG
BÜCHELE
Member in
2009-2012 and
since 2014
KAISA
HIETALA
Member
since 2016
TIMO
LAPPALAINEN
Member since
2014
SHIRLEY
CUNNINGHAM
Member
since 2017

Kemira’s Management Board
FE B RUA RY 2018 INV E S T OR P RE S E NT A T ION 62
Jukka Hakkila, Chief Legal Officer, acts as secretary of Management Board and Board of Directors
PRESIDENT AND CEO
Jari Rosendal
PULP & PAPER
Kim Poulsen
OPERATIONAL
EXCELLENCE
Esa-Matti Puputti
INDUSTRY & WATER
Antti Salminen
CFO
Petri CastrénHUMAN RESOURCES
Eeva SalonenCTO
Matthew R. Pixton
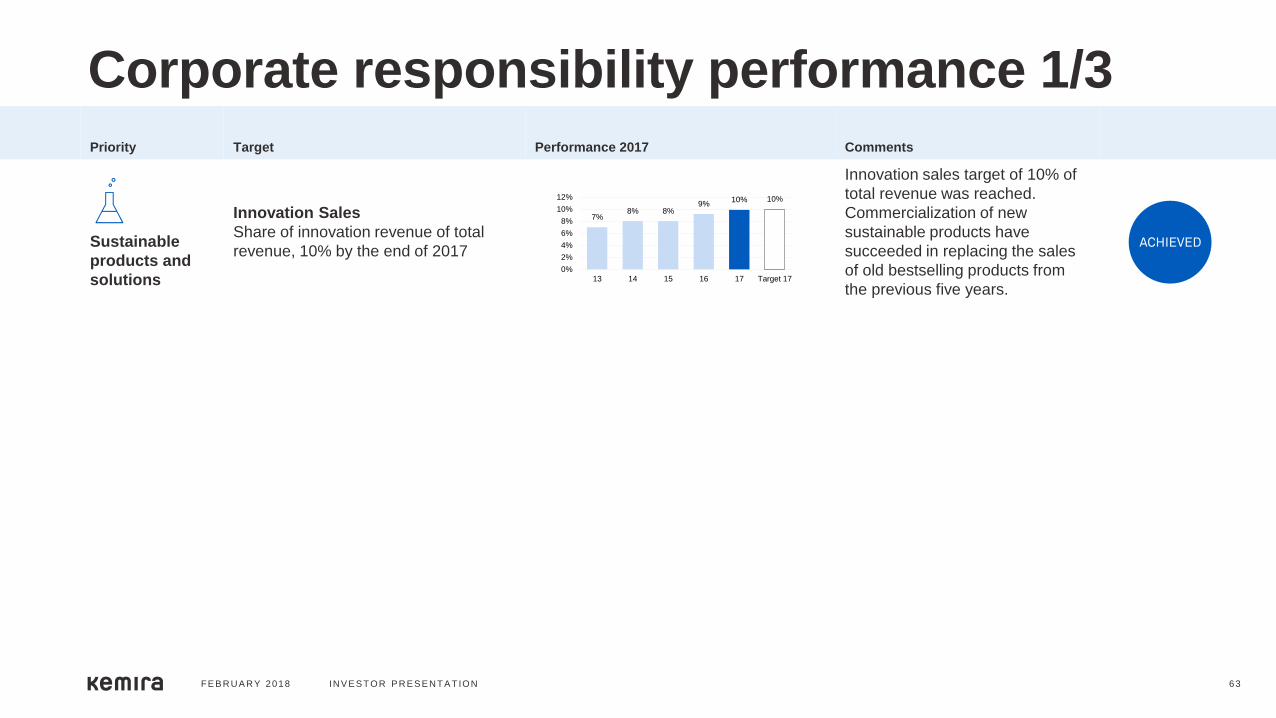
Corporate responsibility performance 1/3
FE B RUA RY 2018 INV E S T OR P RE S E NT A T ION 63
Priority Target Performance 2017 Comments
Sustainable
products and
solutions
Innovation Sales
Share of innovation revenue of total
revenue, 10% by the end of 2017
Innovation sales target of 10% of
total revenue was reached.
Commercialization of new
sustainable products have
succeeded in replacing the sales
of old bestselling products from
the previous five years.
7%8% 8%
9%10% 10%
0%
2%
4%
6%
8%
10%
12%
13 14 15 16 17 Target 17

FE B RUA RY 2018 INV E S T OR P RE S E NT A T ION 64
Priority Target Performance 2017 Comments
Responsible
operations and
supply chain
Climate change
Kemira Carbon Index ≤ 80
by end of 2020 (2012 = 100)
Slight decrease in carbon index
compared to 2016, due to
increased use of carbon neutral
energy sources and continuous
implementation of energy
efficiency projects.
People Safety
Achieve zero injuries on long term;
TRIF* 2.0 by end of 2020
In 2017, TRIF increased to 3.9
(3.4). The increase in incidents
were related to contracted work at
our premises. Also the severity of
incidents increased, including 3
permanent disabilities.
Supplier Management
5 sustainability audits for highest risk**
suppliers every year during 2016–2020,
average, cumulative target 25 by 2020
Four SMETA (Sedex Members
Ethical Trade Audit) audits in
collaboration with an external
service provider was conducted
with no business stopping results.
Majority of the corrective actions
were related to health and safety
and labor practices.
* TRIF = Number of Total Recordable Injury Frequency per million hours, Kemira + contractor
** Suppliers with lowest sustainability assessment score
10088 91 92 86 85 80
0
20
40
60
80
100
120
12 13 14 15 16 17 Target20
5,8
7,2
3,43,9
2,0
0,0
2,0
4,0
6,0
8,0
14 15 16 17 18 19 Target20
4
8
25
0
5
10
15
20
25
30
2016 2017 Target 2020
Corporate responsibility performance 2/3

FE B RUA RY 2018 INV E S T OR P RE S E NT A T ION 65
Priority Target Performance 2017 Comments
People and
integrity
Employee engagement index based
on Voices@Kemira biennial survey
The index at or above the external
industry norm Participation rate in
Voices@Kemira 75% or above
Due to the reorganization, the
biennial employee engagement
survey was postponed from
autumn 2017 until spring 2018, to
give managers at least six months
with their new teams before
engaging in the survey.
Leadership development activities
provided, average
Two (2) leadership development
activities per people manager position
during 2016–2020, cumulative target
1,500 by 2020
Steady rate of participation in both
internal and external leadership
development activities continued
in 2017 at 542 and actual
cumulative total so far 1,036. The
activities also included on-the-job
learning opportunities in corporate
development projects.
494
1 036
1 500
0
500
1000
1500
2000
2016 2017 Target 2020
58%67%
75%85%
0%
50%
100%
2013 2015 2017
Engagement Participation
Corporate responsibility performance 3/3

Important information about financial figuresKemira provides certain financial performance measures (alternative performance measures) on non-GAAP basis. Kemira believes that alternative performance measures, such as organic growth*, EBITDA, operative EBITDA, cash flow after investing activities, and gearing followed by capital markets and Kemira management, provide useful information of its comparable business performance and financial position. Selected alternative performance measures are also used as performance criteria in remuneration.
Kemira’s alternative performance measures should not be viewed in isolation to the equivalent IFRS measures and alternative performance measures should be read in conjunction with the most directly comparable IFRS measures. Definitions of the alternative performance measures can be found in the Definitions of the key figures in this report, as well as at www.kemira.com > Investors > Financial information.
All the figures in this interim report have been individually rounded and consequently the sum of individual figures may deviate slightly from the sum figure presented.
* Revenue growth in local currencies, excluding acquisitions and divestments
FE B RUA RY 8 , 2018 FY 2017 RE S ULT S 66


