Goodman Australia Finance Pty Limited (ACN 127 959 951) Announcement to Singapore Exchange Goodman Group Goodman Limited | ABN 69 000 123 071 Goodman Funds Management Limited | ABN 48 067 796 641 | AFSL Number 223621 as responsible entity of Goodman Industrial Trust | ARSN 091213 839 Level 17, 60 Castlereagh Street, Sydney NSW 2000 | GPO Box 4703, Sydney NSW 2001 Australia Tel +61 2 9230 7400 | Fax +61 2 9230 7444 Goodman Logistics (HK) Limited 嘉民物流(香港)有限公司 | Company No. 1700359 | ARBN 155 911 149 a Hong Kong company with limited liability Suite 901, Three Pacific Place, 1 Queen’s Road East, Hong Kong | Tel +852 2249 3100 | Fax +852 2525 2070 info- [email protected]| www.goodman.com 23 August 2019 JPY12,500,000,000 3.32% NOTES DUE APRIL 2023 EURO500,000,000 1.375% NOTES DUE SEPTEMBER 2025 ANNOUNCEMENT OF GOODMAN GROUP RESULTS FOR THE FULL YEAR ENDED 30 JUNE 2019 – PART 1 We attach the consolidated Goodman Group Financial Report for the Full Year ended 30 June 2019 including the Australian Securities Exchange (ASX) Appendix 4E statement under the ASX Listing Rules. The ASX Announcement and Investor Presentation in relation to the 2019 Full Year Results are set out in Part 2 of the announcement. The results are as released to the Australian Securities Exchange. Yours sincerely, For Goodman Australia Finance Pty Limited Carl Bicego Company Secretary
Transcript
Goodman Australia Finance Pty Limited (ACN 127 959 951)
Announcement to Singapore Exchange
Goodman Group Goodman Limited | ABN 69 000 123 071 Goodman Funds Management Limited | ABN 48 067 796 641 | AFSL Number 223621 as responsible entity of Goodman Industrial Trust | ARSN 091213 839
Level 17, 60 Castlereagh Street, Sydney NSW 2000 | GPO Box 4703, Sydney NSW 2001 Australia Tel +61 2 9230 7400 | Fax +61 2 9230 7444
Goodman Logistics (HK) Limited 嘉民物流(香港)有限公司 | Company No. 1700359 | ARBN 155 911 149 a Hong Kong company with limited liability
Suite 901, Three Pacific Place, 1 Queen’s Road East, Hong Kong | Tel +852 2249 3100 | Fax +852 2525 2070 [email protected] | www.goodman.com
23 August 2019
JPY12,500,000,000 3.32% NOTES DUE APRIL 2023 EURO500,000,000 1.375% NOTES DUE SEPTEMBER 2025 ANNOUNCEMENT OF GOODMAN GROUP RESULTS FOR THE FULL YEAR ENDED 30 JUNE 2019 – PART 1
We attach the consolidated Goodman Group Financial Report for the Full Year ended 30 June 2019 including the Australian Securities Exchange (ASX) Appendix 4E statement under the ASX Listing Rules.
The ASX Announcement and Investor Presentation in relation to the 2019 Full Year Results are set out in Part 2 of the announcement. The results are as released to the Australian Securities Exchange.
Yours sincerely,
For Goodman Australia Finance Pty Limited
Carl Bicego Company Secretary
The Appendix 4E should be read in conjunction with the Directors' report and Consolidated financial statements of Goodman Limited for the year ended30 June 2019. The information included in the Appendix 4E and the Consolidated financial report for the year ended 30 June 2019 comprises all theinformation required by ASX Listing Rule 4.3A. The Appendix 4E is based on the Consolidated financial statements which have been audited by KPMG.
Highlights of results30 Jun 2019 30 Jun 2018
Operating profit (before specific non-cash and other significant items) attributable to Securityholders ($M) 942.3 845.9 up 11.4%
Revenue and other income ($M) 3,025.8 2,672.8 up 13.2%
Profit (statutory) attributable to Securityholders ($M) 1,627.9 1,098.2 up 48.2%
Diluted operating profit per security (cents) 51.6 46.7 up 10.5%
Dividends and distributions
Interim distribution per GMG security (cents) 15.00 13.75 up 9.1%Final dividend and distribution proposed per GMG security (cents) 15.00 14.25 up 5.3%
30.00 28.00 up 7.1%
Interim distribution paid ($M) 272.1 247.6 up 9.9%Final dividend and distribution proposed ($M) 272.1 256.6 up 6.0%
544.2 504.2 up 7.9%
Franked amount per security/share (cents) - - - -
Conduit foreign income - - - -
Record date for determining entitlements to the final dividend and distribution 30 Jun 2019 30 Jun 2018
Date interim distribution was paid 26 Feb 2019 26 Feb 2018
Date final dividend and distribution are payable 9 Sep 2019 29 Aug 2018
Distribution reinvestment planGoodman Group’s Distribution Reinvestment Plan (DRP) remains suspended.
Total assets under management ($B) 46.2 38.3 up 20.6%
External assets under management ($B) 42.9 35.1 up 22.2%
Total assets ($M) 14,912.8 13,459.4 up 10.8%
Total liabilities ($M) 4,390.3 4,285.7 up 2.4%
Net assets ($M) 10,522.5 9,173.7 up 14.7%
Net tangible assets per security/share (cents) 533.8 464.1 up 15.0%
Gearing (%) 9.7 5.1 up 90.2%
Contributed equity ($M) 8,031.7 8,031.7 - -
Security price ($) 15.03 9.62 up 56.2%
Number of securities on issue (M) 1,813.9 1,800.8 up 0.7%
Market capitalisation ($M) 27,262.6 17,323.3 up 57.4%
Number of Securityholders 26,648 25,807 up 3.3%
APPENDIX 4EGOODMAN GROUP
(comprising Goodman Limited, Goodman Industrial Trust and Goodman Logistics (HK) Limited)RESULTS FOR ANNOUNCEMENT TO THE MARKET
For the year ended 30 June 2019
Change
Controlled entities acquired or disposedThere were no material acquisitions or disposals of controlled entities during the year.
Associates and joint venture entitiesGoodman's Group's associates are set out in note 6 to the financial statements.
Goodman Group's joint ventures and its percentage holding in these joint ventures are set out below:BGMG1 Oakdale West Trust (50%)BGMG2 Rochedale North Trust (50%)BL Goodman Limited PartnershipEuston Road Subtrust No.2 Trust (50%)FSX Czech s.r.o (50%)GEP Bonneuil Logistics (France) SCI (50%)Goodman Australia Development Partnership (20%)Goodman Blacktorn Logistics (Poland) (50%)Goodman Bondi Logistics Netherlands (50%)Goodman Blue Logistics (Hungary) Kft (50%)Goodman Brazil Logistics Partnership (15%)Goodman Can Estella Logistics Spain (50%)Goodman China Logistics Partnership (20%)Goodman Delta Logistics (Poland) (50%)Goodman Doris Logistics Netherlands (50%)Goodman European Partnership Bonneuil Logistics (France) SCI (50%)Goodman Japan Development Partnership (50%)Goodman Lazulite Logistics (Lux) Sàrl (50%)Goodman North America Partnership (55%)Goodman Odysse Logistics (Lux) Sàrl (50%)Goodman Persiphone Logistics Poland (50%)Goodman Princeton Partnership (Jersey) Ltd (20%)Goodman Purple Logistics (Poland) (50%)Goodman Sunglow Logistics (Lux) Sàrl (50%)Goodman UK Partnership L.P (33.3%)Loreto Investments, S.L. (50%)Metropol Development s.r.o. (50%)KWASA Goodman Germany (19.3%)KWASA Goodman Industrial Partnership (40%)Pochin Goodman (Northern Gateway) Ltd (50%)South East Asia Joint Venture (50%)
Goodman Group Consolidated financial report
for the year ended 30 June 2019
Contents Page Directors’ report 2 Lead auditor’s independence declaration 56 Consolidated statements of financial position 57 Consolidated income statements 58 Consolidated statements of comprehensive income 59 Consolidated statements of changes in equity 60 Consolidated cash flow statements 62 Notes to the consolidated financial statements 63 Basis of preparation 1 Basis of preparation 63 Results for the year 2 Profit before income tax 68 3 Profit per security 71 4 Segment reporting 72 5 Taxation 76 Operating assets and liabilities 6 Property assets 78 7 Receivables 90 8 Contract balances 90 9 Payables 92 10 Provisions 92 11 Goodwill and intangible assets 93 Capital management 12 Net finance (expense)/income 98 13 Interest bearing liabilities 99 14 Other financial assets and liabilities 102 15 Financial risk management 103 16 Dividends and distributions 112 17 Issued capital 113 Other items 18 Notes to the cash flow statements 115 19 Equity attributable to Goodman Limited and non-controlling interests 118 20 Controlled entities 120 21 Related parties 122 22 Commitments 124 23 Auditors’ remuneration 125 24 Parent entity disclosures 125 25 Events subsequent to balance date 126 Directors’ declaration 127 Independent auditor’s report 128 Appendix A – Goodman Logistics (HK) Limited financial report for the year ended 30 June 2019 A1
Goodman Group Directors’ report
for the year ended 30 June 2019
2
The directors (Directors) of Goodman Limited (ABN 69 000 123 071) and Goodman Funds Management Limited (GFML), the responsible entity for Goodman Industrial Trust (ARSN 091 213 839), present their Directors’ report together with the consolidated financial statements of Goodman Limited and the entities it controlled (Goodman or Group) and the consolidated financial statements of Goodman Industrial Trust and the entities it controlled (GIT) at the end of, or during, the financial year ended 30 June 2019 (FY19) and the audit report thereon.
Shares in Goodman Limited (Company or GL), units in Goodman Industrial Trust (Trust) and CHESS Depositary Interests (CDIs) over shares in Goodman Logistics (HK) Limited (GLHK) are stapled to one another and are quoted as a single security on the Australian Securities Exchange (ASX). In respect of stapling arrangements, Australian Accounting Standards require an acquirer to be identified and an in-substance acquisition to be recognised and accordingly Goodman Limited is identified as having acquired control over the assets of GIT and GLHK. The consolidated financial statements of Goodman Limited therefore include the results of GIT and GLHK.
As permitted by the relief provided in Australian Securities & Investments Commission (ASIC) Instrument 18-0353, the accompanying consolidated financial statements present both the financial statements and accompanying notes of Goodman and GIT. GLHK, which is incorporated and domiciled in Hong Kong, prepares its financial statements under Hong Kong Financial Reporting Standards and the applicable requirements of the Hong Kong Companies Ordinance and accordingly the financial statements of GLHK have not been included as adjacent columns in the consolidated financial statements. The financial statements of GLHK have been included as an appendix to this financial report.
GFML, as responsible entity for the Trust, is solely responsible for the preparation of the accompanying consolidated financial report of GIT, in accordance with the Trust’s Constitution and the Corporations Act 2001.
Operating and financial review
Principal activities
Goodman is a global integrated property group and one of the world’s leading listed industrial property groups. Goodman is focused on its proven business model of owning, developing and managing industrial property and business space in key markets around the world.
The principal activities of Goodman during the course of the current financial year were investment in directly and indirectly held industrial property, investment management, property services and property development. Goodman’s key operating regions during the financial year were Australia and New Zealand, Asia, Continental Europe, the United Kingdom and the Americas.
Goodman Group Directors’ report
for the year ended 30 June 2019
3
Operating and financial review (cont) Goodman strategy Goodman’s purpose is to make space for its stakeholders’ ambitions. This purpose is executed through Goodman’s integrated business capabilities model – “own+develop+manage”, where its customers’ need for sustainable solutions and service excellence in high quality locations, is at the centre.
The business capabilities are supported by five strategic “pillars”:
1. Quality partnerships – develop and maintain strong relationships with key stakeholders including customers, investment partners, suppliers and employees;
2. Quality product and service – deliver high quality product and customer service in key logistics markets globally by actively leveraging Goodman’s industrial sector expertise, development and management experience and global operating platform;
3. Culture and brand – promote Goodman’s unique and recognisable brand and embed Goodman’s core values across each operating division to foster a strong and consistent culture. The core values are:
- Customer + Focus: “Be closer to the customer’s world and their changing needs”; - Innovative + Dynamic: “Be more creative in our thinking and more creative in our actions”; - Open + Fair: “Be adaptable and considerate in our dealings inside and outside our business”; - Performance + Drive: “Do what we say we’ll do and make things happen”; and - Team + Respect: “Recognise the worth in each other and collaborate for better results”;
4. Operational efficiency – optimise business resources to maximise effectiveness and drive efficiencies; and
5. Capital efficiency – maintain active capital management to facilitate appropriate returns and sustainability of the business.
Goodman Group Directors’ report
for the year ended 30 June 2019
4
Operating and financial review (cont)
Financial highlights
1. Operating profit per security (operating EPS) is the operating profit divided by the weighted average number of securities on issue during FY19, including securities relating to performance rights that have not yet vested but where the performance hurdles have been achieved. Operating profit comprises profit attributable to Securityholders adjusted for net property valuations gains, non-property impairment losses, net gains/losses from the fair value movements on derivative financial instruments and unrealised fair value and foreign exchange movements on interest bearing liabilities and other non-cash adjustments or non-recurring items e.g. the share based payments expense associated with Goodman’s Long Term Incentive Plan (LTIP).
The Directors consider that Goodman’s operating profit is a key measure by which to examine the underlying performance of the business, notwithstanding that operating profit is not an income measure under International Financial Reporting Standards.
2. Development work in progress is the end value of ongoing developments across Goodman and its investments in associates and joint ventures (referred to as Partnerships).
3. Gearing is calculated as total interest bearing liabilities over total assets, both net of cash and the fair values of certain derivative financial instruments included in other financial assets of $222.4 million (2018: $154.3 million). Total interest bearing liabilities are grossed up for the fair values of certain derivative financial instruments included in other financial liabilities of $123.6 million (2018: $31.9 million).
4. Interest cover is operating profit before net finance expense (operating) and income tax (operating) divided by adjusted net finance expense (operating). Adjusted net finance expense excludes capitalised borrowing costs.
2019 2018 Change %
Revenue and other income before fair value adjustments on investment
properties ($M) 2,132.4 1,999.0 6.7%
Fair value adjustments on investment properties including share of adjustments
for associates and joint ventures (JVs) ($M) 893.4 673.8 32.6%
Revenue and other income ($M) 3,025.8 2,672.8 13.2%
Profit attributable to Securityholders ($M) 1,627.9 1,098.2 48.2%
Total comprehensive income attributable to Securityholders ($M) 1,795.4 1,300.3 38.1%
Operating profit ($M) 942.3 845.9 11.4%
Statutory profit per security - basic (¢) 89.9 61.1 47.1%
Operating profit per security (operating EPS) (¢)1
51.6 46.7 10.5%
Dividends/distributions in relation to the financial year ($M) 544.2 504.2 7.9%
Dividends/distributions per security in relation to the financial year (¢) 30.0 28.0 7.1%
Weighted average number of securities on issue (M) 1,811.7 1,798.8 0.7%
Total equity attributable to Securityholders ($M) 10,522.5 9,173.7 14.7%
Number of securities on issue (M) 1,813.9 1,800.8 0.7%
Net tangible assets per security ($) 5.34 4.64 15.1%
Net assets per security ($) 5.80 5.09 13.9%
External assets under management ($B) 42.9 35.1 22.2%
Total assets under management ($B) 46.2 38.3 20.6%
Development work in progress ($B)2
4.1 3.6 13.9%
Gearing (%)3 9.7 5.1
Interest cover4 (times) 19.6 16.2
Liquidity ($B) 2.7 3.4
Weighted average debt maturity (years) 6.6 6.9
Goodman Group Directors’ report
for the year ended 30 June 2019
5
Operating and financial review (cont)
Overview Goodman has delivered another strong result, with operating profit of $942.3 million for FY19, compared to $845.9 million for the prior year, an increase of 11.4%. This equated to an operating EPS of 51.6 cents, up 10.5% on FY18. The contribution from overseas operations has again increased and now comprises 68% of the Group’s operating profit. The demand by Goodman’s customers for industrial property close to their consumers in major urban locations continues to drive the development workbook and has resulted in consistently strong property fundamentals across the global portfolio. Goodman’s statutory profit attributable to Securityholders for FY19 was $1,627.9 million, an increase of $529.7 million compared with FY18. This included the Group’s share of property valuation gains, net of deferred tax, of $871.7 million and the accounting expense of the Group’s Long Term Incentive Plan of $196.6 million. There was also a $17.0 million fair value gain on derivatives and debt translation which is included in the statutory profit but excluded from the calculation of operating profit. Goodman has achieved this result while maintaining the prudent metrics in accordance with its financial risk management policy. The Group’s debt bears interest at rates consistent with the prevailing low interest rate environment, and over $2.0 billion of bonds have expiries in more than five years. At 30 June 2019, gearing remained low at 9.7% and the funds available to the Group for investment were $2.7 billion. Dividends and distributions relating to FY19 increased to 30 cents per security, up 7.1% on the prior year. Key operational highlights: Investment:
+ $46.2 billion of total assets under management (AUM), of which the Group owns a whole or a part share
+ 3.3% like for like growth in net property income (NPI) in Partnerships
+ 98% occupancy across the Group and Partnerships Management
+ $42.9 billion of external AUM in Partnerships
+ 15.9% total return across Partnerships Development
+ $4.1 billion of development work in progress (WIP)
+ $4.2 billion of development commencements, with 81% undertaken in Partnerships and third parties Goodman continues to focus on the location of its portfolios. Urbanisation and the consumers’ demand for convenience require Goodman’s customers to be located in major cities and have fast and efficient supply chains. The asset disposal programme over the past few years has allowed Goodman’s portfolios around the world to be concentrated in these key urban centres where demand is currently outstripping supply. This has resulted in average occupancy of 98% and like for like NPI growth during FY19 of over 3%. The strong customer demand for these assets is also driving strong investor demand. This is particularly accentuated in a relatively low general growth environment where the prospects for Goodman’s portfolios appear relatively strong. As a result, the valuations of the Group’s stabilised investment properties again showed strong growth, due to further compression of capitalisation rates and the impact of the increased rental income. The weighted average capitalisation rate across the Goodman portfolios decreased from 5.5% at the start of FY19 to 5.1% at 30 June 2019. The ongoing development activity in all regions, the property valuation growth and the net acquisitions have increased total AUM by 21% to $46.2 billion at 30 June 2019 from $38.3 billion at 30 June 2018. Consequently, both the Group’s share of investment income from Partnerships and base management and property services fees have increased compared to the prior year. Management income is further supplemented by the recognition of portfolio performance fee revenue, a reflection of the Partnership returns that have been consistently achieved over the past few years. Asset pricing has meant that the development of sites by the Group has continued to be the best way for Goodman and Partnerships to access high quality assets in the target locations. The size and scale of new projects are growing given the high value nature of urban sites and development earnings and development WIP has increased during FY19. As at 30 June 2019, development WIP was $4.1 billion across 55 projects, with approximately 80% of development activity in Partnerships.
Goodman Group Directors’ report
for the year ended 30 June 2019
6
Operating and financial review (cont) Analysis of performance Goodman’s key operating regions are Australia and New Zealand (reported on a combined basis), Asia (Greater China and Japan), Continental Europe (approximately 75% of assets located in Germany and France), the United Kingdom and the Americas (North America and Brazil). The operational performance can be analysed into property investment earnings, management earnings and development earnings, and the Directors consider this presentation of the consolidated results facilitates a better understanding of the underlying performance of Goodman given the differing nature of and risks associated with each earnings stream. Property investment earnings consist of gross property income (excluding straight lining of rental income), less property expenses, plus Goodman’s share of the operating results of Partnerships that is allocable to property investment activities which excludes the Group’s share of property revaluations and derivative mark to market movements. The key drivers for maintaining or growing Goodman’s property investment earnings are increasing the level of AUM (subject also to Goodman’s direct and indirect interest), maintaining or increasing occupancy and rental levels within the portfolio, and financing costs within Partnerships. Management earnings relate to the revenue from managing both the property portfolios and the capital invested in Partnerships (management income). This includes performance related revenues but excludes earnings from managing development activities in Partnerships, which are included in development earnings. The key drivers for maintaining or growing management earnings are activity levels, asset performance, and increasing the level of AUM, which can be impacted by property valuations and asset disposals and is also dependent on liquidity including the continued availability of third party capital to fund both development activity and acquisitions across Goodman’s Partnerships. Development earnings consist of development income, plus Goodman’s share of the operating results of Partnerships that is allocable to development activities, plus net gains or losses from disposals of investment properties and equity investments that are allocable to development activities, less development expenses. Development income includes development management fees and also performance related revenues associated with managing development activity in Partnerships. The key drivers for Goodman’s development earnings are the level of development activity, land and construction prices, property valuations and the continued availability of third party capital to fund development activity.
Goodman Group Directors’ report
for the year ended 30 June 2019
7
Operating and financial review (cont) Analysis of performance (cont) The analysis of Goodman’s performance and the reconciliation of the operating profit to profit attributable to Securityholders for FY19 are set out in the table below:
1. Net finance expense (operating) excludes derivative mark to market, unrealised foreign exchange movements and debt restructure expense.
2. Income tax expense (operating) excludes the deferred tax movements relating to investment property valuations.
2019 2018
Note $M $M
Analysis of operating profit
Property investment earnings 372.1 384.8
Management earnings 469.7 316.5
Development earnings 509.2 490.6
1,351.0 1,191.9
Operating expenses (267.7) (249.4)
1,083.3 942.5
Net finance expense (operating)1 (45.9) (44.4)
Income tax expense (operating)2 (95.1) (47.6)
942.3 850.5
Less: Attributable to other non-controlling interests - (4.6)
Operating profit 942.3 845.9
Adjustments for:
Property valuation related movements
- Net gain from fair value adjustments on investment properties 6(e) 146.8 71.1
- Share of fair value adjustments attributable to investment properties
in associates and JVs after tax 6(f) 746.6 602.7
- Deferred tax on fair value adjustments on investment properties (21.7) (34.8)
871.7 639.0
Fair value adjustments and unrealised foreign currency exchange movements
related to liability management
- Fair value adjustments on derivative financial instruments 12 6.7 (131.4)
- Share of fair value adjustments on derivative financial instruments
- Net capital losses not distributed and tax deferred adjustments (6.9) (4.7)
- Debt restructure expense 12 - (82.8)
(203.1) (212.3)
Profit attributable to Securityholders 1,627.9 1,098.2
Goodman Group Directors’ report
for the year ended 30 June 2019
8
Operating and financial review (cont) Analysis of performance (cont) Property investment Property investment earnings in FY19 of $372.1 million were slightly down on the prior year and comprised 27% of the total earnings (2018: 32%).
The Group’s property portfolios are concentrated in large, urban centres around the world where demand from customers (including e-commerce) who continue to invest in improving the efficiency of their supply chains, data centre users and urban renewal, has put pressure on land use and availability. As a consequence, barriers to entry in these locations are high, land is scarce and, in some cases, supply is negative meaning that the properties should see higher valuation growth and higher returns over the long term. The directly held properties are primarily in Australia and generally have potential for higher intensity or alternate uses. The decrease in investment earnings from the directly held properties was due to the $346.2 million of disposals in FY18 and repositioning of certain assets as they are prepared for redevelopment. Goodman’s share of investment earnings from its cornerstone holdings in Partnerships increased by 9.8% to $298.1 million compared to the prior year. This was due to rental income growth from existing properties and the completion of developments both during FY18 and FY19. Although there were disposals in FY19, notably in New Zealand and Continental Europe, the value of disposals was much lower than the annual average over the previous five years, as the composition of the Group’s portfolios is now largely orientated to the desired quality of assets. Net property income from the Partnership portfolios in FY19 was up 3.3% on a like for like basis compared to FY18 and occupancy at 30 June 2019 was 98% (2018: 98%). During FY19, the Group’s share of property valuations from the stabilised portfolios was $575.1 million, excluding valuation uplifts on new developments that reached completion. Valuation gains occurred across all the Group’s operating segments and were due to both capitalisation rate compression and the growth in rental income. At 30 June 2019, the WACR for the Group’s portfolios was 5.1%, compared to 5.5% at the start of FY19. The returns from Partnerships are also impacted by the level of debt in each Partnership. Consistent with the Group’s financial risk management, gearing in Partnerships was also maintained at the lower end of target ranges, which continues to be appropriate given the levels of ongoing development activity. While a higher level of gearing would have improved the short-term returns, Goodman’s strategy has been to position its Partnerships for sustainable long-term growth. The operating return on Goodman’s investment in the stabilised portfolios held by the Partnerships was 4.9% compared to 5.2% in the prior year, the decrease due to the strong valuation growth that increased the investment base.
2019 2018
$M $M
Analysis of property investment earnings:
Direct 74.0 113.2
Partnerships 298.1 271.6
372.1 384.8
2019 2018
Key metrics:
Weighted average capitalisation rate (WACR) (%) 5.1 5.5
Weighted average lease expiry (WALE) (yrs) 4.7 4.8
Occupancy (%) 98 98
Goodman Group Directors’ report
for the year ended 30 June 2019
9
Operating and financial review (cont)
Analysis of performance (cont)
Management
Management earnings in FY19 of $469.7 million increased by 48.4% compared to the prior year and comprised 35% of total operating earnings (2018: 27%). The two main drivers of management earnings were the increase in external AUM and the increasing contribution from portfolio performance fee income.
During FY19, external AUM increased by 22% to $42.9 billion from $35.1 billion as set out below:
External assets under management
Base management fee income, earned from the overall management of the Group’s Partnerships, increased in line with the increase in AUM. This was supplemented by property services income, which increased in line with the gross property income in Partnerships, and other income such as leasing fees and transactional fees.
In addition, the consistently high Partnership returns over the past few years resulted in performance fee revenue growing to $204.3 million in FY19 from $83.1 million in the prior year, primarily in Australia and Asia. For FY19, the Partnerships reported average total returns of 15.9% (2018: 15.0%), and performance fee revenue represented around 43% of the total management earnings, up from 26% in the prior year.
Development
In FY19, development earnings were $509.2 million, an increase of 3.8% on the prior year and comprised 38% of total operating earnings (2018: 41%).
Development activity continued to be strong with commencements during the year of $4.2 billion, completions of $3.9 billion and WIP of $4.1 billion across 55 projects at 30 June 2019. The increase in the Group’s earnings was primarily volume driven.
The majority of inventory disposals and fixed price contract income arose in Europe, as Partnerships in Continental Europe generally acquire completed developments from Goodman. In the Group’s other operating segments, development earnings are a mix of development management income, including performance related income, and transactional activity, including the Group’s share of development profits reported by Partnerships themselves. During FY19, approximately 80% of development activity (by end value) was undertaken by Partnerships, which was consistent with the prior year.
Consistent with the Group’s strategy, development activity has been focused on key urban centres, where customer demand is high and the supply of industrial logistics is restricted. In locations, such as Japan and North America, this has allowed the Group to commence certain projects on a speculative basis. Nevertheless, occupancy at completion remained strong with 81% leased to customers based on the projects that completed during FY19. Furthermore, at reporting date 88% of developments (by value) were either already owned by or contracted for sale to third parties or Partnerships.
The scale of the projects has been growing over time as a consequence of the high value nature of the sites and the complexity associated with development of infill locations. With further high value developments in the pipeline, particularly in Asia and North America, WIP is expected to approach $5 billion in FY20.
2019
$B
At the beginning of the year 35.1
Acquisitions 2.4
Disposals (1.5)
Capital expenditure (developments) 2.0
Valuations 3.7
Foreign currency translation 1.2
At the end of the year 42.9
2019 2018
Key metrics:
Work in progress (A$B) 4.1 3.6
Number of developments 55 80
Goodman Group Directors’ report
for the year ended 30 June 2019
10
Operating and financial review (cont) Analysis of performance (cont) Operating expenses For FY19, operating expenses increased to $267.7 million from $249.4 million. The majority of the operating expenses related to remuneration costs which increased to $191.9 million from $180.7 million as a result of modest inflation pressure, lower cost capitalisation (with fewer development assets directly held by the Group) and the impact of a weaker Australian dollar on the translation of the overseas costs. Headcount was maintained or reduced in most divisions. Administrative expenses also increased in FY19 due to the impact of foreign currency translation and increased compliance costs, with local regulators either increasing or introducing levies to fund financial services monitoring and surveillance programmes. Net finance expense (operating) Net finance expense (operating), which excluded derivative mark to market, unrealised foreign exchange movements and debt restructure expenses, increased to $45.9 million from $44.4 million. This was due to an increase in the net interest cost associated with the Group’s cross currency interest rate derivatives and the lower Australian dollar, which offset the full year impact of the lower rates following the refinance of the Group’s bonds in FY18. Income tax expense (operating) Income tax expense (operating) for FY19 at $95.1 million (2018: $47.6 million) increased compared to the prior year. A significant proportion of Goodman’s earnings related to GIT and its controlled entities, which are “flow through” entities under Australian tax legislation, meaning Securityholders (and not GIT) are taxed on their respective share of income. However, the majority of the increase in earnings in FY19 related to management activities, which are taxed at prevailing local rates. Additionally, certain jurisdictions have now fully utilised any tax losses, with most of the Group’s remaining tax losses being in Australia and the United Kingdom. Capital management Goodman has maintained its prudent approach to capital management. At 30 June 2019, the Group’s available debt facilities and fixed rate long-term bonds, which totalled $4.0 billion (of which $2.95 billion had been drawn), had a weighted average maturity of 6.6 years. The Group’s cash and undrawn bank facilities were $2.7 billion, which is available for future investment. At 30 June 2019, gearing was 9.7% (2018: 5.1%), which continued to be at the lower end of the Group’s policy range but was increased compared to 30 June 2018 due to equity investments in Partnerships to fund the growth in development activity, notably Goodman North America Partnership, and the currency translation impact associated with the USD, JPY and EUR denominated debt. Interest cover was 19.6 times (2018: 16.2 times) and the Group continued to have significant headroom relative to its financing covenants. Goodman’s credit ratings from Standard & Poor’s and Moody’s were unchanged at BBB+ and Baa1, respectively. As Goodman expects to undertake an increased volume of development activity over the next few years, more capital will be allocated to development and also to Partnership investments. In order to maintain low financial leverage, the Group is transitioning its distribution pay-out ratio from 60% towards 50% of operating profit. The distribution for FY19 was 30 cents per security, a pay-out ratio of 58%, with 15 cents paid on 26 February 2019 and 15 cents to be paid on 9 September 2019. The distribution reinvestment plan was not in operation during the year. During FY19, the Group and its Partnerships refinanced over $2.8 billion of bank debt and secured third party equity commitments of $2.4 billion to provide liquidity for ongoing acquisition and development opportunities.
Dividends and distributions Goodman Limited did not declare any dividends during the financial year (2018: $nil). During FY19, Goodman Industrial Trust declared and accrued distributions of 25.0 cents per security (2018: 23.0 cents per security), amounting to $453.5 million (2018: $414.2 million). During FY19, GLHK declared and accrued a dividend of 5.0 cents per security (2018: 5.0 cents per security), amounting to $90.7 million (2018: $90.0 million).
Goodman Group Directors’ report
for the year ended 30 June 2019
11
Operating and financial review (cont) Analysis of performance (cont) Summary of items that reconcile operating profit to statutory profit Property valuation related movements The net gain from fair value adjustments on investment properties of $146.8 million (2018: $71.1 million) related to those assets directly held by Goodman, principally in Sydney, Australia. The uplift in value was due to both rental growth and a contraction in capitalisation rates. Goodman’s share of net gains from fair value adjustments after tax attributable to investment properties in Partnerships increased to $746.6 million from $602.7 million in the prior year. Increases occurred in most regions due to the quality of the property portfolios, improved leasing outcomes, continued investor demand for industrial assets and developments conducted in the Partnerships. The valuations in FY19 included $171 million (2018: $215 million) relating to completion of development assets, predominantly in North America, and a further $50 million relating to developments in progress at 30 June 2019. At 30 June 2019, the WACR for Goodman’s stabilised property portfolios (both directly held and Partnerships) decreased from 5.5% to 5.1%. There were no impairment losses associated with the Group’s inventories during FY19. Fair value adjustments and unrealised foreign currency exchange movements related to liability management The amount reported in profit or loss associated with the Group’s derivative financial instruments and translation of USD debt was a net gain of $17.0 million. This included fair value gains of $27.1 million associated with the derivative financial instruments and losses of $10.1 million from translation of the USD denominated bonds that do not qualify for net investment hedging. The $27.1 million fair value gains on the derivative financial instruments comprised unrealised profits on those interest rate derivatives where the Group was receiving fixed Australian dollar interest and losses on the currency derivatives due to the weakening Australian dollar versus most of the currencies in the Group’s overseas operations. Goodman’s policy is to hedge between 65% and 90% of the net assets of these foreign operations. Where Goodman invests in foreign assets, it will borrow in that currency or enter into derivative financial instruments to create a similar liability. In so doing, Goodman minimises its net asset and income exposures to those currencies. The unrealised fair value movement of the derivative financial instruments (up or down) is recorded in the income statement; however, the foreign currency translation of the net investment that is being hedged is recorded directly in reserves. In FY19, the movement in reserves attributable to foreign currency movements was a gain of $170 million, which reflected an increase in the carrying value of the overseas net assets when converted to Australian dollars. Other non-cash adjustments or non-recurring items The principal other non-cash adjustments or non-recurring items for FY19 related to the share based payments expense of $196.6 million for Goodman’s LTIP, up from $125.6 million in FY18, primarily a result of the increasing Goodman security price.
Goodman Group Directors’ report
for the year ended 30 June 2019
12
Operating and financial review (cont) Statement of financial position
The carrying value of wholly owned, stabilised investment properties increased by $132.1 million to $1,756.4 million at 30 June 2019. This was primarily due to valuation uplifts of $146.8 million during the year. The value of Goodman’s cornerstone investments in Partnerships, which excludes the Group’s share of development assets in the Partnerships, increased by $833.9 million to $6,920.4 million, due to the valuation uplifts across the portfolios, the Group’s funding of its share of development completions and the impact of foreign currency translation. Goodman’s development holdings, which include the Group’s share of development assets in the Partnerships as well as the directly held properties, increased during the year by $998.2 million to $2,991.8 million. The overall level of development activity trended higher during FY19, with growth in Asia and the Americas, leading to the end value of development WIP of $4.1 billion at 30 June 2019 (2018: $3.6 billion). This is likely to increase further in FY20, with other high value projects in the pipeline. The majority of development activity is undertaken by the Partnerships themselves and therefore the Group’s development holdings at 30 June 2019 were at a similar level to the prior year. This was also impacted by further progress in rotating the longer dated land banks in the United Kingdom, that no longer fit with the Group’s strategic focus on locations close to urban centres. At 30 June 2019, the principal goodwill and intangible asset balances were in Continental Europe and the United Kingdom. The movement during FY19 related to changes in foreign currency exchange rates and there have been no impairments or reversals of impairments. The Group’s cash and interest bearing liabilities should be considered together. On a net basis, the liability was $1,367.9 million at 30 June 2019 compared to $674.7 million at 30 June 2018. The increased liability related to the funding of development activity in the Group’s Partnerships and the impact of foreign currency translation on the USD, JPY and EUR denominated borrowings. Other assets included certain receivables and derivative financial instruments. The movements during FY19 related to increases in receivables associated with performance related income that is expected to be settled in FY20. Other liabilities included trade and other payables, the provision for the dividends/distributions to Securityholders, fair values of derivative financial instruments and tax liabilities (including deferred tax). The movement during the year was a result of changes in the fair values of derivatives, increased development payable and increased tax liabilities.
2019 2018
$M $M
Stabilised investment properties 1,756.4 1,624.3
Cornerstone investments in Partnerships 6,920.4 6,086.5
Development holdings 2,991.8 1,993.6
Intangible assets 840.0 816.7
Cash 1,607.1 2,406.8
Other assets 797.1 531.5
Total assets 14,912.8 13,459.4
Interest bearing liabilities 2,975.0 3,081.5
Other liabilities 1,415.3 1,204.2
Total liabilities 4,390.3 4,285.7
Net assets 10,522.5 9,173.7
Goodman Group Directors’ report
for the year ended 30 June 2019
13
Operating and financial review (cont)
Cash flow
Operating cash flows of $827.5 million has decreased relative to the prior year and is lower compared to the Group’s operating profit of $942.3 million. FY18 included settlements associated with large development projects in Continental Europe that were funded by Goodman through to completion and had been in progress at 30 June 2017. The timing of development completions relative to the reporting date generally has a significant impact on overall operating cash flows. Furthermore, the distributions received from Partnerships in FY19 were lower than the prior year due to the asset disposals and also capital management initiatives by Partnerships. This was partially offset by the increase in management income received. When compared against the operating profit, the lower operating cash flow is due to the capital management initiatives by Partnerships, referred to above, and also the growth in contract assets that are only due to be settled in FY20.
Investing cash flows in FY19 primarily related to the net investments in Goodman’s Partnerships of $797.2 million (2018: $571.1 million, excluding proceeds from the disposal of Arlington Business Parks Partnership). This investment occurred principally in Japan and North America to fund the development activity in those Partnerships. This is likely to be a continued theme in respect of the Partnerships with the level of development expected to increase in FY20. In FY18, net investing cash outflows were only $26.5 million, as Goodman also received proceeds of $668.1 million from disposals of investment properties in Australia and the Group’s investment in Arlington Business Parks Partnership. Other investing cash outflows related to capital expenditure on the Group’s directly held investment properties of $94.5 million (2018: $118.1 million).
Financing cash flows include the drawdowns and repayments associated with Goodman’s interest bearing liabilities. The principal financing cash outflows were the distributions paid to Securityholders and the repayment of the GBP denominated bonds at their maturity.
Outlook
For FY20, business conditions, as they relate to Goodman’s operations, are expected to remain favourable and Goodman is strategically well placed given its financial and operational strength. The Board sets targets annually and reviews them regularly. As a result, the Group expects to achieve operating profit for FY20 of $1,040.0 million, which equates to operating EPS of 56.3 cents, up 9% on FY19. The increase in operating profit is anticipated from each of the Group’s earning streams, subject to there being no material adverse change in market conditions or the occurrence of other unforeseen events. Total AUM are expected to increase to over $50 billion, resulting in growth in property investment and management earnings, while the commencement of high value developments in Asia and Americas will see WIP approaching $5 billion. In order for the Group to fund the anticipated increase in the capital allocated to development activities, including funding its share of investment in Partnerships, and to keep the Group’s financial leverage at the lower end of the policy range, the Directors intend to hold the distribution at 30 cents per security for FY20 subject to achieving the anticipated profits. This will be maintained until the Group’s distribution pay-out ratio has been transitioned closer to 50%. Thereafter, the distribution is expected to increase in line with the Group’s operating profit. Further information as to other likely developments in the operations of Goodman and the expected results of those operations in future financial years has not been included in this Directors’ report because disclosure of the information would be likely to result in unreasonable prejudice to Goodman.
2019 2018
$M $M
Operating cash flows 827.5 1,161.2
Investing cash flows (818.2) (26.5)
Financing cash flows (excluding dividends and distributions) (320.5) (310.8)
Dividends and distributions paid (528.7) (488.4)
Net (decrease)/increase in cash and cash equivalents held (839.9) 335.5
Cash and cash equivalents at the beginning of the year 2,406.8 2,095.1
Effect of exchange rate fluctuations on cash held 40.2 (23.8)
Cash and cash equivalents at the end of the year 1,607.1 2,406.8
Goodman Group Directors’ report
for the year ended 30 June 2019
14
Operating and financial review (cont) Risks
Goodman identifies strategic and operational risks for each of its regions as part of its strategy process. The key risks, an assessment of their likelihood of occurrence and consequences and controls that are in place to mitigate the risks are reported to the Board annually. Goodman has established formal systems and processes to manage the risks at each stage of its decision making process. This is facilitated by a Group Investment Committee comprising senior executives, chaired by the Group Chief Executive Officer, which considers all major operational decisions and transactions. The Group Investment Committee meets on a weekly basis.
The Board has separate committees to review and assess key risks. The Risk and Compliance Committee reviews and monitors a range of material risks in Goodman’s risk management systems including, among other risks, market risks, operational risks, sustainability, regulation and compliance and information technology. The Audit Committee reviews and monitors financial risk management and tax policies.
Goodman Group Directors’ report
for the year ended 30 June 2019
15
Operating and financial review (cont) Risks (cont)
The key risks faced by Goodman and the controls that have been established to manage those risks are set out below:
Risk area Mitigation
Capital
management
Ensuring long-term availability of funding from
both investors and financial institutions to support
the sustainability of the business.
+ Board approved financial risk management policy
+ Prudent capital management with cash flow requirements, gearing and
available liquidity reviewed monthly and reported to the Board
+ Diversification of debt funding sources and maturities
+ Diversification of investment partners
+ Change in distribution pay-out ratio consistent with
contribution to increasing development workbook
Economic and
geopolitical
environment
Headline economic indicators suggest global
growth has peaked, with indications of a gradual
slowdown in coming years. Geopolitical and geo-
economic tensions are rising among the world’s
major powers, evidenced by political protests in
Hong Kong and trade tension between the US and
China. The world is evolving into a period of
divergence following a period of globalisation that
profoundly altered the global political economy.
+ Global diversification of Goodman’s property portfolios
+ Focus on core property portfolios in key urban market locations
+ Focus on cost management
+ Prudent capital management with low gearing and significant
available liquidity to allow for potential market shocks
Governance,
regulation and
compliance
Non-compliance and changes to the regulatory
environments (including tax) impact Goodman's
business, including its reputation.
+ Independent governance structures
+ Core values and attitudes, with an embedded compliance culture
focused on best practice
+ Dedicated Chief Risk Officer and Compliance Officer
+ Review of transactions by the Group Investment Committee
People Retaining the executive management team, who
support the sustainability of the business.
Maintaining an organisational culture
commensurate with Goodman’s values.
+ Succession planning for senior executives
+ Competitive remuneration structures
+ Performance management and review
+ Goodman values programme
Technology
change and
disruption
Through advancement in technology (as seen
through automation/robotics, investment in
driverless vehicles and drone technology), there is
+ Diversification of customer base and lease expiries
+ Review of significant leasing transactions and development projects
by the Group Investment Committee
+ Sustainability strategy including the assessment of individual
assets to improve resilience and implementation of sustainability
initiatives
+ Adoption of the Task Force on Climate-related Financial Disclosures
recommendations as a framework for the assessment, management
and disclosure of climate risks
+ Capital expenditure programmes keeping pace with property
lifecycle
Concentration to
counterparties and
markets
Over-exposure to customers and market may limit
growth and sustainability opportunities.
+ Diversification of customer base and lease expiries
+ Diversification of capital partners and Partnership expiries
Information and
data security
Maintaining security of IT environment and data,
ensuring continuity of IT applications to support
sustainability and growth.
+ Reporting of risks and management activity
+ Proactive monitoring, review and testing of infrastructure
+ Disaster recovery and business continuity planning and testing
Goodman Group Directors’ report
for the year ended 30 June 2019
16
Qualifications, experience and special responsibilities of Directors and Company Secretary Board of Directors Ian Ferrier, AM – Independent Chairman Member of the Audit Committee and Remuneration and Nomination Committee Appointed to the board of Goodman Limited on 1 September 2003; Tenure 15 years, 10 months Appointed to the board of GFML on 23 February 2005; Tenure 14 years, 4 months Ian is the Independent Chairman of Goodman Limited and Goodman Funds Management Limited (appointed on 28 July 2009 having been Acting Chairman from 28 November 2008) and also Goodman Logistics (HK) Limited (since 22 February 2012). Ian is a Fellow of Chartered Accountants Australia and New Zealand and has in excess of 40 years of experience in company corporate recovery and turnaround practice. Ian is also a director of a number of private and public companies. He is also a director of EnergyOne Limited (since January 2007) and was formerly the Chairman of Reckon Limited (from August 2004 to July 2018), InvoCare Limited and Australian Vintage Ltd. His experience is essentially concerned with understanding the financial and other issues confronting company management, analysing those issues and implementing policies and strategies which lead to success. Ian has significant experience in property and development, tourism, manufacturing, retail, hospitality and hotels, infrastructure and aviation and service industries. Gregory Goodman – Group Chief Executive Officer Appointed to the board of Goodman Limited on 7 August 1998; Tenure 20 years, 11 months Appointed to the board of GFML on 17 January 1995; Tenure 24 years, 5 months Gregory is the Managing Director of Goodman Limited and Goodman Funds Management Limited and Group Chief Executive Officer of Goodman. He is also an alternate director of Goodman Logistics (HK) Limited. As Group Chief Executive Officer, he is responsible for Goodman’s overall operations and the implementation of its strategic plan. He has over 30 years of experience in the property industry with significant expertise in the industrial property arena. Gregory was a co-founder of Goodman, playing an integral role in establishing its specialist global position in the property market through various corporate transactions, including takeovers, mergers and acquisitions. He is a director of Goodman (NZ) Limited (the manager of the New Zealand Exchange listed Goodman Property Trust), and a director and/or representative of Goodman’s subsidiaries, management companies and Partnerships. Christopher Green – Independent Director Member of the Audit Committee Appointed to the board of Goodman Limited and GFML on 28 April 2019; Tenure 2 months Chris is an Independent Non-Executive Director of Goodman Limited and Goodman Funds Management Limited. Chris is also the Founder and Chief Executive Officer of GreenPoint Partners, a New York headquartered firm investing in real estate innovation, technology and private equity. Chris spent 16 years at Macquarie Group and was the Global Head of Macquarie Capital’s real estate business leading its global expansion through to 2018. He has a Bachelor of Laws (Hons) degree and a Bachelor of Commerce (Computer Science and Accounting) degree from the University of Sydney. Stephen Johns – Independent Director Chairman of the Audit Committee and Member of the Risk and Compliance Committee Appointed to the board of Goodman Limited and GFML on 1 January 2017; Tenure 2 years, 6 months Stephen is an Independent Non-Executive Director of Goodman Limited and Goodman Funds Management Limited. He is currently also Chairman and Non-Executive Director of Brambles Limited and was previously Chairman and Non-Executive Director of Leighton Holdings Limited and Spark Infrastructure Group. Stephen is also an Executive Director of the Garvan Institute of Medical Research. Stephen is a former Executive and Non-Executive Director of Westfield Group where he had a long executive career during which he held a number of senior positions including that of Finance Director from 1985 to 2002. He has a Bachelor of Economics degree from the University of Sydney and is a Fellow of Chartered Accountants Australia and New Zealand and a Fellow of the Australian Institute of Company Directors.
Goodman Group Directors’ report
for the year ended 30 June 2019
17
Qualifications, experience and special responsibilities of Directors and Company Secretary (cont)
Board of Directors (cont)
Rebecca McGrath – Independent Director Chairman of the Risk and Compliance Committee and Member of the Remuneration and Nomination Committee Appointed to the board of Goodman Limited and GFML on 3 April 2012; Tenure 7 years, 3 months
Rebecca is an Independent Non-Executive Director of Goodman Limited and Goodman Funds Management Limited. Rebecca is also currently Chairman of OZ Minerals Limited (Non- Executive Director since November 2010) and a Non- Executive Director of Incitec Pivot Limited (since September 2011). Rebecca is also a Non-Executive Director of Investa Wholesale Funds Management Limited and the Independent Chairman of Scania Australia Pty Limited. Rebecca was formerly a Director of CSR Limited (February 2012 to October 2016).
During her executive career at BP plc, she held numerous senior roles in finance, operations, corporate planning, project management and marketing in Australasia, the UK, and Europe. Her most recent executive experience was as Chief Financial Officer of BP Australasia.
Rebecca holds a Bachelors degree of Town Planning and a Masters of Applied Science (Project Management) and is a graduate of the Cambridge University Business and Environment Programme. She is a Fellow of the Australian Institute of Company Directors.
Danny Peeters – Executive Director, Corporate Appointed to the board of Goodman Limited and GFML on 1 January 2013; Tenure 6 years, 6 months
Danny is an Executive Director of Goodman Limited, Goodman Funds Management Limited and Goodman Logistics (HK) Limited. He has oversight of Goodman’s European and Brazilian operations and strategy. Danny has been with Goodman since 2006 and has 19 years of experience in the property and logistics sectors. Danny is a director and/or representative of Goodman’s investment management entities, subsidiaries and Partnerships in Europe and Brazil.
During his career, Danny has built up extensive experience in the design, implementation and outsourcing of pan- European supply chain and real estate strategies for various multinationals. Danny was Chief Executive Officer of Eurinpro, a developer of tailor made logistic property solutions in Europe acquired by Goodman in May 2006.
Phillip Pryke – Independent Director Chairman of the Remuneration and Nomination Committee and Member of the Audit Committee Appointed to the board of Goodman Limited and GFML on 13 October 2010; Tenure 8 years, 9 months
Phillip is an Independent Non-Executive Director of Goodman Limited and Goodman Funds Management Limited. He is also a director of Goodman (NZ) Limited, the manager of the New Zealand Exchange listed Goodman Property Trust. Phillip is currently also a director of North Ridge Partners Pty Limited. He was formerly the Deputy Chairman and Lead Independent Director of New Zealand Exchange listed Contact Energy Limited and a director of Tru-Test Corporation Limited.
Phillip has wide experience in the fishing, energy, financial services, and health and technology industries and holds a Bachelor of Economics degree.
Anthony Rozic – Deputy Group Chief Executive Officer and Chief Executive Officer, North America Appointed to the board of Goodman Limited and GFML on 1 January 2013; Tenure 6 years, 6 months
Anthony is an Executive Director and Deputy Group Chief Executive Officer (since August 2010). He was appointed Chief Executive Officer, North America in September 2016, and in that role is responsible for setting and managing the strategy, business performance and corporate transactions for the Group’s North American business.
Anthony joined Goodman in 2004 as Group Chief Financial Officer and was appointed Group Chief Operating Officer in February 2009 before taking on his current positions.
Anthony is a qualified Chartered Accountant and has over 20 years’ experience in the property industry, having previously held a number of senior roles in the property funds management industry and chartered accountancy profession.
Goodman Group Directors’ report
for the year ended 30 June 2019
18
Qualifications, experience and special responsibilities of Directors and Company Secretary (cont) Board of Directors (cont) Penny Winn – Independent Director Member of the Remuneration and Nomination Committee and Risk and Compliance Committee Appointed to the board of Goodman Limited and GFML on 1 February 2018; Tenure 1 year, 5 months Penny is an Independent Non-Executive Director of Goodman Limited and Goodman Funds Management Limited. Penny is also currently the Chair of Port Waratah Coal Services Limited (since June 2015), a Non-Executive Director of CSR Limited (since November 2015) and a Non-Executive Director of Caltex Australia Limited (since November 2015). Penny has over 30 years of experience in retail, supply chain and digital strategy in senior management roles in Australia and overseas, including as Director Group Retail Services with Woolworths Limited (2011-2015) where she was responsible for leading the Logistics and Information Technology divisions, Online Retailing and the Customer Engagement teams across the organisation. She has previously served as a director of a Woolworths business, Greengrocer.com, a Myer business, sass & bide, and Quantium Group. Penny is a graduate of the Australian Institute of Company Directors and holds a Bachelor of Commerce from the Australian National University and a Master of Business Administration from the University of Technology, Sydney. Former Independent Director
Jim Sloman, OAM – Former independent Director Appointed to the board of Goodman Limited and GFML on 1 February 2006 and retired on 15 November 2018 Jim was an Independent Non-Executive Director of Goodman Limited and Goodman Funds Management Limited before his retirement at the 2018 Annual General Meeting. Jim has over 40 years of experience in the building and construction industries in Australia and overseas, including experience with Sir Robert McAlpine & Sons in London, Lend Lease Corporation in Australia and as Deputy Chief Executive and Chief Operating Officer of the Sydney Organising Committee for the Olympic Games (SOCOG) from 1997 to 2001. He was the CEO and a director of MI Associates Pty Limited, a company established by him and comprising some of the leading members of the former SOCOG senior management team. He advised on major events including the London 2012 Olympic Games and Rio de Janeiro 2016 Olympic Games. Jim is currently working as an advisor to the Qatar 2022 World Cup. In addition, Jim is Chairman of Laing O’Rourke Australia Pty Limited and of several of its associated companies and a director of SHAPE Holdings Pty Limited and of several of its associated companies. With his range of experience, Jim brought significant property, construction and major projects expertise to Goodman while a director. Company Secretary Carl Bicego – Group Head of Legal and Company Secretary Appointed as Company Secretary of Goodman Limited and GFML on 24 October 2006 Carl is the Group Head of Legal and the Company Secretary of the Company. He was admitted as a solicitor in 1996 and joined Goodman from law firm Allens in 2006. Carl holds a Master of Laws degree and Bachelor of Economics/Bachelor of Laws (Hons) degrees.
Goodman Group Directors’ report
for the year ended 30 June 2019
19
Directors’ meetings (GL and GFML) The number of Directors’ meetings held (including meetings of committees of Directors) and the number of meetings attended by each of the Directors during the financial year were:
1. Christopher Green was appointed as a director on 28 April 2019 and commenced as a member of the Audit Committee on 17 May 2019. 2. Stephen Johns, Rebecca McGrath and Danny Peeters were unable to attend one unscheduled meeting held on short notice due to pre-existing commitments. 3. Jim Sloman retired as a director on 15 November 2018. 4. Penny Winn ceased to be a member of the Audit Committee and commenced as a member of the Remuneration and Nomination Committee on 17 May 2019. 5. Reflects the number of meetings individuals were entitled to attend.
Directors
Held5
Attended Held5
Attended Held5
Attended Held5
Attended
Ian Ferrier 8 8 4 4 4 3 - -
Gregory Goodman 8 8 - - - - - -
Christopher Green1
2 2 1 1 - - - -
Stephen Johns2
8 7 4 4 - - 4 4
Rebecca McGrath2
8 7 - - 4 4 4 4
Danny Peeters2
7 6 - - - - - -
Phillip Pryke 8 8 4 4 4 4 - -
Anthony Rozic 7 7 - - - - - -
Jim Sloman3
2 2 - - 1 1 2 2
Penny Winn4
8 8 3 3 1 1 4 4
Risk and Compliance
Committee meetingsBoard meetings
Audit Committee
meetings
Remuneration and
Nomination Committee
meetings
Goodman Group Directors’ report
for the year ended 30 June 2019
Remuneration report - audited
20
Dear Securityholders,
On behalf of the Board, we are pleased to present the 2019 remuneration report. It outlines Goodman’s remuneration strategy and the changes we have made following stakeholder feedback. Goodman’s remuneration framework is integral to attracting and retaining high quality professionals with local expertise, who develop businesses and relationships globally and drive Goodman’s long-term success. It is integral to the exceptional results delivered for Securityholders.
Performance It has been another strong year of performance for the Group, following ten years of outperforming its peer group locally and globally.
Total Securityholder return (TSR)
1 year
%
3 years
%
5 years
%
10 years
%
Goodman1 59.4 123.2 223.4 927.1
S&P/ASX 20 14.3 45.0 40.7 152.7
S&P/ASX 100 12.6 44.7 52.9 165.1
S&P/ASX 200 A-REIT 19.3 26.4 89.4 269.8
MSCI World REITs 13.6 15.5 39.2 229.5
1. Goodman TSR does not assume re-investment of distributions.
Key highlights include:
+ TSR of 59.4% in 2019 and 223.4% over the past five years (outperforming the major local and global
indices;
+ for FY19, statutory profit of $1.6 billion (+48.2%) and operating profit of $942.3 million (+11.4%), both
materially ahead of targets; and
+ in FY19, $3.8 billion of valuation growth across the platform (+10% on assets valued) and assets under
management (AUM) up 21% to $46.2 billion, and development work in progress (WIP) up 14% to $4.1
billion.
Remuneration approach
The Group’s remuneration is determined through a bottom up assessment of the region, business unit and the individual. The framework is focused on:
+ influencing long-term decision making and collaboration across business units and
international operations;
+ delivering superior Group performance on both a short-term and long-term basis; and
+ managing risk appropriately and reinforcing the Group’s cultural values and behaviour as guided by its
Code of Conduct.
We have taken a consistent and long-standing approach to remuneration. It is a partnership approach where the long-term returns of the Group are shared between Securityholders and Goodman’s people.
Our people are largely based outside Australia, and as we focus on creating the right culture, the right perspective and long-term performance, we use a structure that can be effective and understood across our global workforce. Remuneration is concentrated on long-term equity-based rewards. Aligning ALL people at Goodman with Securityholders through the Group’s remuneration policy has added significant value to Goodman. It has been a critical differentiator in generating and rewarding that long-term performance and retaining our people in a highly competitive global environment.
Goodman Group Directors’ report
for the year ended 30 June 2019
Remuneration report – audited (cont)
21
FY20 remuneration changes Following the advisory vote against our remuneration report at last year’s Annual General Meeting, the Board has engaged with investors and other stakeholders, including proxy advisors, to better understand their concerns and collate feedback on potential areas of improvement on Goodman’s remuneration policy and framework as well as our remuneration report. These discussions indicated that while the overall principles of the Group’s remuneration strategy are well supported, a number of improvements should be made to increase transparency and rigour around the remuneration structure.
In response to this, the Board has made changes to the remuneration structure and disclosures while retaining the core principles and structure of the plan. The key areas of improvement are covered in more detail in section 1.1 and include:
+ Incorporating additional disclosures in support of variable remuneration
+ Changing the operating earnings per security (EPS) hurdle under the Long Term Incentive Plan (LTIP)
to an Operating EPS hurdle range over the three years that is set at the time of each grant. This is to
give more transparency around performance expectations with graduated vesting over the range
+ Further explaining of the rationale for the use of Goodman’s operating profit in determining
remuneration outcomes
+ Explaining in more detail the comparator sets used in assessing remuneration levels.
The Board believes that these substantive improvements will enhance transparency, sustain continued focus on long-term performance and provide a fair and equitable allocation of rewards between Securityholders and Goodman’s people over the long term.
The retention of talent is critical for the long term and is increasingly challenging as opportunistic competitors seek to recruit Goodman’s high-performing teams. The Group’s remuneration policy plays a critical role in helping to ensure that the Group has the right human resources to deliver our strategy and drive performance for all stakeholders.
We will continue to engage in an open and meaningful dialogue with Securityholders and other stakeholders to enhance understanding of our policy and its contribution to Goodman’s performance as well as our understanding of Securityholder concerns and local and global market practices. We hope we can rely on your support at our 2019 Annual General Meeting in November.
1. SUMMARY OF CHANGES TO REMUNERATION1.1 Summary of changes to remunerationThe table below details the key components of the remuneration structure reviewed by the Board for FY20 and the rationale for the outcome:
Area reviewed Change Rationale
More information
LTIP Operating
EPS performance
hurdle (see
section 1.2)
YES Performance rights assessed under the Operating EPS hurdle to remain at a weighting of
75%. However, for FY20 and future grants, testing criteria will change. For the FY20 grant:
– the Board will set an Operating EPS hurdle to grow Operating EPS to a range of
outcomes between Threshold level and Upper level over the three year testing period.
– 25% of performance rights will satisfy the hurdle at the Threshold level and 100% will
satisfy the hurdle at the Upper level, with a sliding scale of vesting for outcomes
between this range.
– the Operating EPS range will be set with reference a number of factors including market
indices, global forecasts and the economic environment to ensure they are competitive
and challenging but allow Goodman to maintain appropriate risk settings.
This improves the existing system by:
– formalising the required growth rates over the entire testing period at the time of grant;
and
– removing “cliff vesting” by providing for graduated vesting on a straight-line basis where
25% of LTIP satisfy the hurdle at the Threshold level and 100% at the Upper level.
Section 1.2
LTIP TSR
performance
hurdle
NO Performance rights assessed under the relative TSR hurdle remain at a weighting of 25%.
TSR impacts the value of all performance rights, which is the primary form of
remuneration. Therefore, the impact of the 25% weighting to TSR is understated in relation
to the overall alignment with Securityholders.
TSR (through growth in the value of securities) provides an effective check against
increasing risk practices within the Group as the security price will reflect the market
perceived risk of the Group.
Peer group for relative TSR is to remain the S&P/ASX 100, which correlates with the
majority of our investors’ benchmarks relevant to security holdings.
Section 3.1
LTIP testing and
vesting period
NO Testing period remains three years. Vesting of performance rights will still occur in three
equal tranches shortly after years 3, 4 and 5.
Section 3.1
LTIP – cliff
vesting
YES The three year testing range provides for graduated vesting; 25% at the Threshold Level
and 100% at the Upper level.
Section 3.1
Operating EPS
calculation
NO Operating EPS will continue to be based on the Group’s operating profit as consistently
achievements across financial and non-financial items.
Section 4.8
Perception that
STI and long-term
incentive (LTI)
use the same
metrics
YES Requirements for awarding of STI and testing of performance rights are distinctly different.
For any individual STI awards to be granted, two gates must be achieved first: (1) meeting
Goodman behavioural expectation per the Code of Conduct; and (2) achieving Operating
EPS based on the annual forecast.
The Board intends to continue to announce an annual forecast Operating EPS each year
with the release of the full year results.
LTIP vesting is based on a range of outcomes using Operating EPS and TSR performance
hurdles tested over three years (discussed above).
Section 3.1
LTI cap NO The number of performance rights outstanding under the LTIP is capped at 5% of total issued securities and covers the entire employee population globally. As performance rights vest over 5 years, this effectively limits annual grants to an average of 1% of total issued securities per annum. For FY20 awards, the number of performance rights intended to be issued has reduced by 33% compared to the prior year’s award, primarily reflecting the increase in security price over the past year,
Under the new performance measures, the three year Operating EPS hurdle must be met after allowing for full dilution resulting from securities issued through vesting and those to be issued as a result of testing over the measurement period.
Section 3.1
and 6.2
Quantum
assessment
YES The Board uses local and global labour market comparators, more relevant to the
competitive nature of our global workforce, including reference to S&P/ASX companies
with global operations, private equity, fund managers and developers. The number of
performance rights declined significantly.
Section 3.5
STI cap NO STI will remain capped at 150% of fixed remuneration for executive KMP, with 50%
deferred 12 months.
Section 6.1
Goodman Group Directors’ report
for the year ended 30 June 2019
Remuneration report – audited (cont)
23
1.2 Establishing performance hurdles
For FY20 awards under the LTIP, the Board has introduced an Operating EPS performance hurdle range for testing performance rights. This improves the current performance hurdle by:
+ formalising the required growth rates over the entire testing period at the time of grant; and
+ providing for graduated vesting on a straight-line basis where 25% of performance rights satisfy the
hurdle at the Threshold level and 100% at Upper level.
The hurdle range is for the purpose of remuneration only, specifically the testing criteria for vesting of performance rights. The range does not constitute earnings guidance for the Group. The Board has set an Operating EPS performance hurdle of growing Operating EPS from the FY19 result of 51.6 cents to between 61.4cents (Threshold level) and 66.8cents (Upper level) in FY22. At the Threshold level, 25% satisfy the hurdle with a sliding scale up to 100% satisfying the hurdle at the Upper level. This range is equivalent to between 6% and 9% compound annual growth rate (CAGR) in Operating EPS or approximately 19% to 30% over the three year testing period.
The range has been set with reference to:
+ the range of potential opportunities for the Group globally;
+ the long-run historical performance of the Group;
+ the global economic environment, noting that the current rate of inflation in Australia and the major
markets in which Goodman operates globally is around 2% and the current 10 year rate of interest on
government securities in Australia and most major markets is below 2% per annum;
+ the average rate of EPS growth from other large Australian companies and REITs is in the order of 2%
to 4% per annum based on a range of broker estimates; and
+ the desire to achieve a sustainable long-term growth rate that is robust and competitive with the market
on a risk adjusted basis, reflecting the low financial leverage of Goodman and other risk settings.
Increasing hurdles to unsustainable levels based on current risk parameters will encourage riskier
behaviour, inconsistent with an acceptable tolerance and framework. This could potentially lead to
lower quality earnings and adversely affect the intent of the LTIP.
The Board also notes that the range is set for the entire period of the grant and hence performance must be achieved regardless of changes to business conditions globally. Management and other employees carry the risk associated with external factors negatively impacting Operating EPS. Importantly, the Operating EPS performance hurdle calculation includes all securities issued under the LTIP through the testing period and the additional tested (but not vested) performance rights. The Board believe the hurdle is:
+ competitive with the market and peer groups;
+ challenging for management; and
+ appropriate in the context of the current business risk settings.
Operating EPS performance hurdle considerations for FY20 hurdles
1Broker estimates
Economic indicators Australia (% pa) United States (% pa) Europe (% pa)
10 year bond rates 1.1 1.6 -0.1
Inflation 1.6 1.6 1.86
Thresholds and comparisons EPS (cents) CAGR in EPS Cumulative growth
in EPS
Proposed Threshold level 61.4 6% 19.0%
Proposed Upper level 66.8 9% 29.6%
S&P/ASX 100 FY20-22 (Broker estimates and FactSet) n/a 2.5% 7.6%
S&P/ASX 200 A-REIT FY20-22 (ex Goodman)
n/a 2.7%1 8.4%1
Goodman Group Directors’ report
for the year ended 30 June 2019
Remuneration report – audited (cont)
24
2. SUMMARY OF REMUNERATION OUTCOMES
Executive remuneration mix
― Remuneration mix is significantly weighted to at-risk pay.
― Group Chief Executive Officer (CEO) vested remuneration was
91% at-risk in the form of LTI (no STI).
― Executive KMP remuneration 89% at-risk ― The Board determined that Anthony Rozic’s fixed remuneration
be benchmarked to the US market and paid in US$ to reflect
his responsibilities as CEO, North America, with effect from 1
January 2019. His new fixed remuneration is US$700,000.
Total remuneration FY19 (vested)
STI outcomes
― Key performance indicators (KPIs) for the executive KMPs are
aligned with sustainable delivery of financial, environmental
and strategic results to Securityholders.
― While LTI is the focus of remuneration, STI is important in
reflecting exceptional performance on a year-on-year basis and
offsets the low base pay.
― Executive KMP (excluding Group CEO) average STI as a % of
maximum was 89%.
― Executive KMP (excluding Group CEO) STI increased slightly
compared to FY18 primarily due to the outperformance of the
Operating EPS target.
Financial performance highlights
― FY19 Operating EPS growth of 10.5% vs target of 7%
― TSR of 59.4% for FY19 and top performing S&P/ASX20 company
by TSR
― Maintained low financial leverage with gearing at 9.7%
― Operating profit growth of 11.4%
― AUM growth of 21% to $46.2 billion and development WIP
increased 14% to record level at $4.1 billion
― Weighted average Partnership returns of 15.9%
― Two Partnerships were awarded ‘Sector Leader’ in their respective
peer groups in the Global Real Estate Sustainability Benchmark
(GRESB)
Non-financial performance highlights
― Development of a contemporary global sustainability strategy with
defined targets to 2030
― Significant community impact made by the Goodman Foundation
through grants, in-kind donations and volunteering and fund raising
efforts of Goodman people around the world
― Continued improvement in ratings from GRESB and Sustainalytics
LTI outcomes Outcomes of historic grants:
― FY16 grant, measured at the end of FY19:
― Operating EPS (75% weighting): tested against
Operating EPS hurdle over three years – vested at
100%
― TSR (25% weighting): relative TSR percentile ranking
tested against S&P/ASX 100 – vested at 100%
Three year growth in EPS of 29% vs target of 20% TSR TSR over three years of 123.2% vs S&P/ASX 100 at 44.7%
― Total increase in Securityholder value of $10 billion in FY19
― 94th percentile relative to the S&P/ASX 100 over the three year
testing period
Goodman Group Directors’ report
for the year ended 30 June 2019
Remuneration report – audited (cont)
25
3. REMUNERATION PHILOSOPHY AND LINK TO BUSINESS STRATEGY
Goodman is a globally diversified real estate fund manager and one of the largest listed industrial property groups globally with 68% of earnings outside Australia and 72% of earnings from active development and management businesses. Consequently, Goodman’s remuneration structure has some key differences from the Australian market. This reflects the requirements of the labour market we are competing in globally, not just Australia, and the objective of aligning multiple regional businesses and operational segments with Group performance outcomes.
The Board:
+ encourages management to take a long-term strategic rather than opportunistic approach to the
Group’s property and investment management businesses as it can take significant time to create
value;
+ has overlaid the operational, financial and human strategy focused on this process in order to create
long-term sustainable returns; and
+ focuses on cash profit as the most tangible means of measuring long-term value creation for
Securityholders.
Given the cyclical nature of real estate, incentive structures within real estate businesses are highly outcome driven (particularly private equity real estate managers where the majority of institutional assets reside). The Group’s remuneration framework is therefore focused on influencing long-term decision making and collaboration across business units and international operations to derive sustainable outcomes. This may result in capital and resource allocations shifting over time, which are aimed to deliver the best risk adjusted returns overall, at the expense of one part of the business and to the benefit of another. This requires collaboration across regions and divisions and long-term thinking which is encouraged by the Group’s remuneration structure.
The Board annually considers remuneration with a three to five year view. It considers how the performance of the Group has been influenced by the decisions over the last three to five years and how it expects the business to perform over the next three to five years. It is not solely an exercise in reviewing a single year. This drives several key principles of remuneration at Goodman:
+ focus on LTI as the predominant source of pay for performance. All employees are eligible to receive
LTI grants as a material component of remuneration (see section 4.7), ensuring alignment and reward
with Securityholders across the Group;
+ focus on cash profits as the primary testing measure for grants. This aligns the deliverable outcomes of
all employees globally with Goodman’s aspirations of long-term cash flow growth, resilience and
sustainability (see section 3.2);
+ collaboration to achieve Group-wide targets across regions and business units; and
+ a culture of ownership, inclusion and alignment.
The Board believes the success of Goodman is primarily due to the depth of talent globally executing a strategy that requires strong collaboration and the culture of inclusion created by the LTIP. The Board believes that Goodman’s LTIP is unique in the Australian market.
Our human capital is therefore critical to the continued success of our business over the next five years. The retention of people is critical for the long term and is increasingly challenging as opportunistic competitors seek to recruit Goodman’s teams.
Goodman Group Directors’ report
for the year ended 30 June 2019
Remuneration report – audited (cont)
26
3.1 Objectives of remuneration strategy
Attract Reward Long-term alignment of our people and Securityholders
Remuneration structure Performance conditions Alignment with strategy and long-term performance Fixed remuneration
Low fixed costs
Scope and complexity of the role,
individual absolute and relative
comparison in the relevant market
and comparator group
Real estate investment management and development are cyclical so
fixed employee costs are kept low.
At-
risk r
em
unera
tio
n
Short-term at-risk
remuneration
Group CEO: 0% of
remuneration Other
executive KMP: 10%-15%
of total remuneration
For executive KMP: 50% of
STI paid in cash after
release of full year results
and 50% deferred for 12
months
STI is an at-risk award for
outperformance over the
past 12 months.
Failure to meet STI gates
(i.e. Code of Conduct and
Operating EPS) will result in
zero award.
Gate 1: meeting Goodman
behavioural expectation per the
Code of Conduct
Gate 2: achieving Operating EPS
target
Financial measures
The Group’s financial objectives
vary with strategic priorities but
include:
― level of Operating EPS growth
― property investment
performance
― development performance
― Partnership performance
― capital management
Non-financial considerations
A balance of measures that
underpin the sustainability of the
business including environmental
commitments, customer
satisfaction, and Partnership
performance, risk management,
safety and diversity
Assessment of conduct is continual
in the organisation and is a gate to
any STI. The Board believes it is an
absolute and hence applying a
percentage weighting to the
measure is less effective.
STI is an at-risk component, rewarding financial and non-financial
performance against objectives of the individual and the Group. Awards
have varied from 0% in FY10 to 100% of the maximum and have
averaged 79% of maximum allowable over ten years.
The performance of individuals is assessed through a detailed bottom
up performance appraisal process based on contribution to defined
objectives that reflect behavioural expectations, annual contribution to
results as well as strategic and other contributions where these results
or benefits may be reflected in future years. Base salaries for the
executive KMP roles are set low versus peers and this is carried through
in lower STI outcomes.
Operating profit growth and capital management are of the highest
importance in financial assessment. These factors together encourage
not only the Operating EPS targets being met but also the method in
which they are met matches appropriate risk and quality settings.
This structure is simple and transparent and aligns management with
the Operating EPS growth expectations of Securityholders.
At senior executive level in the Group, the focus on STI as a form of
reward has reduced in favour of LTI, in line with a culture and ethos of
sustainable outcomes.
STI awards are used by the Board to reward exceptional performance
such as those in the FY19 results.
LTI at-risk remuneration
Rewards long-term
sustained performance
Will be awarded in FY20 as
a result of FY19
performance achievements
and expected future
contributions
Issued as performance
rights tested over three
years and vesting over
three to five years
Encourages a more
collaborative approach and
broader distribution of
performance across the
entire workforce when the
Group is performing, not
just executive KMP
For proposed FY20 grant:
― Operating EPS hurdle range
(75%)
― relative TSR against the
S&P/ASX100 (25%) - this
aligns with investors’
benchmarks relevant to their
holdings and provides closest
alignment with their
performance
Operating EPS is a critical measure of long-term performance (see
section 3.2).
Hurdles are set to be competitive and challenging (see section 1.2)
relative to external and internal reference points.
TSR and Operating EPS cohabitate as TSR impacts the value of all
performance rights, so the impact of the 25% weighting is understated in
relation to its importance in overall alignment.
TSR provides an effective check against increasing risk practices within
the Group. The price to earnings multiple attributable to securities will
reflect the perceived risk in achieving Operating EPS targets, which
impacts vesting and the ultimate value upon vesting.
The weighting to LTI is believed to be the best way of rewarding
sustained performance and retaining talent.
The significant security price rise has seen the expected number of
performance rights to be issued in FY20 decrease by 33%, resulting in
less future dilution of Operating EPS.
The total number of performance rights outstanding under the LTIP
equates to 4.4% of the Group’s issued securities. If all hurdles are
achieved, then this would mean the number of performance rights
vesting each year is approximately 1% of the total securities on issue.
FY20 intended performance rights represent a significantly lower
percentage of issued securities.
Goodman Group Directors’ report
for the year ended 30 June 2019
Remuneration report – audited (cont)
27
3.2 Operating EPS
The Group provides Statutory profit disclosure in accordance with Australian Accounting Standards, including all required specific disclosures. The Board believes that managing the business on what is primarily a cash profit basis is fundamental to long-term cash flow and is the strongest determinant of value creation over time. That is the intent of the operating profit definition. The measure has been consistently applied for 14 years.
+ Operating profit intentionally excludes non-cash measures which can lead to anomalies over time and
which may cause structural cash and liquidity mismatches. In the past, the Group has excluded
significant cash realised profits (such as the urban renewal realisation gains) where these were
believed to be cyclical in nature and not reflective of long-term earnings. The measure represents a key
link between the impactable operational outcomes at an individual level and the overall outcomes
which create Securityholder value for the Group, directly reflected in Operating EPS measures.
+ It is important as a transparent driver of employee behaviour in all aspects of the business from
location selection, to quality of product, dealings with partners and financial leverage among other
things. This aims to drive long-term capital and human resources decisions without adding volatility.
+ Outcomes for employees through the LTIP and equity performance are directly aligned with the long-
term cash profit growth of the business on a per security basis, which is believed to be the real driver of
performance.
In addition, the proposed three year hurdle will account for any dilution over the three years through successful testing of prior year grants. This is because the Operating EPS hurdle range must be met allowing for all securities vested during the three year period and securities tested but unvested in year 3 in the weighted average securities calculation.
The share based payments (SBP) expense reflects the amortisation of the aggregated fair value applicable to outstanding performance rights grants. It is disclosed and expensed in our statutory accounts per the accounting standards. Like other non-cash items (such as revaluations), SBP are excluded from our operating profit. Importantly for Securityholders, the Board believes that SBP:
+ have no impact on Securityholder value until they vest;
+ do not reflect the cost of the plan to Securityholders or the true value to employees; and
+ increase volatility and decrease earnings transparency on a short term basis depending on movements
in security price, subjective assessments and other valuation parameters.
Prior to vesting, performance rights have no entitlement to income or net assets, therefore no dilution to Securityholders
+ the financial impact of the performance rights occurs only when securities are issued through the
dilution impact at the time of issuance and future EPS dilution;
+ this only occurs if testing / vesting criteria are passed and by extension, the Group’s performance has
achieved / exceeded performance criteria;
+ not all performance rights necessarily vest;
+ following successful testing at year three, only one third of the tested performance rights vest. The
remainder have no rights until they vest, following the end of years four and five; and
+ Goodman includes all tested performance rights (even those which have been tested but have not
vested) in the denominator when calculating Operating EPS. The Board considers this to
be conservative.
Goodman Group Directors’ report
for the year ended 30 June 2019
Remuneration report – audited (cont)
28
3.3 When is remuneration earned and received?
The Group CEO’s performance based pay for FY19 performance will be 100% awarded in the form of an LTI grant (to be made post the Annual General Meeting in November 2019 subject to Securityholder approval) that will be tested in future periods. This means the Group CEO must achieve performance goals over a period of three years to qualify for performance based pay. Vesting then occurs in equal tranches after years three to five. However, there is no certainty of vesting and the final outcome is dependent on the movement in the security price over the next five years.
A significant proportion (69-78%) of the executive KMP (excluding Group CEO) performance based pay for FY19 will also be delivered in the form of performance rights. The chart below illustrates the Group’s remuneration component and timing of receipt, noting that the Group CEO is not receiving an STI for FY19.
3.4 Remuneration components for executive KMP
The chart below illustrates the potential components of remuneration using:
+ current fixed base pay;
+ the maximum potential STI outcome (equivalent to 150% of fixed base pay); and
+ an LTI value using 100% of intended grant to be made in FY20 at $15.03 per right, which was the
security price at 30 June 2019.
This analysis is different to both the statutory presentation of remuneration and the vested remuneration analysis, which are discussed later in the remuneration report. This chart reflects the significant level of overall remuneration that is at risk, which is a key consideration for the Board in its determination of STI and LTI awards in respect of FY19 performance.
Goodman Group Directors’ report
for the year ended 30 June 2019
Remuneration report – audited (cont)
29
3.5 Peer group and quantum assessment
Goodman is the 14th largest entity listed on the ASX, and a member of the S&P/ASX 20 index. The Group has limited direct comparable real estate market peers in Australia, with it having operating businesses in five continents and 17 countries, each with market driven remuneration outcomes. It is not just a collection of domestic assets like most Australian REITs. The Group’s 959 staff are mostly offshore, and consequently Goodman competes for labour in an international market. When assessing the quantum of remuneration awards the Board considers:
+ 72% of earnings are from management and development activities which require more intensive day to
day activity than a passive investment portfolio;
+ the Group provides its customers and partners with investment management, asset management,
development, financial, transaction and capital management services in the listed and private equity
capital markets globally; and
+ 68% of earnings are generated in international markets and 80% of employees are situated offshore.
Goodman’s Partnerships include a far greater volume of assets and revenues than those shown in Goodman’s financial statements. Employees manage and create value in respect of $46 billion of assets globally, generated a combined statutory profit of $5 billion in FY19 and construct around $4 billion of new development product per annum. The performance and returns from this manifest in Group performance which flows through to remuneration.
3.6 Various peer group CEO comparators considered by the Board
Peer group comparator
Reason for comparison
Annual remuneration1
Annual remuneration
average1 Offshore earnings
1 year TSR
5 years TSR
Goodman N/A $14.9m $14.9m 68%
59.4%
223.4%
S&P/ASX 20 Goodman is number 14 in the S&P/ASX 20 index.
$3m-$20m $12m n/a 14.3%
40.7%
Selected ASX companies with global operations
68% of GMG earnings are outside Australia. The comparator group is slightly less on average and has similar average operating earnings before interest and tax. It provides a reference for local companies operating offshore in a number of industries.
$4.7m-$20m $11m
56%
9.8%
141.3%
Global REITs including Australia
Goodman is the largest REIT in Australia by market capitalisation and one of the largest global industrial property entities.
$6m-$53m $15m n/a 14.3%2 21.1% pa2
1. Reflects fixed base pay and the face value of the intended award of performance rights, using the closing Goodman security price of $15.03 at 30 June 2019. Peer group comparator information is calculated using ISS pay benchmarking data and methodology.
2. One year and five year TSR reflects the MSCI World REITs index.
3. Private equity managers were also considered for comparison, particularly with respect to the nature of pay for performance remuneration structures in those types of enterprises.
The assessment and presentation of the allocations of SBP awards in the table above use face value metrics, as is market practice. That is, no discount is applied to SBP for vesting risk or time value of money. The Board has considered the total remuneration noting its determination that the Group CEO will continue not to participate in the STI award, and 91% of his remuneration for FY19 performance will be taken in the form of at-risk performance rights. This means that the Group CEO may not receive any incentive in respect of his performance for FY19 if the Group does not meet its performance hurdles under the LTIP over the next three years. Furthermore, the award will be subject to Goodman’s security price performance over the next five years. In the Board’s opinion, this results in a more significant at-risk element to the Group CEO’s remuneration compared to other ASX listed companies.
Goodman Group Directors’ report
for the year ended 30 June 2019
Remuneration report – audited (cont)
30
4. REMUNERATION OUTCOMES AND THE LINK BETWEEN PERFORMANCE AND REWARD
4.1 Group FY19 highlights
+ Goodman outperformed the major local indices (S&P/ASX 20, S&P/ASX 100, S&P/ASX 200 A-REIT)
and the global MSCI World REIT index over one, three and five years
+ Goodman was the largest real estate entity listed on the ASX. The Group’s equity market capitalisation
increased by $10 billion to $27 billion at 30 June 2019.
Financial
Statutory profit of $1,628 million (up 48.2% on FY18)
Operating profit of $942.3 million (up 11.4% on FY18)
Operating EPS of 51.6 cents (up 10.5% on FY18)
Distribution of 30.0 cents per security
Net tangibles assets (NTA) per security increased 15.1% to $5.34 per security
Operational property investment, management and development
High occupancy maintained at 98% and like for like net property income growth of 3.3%
Total AUM of $46.2 billion (up 21% on FY18)
Management earnings up 48% to $469.7 million
Commenced $4.2 billion of new developments and completed $3.9 billion
People and culture
All permanent employees are equity owners through the LTIP
Significant community impact made by the Goodman Foundation through grants, in-kind donations and volunteering and fundraising efforts of Goodman people around the world
Implemented strategies to improve labour standards, fair work practices, improve ethics and eradicate potential instances of modern day slavery in our supply chains
Lead safety performance metrics have reduced safety non-conformances in Goodman’s projects and asset management operations.
Promotion and application of the Goodman values integrated throughout the business
Environmental
100% of Goodman’s developments globally included sustainable design initiatives. The Group committed to 100% carbon neutral operations by 2025
Two Partnerships were awarded ‘Sector Leader’ for their respective peer groups in the 2018 GRESB with all previously rated Partnerships awarded GRESB 3 star+. Sustainalytics rating also materially improved
Commitment to TCFD (Task Force on Climate-related Financial Disclosures) regime
30MW+ of solar PV installed across Goodman’s portfolio globally
Capital management
Debt refinancing transactions totalling $2.8 billion and over $6.0 billion of hedging transactions for the Group and Partnerships
Low gearing at 9.7%
$2.7 billion of available liquidity, $1.6 billion in cash in the Group
Goodman Group Directors’ report
for the year ended 30 June 2019
Remuneration report – audited (cont)
31
4.2 Long-term results
In addition to the FY19 results, performance has been demonstrated over many years through specific actions of the Board and management including:
+ $21 billion in Securityholder value generated over five years;
+ significant reduction in financial leverage (gearing) since 2009 from 47.9% to 9.7%;
+ diversification of the Group’s sources of debt and tenor;
+ increased quality of the property portfolio through over $15 billion asset sales since 2013 and
concentrating the portfolio in predominantly urban infill markets;
+ reduced operational leverage through partnering of development activity, reducing volatility of earnings
but increasing return on assets (ROA). The impact of increased development within the Partnerships
has increased their returns and also the prospects for performance fees in the medium to longer term;
+ significant sales of assets that were reconfigured for higher and better residential use. On these
transactions, the substantial profit was not included in operating profit despite being cash realised gains
as they were believed to be over and above the usual course of business;
+ conservative pay-out ratio to retain funding for growing development demand; and
+ the focus on growing operating profit, which mirrors cash profit, has strengthened alignment with actual
and realised returns.
4.3 Code of Conduct The manner in which employees conduct themselves is crucial to the success of the Group. Goodman has consistent and transparent practices in place for managing non-compliance with policies and the approach to risk guides the way all employees are expected to conduct themselves. Within the Code of Conduct there is a set of eight guiding principles that encourage employees to uphold Goodman’s reputation and behave appropriately in dealing with our customers and other team members. Employees are assessed continually against these principles. The guiding principles are:
+ Act in a professional manner
+ Work as a team and respect others
+ Treat stakeholders fairly
+ Value honesty and integrity
+ Follow the law and our policies
+ Respect confidentiality and do not misuse information
+ Manage conflicts of interest
+ Strive to be a great team member
The Board also believes that ownership through the LTIP embeds a culture of inclusion and sense of place in Goodman. While assessment is continual, the Code of Conduct is a gate for individuals being eligible to receive a STI at the time of assessment. The Board believes this is an absolute requirement and hence applying a percentage to the measure is less effective. The proportional impact of this measure on STI can be anything from 0% -100%, as any breach of the code can have levels of severity ranging from cessation of employment to minor performance issues which can be managed and rectified and may require varying levels of financial impact, training and/ or personal development.
Security price as at 30 June ($) 5.05 6.27 7.11 7.87 9.62 15.03
Distributions per security (cents) 20.7 22.2 24.0 25.9 28.0 30.0
TSR (%) 10.7 30.0 17.0 14.2 26.0 59.4
TSR ($B)1 0.7 2.7 2.0 2.0 3.7 10.6
NTA per security ($) 2.88 3.46 4.10 4.21 4.64 5.34
Growth in NTA ($B) 0.4 1.1 1.2 0.2 0.9 1.3
Gearing (%) 19.5 17.3 11.8 5.9 5.1 9.7
AUM ($B) 26.8 30.3 34.1 34.6 38.3 46.2
Market capitalisation premium to NTA ($B) 3.8 4.9 5.4 6.6 9.0 17.6
1 TSR = Increase in market capitalisation plus dividend and distribution, attributable to the respective financial year.
The key financial metrics which are aligned with the Group’s strategy, long-term performance and STI and LTI programmes for all employees are Operating EPS and TSR. CAGR in Operating EPS over the past five years has been 8.2%, which has exceeded the forecasts and therefore the hurdles. This has been achieved while at the same time gearing has been reduced.
Goodman Group Directors’ report
for the year ended 30 June 2019
Remuneration report – audited (cont)
33
4.5 Total returns comparison
The Group is included in the S&P/ASX20 index and is the largest Australian real estate entity. The charts below show the Group’s TSR has significantly outperformed the S&P/ASX 20, S&P/ASX 100, S&P/ASX 200 AREIT indices and the MSCI World REITs index over the past five years.
TSR for the Group versus comparable indices is detailed below:
Total Securityholder return (TSR)
1 year
%
3 years
%
5 years
%
10 years
%
Goodman1 59.4 123.2 223.4 927.1
S&P/ASX 20 14.3 45.0 40.7 152.7
S&P/ASX 100 12.6 44.7 52.9 165.1
S&P/ASX 200 A-REIT 19.3 26.4 89.4 269.8
MSCI World REITs 13.6 15.5 39.2 229.5
1. Goodman TSR does not assume re-investment of distributions.
Goodman Group Directors’ report
for the year ended 30 June 2019
Remuneration report – audited (cont)
34
4.6 Group CEO remuneration and Goodman performance outcomes
The charts below demonstrate the performance of the Group and various key metrics relative to the Group CEO’s vested remuneration outcomes in FY19 and prior years. Vested remuneration is often considered by stakeholders as it represents the value that is actually received by the KMP during the year. It includes fixed base pay, STI and the value of performance rights that vested during the year, using the closing Goodman security price on the day of vesting.
The charts illustrate significant alignment of Group CEO remuneration outcomes and the key metrics for testing and vesting of performance rights. Significant operating profit growth, security price growth and consequently TSR for Securityholders, correlate with increased Group CEO remuneration. Importantly Group CEO vested remuneration as a proportion of TSR (shown in the chart below) and statutory profit has continued to decline, indicating that the Securityholders have experienced a more than proportionate benefit from the Group’s performance relative to the Group CEO.
4.7 Remuneration mix alignment across the Group
The Board believes that the alignment between pay and long-term performance is evidenced by the significant portion of at-risk remuneration for the Group CEO, the other executive KMP and the organisation as a whole, that is in the form of LTI. In FY19:
+ 91% of the Group CEO vested remuneration was in the form of LTI, reflecting consistent growth in
Operating EPS and security price over the period
+ 74% of the executive KMP vested remuneration (on average) was in the form of LTI
+ around 36% of all other employees’ vested remuneration excluding executive KMP (on average) was in
the form of LTI.
Future remuneration outcomes will depend on the Group achieving its hurdles over the long term and the security price.
The at-risk portion of remuneration (FY19 STI and performance rights vested in FY19) as a proportion of total remuneration for the Group CEO, other executive KMP and remainder of employees, is illustrated in the charts overleaf. They show strong alignment between Securityholders and all employees.
Goodman Group Directors’ report
for the year ended 30 June 2019
Remuneration report – audited (cont)
35
4.8 FY19 performance achievements
Group CEO – Gregory Goodman Executive Director, Corporate – Danny Peeters
– Developed and drove consistent global business strategy
across all markets to position the company to deliver long-
term, high quality sustainable growth
– Delivered strong and sustained TSR of 59% in FY19 and
223% over five years
– Statutory profit of $1,628 million, up 48% on FY18
– Operating profit of $942 million, up 11.4% on FY18
– Operating EPS of 51.6 cents (up 10.5% on FY18)
– NTA increased 15.1% to $5.34 per security.
– Successfully oversaw business operations in Continental
Europe and Brazil, playing a critical role in communicating
and reinforcing the Group’s strategy in these diverse
regions
– Outperformance against all key performance and financial
parameters.
– Maintained low financial leverage and strong Group
balance sheet with $2.7 billion of liquidity
– Continued to pursue improved sustainability initiatives and
programmes including commitment to TCFD compliance by
2022, and zero carbon emissions for the Group by 2025
– Continued to foster a culture that focused on delivering
quality across all aspects of the business: people,
properties and service
– Reinforced Goodman’s purpose aimed at understanding the
drivers of change and the needs of our customers and all
–– Continental Europe and Brazil contributed 27% of Group
earnings, significantly ahead of budget
– Strong development results with very active development
pipeline, c800,000 sqm of commencements and
continued to secure strong development pipeline moving
into FY20
– Supported the integration of the Brazil operation into the
global network.
– Continued to show leadership for all employees and
alignment with Securityholders through the LTIP as the
preferred form of remuneration by taking 100% of
performance based remuneration in performance rights
– Continued to drive global internal programmes to promote a
strong culture of inclusion, collaboration and conduct across
the organisation, underpinned by the long held principles in
the Code of Conduct, treating all stakeholders with integrity,
and accountability, always.
–– In Europe, completed sales programme to reposition the
stabilised portfolio towards infill, consumption-focused
locations:
– current AUM at $8 billion
– occupancy of 97% and weighted average lease
expiry of 5.2 years
– total investment return of 11%, while maintaining
conservative gearing.
– Increased the Goodman Foundation commitment to $50
million over the next 10 years with $5.7 million contributed
in FY19 and the Goodman team globally contributed 13,000
hours of service through the year. The Foundation focuses
on children and youth, community and its health, and food
rescue and the environment. Meal programmes and food
rescue have provided around 130 million meals globally.
– In Brazil, played key role in overseeing successful first
year of Investment Partnership:
– continued to secure significant infill land banks for
GLBP supporting gross lettable area of more than
400,000 sqm
– provided guidance in a complex acquisition and
development environment effecting on-target
performance
– embedded key controls and culture with the team
working cohesively and capability increasing.
Goodman Group Directors’ report
for the year ended 30 June 2019
Remuneration report – audited (cont)
36
CEO, North America and Deputy Group CEO –
Anthony Rozic
Group Head of Equities – Nick Kurtis
– Successfully oversaw strong growth in business operations
in North America
– Critical role in communicating and reinforcing the Group’s
strategy in the region
– Strong performance against FY19 targets
– Oversaw the strategies of the Partnerships to
successfully deliver significant total returns. Partnership
investment portfolio delivered:
– annualised total return of 15.9% for FY19
– average annualised total return of 16.4% over the
past five years.
– Positioned North American business over FY19 with focus
on pre-leasing developments, replenishing the land/value-
add inventory and maintaining focused team. Emphasis on
developing major infill sites and value-add development
skillsets
– Continued development of high-quality portfolio and strong
differentiated brand position focused in strategic locations
close to large urban populations.
– – Oversaw increase in divisional earnings to $470 million.
– outperformance leading to strong performance fees
of $204 million
– Growth in third-party AUM up 22% to $42.9 billion
– strong asset selection focus resulting in superior
property level returns
– Strong leadership in embedding the Goodman values in the
behaviour of the team and encouraging teamwork with
respect
– Building team capabilities and skill sets for complex
acquisitions and developments
– Consistently integrated the US business into Goodman
network through introduction of global processes and tools.
– – Maintained strong investor relationships and successful
communication of Partnership strategies and alignment of
interests with investors
– Successfully executed continuation of several
Partnerships through the course of FY19
– Raised $2.4 billion of additional equity to bring total
available liquidity in the Partnerships to $13.6 billion
– Aligned the Group and Partnerships’ long-term
investment strategy to optimise financial outcomes.
Group Chief Risk Officer – Michael O’Sullivan Group Chief Financial Officer – Nick Vrondas
– Continued to implement risk frameworks with improved
outcomes across the Group and Managed Partnerships in
FY19 adapting to the structural changes driving our
business including nature and scale of development
projects globally
– Successfully developed and played a key role in the
execution of the business strategy including the
management and allocation of capital that has delivered
strong returns to investors over several years, culminating
in strong operating profit growth, representing 10.5%
Operating EPS growth in FY19
– Performed a critical role in commercial oversight and
assessment of globally complex transactions for the Group
in order to allow the required level of autonomy at a
regional level within delegated authority limits
– A heightened level of activity for Group Risk through Group
Investment Committee process including:
– $4.2 billion in development commencements and $3.9
billion of completions
– $2.4 billion of asset sales within the Group and to
external parties globally
– $2.6 billion of global acquisitions
– 15 business plans and Partnership strategy proposals
across $42.9 billion of global assets.
– – Continued improvements in financial reporting to facilitate
active business management
– building improvements and resilience into systems
and controls framework
– strengthened monitoring, coordination and
consolidation of financial performance and financial
position of regional business units and divisions to
achieve budgets and financial plans
– Led operational improvements in relation to business
processes, IT and business intelligence applications
– Updated and improved various operational policies to
enhance compliance
– Managed the financial risk management practices
through variable market conditions, consistently reducing
overall risk
– Established a track record in the debt capital markets that
has facilitated strong support for Group issuances
Goodman Group Directors’ report
for the year ended 30 June 2019
Remuneration report – audited (cont)
37
Group Chief Risk Officer – Michael O’Sullivan (cont)
– Group Chief Financial Officer – Nick Vrondas (cont)
– Coordinated Group Corporate Service functions, in the
identification and monitoring of non-financial risks including
internal audit, safety, sustainability, insurance, data storage
and business continuity planning
– Engaged insurance brokers and underwriters globally to
ensure insurable risks are adequately covered
– Oversaw and aligned the Group Investment Committee
process with strategy execution, to ensure proposed
commercial outcomes remain consistent with Group
strategy
– Oversaw the development of a contemporary global
sustainability strategy with defined targets to 2030.
– – Ensured strong capital management position and
compliance with financial risk management policies of
Group and Partnerships
– oversaw debt finance transactions in banking and
debt capital markets of $2.8 billion for the Group and
its Partnerships, adding term to maturity profile and
diversity of funding sources
– effective financial risk management. Involved in and
oversaw derivative and hedge transactions of over
$6.0 billion for the Group and its Partnerships
4.9 LTI Grants in FY20 in relation to FY19 performance The remuneration awards made by the Board in respect of the executive KMP performance in FY19 comprise fixed remuneration, STI and awards under the LTIP that will be made in FY20. As discussed in section 3.1, these performance rights will be tested over FY20-FY22. The vesting of those performance rights that achieve the performance hurdles will occur in equal tranches in September 2022, September 2023 and September 2024. The minimum vesting percentage is 0% if hurdles are not met. Performance rights proposed to be awarded to the Group CEO have decreased 44% compared to the grant made in November 2018. In determining its intended award of performance rights, the Board has considered the face value for each executive KMP. This assumes 100% vesting and therefore represents the maximum value. It does not take into account the risk of achieving the performance hurdles and that performance rights have no entitlement to distributions over the vesting period.
Executive Year of
grant
Performance
rights proposed
GMG price
$
Face value of grant
$M
Gregory Goodman FY20 900,000 15.03 13.5
FY19 1,600,000 10.33 16.5
Danny Peeters FY20 350,000 15.03 5.3
FY19 550,000 10.33 5.7
Anthony Rozic FY20 380,000 15.03 5.7
FY19 600,000 10.33 6.2
Nick Kurtis FY20 380,000 15.03 5.7
FY19 600,000 10.36 6.2
Michael O’Sullivan FY20 300,000 15.03 4.5
FY19 400,000 10.36 4.1
Nick Vrondas FY20 380,000 15.03 5.7
FY19 600,000 10.36 6.2
The face values of grants have been determined using the Goodman security price at 30 June 2019 of $15.03 (FY19 based on the security price at grant date). For the Group, the maximum securities issuable under the proposed grants of performance rights to all employees, have decreased by 33% compared with the awards made during FY19. This primarily reflects the strong security price appreciation over the past 12 months.
Goodman Group Directors’ report
for the year ended 30 June 2019
Remuneration report – audited (cont)
38
4.10 STI outcomes
The Board has again determined that the Group CEO will not participate in the STI award, despite the significant outperformance of the Group compared to its benchmarks and peer groups. In line with continued focus on sustained long-term performance, all performance based remuneration relating to the Group CEO’s FY19 performance will be awarded in the form of LTI. The other executive KMP STI outcomes are up slightly on FY18, reflecting the exceptional performance across the Group. These on average reflect 89% of maximum possible STI and are individually detailed below.
Test Metrics Result
Gate 1: Behaviour Code of Conduct: Pass/ Fail Pass
Gate 2: Operating EPS - FY19 Operating EPS versus target
With effect from 1 January 2019, the Board and Remuneration Committee determined that Anthony Rozic’s fixed remuneration be benchmarked to the US market and paid in US$ to reflect his responsibilities as CEO, North America. His STI outcome for FY19 has been based off his new fixed remuneration which is now US$700,000.
4.11 Historical LTI grant outcomes
Performance rights are granted on an annual basis, are tested over three years and vest in three equal tranches shortly after the third, fourth and fifth anniversary of the grant. Testing as at 30 June 2019 was completed for the grants of performance rights made to executive KMP in FY17 (these awards were in respect of executive KMP performance in FY16). The FY17 grants had two hurdles: Operating EPS and a relative TSR, both measured over the three years ended 30 June 2019.
The mechanics of the testing are detailed in section 6.2. The first tranche of the FY17 grants will vest in September 2019, the second tranche will vest in September 2020 and the third tranche in September 2021.
Goodman Group Directors’ report
for the year ended 30 June 2019
Remuneration report – audited (cont)
39
Operating EPS hurdle (75% weighting)
The Operating EPS is calculated by dividing operating profit by the weighted average number of securities on issue adjusted to include all performance rights which have passed the testing criteria, even though they are not yet vested (issued) to account for potential EPS dilution. Operating EPS growth for the three year period to 30 June 2019 (allowing for dilution of all securities issued during the period and securities tested but not vested) was 28.7%. This compared to a cumulative three year hurdle of 20.2%.
Target Actual Out-performance Outcome
FY17 42.5 cents 43.1 cents 0.6 cents Pass
FY18 45.7 cents 46.7 cents 1.0 cent Pass
FY19 50.0 cents 51.6 cents 1.6 cents Pass
Cumulative 20.2% implied Operating EPS
growth
28.7% Operating EPS growth
3.2 cents 100%
As a results of achieving the Operating EPS hurdle, a total of 14,338,500 performance rights will vest in September 2019, September 2020 and September 2021.
Relative TSR (25% weighting)
TSR provides an effective check against increasing risk practices within the Group, as the price to earnings multiple will reflect the perceived risk in the Group. Relative TSR is measured against the S&P/ASX 100 peer group. Vesting applies a sliding scale:
+ 0% vests up to and including the 50th percentile; and
+ vesting of 50% starts at the 51st percentile on a sliding scale with 100% vesting at the 76th percentile.
Goodman posted a three year TSR of 123.2% to 30 June 2019, compared with the S&P/ASX100 Index performance of 44.7%. The ranked Goodman in the 94th percentile and consequently 100% of these performance rights vested.
GMG TSR1 S&P/ASX 1001 TSR Percentile Outcome
FY16 LTIP grant – TSR hurdle
123.2% 44.7% 94th 100%
1. Testing period for grant 1 July 2016 to 30 June 2019
As a results of achieving the relative TSR hurdle, a total of 4,779,500 performance rights will vest in September 2019, September 2020 and September 2021.
Goodman Group Directors’ report
for the year ended 30 June 2019
Remuneration report – audited (cont)
40
5. GROUP CEO REMUNERATION OUTCOMES
5.1 Group CEO – vested outcomes The table below details the vested remuneration over the past five years for the Group CEO. The numbers in this table differ from the statutory disclosure in section 7 primarily due to the differences in the measurement and timing of recognition in respect of performance rights issued under the LTIP. The below figures show the base salary received by the Group CEO in the respective year plus the value of performance rights which vested during that year at the closing price on the day the performance rights vested.
The table highlights:
+ no change in fixed remuneration over the period;
+ the proportion of remuneration from fixed (cash) salary has continued to decline; and
+ significant growth in value of LTI from grant date to the vesting date due to the increase in security
price (average 86% for grants vesting in FY19).
FY14 FY15 FY16 FY17 FY18 FY19
$M $M $M $M $M $M
Base salary 1.4 1.4 1.4 1.4 1.4 1.4
STI 2.4 2.2 0.0 0.0 0.0 0.0
Value of LTI on grant date1 1.7 2.6 3.1 3.8 4.7 7.3
Value of LTI on vesting 2.3 4.6 5.2 7.0 8.8 13.5
Total remuneration based on
LTI value at grant date1 5.5 6.2 4.5 5.2 6.1 8.7
Total vested remuneration based on
LTI value at vesting date 6.1 8.2 6.6 8.4 10.2 14.9
Increase in LTI value due to security
price performance of the Group 0.6 2.0 2.1 3.2 4.1 6.3
Percentage growth in value of LTI
during vesting period 37% 74% 66% 84% 88% 86%
1. Value based on the security prices at the grant dates for the performance rights that vested in the financial year.
This remuneration disclosure indicates available remuneration resulting from the performance over the past three to five years. Grant vesting outcomes have increased significantly compared to the initial grant value, due to strong consistent earnings growth and significant security price outperformance of the Group.
The chart below illustrates the proportions of vesting outcomes due to grant value and value added since grant date:
Goodman Group Directors’ report
for the year ended 30 June 2019
Remuneration report – audited (cont)
41
6. ADDITIONAL STRUCTURE DETAIL
6.1 STI parameters
STI is an at-risk component of remuneration, specific to achievement of financial and non-financial objectives. This structure is very transparent and aligns management with the Operating EPS growth expectations of Securityholders.
Questions
Who is eligible to
participate in
the STI?
All full-time and part-time permanent employees.
The Group CEO agreed with the Board not to participate in the STI awards, to emphasise reward for long-term
decision making across the organisation.
What is the form of
the STI award?
For executive KMP, 50% of the STI award is paid in cash on finalisation of Goodman’s full year result.
50% of the STI award is deferred and paid in cash after a period of 12 months and the deferred STI amount is
subject to forfeiture under malus provisions (see below).
What is the
maximum award
participants
may earn?
STI awards are capped at 150% of fixed remuneration for executive KMP. Target STI for individuals is also
compared to market-based remuneration data and their manager’s own assessment of what an appropriate level of
incentive compensation may be.
How is the
STI earned?
The Board sets budget targets for the business annually. These targets are set relative to the market conditions,
earnings visibility, financial structure and strategy and are challenging and appropriate. Targets will vary over time,
through cycle and strategy, to ensure they remain contemporary.
STI for all staff is subject to: (1) meeting behavioural expectations under the Group Code of Conduct; and (2)
achieving Operating EPS(based on the annual forecast for the relevant year. Securityholder returns are prioritised.
How is the
individual STI
award determined?
STI rewards performance against objectives of the individual and the Group.
The Group objectives include multiple factors as set from time to time, dependent on the market and strategy of the
Group. These primarily fall into five groups:
– property investment;
– development;
– management;
– capital management; and
– corporate and social responsibility.
Adherence to the Group’s core values is a minimum hurdle for the STI to vest.
The performance of individuals is assessed through a detailed and formal performance appraisal process based on
contribution to defined objectives, behavioural expectations, annual contribution to results as well as strategic and
other contributions where these results or benefits may be reflected in future years.
Is there
malus/clawback?
The executive KMP’s STI awards are subject to 50% deferral for 12 months from the date of publication of
Goodman’s financial statements. This deferral period provides protection from malus. The Board has discretion to
forfeit deferred amounts for material misstatement, fraud or adverse changes that would have affected the award
where there is executive responsibility. For all employees, the STI award is subject to immediate forfeiture in
circumstances where employees are dismissed for cause without notice (e.g. fraud or serious misconduct). LTI will
also be forfeited where employees cease to be employed unless special circumstances exist.
Goodman Group Directors’ report
for the year ended 30 June 2019
Remuneration report – audited (cont)
42
6.2 LTI parameters The LTIP is an at-risk equity plan that is open to all permanent employees to create alignment with the interests of Securityholders over the long term.
+ No value is derived from LTI unless cumulative performance hurdles of Operating EPS and relative
TSR are met or exceeded, and performance rights have no entitlement to income or assets until they
vest.
+ However, when performance achieves or exceeds long-term targets and performance rights vest, LTI
represents the majority of remuneration for the executive KMP and is a material component of
remuneration for all participating employees.
Questions (in relation to all grants including FY20)
Who is eligible
to participate?
All full-time and part-time permanent employees are eligible to participate in the LTIP.
What is the form of
the award?
The LTIP awards performance rights.
What is the maximum
LTI participants may
earn?
When considering the overall size of LTI awards, the Board also considers the number of securities that could
vest and the associated impact on the Operating EPS growth. Performance rights issued under the LTIP are
capped at 5% of issued capital with vesting of approximately 1% per annum, assuming all hurdles are met and
all employees remain employed. The Board considers the performance of the Group in comparison with the
comparator group, the amount of overall operating profit, the competitive nature of the global labour markets
where we operate and the value of the team in the local and global market place, as appropriate.
How is the number of
rights determined?
The number of rights is determined by dividing the LTI award amount by the face value of the Goodman
security price at the time of allocation. The performance rights do not receive distributions or have any right to
income or assets until vesting.
What are the
performance measures?
Behaviour in accordance with core values is an absolute requirement and a minimum hurdle for any LTI
awards to vest as continued employment is a pre-condition.
The Board believes that the commercial decisions Goodman makes in fulfilment of its overall financial
objectives are best reflected in two key indicators: Operating EPS and relative TSR.
Operating EPS is a critical measure of long-term global performance (see section 3.2).
The hurdles are set to be competitive and challenging relative to external and internal historical and
prospective reference points (see section 1.2).
TSR provides an effective check against increasing risk practices within the Group i.e. the security price to
earnings multiple will reflect the perceived risk in the Group in achieving Operating EPS targets.
Focus on LTI is an efficient way of rewarding sustained performance and retaining talent.
What is the weighting? 75% Operating EPS hurdle 25% relative TSR hurdle
What is the performance
period?
Both Operating EPS and relative TSR performance is tested over three financial year starting from 1 July each
year. Operating EPS growth is assessed in the third year.
How do the LTIP awards
vest?
Subject to meeting performance hurdles, vesting occurs in equal tranches shortly after the end of years three,
four and five, provided participants remain employed by the Group.
Is there
malus/clawback?
Subject to immediate forfeiture in circumstances where employees are dismissed for cause without notice (e.g.
fraud or serious misconduct). LTI will also be forfeited where employees cease to be employed unless special
circumstances exist.
What rights are attached
to the performance
rights?
Performance rights have no Securityholder rights prior to vesting (e.g. distributions, voting, rights issue
participation).
What happens to LTIP
upon termination?
Performance rights lapse upon leaving Goodman except in special circumstances (e.g. ill health, death,
retirement or redundancy).
Goodman Group Directors’ report
for the year ended 30 June 2019
Remuneration report – audited (cont)
43
Questions specific to the intended FY20 grant
What are the vesting
conditions for FY20
grants?
Operating EPS tested (75% of grant)
The Board has set an Operating EPS
performance hurdle of growing Operating EPS
from the FY19 result of 51.6 cents to between
61.4 cents (Threshold level) and 66.8 cents
(Upper level) in FY22. 25% satisfy testing
conditions at the Threshold level with a sliding
scale up to 100% at the Upper level. The range is
equivalent to between 6% and 9% CAGR in
Operating EPS or approximately 19% to 30%
over the three year testing period.
The Operating EPS performance hurdle range
will be set with each new grant at the time of
grant.
Relative TSR tested (75% of grant)
TSR awards are subject to achievement of cumulative
TSR relative to the S&P/ASX 100 over a three year
period:
– 50% of awards vest for performance at the 51st
percentile;
– 100% of awards vest for performance at the 76th
percentile or above; and
– awards vest on a sliding scale between 50% and 100%
for performance between the 51st and the 76th
percentile.
Can the hurdles be
adjusted?
No No
Questions specific to outstanding historic grants (FY15-FY19)
What are the vesting
conditions for prior
grants (FY15-FY19)
currently outstanding?
Operating EPS tested (75% of grant)
Operating EPS awards are subject to
achievement of a cumulative Operating EPS
hurdle, which is the combination of three years’
individual Operating EPS hurdles. This ensures
that the appropriate balance between short and
long-term challenges is incorporated. With the
vast majority of remuneration through LTI, the
focus remains on sustainable performance.
Targets are disclosed to the market each year
and are equal to the forecast Operating EPS. For
FY20, this is 56.3 cents.
RTSR tested (75% of grant)
TSR awards are subject to achievement of cumulative
TSR relative to the S&P/ASX 100 over a three year
period:
– 50% of awards vest for performance at 51st percentile;
– 100% of awards vest for performance at 76th
percentile or above; and
– awards vest on a sliding scale between 50% and 100%
for performance between the 51st and 76th percentile.
Goodman Group Directors’ report
for the year ended 30 June 2019
Remuneration report – audited (cont)
44
7. EXECUTIVE KMP REMUNERATION (STATUTORY ANALYSIS)Details of the nature and amount of each major element of the remuneration of each executive KMP, as calculated under Australian Accounting Standards, are set out below:
The footnotes for this table are set out on the following page.
Executive KMP are engaged under written employment contracts until notice is given by either Goodman or the executive KMP. Notice periods are for six months with the exception of Gregory
Goodman and Danny Peeters for whom the period is 12 months. Danny Peeters provides his services through a management company, DPCON Bvba.
Goodman Group Directors’ report
for the year ended 30 June 2019
Remuneration report – audited (cont)
45
Footnotes to the executive KMP remuneration table
1. Salary and fees represent the amounts due under the terms of executives’ service contracts and include movements
in annual leave provisions.
2. Executives’ bonus awards are paid in two instalments: 50% on finalisation of Goodman’s financial statements and
50% 12 months later. Under Australian Accounting Standards, this means the entire bonus award is considered as a
long-term benefit with regard to the disclosure of individual executive’s remuneration. No bonuses were forfeited
during the financial year.
3. Other includes reportable fringe benefits, car parking and changes in long service leave provisions.
4. Performance rights are an LTI and in accordance with Australian Accounting Standards, the values of the awards
are determined using option pricing models and amortised in the consolidated income statement over the vesting
periods.
5. The remuneration of Danny Peeters is disclosed in Euros, the currency in which his base remuneration and STI are
determined. The value attributed to his performance rights is translated from Australian dollars at the weighted
average rate for the relevant financial year.
6. With effect from 1 January 2019, the Board determined Anthony Rozic’s base remuneration and STI in US dollars to
reflect his responsibilities as CEO, North America. Accordingly, his remuneration has been disclosed in US dollars,
with any remuneration prior to 1 January 2019 (including remuneration for the comparative financial year) and the
value attributed to performance rights translated from Australian dollars at the weighted average rate for the relevant
financial year.
Goodman Group Directors’ report
for the year ended 30 June 2019
Remuneration report – audited (cont)
46
8. NON-EXECUTIVE DIRECTOR REMUNERATION
8.1 Key elements of the Non-Executive Director remuneration policy
– The policy is structured to ensure independence of judgement in the performance of their duties.
– Non-Executive Directors receive fixed fees for being on the Board and additional fees for membership of
committees.
– The fees take into account the size and scope of Goodman’s activities and the responsibilities and
experience of the Directors. Periodically, these fees are benchmarked against data for comparable entities
provided by external advisers.
– As approved by Securityholders at the 2006 Annual General Meeting, total remuneration (including
superannuation) payable by Goodman to all Non-Executive Directors in aggregate must not exceed $2.5
million per annum. For the current financial year, total Non-Executive Directors’ remuneration was
$2.1 million (2018: $2.2 million).
– The decrease in Non-Executive Director fees compared to the prior financial year was due to the change in
composition of the Board, partly offset by the full year impact of the increase in Board fees (excluding Board
committee fees) that occurred from 1 January 2018.
– Non-Executive Directors are not entitled to participate in any STI or LTI schemes as they may be perceived
to create a bias when overseeing executive decision making.
– The Board has a policy, set out in the Directors’ Securities Acquisition Plan, for Non-Executive Directors to
accumulate a significant long-term holding of Goodman securities so that they have an alignment of interests
with those of Securityholders. Under the policy, each Non-Executive Director is required to acquire securities
such that their holding is equal in value to twice their annual base fees. The value of securities for this
purpose equals the higher of purchase cost or market value at the end of each financial year. This holding
may be acquired at any time but where not held at the beginning of a financial year, the policy is for 25% of
base fees (net of tax) during the financial year to be applied to the on-market purchase of securities.
Details of the nature and amount of each major element of the remuneration of Non-Executive Directors, as calculated under Australian Accounting Standards, are set out below:
Salary and fees Superannuation
benefits Total Non-Executive Directors – GL and GFML $ $ $
Ian Ferrier1 FY19 604,469 20,531 625,000
FY18 572,951 20,049 593,000
Christopher Green2 FY19 43,155 3,080 46,235
FY18 - - -
Stephen Johns FY19 284,469 20,531 305,000
FY18 251,564 18,874 270,438
Rebecca McGrath FY19 274,469 20,531 295,000
FY18 259,451 20,049 279,500
Phillip Pryke3 FY19 358,853 20,531 379,384
FY18 348,890 20,049 368,939
Jim Sloman4 FY19 97,301 8,555 105,856
FY18 244,451 20,049 264,500
Penny Winn5 FY19 259,469 20,531 280,000
FY18 108,312 8,354 116,666
Non-Executive Director – GLHK HK$ HK$ HK$
David Collins6 FY19 625,000 - 625,000
FY18 260,417 - 260,417
1. Ian Ferrier does not receive any additional board committee fees.
2. Christopher Green was appointed as a Director on 28 April 2019.
3. Salary and fees for Phillip Pryke included an amount of A$84,388 (NZ$90,000) (2018: A$89,439 (NZ$97,050)) due in respect of
his role on the board and audit committee of Goodman (NZ) Limited, the manager of Goodman Property Trust.
4. Jim Sloman retired as a Director on 15 November 2018.
5. Penny Winn was appointed as a Director on 1 February 2018.
6. David Collins is a Director of GLHK and was appointed on 1 February 2018. His director fees are disclosed in Hong Kong dollars.
Goodman Group Directors’ report
for the year ended 30 June 2019
Remuneration report – audited (cont)
48
9. OTHER REMUNERATION DISCLOSURES
9.1 Movements in performance rights held by executive KMP
The movements in the number of performance rights during FY19 are summarised as follows:
Danny Peeters FY19 2,064,458 550,000 (444,795) (11,250) 2,158,413
FY18 1,967,528 550,000 (453,070) - 2,064,458
Anthony Rozic FY19 2,394,624 600,000 (508,628) (15,000) 2,470,996
FY18 2,262,777 600,000 (468,153) - 2,394,624
Other executives
Nick Kurtis FY19 2,544,623 600,000 (557,378) (18,750) 2,568,495
FY18 2,412,777 600,000 (468,154) - 2,544,623
Michael O'Sullivan FY19 1,568,509 400,000 (352,743) (8,748) 1,607,018
FY18 1,505,802 390,000 (327,293) - 1,568,509
Nick Vrondas FY19 2,547,878 600,000 (525,716) (18,750) 2,603,412
FY18 2,362,295 600,000 (414,417) - 2,547,878
Goodman Group Directors’ report
for the year ended 30 June 2019
Remuneration report – audited (cont)
49
9.2 Analysis of performance rights held by executive KMP
Details of the awards of performance rights under the LTIP granted by Goodman as compensation to the executive KMP are set out in the following tables:
Danny Peeters 2019 1,796,560 444,795 - (650,000) 1,591,355
2018 1,843,520 453,070 - (500,030) 1,796,560
Anthony Rozic 2019 1,109,460 508,628 - (508,628) 1,109,460
2018 941,307 468,153 - (300,000) 1,109,460
Other executives
Nick Kurtis 2019 660,352 557,378 - (810,590) 407,140
2018 705,789 468,154 - (513,591) 660,352
Michael O'Sullivan 2019 764,967 352,743 - (652,743) 464,967
2018 437,674 327,293 - - 764,967
Nick Vrondas 2019 404,417 525,716 - (930,133) -
2018 330,000 414,417 - (340,000) 404,417
1. Relates to securities held at the later of the start of the financial year or the date of becoming a KMP.
2. Relates to securities held at the earlier of the end of the financial year or the date of ceasing to be a KMP.
Goodman Group Directors’ report
for the year ended 30 June 2019
Remuneration report – audited (cont)
53
9.6 Movement in Goodman Property Trust securities
Throughout the year, Michael O’Sullivan held 349,650 units in Goodman Property Trust (GMT). GMT is listed on the New Zealand Exchange and Goodman owned 21.6% of the issued units at 30 June 2019.
9.7 Transactions with Directors, executives and their related entities
There were no other transactions with Directors, executives and their related entities.
Goodman Group Directors’ report
for the year ended 30 June 2019
54
Environmental regulations
Goodman has policies and procedures to identify and appropriately address environmental obligations that might arise in respect of Goodman’s operations that are subject to significant environmental laws and regulation. The Directors have determined that Goodman has complied with those obligations during the financial year and that there has not been any material breach.
Declaration by the Group Chief Executive Officer and Group Chief Financial Officer
The Group Chief Executive Officer and Group Chief Financial Officer declared in writing to the Board that, in their opinion, the financial records of Goodman for the year ended 30 June 2019 have been properly maintained and the financial report for the year ended 30 June 2019 complies with accounting standards and presents a true and fair view of Goodman’s financial condition and operational results. The Group Chief Executive Officer and Group Chief Financial Officer confirmed that the above declaration was, to the best of their knowledge and belief, founded on a sound system of risk management and internal control and that the system was operating effectively in all material respects in relation to the financial reporting risks.
Disclosure in respect of any indemnification and insurance of officers and auditors
Pursuant to the Constitution of Goodman, current and former directors and officers of Goodman are entitled to be indemnified. Deeds of Indemnity have been executed by Goodman, consistent with the Constitution, in favour of each Director. The Deed indemnifies each Director to the extent permitted by law for liabilities (other than legal costs) incurred in their capacity as a director of Goodman or a controlled entity and, in respect of legal costs, for liabilities incurred in defending or resisting civil or criminal proceedings.
Goodman has insured to the extent permitted by law, current and former directors and officers of Goodman in respect of liability and legal expenses incurred in their capacity as a director or officer. As it is prohibited under the terms of the contract of insurance, the Directors have not included details of the nature of the liabilities covered or the amount of the premiums paid.
The auditors of Goodman are not indemnified by Goodman or covered in any way by this insurance in respect of the audit.
Non-audit services
During the financial year, KPMG, Goodman and GIT’s auditor, performed certain other services in addition to the audit and review of the financial statements.
The Board has considered the non-audit services provided during the financial year by the auditor and, in accordance with written advice authorised by a resolution of the Audit Committee, resolved that it is satisfied that the provision of those non-audit services during the financial year by the auditor is compatible with, and did not compromise, the auditor independence requirements of the Corporations Act 2001 for the following reasons:
+ all non-audit services were subject to the corporate governance procedures adopted by Goodman and have beenreviewed by the Audit Committee to determine they do not impact the integrity and objectivity of the auditor; and
+ the non-audit services provided do not undermine the general principles relating to auditor independence as set outin APES 110 Code of Ethics for Professional Accountants, as they did not involve reviewing or auditing the auditor’sown work, acting in a management or decision making capacity for Goodman, acting as an advocate for Goodmanor jointly sharing risks and rewards.
Details of the amounts paid to the auditor of Goodman and GIT, KPMG and its network firms, for the audit and non-audit services provided during the financial year are set out in note 23 to the consolidated financial statements.
Lead auditor’s independence declaration under section 307C of the Corporations Act 2001
The lead auditor’s independence declaration is set out on page 56 and forms part of this Directors’ report for the financial year.
Rounding
Goodman and GIT are entities of a kind referred to in ASIC Corporations (Rounding in Financial/Directors’ Reports) Instrument 2016/191. In accordance with that Instrument, amounts in this Directors’ report and the consolidated financial statements have been rounded to the nearest hundred thousand dollars, unless otherwise stated.
The Directors’ report is made in accordance with a resolution of the Directors.
Goodman Group Directors’ report
for the year ended 30 June 2019
55
Events subsequent to balance date
There has not arisen in the interval between the end of the financial year and the date of this report any item, transaction or event of a material and unusual nature likely, in the opinion of the Directors, to affect significantly the operations of Goodman, the results of those operations, or the state of affairs of Goodman, in future financial years.
Ian Ferrier, AM Gregory Goodman Independent Chairman Group Chief Executive Officer
Sydney, 23 August 2019
Lead Auditor's lndeoendence Declaration under
section 307C or the coroorations Act 2001
To the Directors of Goodman Limited and Goodman Funds Management
Limited, as Responsible Entity for Goodman Industrial Trust
I declare that, to the best of my knowledge and belief, in relation to the audits for the financial year
ended 30 June 2019 there have been:
i. no contraventions of the auditor independence requirements as set out in the
Corporations Act 2001 in relation to the audits; and
ii. no contraventions of any applicable code of professional conduct in relation to the audits.
KPMG Eileen Haggett
Partner
Sydney
23 August 2019
KPMG, an Australian partnership and a member firm of the KPMG network of independent member firms affiliated with KPMG International Cooperative ("KPMG International"), a Swiss entity.
Liability limited by a scheme approved under Professional Standards Legislation.
56
Goodman Group Consolidated statements of financial position
for the year ended 30 June 2019
57
1. The comparative figures have been restated to reflect changes in accounting policies. Details of these are set out in note 1(d).
The consolidated statements of financial position are to be read in conjunction with the accompanying notes.
Goodman GIT
2019 2018 2019 2018
Restated1
Restated1
Note $M $M $M $M
Current assets
Cash and cash equivalents 18(a) 1,607.1 2,406.8 1,214.4 2,129.7
Receivables 7 237.6 464.6 1,838.5 2,109.0
Contract assets 8 308.1 145.4 - -
Inventories 6(b) 307.9 520.5 - -
Other financial assets 14 1.3 1.6 1.3 1.6
Other assets 12.0 17.1 3.3 5.0
Total current assets 2,474.0 3,556.0 3,057.5 4,245.3
Other financial liabilities 14 236.4 94.4 229.7 94.4
Total non-current liabilities 3,541.3 3,256.1 3,309.1 3,352.0
Total liabilities 4,390.3 4,285.7 4,210.2 4,331.9
Net assets 10,522.5 9,173.7 8,243.7 7,476.7
Equity attributable to Securityholders
Issued capital 17 8,031.7 8,031.7 7,477.3 7,381.3
Reserves 397.5 185.0 97.9 (16.9)
Retained earnings 2,093.3 957.0 668.5 112.3
Total equity attributable to Securityholders 10,522.5 9,173.7 8,243.7 7,476.7
Comprising:
Total equity attributable to GL 19(a) 936.2 582.5
Total equity attributable to other entities stapled to GL 19(b) 9,586.3 8,591.2
Total equity attributable to Securityholders 10,522.5 9,173.7 8,243.7 7,476.7
Goodman Group Consolidated income statements for the year ended 30 June 2019
58
The consolidated income statements are to be read in conjunction with the accompanying notes.
Goodman GIT
2019 2018 2019 2018
Note $M $M $M $M
Revenue
Gross property income 2 114.6 150.4 80.2 82.4
Management income 2 469.7 316.5 - -
Development income 2 1,134.3 1,115.8 31.5 34.1
Distributions from investments - - 2.9 7.4
1,718.6 1,582.7 114.6 123.9
Property and development expenses
Property expenses (40.2) (36.4) (28.4) (26.7)
Development expenses 2 (727.3) (808.9) (31.5) (27.4)
(767.5) (845.3) (59.9) (54.1)
Other income
Net gain from fair value adjustments on investment
properties 6(e) 146.8 71.1 142.3 56.0
Net gain on disposal of investment properties 15.3 67.4 8.0 10.3
Share of net results of equity accounted investments 6(f) 1,132.5 910.9 816.6 733.7
Net gain on disposal of equity investments 2 12.6 40.7 4.9 39.3
Other income - - - 0.6
1,307.2 1,090.1 971.8 839.9
Other expenses
Employee expenses 2 (191.9) (180.7) - -
Share based payments expense 2 (196.6) (125.6) - -
Administrative and other expenses (75.8) (68.7) (51.7) (46.6)
(464.3) (375.0) (51.7) (46.6)
Profit before interest and tax 1,794.0 1,452.5 974.8 863.1
Net finance income/(expense)
Finance income 12 46.2 35.3 167.4 174.4
Finance expense 12 (95.5) (302.6) (114.1) (292.8)
Net finance (expense)/income (49.3) (267.3) 53.3 (118.4)
Profit before income tax 1,744.7 1,185.2 1,028.1 744.7
Income tax expense 5 (116.8) (82.4) (18.4) (28.8)
Profit for the year 1,627.9 1,102.8 1,009.7 715.9
Profit attributable to GL 19(a) 242.8 182.5
Profit attributable to other entities stapled to GL 19(b) 1,385.1 915.7
Profit attributable to Securityholders 1,627.9 1,098.2 1,009.7 711.3
Profit attributable to other non-controlling interests - 4.6 - 4.6
Profit for the year 1,627.9 1,102.8 1,009.7 715.9
Basic profit per security (¢) 3(a) 89.9 61.1
Diluted profit per security (¢) 3(a) 87.3 59.4
Goodman Group Consolidated statements of comprehensive income
for the year ended 30 June 2019
59
The consolidated statements of comprehensive income are to be read in conjunction with the accompanying notes.
Goodman GIT
2019 2018 2019 2018
Note $M $M $M $M
Profit for the year 1,627.9 1,102.8 1,009.7 715.9
Other comprehensive income/(loss) for the year
Items that will not be reclassified to profit or loss
Actuarial gains on defined benefit superannuation funds 3.2 6.9 - -
Effect of foreign currency translation (0.4) (1.6) - -
2.8 5.3 - -
Items that are or may be reclassified subsequently to profit or loss
(Decrease)/increase due to revaluation of other
financial assets - (0.4) 1.8 (2.5)
Cash flow hedges:
- Change in value of financial instruments (4.9) 3.0 (4.9) 3.0
Effect of foreign currency translation 169.6 194.2 87.5 37.7
164.7 196.8 84.4 38.2
Other comprehensive income for the year, net of
income tax 167.5 202.1 84.4 38.2
Total comprehensive income for the year 1,795.4 1,304.9 1,094.1 754.1
Total comprehensive income attributable to GL 19(a) 293.7 164.9
Total comprehensive income attributable to other
entities stapled to GL 19(b) 1,501.7 1,135.4
Total comprehensive income attributable to
Securityholders 1,795.4 1,300.3 1,094.1 749.5
Total comprehensive income attributable to other non-
controlling interests - 4.6 - 4.6
Total comprehensive income for the year 1,795.4 1,304.9 1,094.1 754.1
Goodman Group Consolidated statements of changes in equity
for the year ended 30 June 2019
60
The consolidated statement of changes in equity is to be read in conjunction with the accompanying notes. For an analysis of equity attributable to non-controlling interests, refer to note 19(b).
Attributable to Securityholders
Goodman
Issued
capital
Asset
revaluation
reserve
Cash flow
hedge
reserve
Foreign
currency
translation
reserve
Employee
compensation
reserve
Defined
benefit funds
actuarial
losses
reserve
Total
reserves
Retained
earnings Total
Other non-
controlling
interests Total equity
Note $M $M $M $M $M $M $M $M $M $M $M
Balance at 1 July 2017 8,031.7 (6.1) (1.4) (149.4) 131.6 (31.4) (56.7) 321.4 8,296.4 325.8 8,622.2
Total comprehensive income for the year
Profit for the year - - - - - - - 1,098.2 1,098.2 4.6 1,102.8
Net income taxes (paid)/received (37.4) (59.6) (1.5) 0.1
Net cash provided by operating activities 18(b) 827.5 1,161.2 181.3 307.3
Cash flows from investing activities
Net proceeds from disposal of investment properties 75.2 459.9 243.2 102.8
Net proceeds from disposal of equity investments 123.4 208.2 115.6 5.2
Payments for investment properties (94.5) (118.1) (10.7) (16.6)
Payments for equity investments (920.6) (571.1) (657.2) (361.4)
Payments for plant and equipment (1.7) (5.4) - -
Net cash used in investing activities (818.2) (26.5) (309.1) (270.0)
Cash flows from financing activities
Repurchase of Goodman PLUS - (327.0) - (327.0)
Net cash flows from loans to related parties (41.2) (10.1) (126.3) 956.5
Proceeds from borrowings 12.6 1,867.1 - 1,867.1
Payments on borrowings and derivative financial
instruments (291.9) (1,678.6) (262.5) (1,615.5)
Cash outflow on debt restructure - (162.2) - (162.2)
Dividends and distributions paid (528.7) (488.4) (438.7) (488.4)
Net cash (used in)/provided by financing activities (849.2) (799.2) (827.5) 230.5
Net (decrease)/increase in cash held (839.9) 335.5 (955.3) 267.8
Cash and cash equivalents at the beginning of the year 2,406.8 2,095.1 2,129.7 1,882.5
Effect of exchange rate fluctuations on cash held 40.2 (23.8) 40.0 (20.6)
Cash and cash equivalents at the end of the year 18(a) 1,607.1 2,406.8 1,214.4 2,129.7
Goodman Group Notes to the consolidated financial statements
for the year ended 30 June 2019
63
Basis of preparation
This section sets out the general basis upon which Goodman and GIT have prepared their financial statements and information that is disclosed to comply with the Australian Accounting Standards, Corporations Act 2001 or Corporations Regulations. Specific accounting policies can be found in the section to which they relate.
1 Basis of preparation Goodman Limited and Goodman Industrial Trust are for profit entities domiciled in Australia. (a) Statement of compliance These consolidated financial statements are general purpose financial statements which have been prepared in accordance with Australian Accounting Standards adopted by the Australian Accounting Standards Board (AASB) and the Corporations Act 2001. International Financial Reporting Standards (IFRS) form the basis of Australian Accounting Standards adopted by the AASB. The consolidated financial statements also comply with IFRS. The consolidated financial statements are presented in Australian dollars and were authorised for issue by the Directors on 23 August 2019. (b) Basis of preparation of the consolidated financial reports Shares in the Company, units in the Trust and CDIs over shares in GLHK are stapled to one another and are quoted as a single security on the ASX. Australian Accounting Standards require an acquirer to be identified and an in-substance acquisition to be recognised. In relation to the stapling of the Company, the Trust and GLHK, the Company is identified as having acquired control over the assets of the Trust and GLHK. In the consolidated statement of financial position of the Group, equity attributable to the Trust and the CDIs over the shares of GLHK are presented as non-controlling interests. As permitted by the relief provided in ASIC Instrument 18-0353, these financial statements present both the financial statements and accompanying notes of Goodman and GIT. GLHK, which is incorporated and domiciled in Hong Kong, prepares its financial statements under Hong Kong Financial Reporting Standards and the applicable requirements of the Hong Kong Companies Ordinance and accordingly the financial statements of GLHK have not been combined and included as adjacent columns in this report. The financial statements of GLHK have been included as an appendix to this report. The consolidated financial statements are prepared on the historical cost basis, subject to any impairment of assets, except that the following assets and liabilities are stated at fair value:
+ investment properties;
+ derivative financial instruments;
+ investments in unlisted securities; and
+ liabilities for cash settled share based payment arrangements. In accordance with ASIC Corporations (Rounding in Financial/Directors’ Reports) Instrument 2016/191, amounts in these consolidated financial statements have been rounded to the nearest hundred thousand dollars, unless otherwise stated.
Goodman Group Notes to the consolidated financial statements
for the year ended 30 June 2019
64
Basis of preparation (cont) 1 Basis of preparation (cont) (c) Foreign currency translation Functional and presentation currency Items included in the consolidated financial statements of each of the controlled entities are measured using the currency of the primary economic environment in which the entity operates (functional currency). The consolidated financial statements are presented in Australian dollars, which is the Company’s and the Trust’s functional and presentation currency. Transactions Foreign currency transactions are translated to each entity’s functional currency at rates approximating to the foreign exchange rates ruling at the dates of the transactions. Amounts receivable and payable in foreign currencies at the balance date are translated at the rates of exchange ruling on that date. Resulting exchange differences are recognised in profit or loss. Non-monetary assets and liabilities that are measured in terms of historical cost are translated at rates of exchange applicable at the date of the initial transaction. Non-monetary items which are measured at fair value in a foreign currency are translated using the exchange rates at the date when the fair value was determined. Translation of controlled foreign operations The assets and liabilities of controlled foreign operations are translated into Australian dollars at foreign exchange rates ruling at the balance date. Revenue and expenses are translated at weighted average rates for the financial year. Exchange differences arising on translation are taken directly to the foreign currency translation reserve. On cessation of operations in a foreign region, the cumulative exchange differences relating to the operations in that region, that have been included in the foreign currency translation reserve, are reclassified to profit or loss. Exchange differences arising on monetary items that form part of the net investment in a foreign operation are recognised in the foreign currency translation reserve on consolidation. Exchange rates used The following exchange rates are the main exchange rates used in translating foreign currency transactions, balances and financial statements to Australian dollars:
Australian dollars (AUD) to 2019 2018 2019 2018
New Zealand dollars (NZD) 1.0665 1.0851 1.0449 1.0922
Hong Kong dollars (HKD) 5.6069 6.0659 5.4761 5.8015
Chinese yuan (CNY) 4.8819 5.0429 4.8141 4.8975
Japanese yen (JPY) 79.4634 85.5326 75.6340 81.9120
Euros (EUR) 0.6269 0.6498 0.6173 0.6332
British pounds sterling (GBP) 0.5527 0.5760 0.5523 0.5604
United States dollars (USD) 0.7152 0.7752 0.7011 0.7394
Brazilian real (BRL) 2.7616 2.5684 2.6880 2.8565
Weighted average As at 30 June
Goodman Group Notes to the consolidated financial statements
for the year ended 30 June 2019
65
Basis of preparation (cont) 1 Basis of preparation (cont) (d) Changes in accounting policies Goodman and GIT have adopted AASB 15 Revenue from Contracts with Customers and AASB 9 Financial Instruments, with a date of initial application of 1 July 2018. A number of other new standards are also effective from 1 July 2018 but they do not have a material effect on Goodman and GIT’s financial statements.
AASB 15 Revenue from Contracts with Customers AASB 15 provides a single revenue recognition model based on the transfer of goods and services and the consideration expected to be received in return for that transfer. The adoption of AASB 15 has resulted in a change in accounting policy for revenue recognition associated with property disposals, such that revenue is recognised on transfer of control of the asset rather than the transfer of the significant risks and rewards associated with the asset. For Goodman, the new accounting policy has not had a material impact on the revenue and profit reflected in previous periods but the consolidated statement of financial position now includes additional captions for “Contract assets” and “Contract liabilities”. In accordance with the transition provisions in AASB 15, Goodman has adopted the new rules retrospectively and has restated the comparative consolidated statement of financial position at the date of initial application as set out below: Goodman
Contract assets Contract assets include amounts recoverable in respect of investment management contracts and fixed price development contracts. These were previously recognised as receivables.
Contract liabilities Contract liabilities include consideration received in advance of the completion of development contracts and rental guarantees provided by Goodman in respect of inventory disposal and fixed price development contracts. These were previously recognised as payables. The adoption of AASB 15 has not had a material impact on the results of GIT.
As previously
reported
30 Jun 2018 Adjustments
Restated
1 Jul 2018
$M $M $M
Current assets
Receivables 610.0 (145.4) 464.6
Contract assets - 145.4 145.4
Total current assets 610.0 - 610.0
Current liabilities
Payables 422.5 (22.7) 399.8
Contract liabilities - 22.7 22.7
Total current liabilities 422.5 - 422.5
Non-current liabilities
Payables 191.1 (3.7) 187.4
Contract liabilities - 3.7 3.7
Total non-current liabilities 191.1 - 191.1
Impact of adopting AASB 15
Goodman Group Notes to the consolidated financial statements
for the year ended 30 June 2019
66
Basis of preparation (cont) 1 Basis of preparation (cont) (d) Changes in accounting policies (cont) AASB 9 Financial Instruments AASB 9 sets out the recognition, classification and measurement of financial assets and financial liabilities, derecognition of financial instruments, hedge accounting and impairment of financial assets. AASB 9 replaces AASB 139 Financial Instruments: Recognition and Measurement. (i) Classification and measurement The new classification of financial assets under AASB 9 has not had a material impact on Goodman’s or GIT’s financial statements. (ii) Derivatives and hedging AASB 9 allows the application of a more qualitative approach to assessing hedge effectiveness compared to AASB 139. Goodman and GIT’s directly held derivative financial instruments are not designated as a hedge for accounting purposes. Certain of Goodman and GIT’s associates and JVs continue to designate derivative financial instruments as cash flow hedges for accounting purposes but the new standard has not had a material impact on Goodman and GIT’s equity accounted results. (iii) Impairment of financial assets Under AASB 9, impairments of trade receivables, amounts and loans due from related parties and other receivables are based on an ‘expected credit loss’ assessment. Previously, impairments were only booked when issues regarding the potential collectability of a receivable or contract asset had been identified. The change in methodology did not have a material impact on the results of Goodman and GIT as receivables relate to property rental income, where the Group generally holds either a security deposit or a bank guarantee, and amounts due from related parties, including Partnerships. (e) Australian Accounting Standards issued but not yet effective As at the date of this consolidated financial report, AASB 16 Leases was available for early adoption but has not been applied in preparing these financial statements: AASB 16 replaces AASB 117 Leases and other existing guidance on leases. It introduces a single lessee accounting model and requires a lessee to recognise assets and liabilities for all leases with a term of more than 12 months, unless the underlying asset is of low value. A lessee is required to recognise a right of use asset representing its right to use the underlying leased asset and a lease liability representing its obligations to make lease payments. The new standard will result in the gross up of assets and liabilities where Goodman leases office buildings, motor vehicles and development land classified as inventories. Goodman will apply AASB 16 initially on 1 July 2019 using the modified retrospective approach. Under this approach, the cumulative effect of initially applying this standard is recognised at the date of initial application. Goodman will recognise a lease liability at the present value of the remaining lease payments, discounted using the lessee’s incremental borrowing rate at the date of initial application and a right of use asset equal to the lease liability, adjusted for any prepared or accrued lease payments. Goodman expects to recognise $15.9 million of right of use assets and $15.9 million of lease liabilities at 1 July 2019 in relation to development land and $58.2 million of right of use assets and $57.3 million of lease liabilities at 1 July 2019 in relation to other leases. Goodman will apply the practical expedient to grandfather the definition of a lease on transition. This means that it will apply AASB 16 to all contracts entered into before 1 July 2019 and identified as leases in accordance with AASB 117.
As a lessee, GIT has no material leases and therefore the new standard will not have a material impact.
Goodman Group Notes to the consolidated financial statements
for the year ended 30 June 2019
67
Basis of preparation (cont) 1 Basis of preparation (cont) (f) Critical accounting estimates used in the preparation of the consolidated financial statements The preparation of consolidated financial statements requires estimates and assumptions concerning the application of accounting policies and the future to be made by Goodman. Estimates are continually evaluated and are based on historical experience and other factors, including expectations of future events that are believed to be reasonable under the circumstances. The estimates and assumptions that have a significant risk of causing a material adjustment to the carrying amounts of assets and liabilities within the next financial year can be found in the following notes:
+ Note 6 – Property assets;
+ Note 11 – Goodwill and intangible assets; and
+ Note 15 – Financial risk management. The accounting impacts of revisions to estimates are recognised in the period in which the estimate is revised and in any future periods affected. Measurement of fair values A number of Goodman’s accounting policies and disclosures require the measurement of fair values, for both financial and non-financial assets and liabilities. When measuring the fair value of an asset or a liability, Goodman uses market observable data as far as possible. Fair values are categorised into different levels in a fair value hierarchy and have been defined as follows:
+ Level 1: quoted prices (unadjusted) in active markets for identical assets or liabilities;
+ Level 2: inputs other than quoted prices included within Level 1 that are observable for the asset or liability, either directly (i.e. as prices) or indirectly (i.e. derived from prices); and
+ Level 3: inputs for the asset or liability that are not based on observable market data (unobservable inputs). Further information about the assumptions made in measuring fair values is included in the following notes:
+ Note 6 – Property assets; and
+ Note 15 – Financial risk management.
Goodman Group Notes to the consolidated financial statements
for the year ended 30 June 2019
68
Results for the year
The notes in this section focus on the significant items in the income statement, and include the profit per security, analysis of the results by operating segment and taxation details.
2 Profit before income tax
Gross property income Gross property income comprises rental income under operating leases (net of incentives provided) and amounts billed to customers for outgoings (e.g. rates, levies, cleaning, security, etc.). Amounts billed to customers for outgoings are a cost recovery for Goodman and are recognised once the expense has been incurred. The expense is included in property expenses. Rental income under operating leases is recognised on a straight-line basis over the term of the lease contract. Where operating lease rental income is recognised relating to fixed increases in rentals in future years, an asset is recognised. This asset is a component of the relevant investment property carrying amount. The cost of lease incentives provided to customers is amortised on a straight-line basis over the life of the lease as a reduction of gross property income. Management and development income The revenue from management and development activities is measured based on the consideration specified in a contract with a customer. Goodman recognises revenue when it transfers control over a product or service to a customer.
Management income
Fee income derived from investment management and property services is recognised and invoiced progressively as the services are provided. Customers make payments usually either monthly or quarterly in arrears. Performance related management income generally relates to portfolio performance fee income, which is recognised progressively as the services are provided but only when the income can be reliably measured and is highly probable of not being reversed. These portfolio performance fees are typically dependent on the overall returns of a Partnership relative to an agreed benchmark return, assessed over the life of the Partnership, which can vary from one year to seven years. The returns are impacted by operational factors such as the quality and location of the portfolio, active property management, rental income rates and development activity but can also be significantly affected by changes in global and local economic conditions. Accordingly, portfolio performance fee revenue is only recognised at a point close to the end of the relevant assessment period, as prior to this revenue recognition is not considered to be sufficiently certain. In determining the amount of revenue that can be reliably measured, management prepares a sensitivity analysis to understand the impact of changes in asset valuations on the potential performance fee at the assessment date. The assessment of revenue will depend on the prevailing market conditions at the reporting date relative to long-term averages and also the length of time until the assessment date e.g. the longer the time period to assessment date, the greater the impact of the sensitivity analysis. The potential portfolio performance fee revenue is then recognised based on the length of time from the start of the assessment period to the reporting date as a proportion of the total assessment period. Where the income is attributable to development activities that have occurred over the performance fee period, then it is reported as development income, otherwise the income is reported as management income. The Partnerships make payments in respect of portfolio performances fees at the end of the performance periods, once the attainment of the conditions has been verified and the amount of the fee has been agreed by all parties. Development income – disposal of inventories The disposal of inventories is recognised at the point in time when control over the property asset is transferred to the customer. This will generally occur on transfer of legal title and payment in full by the customer. The gain or loss on disposal of inventories is calculated as the difference between the carrying amount of the asset at the time of disposal and the proceeds on disposal (less transaction costs) and is included in the income statement in the period of disposal.
Development income – development management services
Fee income from development management services (including master-planning, development management and overall project management) is recognised progressively as the services are provided in proportion to the stage of completion by reference to costs. Payments are received in accordance with the achievement of agreed milestones over the development period. The development period is usually between six months and twelve months, but can be longer for larger, more complex projects. Performance related development income includes income associated with the returns from individual developments under the Group’s management and performance fee income that relates to development activity. Income in respect of individual developments is recognised by Goodman on attainment of the performance related conditions, which is when the income can be reliably measured and is highly probable of not being reversed. These amounts are paid by the Partnership when the amounts have been measured and agreed. Income associated with development activities as part of a portfolio assessment is recognised on the same basis as outlined above in the management income section.
Goodman Group Notes to the consolidated financial statements
for the year ended 30 June 2019
69
Results for the year (cont) 2 Profit before income tax (cont) Management and development income (cont) Development income – fixed price development contracts Certain development activities are assessed as being fixed price development contracts. This occurs when a signed contract exists, either prior to the commencement of or during the development phase, to acquire a development asset from Goodman on completion. Revenue and expenses relating to these development contracts are recognised in the income statement in proportion to the stage of completion of the relevant contracts by reference to costs. The payments may be on completion of the development once legal title has been transferred. The development phase is usually between six months and twelve months but may be longer. Net gain on disposal of investment properties The disposal of an investment property is recognised at the point in time when control over the property has been transferred to the purchaser. Employee expenses Wages, salaries and annual leave Wages and salaries, including non-monetary benefits, and annual leave that are expected to be settled within 12 months of the balance date represent present obligations resulting from employees’ services provided to the balance date. These are calculated at undiscounted amounts based on rates that are expected to be paid as at balance date including related on-costs, such as insurances and payroll tax. Bonuses A liability is recognised in other payables and accruals for bonuses where there is a contractual obligation or where there is a past practice that has created a constructive obligation. Liabilities for bonuses are measured at the amounts expected to be paid, including related on-costs, when they are settled. Superannuation Defined contribution funds Obligations for contributions to defined contribution funds are recognised as an expense as incurred. Defined benefit funds The net obligation in respect of defined benefit funds is recognised in the statement of financial position and is calculated separately for each plan by estimating the amount of future benefit that employees have earned in the current and prior periods, discounting that amount and deducting the fair value of any plan assets. The calculation of defined benefit obligations is performed annually by a qualified actuary using the projected unit credit method. Remeasurements of the net defined benefit liability, which comprise actuarial gains and losses and the return on plan assets (excluding interest), are recognised immediately in other comprehensive income. Net interest expense and other expenses related to defined benefit plans are recognised in profit or loss.
Goodman Group Notes to the consolidated financial statements
for the year ended 30 June 2019
70
Results for the year (cont) 2 Profit before income tax (cont)
Profit before income tax has been arrived at after crediting/(charging) the following items:
Goodman GIT
2019 2018 2019 2018
Note $M $M $M $M
Gross property income
Rental income 93.5 131.0 63.7 66.6
Recovery of property outgoings 21.1 19.4 16.5 15.8
Gross property income 114.6 150.4 80.2 82.4
Management activities
Management services 265.4 233.4 - -
Performance related income 204.3 83.1 - -
Management income 469.7 316.5 - -
Development activities
Income from disposal of inventories 486.2 402.7 31.5 34.1
Income from fixed price development contracts 419.7 528.8 - -
Other development income, including development
management 223.3 158.4 - -
Net gain on disposal of special purpose development
entities 5.1 25.9 - -
Development income 1,134.3 1,115.8 31.5 34.1
Inventory cost of sales (343.0) (362.4) (31.5) (27.4)
Costs incurred on fixed price development contracts (384.3) (446.5) - -
Development expenses (727.3) (808.9) (31.5) (27.4)
Disposal of equity investments
Net consideration from disposal of associates and JVs 18.2 340.8 4.9 126.5
Carrying value of associates and JVs disposed 6(f) (5.6) (300.1) - (87.2)
Net gain on disposal of equity investments 12.6 40.7 4.9 39.3
Employee expenses
Wages, salaries and on-costs (184.0) (168.5) - -
Annual and long service leave (1.9) (4.2) - -
Superannuation costs (6.0) (8.0) - -
Employee expenses (191.9) (180.7) - -
Share based payments
Equity settled share based payments expense (97.6) (82.4) - -
Cash settled share based payments expense (64.7) (29.9) - -
Other share based payments related costs (34.3) (13.3) - -
Share based payments expense (196.6) (125.6) - -
Amortisation and depreciation (6.6) (6.2) - -
Goodman Group Notes to the consolidated financial statements
for the year ended 30 June 2019
71
Results for the year (cont) 3 Profit per security Basic profit per security of the Group is calculated by dividing the profit attributable to the Securityholders by the weighted average number of securities outstanding during the year. Diluted profit per security is determined by adjusting the profit attributable to the Securityholders and weighted average number of securities outstanding for all dilutive potential securities, which comprise performance rights issued under the LTIP and securities contingently issuable on conversion of hybrid securities. (a) Goodman
Profit after tax used in calculating basic and diluted profit per security:
Weighted average number of securities used in calculating basic and diluted profit per security:
The calculation of profit per security is not required for GIT. (b) Goodman Limited Under Australian Accounting Standards, the issued units of the Trust and the CDIs over the shares of GLHK are presented as non-controlling interests. As a consequence, the Directors are required to present a profit per share and a diluted profit per share based on Goodman Limited’s consolidated result after tax but excluding the results attributable to the Trust and GLHK and also the other non-controlling interests (Goodman PLUS).
The profit after tax used in calculating both the basic and diluted profit per Goodman Limited share was $242.8 million (2018: basic $182.5 million; and diluted $183.6 million) and the weighted average number of securities used in calculating basic and diluted profit per Goodman Limited share was 1,811,689,652 and 1,864,050,389 respectively (2018: 1,798,818,105 and 1,857,173,648).
2019 2018
¢ ¢
Profit per security
Basic profit per security 89.9 61.1
Diluted profit per security 87.3 59.4
2019 2018
$M $M
Profit per security
Profit after tax used in calculating basic profit per security 1,627.9 1,098.2
Distribution on Goodman PLUS - 4.6
Profit after tax used in calculating diluted profit per security 1,627.9 1,102.8
2019 2018
Number of securities
Weighted average number of securities used in calculating basic profit per
security 1,811,689,652 1,798,818,105
Effect of performance rights on issue 52,360,737 48,199,884
Effect of issue of securities to Goodman PLUS holders - 10,155,659
Weighted average number of securities used in calculating diluted profit per
security 1,864,050,389 1,857,173,648
2019 2018
¢ ¢
Profit per Goodman Limited share
Basic profit per Goodman Limited share 13.4 10.1
Diluted profit per Goodman Limited share 13.0 9.9
Goodman Group Notes to the consolidated financial statements
for the year ended 30 June 2019
72
Results for the year (cont) 4 Segment reporting An operating segment is a component of Goodman that engages in business activities from which it may earn revenues and incur expenses. Goodman reports the results and financial position of its operating segments based on the internal reports regularly reviewed by the Group Chief Executive Officer in order to assess each segment’s performance and to allocate resources to them. Operating segment information is reported on a geographic basis and Goodman has determined that its operating segments are Australia and New Zealand (reported on a combined basis), Asia (Greater China and Japan), Continental Europe (primarily Germany and France), the United Kingdom and the Americas (North America and Brazil). The activities and services undertaken by the operating segments include:
+ property investment, including both direct ownership and cornerstone investments in Partnerships;
+ management activities, both fund and property management; and
+ development activities, including development of directly owned assets (predominantly disclosed as inventories) and management of development activities for Partnerships.
The segment results that are reported to the Group Chief Executive Officer are based on profit before net finance expense and income tax expense, and also exclude non-cash items such as fair value adjustments and impairments, corporate expenses and incentive based remuneration. The assets allocated to each operating segment primarily include inventories, investment properties and the operating segment’s investments in Partnerships, but exclude inter-entity funding, income tax receivables and corporate assets. The liabilities allocated to each operating segment primarily relate to trade and other payables associated with the operating activities, but exclude interest bearing liabilities, derivative financial instruments, provisions for distributions and corporate liabilities. The accounting policies used to report segment information are the same as those used to prepare the consolidated financial statements of Goodman and GIT. For the purpose of operating segment reporting, there are no material intersegment revenues and costs. Information regarding the operations of each reportable segment is included on the following pages.
Goodman Group Notes to the consolidated financial statements
for the year ended 30 June 2019
73
Results for the year (cont) 4 Segment reporting (cont) Information about reportable segments
Goodman
Australia and New
Zealand Asia Continental Europe United Kingdom Americas Total
Goodman Group Notes to the consolidated financial statements
for the year ended 30 June 2019
75
Results for the year (cont) 4 Segment reporting (cont) Reconciliation of reportable segment revenues, profit or loss, assets and liabilities
1. The revenue for other segments for GIT in FY18 related to the disposal of a business park asset in the United Kingdom. 2. The allocation of GIT’s segment results to property investment, management and development is not reported to the Group Chief
Executive Officer. 3. Other unallocated amounts in Goodman and GIT included other financial assets and liabilities, deferred tax assets, tax payables and
provisions which did not relate to the reportable segments. Additionally, other unallocated assets and liabilities in GIT included loans due from/to controlled entities of Goodman.
Goodman GIT
2019 2018 2019 2018
Note $M $M $M $M
Revenues
Total revenue for reportable segments 1,718.6 1,582.7 114.6 88.7
Total revenue for other segments1 - - - 35.2
Consolidated revenues 1,718.6 1,582.7 114.6 123.9
Profit or loss
Total profit before tax for reportable segments2
Property investment earnings 372.1 384.8
Management earnings 469.7 316.5
Development earnings 509.2 490.6
Operating expenses allocated to reportable segments (156.1) (136.7)
Reportable segment profit before tax 1,194.9 1,055.2 303.0 372.2
Profit before tax for other segments - - - 8.0
Corporate expenses not allocated to reportable
segments (111.6) (112.7) (51.4) (46.0)
1,083.3 942.5 251.6 334.2
Valuation and other items not included in reportable
segment profit before tax:
- Net gain from fair value adjustments on investment
properties 6(e) 146.8 71.1 142.3 56.0
- Share of fair value adjustments attributable to
investment properties in associates and JVs after tax 6(f) 746.6 602.7 559.8 508.3
- Share of fair value adjustments on derivative financial
instruments in associates and JVs 6(f) 20.4 (34.3) 18.8 (32.6)
- Straight lining of rental income 0.4 0.8 0.2 0.7
- Share based payments expense (196.6) (125.6) - -
- Net capital losses not distributed and tax deferred
adjustments (6.9) (4.7) 2.1 (3.5)
Profit before interest and tax 1,794.0 1,452.5 974.8 863.1
Net finance (expense)/income 12 (49.3) (267.3) 53.3 (118.4)
Consolidated profit before income tax 1,744.7 1,185.2 1,028.1 744.7
Assets
Assets for reportable segments 13,490.3 11,146.9 7,807.9 6,483.0
Cash 1,013.4 2,102.3 1,013.3 2,102.3
Other unallocated amounts3 409.1 210.2 3,632.7 3,223.3
Consolidated total assets 14,912.8 13,459.4 12,453.9 11,808.6
Liabilities
Liabilities for reportable segments 582.8 546.4 201.9 189.7
Other unallocated amounts3 560.4 401.2 962.6 1,010.7
Consolidated total liabilities 4,390.3 4,285.7 4,210.2 4,331.9
Goodman Group Notes to the consolidated financial statements
for the year ended 30 June 2019
76
Results for the year (cont) 5 Taxation Income tax for the period comprises current tax and movements in deferred tax assets and liabilities. Current tax and movements in deferred tax assets and liabilities are recognised in profit or loss except to the extent that they relate to items recognised directly in equity, in which case the relevant amounts of tax are recognised directly in equity. Current tax is the expected tax payable on the taxable income for the financial year and any adjustment to tax payable in respect of previous financial years. Deferred tax is recognised in respect of temporary differences between the carrying amounts of assets and liabilities for financial reporting purposes and the amounts used for taxation purposes. The following temporary differences are not accounted for:
+ goodwill;
+ the initial recognition of assets or liabilities that affect neither accounting nor taxable profit; and
+ differences relating to investments in controlled entities to the extent that they will probably not reverse in the foreseeable future.
The amount of deferred tax provided is based on the expected manner of realisation or settlement of the carrying amount of assets and liabilities. Deferred tax assets or liabilities in respect of investment properties held at fair value are calculated on the presumption that the carrying amount of the investment property will be recovered through sale. A deferred tax asset is recognised only to the extent that it is probable that future taxable profits will be available against which the asset can be utilised. Deferred tax assets are reduced to the extent that it is no longer probable that the related tax benefit will be realised. Additional income taxes that arise from dividends/distributions are recognised at the same time as the liability to pay the related dividends/distributions. (a) Goodman
1. Total income tax expense includes deferred taxes of $21.7 million (2018: $34.8 million) on fair value adjustments on investment
properties.
Reconciliation of income tax expense to profit before income tax
Goodman
2019 2018
$M $M
Current tax expense recognised in the income statement
Current year (72.8) (48.8)
Adjustment for current tax in prior periods 1.3 1.7
Current tax expense (71.5) (47.1)
Deferred tax expense recognised in the income statement
Origination and reversal of temporary differences (45.3) (35.3)
Deferred tax expense (45.3) (35.3)
Total income tax expense1
(116.8) (82.4)
2019 2018
$M $M
Profit before income tax 1,744.7 1,185.2
Prima facie income tax expense calculated at 30% (2018: 30%) on profit before income (523.4) (355.6)
Decrease/(increase) in income tax due to:
- Profit attributable to GIT Unitholders 301.7 223.4
- Current year losses for which no deferred tax asset was recognised (14.8) (9.4)
- Non-deductible impairment losses and fair value movements (0.4) 4.1
- Other non-assessable/(deductible) items, net 63.0 40.9
- Utilisation of previously unrecognised tax losses 54.4 29.7
- Difference in overseas tax rates 29.5 14.0
- Adjustment for current tax in prior periods 1.3 1.7
- Taxes on Partnership income (22.3) (34.2)
- Other items (5.8) 3.0
Income tax expense (116.8) (82.4)
Goodman Group Notes to the consolidated financial statements
for the year ended 30 June 2019
77
Results for the year (cont) 5 Taxation (cont) (a) Goodman (cont) Current tax receivable/payable
Deferred tax assets and liabilities
Deferred tax assets/(liabilities) are attributable to the following:
Deferred tax assets of $248.8 million (2018: $294.4 million) in relation to tax losses and payables have not been recognised by Goodman. (b) GIT Under current Australian income tax legislation, the Trust is not liable for income tax, including capital gains tax, provided that Securityholders are presently entitled to the distributable income of the Trust as calculated for trust law purposes. The controlled entities of the Trust that operate in certain foreign jurisdictions are liable to pay tax in those jurisdictions. The income tax expense recorded by GIT relates to withholding taxes on actual distributions and deferred taxes on potential future distributions from Partnerships. At 30 June 2019, deferred tax liabilities of $62.8 million (2018: $43.2 million) have been recognised in relation to potential future distributions from Partnerships.
2019 2018
$M $M
Net income tax payable
Net income tax payable at the beginning of the year (50.1) (61.5)
Decrease/(increase) in current tax payable due to:
- Net income taxes paid 37.4 59.6
- Current tax expense (71.5) (47.1)
- Other (0.8) (1.1)
Net income tax payable at the end of the year (85.0) (50.1)
Current tax receivables (refer to note 7) 7.6 9.1
Current tax payables (92.6) (59.2)
(85.0) (50.1)
Deferred tax assets Deferred tax liabilities
2019 2018 2019 2018
$M $M $M $M
Investment properties - - (112.8) (69.6)
Receivables - - (46.2) (8.1)
Tax losses 14.5 0.5 - -
Payables 15.1 - - -
Provisions 5.9 5.5 - -
Other items 0.2 - - -
Tax assets/(liabilities) 35.7 6.0 (159.0) (77.7)
Set off of tax (28.9) - 28.9 -
Net tax assets/(liabilities) 6.8 6.0 (130.1) (77.7)
Goodman Group Notes to the consolidated financial statements
for the year ended 30 June 2019
78
Operating assets and liabilities
The notes in this section focus on Goodman’s property assets, working capital and goodwill and intangible assets.
6 Property assets (a) Principles and policies Investment in property assets includes both inventories and investment properties (including those under development), which may be held either directly or through investments in Partnerships (both associates and JVs). Inventories Inventories relate to land and property developments that are held for sale or development and sale in the normal course of the Group’s business. Inventories are carried at the lower of cost or net realisable value. The calculation of net realisable value requires estimates and assumptions which are regularly evaluated and are based on historical experience and expectations of future events that are believed to be reasonable under the circumstances. Inventories are classified as non-current assets unless they are contracted to be sold within twelve months of the end of the reporting period, in which case they are classified as current assets. Investment properties Investment properties comprise investment interests in land and buildings held for the purpose of leasing to produce rental income and/or for capital appreciation. Investment properties are carried at fair value. The calculation of fair value requires estimates and assumptions which are continually evaluated and are based on historical experience and expectations of future events that are believed to be reasonable under the circumstances. Investment properties are not depreciated as they are subject to continual maintenance and regularly revalued on the basis described below. Changes in the fair value of investment properties are recognised directly in the income statement. Components of investment properties Land and buildings (including integral plant and equipment) comprising investment properties are regarded as composite assets and are disclosed as such in the consolidated financial report. Investment property carrying values include the costs of acquiring the assets and subsequent costs of development, including costs of all labour and materials used in construction, costs of managing the projects, holding costs and borrowing costs incurred during the development periods. Amounts provided to customers as lease incentives and assets relating to fixed rental income increases in operating lease contracts are included within investment property values. Lease incentives are amortised over the term of the lease on a straight-line basis. Direct expenditure associated with leasing a property is also capitalised within investment property values and amortised over the term of the lease. Classification of investment properties Investment properties are classified as either properties under development or stabilised properties. Investment properties under development include land, new investment properties in the course of construction and investment properties that are being redeveloped. Stabilised investment properties are all investment properties not classed as being under development and would be completed properties that are leased or are available for lease to customers. For investment properties under development, the carrying values are reviewed by management at each reporting date to consider whether they reflect the fair value and at completion external valuations are obtained to determine the fair values. For stabilised investment properties, independent valuations are obtained at least every three years to determine the fair values. At each reporting date between obtaining independent valuations, the carrying values are reviewed by management to ensure they reflect the fair values.
Deposits for investment properties Deposits and other costs associated with acquiring investment properties that are incurred prior to obtaining legal title are recorded at cost and disclosed as other assets in the statement of financial position.
Goodman Group Notes to the consolidated financial statements
for the year ended 30 June 2019
79
Operating assets and liabilities (cont) 6 Property assets (cont) (b) Summary of investment in property assets
(c) Estimates and assumptions in determining property carrying values Inventories For both inventories held directly and inventories held in Partnerships, external valuations are not performed but instead valuations are determined using the feasibility studies supporting the land and property developments. The end values of the developments in the feasibility studies are based on assumptions such as capitalisation rates, letting up periods and incentives that are consistent with those observed in the relevant market. Where the feasibility study calculations indicate that the forecast cost of a completed development will exceed the net realisable value, then the inventories are impaired. Investment properties
Stabilised investment properties The fair value of stabilised investment properties is based on current prices in an active market for similar properties in the same location and condition and subject to similar lease and other contracts. The current price is the estimated amount for which a property could be exchanged between a willing buyer and a willing seller in an arm’s length transaction after proper marketing wherein the parties had each acted knowledgably, prudently and without compulsion. Approach to determination of fair value The approach to determination of fair value of investment properties is applied to both investment properties held directly and investment properties held in Partnerships. Valuations are determined based on assessments and estimates of uncertain future events, including upturns and downturns in property markets and availability of similar properties, vacancy rates, market rents and capitalisation and discount rates. Recent and relevant sales evidence and other market data are taken into account. Valuations are either based on an external independent valuation or on an internal valuation.
Total property assets 11,418.5 9,318.1 7,566.1 6,281.8
Goodman Group Notes to the consolidated financial statements
for the year ended 30 June 2019
80
Operating assets and liabilities (cont) 6 Property assets (cont) (c) Estimates and assumptions in determining property carrying values (cont)
Investment properties (cont)
Stabilised investment properties (cont)
External valuations are undertaken only where market segments were observed to be active. In making the determination of whether a market segment is active, the following characteristics are considered:
+ function of the asset (distribution/warehouse or suburban office);
+ location of asset (city, suburb or regional area);
+ carrying value of the asset (categorised by likely appeal to private (including syndicates), national and institutional investors); and
+ categorisation as primary or secondary based on a combination of location, weighted average lease expiry, quality of tenant covenant (internal assessment based on available market evidence) and age of construction.
Each property asset is assessed and grouped with assets in the same or similar market segments. Information on all relevant recent sales is also analysed using the same criteria to provide a comparative set. Unless three or more sales are observed in an individual market segment (taken together with any comparable market segments as necessary), that market segment is considered inactive.
Where a market segment is observed to be active, then external independent valuations are performed for stabilised investment properties where there has been more than a 25 basis point movement in capitalisation rates and/or there has been a material change in tenancy profile and/or there has been significant capital expenditure, and/or there has been a change in use (or zoning) of the asset and/or it has been three years since the previous external independent valuation. For all other stabilised investment properties in an active market segment, an internal valuation is performed based on observable capitalisation rates and referenced to independent market data.
Where a market segment is observed to be inactive, then no external independent valuations are performed and internal valuations are undertaken based on discounted cash flow (DCF) calculations. The DCF calculations are prepared over a 10 year period. The key inputs considered for each individual calculation are rental growth rates, discount rates, market rental rates and letting up incentives. Discount rates are computed using the 10 year bond rate or equivalent in each jurisdiction plus increments to reflect country risk, tenant credit risk and industry risk. Where possible, the components of the discount rate are benchmarked to available market data. Market assessment At 30 June 2019, all markets in which Goodman operated were observed to be active and no adjustments were made to the carrying value of stabilised investment properties arising from internal valuations using DCF calculations. The overall weighted average capitalisation rates for the divisional portfolios (including Partnerships) are as set out in the table below:
1. The methodology used to calculate the weighted average capitalisation rate was changed in the current year to reflect the gross values of investment properties held by Partnerships. Had this methodology been applied to the comparative figures, there would have been no change to the rates disclosed except for the Americas, which would have been 4.7% for both Goodman and GIT.
During the current financial year, the fair values of 76% (2018: 69%) of stabilised investment properties (excluding $0.4 billion of properties being positioned for redevelopment) held directly by Goodman were determined based on a valuation by an independent valuer who held a recognised and relevant professional qualification and had recent experience in the location and category of the investment property being valued. The equivalent percentage for GIT was 97% (2018: 69%).
For investments in Partnerships, typically 100% of the stabilised investment property portfolios are valued by an independent valuer in each financial year.
Goodman GIT
20191
2018 20191
2018
Division % % % %
Australia and New Zealand 5.4 5.9 5.3 5.8
Asia 4.8 5.0 4.3 4.6
Continental Europe 5.1 5.4 5.2 5.5
United Kingdom 4.8 5.4 - -
Americas 4.6 4.2 4.6 4.2
Goodman Group Notes to the consolidated financial statements
for the year ended 30 June 2019
81
Operating assets and liabilities (cont) 6 Property assets (cont) (c) Estimates and assumptions in determining property carrying values (cont) Investment properties (cont) Investment properties under development External valuations are generally not performed for investment properties under development, but instead valuations are determined using the feasibility studies supporting the developments. The end values of the developments in the feasibility studies are based on assumptions such as capitalisation rates, letting up periods and incentives that are consistent with those observed in the relevant market adjusted for a profit and risk factor. This profit and risk factor is dependent on the function, location, size and current status of the development and is generally in a market range of 10% to 15%. This adjusted end value is then compared to the forecast cost of a completed development to determine whether there is an increase or decrease in value. This practice of determining fair value by reference to the development feasibility is generally also applied for Goodman’s investments in Partnerships. However, certain Partnerships do obtain independent valuations for investment properties under development each financial year. (d) Inventories
Goodman
During the current and prior financial year, no impairment losses were recognised on land and development properties. During the financial year, borrowing costs of $23.1 million (2018: $67.8 million) previously capitalised into the carrying value of inventories were expensed to the income statement on disposal of the inventories. (e) Investment properties
Reconciliation of carrying amount of directly held investment properties
Goodman GIT
2019 2018 2019 2018
$M $M $M $M
Current
Land and development properties 307.9 520.5 - -
307.9 520.5 - -
Non-current
Land and development properties 761.1 437.5 6.5 37.5
761.1 437.5 6.5 37.5
Goodman GIT
2019 2018 2019 2018
$M $M $M $M
Carrying amount at the beginning of the year 1,774.6 2,010.2 1,222.4 1,263.5
Acquisitions - 53.2 - -
Capital expenditure 59.7 76.7 9.2 12.8
Carrying value of properties disposed (30.4) (415.0) (215.4) (109.6)
Transfers to inventories (54.5) (23.5) - -
Net gain from fair value adjustments 146.8 71.1 142.3 56.0
Effect of foreign currency translation 0.9 1.9 0.1 (0.3)
Carrying amount at the end of the year 1,897.1 1,774.6 1,158.6 1,222.4
Analysed by segment:
Australia and New Zealand 1,866.2 1,744.1 1,158.6 1,222.4
United Kingdom 30.9 30.5 - -
1,897.1 1,774.6 1,158.6 1,222.4
Goodman Group Notes to the consolidated financial statements
for the year ended 30 June 2019
82
Operating assets and liabilities (cont) 6 Property assets (cont) (e) Investment properties (cont) Goodman During the financial year, borrowing costs of $0.6 million (2018: $40.4 million) previously capitalised into the carrying value of investment properties were expensed to the income statement on disposal of the investment properties. Other information regarding directly held investment properties The fair value measurement approach for directly held investment properties has been categorised as a Level 3 fair value based on the inputs to the valuation method used (see notes 1(f) and 6(c)). The majority of directly held investment properties are in Australia and the valuation technique used in measuring the fair value, as well as the values assumed for the significant unobservable inputs, are summarised in the table below:
The estimated fair value would increase if net market rents were higher and/or if capitalisation rates were lower. The estimated fair value would decrease if the net market rents were lower and/or if the capitalisation rates were higher. The weighted average lease expiries of Goodman’s and GIT’s directly held investment properties in Australia are 4.3 and 2.8 years respectively. Non-cancellable operating lease commitments receivable from investment property customers The analysis in the table below reflects the gross property income, excluding recoverable outgoings, based on existing lease agreements. It assumes that leases will not extend beyond the next review date, where the customer has an option to end the lease.
- One year or later and no later than five years 178.8 188.5 90.3 110.8
- Later than five years 128.2 146.9 26.8 23.2
390.8 419.5 165.0 189.5
Goodman Group Notes to the consolidated financial statements
for the year ended 30 June 2019
83
Operating assets and liabilities (cont) 6 Property assets (cont) (f) Investments accounted for using the equity method Investments accounted for using the equity method comprise associates and JVs, which are collectively referred to as Partnerships. Associates An associate is an entity in which Goodman exercises significant influence but not control over its financial and operating policies. In the consolidated financial statements, investments in associates are accounted for using the equity method. Investments in associates are carried at the lower of the equity accounted amount and recoverable amount. Under this method, Goodman’s share of post-acquisition gains or losses of associates is recognised in the consolidated income statement and its share of post-acquisition movements in reserves is recognised in consolidated reserves. Cumulative post-acquisition movements in both profit or loss and reserves are adjusted against the cost of the investment. JVs A JV is an arrangement in which Goodman is considered to have joint control for accounting purposes, whereby Goodman has rights to the net assets of the arrangement, rather than rights to its assets and obligations for its liabilities. In the consolidated financial statements, investments in JVs are accounted for using the equity method. Investments in JVs are carried at the lower of the equity accounted amount and recoverable amount. Goodman’s share of the JVs’ net profit or loss is recognised in the consolidated income statement from the date the arrangement commences to the date the arrangement ceases. Movements in reserves are recognised directly in the consolidated reserves. Transactions eliminated on consolidation Unrealised gains resulting from transactions with associates and JVs, including those relating to contributions of non-monetary assets on establishment, are eliminated to the extent of Goodman’s interest. Unrealised gains relating to associates and JVs are eliminated against the carrying amount of the investment. Unrealised losses are eliminated in the same way as unrealised gains unless they evidence an impairment of an asset.
Goodman Group Notes to the consolidated financial statements
for the year ended 30 June 2019
84
Operating assets and liabilities (cont) 6 Property assets (cont) (f) Investments accounted for using the equity method (cont) (i) Investments in associates Investments in associates are set out below:
1. GMT is listed on the New Zealand Stock Exchange (NZX). The market value of Goodman’s investment in GMT at 30 June 2019 using the quoted price on the last day of trading was $520.6 million (2018: $350.8
million). 2. Goodman’s ownership interest in GJCP reflected the weighted average ownership interest in the various property investment vehicles.
Goodman GIT
Share of net
results
Ownership
interest
Investment
carrying amount
Share of net
results
Ownership
interest
Investment
carrying amount
Country of 2019 2018 2019 2018 2019 2018 2019 2018 2019 2018 2019 2018
Name of associate establishment $M $M % % $M $M $M $M % % $M $M
Property investment
Goodman Australia Industrial Partnership (GAIP) Australia 273.8 128.5 28.4 27.9 1,543.4 1,319.7 273.8 128.5 28.4 27.9 1,543.4 1,319.7
Goodman Australia Partnership (GAP) Australia 118.5 76.2 19.9 19.9 759.9 673.4 118.5 76.2 19.9 19.9 759.9 673.4
Goodman Group Notes to the consolidated financial statements
for the year ended 30 June 2019
85
Operating assets and liabilities (cont) 6 Property assets (cont) (f) Investments accounted for using the equity method (cont) (i) Investments in associates (cont) The reconciliation of the carrying amount of investments in associates is set out as follows:
Goodman GIT
2019 2018 2019 2018
Movement in carrying amount of investments in associates $M $M $M $M
Carrying amount at the beginning of the year 4,162.4 3,907.0 3,569.8 3,159.0
Share of net results after tax (before fair value adjustments) 223.9 236.1 183.6 204.5
Share of fair value adjustments attributable to investment
properties after tax 469.7 329.6 424.3 299.7
Share of fair value adjustments on derivative financial
instruments 20.8 (34.3) 19.2 (32.6)
Share of net results 714.4 531.4 627.1 471.6
Share of movements in reserves (4.8) 2.4 (4.8) 2.4
Acquisitions 86.8 122.5 35.1 97.2
Disposals (5.6) (212.9) - -
Distributions received and receivable (211.2) (256.8) (181.5) (226.5)
Effect of foreign currency translation 114.0 68.8 74.7 66.1
Carrying amount at the end of the year 4,856.0 4,162.4 4,120.4 3,569.8
Goodman Group Notes to the consolidated financial statements
for the year ended 30 June 2019
86
Operating assets and liabilities (cont)
6 Property assets (cont)
(f) Investments accounted for using the equity method (cont)
(i) Investments in associates (cont)
The table below includes further information regarding associates held at the end of the financial year:
1. Distributions receivable related to distributions provided for but not paid by the associates at 30 June 2019. This was applicable to trusts in Australia where unitholders were presently entitled to income at the end of the financial year. 2. The consolidated ownership interest in GJCP reflected the weighted average ownership interest in the various property investment vehicles.
Carrying amount of investment in associate 1,543.4 1,319.7 759.9 673.4 - - 1,103.0 900.8 - - 714.1 675.9
Distributions received and receivable 75.1 123.0 32.1 32.5 - - 34.5 30.7 - - 39.8 40.3
GJCP2
Goodman Group Notes to the consolidated financial statements
for the year ended 30 June 2019
87
Operating assets and liabilities (cont) 6 Property assets (cont) (f) Investments accounted for using the equity method (cont) (ii) Investments in JVs A summary of the results and ownership interest of principal JVs is set out below:
1. The consolidated ownership interest in KGG reflected the weighted average ownership in the various property investment vehicles. 2. Other JVs includes the investment in Goodman Brazil Logistics Partnership.
Goodman Group Notes to the consolidated financial statements
for the year ended 30 June 2019
88
Operating assets and liabilities (cont) 6 Property assets (cont) (f) Investments accounted for using the equity method (cont) (ii) Investments in JVs (cont) The reconciliation of the carrying amount of investments in JVs is set out as follows:
Goodman GIT
2019 2018 2019 2018
Movement in carrying amount of investments in JVs $M $M $M $M
Carrying amount at the beginning of the year 2,423.1 1,819.3 1,452.1 1,111.8
Share of net results after tax (before fair value adjustments) 141.6 106.4 54.4 53.5
Share of fair value adjustments attributable to investment
properties after tax276.9 273.1 135.5 208.6
Share of fair value adjustments on derivative financial
instruments(0.4)
- (0.4)
-
Share of net results 418.1 379.5 189.5 262.1
Share of movements in reserves (39.8) 26.6 - -
Acquisitions 824.2 415.5 612.5 232.6
Disposals - (87.2) - (87.2)
Distributions/dividends received and receivable (154.6) (209.3) (44.2) (106.3)
Effect of foreign currency translation 125.4 78.7 70.7 39.1
Carrying amount at the end of the year 3,596.4 2,423.1 2,280.6 1,452.1
Goodman Group Notes to the consolidated financial statements
for the year ended 30 June 2019
89
Operating assets and liabilities (cont)
6 Property assets (cont)
(f) Investments accounted for using the equity method (cont)
(ii) Investments in JVs (cont)
The table below includes further information regarding principal JVs held at the end of the financial year:
1. The consolidated ownership interest in KGG reflected the weighted average ownership in the various property investment vehicles. 2. Shareholder loans have been provided by investors of GCLP in proportion to their ownership interest. The shareholder loans are interest free, unsecured and have no fixed terms of repayment. The shareholder
loans are not expected to be repaid within 12 months from the end of the reporting period and the Directors consider the loans to form part of Goodman’s investment in GCLP.
Carrying amount of investment in JV 176.3 166.5 - - - - - - - - 1,854.0 1,064.9
Distributions/dividends received and receivable 7.7 8.0 - - - - - - - - 31.9 30.7
Goodman Group Notes to the consolidated financial statements
for the year ended 30 June 2019
90
Operating assets and liabilities (cont) 6 Property assets (cont)
(f) Investments accounted for using the equity method (cont)
(ii) Investments in JVs (cont) With respect to Goodman’s other JVs, the total profit after tax and revaluations was $71.3 million (2018: $72.9 million) and total other comprehensive income was $nil (2018: $nil). With respect to GIT’s other JVs, the total profit after tax and revaluations was $72.2 million (2018: $64.5 million) and total other comprehensive income was $nil (2018: $nil). 7 Receivables Receivables comprise trade and other receivables and loans to related parties and are recognised on the date that they are originated, initially at fair value plus any directly attributable transaction costs. Subsequent to initial recognition, receivables are measured at amortised cost using the effective interest rate method, less any impairment losses. Receivables are derecognised when the contractual rights to the cash flows from the receivable expire or the Group transfers the rights to receive the contractual cash flows on the receivable in a transaction in which substantially all the risks and rewards of the receivable are transferred.
1. Refer to note 21 for details of amounts due from and loans to related parties. 2. The comparative figures have been restated to reflect the allocation of certain receivables to contract assets in accordance with
AASB 15.
8 Contract balances Contract assets primarily comprise amounts recoverable from fixed price development contracts (disclosed net of any payments received on account) and accrued performance fee income where the Consolidated Entity assesses that the income can be reliably measured. Contract liabilities primarily comprise consideration received in advance of the completion of development contracts and rental guarantees. The following table provides an analysis of receivables from contracts with customers (excluding rental income receivables), contract assets and contract liabilities at the reporting dates:
Goodman GIT
2019 2018 2019 2018
Restated2
$M $M $M $M
Current
Trade receivables 11.0 56.7 - -
Tax receivables 7.6 9.1 - -
Other receivables 99.6 135.1 10.5 23.9
Amounts due from related parties1
119.4 259.5 3.0 128.7
Loans to related parties1
- 4.2 1,825.0 1,956.4
237.6 464.6 1,838.5 2,109.0
Non-current
Other receivables 2.5 2.3 - -
Loans to related parties1
116.3 69.6 1,431.3 1,060.9
118.8 71.9 1,431.3 1,060.9
Goodman
2019 2018
$M $M
Current
Receivables, which are included in trade receivables, other
receivables and amounts due from related parties 145.2 204.9
Contracts assets 308.1 145.4
Contract liabilities 6.0 22.7
Non-current
Contract liabilities 3.0 3.7
Goodman Group Notes to the consolidated financial statements
for the year ended 30 June 2019
91
Operting assets and liabilities (cont) 8 Contract balances (cont) Significant changes in the contract assets and the contract liabilities balances during the year are set out below:
Transaction price allocated to the remaining contract obligations The amount of the transaction price allocated to the remaining performance obligations under the Consolidated Entity’s existing contracts is $27.9 million. This amount represents revenue expected to be recognised in the future from ongoing management and fixed price development contracts with customers. The Consolidated Entity will recognise the expected revenue in the future as the work is completed, which is expected to be within the next twelve months. Details regarding Goodman’s future rental income associated with existing lease agreements is included in note 6. In addition, Goodman receives investment management, development management and property services fees under various contracts that it has with its Partnerships. These contracts are for varying lengths of time and are typically transacted on terms that are consistent with market practice. The revenues under these contracts are linked to the assets under management, total development project costs or gross property income of Partnerships and are invoiced as the services are provided.
Goodman
2019 2018
Contract
assets
Contract
liabilities
Contract
assets
Contract
liabilities
$M $M $M $M
Balance at the beginning of the year 145.4 26.4 325.3 22.1
Revenue recognised that was included in the contract liability
balance at the beginning of the year - (17.6) - (15.2)
Increases due to cash received, excluding amounts
recognised as revenue during the year - - - 18.3
Transfers from contract assets to receivables (481.2) - (628.1) -
Increase due to changes in the measure of progress during
the year 635.1 - 433.2 -
Effect of foreign currency translation 8.8 0.2 15.0 1.2
Balance at the end of the year 308.1 9.0 145.4 26.4
Current contract assets and liabilities 308.1 6.0 145.4 22.7
Non-current contract liabilities - 3.0 - 3.7
308.1 9.0 145.4 26.4
Goodman Group Notes to the consolidated financial statements
for the year ended 30 June 2019
92
Operating assets and liabilities (cont) 9 Payables Trade and other payables are recognised initially at trade date fair value plus any directly attributable transaction costs. Subsequent to initial recognition, trade and other payables are measured at amortised cost. Trade and other payables are derecognised when the contractual obligations are discharged or cancelled or expire. Financial assets and liabilities are offset and the net amount presented in the statement of financial position when, and only when, there is a legal right to offset the amounts and an intention to either settle on a net basis or to realise the asset and settle the liability simultaneously.
1. The comparative figures have been restated to reflect changes in accounting policies. Details of these are set out in note 1(d). 2. Refer to note 21 for details of amounts due from and loans to/from related parties.
10 Provisions A provision is recognised when there is a legal, equitable or constructive obligation as a result of a past event and it is probable that a future sacrifice of economic benefits will be required to settle the obligation, the timing or amount of which is uncertain.
Goodman GIT
2019 2018 2019 2018
Restated1
Restated1
$M $M $M $M
Current
Trade payables 73.2 67.5 3.0 2.0
Other payables and accruals 380.1 332.3 118.4 67.5
Rental income received in advance - - 1.4 1.8
Loans from related parties2
- - 584.8 471.6
453.3 399.8 707.6 542.9
Non-current
Other payables and accruals 169.5 187.4 50.0 130.4
Loans from related parties2
- - 102.3 335.0
169.5 187.4 152.3 465.4
Goodman GIT
2019 2018 2019 2018
Note $M $M $M $M
Current
Dividends/distributions to Securityholders 16 272.1 256.6 181.4 166.6
Other provisions 12.9 13.9 - -
285.0 270.5 181.4 166.6
Non-current
Net defined benefit superannuation funds
in the United Kingdom 18.5 25.1 - -
Other provisions 8.8 9.2 - -
27.3 34.3 - -
Goodman Group Notes to the consolidated financial statements
for the year ended 30 June 2019
93
Operating assets and liabilities (cont) 11 Goodwill and intangible assets Goodman recognises both goodwill and indefinite life management rights in its statement of financial position. Goodwill Goodwill arising on the acquisition of controlled entities is stated at cost less any accumulated impairment losses (refer below). No amortisation is provided. Management rights When fund and/or investment management activities are acquired as part of a business combination, management rights are recorded where they arise from contractual or other legal rights, and the fair value can be measured reliably. Management rights are stated at cost less impairment. Management rights are not amortised as they are assumed to have an indefinite life given they are routinely renewed at minimal cost and on broadly similar terms. Impairment The carrying amounts of goodwill and management rights are tested annually for impairment. For the purpose of impairment testing, goodwill and management rights are allocated to the related cash-generating units monitored by management. An impairment loss is recognised whenever the carrying amount of the cash-generating unit exceeds its recoverable amount. Recoverable amount is the greater of the fair value (net of disposal costs) and the value in use but given that goodwill and management rights are not frequently traded (i.e. fair value is difficult to ascertain), the recoverable amount will be equal to the value in use of the cash-generating unit. In assessing value in use, the estimated future cash flows are discounted to their present value using a pre-tax discount rate that reflects current market assessments of the time value of money and the risks specific to the cash-generating unit. Impairment losses are recognised in the income statement. Impairment losses recognised in respect of cash-generating units are allocated first to reduce the goodwill allocated to the cash-generating unit, then to the carrying amount of the management rights allocated to the cash-generating unit and then to reduce the carrying amount of the other assets in the cash-generating unit on a pro rata basis. An impairment loss in respect of goodwill is not reversed. An impairment loss for management rights is reversed only to the extent that its carrying amount does not exceed its original cost. A summary of Goodman’s goodwill and intangible assets are set out by below:
The carrying value of goodwill and intangible assets is analysed by division in the table below:
2019 2018
$M $M
Goodwill 730.8 712.3
Management rights 109.2 104.4
840.0 816.7
2019 2018
$M $M
Analysed:
Goodwill
Continental Europe - Logistics 615.9 600.5
United Kingdom - Logistics 89.2 87.9
Other 25.7 23.9
Subtotal - goodwill 730.8 712.3
Management rights
Continental Europe - Logistics 35.0 34.1
Other 74.2 70.3
Subtotal - management rights 109.2 104.4
Total 840.0 816.7
Goodman Group Notes to the consolidated financial statements
for the year ended 30 June 2019
94
Operating assets and liabilities (cont) 11 Goodwill and intangible assets (cont) A reconciliation of the movement in the cost of goodwill and management rights during the financial year is set out below:
A reconciliation of the movement in the impairment losses during the financial year is set out below:
Impairments and reversals of impairments There were no impairment losses or reversals of impairment losses during either the current or prior financial year.
Balance at
30 June
2017 Disposals
Effect of
foreign
currency
translation
Balance at
30 June
2018
Effect of
foreign
currency
translation
Balance at
30 June
2019
Cost $M $M $M $M $M $M
Goodwill
Continental Europe - Logistics 572.3 - 35.7 608.0 15.6 623.6
United Kingdom - Logistics 120.7 - 6.4 127.1 1.9 129.0
Other 29.9 - 1.5 31.4 2.0 33.4
Subtotal - goodwill 722.9 - 43.6 766.5 19.5 786.0
Management rights
Continental Europe - Logistics 32.2 - 1.9 34.1 0.9 35.0
United Kingdom - Business Parks 176.8 (186.2) 9.4 - - -
Other 78.8 - 2.7 81.5 4.2 85.7
Subtotal - management rights 287.8 (186.2) 14.0 115.6 5.1 120.7
Total 1,010.7 (186.2) 57.6 882.1 24.6 906.7
Balance at
30 June
2017 Disposals
Effect of
foreign
currency
translation
Balance at
30 June
2018
Effect of
foreign
currency
translation
Balance at
30 June
2019
Impairment losses $M $M $M $M $M $M
Goodwill
Continental Europe - Logistics 7.1 - 0.4 7.5 0.2 7.7
United Kingdom - Logistics 37.2 - 2.0 39.2 0.6 39.8
Other 7.1 - 0.4 7.5 0.2 7.7
Subtotal - goodwill 51.4 - 2.8 54.2 1.0 55.2
Management rights
United Kingdom - Business Parks 176.9 (186.3) 9.4 - - -
Other 10.5 - 0.7 11.2 0.3 11.5
Subtotal - management rights 187.4 - 10.1 11.2 0.3 11.5
Total 238.8 - 12.9 65.4 1.3 66.7
Goodman Group Notes to the consolidated financial statements
for the year ended 30 June 2019
95
Operating assets and liabilities (cont) 11 Goodwill and intangible assets (cont) Impairment testing for intangible assets The carrying values of both goodwill and indefinite life management rights are assessed for impairment annually. For the purpose of impairment testing, goodwill and indefinite life management rights are allocated to the Goodman divisions that represent the lowest level within Goodman at which the goodwill and indefinite life management rights are monitored for internal management purposes. Where goodwill and management rights arise in the same division, impairment testing has been performed on the combined intangible asset. The impairment tests for all intangible assets are based on each division’s value in use. Value in use is determined by discounting the future cash flows generated from continuing operations. These cash flows are based on both investment and development forecasts and then estimating a year five terminal value using a terminal growth rate and the division’s discount rate. The estimation of future cash flows requires assumptions to be made regarding uncertain future events. The cash flows associated with management rights require management to make assumptions regarding the period over which the future fee income streams continue to be received, the likelihood of renewal at minimal cost of contractual agreements to manage partnerships, and the future financial performance of Partnerships which generate those future fee income streams. The cash flows associated with goodwill are often similar to management rights but may also include cash flows from other development activities undertaken by the businesses. One of the key assumptions in relation to the impairment testing is that Goodman’s management contracts are assessed to have an indefinite life given that these contracts have been typically renewed at minimal cost and on broadly similar financial terms. A summary of the other key assumptions for those divisions where the carrying amount of goodwill or indefinite life management rights was significant in comparison with Goodman’s total carrying amount of intangible assets is set out below. All amounts were calculated in local currency and translated to Australian dollars at the closing exchange rate at the end of the financial period. Averages related to average amounts over the five year forecast period.
1. When assessing a potential impairment, the value in use was compared against the sum of the intangible asset balance and the
plant and equipment balance for each division. 2. AUM growth rate in United Kingdom - Logistics reflects the projected growth in GUKP. This assumes that current equity commitments
from Goodman and its investment partners will be fully drawn, with additional funding either from new equity or debt facilities.
Continental Europe -
Logistics
United Kingdom -
Logistics
Value in use (A$M)1 2019 1,388.1 138.4
2018 1,201.8 261.2
Pre-tax discount rate (per annum) 2019 11.1% 9.5%
2018 11.5% 9.1%
Average annual development (million square metres) 2019 0.77 0.18
2018 0.71 0.15
Average annual growth in assets under management (AUM)2 2019 7.9% 39.2%
2018 8.7% 27.3%
Goodman Group Notes to the consolidated financial statements
for the year ended 30 June 2019
96
Operating assets and liabilities (cont)
11 Goodwill and intangible assets (cont)
Impairment testing for intangible assets (cont)
The key drivers of value in respect of the intangible assets are:
+ development cash flows, which are impacted by development volumes and margins; and
+ management cash flows, which are primarily related to AUM in Partnerships.
The decrease in the United Kingdom - Logistics value in use compared to the prior year was due to the assumption in the current year assessment that all development activities during the forecast period will be on GUKP’s balance sheet. This will be the focus over the medium term given the strategic acquisitions during FY19. In the prior year assessment, development activity comprised both development on Goodman’s own balance sheet and development in GUKP.
Discount rates
The post-tax discount rates were determined using the capital asset pricing model, with individual assumptions referenced to market data, where available, and adjusting for specific factors associated with each division. A risk premium was included in each division’s discount rate, reflecting the level of forecasting, size, country and financing risks for that division. The value in use was determined using the after-tax cash flows and the post-tax discount rates, with the discount rates then converted to the equivalent pre-tax rates.
Development activity and margins
Demand for modern, well-located industrial product in both Continental Europe and the United Kingdom continues to be driven by customers’ desire to adopt more efficient distribution methods and be closer to the end consumer. Earnings forecasts for each division include projects which have not yet been contracted. Margins from development activity are expected to be consistent with those achieved historically.
Continental Europe – Logistics The forecasts assume the development starts (by area) over the five year period are 0.77 million square metres each year, consistent with historical performance. The majority of development is expected to be undertaken on Goodman’s own balance sheet and sold to Partnerships. The estimated total cash outflow (from Goodman and its Partnerships) required to finance the assumed development pipeline across the forecast period is A$1.02 billion per annum.
United Kingdom – Logistics Investor demand has remained strong for well-let assets in core locations. The division’s development activity over the next five years is forecast to be 0.18 million square metres per annum (on average), which will be undertaken by GUKP, with Goodman earning development management fee income. The estimated cash outflow (from Goodman and its Partnerships) required to finance the assumed development pipeline across the forecast period is on average A$0.30 billion per annum.
Sources of funding for development activity
Capital inflows required to fund acquisitions and development activity in both divisions are assumed to arise from the following sources: equity investment directly into Partnerships (including distribution reinvestment plans) by Goodman and its investment partners; lending facilities advanced to Partnerships; debt capital markets; customer-funded turnkey developments; and proceeds from disposals of assets. It is not practicable to determine the percentage of the total which will flow from each source.
Funds available to Goodman and its investment partners are assumed to be sourced from available global markets and are not limited to lending markets in the regions to which the relevant intangible asset relates.
The cash flow forecasts have not assumed a downturn in earnings that might arise in the event of severe adverse market conditions.
Goodman Group Notes to the consolidated financial statements
for the year ended 30 June 2019
97
Operating assets and liabilities (cont) 11 Goodwill and intangible assets (cont) Impairment testing for intangible assets (cont) AUM For Continental Europe - Logistics, the average annual increase in AUM of 7.9% (2018: 8.7%) over the forecast period is broadly consistent with the prior year forecasts and assumes that development activity is maintained. For the purpose of the forecasts, capitalisation rates are expected to be stable over the period. For United Kingdom - Logistics, the forecasts assume that over the next five years, the division will increase its AUM from £0.3 billion to approximately £1.7 billion, as GUKP draws down committed equity from its investors to fund the expected development activity. This reflects the development of the sites that have been acquired during FY19, with further acquisitions assumed over the forecast period. For the purpose of the forecasts, capitalisation rates are expected to be stable over the period. Assumptions impacting the terminal year
Long-term growth rates have been used to extrapolate cash flow projections beyond the period covered by the five year forecast. For both Continental Europe - Logistics and United Kingdom - Logistics, the growth rate was based on the average consumer price indices over the past five years. For Continental Europe - Logistics, a weighted average was estimated based on the value of AUM for each of the countries in which Goodman operated. The forecast cost of developments in year five represents the estimated total funding requirements for both directly held developments and developments within Partnerships. The cost of developments in Australian dollars has remained relatively stable.
Development in terminal year (million square metres) 2019 0.70 0.18
2018 0.70 0.17
Development in terminal year (cost in A$B) 2019 0.99 0.36
2018 0.76 0.32
Goodman Group Notes to the consolidated financial statements
for the year ended 30 June 2019
98
Capital management
The notes in this section focus on Goodman and GIT’s financing activities, capital structure and management of the financial risks involved.
12 Net finance (expense)/income Interest income and expense are recognised using the effective interest rate method. Finance costs relating to a qualifying asset are capitalised as part of the cost of that asset using a weighted average cost of debt. Qualifying assets are assets which take a substantial time to get ready for their intended use or sale. All other finance costs are expensed using the effective interest rate method.
1. The net foreign exchange gains/(losses) in Goodman and GIT included unrealised losses of $10.1 million (2018: losses of $8.7
million) relating to the translation of USD denominated notes which do not qualify for net investment hedging. 2. Borrowing costs were capitalised to inventories and investment properties under development during the financial year at rates
between 2.5% and 4.9% per annum (2018: 0.9% and 5.9% per annum).
Goodman GIT
2019 2018 2019 2018
$M $M $M $M
Finance income
Interest income from:
- Related parties 0.4 0.8 79.3 93.1
- Other parties 39.1 34.5 36.4 31.1
Fair value adjustments on derivative financial instruments 6.7 - 38.5 -
Foreign exchange gains1
- - 13.2 50.2
46.2 35.3 167.4 174.4
Finance expense
Interest expense from third party loans, overdrafts and
derivatives (91.8) (87.7) (89.5) (68.8)
Interest expense from related party loans - - (19.6) (12.6)
Debt restructure expense - (82.8) - (82.8)
Other borrowing costs (7.7) (9.7) (5.0) (7.8)
Fair value adjustments on derivative financial instruments - (131.4) - (120.8)
Foreign exchange losses1
(10.3) (8.5) - -
Capitalised borrowing costs2
14.3 17.5 - -
(95.5) (302.6) (114.1) (292.8)
Net finance (expense)/income (49.3) (267.3) 53.3 (118.4)
Goodman Group Notes to the consolidated financial statements
for the year ended 30 June 2019
99
Capital management (cont) 13 Interest bearing liabilities Interest bearing liabilities comprise bank loans, notes issued in the capital markets and private placements. Interest bearing liabilities are recognised initially at fair value plus any directly attributable transaction costs. Subsequent to initial recognition, interest bearing liabilities are measured at amortised cost using the effective interest rate method.
(a) Bank loans, secured The secured bank loans in the prior period related to facilities funding the operations in Brazil. The facility was repaid in full during the year. (b) Bank loans, unsecured
The majority of the unsecured bank loans are multi-currency facilities.
Goodman Group Notes to the consolidated financial statements
for the year ended 30 June 2019
100
Capital management (cont) 13 Interest bearing liabilities (cont) (c) GBP denominated notes As at 30 June 2018, Goodman and GIT had A$215.9 million of GBP denominated notes issued under Goodman’s Euro medium-term note programme. The notes were repaid on their maturity during the year. (d) USD denominated notes As at 30 June 2019, Goodman and GIT had notes on issue in the United States 144A/Reg S bond market as follows:
(e) EUR denominated notes As at 30 June 2019, Goodman and GIT had A$810.0 million (2018: A$789.6 million) (€500.0 million) Reg S EUR denominated senior notes on issue. The notes have a fixed coupon of 1.375% per annum and mature on 27 September 2025.
(f) Foreign private placements As at 30 June 2019, Goodman and GIT had A$165.3 million (2018: A$152.6 million)(¥12.5 billion) in a foreign private placement denominated in Japanese yen. The facility has a fixed coupon of 3.32% per annum payable semi-annually and expires on 3 April 2023.
Coupon
Carrying amount Face value (fixed)
Notes maturity date A$M US$M A$M US$M per annum
15 Apr 2021 263.5 184.7 248.9 174.5 6.375%
22 Mar 2022 429.0 300.8 398.3 279.3 6.000%
15 Mar 2028 748.8 525.0 748.8 525.0 3.700%
15 Oct 2037 463.6 325.0 463.6 325.0 4.500%
30 June 2019 1,904.9 1,335.5 1,859.6 1,303.8
30 Jun 2018 1,823.5 1,348.4 1,763.3 1,303.8
Goodman Group Notes to the consolidated financial statements
1. Facilities available and facilities utilised in respect of the USD denominated notes represent the face value of the notes on issue and
exclude the fair value adjustment of A$45.2 million (2018: A$60.2 million) that is being amortised over the period to maturity. 2. Bank guarantees are drawn from facilities available under unsecured bank loans. The guarantees are not reflected as a liability in
Goodman Group Notes to the consolidated financial statements
for the year ended 30 June 2019
102
Capital management (cont) 14 Other financial assets and liabilities Other financial assets and liabilities primarily comprise derivative financial instruments that are recognised initially on the trade date at which Goodman and GIT become a party to the contractual provisions of the instrument. Derivative financial instruments and hedging Goodman and GIT use derivative financial instruments to hedge their economic exposure to foreign exchange and interest rate risks arising from operating, investing and financing activities. In accordance with the Group’s Financial Risk Management policy, Goodman and GIT do not hold or issue derivative financial instruments for speculative trading purposes.
Goodman and GIT’s derivative financial instruments are not designated as a hedge for accounting purposes, and accordingly movements in the fair value of derivative financial instruments are recognised in the income statement.
Cash flow hedges Certain of Goodman and GIT’s associates and JVs continue to designate derivative financial instruments as cash flow hedges for accounting purposes. Goodman’s and GIT’s share of the effective portion of changes in the fair value of derivative financial instruments in associates and JVs that are designated and qualify as cash flow hedges is recognised in the cash flow hedge reserve. The gain or loss relating to any ineffective portion is recognised in the income statement. Other financial assets
1. Includes fair values of derivative financial instruments equating to $222.4 million (2018: $154.3 million) that hedge Goodman’s net investments in Continental Europe and the United Kingdom.
Other financial liabilities
1. Includes fair values of derivative financial instruments equating to $123.6 million (2018: $31.9 million) that hedge Goodman’s net investments in Continental Europe and the United Kingdom.
Goodman GIT
2019 2018 2019 2018
$M $M $M $M
Current
Derivative financial instruments 1.3 1.6 1.3 1.6
1.3 1.6 1.3 1.6
Non-current
Derivative financial instruments1
337.7 187.1 373.9 198.0
Investment in unlisted securities, at fair value 2.7 0.7 25.1 22.6
Goodman Group Notes to the consolidated financial statements
for the year ended 30 June 2019
103
Capital management (cont)
15 Financial risk management
The Directors have ultimate responsibility for Goodman’s financial risk management (FRM) processes and have established policies, documented in the FRM policy, to manage Goodman’s exposure to financial risks and to utilise capital in an efficient manner.
Goodman’s treasury function is responsible for monitoring the day to day compliance with the Group’s FRM policies and prepares reports for consideration by management committees and the Board including:
+ cash flow projections over a period of at least 12 months to assess the level of cash and undrawn facilities, andheadline gearing at each month end;
+ debt maturity profile, to allow the Group to plan well in advance of maturing facilities;
+ interest rate hedge profile over the next ten years, to allow the Group to manage the proportion of fixed and floatingrate debt in accordance with its FRM policy; and
+ capital hedge position (by currency) and profile of expiring currency derivatives, to allow the Group to manage itsnet investment hedging in accordance with its FRM policy.
Any significant investments or material changes to the finance facilities or FRM policies require approval by the Board.
Capital management
Goodman’s principal capital management objectives are to maintain a strong capital base and provide funds for operating activities (including development expenditure), capital expenditure and investment opportunities as they arise. This is achieved through an appropriate mix of debt and equity.
Goodman is able to alter the capital mix by issuing new Goodman debt and equity securities or hybrid securities, through the operation of a distribution reinvestment plan, adjusting the timing of development and capital expenditure and selling assets to reduce borrowings. Goodman also manages capital through its distribution policy in which distributions made to Securityholders are based on the Group’s operating profit, subject to a minimum distribution equal to the taxable income of the Trust.
Goodman Group Notes to the consolidated financial statements
for the year ended 30 June 2019
104
Capital management (cont) 15 Financial risk management (cont) Goodman’s key financial risks are market risk (including foreign exchange and interest rate risk), liquidity risk and credit risk.
(a) Market risk
Foreign exchange risk
Goodman is exposed to foreign exchange risk through its investments in New Zealand, Hong Kong, China, Japan, Continental Europe, the United Kingdom, North America and Brazil. Foreign exchange risk represents the gain or loss that would be recognised from fluctuations in currency prices against the Australian dollar as a result of Goodman’s net investment in foreign operations, future commercial transactions, and other foreign currency denominated assets and liabilities.
In managing foreign exchange risks, Goodman aims to reduce the impact of short-term fluctuations on Goodman’s earnings and net assets. However, over the long term, permanent changes in foreign exchange rates will have an impact on both earnings and net assets.
Goodman’s capital hedge policy for each overseas region is to hedge between 65% and 90% of foreign currency denominated assets with foreign currency denominated liabilities. This is achieved by borrowing in the same currency as the overseas investments to form a natural economic hedge against any foreign currency fluctuations and/or using derivatives such as cross currency interest rate swaps (CCIRS) and foreign exchange contracts (FEC).
The Group’s hedge position is monitored on an ongoing basis and the Group wi ll enter into new derivatives (including forward start contracts) and close out or enter into contra derivative contracts to manage the capital hedge position. As at 30 June 2019, the principal that was used to hedge its exposures using derivatives and the weighted average exchange rates, by currency, are set out below: Goodman and GIT
1. The AUD/EUR CCIRS were held by GLHK at 30 June 2019. At 30 June 2018, the AUD/EUR CCIRS were held by GIT.
Goodman Group Notes to the consolidated financial statements
for the year ended 30 June 2019
105
Capital management (cont) 15 Financial risk management (cont) (a) Market risk (cont) Foreign exchange risk (cont) In prior years, Goodman entered into both USD/EUR and USD/GBP CCIRS to provide a capital hedge against assets denominated in EUR and GBP. As the Group’s investment in North America has increased, the capital hedge positions have been reassessed to comply with the specified policy ranges and at 30 June 2019, the net USD/EUR and USD/GBP exposure was nil:
In addition to the derivatives detailed in the table above, GIT also has a FEC with a controlled entity of GL to hedge that entity’s USD exposure. On maturity of the contract, GIT will receive USD 240.0 million from GL and pay GBP 156.2 million to GL. Sensitivity analysis Throughout the financial year, if the Australian dollar had been 5% stronger against all other currencies, with all other variables held constant, the profit attributable to Securityholders, excluding derivative mark to market and unrealised foreign exchange movements, would have decreased by A$56.0 million (2018: A$40.4 million decrease) for Goodman and A$18.0 million (2018: A$19.8 million decrease) for GIT. If the Australian dollar had been 5% weaker against all other currencies, with all other variables held constant, the profit attributable to Securityholders, excluding derivative mark to market and unrealised foreign exchange movements, would have increased by A$56.0 million (2018: A$40.4 million increase) for Goodman and A$18.0 million (2018: A$19.8 million increase) for GIT. Interest rate risk Goodman’s interest rate risk arises from variable rate borrowings and the Group’s CCIRS that hedge the overseas investments. Goodman adopts a policy of hedging such that between 60% and 100% of its current year exposure to changes in interest rates on borrowings is on a fixed rate basis. Goodman enters into interest rate derivatives (IRD), comprising both interest rate swaps and interest rate caps, to manage cash flow risks associated with the interest rates on borrowings that are floating. The IRD contracts are for 90 day intervals and involve quarterly payments or receipts of the net amount of interest. As at 30 June 2019, Goodman and GIT’s interest rate risk exposure based on existing interest bearing liabilities and derivative financial instruments is set out below: Goodman
1. The Group’s CCIRS may give rise to interest rate exposure as a result of the difference between the principal in A$ calculated at
year end spot rate and the principal in A$ calculated at the contract rate. The impact on the Group’s interest rate exposure is more significant at 30 June 2019 compared to the prior year due to the increased A$ principal associated with the CCIRS and the weakening Australian dollar.
As a result of the fixed rate interest bearing liabilities and derivative financial instruments that exist at 30 June 2019, Goodman and GIT would have the following fixed interest rate exposure at the end of each of the next five financial years. This assumes all interest bearing liabilities and derivative financial instruments mature in accordance with current contractual terms.
Sensitivity analysis Throughout the financial year, if interest rates on borrowings (based on the interest bearing liabilities and derivative financial instruments in place at the end of the year) had been 100 basis points higher/lower, with all other variables held constant, the profit attributable to Securityholders would have decreased/increased by A$0.1 million (2018: A$2.4 million) for Goodman and increased/decreased by A$1.0 million (2018: decreased/increased by A$1.2 million) for GIT.
Price risk
Goodman and GIT are not materially exposed to price risk.
(b) Liquidity risk
Liquidity risk is the risk that Goodman will not be able to meet its financial obligations as they fall due. Goodman’s objective is to maintain sufficient liquidity to fund short term working capital, capital expenditure, investment opportunities, debt expiries and distributions. This is achieved through the monthly preparation of a three year cash flow forecast to understand the uses of funds and to identify potential shortfalls in funding. This allows Goodman to plan for renewal of debt facilities, negotiation of new debt facilities, new issues of securities, including the distribution reinvestment plan, and other potential sources of funding. Goodman’s treasury function is responsible for reporting details of all debt maturities to the Board at its regular meetings. Goodman seeks to spread its debt maturities such that the total debt repayable in a single financial year does not exceed Board approved policy levels.
Goodman Group Notes to the consolidated financial statements
for the year ended 30 June 2019
107
Capital management (cont)
15 Financial risk management (cont)
(b) Liquidity risk (cont)
The contractual maturities of financial liabilities are set out below:
1. Contractual cash flows relating to bank loans exclude any estimate of interest payments that might arise under Goodman’s revolving loan facilities. 2. Net settled includes IRD and FEC. 3. Gross settled includes CCIRS. 4. The comparative figures have been restated to reflect changes in accounting policies. Details of these are set out in note 1(d).
Carrying
amount
Contractual
cash flows
Less than 1
year 1 - 2 year(s) 2 - 3 years 3 - 4 years 4 - 5 years
Total derivative financial (assets)/liabilities - net (39.7) (10.4) 20.6 (26.0) (45.6) 33.3 33.4 (26.1)
Goodman Group Notes to the consolidated financial statements
for the year ended 30 June 2019
109
Capital management (cont) 15 Financial risk management (cont) (c) Credit risk Credit risk represents the loss that would be recognised if counterparties failed to perform as contracted. The maximum exposure to credit risk on financial assets, excluding investments, which have been recognised on the statement of financial position, is equal to the carrying amount. Goodman has a policy of assessing the creditworthiness of all potential customers and is not materially exposed to any one customer. Goodman evaluates all customers’ perceived credit risk and may require the lodgement of rental bonds or bank guarantees, as appropriate, to reduce credit risk. In addition, all rents are payable monthly in advance. Bank guarantees are accepted from financial institutions which have an investment grade credit rating from a major rating agency. Concentration of credit risk may exist due to receivables in respect of the disposals of investment properties. The credit risk is minimised as legal title to the properties is only transferred upon receipt of proceeds and typically Goodman will have either received a cash deposit or be the beneficiary of a bank guarantee for 10% to 20% of the total proceeds. In relation to material bank deposits, Goodman minimises credit risk by dealing with major financial institutions. The counterparty must have a long-term credit rating that is a minimum of an “A” category (or equivalent) from a major rating agency. The amounts and other terms associated with bank deposits are formally reviewed monthly. The credit risks associated with derivative financial instruments are managed by:
+ transacting with multiple derivatives counterparties that have a long-term investment grade credit rating;
+ utilising International Swaps and Derivatives Association (ISDA) agreements with derivative counterparties in order to limit exposure to credit risk through netting of amounts receivable and amounts payable to individual counterparties (refer below); and
+ formally reviewing the mark to market position of derivative financial instruments by counterparty on a monthly basis. Master netting or similar agreements Goodman enters into derivative transactions under ISDA master netting off agreements. Under these agreements, where certain credit events occur (such as a default), all outstanding transactions under the agreement are terminated and a single net termination value is payable in full and final settlement. As Goodman does not have any current legally enforceable right to offset, the fair values associated with derivative financial instruments have been presented gross in the statement of financial position. However, if a credit event occurred, the ISDA master netting off agreement would allow A$209.6 million (2018: A$89.2 million) and A$207.2 million (2018: A$89.2 million) of financial assets and financial liabilities in relation to Goodman’s and GIT’s respective derivative financial instruments to be offset.
Goodman Group Notes to the consolidated financial statements
for the year ended 30 June 2019
110
Capital management (cont) 15 Financial risk management (cont) (d) Fair values of financial instruments The carrying amounts shown in the statement of financial position and fair values of financial assets and liabilities are as follows:
1. The fair value of certain fixed rate interest bearing liabilities has been determined by reference to the quoted market prices at 30 June 2019.
Goodman Group Notes to the consolidated financial statements
for the year ended 30 June 2019
111
Capital management (cont) 15 Financial risk management (cont) (d) Fair values of financial instruments (cont) Fair value hierarchy The table below analyses financial instruments carried at fair value, by valuation method (see note 1(f)):
There were no transfers between the levels during the year. Valuation techniques used to derive Level 2 and Level 3 fair values The Level 2 derivative financial instruments held by Goodman and GIT consist of IRD, CCIRS and FEC. The fair values of derivative financial instruments are determined using generally accepted pricing models which discount estimated future cash flows based on the terms and maturity of each contract and current market interest rates and/or foreign currency rates, adjusted for specific features of the instruments.
Goodman GIT
Level 1 Level 2 Level 3 Total Level 1 Level 2 Level 3 Total
Goodman Group Notes to the consolidated financial statements
for the year ended 30 June 2019
112
Capital management (cont) 16 Dividends and distributions Dividends and distributions are recognised when they are declared and before deduction of any withholding tax. Any non-recoverable withholding tax is included in income tax. Goodman FY19 dividends/distributions
FY18 dividends/distributions
GIT In FY19, GIT’s distributions were 25.0 cents per security (2018: 23.0 cents per security) amounting to $453.5 million (2018: $414.2 million). Movement in provision for dividends/distributions to Securityholders
Dividends/
distributionscents per
security
Total amount
$M
Date of
paymentGL - - n/a
GIT
- 31 Dec 2018 15.00 272.1 26 Feb 2019
- 30 Jun 2019 10.00 181.4 9 Sep 2019
GLHK 5.00 90.7 9 Sep 2019
30.00 544.2
Dividends/
distributions
cents per
security
Total amount
$M
Date of
payment
GL - - n/a
GIT
- 31 Dec 2017 13.75 247.6 26 Feb 2018
- 30 Jun 2018 9.25 166.6 29 Aug 2018
GLHK 5.00 90.0 29 Aug 2018
28.00 504.2
Goodman GIT
2019 2018 2019 2018
$M $M $M $M
Balance at the beginning of the year 256.6 236.2 166.6 236.2
Provisions for dividends/distributions 544.2 504.2 453.5 414.2
Balance at the end of the year 272.1 256.6 181.4 166.6
Goodman Group Notes to the consolidated financial statements
for the year ended 30 June 2019
113
Capital management (cont) 17 Issued capital (a) Ordinary securities Ordinary securities are classified as equity. Incremental costs directly attributable to issues of ordinary securities are recognised as a deduction from equity, net of any tax effects.
Terms and conditions Stapled security means one share in the Company stapled to one unit in the Trust and one CDI over a share in GLHK. Holders of stapled securities are entitled to receive dividends or distributions as declared from time to time and are entitled to one vote per security at Securityholders’ meetings. In the event of a winding up, Securityholders rank after creditors and are fully entitled to any net proceeds of liquidation. Movement in ordinary securities
(b) Share based payments LTIP The Group’s share based payments primarily relate to performance rights awarded to employees under the LTIP. These performance rights entitle an employee to either acquire Goodman securities for $nil consideration (equity settled performance rights) or, in certain jurisdictions, to receive an amount in cash equal to the value of the securities (cash settled performance rights), subject to the vesting conditions having been satisfied. Further details regarding the vesting conditions are included in the remuneration report section of the Directors’ report. During the year, the movement in the number of equity settled and cash settled performance rights under the LTIP was as follows:
Total issued capital 8,031.7 8,031.7 7,477.3 7,381.3
Number of Goodman GIT
Date Details securities $M $M
30 Jun 2017 Balance before accumulated issue costs 1,789,121,143 8,192.2 7,459.0
31 Aug 2017 Securities issued to employees under the LTIP 11,642,734 - 70.8
30 Jun 2018 Balance before accumulated issue costs 1,800,763,877 8,192.2 7,529.8
31 Aug 2018 Securities issued to employees under the LTIP 13,118,118 - 96.0
Less: Accumulated issue costs (160.5) (148.5)
30 Jun 2019 Closing balance 1,813,881,995 8,031.7 7,477.3
2019 2018
Outstanding at the beginning of the year 75,434,623 71,270,400
Granted 21,486,688 20,180,899
Exercised (14,925,092) (12,835,205)
Forfeited (2,934,056) (3,181,471)
Outstanding at the end of the year 79,062,163 75,434,623
Exercisable at the end of the year - -
Number of rights
Goodman Group Notes to the consolidated financial statements
for the year ended 30 June 2019
114
Capital management (cont) 17 Issued capital (cont) (b) Share based payments Share based payments transactions The fair value of equity settled performance rights at the grant date is expensed with a corresponding increase in the employee compensation reserve over the vesting period. The expense is adjusted to reflect the actual number of performance rights for which the related service and non-market vesting conditions are expected to be met. The accumulated share based payments expense of performance rights which have vested or lapsed is transferred from the employee compensation reserve to retained earnings/(accumulated losses). The fair value of cash settled performance rights is also recognised as an expense but with a corresponding increase in liabilities over the vesting period. The expense is adjusted to reflect the actual number of performance rights for which the related service and non-market vesting conditions are expected to be met. The liability is remeasured at each reporting date and at the vesting date based on the fair value of the rights. The fair value of services received in return for performance rights granted under the LTIP is measured by reference to the fair value of the performance rights granted. The fair value of the performance rights granted during the year was measured as follows:
+ operating EPS tranche: these rights were valued as a granted call option, using the standard Black Scholes model with a continuous dividend/distribution yield; and
+ Relative TSR tranche: these rights were valued using a Monte Carlo model which simulated total returns for each of the ASX 100 stocks and discounted the future value of any potential future vesting performance rights to arrive at a present value. The model uses statistical analysis to forecast total returns, based on expected parameters of variance and co-variance.
The model inputs for performance rights, both equity and cash settled, awarded during the current financial year included the following:
The amounts recognised as an expense are set out in note 2. At 30 June 2019, a liability of $87.4 million (2018: $45.1 million) was recognised in relation to cash settled performance rights. Goodman’s New Zealand Long Term Incentive Plan Under Goodman’s New Zealand Long Term Incentive Plan, employees receive approximately half of their LTI in the form of performance rights over GMT units that vest subject to meeting performance hurdles based on the achievement of distributable earnings targets by GMT and the relative total unitholder return from holding GMT units compared to other NZX property vehicles. On vesting, delivery of units in GMT is made from units held by Goodman or acquired on market.
Rights issued on Rights issued on
15 Nov 2018 28 Sep 2018
Fair value at measurement date ($) 8.72 8.52
Security price ($) 10.33 10.36
Exercise price ($) - -
Expected volatility (%) 18.27 18.65
Rights' expected weighted average life (years) 3.8 3.9
Dividend/distribution yield per annum (%) 2.71 2.70
Average risk free rate of interest per annum (%) 2.26 2.21
Goodman Group Notes to the consolidated financial statements
for the year ended 30 June 2019
115
Other items
The notes in this section sets out other information that is required to be disclosed to comply with the Australian Accounting Standards, Corporations Act 2001 or Corporations Regulations.
18 Notes to the cash flow statements (a) Reconciliation of cash For the purpose of the cash flow statements, cash and cash equivalents includes cash on hand at the bank and short-term deposits at call. Cash at the end of the year as shown in the cash flow statements is reconciled to the related items in the statements of financial position as follows:
(b) Reconciliation of profit for the year to net cash provided by operating activities
(c) Non-cash transactions During the current and prior financial years, there were no significant non-cash transactions.
Goodman GIT
2019 2018 2019 2018
$M $M $M $M
Bank balances 950.5 895.6 557.8 618.5
Call deposits 656.6 1,511.2 656.6 1,511.2
1,607.1 2,406.8 1,214.4 2,129.7
Goodman GIT
2019 2018 2019 2018
$M $M $M $M
Profit for the year 1,627.9 1,102.8 1,009.7 715.9
Items classified as investing activities
Net gain on disposal of investment properties (15.3) (67.4) (8.0) (10.3)
Net gain on disposal of equity investments (12.6) (40.7) (4.9) (39.3)
Non-cash items
Amortisation and depreciation 6.6 6.2 - -
Share based payments expense 169.1 125.6 - -
Net gain from fair value adjustments on investment properties (146.8) (71.1) (142.3) (56.0)
Share of net results of equity accounted investments (1,132.5) (910.9) (816.6) (733.7)
Net finance expense/(income) 49.3 267.3 (53.3) 118.4
Income tax expense 116.8 82.4 18.4 28.8
662.5 494.2 3.0 23.8
Changes in assets and liabilities during the year:
- (Increase)/decrease in receivables (78.0) 160.2 0.2 (4.5)
- (Increase)/decrease in inventories (8.1) 176.2 31.0 22.3
- Decrease/(Increase) in other assets 1.4 (17.1) 2.7 (0.8)
- Increase/(decrease) in payables 13.0 31.2 (1.0) 6.0
- Decrease in provisions (11.7) (12.0) - -
579.1 832.7 35.9 46.8
Distributions/dividends received from equity accounted
investments 365.4 465.3 225.6 340.2
Net finance costs paid, excluding cash outflow on debt
restructure (79.6) (77.2) (78.7) (79.8)
Net income taxes (paid)/received (37.4) (59.6) (1.5) 0.1
Net cash provided by operating activities 827.5 1,161.2 181.3 307.3
Goodman Group Notes to the consolidated financial statements
for the year ended 30 June 2019
116
Other items (cont) 18 Notes to the cash flow statements (cont)
(d) Reconciliation of liabilities arising from financing activities
Interest
bearing
liabilities
Derivative
financial
instruments
Provision for
dividends/
distributions Total
Goodman $M $M $M $M
Balance at 1 July 2017 2,878.3 (7.3) 236.2 3,107.2
Changes from financing cash flows
Proceeds from borrowings 1,867.1 - - 1,867.1
Payments on borrowings and derivative financial
instruments (1,508.6) (170.0) - (1,678.6)
Cash outflow on debt restructure/modification (162.2) - - (162.2)
Distributions paid - - (488.4) (488.4)
Total changes from financing cash flows 196.3 (170.0) (488.4) (462.1)
Changes arising from obtaining or losing
control of subsidiaries or other businesses (142.0) - - (142.0)
Effect of changes in foreign exchange rates 79.7 5.8 - 85.5
Changes in fair value (19.5) 131.7 - 112.2
Other changes
Other borrowing costs 5.8 - - 5.8
Debt restructure expense 82.9 - - 82.9
Distributions declared - - 508.8 508.8
Total other changes 88.7 - 508.8 597.5
Balance at 30 June 2018 3,081.5 (39.8) 256.6 3,298.3
Changes from financing cash flows
Proceeds from borrowings 12.6 - - 12.6
Payments on borrowings and derivative financial
instruments (249.4) (42.5) - (291.9)
Distributions paid - - (528.7) (528.7)
Total changes from financing cash flows (236.8) (42.5) (528.7) (808.0)
Effect of changes in foreign exchange rates 140.8 (1.5) - 139.3
Changes in fair value (14.9) (6.7) - (21.6)
Other changes
Other borrowing costs 4.4 - - 4.4
Distributions declared - - 544.2 544.2
Total other changes 4.4 - 544.2 548.6
Balance at 30 June 2019 2,975.0 (90.5) 272.1 3,156.6
Goodman Group Notes to the consolidated financial statements
for the year ended 30 June 2019
117
Other items (cont) 18 Notes to the cash flow statements (cont)
(d) Reconciliation of liabilities arising from financing activities (cont)
Interest
bearing
liabilities
Derivative
financial
instruments
Provision
for
distributions
Loans with
related
parties, net Total
GIT $M $M $M $M $M
Balance at 1 July 2017 2,576.3 (7.2) 236.2 (2,902.5) (97.2)
Changes from financing cash flows
Net cash flows from loans to related parties - - - 956.5 956.5
Proceeds from borrowings 1,867.1 - - - 1,867.1
Payments on borrowings and derivative financial
instruments (1,445.5) (170.0) - - (1,615.5)
Cash outflow on debt restructure/modification (162.2) - - - (162.2)
Distributions paid - - (488.4) - (488.4)
Total changes from financing cash flows 259.4 (170.0) (488.4) 956.5 557.5
Effect of changes in foreign exchange rates 59.7 5.9 - (68.5) (2.9)
Changes in fair value (19.5) 120.6 - - 101.1
Other changes
Issue of units - - - (70.8) (70.8)
Equity settled share based payments - - - (25.8) (25.8)
Interest income - - - (93.1) (93.1)
Interest expense - - - 12.6 12.6
Interest paid - - - (19.1) (19.1)
Other borrowing costs 6.2 - - - 6.2
Debt restructure expense 82.8 - - - 82.8
Distributions declared - - 418.8 - 418.8
Total other changes 89.0 - 418.8 (196.2) 311.6
Balance at 30 June 2018 2,964.9 (50.7) 166.6 (2,210.7) 870.1
Changes from financing cash flows
Net cash flows from loans to related parties - - - (126.3) (126.3)
Payments on borrowings and derivative financial
instruments (220.1) (42.4) - - (262.5)
Distributions paid - - (438.7) - (438.7)
Total changes from financing cash flows (220.1) (42.4) (438.7) (126.3) (827.5)
Effect of changes in foreign exchange rates 134.7 (1.9) - (24.2) 108.6
Changes in fair value (17.9) (38.4) - - (56.3)
Other changes
Issue of units - - - (96.0) (96.0)
Equity settled share based payments - - - (30.4) (30.4)
Interest income - - - (79.3) (79.3)
Interest expense - - - 19.6 19.6
Interest paid - - - (21.9) (21.9)
Other borrowing costs 2.7 - - - 2.7
Distributions declared - - 453.5 - 453.5
Total other changes 2.7 - 453.5 (208.0) 248.2
Balance at 30 June 2019 2,864.3 (133.4) 181.4 (2,569.2) 343.1
Goodman Group Notes to the consolidated financial statements
for the year ended 30 June 2019
118
Other items (cont) 19 Equity attributable to Goodman Limited and non-controlling interests Under Australian Accounting Standards, stapled entities are required to separately identify equity attributable to the parent entity from equity attributable to other entities stapled to the parent. The equity attributable to other entities stapled to the parent is presented as non-controlling interests in the statement of financial position of the Group. The tables below in notes 19(a) and 19(b) provide an analysis of equity, profit for the year and total comprehensive income for the year attributable to each of Goodman Limited and the other entities stapled to Goodman Limited (non-controlling interests). (a) Equity attributable to Goodman Limited
Attributable to Goodman Limited
Goodman
Issued
capital
Asset
revaluation
reserve
Foreign
currency
translation
reserve
Employee
compensation
reserve
Defined benefit
funds actuarial
losses reserve
Total
reserves
(Accumulated
losses)/
retained
earnings Total
$M $M $M $M $M $M $M $M
Balance at 1 July 2017 483.2 - (27.9) 12.2 (31.4) (47.1) (70.0) 366.1
Balance at 30 June 2019 7,548.5 (7.1) (3.3) 217.7 187.9 395.2 1,642.6 9,586.3 -
Goodman Group Notes to the consolidated financial statements
for the year ended 30 June 2019
120
Other items (cont) 20 Controlled entities Controlled entities are entities controlled by the Company. Under Australian Accounting Standards, the Company is identified as having acquired control over the assets of the Trust and GLHK. The consolidated financial statements incorporate the assets and liabilities of all controlled entities as at 30 June 2019 and the results of all such entities for the year ended 30 June 2019. Where an entity either began or ceased to be controlled during the financial year, the results of that entity are included only from or to the date control commenced or ceased. Unrealised gains and losses and inter-entity balances resulting from transactions with or between controlled entities are eliminated in full on consolidation. The significant controlled entities of the Company are set out below:
1. Significant controlled entities of Goodman Industrial Trust.
Country of establishment/
Significant controlled entities of Goodman Limited incorporation
GA Industrial Portfolio Trust Australia
Goodman Australia Finance Pty Limited1 Australia
Goodman Capital Trust1 Australia
Goodman Europe Development Trust1 Australia
Goodman Finance Australia Trust1 Australia
Goodman Funding Pty Limited1 Australia
Goodman Funds Management Australia Limited Australia
Goodman Funds Management Limited Australia
Goodman Industrial Funds Management Limited Australia
Goodman Industrial Trust Australia
Goodman Property Services (Aust) Pty Limited Australia
Goodman Treasury Trust1 Australia
Goodman Ultimo Trust1 Australia
Moorabbin Airport Corporation Pty Ltd Australia
Goodman Belgium NV Belgium
Goodman Management Services (Belgium) NV Belgium
Goodman China Asset Management Limited Cayman Islands
Goodman China Developments Cayman Islands
Goodman Developments Asia Cayman Islands
MGI HK Finance1 Cayman Islands
Goodman Management Consulting (Beijing) Co. Ltd China
Goodman Management Consulting (Shanghai) Co. Ltd China
Goodman Czech Republic sro Czech Republic
Goodman France Sàrl France
Goodman Germany GmbH Germany
GFM Hong Kong Limited Hong Kong
Goodman Asia Limited Hong Kong
Goodman China Limited Hong Kong
Goodman Hong Kong Investment Trust Hong Kong
Goodman Logistics (HK) Limited Hong Kong
GPS Hong Kong Limited Hong Kong
Goodman Hungary Kft Hungary
Goodman Italy S.R.L. Italy
Goodman Group Notes to the consolidated financial statements
for the year ended 30 June 2019
121
Other items (cont) 20 Controlled entities (cont)
1. Significant controlled entities of Goodman Industrial Trust.
Country of establishment/
Significant controlled entities of Goodman Limited incorporation
Goodman Investment Holdings (NZ) Limited New Zealand
Goodman (NZ) Limited New Zealand
Goodman Property Services (NZ) Limited New Zealand
Goodman Poland Sp zoo Poland
Goodman Slovakia sro Slovakia
Goodman Galaxy Holding BV The Netherlands
Goodman Netherlands BV The Netherlands
Goodman Logistics Developments (UK) Limited United Kingdom
Goodman Operator (UK) Limited United Kingdom
Goodman Real Estate Adviser (UK) Limited United Kingdom
Goodman Real Estate (UK) Limited United Kingdom
Goodman UK Limited United Kingdom
Goodman Management USA Inc United States
Goodman US Finance One, LLC1 United States
Goodman US Finance Two, LLC1 United States
Goodman US Finance Three, LLC1 United States
Goodman US Finance Four, LLC1 United States
Goodman US Finance Five, LLC1 United States
Tarpon Properties REIT Inc1 United States
Goodman Group Notes to the consolidated financial statements
for the year ended 30 June 2019
122
Other items (cont) 21 Related parties The names of key management personnel of Goodman at any time during the financial year are as follows:
Remuneration of key management personnel
The key management personnel remuneration totals are as follows:
1. The remuneration is paid by wholly-owned controlled entities of the Company.
GIT does not employ personnel in its own right. However, it is required to have an incorporated responsible entity to manage its activities and GFML is considered to be the key management personnel of GIT. Individual Directors’ and executives’ compensation disclosures Information regarding individual Directors’ and executives’ compensation and some equity instruments disclosures as required by Corporations Regulations 2M.3.03 is provided in the remuneration report section of the Directors’ report. Transactions with associates and JVs The transactions with Partnerships during the financial year were as follows:
Non-Executive Directors - GL and GFML Executive KMP
Ian Ferrier, AM Gregory Goodman
Christopher Green (appointed 28 April 2019) Anthony Rozic
Stephen Johns Danny Peeters
Rebecca McGrath Nick Kurtis
Phillip Pryke Nick Vrondas
Jim Sloman (retired 15 November 2018) Michael O'Sullivan
Goodman Group Notes to the consolidated financial statements
for the year ended 30 June 2019
123
Other items (cont)
21 Related parties (cont)
Transactions with associates and JVs (cont)
Amounts due from Partnerships at 30 June 2019 were as follows:
1. Amounts due from related parties include contract assets arising from transactions with related parties.2. Loans provided by Goodman and GIT to associates and JVs have been provided on an arm’s length basis.
Transactions between GIT and other Goodman entities
In accordance with the Trust’s Constitution, GFML is entitled to be reimbursed where expenses have been incurred on behalf of the Trust:
As at 30 June 2019, no amounts were owed to GFML (2018: $nil).
Other Goodman entities perform a number of services for GIT. The fees, costs and expenses for the services performed during the year were as follows:
In addition to the above, interest bearing loans exist between GIT and other Goodman entities. At 30 June 2019, interest bearing loans of $3,226.3 million (2018: $3,007.8 million) were receivable by GIT from other Goodman entities and $676.4 million (2018: $796.0 million) was payable by GIT to other Goodman entities. Loans to related Goodman entities bear interest at rates referenced to GIT’s external funding arrangements.
Goodman Group Notes to the consolidated financial statements
for the year ended 30 June 2019
124
Other items (cont)
22 Commitments
Goodman’s operating lease commitments (as a lessee) are set out below:
GIT has no operating lease commitments as a lessee (2018: $nil).
Development activities
At 30 June 2019, Goodman was committed to expenditure in respect of $277.9 million (2018: $264.3 million) on inventories and other development activities. GIT has no such commitments (2018: $nil).
Investment properties
At 30 June 2019, capital expenditure commitments on Goodman’s existing investment property portfolio was $100.9 million (2018: $16.9 million). GIT has no such commitments (2018: $nil).
Partnerships
At 30 June 2019, Goodman had a remaining equity commitment of $64.8 million (2018: $63.2 million) into GEP. This commitment also applies to GIT.
In relation to GAIP and GEP, Goodman offers limited liquidity facilities to investors, which allow the investors to sell to Goodman some or all of their investment in the Partnerships. Limits apply to these liquidity facilities and Goodman is only required to offer to purchase up to $7.5 million of the issued capital of GAIP each quarter and EUR 25 million of the issued capital of GEP each half year. Furthermore, Goodman is only required to purchase units where its co-investment in GAIP or GEP is either below a prescribed limit or a maximum amount of liquidity has been provided. Currently, Goodman’s interest (together with its custodian’s interest) in GAIP and GEP is below the prescribed limit and both liquidity facilities are open for investors. The commitment under the liquidity facility also applies to GIT.
Furthermore, in respect of certain Partnerships, Goodman and its investment partners have committed to invest further capital, subject to the unanimous approval by the partners of the relevant property acquisition and/or development for which the funding is required. Goodman’s commitment in respect of these Partnerships is set out below:
+ $99.7 million (2018: $nil) into GHKLP;
+ $23.8 million (2018: $23.8 million) into KGIP;
+ $150.0 million (2018: $146.2 million) into KGG;
+ $361.0 million (2018: $371.8 million) into GJDP;
+ $872.7 million (2018: $396.0 million) into GCLP;
+ $209.1 million (2018: $269.7 million) into GUKP;
+ $855.6 million (2018: $1,406.7 million) into GNAP; and
+ $123.8 million (2018: $131.3) into Goodman Brazil Logistics Partnership.
2019 2018
$M $M
Non-cancellable operating lease commitments
Future operating lease commitments not provided for in the financial statements and payable:
- Within one year 18.8 16.6
- One year or later and no later than five years 35.8 30.6
- Later than five years 8.6 4.7
63.2 51.9
Future inventory ground lease commitments not provided for in the financial statements
and payable:
- Within one year 1.1 1.8
- One year or later and no later than five years 4.6 11.0
- Later than five years 35.6 101.4
41.3 114.2
Goodman Group Notes to the consolidated financial statements
for the year ended 30 June 2019
125
Other items (cont)
23 Auditors’ remuneration
24 Parent entity disclosures
As at, and throughout the financial year ended, 30 June 2019, the parent entities of Goodman and GIT were Goodman Limited and Goodman Industrial Trust respectively. The financial information for the parent entities is disclosed as follows:
Goodman GIT
2019 2018 2019 2018
$000 $000 $000 $000
Audit services
Auditor of the Company:
- Audit and review of financial reports (KPMG Australia) 926.2 884.9 592.6 443.5
- Audit and review of financial reports (overseas KPMG firms) 906.9 850.6 16.8 59.8
1,833.1 1,735.5 609.4 503.3
Other services
- Other regulatory services (KPMG Australia) 55.6 53.3 36.5 35.0
- Other assurance services (KPMG Australia) - 300.5 - 300.5
- Other advisory services (KPMG Australia) 18.7 25.0 - -
Goodman Group Notes to the consolidated financial statements
for the year ended 30 June 2019
126
Other items (cont)
24 Parent entity disclosures (cont)
The financial information for the parent entities of Goodman and GIT has been prepared on the same basis as the consolidated financial statements, except as set out below:
Investments in controlled entities and Partnerships Investments in controlled entities and Partnerships are accounted for at cost in the financial statements of Goodman Limited and Goodman Industrial Trust. Distributions/dividends received from Partnerships are recognised in profit or loss, rather than being deducted from the carrying amount of these investments.
Tax consolidation Goodman Limited is the head entity in a tax consolidated group comprising all Australian wholly-owned subsidiaries (this excludes GIT). The head entity recognises all of the current tax assets and liabilities of the tax consolidated group (after elimination of intra-group transactions).
Financial guarantees Where the parent entities have provided financial guarantees in relation to loans and payables of controlled entities for no compensation, the fair values of these guarantees are accounted for as contributions and recognised as part of the cost of the investment.
Parent entity capital commitments At 30 June 2019, the parent entities had no capital commitments (2018: $nil).
Parent entity contingencies Capitalisation Deed Poll The Company, GFML, as responsible entity of the Trust, GLHK and certain of their wholly-owned controlled entities are “investors” under a Capitalisation Deed Poll (CDP) dated 23 May 2007. Under the CDP, each investor undertakes to pay to the relevant controlled entity borrower (borrower) any amounts owing under finance documents for the purpose of the CDP when the borrower fails to make a payment. Any payments by an investor to a borrower will be by way of loan to, or proceeds for the subscription of equity in, the borrower by the investor.
United States and Reg S senior notes Under the issue of notes in the United States 144A/Reg S bond market (refer to notes 12(d) and 12(e)), controlled entities of GIT had on issue USD and EUR notes amounting to US$1,303.8 million and €500.0 million respectively. GL, GFML, as responsible entity of the Trust, and GLHK have unconditionally and irrevocably guaranteed on a joint and several basis the payment of principal and interest in respect of each of the notes.
25 Events subsequent to balance date
Goodman and GIT
Other than as disclosed elsewhere in the consolidated financial report (including the Directors’ report), there has not arisen in the interval between the end of the financial year and the date of this consolidated financial report any item, transaction or event of a material and unusual nature likely, in the opinion of the Directors, to affect significantly the operations of Goodman and GIT, the results of those operations, or the state of affairs of Goodman and GIT, in future financial years.
Goodman Group Directors’ declaration
127
In the opinion of the directors of Goodman Limited and the directors of Goodman Funds Management Limited, the responsible entity for Goodman Industrial Trust:
(a) the consolidated financial statements and the notes of Goodman Limited and its controlled entities and GoodmanIndustrial Trust and its controlled entities set out on pages 57 to 126 and the remuneration report that is containedon pages 20 to 53 in the Directors’ report, are in accordance with the Corporations Act 2001, including:
(i) giving a true and fair view of Goodman’s and GIT’s financial position as at 30 June 2019 and of theirperformance for the financial year ended on that date; and
(ii) complying with Australian Accounting Standards (including Australian Accounting Interpretations) and theCorporations Regulations 2001; and
(b) there are reasonable grounds to believe that the Company and the Trust will be able to pay their debts as and whenthey become due and payable.
The Directors have been given the declarations required by section 295A of the Corporations Act 2001 from the Group Chief Executive Officer and Chief Financial Officer for the financial year ended 30 June 2019.
The Directors draw attention to note 1 to the consolidated financial statements, which includes a statement of compliance with International Financial Reporting Standards.
Signed in accordance with a resolution of the Directors.
Ian Ferrier, AM Gregory Goodman Independent Chairman Group Chief Executive Officer
Sydney, 23 August 2019
Independent Auditor·s Report
To the stapled security holders of Goodman Group and the unitholders of
Goodman Industrial Trust
Report on the audit of the Financial Report
Opinion
We have audited the Financial Report of
Goodman Limited (the Company) as the
deemed parent presenting the stapled
security arrangement of the Goodman
Group (the Goodman Group Financial
Report).
We have also audited the Financial
Statements of Goodman Industrial Trust
(the Trust Financial Report).
In our opinion, each of the accompanying
Goodman Group Financial Report and
Trust Financial Report are in accordance
with the Corporations Act 2001, including:
• giving a true and fair view of the
Goodman Group's and of the
Trust's financial position as at 30
June 2019 and of its financial
performance for the year ended on
that date; and
• complying with Australian Accounting
Standards and the Corporations
Regulations 2001.
The content of each of the Goodman Group and Trust
Financial Report comprise:
• Consolidated statement of financial position as at 30
June 2019;
• Consolidated income statement, Consolidated
statement of comprehensive income, Consolidated
statement of changes in equity, and Consolidated
cash flow statement for the year then ended;
• Notes including a summary of significant accounting
policies; and
(collectively referred to as Financial Statements)
• Directors' Declaration.
The Goodman Group consists of Goodman Limited and
the entities it controlled at the year-end or from time to
time during the financial year, Goodman Industrial Trust
(the Trust) and the entities it controlled at the year-end or
from time to time during the financial year, and Goodman
Logistics (HK) Limited and the entities it controlled at the
year-end or from time to time during the financial year.
Basis for opinions
We conducted our audit in accordance with Australian Auditing Standards. We believe that the audit
evidence we have obtained is sufficient and appropriate to provide a basis for our opinions.
Our responsibilities under those standards are further described in the Auditor's responsibilities for the
audit of the Financial Report section of our report.
We are independent of the Goodman Group, Goodman Limited, Goodman Funds Management Limited
(the Responsible Entity of the Trust) and the Trust in accordance with the Corporations Act 2001 and
the ethical requirements of the Accounting Professional and Ethical Standards Board's APES 110 Code
of Ethics for Professional Accountants (the Code) that are relevant to our audit of the Financial Report
in Australia. We have fulfilled our other ethical responsibilities in accordance with the Code.
KPMG, an Australian partnership and a member firm of the KPMG network of independent member firms affiliated with KPMG International Cooperative ("KPMG International"), a Swiss entity.
Liability limited by a scheme approved under Professional Standards Leoislation.
128
Key Audit Matters
The Key Audit Matters we identified for the
Goodman Group are:
• Recognition of portfolio performance fee income;
• Recognition of development income;
• Valuation of investment properties, investments
accounted for using the equity method and
inventories; and
• Value of intangible assets.
Key Audit Matters are those matters that, in
our professional judgement, were of most
significance in our audit of the Financial Report
of the current period.
These matters were addressed in the context
of our audit of the Financial Report as a whole,
and in forming our opinion thereon, and we do
not provide a separate opinion on these
matters.
Recognition of portfolio performance fee income
Refer to Note 2 to the Financial Report (portfolio performance fee income is allocated to management
income and development income).
The key audit matter How the matter was addressed in our audit
The Goodman Group, in its capacity as an Our procedures included:
investment manager, earns portfolio performance Reading the Goodman Group's agreements
fees based on agreements with some of its •
managed partnerships. with managed partnerships to understand
the key terms related to performance fees,
Recognition of portfolio performance fee income is including hurdle rates;
considered a key audit matter due to the: Evaluating Goodman Group's accounting •
• Quantum of portfolio performance fee income, policies regarding the recognition of
relative to the Goodman Group's total revenue; performance fee income and valuation of
and investment properties against accounting
Significant judgement exercised by us in standard requirements;
• assessing the amount of performance fees • Assessing the scope, competence and
recognised by the Goodman Group. The key objectivity of the partnerships' external
assumptions impacting the amount of experts and internal valuers to fair value the
performance fees are subject to estimation underlying investment properties held by
uncertainty, bias and inconsistent application. the partnerships;
This increases the risk of inaccurate forecasts With the assistance of real estate valuation •
or a wider range of possible outcomes for us specialists, challenging specific property fair
to consider. Increased time and effort is spent value assumptions such as capitalisation
by the audit team in assessing these key rates and market rental yields by comparing
assumptions. to market analysis published by industry
The amount of portfolio performance fees experts, recent market transactions,
recognised is impacted by key assumptions inquiries with the Stapled Group, historical
including: performance of the underlying investment
Fair value of underlying investment properties properties and using our industry
• experience; (a key driver of the quantum of performance
fees recognised by the Goodman Group) held • Comparing hurdle rates and performance
by the partnerships. The valuation of fee rates to underlying partnership
investment properties contains assumptions agreements and recalculated the
with estimation uncertainty such as expected performance fee income using the rates in
capitalisation rates and market rental yields. the agreements applied to the value in
This leads to additional audit effort due to the excess of the hurdle value; and
differing assumptions based on asset classes,
129
geographies and characteristics of individual
investment properties.
• The level of constraint applied. This is
impacted by the Goodman Group's
expectations of how much of the
performance fee is highly probable to be
received in accordance with the
requirements of the accounting standards.
In assessing this Key Audit Matter, real estate
valuation specialists, who understand the Group's
investment profile and business, were involved.
• Challenging the constraints applied in
determining the amount of performance
fees that are highly probable to be received
by the Goodman Group, based on the
Goodman Group's estimate of current and
forecast partnership performance and the
remaining tenure of the partnerships. We
used our knowledge of the Goodman
Group, their past performance, business,
and our industry experience.
Recognition of development income ($1, 134.3m)
Refer to Note 2 to the Financial Report
The key audit matter How the matter was addressed in our audit
Development income was a key audit matter Our procedures included:
due to: Selecting specific contracts from development •
• its significant value (37% of revenue and income recognised (in relation to contracts that
other income); remain in progress at period end) based on
the high volume of transactions; and quantitative and qualitative information (such as the
• size and complexity of the arrangement); and
• the judgements applied by us to assess the Evaluating Goodman Group's recognition of
Goodman Group's determination of • development income against the criteria in the
revenue recognised during the period in accounting standards.
relation to contracts which remain in
progress at period end. For the specific contracts selected, our procedures
Development income comprises income from included:
disposal of inventories, other development • Understanding the underlying contractual
income (including development management) arrangements, in particular their unique terms;
and income from fixed price construction Where recognition of development income is
contracts. • conditional upon certain events occurring, checking
Income from development management correspondence with external parties for evidence
services is recognised progressively, requiring of achievement of conditions;
judgement by us when considering the Assessing the Goodman Group's determination of
Goodman Group's determination of the amount • and extent of the services provided based on
revenue recognised during the period in
contract deliverables. accordance with the provision of services
stipulated in the underlying contract or the stage of
Income from certain inventory disposals and completion;
fixed price construction contracts is recognised For revenue recognised based on the stage of
in proportion to the stage of completion of the • relevant contracts. We focused on the stage of
completion. assessing a sample of costs incurred
completion estimation which is based on costs to date and total forecast costs against project
incurred as a percentage of estimated total feasibilities; and
costs for each contract. • Challenging the key assumptions included in the
Goodman Group's project feasibilities by comparing
to commentary published by industry experts,
130
recent market transactions, and our knowledge of
historical performance of the assets.
Valuation of investment properties ($1,897.1m), investments accounted for using the equity
method ($8,530.9m) and inventories ($1,069.0m)
Refer to Note 6 to the Financial Report
How the matter was addressed in our audit The key audit matter
The valuations of property assets is a key audit
matter as they are significant in value (being
77% of total assets) and contain assumptions
with estimation uncertainty.
This leads to additional audit effort due to
differing assumptions based on asset classes,
geographies and characteristics of individual
property assets.
The Goodman Group's investments in property
assets include investment properties and
inventories, which are held either directly or
through its investments accounted for using the
equity method.
Investment properties are held at fair value and
inventories are held at the lower of cost and net
realisable value. The valuations of property
assets are determined using internal
methodologies or through the use of external
valuation experts.
The valuations of property assets include a
number of significant assumptions:
• Investment properties:
- capitalisation rates;
market rental yields;
weighted average lease expiry and
vacancy levels;
projections of capital expenditure; and
lease incentive costs.
• Inventories:
- forecast capitalisation rates and
market rental yields;
- land value per square metre;
- letting up periods and lease incentive
costs; and
Our procedures included:
• Obtaining an understanding of the Goodman
Group's process regarding the valuation of
property assets;
• Assessing the methodologies used in the
valuations of property assets, for consistency
with accounting standards, industry practice
and the Goodman Group's policies; and
• Working with real estate valuation specialists
to read published reports and industry
commentary to gain an understanding of
prevailing property market conditions.
For investment properties:
• Assessing the scope, competence and
objectivity of external valuation experts and
Goodman Group's internal valuers;
• On a portfolio basis, taking into consideration
asset classes, geographies and characteristics
of individual investment properties, challenging
significant assumptions, with reference to
published reports or industry commentary,
capitalisation rates; and
• With assistance of real estate valuation
specialists, assessing a sample of significant
assumptions including capitalisation rates,
market rental yields, weighted average lease
expiry and vacancy levels, projections of capital
expenditure and lease incentive costs. We did
this by comparing to market analysis published
by industry experts, recent market
transactions, inquiries with the Goodman
Group, historical performance of the assets
and using our industry experience.
For inventories:
• Challenging the key assumptions included in
the Goodman Group's internal recoverability
assessments (project feasibilities) and
131
development costs.
In assessing this Key Audit Matter, we involved
real estate valuation specialists, who
understand the Group's investment profile and
business and the economic environment it
operates in.
valuations by comparing to commentary
published by industry experts, recent market
transactions, and our knowledge of historical
performance of the assets.
Value of intangible assets ($840.0m)
Refer to Note 11 to the Financial Report
The key audit matter How the matter was addressed in our audit
At 30 June 2019 the Goodman Group's intangible Our procedures included:
assets comprised goodwill and management Considering the appropriateness of the value in
rights. The valuation of intangible assets was • identified as a key audit matter as the Goodman
use method applied by the Goodman Group to
Group's annual impairment assessment contains perform the annual test of goodwill and
significant judgements involving forecasting and management rights impairment, against the
discounting future cash flows. requirements of the accounting standards.
The impairment assessment is based on the value • For divisions with significant intangible assets:
in use model performed for each division of the - Working with our valuation specialists,
Goodman Group. The value in use models evaluating the discount rates and terminal
incorporate significant judgement in respect of growth rates used in the value in use
future conditions and assumptions such as: models by comparing to publicly available
forecast cash flows, growth rates and terminal data of comparable entities;
• growth rates, taking into consideration the - Assessing the ability of the Goodman Group
level and margins of ongoing development to accurately forecast by comparing
activity and forecast funds management previous forecasts to actual results;
income (which is primarily dependent on - Comparing the division's forecast cash
assets under management). The Group's flows contained in the value in use models
models are sensitive to small changes in these to Board approved forecasts;
assumptions, which may reduce available
headroom. This drives additional audit effort - Challenging the divisions forecast cash
specific to their feasibility and consistency of flows from development activity and funds
application to the Group's strategy; and management based on our understanding
discount rates - these are complicated in of local market conditions; and
• nature and vary according to the conditions the - Performing a sensitivity analysis on the
division is subject to from time to time. discount rates, growth rates and forecast
We involved valuation specialists in assessing this assets under management by applying a
reasonably possible range of outcomes to Key Audit Matter.
focus our further procedures.
• Assessing the disclosures in the financial report
using our understanding from our testing and
against the requirements of the accounting
standards.
132
Other Information
Other Information is financial and non-financial information in the Goodman Group's annual reporting
which is provided in addition to the Financial Report and the Auditor's Report. The Directors of the
Company and the Directors of the Responsible Entity are responsible for the Other Information.
The Other Information we obtained prior to the date of this Auditor's Report was the Directors' Report
(including the Remuneration Report). The Chairman's Letter. Group Chief Executive Officer's Letter,
Group Operational Performance Summary, Space for the World's Greatest Ambitions, Corporate
Responsibility and Sustainability, Goodman Foundation, Goodman's Global Network, Corporate
Governance Statement, Sustainability Statement and Securities Information are expected to be made
available to us after the date of the Auditor's Report.
Our opinion on the Financial Report does not cover the Other Information and, accordingly, we do not
express an audit opinion or any form of assurance conclusion thereon, with the exception of the
Remuneration Report and our related assurance opinion.
In connection with our audit of the Financial Report, our responsibility is to read the Other Information.
In doing so, we consider whether the Other Information is materially inconsistent with the Financial
Report or our knowledge obtained in the audit, or otherwise appears to be materially misstated.
We are required to report if we conclude that there is a material misstatement of this Other
Information, and based on the work we have performed on the Other Information that we obtained
prior to the date of this Auditor's Report, we have nothing to report.
Responsibilities of the Directors for the Financial Report
The Directors of the Company and the Responsible Entity are responsible for:
• preparing the Financial Report that gives a true and fair view in accordance with Australian
Accounting Standards and the Corporations Act 2001;
• implementing necessary internal control to enable the preparation of a Financial Report that
gives a true and fair view and is free from material misstatement, whether due to fraud or error;
• assessing the Goodman Group and Trust's ability to continue as a going concern and whether
the use of the going concern basis of accounting is appropriate. This includes disclosing, as
applicable, matters related to going concern and using the going concern basis of accounting
unless they either intend to liquidate the Goodman Group or the Trust or to cease operations, or
have no realistic alternative but to do so.
Auditor's responsibilities for the audit of the Financial Report
Our objective is:
• to obtain reasonable assurance about whether the Financial Report as a whole is free from
material misstatement, whether due to fraud or error; and
• to issue an Auditor's Report that includes our opinion.
Reasonable assurance is a high level of assurance, but is not a guarantee that an audit conducted in
accordance with Australian Auditing Standards will always detect a material misstatement when it
exists.
Misstatements can arise from fraud or error. They are considered material if, individually or in the
aggregate, they could reasonably be expected to influence the economic decisions of users taken on
the basis of the Financial Report.
A further description of our responsibilities for the audits of the Financial Report is located at the
Auditing and Assurance Standards Board website at
http://www.auasb.qov.au/auditors responsibilities/ar1 .pdf. This description forms part of our Auditor's
Report.
133
Report on the Remuneration Report
Opinion
In our opinion, the Remuneration Report
of Goodman Limited for the year ended
30 June 2019 complies with Section 300A
of the Corporations Act 2001.
KPMG
Directors' responsibilities
The Directors of the Goodman Limited are responsible for
the preparation and presentation of the Remuneration
Report in accordance with Section 300A of the
Corporations Act 2001.
Our responsibilities
We have audited the Remuneration Report included in
pages 20 to 53 of the Directors' report for the year ended
30 June 2019.
Our responsibility is to express an opinion on the
Remuneration Report, based on our audit conducted in
accordance with Australian Auditing Standards.
Eileen Haggett
Partner
Sydney
23 August 2019
134
Goodman Logistics (HK) Limited ARBN 155 911 149
and its subsidiaries Consolidated financial statements for the year ended 30 June 2019
A1
Contents Page
Report of the directors A2
Independent auditor’s report A11
Consolidated statement of financial position A14
Consolidated statement of comprehensive income A15
Consolidated statement of changes in equity A16
Consolidated cash flow statement A17
Notes to the consolidated financial statements
Basis of preparation 1 Basis of preparation A18 Results for the year 2 Profit before interest and tax A22 3 Segment reporting A24 4 Income tax expense A27 5 Profit attributable to equity shareholders of the Company A28 Operating assets and liabilities 6 Property assets A29 7 Receivables A34 8 Contract balances A36 9 Payables A37 Capital management 10 Finance income and expense A38 11 Other financial assets and liabilities A38 12 Financial risk management A39 13 Dividends A44 14 Share capital A44 Other items 15 Notes to the consolidated cash flow statement A47 16 Reserves A48 17 Retained earnings A49 18 Investments in subsidiaries A49 19 Related party transactions A50 20 Commitments A52 21 Contingencies A52 22 Company level statement of financial position A53 23 Subsequent events A53
Goodman Logistics (HK) Limited and its subsidiaries Report of the directors
for the year ended 30 June 2019
A2
The directors have pleasure in submitting their annual financial report together with the audited financial statements of Goodman Logistics (HK) Limited (“the Company”) and its subsidiaries (collectively referred to as the “Consolidated Entity”) for the year ended 30 June 2019 (“FY19”). Incorporation and principal place of business Goodman Logistics (HK) Limited was incorporated in Hong Kong on 18 January 2012 and has its principal place of business at Suite 901, Three Pacific Place, 1 Queen’s Road East, Hong Kong. On 22 August 2012, the Company became a party to the stapling deed with Goodman Limited (“GL”) and Goodman Industrial Trust (“GIT”), and together the three entities and their subsidiaries are known as Goodman Group. Goodman Group is listed on the Australian Securities Exchange (“ASX”). Principal activities The principal activities of the Consolidated Entity are investment in directly and indirectly held industrial property, investment management, property management services and development management. The principal activities and other particulars of the subsidiaries are set out in note 18 to the consolidated financial statements. Financial statements The financial performance of the Consolidated Entity for the year ended 30 June 2019 and the Consolidated Entity’s financial position at that date are set out in the consolidated financial report on pages A14 to A53. During the financial year, the Company declared a final dividend of 5.0 cents per share amounting to $90.7 million. The dividend is payable out of FY19 profit after tax. In the prior year, the Company declared a final dividend of 5.0 cents per share amounting to $90.0 million out of FY18 profit after tax. Share capital Details of the movements in share capital of the Company during the year are set out in note 14 to the consolidated financial statements. Directors The directors during the year and up to the date of this report were: Ian Douglas Ferrier, AM David Jeremy Collins Gregory Leith Goodman (alternate director to Ian Douglas Ferrier) Daniel Cornelius D. Peeters.
Directors of controlled entities The names of directors who have served on the boards of the controlled entities of the Company during the year ended 30 June 2019 are set out below:
Ales Ruzicka Hove Izak Marwan Bustani
Bart Manteleers Hugh Baggie Nicholas Kurtis
Chi Wing Lin István Kerekes Philippe Van der Beken
Christof Prange Jan Palek Shiling Li
Chun Kit Fung Jie Yang Simone Marlene Weyermanns
David Anthony Hinchey John Morton Dakin Tai Yit Chan
Dirk Mölter Jorn Bruyninckx Tang Chenying
Dominique Prince Joseph Salvaggio Thomas De Meester
Edwin Chong Chee Wai Karl Dockx Wai Ho Stephen Lee
Garcia Cuenca Ignacio Kim Swee Seah Wang Chen
Godfrey Abel Kristoffer Allan Harvey Xiaoyin Zhang.
Goh Hoi Lai Lien Standaert
Henry Kelly Marcin Duda
Goodman Logistics (HK) Limited and its subsidiaries Report of the directors
for the year ended 30 June 2019
A3
Business review State of affairs There were no significant changes in the Consolidated Entity’s state of affairs during the year. Goodman Group’s strategy Goodman Group’s purpose is to make space for its stakeholders’ ambitions. This purpose is executed through Goodman Group’s integrated business capabilities model – “own+develop+manage”, where its customer’s need for sustainable solutions and service excellence in high-quality locations, is at the centre.
The business capabilities are supported by five strategic “pillars”:
1. Quality partnerships – develop and maintain strong relationships with key stakeholders including customers, investment partners, suppliers and employees;
2. Quality product and service – deliver high quality product and customer service in key logistics markets globally by actively leveraging Goodman Group’s industrial sector expertise, development and management experience and global operating platform;
3. Culture and brand – promote Goodman Group’s unique and recognisable brand and maintain Goodman Group’s core values across each operating division to foster a strong and consistent culture. The core values are:
a. Customer + Focus: “Be closer to the customer’s world and their changing needs”; b. Innovative + Dynamic: “Be more creative in our thinking and more creative in our actions”; c. Open + Fair: “Be adaptable and considerate in our dealings inside and outside our business”; d. Performance + Drive: “Do what we say we’ll do and make things happen”; and e. Team + Respect: “Recognise the worth in each other and collaborate for better results”;
4. Operational efficiency – optimise business resources to maximise effectiveness and drive efficiencies; and
5. Capital efficiency – maintain active capital management to facilitate appropriate returns and sustainability of the business.
Goodman Logistics (HK) Limited and its subsidiaries Report of the directors
for the year ended 30 June 2019
A4
Business review (cont) Performance review The Consolidated Entity has operations in Asia, Continental Europe and the United Kingdom (“UK”), and its earnings are derived from property investment, development and management activities. In assessing Goodman Group’s underlying performance, the directors consider operating earnings as well as Goodman Group’s statutory profit. Operating earnings is a proxy for ‘cash earnings’ and is not an income measure under Hong Kong Financial Reporting Standards (“HKFRS”). It is defined as profit attributable to Shareholders adjusted for property valuations, impairment losses and other non-cash adjustments or non-recurring items.
1. Net finance expense (operating) excludes derivative mark to market, unrealised foreign exchange movements and debt restructure expense.
Property investment activities Property investment earnings in FY19 of $36.0 million were down on the prior year and comprised 7% of the total earnings (2018: 10%).
Property investment earnings comprise property income from completed developments held for sale and the Consolidated Entity’s share of the results of property investment joint ventures (referred to by the Consolidated Entity as “Partnerships”). The key drivers for maintaining or growing Goodman’s property investment earnings are increasing the level of assets under management (“AUM”) (subject also to the Consolidated Entity’s direct and indirect interest), maintaining or increasing occupancy and rental levels within the portfolio, and changes in financing arrangements. The Consolidated Entity’s property portfolios are concentrated in large, urban centres around the world where demand from customers (including e-commerce) who continue to invest in improving the efficiency of their supply chains, data centre users and urban renewals has put pressure on land use and availability. As a consequence, barriers to entry in these locations are high, land is scarce and, in some cases, supply is negative meaning that the properties should see higher valuation growth and higher returns over the long term. The Consolidated Entity’s share of investment earnings from its cornerstone holdings in the Partnerships increased by 6.9% to $30.9 million compared to the prior year. This was due to rental income growth from existing properties and the completion of developments both during FY18 and FY19. During FY19, the Consolidated Entity’s share of property valuations from the stabilised portfolios was $137.0 million. Valuation gains were due to both capitalisation rate compression and the growth in rental income. At 30 June 2019, the weighted average capitalisation rate for the Consolidated Entity’s portfolios was 5.3%, compared to 5.8% at the start of FY19.
2019 2018
$M $M
Analysis of operating profit
Property investment earnings 36.0 41.6
Development earnings 278.8 204.9
Management earnings 215.1 149.5
529.9 396.0
Operating expenses (117.9) (104.1)
412.0 291.9
Net finance expense (operating)1 (26.3) (21.3)
Income tax expense (operating) (57.6) (26.7)
Operating profit 328.1 243.9
2019 2018
$M $M
Net property income 5.1 12.7
Partnerships 30.9 28.9
Property investment earnings 36.0 41.6
Key metrics 2019 2018
Weighted average capitalisation rate (%) 5.3 5.8
Weighted average lease expiry (years) 4.4 4.7
Occupancy (%) 98.3 99.0
Goodman Logistics (HK) Limited and its subsidiaries Report of the directors
for the year ended 30 June 2019
A5
Business review (cont) Performance review (cont) Development activities In FY19, development earnings were $278.8 million, an increase of 36% on the prior year and comprised 53% of total operating earnings (2018: 52%). Development activity continued to be strong with 40 developments completed during the year and work in progress of $2.0 billion across 25 projects at 30 June 2019. The increase in the Consolidated Entity’s earnings was primarily volume driven.
Development earnings comprise development income (including development management fees) net of expenses, income from sales of properties (primarily inventories but also including disposals of special purpose entities in certain jurisdictions) and the Consolidated Entity’s share of the results of property development Partnerships. Development income includes performance related revenues associated with managing development activity in the Partnerships. The key drivers for the Consolidated Entity’s development earnings are the level of development activity, land and construction prices, property valuations and the continued availability of third party capital to fund development activity. The majority of inventory disposals and fixed price contract income arose in Europe, as the Partnerships in Continental Europe generally acquire completed developments from the Consolidated Entity. In the Consolidated Entity’s other operating segments, development earnings are a mix of development management income, including performance related income, and transactional activity, including the Consolidated Entity’s share of development profits reported by the Partnerships themselves. Consistent with Goodman Group’s strategy, development activity has been focused on key urban centres, where customer demand is high and the supply of industrial logistics is restricted. The scale of the projects has been growing over time as a consequence of the high value nature of these sites and the complexity associated with development of infill locations.
2019 2018
$M $M
Net development income 225.5 182.2
Partnerships 53.3 22.7
Development earnings 278.8 204.9
Key metrics 2019 2018
Work in progress ($B) 2.0 1.6
Work in progress (million square metres) 1.1 1.5
Work in progress (number of developments) 25 37
Developments completed during the year (number of developments) 40 38
Goodman Logistics (HK) Limited and its subsidiaries Report of the directors
for the year ended 30 June 2019
A6
Business review (cont) Performance review (cont) Management activities Management earnings in FY19 of $215.1 million increased by 44% compared to the prior year and comprised 40% of total operating earnings (2018: 38%). The two main drivers of management earnings were the increase in external AUM and the increasing contribution from portfolio performance fee income. During FY19, external AUM increased by 22% to $20.2 billion from $16.5 billion as set out below:
Management earnings relates to the revenue from managing the property portfolios and the capital invested in the Partnerships (management income). This includes performance related revenues but excludes earnings from managing development activities in the Partnerships, which are included in development earnings. The key drivers for maintaining or growing management earnings are activity levels, asset performance, and increasing the level of AUM, which can be impacted by property valuations and asset disposals and is also dependent on liquidity including the continued availability of third party capital to fund both development activity and acquisitions across the Consolidated Entity’s Partnerships. Base management fee income, earned from the overall management of the Partnerships, increased in line with the increase in AUM. This was supplemented by property services income, which increased in line with the gross property income in the Partnerships, and other income such as leasing fees and transactional fees. In addition, the consistently high partnership returns over the past few years resulted in performance fee revenue growing to $92.3 million in FY19 from $38.9 million in the prior year. For FY19, performance fee revenue represented around 43% of the total management earnings, up from 26% in the prior year. Statement of financial position
The value of cornerstone investments in Partnerships has increased by $319.7 million to $1,226.9 million, principally driven by capital contributions into existing Partnerships. A reconciliation of the current year movement in cornerstone investments in Partnerships is detailed in note 6(e) to the consolidated financial statements. Distributions of income and capital from cornerstone investments in the current year amounted to $102.1 million. The increase in development holdings by $97.8 million to $541.2 million is primarily due to the additional expenditure on development projects in Continental Europe and China. A greater amount of accrued income accounted for the increase in other assets by $209.1 million to $889.9 million. The majority of accrued income is expected to be received in FY20. The increase in other liabilities is principally due to an accrual for transaction management fees payable to a related party and an increase in accruals for cash settled performance rights issued to employees.
2019 2018
$M $M
Management earnings 215.1 149.5
Key metrics 2019 2018
Number of Partnerships 7 7
External AUM ($B) 20.2 16.5
2019 2018
$M $M
Cornerstone investments in Partnerships 1,226.9 907.2
Development holdings 541.2 443.4
Cash 212.7 115.5
Other assets 889.9 680.8
Total assets 2,870.7 2,146.9
Loans from related parties 1,102.4 897.0
Other liabilities 460.2 285.9
Total liabilities 1,562.6 1,182.9
Non-controlling interests 24.7 22.4
Net assets attributable to Shareholders 1,283.4 941.6
Goodman Logistics (HK) Limited and its subsidiaries Report of the directors
for the year ended 30 June 2019
A7
Business review (cont) Performance review (cont) Cash flow
The movement in operating and investing cash flows from the comparative year is primarily attributable to the timing of development activities undertaken, both on balance sheet and in Partnerships, compared with the prior year. The lower operating cash inflow from development activities was partly offset by increased cash flows from management activities. Investing cash flows primarily relate to investments in the Partnerships to fund development expenditure. Financing cash flows comprise principally of proceeds of loans from related parties offset by dividends paid in FY19. The higher financing cash outflow in the prior financial year was due to the repayment of related party loans using excess operating cash. Outlook For FY20, business conditions are expected to remain favourable in the Consolidated Entity’s markets and the Consolidated Entity is strategically well placed given its financial and operational strength. An increase in performance is anticipated from each of the Consolidated Entity’s earning streams, subject to there being no material adverse change in market conditions or the occurrence of other unforeseen events. Further information as to other likely developments in the operations of the Consolidated Entity and the expected results of those operations in future financial years has not been included in this report of the directors because disclosure of the information would be likely to result in unreasonable prejudice to the Consolidated Entity. Risks Goodman Group identifies strategic and operational risks for each of its regions as part of its strategy process. The key risks, an assessment of their likelihood of occurrence and consequences and controls that are in place to mitigate the risks are reported to the Goodman Group board annually. Goodman Group has established formal systems and processes to manage the risks at each stage of its decision making process. This is facilitated by a Goodman Group Investment Committee comprising senior executives, chaired by the Group Chief Executive Officer, which considers all major operational decisions and transactions. The Goodman Group Investment Committee meets on a weekly basis. The Goodman Group board has separate board committees to review and assess key risks. The Risk and Compliance Committee reviews and monitors a range of material risks in Goodman Group’s risk management systems including, among other risks, market, operational, sustainability, regulation and compliance and information technology. The Goodman Group Audit Committee reviews and monitors financial risk management and tax policies.
2019 2018
$M $M
Operating cash flows 238.5 421.7
Investing cash flows (136.4) (123.4)
Financing cash flows (14.4) (296.4)
Net increase in cash held 87.7 1.9
Effect of exchange rate fluctuations on cash held 9.5 5.7
Cash at the beginning of the year 115.5 107.9
Cash at the end of the year 212.7 115.5
Goodman Logistics (HK) Limited and its subsidiaries Report of the directors
for the year ended 30 June 2019
A8
Business review (cont)
Risks (cont) The key risks faced by Goodman Group and the controls that have been established to manage those risks are set out below:
Risk area Mitigation
Capital management Ensuring long-term availability of funding from
both investors and financial institutions to
support the sustainability of the business.
+ Goodman Group board approved financial risk management policy
+ Prudent capital management with cash flow requirements,
gearing and available liquidity reviewed monthly and reported
to the Goodman Group board
+ Diversification of debt funding sources and maturities
+ Diversification of investment partners
+ Change in distribution pay-out ratio consistent with contribution to
increasing development workbook
Economic and
geopolitical
environment
Headline economic indicators suggest global
growth has peaked, with indications of a gradual
slowdown in coming years. Geopolitical and geo-
economic tensions are rising among the world’s
major powers, evidenced by political protests in
HK and trade tension between the US and
China. The world is evolving into a period of
divergence following a period of globalisation
that profoundly altered the global political
economy.
+ Global diversification of Goodman Group’s property portfolios
+ Focus on core property portfolios in key urban market locations
+ Focus on cost management
+ Prudent capital management with low gearing and significant
available liquidity to allow for potential market shocks
Governance,
regulation and
compliance
Non-compliance and changes to the regulatory
environments (including tax) impact Goodman
Group's business, including its reputation.
+ Independent governance structures
+ Core values and attitudes, with an embedded compliance culture
focused on best practice
+ Dedicated Chief Risk Officer and Compliance Officer
+ Review of transactions by the Goodman Group Investment
Committee
People Retaining the executive management team, who
support the sustainability of the business.
Maintaining an organisational culture
commensurate with Goodman Group’s values.
+ Succession planning for senior executives
+ Competitive remuneration structures
+ Performance management and review
+ Goodman Group values programme
Technology change
and disruption
Through advancement in technology (as seen
through automation/robotics, investment in
driverless vehicles and drone technology), there
is a longer-term risk that warehouses become
obsolete and not fit for purpose through their
specialisation and/or location.
+ Key urban market strategy – urban, infill locations support re-usability of
property
+ Adaptable and re-usable building design – ease to reconfigure for another
customer
+ Geographic diversification
Development Development risks may arise from location, site
complexity, planning and permitting,
infrastructure, size and duration, contamination,
earthquakes, adverse weather conditions and
other environmental factors, along with general
contractor capability.
+ Review of development projects by the Goodman Group
Investment Committee
+ Goodman Group defined design specifications, which cover
environmental, technological, and safety requirements,
protecting against short-term obsolescence
+ Internal audit reviews with reporting to the Risk and Compliance
Committee
+ Insurance programme, both Goodman Group and general
contractor
+ Ongoing monitoring and reporting of work in progress and
levels of speculative development, with Goodman Group board
oversight including limits with respect to speculative development
Asset management
and leasing
Leasing risk exposures can reduce returns from
Goodman Group’s portfolios. Adverse weather
events and other environmental factors can
adversely affect returns.
+ Key gateway city strategy – urban, infill locations where customer
demand is strongest
+ Diversification of customer base and lease expiries
+ Review of significant leasing transactions and development
projects by the Goodman Group Investment Committee
+ Sustainability strategy including the assessment of individual assets to
improve resilience and implementation of sustainability initiatives
+ Adoption of the Task Force on Climate-related Financial Disclosures
recommendations as a framework for the
assessment, management and disclosure of climate risks
+ Capital expenditure programmes keeping pace with property
lifecycle
Concentration to
counterparties and
markets
Over-exposure to customers and market may
limit growth and sustainability opportunities.
+ Diversification of customer base and lease expiry
+ Diversification of capital partners and partnership expiries
Information and data
security
Maintaining security of IT environment and data,
ensuring continuity of IT applications to support
sustainability and growth.
+ Reporting of risks and management activity
+ Proactive monitoring, review and testing of infrastructure
+ Disaster recovery and business continuity planning and
testing
Goodman Logistics (HK) Limited and its subsidiaries Report of the directors
for the year ended 30 June 2019
A9
Environmental regulations
The Consolidated Entity has policies and procedures to identify and appropriately address environmental obligations that might arise in respect of the Consolidated Entity’s operations that are subject to significant environmental regulation under the laws of the countries the Consolidated Entity operates in. The directors have determined that the Consolidated Entity has complied with those obligations during the financial year and that there has not been any material breach.
Disclosure in respect of any indemnification of directors
A permitted indemnity provision (as defined in section 469 of the Hong Kong Companies Ordinance) for the benefit of the directors of the Company is currently in force and was in force throughout this year.
Directors’ interests in contracts
No contract of significance in relation to the Consolidated Entity’s business to which the Company, its subsidiaries or any of its fellow subsidiaries was a party and in which the directors of the Company had a material interest, whether directly or indirectly, subsisted at the end of the year or at any time during the year.
Directors’ interest in shares
At the end of the year, the directors (including alternate directors) held the following interests in the stapled securities of Goodman Group, which are listed on the ASX:
In addition, Gregory Goodman and Daniel Peeters participate in the Goodman Group Long Term Incentive Plan (“LTIP”) under which they hold performance rights. Performance rights entitle participants to receive Goodman Group stapled securities without the payment of consideration, subject to Goodman Group satisfying performance criteria and the participants remaining employees of Goodman Group.
Details of the awards of performance rights under the LTIP granted as compensation to the directors (including alternate directors) at 30 June 2019 are as follows:
Apart from the above, at no time during the year was the Company, its subsidiaries or any of its fellow subsidiaries a party to any arrangement to enable the directors of the Company to acquire benefits by means of the acquisition of shares in or debentures of the Company or any other related body corporate.
Directors
Direct
securities
Indirect
securities Total
Ian Douglas Ferrier 202,922 - 202,922
David Jeremy Collins 5,000 - 5,000
Gregory Leith Goodman 78,047 38,024,673 38,102,720
Daniel Cornelius D. Peeters - 1,591,385 1,591,385
Number of
performance
rights at the start
of the year
Number of
performance
rights
granted
during the
year
Number of
performance
rights vested
during the
year
Number of
performance
rights
forfeited
during the
year
Number of
performance
rights at the
end of the
year
Date
performance
rights granted
Financial
years in
which grant
vests
Gregory Leith Goodman - 1,600,000 - - 1,600,000 15 Nov 18 2022 – 2024
Goodman Logistics (HK) Limited and its subsidiaries Report of the directors
for the year ended 30 June 2019
A10
Auditors
KPMG retire and, being eligible, offer themselves for re-appointment. A resolution for the re-appointment of KPMG as auditors of the Company is to be proposed at the forthcoming Annual General Meeting.
Subsequent events
On 19 August 2019, the Consolidated Entity acquired a number of entities operating in the United Kingdom from Goodman Limited for consideration of GBP 1.8 million.
Other than the matter discussed above, there has not arisen in the interval between the end of the financial year and the date of this report any item, transaction or event of a material and unusual nature likely, in the opinion of the Directors, to affect significantly the operations of the Consolidated Entity, the results of those operations, or the state of affairs of the Consolidated Entity, in future financial years.
Declaration by the Group Chief Executive Officer and Chief Financial Officer
The directors have been given declarations equivalent to those required of listed Australian companies by section 295A of the Corporations Act 2001 from the Group Chief Executive Officer and Chief Financial Officer for the year ended 30 June 2019.
By order of the board of directors
Ian Douglas Ferrier, AM David Jeremy Collins Director Director
Sydney, 23 August 2019
Independent auditor's report to the members of
Goodman Logistics (HK) Limited
(Incorporated in Hong Kong with limited liability)
Opinion We have audited the consolidated financial statements of Goodman Logistics (HK) limited ("the Company") and its subsidiaries ("the Group") set out on pages A 14 to A53, which comprise the consolidated statement of financial position as at 30 June 2019, the consolidated statement of comprehensive income, the consolidated statement of changes in equity and the consolidated cash flow statement for the year then ended and notes to the consolidated financial statements, including a summary of significant accounting policies.
In our opinion, the consolidated financial statements give a true and fair view of the consolidated financial position of the
Group as at 30 June 2019 and of its consolidated financial performance and its consolidated cash flows for the year then ended in accordance with Hong Kong Financial Reporting Standards ("HKFRSs") issued by the Hong Kong Institute of Certified Public Accountants ("HKICPA") and have been properly prepared in compliance with the Hong Kong Companies
Ordinance.
Basis for opinion We conducted our audit in accordance with Hong Kong Standards on Auditing ("HKSAs") issued by the HKICPA. Our responsibilities under those standards are further described in the Auditor's responsibilities for the audit of the consolidated financial statements section of our report. We are independent of the Group in accordance with the HKICPA's Code of Ethics for Professional Accountants ("the Code") and we have fulfilled our other ethical responsibilities in accordance with the Code. We believe that the audit evidence we have obtained is sufficient and appropriate to provide a basis for our opinion ..
Information other than the consolidated financial statements and auditor's report thereon The directors are responsible for the other information which comprises all the information included in the Company's Report of the directors.
Our opinion on the c.onsolidated financial statements does not cover the other information and we do not express any form of assurance conclusion thereon.
In connection with our audit of the consolidated financial statements, our responsibility is to read the other information and, in doing so, consider whether the other information is materially inconsistent with the consolidated financial statements or our knowledge obtained in the audit or otherwise appears to be materially misstated.
If, based on the work we have performed, we conclude that there is a material misstatement of this other information, we are required to report that fact. We have nothing to report in this regard.
Responsibilities of the directors for the consolidated financial statements The directors are responsible for the preparation of the consolidated financial statements that give a true and fair view in accordance with HKFRSs issued by 1he HKICPA and the Hong Kong Companies Ordinance and for such internal control as the directors determine is necessary to enable the preparation of consolidated financial statements that are free from material misstatement, whether due to fraud or error.
In preparing the consolidated financial statements, the directors are responsible for assessing the Group's ability to continue as a going concern, disclosing, as appUcable, matters related to going concern and using the going concern basis of accounting unless the directors either intend to liquidate the Group or to cease operations, or have no realistic alternative
but to do so.
A11
Independent auditor's report to the members of
Goodman Logistics (HK) Limited (continued)
(Incorporated in Hong Kong with limited liability)
Auditor's responsibilities for the audit of the consolidated financial statements Our objectives are to obtain reasonable assurance about whether the consolidated financial statements as a whole are
free from material misstatement, whether due to fraud or error, and to issue an auditor's report that includes our opinion.
This report is made solely to you, as a body, in accordance with section 405 of the Hong Kong Companies Ordinance, and
for no other purpose. We do not assume responsibility towards or accept liabitity to any other person for the contents of
this report.
Reasonable assurance is a high level of assurance, but is not a guarantee that an audit conducted in accordance with
HKSAs will always detect a material misstatement when it exists. Misstatements can arise from fraud or error and are
considered material if, individually or in the aggregate, they could reasonably be expected to influence the economic
decisions of users ta ken on the basis of these consolidated financial s1atements.
As part of an audit in accordance with HKSAs, we exercise professional judgement and maintain professional scepticism
throughout the audit We also:
Identify and assess the risks of material misstatement of the consolidated financial statements, whether due to fraud
or error, design and perform audit procedures responsive to those risks, and obtain audit evidence that is sufficient
and appropriate to provide a basis for our opinion. The risk of not detecting a material misstatement resulting from
fraud is higher than for one resulting from error, as fraud may involve collusion, forgery, intentional omissions,
misrepresentations, or the override of internal control.
Obtain an understanding of internal control relevant to the audit in order to design audit procedures that are appropriate
in the circumstances, but not for the purpose of expressing an opinion on the effectiveness of the Group's internal
control.
Evaluate the appropriateness of accounting policies used and the reasonableness of accounting estimates and related
disclosures made by the directors.
Conclude on the appropriateness of the directors' use of the going concern basis of accounting and, based on the
audit evidence obtained, whether a material uncertainty exists related to events or conditions that may cast significant
doubt on the Group's ability to continue as a going concern. If we conclude that a material uncer1ainty exists, we are
required to draw attention in our auditor's report to the related disclosures in the consolidated financial statements or,
if such disclosures are inadequate, to modify our opinion. Our conclusions are based on the audit evidence obtained
up to the date of our auditor's report. However, future events or conditions may cause the Group to cease to continue
as a going concern.
Evaluate the overall presentation, structure and content of the conso1idated financial statements, including the
disclosures, and whether the consolidated financial statements represent the underlying transactions and events in a
manner that achieves fair presentation.
Obtain sufficient appropriate audit evidence regarding the financial information of the entities or business activities
within the Group to express an opinion on the consolidated financial statements. We are responsible for the direction,
supervision and performance of the Group audit. We remain solely responsible for our audit opinion.
A12
Independent auditor's report to the members of
Goodman Logistics (HK) Limited (continued)
(Incorporated in Hong Kong with limited liability)
Auditor's responsibilities for the audit of the consolidated financial statements (continued)
We communicate with the directors regarding. among other matters, the planned scope and timing of the audit and significant audit findings. including any significant deficiencies in internal control that we identify during our audit.
KPMG Certified Public Accountants
8th Floor, Prince's Building 10 Chater Road Central. Hong Kong
23 August 2019
A13
Goodman Logistics (HK) Limited and its subsidiaries Consolidated statement of financial position
as at 30 June 2019
A14
(expressed in Australian dollars)
1. The comparative figures have been restated to reflect changes in accounting policies. Details of these are set out in note 1(e).
The notes on pages A18 to A53 form part of these consolidated financial statements.
Approved and authorised for issue by the board of directors on 23 August 2019
Ian Douglas Ferrier, AM David Jeremy Collins Director Director
2019 2018
Restated1
Note $M $M
Current assets
Cash 15(a) 212.7 115.5
Inventories 6(b) 156.6 172.2
Receivables 7 556.2 518.6
Contract assets 8 279.5 141.0
Current tax receivables 4(c) 1.2 2.5
Other assets 1.5 4.2
Total current assets 1,207.7 954.0
Non-current assets
Inventories 6(b) 315.2 196.0
Investments accounted for using the equity method 6(b) 1,226.9 907.2
Receivables 7 82.1 57.5
Other financial assets 11 28.2 21.5
Deferred tax assets 4(d) 0.1 0.2
Other assets 10.5 10.5
Total non-current assets 1,663.0 1,192.9
Total assets 2,870.7 2,146.9
Current liabilities
Payables 9 1,074.0 883.0
Contract liabilities 8 5.2 21.9
Current tax payables 4(c) 28.3 14.5
Employee benefits 23.9 21.5
Dividend payable 13 90.7 90.0
Total current liabilities 1,222.1 1,030.9
Non-current liabilities
Payables 9 300.0 143.6
Contract liabilities 8 3.0 3.7
Deferred tax liabilities 4(d) 30.8 4.7
Other financial liabilities 11 6.7 -
Total non-current liabilities 340.5 152.0
Total liabilities 1,562.6 1,182.9
Net assets 1,308.1 964.0
Equity attributable to Shareholders
Share capital 14(a) 696.0 674.6
Reserves 16 (447.4) (459.6)
Retained earnings 17 1,034.8 726.6
Total equity attributable to Shareholders 1,283.4 941.6
Non-controlling interests 24.7 22.4
Total equity 1,308.1 964.0
Goodman Logistics (HK) Limited and its subsidiaries Consolidated statement of comprehensive income
for the year ended 30 June 2019
A15
(expressed in Australian dollars)
The notes on pages A18 to A53 form part of these consolidated financial statements.
2019 2018
Note $M $M
Revenue
Gross property income 8.3 15.4
Management income 2 317.0 172.1
Development income 2 694.7 709.9
Dividends from investments 0.8 1.3
1,020.8 898.7
Property and development expenses
Property expenses (3.2) (2.7)
Development expenses 2 (474.8) (529.7)
(478.0) (532.4)
Other income
Share of net results of equity accounted investments 6(e) 221.2 104.0
Net gain on disposal of equity accounted investments 4.8 0.7
226.0 104.7
Other expenses
Employee expenses (91.7) (80.2)
Share based payments expense (54.8) (28.4)
Administrative and other expenses (128.1) (46.5)
(274.6) (155.1)
Profit before interest and income tax 2 494.2 315.9
Net finance income/(expense)
Finance income 10 4.4 3.1
Finance expense 10 (37.4) (24.4)
Net finance expense (33.0) (21.3)
Profit before income tax 461.2 294.6
Income tax expense 4 (57.6) (26.7)
Profit for the year 403.6 267.9
Profit for the year attributable to:
Shareholders 17 398.9 262.6
Non-controlling interests 4.7 5.3
Profit for the year 403.6 267.9
Other comprehensive income
Items that will not be reclassified to profit or loss
Increase due to revaluation of other financial assets 3.0 -
3.0 -
Items that are or may be reclassified subsequently to profit or loss
Effect of foreign currency translation 2.5 85.7
2.5 85.7
Other comprehensive income for the year, net of tax 5.5 85.7
Total comprehensive income for the year 409.1 353.6
Total comprehensive income for the year attributable to:
Shareholders 403.9 346.6
Non-controlling interests 5.2 7.0
Total comprehensive income for the year 409.1 353.6
Goodman Logistics (HK) Limited and its subsidiaries Consolidated statement of changes in equity
for the year ended 30 June 2019
A16
(expressed in Australian dollars)
Year ended 30 June 2018
Year ended 30 June 2019
The notes on pages A18 to A53 form part of these consolidated financial statements.
Share
capital Reserves
Retained
earnings Total
Non-
controlling
interests
Total
equity
Note $M $M $M $M $M $M
Balance at 1 July 2017 661.1 (548.7) 554.0 666.4 23.6 690.0
Total comprehensive income for the year
Profit for the year 17 - - 262.6 262.6 5.3 267.9
Other comprehensive income for the year - 84.0 - 84.0 1.7 85.7
Balance at 30 June 2019 696.0 (447.4) 1,034.8 1,283.4 24.7 1,308.1
Attributable to Shareholders
Goodman Logistics (HK) Limited and its subsidiaries Consolidated cash flow statement for the year ended 30 June 2019
A17
(expressed in Australian dollars)
The notes on pages A18 to A53 form part of these consolidated financial statements.
2019 2018
Note $M $M
Cash flows from operating activities
Property income received 5.8 20.6
Cash receipts from development activities 688.1 922.7
Other cash receipts from services provided 186.1 137.6
Property expenses paid (2.9) (3.7)
Payments for development activities (552.8) (559.6)
Other cash payments in the course of operations (120.4) (105.9)
Dividends/distributions received 52.8 35.7
Interest received 0.4 1.1
Finance costs paid (0.6) (0.7)
Net income taxes paid (18.0) (26.1)
Net cash provided by operating activities 15(b) 238.5 421.7
Cash flows from investing activities
Payments for investment properties - (0.2)
Proceeds from disposal of equity accounted investments 4.8 -
Capital return from equity accounted investments 50.1 59.2
Payments for equity investments (191.0) (182.3)
Payments for plant and equipment (0.3) (0.1)
Net cash used in investing activities (136.4) (123.4)
Cash flows from financing activities
Net proceeds from/(repayment of) loans with related parties 78.5 (288.8)
Dividends paid to shareholders (90.0) -
Dividends paid to non-controlling interests (2.9) (7.6)
Net cash used in financing activities (14.4) (296.4)
Net increase in cash held 87.7 1.9
Cash at the beginning of the year 115.5 107.9
Effect of exchange rate fluctuations on cash held 9.5 5.7
Cash at the end of the year 15(a) 212.7 115.5
Goodman Logistics (HK) Limited and its subsidiaries Notes to the consolidated financial statements
for the year ended 30 June 2019
A18
(expressed in Australian dollars)
Basis of preparation
1 Basis of preparation
(a) Statement of compliance
These financial statements have been prepared in accordance with all applicable Hong Kong Financial Reporting Standards (“HKFRSs”), which collective term includes all applicable individual Hong Kong Financial Reporting Standards, Hong Kong Accounting Standards (“HKASs”) and Interpretations issued by the Hong Kong Institute of Certified Public Accountants (“HKICPA”) and accounting principles generally accepted in Hong Kong. These financial statements also comply with the applicable requirements of the Hong Kong Companies Ordinance.
(b) Basis of preparation of the consolidated financial statements
The measurement basis used in the preparation of the consolidated financial statements is the historical cost basis except for investment properties and other financial assets which are stated at fair value.
As at 30 June 2019, the Consolidated Entity had net current liabilities of $14.4 million. In accordance with the stapling agreement between the Company (“GLHK”), Goodman Limited (“GL”) and Goodman Funds Management Limited as responsible entity for Goodman Industrial Trust (“GIT”), on request, each party (and its subsidiaries) must provide financial support to the other party (and its subsidiaries). The financial support to the other party (and its subsidiaries) may include:
+ lending money or providing financial accommodation;
+ guaranteeing any loan or other financing facility including providing any security;
+ entering into any covenant, undertaking, restraint, negative pledge on the obtaining of any financial accommodationor the provision of any guarantee or security in connection with any financial accommodation; and
+ entering into any joint borrowing or joint financial accommodation and providing any guarantee, security, indemnitiesand undertakings in connection with the relevant joint borrowing or joint financial accommodation.
A party need not do anything under the above arrangements to the extent that the party considers that it is not in the interests of Goodman Group Securityholders as a whole, or would cause a member of the party’s group to contravene or breach applicable laws or particular finance arrangements.
On the basis of the above, the consolidated financial statements have been prepared on a going concern basis.
The preparation of financial statements in conformity with HKFRSs requires management to make judgements, estimates and assumptions that affect the application of policies and reported amounts of assets, liabilities, income and expenses. The estimates and associated assumptions are based on historical experience and various other factors that are believed to be reasonable under the circumstances, the results of which form the basis of making the judgements about carrying values of assets and liabilities that are not readily apparent from other sources. Actual results may differ from these estimates.
The estimates and underlying assumptions are reviewed on an ongoing basis. Revisions to accounting estimates are recognised in the period in which the estimate is revised if the revision affects only that period, or in the period of the revision and future periods if the revision affects both current and future periods.
(c) Principles of consolidation
Subsidiaries Subsidiaries are entities controlled by the Company. The Company controls an entity when it is exposed, or has rights, to variable returns from its involvement with the entity and has the ability to affect those returns through its power over the entity. When assessing whether the Company has power, only substantive rights (held by the Company and other parties) are considered.
An investment in a controlled entity is consolidated into the consolidated financial statements from the date that control commences until the date that control ceases. When an entity ceases to be controlled by the Company, it is accounted for as a disposal of the entire interest in the entity, with a resulting gain or loss being recognised in profit or loss.
In the Company’s statement of financial position, an investment in a subsidiary is stated at cost less impairment losses.
Accounting for acquisitions of non-controlling interests Acquisitions of non-controlling interests are accounted for as transactions with equity holders in their capacity as equity holders and therefore no gain or loss and no goodwill is recognised as a result of such transactions.
Goodman Logistics (HK) Limited and its subsidiaries Notes to the consolidated financial statements
for the year ended 30 June 2019
A19
Basis of preparation (cont)
1 Basis of preparation (cont)
(c) Principles of consolidation (cont)
Joint ventures A joint venture (“JV”) is an arrangement (referred to by the Consolidated Entity as a “Partnership”) in which the Consolidated Entity is considered to have joint control for accounting purposes, whereby the Consolidated Entity has rights to the net assets of the arrangement, rather than rights to its assets and obligations for its liabilities. In the consolidated financial statements, investments in JVs are accounted for using the equity method. Investments in JVs are carried at the lower of the equity accounted amount and recoverable amount. The Consolidated Entity’s share of the JVs’ net profit or loss is recognised in the consolidated profit or loss from the date the arrangement commences to the date the arrangement ceases. Movements in reserves are recognised directly in the consolidated reserves.
Transactions eliminated on consolidation Unrealised gains resulting from transactions with JVs, including those relating to contributions of non-monetary assets on establishment, are eliminated to the extent of the Consolidated Entity’s interest. Unrealised gains relating to JVs are eliminated against the carrying amount of the investment. Unrealised losses are eliminated in the same way as unrealised gains, unless they evidence an impairment of an asset.
Combination of entities or businesses under common control Where the Consolidated Entity acquires entities or businesses from other members of Goodman Group such that all of the combining entities (businesses) are ultimately controlled by Goodman Group Securityholders both before and after the combination, the Consolidated Entity applies the pooling of interests method.
At the date of the combination of entities under common control, the assets and liabilities of the combining entities are reflected at their carrying amounts. No adjustments are made to reflect fair values, or recognise any new assets or liabilities that would otherwise be done under the acquisition method. The only goodwill that is recognised is any existing goodwill relating to either of the combining entities. Any difference between the consideration transferred and the equity “acquired” by the Consolidated Entity is reflected within equity (common control reserve).
Similar to the acquisition method, the results of the “acquired” entity are included only from the date control commenced. Comparatives are not restated to present the consolidated financial statements as if the entities had always been combined.
(d) Foreign currency translation
Functional and presentation currency Items included in the consolidated financial statements of each of the Company’s subsidiaries are measured using the currency of the primary economic environment in which the entity operates (“functional currency"). The consolidated financial statements are presented in Australian dollars, which is the Company’s functional and presentation currency.
Transactions Foreign currency transactions are translated to each entity’s functional currency at rates approximating the foreign exchange rates ruling at the dates of the transactions. Amounts receivable and payable in foreign currencies at the reporting date are translated at the rates of exchange ruling on that date. Resulting exchange differences are recognised in profit or loss.
Non-monetary assets and liabilities that are measured in terms of historical cost are translated at rates of exchange applicable at the date of the initial transaction. Non-monetary items which are measured at fair value in a foreign currency are translated using the exchange rates at the date when the fair value was determined.
Translation of controlled foreign operations The assets and liabilities of foreign operations are translated into Australian dollars at foreign exchange rates applicable at the reporting date.
Revenue and expenses are translated at weighted average rates for the financial year. Exchange differences arising on translation are taken directly to the foreign currency translation reserve until the disposal or partial disposal of the operations.
Exchange differences arising on monetary items that form part of the net investment in a foreign operation are recognised in the foreign currency translation reserve on consolidation.
Goodman Logistics (HK) Limited and its subsidiaries Notes to the consolidated financial statements
for the year ended 30 June 2019
A20
Basis of preparation (cont)
1 Basis of preparation (cont)
(e) Changes in accounting policies
The Consolidated Entity has adopted HKFRS 9 Financial Instruments and HKFRS 15 Revenue from Contracts with Customers, with a date of initial application of 1 July 2018.
HKFRS 9 Financial Instruments HKFRS 9 sets out the recognition, classification and measurement of financial assets and financial liabilities, derecognition of financial instruments, hedge accounting and impairment of financial assets. HKFRS 9 replaces HKAS 39 Financial Instruments: Recognition and Measurement.
(i) Classification and measurementHKFRS 9 categorises financial assets into three principal classification categories: measured at amortised cost, at fairvalue through other comprehensive income and at fair value through profit or loss. These supersede HKAS 39’s categoriesof held-to maturity investments, loans and receivables, available for sale financial assets and financial assets measured atfair value through profit or loss. The adoption of HKFRS 9 has not had a material impact on the results of the ConsolidatedEntity. Under the standard, the Consolidated Entity may elect to classify its investments in unlisted securities as fair valuethrough other comprehensive income or fair value through profit or loss. The Consolidated Entity has determined that it willcontinue to recognise fair value movements through other comprehensive income.
(ii) Impairment of financial assetsThe new impairment model in HKFRS 9 replaces the “incurred loss” model in HKAS 39 with an “expected credit loss”model. The new impairment model applies to financial assets measured at amortised cost and contract assets. The financialassets held by the Consolidated Entity that are subject to the new expected credit loss model include cash and cashequivalents, trade receivables, amounts and loans due from related parties and other receivables.
The Consolidated Entity is required to revise the impairment methodology under HKFRS 9 for each of these classes of assets. The change in methodology did not have a material impact on the results of the Consolidated Entity.
HKFRS 15 Revenue from Contracts with Customers HKFRS 15 provides a single revenue recognition model based on the transfer of goods and services and the consideration expected to be received in return for that transfer. The adoption of HKFRS 15 has resulted in a change in accounting policy for revenue recognition associated with inventory disposals, such that revenue is recognised on transfer of control of the asset rather than the transfer of the significant risks and rewards associated with the asset. This change has not had a material impact on the revenue, profit and net assets reported in previous periods but the consolidated statement of financial position now includes additional captions for “Contract assets” and “Contract liabilities”.
In accordance with the transition provisions in HKFRS 15, the Consolidated Entity has adopted the new rules retrospectively and has restated the comparative statement of financial position at the date of initial application as set out below:
As previously
reportedRestated
30 Jun 2018 Adjustments 1 Jul 2018
$M $M $M
Current assets
Receivables 659.6 (141.0) 518.6
Contract assets - 141.0 141.0
Total current assets 659.6 - 659.6
Current liabilities
Payables 904.9 (21.9) 883.0
Contract liabilities - 21.9 21.9
Total current liabilities 904.9 - 904.9
Non-current liabilities
Payables 147.3 (3.7) 143.6
Contract liabilities - 3.7 3.7
Total non-current liabilities 147.3 - 147.3
Impact of adopting HKFRS 15
Goodman Logistics (HK) Limited and its subsidiaries Notes to the consolidated financial statements
for the year ended 30 June 2019
A21
Basis of preparation (cont) 1 Basis of preparation (cont) (e) Changes in accounting policies (cont) Contract assets Contract assets include amounts recoverable in respect of investment management contracts and fixed price development contracts. These were previously recognised as receivables. Contract liabilities Contract liabilities relate to consideration received in advance of the completion of development contracts and rental guarantees provided by the Consolidated Entity in respect of inventory disposal and fixed price development contracts. These were previously recognised as payables. The HKICPA has issued several amendments to HKFRSs that are first effective for the current accounting period of the Consolidated Entity. The adoption of the amendments did not have any material impact on the preparation of the consolidated financial statements. The Consolidated Entity has not applied any new standard or interpretation that is not yet effective for the current accounting period. (f) Accounting standards issued but not yet effective As at the date of this consolidated financial report, HKFRS16 Leases was available for early adoption but has not been applied in preparing these financial statements. HKFRS 16 replaces HKAS 17 Leases and other existing guidance on leases. It introduces a single lessee accounting model and requires a lessee to recognise assets and liabilities for all leases with a term of more than 12 months, unless the underlying asset is of low value. A lessee is required to recognise a right of use asset representing its right to use the underlying leased asset and a lease liability representing its obligations to make lease payments. The new standard will become mandatory for the Consolidated Entity’s 30 June 2020 financial statements and will result in the gross up of assets and liabilities where the Consolidated Entity leases office buildings, motor vehicles and development land classified as inventories.
The Consolidated Entity will apply HKFRS 16 initially on 1 July 2019 using the modified retrospective approach. Under this approach, the cumulative effect of initially applying this standard is recognised at the date of initial application. The Consolidated Entity will recognise a lease liability at the present value of the remaining lease payments, discounted using the lessee’s incremental borrowing rate at the date of initial application and a right of use asset equal to the lease liabil ity, adjusted for any prepaid or accrued lease payments. The Consolidated Entity estimates that it will recognise $18.5 million of right of use assets and lease liabilities at 1 July 2019 relating to office equipment and motor vehicles. In relation to the lease of development land held as inventories, an estimated $15.9 million of right of use assets and lease liabilities will be recognised at 1 July 2019.
The Consolidated Entity plans to apply the practical expedient to grandfather the definition of a lease on transition. This means that it will apply HKFRS 16 to all contracts entered into before 1 July 2019 and identified as leases in accordance with HKAS 17. (g) Critical accounting estimates used in the preparation of the consolidated financial statements The preparation of consolidated financial statements requires estimates and assumptions concerning the application of accounting policies and the future to be made by the Consolidated Entity. Estimates are continually evaluated and are based on historical experience and other factors, including expectations of future events that are believed to be reasonable under the circumstances. The estimates and assumptions that have a significant risk of causing a material adjustment to the carrying amounts of assets and liabilities within the next financial year can be found in the following notes:
+ Note 6 – Property assets; and
+ Note 12 – Financial risk management. The accounting impacts of revisions to estimates are recognised in the period in which the estimate is revised and in any future periods affected.
Goodman Logistics (HK) Limited and its subsidiaries Notes to the consolidated financial statements
for the year ended 30 June 2019
A22
Basis of preparation (cont)
1 Basis of preparation (cont)
(g) Critical accounting estimates used in the preparation of the consolidated financial statements (cont)
Measurement of fair values A number of the Consolidated Entity’s accounting policies and disclosures require the measurement of fair values, for both financial and non-financial assets and liabilities.
When measuring the fair value of an asset or a liability, the Consolidated Entity uses market observable data as far as possible. Fair values are categorised into different levels in a fair value hierarchy and have been defined as follows:
+ Level 1: quoted prices (unadjusted) in active markets for identical assets or liabilities;
+ Level 2: inputs other than quoted prices included within Level 1 that are observable for the asset or liability, eitherdirectly (i.e. as prices) or indirectly (i.e. derived from prices); and
+ Level 3: inputs for the asset or liability that are not based on observable market data (unobservable inputs).
Further information about the assumptions made in measuring fair values is included in the following notes:
+ Note 6 – Property assets; and
+ Note 12 – Financial risk management.
Results for the year
2 Profit before interest and tax
Gross property income Gross property income comprises rental income under operating leases (net of incentives provided) and amounts billed to customers for outgoings (e.g. rates, levies, cleaning, security, etc.). Amounts billed to customers for outgoings are a cost recovery for the Consolidated Entity and are recognised once the expense has been incurred. The expense is included in property expenses.
Rental income under operating leases is recognised on a straight-line basis over the term of the lease contract. Where operating lease rental income is recognised relating to fixed increases in rentals in future years, an asset is recognised. This asset is a component of the relevant investment property carrying amount. The cost of lease incentives provided to customers is amortised on a straight-line basis over the life of the lease as a reduction of gross property income.
Management and development income The revenue from management and development activities is measured based on the consideration specified in a contract with a customer. The Consolidated Entity recognises revenue when it transfers control over a product or service to a customer.
Management income
Fee income derived from investment management and property services is recognised and invoiced progressively as the services are provided. Customers make payments usually either monthly or quarterly in arrears.
Performance related investment management income is recognised progressively as the services are provided but only when the income can be reliably measured and is highly probable of not being reversed. These portfolio performance fees are typically dependent on the overall returns of a Partnership relative to an agreed benchmark return, assessed over the life of the Partnership, which can vary from one year to seven years. The returns are impacted by operational factors such as quality and location of the portfolio, active property management and rental income rates but can also be significantly affected by changes in global and local economic conditions. Accordingly, performance fee revenue is only recognised at a point close to the end of the relevant assessment period, as prior to this revenue recognition is not considered to be sufficiently certain.
Goodman Logistics (HK) Limited and its subsidiaries Notes to the consolidated financial statements
for the year ended 30 June 2019
A23
Results for the year (cont)
2 Profit before interest and tax (cont)
Management and development income (cont)
In determining the amount of revenue that can be reliably measured, management prepares a sensitivity analysis to understand the impact of changes in asset valuations on the potential performance fee at the assessment date. The assessment of revenue will depend on the prevailing market conditions at the reporting date relative to long-term averages and also the length of time until the assessment date e.g. the longer the time period to assessment date, the greater the impact of the sensitivity analysis. The potential portfolio performance fee revenue is then recognised based on the length of time from the start of the assessment period to the reporting date as a proportion of the total assessment period. Payments are made at the end of the performance periods.
Development income – disposal of inventories The disposal of inventories is recognised at the point in time when control over the property asset is transferred to the customer. This will generally occur on transfer of legal title and payment in full by the customer. The gain or loss on disposal of inventories is calculated as the difference between the carrying amount of the asset at the time of disposal and the proceeds on disposal (less transaction costs) and is included in the profit or loss in the period of disposal.
Development income – development management services
Fee income from development management services (including master-planning, development management and overall project management) is recognised progressively as the services are provided in proportion to the stage of completion by reference to costs. Payments are received in accordance with the achievement of agreed milestones over the development period. The development period is usually between six months and 12 months, but can be longer for larger and more complex developments.
Performance related development management income is recognised by the Consolidated Entity on attainment of the performance related conditions, which is when the income can be reliably measured and is highly probable of not being reversed. These amounts are paid by the Partnership when the amounts have been measured and agreed.
Development income – fixed price development contracts Certain development activities are assessed as being fixed price development contracts. This occurs when a signed contract exists, either prior to the commencement of or during the development phase, to acquire a development asset from the Consolidated Entity on completion. Revenue and expenses relating to these development contracts are recognised in profit or loss in proportion to the stage of completion of the relevant contracts by reference to costs. The payments may be on completion of the development once legal title has been transferred. The development phase is usually between six months and 12 months but may be longer.
Net gain on disposal of investment properties The disposal of an investment property is recognised at the point in time when control over the property has been transferred to the purchaser.
Employee benefits
Wages, salaries and annual leave Wages and salaries, including non-monetary benefits, and annual leave that are expected to be settled within 12 months of the reporting date represent present obligations resulting from employees’ services provided to the reporting date. These are calculated at undiscounted amounts based on rates that are expected to be paid as at the reporting date including related on-costs, such as workers’ compensation insurance and payroll tax.
Bonuses A liability is recognised in other payables and accruals for bonuses where there is a contractual obligation or where there is a past practice that has created a constructive obligation. Liabilities for bonuses that are expected to be settled within 12 months are measured at the amounts expected to be paid, including related on-costs, when they are settled. Liabilities for bonuses, including related on-costs, which are expected to be settled after more than 12 months are discounted to reflect the estimated timing of payments.
Defined contribution retirement plans Obligations for contributions to defined contribution retirement plans are recognised as an expense as incurred.
Goodman Logistics (HK) Limited and its subsidiaries Notes to the consolidated financial statements
for the year ended 30 June 2019
A24
Results for the year (cont)
2 Profit before interest and tax (cont)
Profit before interest and income tax has been arrived at after crediting/(charging) the following items:
3 Segment reporting
An operating segment is a component of the Consolidated Entity that engages in business activities from which it may earn revenues and incur expenses. The Consolidated Entity reports the results and financial position of its operating segments based on the internal reports regularly reviewed by the Group Chief Executive Officer in order to assess each segment’s performance and to allocate resources to them.
Operating segment information is reported on a geographic basis and the Consolidated Entity has determined that its operating segments are Asia (which consists of Greater China and Japan), Continental Europe and the United Kingdom.
The activities and services undertaken by the operating segments include:
+ property investment, comprising the Consolidated Entity’s cornerstone investments in Partnerships;
+ management activities, both fund and property management; and
+ development activities, including development of directly owned assets (predominantly disclosed as inventories) andmanagement of development activities for the Consolidated Entity’s Partnerships.
The segment results that are reported to the Group Chief Executive Officer are based on profit before net finance expense and income tax expense, and also exclude non-cash items such as fair value adjustments and impairments, corporate expenses and incentive based remuneration. The assets allocated to each operating segment primarily include inventories, and the operating segment’s investments in Partnerships, but exclude receivables from GL, GIT and their controlled entities, income tax receivables and corporate assets. The liabilities allocated to each operating segment primarily relate to trade and other payables associated with the operating activities, but exclude payables to GL, GIT and their controlled entities, provision for dividends to Shareholders, income tax payables and corporate liabilities.
The accounting policies used to report segment information are the same as those used to prepare the consolidated financial statements for the Consolidated Entity.
There are no intersegment transactions.
2019 2018
$M $M
Management income 122.8 110.7
Portfolio performance fees 194.2 61.4
Management income 317.0 172.1
Income from disposal of inventories 305.0 199.6
Development income from fixed price development contracts 310.7 446.0
Other development income, including development management 74.5 49.0
Net gain on disposal of special purpose development entities 4.5 15.3
Development income 694.7 709.9
Inventory cost of sales (220.8) (157.1)
Other development expenses (254.0) (372.6)
Development expenses (474.8) (529.7)
Salaries, wages and other benefits (90.7) (79.3)
Contributions to defined contribution retirement plans (1.0) (0.9)
Transaction management fees (101.9) (22.6)
Operating lease expense (8.0) (7.2)
Depreciation of plant and equipment (2.0) (2.5)
Auditor's remuneration (0.8) (0.6)
Goodman Logistics (HK) Limited and its subsidiaries Notes to the consolidated financial statements
for the year ended 30 June 2019
A25
Results for the year (cont) 3 Segment reporting (cont) Information about reportable segments
2019 2018 2019 2018 2019 2018 2019 2018
Statement of comprehensive income $M $M $M $M $M $M $M $M
Goodman Logistics (HK) Limited and its subsidiaries Notes to the consolidated financial statements
for the year ended 30 June 2019
A26
Results for the year (cont)
3 Segment reporting (cont)
Reconciliation of reportable segment revenue, profit or loss, assets and liabilities
1. Other unallocated amounts comprise principally receivables from and payables to GL, GIT and their controlled entities.
2019 2018
$M $M
Revenue
Total revenue for reportable segments 1,020.8 898.7
Consolidated revenues 1,020.8 898.7
Profit or loss
Total profit before income tax for reportable segments 450.3 320.3
Corporate expenses not allocated to reportable segments (38.3) (28.4)
412.0 291.9
Valuation and other adjustments not included in reportable segment profit
before income tax:
- Share of fair value adjustments in equity accounted investments 137.0 52.4
- Share based payments expense (54.8) (28.4)
Net finance expense - refer to note 10 (33.0) (21.3)
Consolidated profit before income tax 461.2 294.6
Assets
Total assets for reportable segments 2,462.7 1,785.6
Other unallocated amounts1 408.0 361.3
Consolidated total assets 2,870.7 2,146.9
Liabilities
Total liabilities for reportable segments 149.5 133.4
Other unallocated amounts1 1,413.1 1,049.5
Consolidated total liabilities 1,562.6 1,182.9
Goodman Logistics (HK) Limited and its subsidiaries Notes to the consolidated financial statements
for the year ended 30 June 2019
A27
Results for the year (cont) 4 Income tax expense Income tax for the period comprises current tax and movements in deferred tax assets and liabilities. Current tax and movements in deferred tax assets and liabilities are recognised in profit or loss except to the extent that they relate to items recognised in other comprehensive income or directly in equity, in which case the relevant amounts of tax are recognised in other comprehensive income or directly in equity respectively. Current tax is the expected tax payable on the taxable income for the period, using tax rates enacted or substantively enacted at the reporting date, and any adjustment to tax payable in respect of previous years.
Deferred tax assets and liabilities arise from deductible and taxable temporary differences respectively, being the differences between the carrying amounts of assets and liabilities for financial reporting purposes and their tax bases. Deferred tax assets also arise from unused tax losses and unused tax credits. Apart from differences which arise on initial recognition of assets and liabilities, all deferred tax liabilities and all deferred tax assets, to the extent that it is probable that future taxable profits will be available against which the asset can be utilised, are recognised.
The amount of deferred tax recognised is measured based on the expected manner of realisation or settlement of the carrying amount of the assets and liabilities, using tax rates enacted or substantively enacted at the reporting date. Deferred tax assets and liabilities are not discounted. (a) Taxation in the statement of comprehensive income
The provision for Hong Kong profits tax for year ended 30 June 2019 is calculated at 16.5% (2018: 16.5%) of the estimated assessable profits for the year. Taxation for overseas subsidiaries is charged at the appropriate current rates of taxation ruling in the relevant countries.
2019 2018
$M $M
Current tax expense - Hong Kong profits tax
Current year (3.6) (7.3)
Adjustment for prior periods 0.6 0.4
(3.0) (6.9)
Current tax expense - overseas
Current year (30.4) (15.2)
Adjustment for prior periods 1.1 (0.2)
(29.3) (15.4)
Deferred tax expense
Origination and reversal of temporary differences (24.9) (4.6)
Benefit of tax losses recognised - 0.2
Other (0.4) -
(25.3) (4.4)
Total income tax expense (57.6) (26.7)
Goodman Logistics (HK) Limited and its subsidiaries Notes to the consolidated financial statements
for the year ended 30 June 2019
A28
Results for the year (cont)
4 Income tax expense (cont)
(b) Reconciliation between income tax expense and accounting profit at applicable tax rates
(c) Net income tax payable
(d) Deferred tax assets and liabilities
Deferred tax assets of $0.1 million (2018: $0.2 million) arising from tax losses and deferred tax liabilities of $30.8 million (2018: $4.7 million) arising from other receivables were recognised in the consolidated statement of financial position.
5 Profit attributable to equity shareholders of the Company
The consolidated profit attributable to equity shareholders of the Company includes a profit of $114.7 million (2018: $222.1 million) which has been dealt with in the financial statements of the Company.
2019 2018
$M $M
Profit before income tax 461.2 294.6
Notional tax on profit before income tax, calculated at the rates applicable to profits in the
countries concerned (124.4) (78.8)
(Increase)/decrease in income tax due to:
- Current year losses for which no deferred tax asset was recognised (7.7) (9.8)
- Non-assessable income 96.0 74.1
- Non-deductible expense (43.8) (17.6)
- Utilisation of previously unrecognised tax losses 20.6 5.2
- Adjustment for prior periods 1.7 0.2
Income tax expense (57.6) (26.7)
2019 2018
$M $M
Net balance at the beginning of the year (12.0) (15.1)
Decrease/(increase) in current net tax payable due to:
- Net income taxes paid 18.0 26.1
- Net income tax expense on current year’s profit (34.0) (22.5)
- Adjustment for prior periods 1.7 0.2
- Other (0.8) (0.7)
Net balance at the end of the year (27.1) (12.0)
Current tax receivables 1.2 2.5
Current tax payables (28.3) (14.5)
(27.1) (12.0)
Goodman Logistics (HK) Limited and its subsidiaries Notes to the consolidated financial statements
for the year ended 30 June 2019
A29
Operating assets and liabilities
6 Property assets
(a) Types of property assets
Investment in property assets includes both inventories and investment properties (including those under development), which may be held either directly or through investments in Partnerships.
Inventories Inventories relate to land and property developments that are held for sale or development and sale in the normal course of business. Where property developments are forecast to be completed and sold more than 12 months after the reporting date, then the inventories are classified as non-current.
Work in progress in relation to land subdivision and development projects includes the costs of acquisition, planning, management and development and holding costs such as interest and taxes.
Inventories are carried at the lower of cost or net realisable value. Net realisable value is the estimated selling price in the normal course of business, less the estimated costs of completion and selling expenses. The calculation of net realisable value requires estimates and assumptions which are continually evaluated and are based on historical experience and expectations of future events that are believed to be reasonable under the circumstances.
Investment properties Investment properties comprise investment interests in land and buildings held for the purpose of leasing to produce rental income and/or for capital appreciation. Investment properties are carried at fair value. The calculation of fair value requires estimates and assumptions which are continually evaluated and are based on historical experience and expectations of future events that are believed to be reasonable under the circumstances. Investment properties are not depreciated as they are subject to continual maintenance and regularly revalued on the basis described below. Changes in the fair value of investment properties are recognised directly in profit or loss.
Components of investment properties Land and buildings (including integral plant and equipment) comprising investment properties are regarded as composite assets and are disclosed as such in the consolidated financial statements.
Investment property carrying values include the costs of acquiring the assets and subsequent costs of development, including costs of all labour and materials used in construction, costs of managing the projects, holding costs and borrowing costs incurred during the development periods.
Amounts provided to customers as lease incentives and assets relating to fixed rental income increases in operating lease contracts are included within investment property values. Lease incentives are amortised over the term of the lease on a straight-line basis. Direct expenditure associated with leasing a property is also capitalised within investment property values and amortised over the term of the lease.
Classification of investment properties Investment properties are classified as either properties under development or stabilised properties. Investment properties under development include land, new investment properties in the course of construction and investment properties that are being redeveloped. Stabilised investment properties are all investment properties not classified as being under development and would be completed properties that are leased or are available for lease to customers.
For investment properties under development, the carrying values are reviewed by management at each reporting date to consider whether they reflect their fair value and at completion external valuations are obtained to determine the fair values.
For stabilised investment properties, independent valuations are obtained at least every three years to determine the fair values. At each reporting date between obtaining independent valuations, the carrying values are reviewed by management to ensure they reflect the fair values.
Goodman Logistics (HK) Limited and its subsidiaries Notes to the consolidated financial statements
for the year ended 30 June 2019
A30
Operating assets and liabilities (cont) 6 Property assets (cont) (a) Types of property assets (cont) Deposits for investment properties Deposits and other costs associated with acquiring investment properties that are incurred prior to obtaining legal title are recorded at cost and disclosed as other assets in the statement of financial position. (b) Summary of the Consolidated Entity’s investment in property assets
(c) Estimates and assumptions in determining property carrying values
Inventories
For both inventories held directly and inventories held in Partnerships, external valuations are not performed but instead valuations are determined using the feasibility studies supporting the land and property developments. The end values of the developments in the feasibility studies are based on assumptions such as capitalisation rates, letting up periods and incentives that are consistent with those observed in the relevant market. Where the feasibility study calculations indicate that the forecast cost of a completed development will exceed the net realisable value, then the inventories are impaired.
Stabilised investment properties The fair value of stabilised investment properties is based on current prices in an active market for similar properties in the same location and condition and subject to similar lease and other contracts. The current price is the estimated amount for which a property could be exchanged between a willing buyer and a willing seller in an arm’s length transaction after proper marketing wherein the parties had each acted knowledgably, prudently and without compulsion. Approach to determination of fair value The approach to determination of fair value of investment properties is applied to both investment properties held directly and investment properties held in Partnerships. Valuations are determined based on assessments and estimates of uncertain future events, including upturns and downturns in property markets and availability of similar properties, vacancy rates, market rents and capitalisation and discount rates. Recent and relevant sales evidence and other market data are taken into account. Valuations are either based on an external, independent valuation or on an internal valuation. External valuations are undertaken only where market segments were observed to be active. In making the determination of whether a market segment is active, the following characteristics are considered:
+ function of the asset (distribution/warehouse or suburban office);
+ location of the asset (city, suburb or regional area);
+ carrying value of the asset (categorised by likely appeal to private (including syndicates), national and institutional investors); and
+ categorisation as primary or secondary based on a combination of location, weighted average lease expiry, quality of tenant covenant (internal assessment based on available market evidence) and age of construction.
Each property asset is assessed and grouped with assets in the same or similar market segments. Information on all relevant recent sales is also analysed using the same criteria to provide a comparative set. Unless three or more sales are observed in an individual market segment (taken together with any comparable market segments as necessary), that market segment is considered inactive.
2019 2018
Note $M $M
Directly held property:
Inventories
Current 6(d) 156.6 172.2
Non-current 6(d) 315.2 196.0
471.8 368.2
Property held by Partnerships:
Investments accounted for using the equity method - JVs 6(e) 1,226.9 907.2
1,226.9 907.2
Goodman Logistics (HK) Limited and its subsidiaries Notes to the consolidated financial statements
for the year ended 30 June 2019
A31
Operating assets and liabilities (cont)
6 Property assets (cont)
(c) Estimates and assumptions in determining property carrying values (cont)
Stabilised investment properties (cont)
Where a market segment is observed to be active, then external, independent valuations are performed for stabilised investment properties where there has been more than a 25 basis point movement in capitalisation rates and/or there has been a material change in tenancy profile and/or there has been significant capital expenditure, and/or there has been a change in use (or zoning) of the asset and/or it has been three years since the previous external, independent valuation. For all other stabilised investment properties in an active market segment, an internal valuation is performed based on observable capitalisation rates and referenced to independent market data.
Where a market segment is observed to be inactive, then no external, independent valuations are performed and internal valuations are undertaken based on discounted cash flow (DCF) calculations. The DCF calculations are prepared over a 10 year period. The key inputs considered for each individual calculation are rental growth rates, discount rates, market rental rates and letting up incentives. Discount rates are computed using the 10 year bond rate or equivalent in each jurisdiction plus increments to reflect country risk, tenant credit risk and industry risk. Where possible, the components of the discount rate are benchmarked to available market data.
Market assessment At 30 June 2019, all markets in which the Consolidated Entity operated were observed to be active and no adjustments were made to the carrying value of stabilised investment properties arising from internal valuations using DCF calculations. Overall weighted average capitalisation rates for the divisional portfolios (including Partnerships) are set out in the table below:
Investment properties under development
External valuations are generally not performed for investment properties under development, but instead valuations are determined using the feasibility studies supporting the developments. The end values of the developments in the feasibility studies are based on assumptions such as capitalisation rates, letting up periods and incentives that are consistent with those observed in the relevant market adjusted for a profit and risk factor. This profit and risk factor is dependent on the function, location, size and current status of the development and is generally in a market range of 10% to 15%. This adjusted end value is then compared to the forecast cost of a completed development to determine whether there is an increase or decrease in value.
(d) Inventories
No impairment losses on land and development properties was recognised in the current and comparative financial years.
2019 2018
Division % %
Asia 5.6 6.1
Continental Europe 4.6 5.1
United Kingdom 4.5 4.7
Total portfolio weighted
average capitalisation rate
2019 2018
$M $M
Current
Land and development properties 156.6 172.2
156.6 172.2
Non-current
Land and development properties 315.2 196.0
315.2 196.0
Goodman Logistics (HK) Limited and its subsidiaries Notes to the consolidated financial statements
for the year ended 30 June 2019
A32
Operating assets and liabilities (cont) 6 Property assets (cont) (e) Investments accounted for using the equity method The Consolidated Entity’s principal Partnerships are set out below:
GJDP undertakes property development activities, with completed developments sold at, or shortly after, completion depending on leasing status. The Consolidated Entity’s other Partnerships have a long-term remit to hold investment properties to earn rental income and for capital appreciation, although they will undertake developments when an appropriate opportunity arises. The reconciliation of the carrying value at the beginning to the carrying value at the end of the year is set out as follows:
Summary financial information of JVs The following table summarises the financial information of the material Partnerships as included in their own financial statements. The table also reconciles the summarised financial information to the carrying amount of the Consolidated Entity’s interest in the JVs.
Goodman UK Partnership ("GUKP") United Kingdom 20.9 12.6 33.3 33.3 196.3 109.4
Other JVs 1.5 (1.0) 10.1 5.1
221.2 104.0 1,226.9 907.2
Consolidated
share of net
results recognised
Consolidated
ownership interest
Consolidated
investment
carrying amount
2019 2018
Movements in carrying amount of investments in JVs $M $M
Carrying amount at the beginning of the year 907.2 651.4
Share of net results after tax (before fair value adjustments) 84.2 51.6
Share of fair value adjustments 137.0 52.4
Share of net results after tax 221.2 104.0
Share of movements in reserves (39.8) 26.6
Acquisitions 189.0 182.8
Capital return (50.1) (60.5)
Dividends/distributions received and receivable (52.0) (34.5)
Effect of foreign currency translation 51.4 37.4
Carrying amount at the end of the year 1,226.9 907.2
Goodman Logistics (HK) Limited and its subsidiaries Notes to the consolidated financial statements
for the year ended 30 June 2019
A33
Operating assets and liabilities (cont) 6 Property assets (cont) (e) Investments accounted for using the equity method (cont) Summary financial information of JVs (cont)
1. Shareholder loans have been provided by investors of GCLP in proportion to their ownership interest. The shareholder loans are interest free, unsecured and have no fixed terms of repayment. The shareholder loans are not expected to be repaid within 12 months from the end of the reporting period and the directors consider the loans to form part of the Consolidated Entity’s investment in GCLP.
Profit and total comprehensive income (100%) 414.4 425.4 108.6 73.1 62.8 37.9 106.6 34.9
Consolidated share of profit and total comprehensive income 82.8 85.1 22.9 16.4 20.9 12.6 53.3 17.5
Dividends/distributions received and receivable by the Consolidated Entity 6.0 8.8 5.9 6.2 - - 40.1 19.4
GCLP KGG GUKP GJDP
Goodman Logistics (HK) Limited and its subsidiaries Notes to the consolidated financial statements
for the year ended 30 June 2019
A34
Operating assets and liabilities (cont)
7 Receivables
Non-derivative financial assets The Consolidated Entity initially recognises loans and receivables and deposits on the date that they are originated. All other financial assets are recognised initially on the trade date at which the Consolidated Entity becomes a party to the contractual provisions of the instrument.
The Consolidated Entity derecognises a financial asset when the contractual rights to the cash flows from the asset expire, or it transfers the right to receive the contractual cash flows on the financial asset in a transaction in which substantially all the risks and rewards of ownership of the financial asset are transferred. Any interest in transferred financial assets that is created or retained by the Consolidated Entity is recognised as a separate asset or liability.
Financial assets and liabilities are offset and the net amount presented in the statement of financial position when, and only when, the Consolidated Entity has a legal right to offset the amounts and intends to either settle on a net basis or to realise the asset and settle the liability simultaneously.
Loans and receivables Loans and receivables are financial assets with fixed or determinable payments that are not quoted in an active market. Such assets are recognised initially at fair value plus any directly attributable transaction costs. Subsequent to initial recognition, loans and receivables are measured at amortised cost using the effective interest rate method, less allowance for impairment of doubtful debts, except where the receivables are interest free loans made to related parties without any fixed repayment terms or the effect of discounting would be immaterial. In such cases, the receivables are stated at cost less allowance for impairment of doubtful debts.
Loans and receivables comprise trade and other receivables, amounts due from related parties and loans to related parties.
Amounts recoverable on development contracts Amounts recoverable on development contracts arise when the Consolidated Entity contracts to sell a completed development asset either prior to or during the development phase. The receivables are stated at cost plus profit recognised to date less an allowance for foreseeable losses and less amounts already billed.
Impairment
Non-financial assets The carrying amounts of the Consolidated Entity’s assets (except inventories, refer to note 6(d); and deferred tax assets, refer to note 4) are reviewed at each reporting date to determine whether there is any indication of impairment. If such indication exists, the asset is written down to the recoverable amount. The impairment is recognised in profit or loss in the reporting period in which it occurs.
An impairment loss is recognised whenever the carrying amount of an asset or its cash-generating unit exceeds its recoverable amount. Impairment losses are recognised in profit or loss, unless an asset has previously been revalued, in which case the impairment loss is recognised as a reversal to the extent of that previous revaluation, with any excess recognised through profit or loss.
Impairment losses recognised in respect of cash-generating units are allocated to the carrying amount of any identified intangible asset and then to reduce the carrying amount of the other assets in the unit (group of units) on a pro rata basis.
Financial assets and contract assets The Consolidated Entity recognises an impairment loss allowance for expected credit losses (ECLs) on financial assets measured at amortised cost and contract assets. Financial assets measured at amortised cost include cash and cash equivalents, trade receivables, amounts and loans due from related parties and other receivables.
Other financial assets measured at fair value are not subject to the ECL assessment.
Measurement of ECLs ECLs are a probability-weighted estimate of credit losses. Credit losses are measured as the present value of all expected cash shortfalls. In measuring ECLs, the Consolidated Entity takes into account information about past events, current conditions and forecasts of future economic conditions.
Impairment loss allowances for trade receivables, amounts due from related parties, other receivables and contract asset are measured at an amount equal to a lifetime ECL. Lifetime ECLs are losses that are expected to result from all possible default events over the expected lives of the items to which the ECL model applies.
The Consolidated Entity recognises an impairment loss allowance equal to the expected losses within 12 months after the reporting date on loans to related parties, unless there has been a significant increase in credit risk of the loans since initial recognition, in which case the loss allowance is measured at an amount equal to lifetime ECLs.
Goodman Logistics (HK) Limited and its subsidiaries Notes to the consolidated financial statements
for the year ended 30 June 2019
A35
Operating assets and liabilities (cont)
7 Receivables (cont)
Impairment (cont)
1. The comparative figures have been restated to reflect the allocation of certain receivables to contract assets in accordance withHKFRS 15.
The maximum exposure to credit risk at the reporting date is the fair value of each class of receivable mentioned above. All non-current receivables of the Consolidated Entity are due within five years from the reporting date. There is no material difference between the carrying values and the fair values of receivables.
Trade receivables No trade receivables were impaired at 30 June 2019 and 2018. There are no significant overdue trade receivables at 30 June 2019.
Other receivables
At 30 June 2019, none of the other receivables balance was overdue or impaired (2018: $nil).
Amounts due from related parties
At 30 June 2019, none of the amounts due from related parties was overdue or impaired (2018: $nil). Amounts due from related parties are typically repayable within 30 days. The amounts due from related parties are unsecured.
Loans to related parties
Loans to related parties principally relate to loans to fellow subsidiaries of GL and GIT and loans to JVs. Refer to note 19(c) for details of loans to related parties. During the year, no impairment losses were recognised on loans to related parties (2018: nil impairment). The loans to related parties are unsecured.
2019 2018
Restated1
Note $M $M
Current
Trade receivables 7.8 45.5
Other receivables 50.8 49.7
Amounts due from related parties 89.6 57.9
Loans to related parties 19(c) 408.0 365.5 556.2 518.6
Non-current
Loans to related parties 19(c) 82.1 57.5 82.1 57.5
Goodman Logistics (HK) Limited and its subsidiaries Notes to the consolidated financial statements
for the year ended 30 June 2019
A36
Operating assets and liabilities (cont) 8 Contract balances Contract assets primarily comprise amounts recoverable from fixed price development contracts (disclosed net of any payments received on account) and accrued performance fee income where the Consolidated Entity assesses that the income can be reliably measured. Contract liabilities primarily comprise deposits and other amounts received in advance for development contracts and rental guarantees. The following table provides an analysis of receivables from contracts with customers (excluding rental income receivables), contract assets and contract liabilities at the reporting dates:
1. The comparative figures have been restated to reflect the allocation of certain balances to contract assets and liabilities in accordance with HKFRS 15.
Significant changes in the contract assets and the contract liabilities balances during the year are set out below:
2019 2018
Restated1
$M $M
Current
Receivables from contracts with customers, which are included in trade
receivables, other receivables and amounts due from related parties 100.0 102.6
Contract assets 279.5 141.0
Contract liabilities 5.2 21.9
Non-current
Contract liabilities 3.0 3.7
Contract
assets
Contract
liabilities
Contract
assets
Contract
liabilities
$M $M $M $M
Balance at the beginning of the year 141.0 25.6 321.4 20.4
Revenue recognised that was included in the contract liability balance at the
beginning of the year - (17.6) - (13.4)
Increases due to cash received, excluding amounts recognised as revenue
during the year - - - 17.2
Transfers from contract assets to receivables (384.1) - (618.4) -
Increase due to changes in the measure of progress during the year 513.9 - 423.0 -
Effect of foreign currency translation 8.7 0.4 14.8 1.2
Other - (0.2) 0.2 0.2
279.5 8.2 141.0 25.6
Current contract assets and liabilities 279.5 5.2 141.0 21.9
Non-current contract liabilities - 3.0 - 3.7
279.5 8.2 141.0 25.6
2019 2018
Goodman Logistics (HK) Limited and its subsidiaries Notes to the consolidated financial statements
for the year ended 30 June 2019
A37
Operating assets and liabilities (cont)
8 Contract balances (cont)
Transaction price allocated to the remaining contract obligations The amount of the transaction price allocated to the remaining performance obligations under the Consolidated Entity’s existing contracts is $21.9 million. This amount represents revenue expected to be recognised in the future from ongoing management and fixed price development contracts with customers. The Consolidated Entity will recognise the expected revenue in the future as the work is completed, which is expected to be within the next 12 months.
In addition, the Consolidated Entity receives investment management, development management and property services fees under various contracts that it has with its Partnerships. These contracts are for varying lengths of time and are typically transacted on terms that are consistent with market practice. The revenues under these contracts are linked to the assets under management, total development project costs or gross property income of the Partnerships and are invoiced as the services are provided.
9 Payables
Non-derivative financial liabilities The Consolidated Entity initially recognises debt securities issued and subordinated liabilities on the date that they are originated. All other financial liabilities are recognised initially on the trade date at which the Consolidated Entity becomes a party to the contractual provisions of the instrument.
The Consolidated Entity derecognises a financial liability when the contractual obligations are discharged or cancelled or expire.
Financial assets and liabilities are offset and the net amount presented in the statement of financial position when, and only when, the Consolidated Entity has a legal right to offset the amounts and intends to either settle on a net basis or to realise the asset and settle the liability simultaneously.
The Consolidated Entity has classified non-derivative financial liabilities into the other financial liabilities category. Such financial liabilities are recognised initially at fair value plus any directly attributable transaction costs. Subsequent to initial recognition, these financial liabilities are measured at amortised cost using the effective interest rate method.
Other financial liabilities comprise trade and other payables and loans from related parties (refer to note 19(c)).
1. The comparative figures have been restated to reflect the allocation of certain payables to contract liabilities in accordance withHKFRS 15.
2019 2018
Restated1
Note $M $M
Current
Trade payables 26.9 38.1
Other payables and accruals 195.4 46.8
Loans from related parties 19(c) 851.7 798.1
1,074.0 883.0
Non-current
Other payables and accruals 49.3 44.7
Loans from related parties 19(c) 250.7 98.9
300.0 143.6
Goodman Logistics (HK) Limited and its subsidiaries Notes to the consolidated financial statements
for the year ended 30 June 2019
A38
Capital management 10 Finance income and expense Finance income Interest is recognised on an accruals basis using the effective interest rate method, and, if not received at the reporting date, is reflected in the statement of financial position as a receivable. Finance expense Expenditure incurred in obtaining debt finance is offset against the principal amount of the interest bearing liability to which it relates, and is recognised as a finance cost on an effective interest rate basis over the life of the facility or until the facility is significantly modified. Where a facility is significantly modified, any unamortised expenditure in relation to that facility and incremental expenditure incurred in modifying the facility are recognised as a finance cost in the financial year in which the significant modification occurs. Finance costs relating to a qualifying asset are capitalised as part of the cost of that asset using a weighted average cost of debt. Qualifying assets are assets which take a substantial time to get ready for their intended use or sale. All other finance costs are expensed using the effective interest rate method.
Borrowing costs were capitalised to inventories and investment properties under development during the financial year at rates between 2.5% and 5.9% per annum (2018: 0.9% and 5.9% per annum). 11 Other financial assets and liabilities Other financial assets and liabilities are recognised initially on the trade date at which the Consolidated Entity become a party to the contractual provisions of the instrument. Derivative financial instruments and hedging The Consolidated Entity uses derivative financial instruments to hedge its economic exposure to foreign exchange and interest rate risks arising from operating, investing and financing activities. In accordance with its treasury policy, the Consolidated Entity does not hold or issue derivative financial instruments for speculative trading purposes. The Consolidated Entity’s derivative financial instruments are not designated as a hedge for accounting purposes, and accordingly movements in the fair value of derivative financial instruments are recognised in profit or loss. Investments in unlisted securities Subsequent to initial recognition, investments in unlisted securities are measured at fair value and changes therein are recognised as other comprehensive income and presented in the asset revaluation reserve in equity. Dividends are recognised as income in profit or loss unless the dividend clearly represents a recovery of part of the cost of the investment. Other net gains and losses are recognised in comprehensive income and are never reclassified to profit or loss. When such an asset is derecognised, the cumulative gain or loss in equity is transferred to retained earnings.
2019 2018
Note $M $M
Finance income
Interest income on loans to:
- Related parties 19(c) 3.8 2.8
- Other parties 0.6 0.3
4.4 3.1
Finance expense
Interest expense from related party loans 19(c) (37.2) (30.5)
Other borrowing costs (0.4) (0.4)
Fair value adjustments on derivative financial instruments (6.7) -
Foreign exchange loss (0.1) -
Capitalised borrowing costs 7.0 6.5
(37.4) (24.4)
Net finance expense (33.0) (21.3)
Goodman Logistics (HK) Limited and its subsidiaries Notes to the consolidated financial statements
for the year ended 30 June 2019
A39
Capital management (cont) 11 Other financial assets and liabilities (cont) Other financial assets
1. Principally relates to the Consolidated Entity’s 10.0% (2018: 10.0%) interest in Goodman Japan Limited. During the year, a
revaluation gain of $3.0 million was recognised in other comprehensive income (2018: no gain or losses). Refer to note 12(d) for assumptions made in measuring fair value of the unlisted securities.
Other financial liabilities
1. During the year, the Consolidated Entity entered into cross currency interest rate swaps (“CCIRS”) to hedge the net investment in Europe.
12 Financial risk management The Consolidated Entity’s capital management and financial risk management processes are managed as part of the wider Goodman Group. There are established policies, documented in Goodman Group’s financial risk management (“FRM”) policy document, to ensure both the efficient use of capital and the appropriate management of the exposure to financial risk. Goodman Group’s treasury function is responsible for monitoring the day to day compliance with Goodman Group’s FRM policies and prepares reports for consideration by management committees and Goodman Group’s Board including:
+ cash flow projections over a period of at least 12 months to assess the level of cash and undrawn facilities, and headline gearing at each month end;
+ debt maturity profile, to allow the Goodman Group to plan well in advance of maturing facilities;
+ interest rate hedge profile over the next 10 years, to allow Goodman Group to manage the proportion of fixed and floating rate debt in accordance with its FRM policy; and
+ capital hedge position (by currency) and profile of expiring currency derivatives, to allow Goodman Group to manage its net investment hedging in accordance with its FRM policy.
Any significant investments or material changes to the finance facilities or FRM policies require approval by the Goodman Group Board.
2019 2018
$M $M
Non-current
Investment in unlisted securities , at fair value1
28.2 21.5
28.2 21.5
2019 2018
$M $M
Non-current
Derivative financial instruments1
6.7 -
6.7 -
Goodman Logistics (HK) Limited and its subsidiaries Notes to the consolidated financial statements
for the year ended 30 June 2019
A40
Capital management (cont)
12 Financial risk management (cont)
The Consolidated Entity’s key financial risks are market risk (including foreign exchange and interest rate risk), liquidity risk and credit risk.
(a) Market risk
Foreign exchange risk
The Consolidated Entity is exposed to transactional foreign currency risk and net investment foreign currency risk through its investments in Hong Kong, Japan, China, Continental Europe and the United Kingdom. Foreign exchange risk represents the loss that would be recognised from adverse fluctuations in currency prices as a result of future commercial transactions, recognised assets and liabilities and, principally, net investments in foreign operations.
Goodman Group manages foreign currency exposure on a consolidated basis. In managing foreign currency risks, Goodman Group aims to reduce the impact of short-term fluctuations on earnings and net assets. However, over the long term, permanent changes in foreign exchange will have an impact on both earnings and net assets.
Goodman Group’s capital hedge policy for each overseas region is to hedge between 65% and 90% of foreign currency denominated assets with foreign currency denominated liabilities. This is achieved by borrowing in the same functional currency as the investments to form a natural economic hedge against any foreign currency fluctuations and/or using derivatives such as CCIRS
During the year, the Consolidated Entity entered into CCIRS to hedge its net investment in Continental Europe. The CCIRS have a principal amount payable and receivable on maturity in FY26 of EUR 495.0 million and AUD 803.0 million respectively. A fair value loss of $6.7 million was recognised in profit or loss on revaluation of the CCIRS at 30 June 2019.
The Consolidated Entity has minimal transactional foreign exchange risk as the majority of transactions in each division are in the functional currency of each division.
Sensitivity analysis
Throughout the financial year, if the Australian dollar had been 5% (2018: 5%) stronger against all other currencies, with all other variables held constant, the Consolidated Entity’s profit attributable to Shareholders, excluding derivative mark to market and unrealised foreign exchange movements, would have decreased by $31.5 million (2018: $17.4 million). If the Australian dollar had been 5% (2018: 5%) weaker against all other currencies, with all other variables held constant, the Consolidated Entity’s profit attributable to Shareholders, excluding derivative mark to market and unrealised foreign exchange movements, would have increased by $31.5 million (2018: $17.4 million).
Interest rate risk
The Consolidated Entity’s interest rate risk arises from variable rate borrowings with related parties and CCIRS.
Sensitivity analysis
Based on the Consolidated Entity’s interest bearing borrowings at 30 June 2019, if interest rates on borrowings had been 100 basis points per annum (2018: 100 basis points per annum) higher/lower, with all other variables held constant, the Consolidated Entity’s profit attributable to Shareholders for the financial year would have been $6.9 million lower/higher (2018: $5.4 million lower/higher).
Price risk
The Consolidated Entity is not exposed to price risk.
Goodman Logistics (HK) Limited and its subsidiaries Notes to the consolidated financial statements
for the year ended 30 June 2019
A41
Capital management (cont) 12 Financial risk management (cont) (b) Liquidity risk Liquidity risk is the risk that the Consolidated Entity will not be able to meet its financial obligations as they fall due. The Consolidated Entity’s objective is to maintain sufficient liquidity resources for working capital, meet its financial obligations and liabilities, pay distributions and provide funds for capital expenditure and investment opportunities. Management seeks to achieve these objectives through the preparation of regular forecast cash flows to understand the application and use of funds and through the identification of future funding, primarily through loans from related parties in Goodman Group. The contractual maturities of financial liabilities are set out below:
1. Gross settled includes CCIRS.
Carrying
amount
Contractual
cash flows
Up to 12
months 1 - 2 year(s) 2 - 3 years 3 - 4 years 4 - 5 years
More than 5
years
$M $M $M $M $M $M $M $M
As at 30 June 2019
Non-derivative financial liabilities
Trade and other payables 271.6 271.6 222.3 49.3 - - - -
Loans from related parties 1,102.4 1,132.1 857.5 5.8 6.0 6.1 137.9 118.8
Goodman Logistics (HK) Limited and its subsidiaries Notes to the consolidated financial statements
for the year ended 30 June 2019
A42
Capital management (cont)
12 Financial risk management (cont)
(c) Credit risk
Credit risk represents the loss that would be recognised if counterparties failed to perform as contracted.
The maximum exposure to credit risk on financial assets, excluding investments, of the Consolidated Entity which have been recognised in the consolidated statement of financial position, is the carrying amount (refer to notes 7 and 15(a)).
The Consolidated Entity has a policy of assessing the creditworthiness of all potential customers and is not materially exposed to any one customer. The Consolidated Entity evaluates all customers’ perceived credit risk.
In relation to material bank deposits, the Consolidated Entity minimises credit risk by dealing with major financial institutions. The counterparty must have a stable, long-term credit rating that is a minimum of an “A” category (or equivalent) from a major rating agency. The amounts and other terms associated with bank deposits are formally reviewed monthly.
From time to time, the Consolidated Entity also makes loans to JVs, typically to fund development projects. In making its investment decisions, the Consolidated Entity will undertake a detailed assessment of the development feasibility and credit risks associated with the relevant counterparties.
During the current and prior year, credit risk arising from cash and cash equivalents, trade receivables, amounts and loans due from related parties and other receivables were not determined to be significant and no impairment losses were recognised.
The credit risks associated with derivative financial instruments are managed by:
+ transacting with multiple derivatives counterparties that have a long-term investment grade credit rating;
+ utilising International Swaps and Derivatives Association (“ISDA”) agreements with derivative counterparties in orderto limit exposure to credit risk through netting of amounts receivable and amounts payable to individualcounterparties (refer below); and
+ formal review of the mark to market position of derivative financial instruments by counterparty on a monthly basis.
Master netting or similar agreements
Goodman Group enters into derivative transactions under ISDA master netting off agreements. Under these agreements, where certain credit events occur (such as a default), all outstanding transactions under the agreement are terminated and a single net termination value is payable in full and final settlement.
(d) Fair values of financial instruments
Except for derivative financial instruments and investments in unlisted securities which are carried at fair value, the Consolidated Entity’s financial instruments are carried at cost or amortised cost. The carrying amounts of the Consolidated Entity’s financial instruments carried at cost or amortised cost were not materially different from their fair values as at 30 June 2019 and 2018.
(i) Fair value hierarchy
The table below analyses financial instruments carried at fair value, by valuation method (see note 1(g):
There were no transfers between the levels during the year.
Level 1 Level 2 Level 3 Total
$M $M $M $M
As at 30 June 2019
Investment in unlisted securities, at fair value - - 28.2 28.2
- - 28.2 28.2
Derivative financial liabilites - 6.7 - 6.7
- 6.7 - 6.7
As at 30 June 2018
Investment in unlisted securities, at fair value - - 21.5 21.5
- - 21.5 21.5
Goodman Logistics (HK) Limited and its subsidiaries Notes to the consolidated financial statements
for the year ended 30 June 2019
A43
Capital management (cont)
12 Financial risk management (cont)
(d) Fair values of financial instruments (cont)
(ii) Valuation techniques used to derive Level 2 and Level 3 fair values
The Level 2 derivative financial instruments held by the Consolidated Entity consist of CCIRS.
The fair value of derivative are determined using generally accepted pricing models which discount estimated future cash flows based on the terms and maturity of each contract and current market interest rates and/or foreign currency rates, adjusted for specific features of the instruments.
The fair value measurement for investment in unlisted securities has been categorised as a Level 3 fair value. The following table shows the valuation technique used in measuring fair value as well as the significant unobservable inputs used:
Type Valuation technique Significant unobservable inputs
Inter-relationship between significant unobservable inputs and fair value measurement
Equity securities - Goodman
JapanLimited
Discounted cash flows: The valuation model was determined by discounting the future cash flows expected to be generated from continuing operations. The future cash flows were based on fund and development forecasts and then estimating a year five terminal value using a terminal growth rate and an appropriate discount rate
+ Assets under managementof $4.3 billion in year five
+ Average annualdevelopment of 100,600 sqm
+ Five year terminal valuegrowth rate of 0.62%
+ Risk adjusted discount rateof 7.24% per annum
The estimated fair value would increase/(decrease) if:
+ the level ofdevelopment activity,assets undermanagement andterminal value growthrate werehigher/(lower); or
+ the risk adjusteddiscount rate werelower/(higher)
(iii) Reconciliation of Level 3 fair values
2019 2018
$M $M
Carrying amount at the beginning of the year 21.5 20.5
Acquisitions 1.8 -
Net change in fair value - included in other comprehensive income 3.0 -
Effect of foreign currency translation 1.9 1.0
Carrying amount at the end of the year 28.2 21.5
Goodman Logistics (HK) Limited and its subsidiaries Notes to the consolidated financial statements
for the year ended 30 June 2019
A44
Capital management (cont) 13 Dividends During the financial year, the Company declared a final dividend of 5.0 cents per share amounting to $90.7 million. The dividend is payable out of FY19 profit after tax. In the prior year, the Company declared a final dividend of 5.0 cents per share amounting to $90.0 million out of FY18 profit after tax. 14 Share capital (a) Ordinary shares Ordinary shares of the Company are classified as equity. Incremental costs directly attributable to issues of ordinary shares are recognised as a deduction from equity, net of any tax effects.
1. During the year, the Company issued 13,118,118 (2018: 11,642,734) shares to employees of Goodman Group under the Goodman
Group Long Term Incentive Plan (“LTIP”) and Goodman Group Tax Exempt Plan.
The holders of ordinary shares are entitled to receive dividends as declared from time to time and are entitled to one vote per share at meetings of the Company. All ordinary shares rank equally with regard to the Company’s residual assets.
2019 2018 2019 2018
$M $M
Share capital 1,813,881,995 1,800,763,877 696.6 675.2
Accumulated issue costs (0.6) (0.6)
Total issued capital 696.0 674.6
Share capital
Details Number of shares $M
Ordinary shares, issued and fully paid
Balance at 1 July 2017 1,789,121,143 661.7
Shares issued to employees of Goodman Group111,642,734 13.5
Balance at 30 June 2018 1,800,763,877 675.2
Shares issued to employees of Goodman Group113,118,118 21.4
Balance at 30 June 2019 1,813,881,995 696.6
Number of shares
Goodman Logistics (HK) Limited and its subsidiaries Notes to the consolidated financial statements
for the year ended 30 June 2019
A45
Capital management (cont) 14 Share capital (cont) (b) Equity settled share based payment transactions LTIP Goodman Group’s share based payments primarily relate to performance rights awarded to employees under the LTIP. These performance rights entitle an employee to either acquire Goodman Group securities for $nil consideration (equity settled performance rights) or, in certain jurisdictions, to receive an amount in cash equal to the value of the securities (cash settled performance rights), subject to the vesting conditions having been satisfied. During the year, the movement in the number of equity settled and cash settled performance rights under the LTIP was as follows:
Share based payments transactions The fair value of equity settled performance rights at the grant date is expensed with a corresponding increase in the employee compensation reserve over the vesting period. The expense is adjusted to reflect the actual number of performance rights for which the related service and non-market vesting conditions are expected to be met. The accumulated share based payments expense of performance rights which have vested or lapsed is transferred from the employee compensation reserve to retained earnings/(accumulated losses). The fair value of cash settled performance rights is also recognised as an expense but with a corresponding increase in liabilities over the vesting period. The expense is adjusted to reflect the actual number of performance rights for which the related service and non-market vesting conditions are expected to be met. The liability is remeasured at each reporting date and at the vesting date based on the fair value of the rights.
2019 2018
Outstanding at the beginning of the year 20,633,959 18,967,105
Issued 6,628,500 6,848,150
Vested (3,674,423) (3,418,555)
Forfeited (2,287,820) (1,762,741)
Outstanding at the end of the year 21,300,216 20,633,959
Exercisable at the end of the year - -
Number of rights
Goodman Logistics (HK) Limited and its subsidiaries Notes to the consolidated financial statements
for the year ended 30 June 2019
A46
Capital management (cont) 14 Share capital (cont) (b) Equity settled share based payment transactions (cont) The fair value of services received in return for performance rights granted under the LTIP is measured by reference to the fair value of the performance rights granted. The fair value of the performance rights granted during the year was measured as follows:
+ operating EPS tranche: these rights were valued as a granted call option, using the standard Black Scholes model with a continuous dividend/distribution yield; and
+ Relative TSR tranche: these rights were valued using a Monte Carlo model which simulated total returns for each of the ASX 100 stocks and discounted the future value of any potential future vesting performance rights to arrive at a present value. The model uses statistical analysis to forecast total returns, based on expected parameters of variance and co-variance.
The model inputs for performance rights, both equity and cash settled, awarded during the current financial year included the following:
Share based payment expense included in profit or loss was as follows:
At 30 June 2019, a liability of $44.9 million (2018: $22.1 million) was recognised in relation to cash settled performance rights.
Rights issued on Rights issued on
15 Nov 2018 28 Sep 2018
Fair value at measurement date ($) 8.72 8.52
Security price ($) 10.33 10.36
Exercise price ($) - -
Expected volatility (%) 18.27 18.65
Rights' expected weighted average life (years) 3.8 3.9
Dividend/distribution yield per annum (%) 2.71 2.70
Average risk free rate of interest per annum (%) 2.26 2.21
2019 2018
$M $M
Share based payment expense:
- Equity settled 18.6 13.7
- Cash settled 36.2 14.7
54.8 28.4
Goodman Logistics (HK) Limited and its subsidiaries Notes to the consolidated financial statements
for the year ended 30 June 2019
A47
Other items
15 Notes to the consolidated cash flow statement
Cash and cash equivalents comprise cash balances and call deposits with original maturities of three months or less.
(a) Reconciliation of cash
Cash as at the end of the year as shown in the consolidated cash flow statement is reconciled to the related items in the consolidated statement of financial position as follows:
(b) Reconciliation of profit for the year to net cash provided by operating activities
2019 2018
$M $M
Cash assets 212.7 115.5
2019 2018
$M $M
Profit for the year 403.6 267.9
Items classified as investing activities
Net gain on disposal of equity accounted investments (4.8) (0.7)
Non-cash items
Depreciation of plant and equipment 2.0 2.5
Share based payments expense 54.8 28.4
Share of net results of equity accounted investments (221.2) (104.0)
Net finance expense 33.0 21.3
Income tax expense 57.6 26.7
325.0 242.1
Changes in assets and liabilities during the year:
- (Increase)/decrease in receivables (121.8) 158.5
- Increase in inventories (91.6) (29.5)
- Decrease/(increase) in other assets 2.5 (6.7)
- Increase in payables 90.9 44.4
- (Decrease)/increase in provisions (including employee benefits) (0.3) 4.1
204.7 412.9
Dividends/distributions received from equity accounted investments 52.0 34.5
Net finance costs (paid)/received (0.2) 0.4
Net income taxes paid (18.0) (26.1)
Net cash provided by operating activities 238.5 421.7
Goodman Logistics (HK) Limited and its subsidiaries Notes to the consolidated financial statements
for the year ended 30 June 2019
A48
Other items (cont)
15 Notes to the consolidated cash flow statement (cont)
(c) Reconciliation of liabilities arising from financing activities
16 Reserves
1. The common control reserve arises from the acquisition of entities from other members of Goodman Group under the pooling ofinterest method. The amount in the common control reserve reflects the difference between the consideration paid and the carryingvalues of the assets and liabilities of the “acquired” entity at the date of acquisition.
Derivatives
used for
hedging
Dividends
payable
Loans
to/(from)
related
$M $M $M
Balance at 1 July 2018 - (90.0) (474.0)
Changes from financing cash flows
Net proceeds from loans with related parties - - (78.5)
Distributions paid - 90.0 -
Total changes from financing cash flows - 90.0 (78.5)
Goodman Logistics (HK) Limited and its subsidiaries Notes to the consolidated financial statements
for the year ended 30 June 2019
A49
Other items (cont) 16 Reserves (cont) The movements in reserves of the Consolidated Entity and the Company are analysed below:
17 Retained earnings
18 Investments in subsidiaries
The following list contains only the particulars of subsidiaries which principally affected the results, assets or liabilities of the Consolidated Entity. The class of shares held is ordinary unless otherwise stated.
2019 2018 2019 2018
$M $M $M $M
(a) Asset revaluation reserve
Balance at the beginning of the year 11.2 11.2 11.2 11.2
Increase due to revaluation of other financial assets 3.0 - 3.0 -
Balance at the end of the year 14.2 11.2 14.2 11.2
(b) Foreign currency translation reserve
Balance at the beginning of the year 46.3 (37.7) - -
Net exchange differences on conversion of foreign operations 2.0 84.0 - -
Balance at the end of the year 48.3 46.3 - -
(c) Employee compensation reserve
Balance at the beginning of the year 21.0 15.9 21.0 15.9
Equity settled share based payment transactions 7.2 5.1 7.2 5.1
Balance at the end of the year 28.2 21.0 28.2 21.0
(d) Common control reserve
Balance at the beginning of the year (538.1) (538.1) - -
Balance at the end of the year (538.1) (538.1) - -
Consolidated Company
2019 2018 2019 2018
Note $M $M $M $M
Balance at the beginning of the year 726.6 554.0 229.7 97.6
Profit for the year 398.9 262.6 114.7 222.1
Dividends declared 13 (90.7) (90.0) (90.7) (90.0)
Balance at the end of the year 1,034.8 726.6 253.7 229.7
Consolidated Company
Country of 2019 2018
Significant controlled companies Principal activities incorporation % %
Goodman Asia Limited Investment and property management services Hong Kong 100.0 100.0
Goodman China Limited Property management and development
Goodman UK Holdings (HK) Limited Intermediate holding company United Kingdom 100.0 100.0
Interest held
Goodman Logistics (HK) Limited and its subsidiaries Notes to the consolidated financial statements
for the year ended 30 June 2019
A50
Other items (cont)
19 Related party transactions
Related parties
(i) A person, or a close member of that person’s family, is related to the Company if that person:(1) has control or joint control over the Company;(2) has significant influence over the Company; or(3) is a member of the key management personnel of the Company or the Company’s parent.
(ii) An entity is related to the Company if any of the following conditions applies:(1) the entity and the Company are members of the same group (which means that each parent, subsidiary and
fellow subsidiary is related to the others);(2) one entity is an associate or JV of the other entity (or an associate or JV of a member of a group of which
the other entity is a member);(3) both entities are JVs of the same third party;(4) one entity is a JV of a third entity and the other entity is an associate of the third entity;(5) the entity is a post-employment benefit plan for the benefit of employees of either the Company or an entity
related to the Company;(6) the entity is controlled or jointly controlled by a person identified in (i);(7) a person identified in (i)(1) has significant influence over the entity or is a member of the key management
personnel of the entity (or of a parent of the entity); or(8) the entity, or any member of a group of which it is a part, provides key management personnel services to
the Company or the Company’s parent.
Close members of the family of a person are those family members who may be expected to influence, or be influenced by, that person in their dealings with the entity.
(a) Directors’ remuneration
Directors’ remuneration (including alternate directors) disclosed pursuant to section 383(1) of the Hong Kong Companies Ordinance and Part 2 of the Companies (Disclosure of Information about Benefits of Directors) Regulation is as follows:
1. Gregory Goodman and Daniel Peeters were appointed directors on 1 February 2018. The figures disclosed include their remunerationfor the period from 1 February 2018 to 30 June 2018.
(b) Transactions and amounts due from related parties
1. Includes contract assets arising from transactions with related parties.
2019 20181
$M $M
Directors' fees 0.6 0.7
Salaries, allowances and benefits in kind 3.7 1.7
Share based payments 14.8 6.9
19.1 9.3
2019 2018 2019 2018
$M $M $M $M
JVs
GCLP 58.6 54.4 34.9 29.6
KGG 52.5 140.2 - -
111.1 194.6 34.9 29.6
Related parties of GL and GIT
Goodman Hong Kong Logistics Partnership 191.8 56.0 194.3 37.0
Goodman European Partnership 441.9 320.9 44.4 30.0
Other related parties 6.7 4.9 3.5 5.5
640.4 381.8 242.2 72.5
Amounts due from
related parties1
Management and
development activities
Goodman Logistics (HK) Limited and its subsidiaries Notes to the consolidated financial statements
for the year ended 30 June 2019
A51
Other items (cont)
19 Related party transactions (cont)
(b) Transactions and amounts due from related parties (cont)
Transactions with GL During the year, the Consolidated Entity recognised transaction management fees of $97.4 million (2018: $22.6 million), which will be payable to a controlled entity of GL in FY20. In the comparative year, the Consolidated Entity acquired an additional 4.0% equity interest in GJDP from a controlled entity of GL for consideration of $3.1 million.
(c) Financing arrangements with related parties
1. Loans by the Consolidated Entity to/from JVs and other related parties have generally been provided on an arm’s length basis. At30 June 2019, details in respect of the principal loan balances are set out below:
+ loans to GIT and its subsidiaries amounting to $408.0 million (2018: $361.3 million) are interest bearing and repayable ondemand. The interest bearing loans incur interest at rates ranging from 0.7% to 1.0% per annum (2018: 0.7% to 1.6% perannum)
+ loans from GL, GIT and their controlled entities are interest bearing and amount to $1,102.4 million (2018: $897.0 million).$851.7 million of the loans is repayable on demand and $250.7 million is repayable greater than one year from the reportingdate. The interest bearing loans incur floating interest at rates ranging from 1.6% to 5.0% per annum (2018: 0.9% to 5.9% perannum); and
+ a shareholder loan of $3.6 million (2018: $21.2 million) was provided to Goodman Pyrite Logistics (Lux) Sàrl, a controlled entityof Goodman European Partnership, and incurred interest at 6.9% per annum (2018: 6.9% per annum).
2019 2018 2019 2018 2019 2018
$M $M $M $M $M $M
JVs 78.5 40.5 - - 0.3 0.3
GL, GIT and their controlled entities 408.0 361.3 (1,102.4) (897.0) (33.7) (28.4)
Related parties of GL and GIT
Goodman European Partnership 3.6 21.2 - - - 0.4
Related parties of GL and GIT 3.6 21.2 - - - 0.4
490.1 423.0 (1,102.4) (897.0) (33.4) (27.7)
Loans from related
parties 1
Interest
income/(expense)
charged on loans
to/from related parties
Loans to related
parties 1
Goodman Logistics (HK) Limited and its subsidiaries Notes to the consolidated financial statements
for the year ended 30 June 2019
A52
Other items (cont)
20 Commitments
Non-cancellable lease commitments
At 30 June 2019, the Consolidated Entity was also committed to $274.8 million (2018: $191.6 million) expenditure in respect of inventories and other development activities.
21 Contingencies
Capitalisation Deed Poll GLHK, GL, GIT and certain of their wholly-owned controlled entities are “investors” under a Capitalisation Deed Poll (CDP) dated 23 May 2007. Under the CDP, each investor undertakes to pay to the relevant controlled entity borrower (borrower) any amounts owing under finance documents for the purpose of the CDP when the borrower fails to make a payment. Any payments by an investor to a borrower will be by way of loan to, or proceeds for the subscription of equity in, the borrower by the investor.
United States and Reg S senior notes Under the issue of notes in the United States 144A/Reg S bond market, controlled entities of GIT had on issue USD and EUR notes amounting to US$1,303.8 million and €500.0 million respectively. GL, Goodman Funds Management Limited, as responsible entity of GIT, and GLHK have unconditionally and irrevocably guaranteed on a joint and several basis the payment of principal and interest in respect of each of the notes.
2019 2018
$M $M
Future operating lease commitments not provided for in the financial statements and
payable:
- Within one year 9.1 7.4
- One year or later and no later than five years 12.9 14.3
- Later than five years - 0.4
22.0 22.1
Future commitments in respect of development land leased by the Consolidated Entity
and held as inventories. These amounts are not provided for in the financial statements
and payable:
- Within one year 1.1 1.8
- One year or later and no later than five years 4.6 11.0
- Later than five years 35.6 101.4
41.3 114.2
Goodman Logistics (HK) Limited and its subsidiaries Notes to the consolidated financial statements
for the year ended 30 June 2019
A53
Other items (cont)
22 Company level statement of financial position
The company level statement of financial position was approved and authorised for issue by the board of directors on 23 August 2019.
Ian Douglas Ferrier, AM David Jeremy Collins Director Director
23 Subsequent events
On 19 August 2019, the Consolidated Entity acquired a number of entities operating in the United Kingdom from Goodman Limited for consideration of GBP 1.8 million.
Other than the matter discussed above, there has not arisen in the interval between the end of the financial year and the date of this report any item, transaction or event of a material and unusual nature likely, in the opinion of the Directors, to affect significantly the operations of the Consolidated Entity, the results of those operations, or the state of affairs of the Consolidated Entity, in future financial years.
2019 2018
Note $M $M
Current assets
Cash 106.0 37.9
Receivables 258.0 226.0
Total current assets 364.0 263.9
Non-current assets
Investments in subsidiaries 793.5 721.2
Other financial assets 182.7 140.5
Total non-current assets 976.2 861.7
Total assets 1,340.2 1,125.6
Current liabilities
Payables - 0.2
Dividends payable 90.7 90.0
Total current liabilities 90.7 90.2
Non-current liabilities
Payables 250.7 98.9
Other financial liabilities 6.7 -
Total non-current liabilities 257.4 98.9
Total liabilities 348.1 189.1
Net assets 992.1 936.5
Equity attributable to Shareholders
Share capital 696.0 674.6
Reserves 16 42.4 32.2
Retained earnings 17 253.7 229.7
Total equity attributable to Shareholders 992.1 936.5


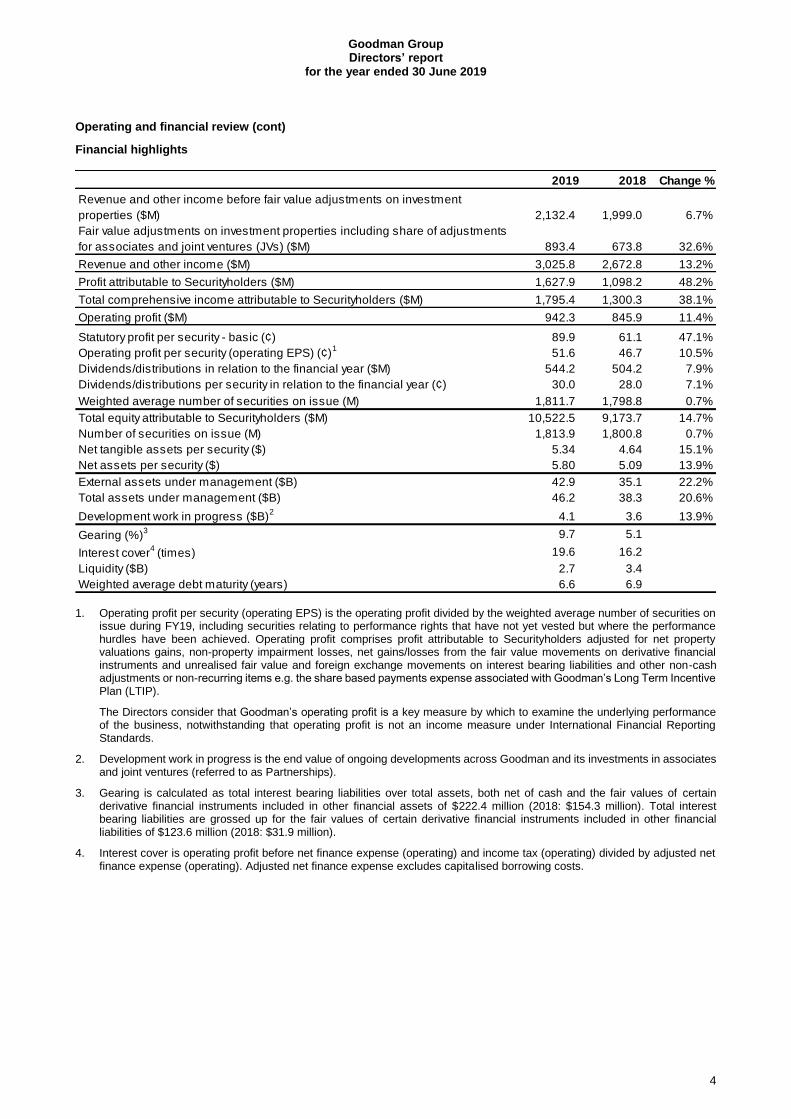


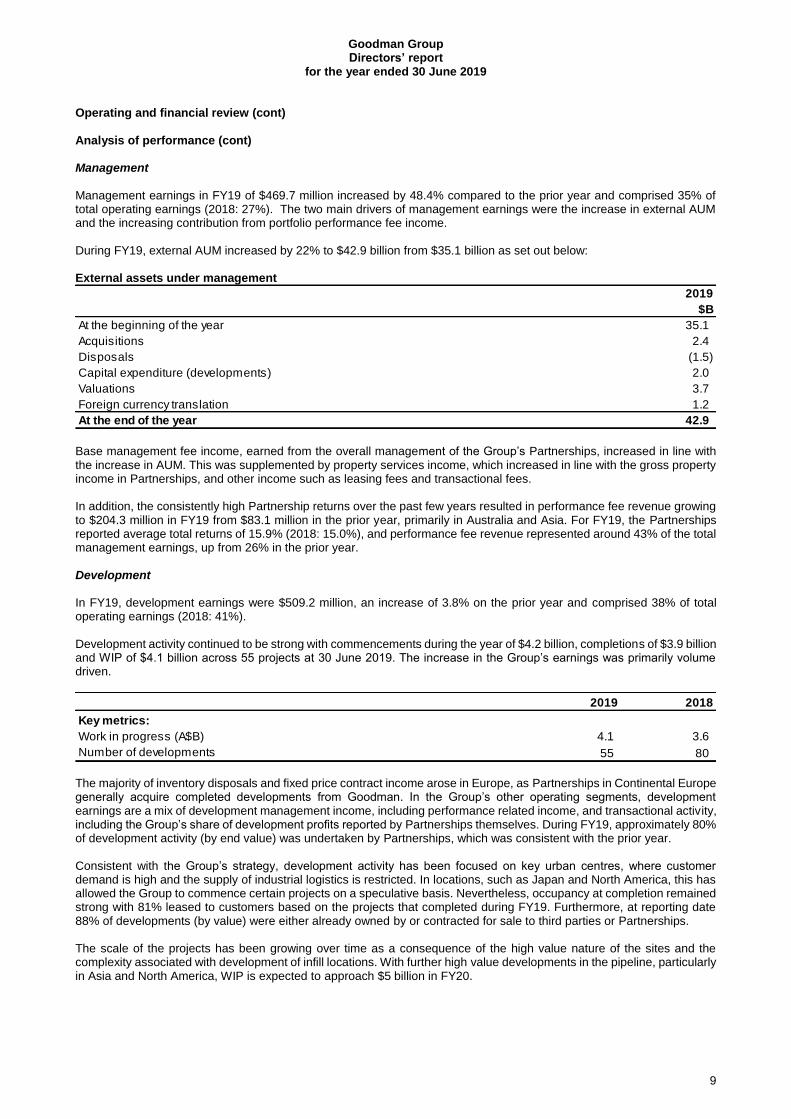


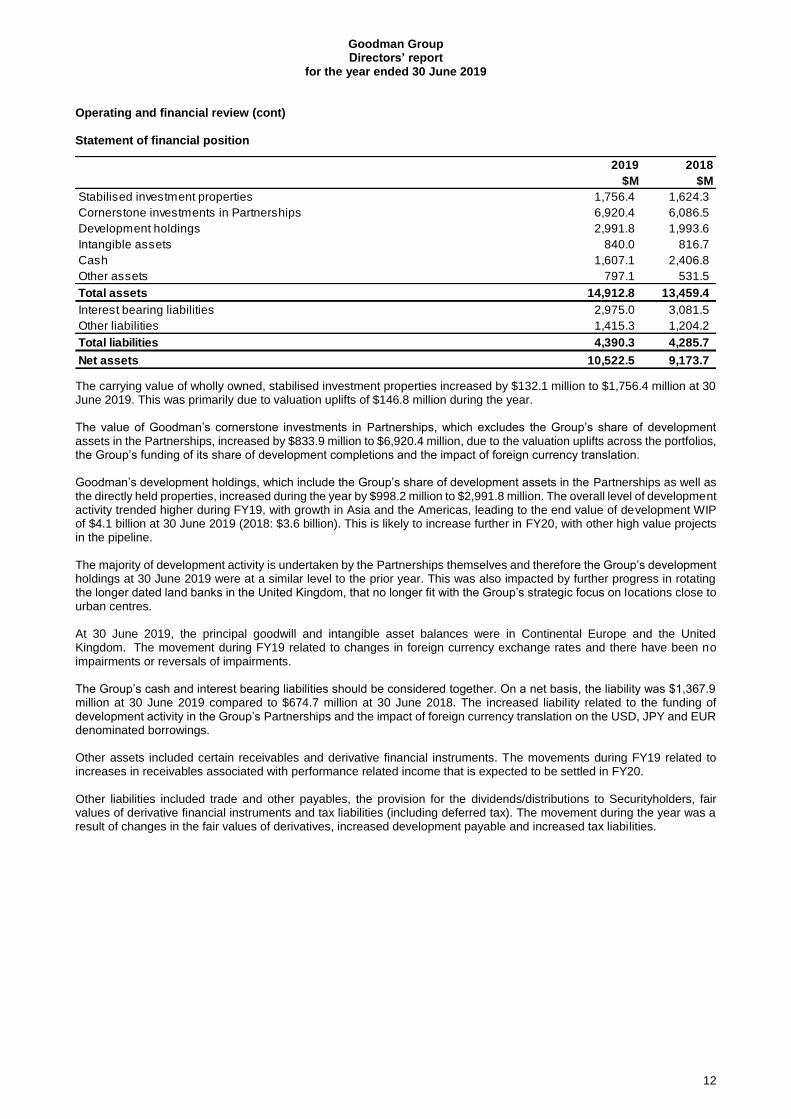
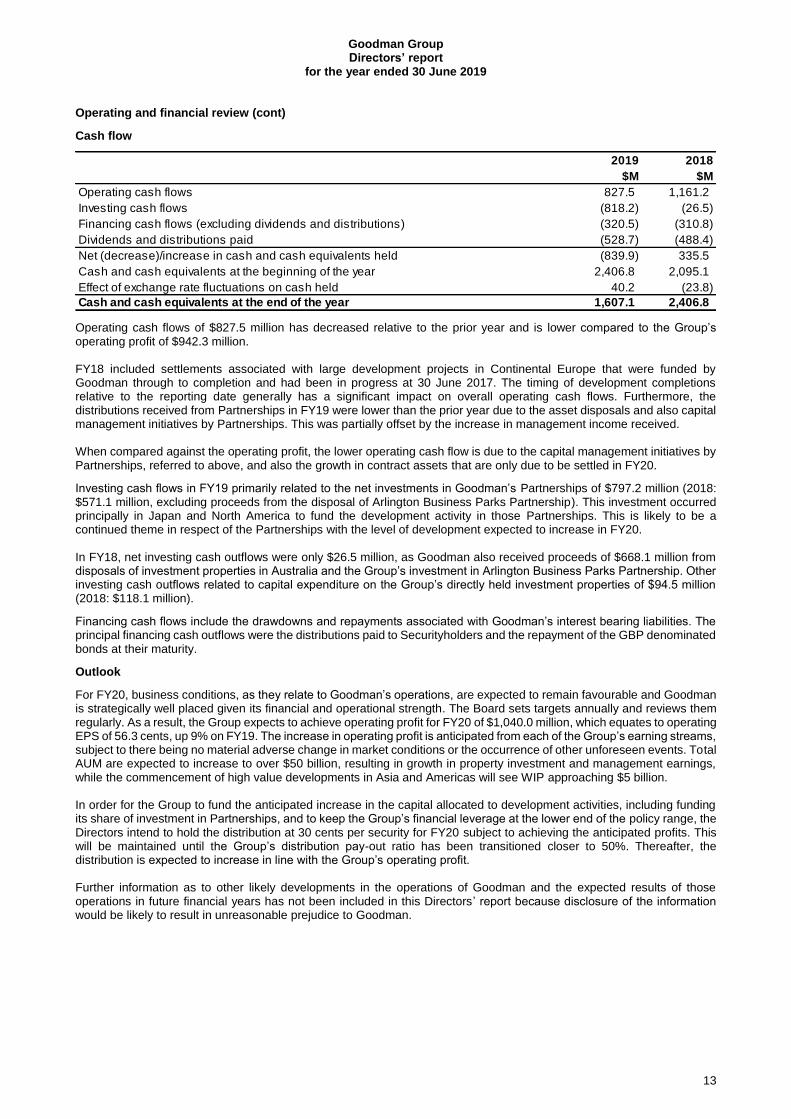


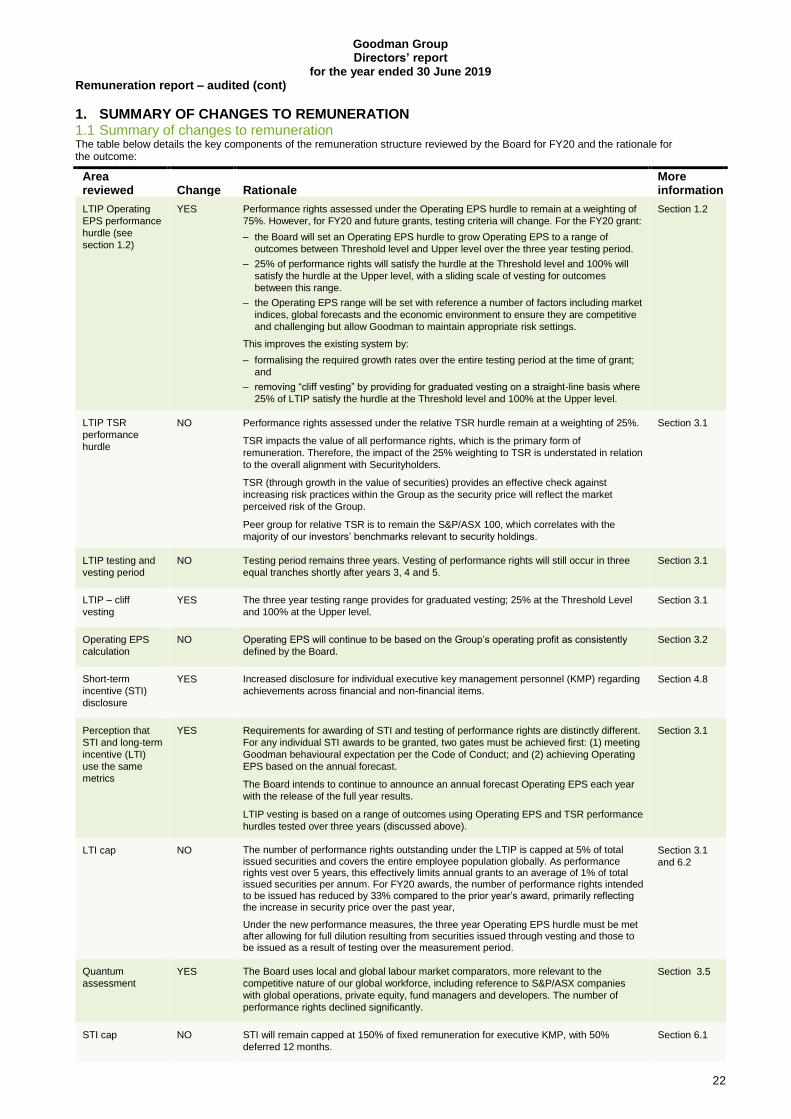


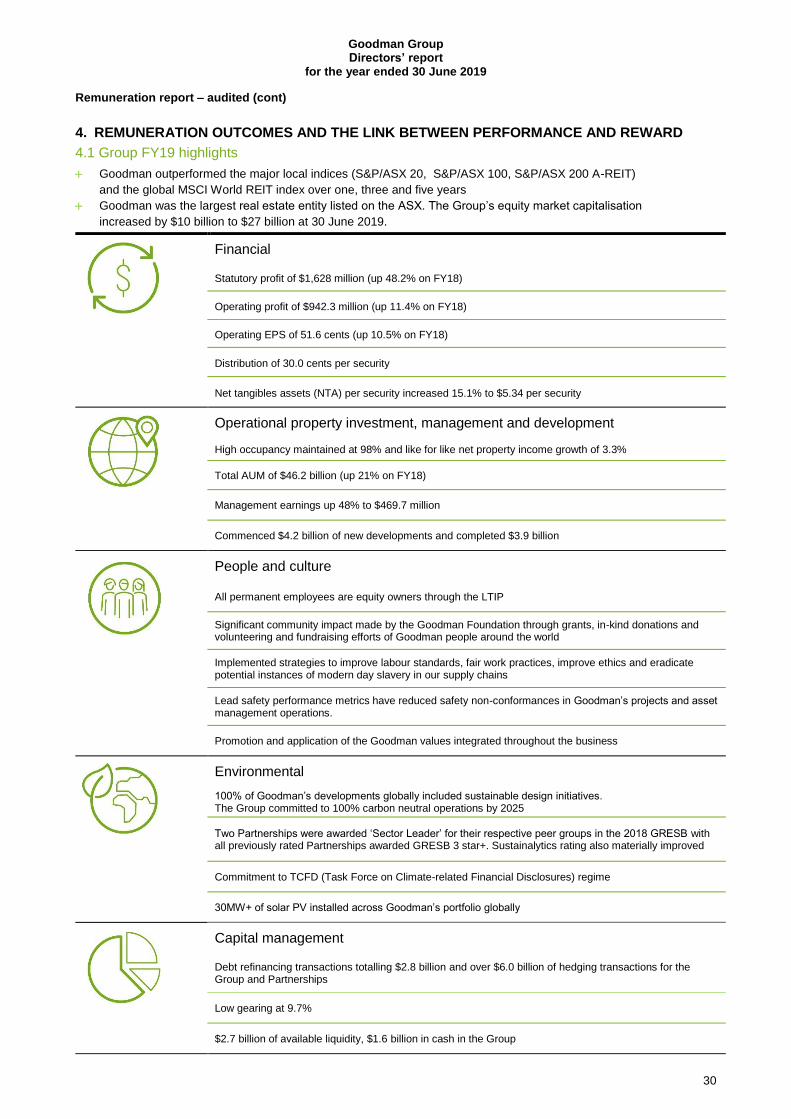


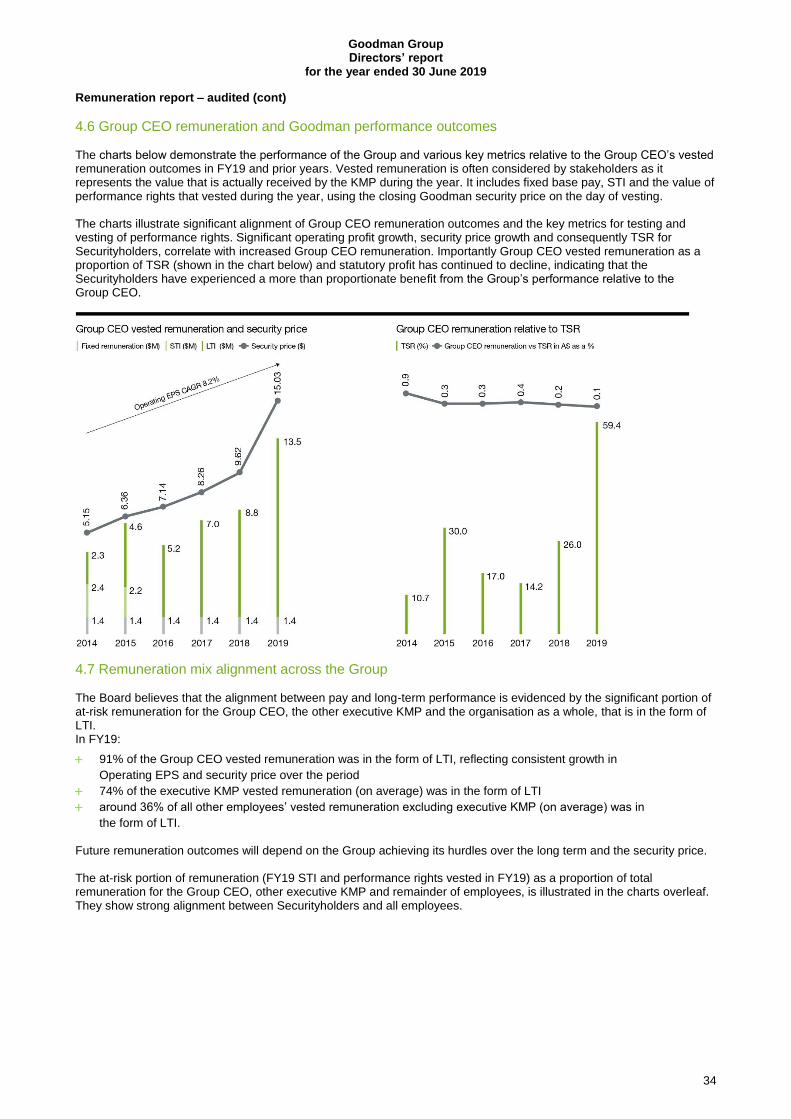


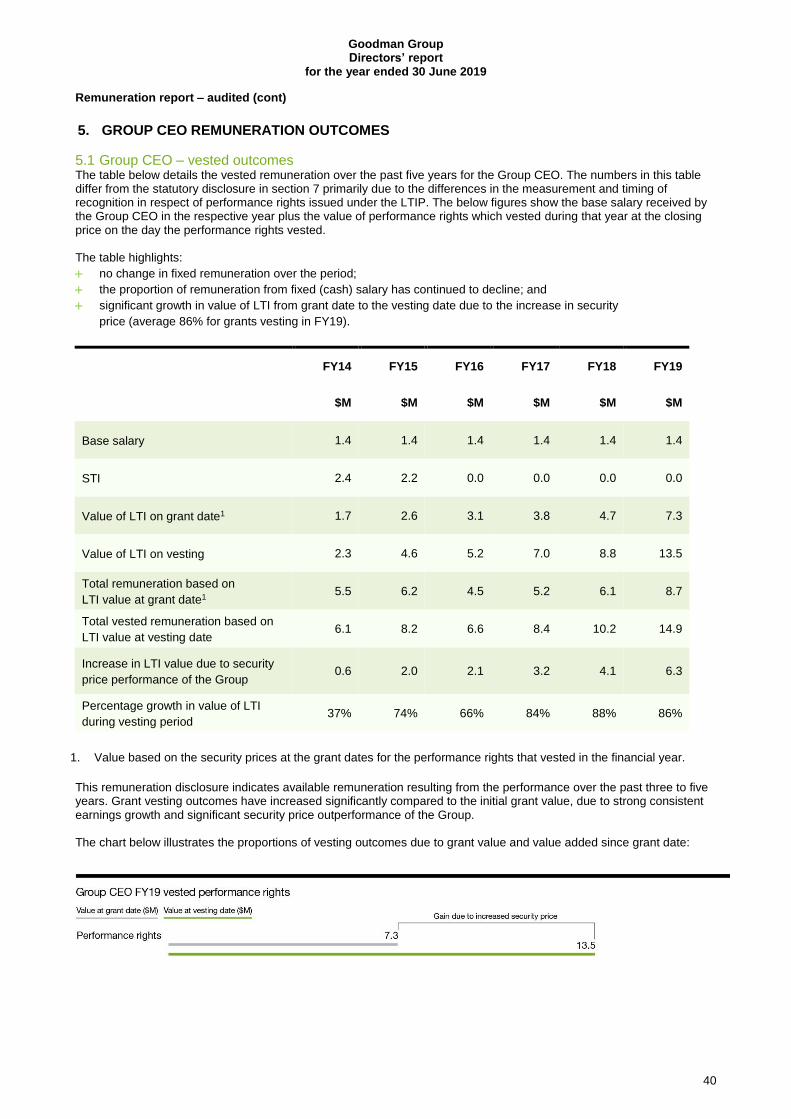

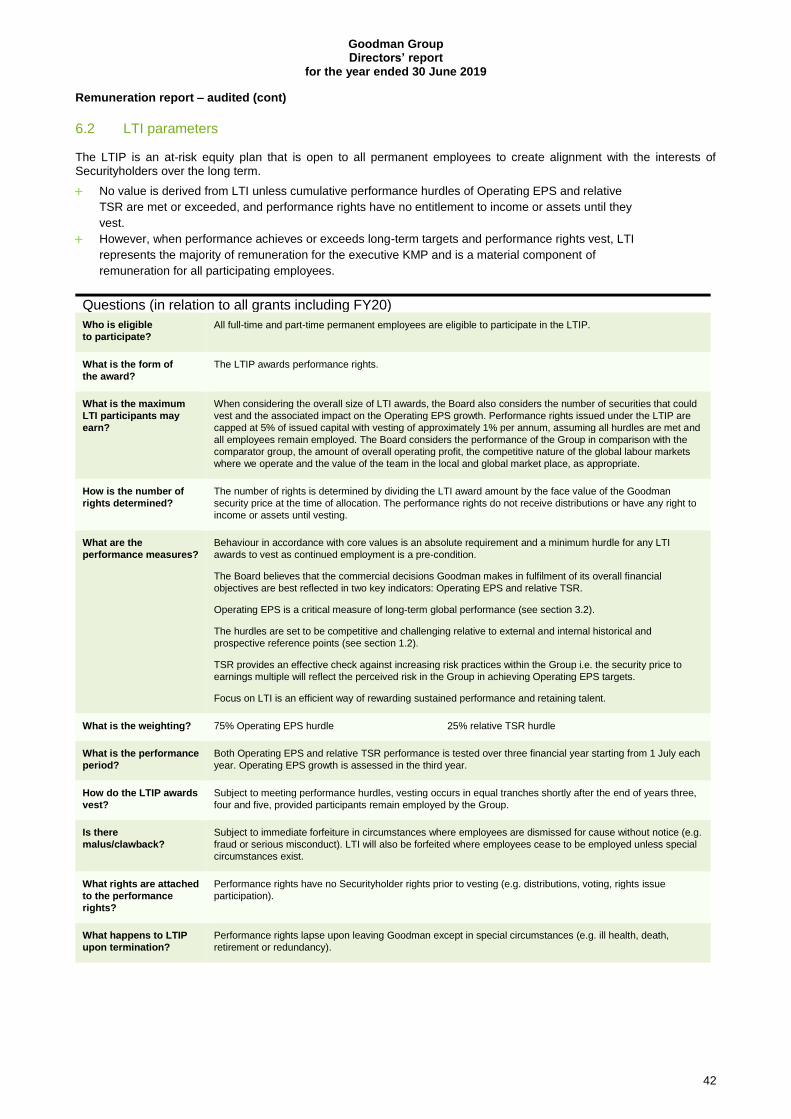


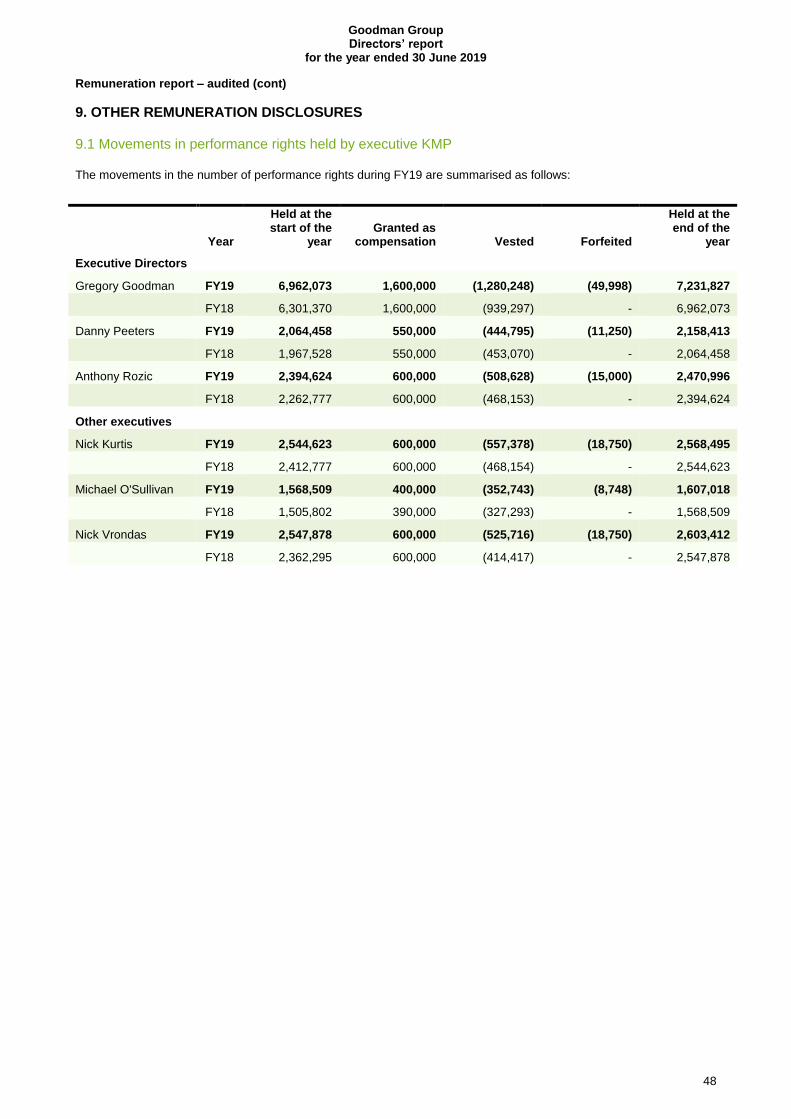


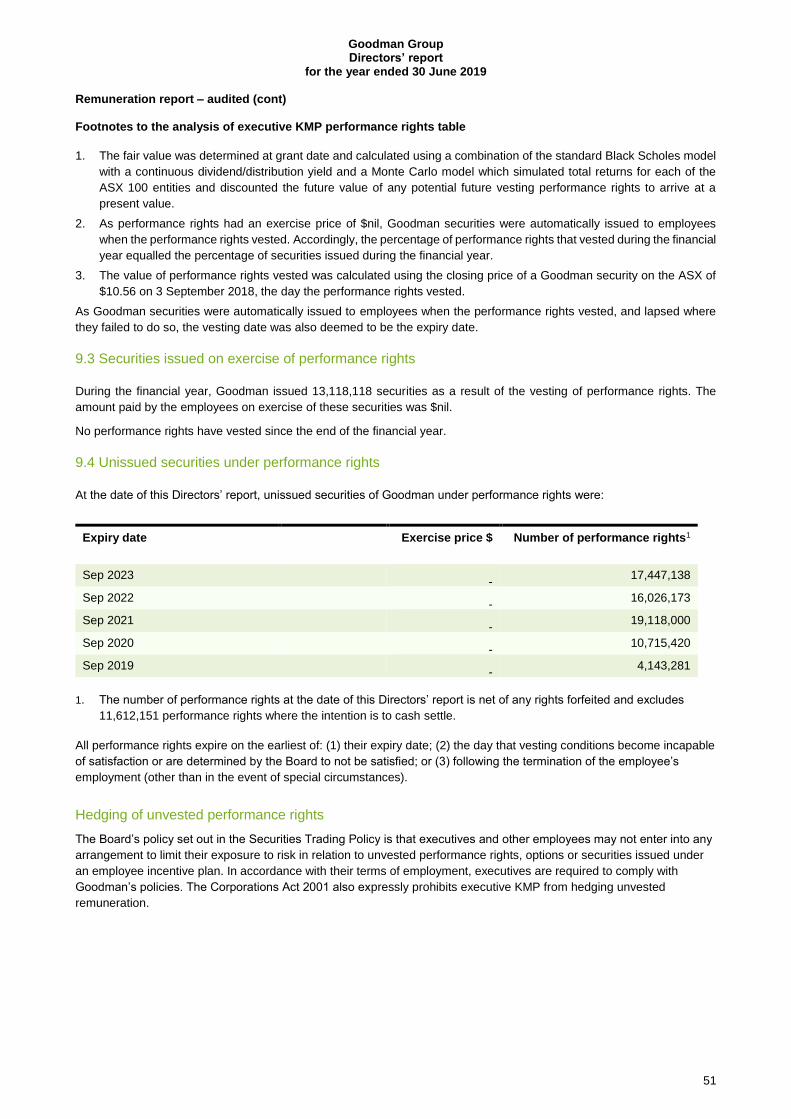


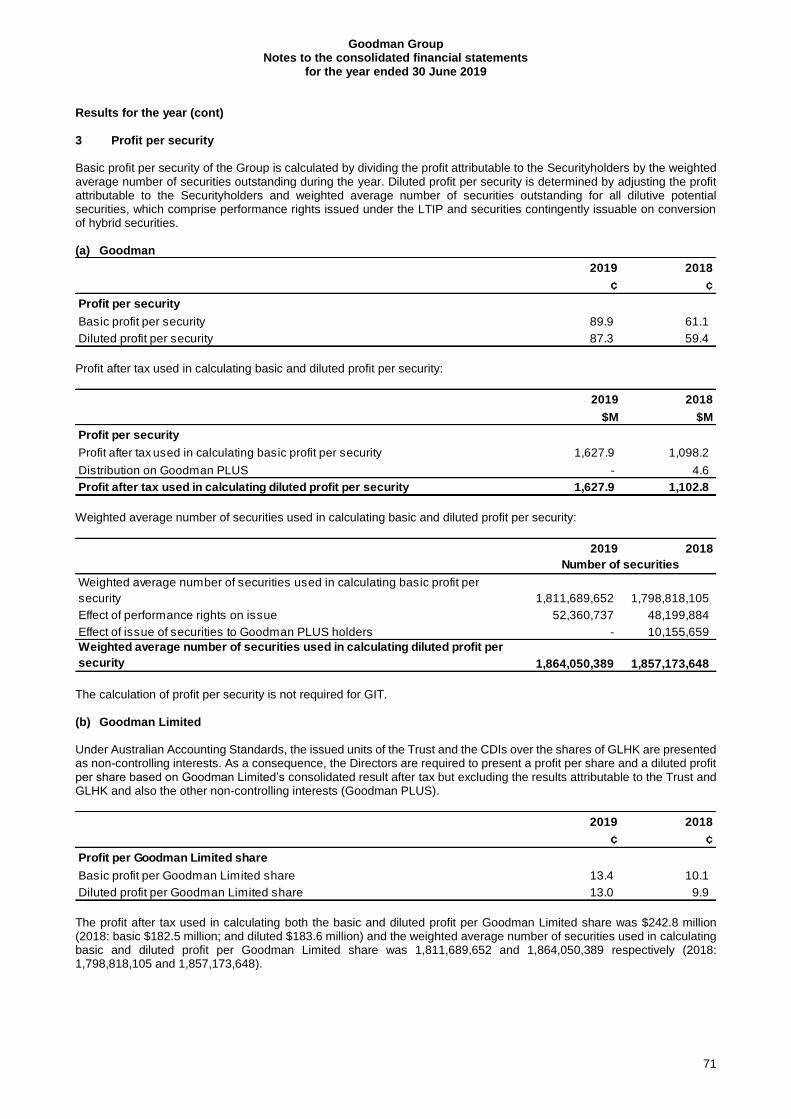


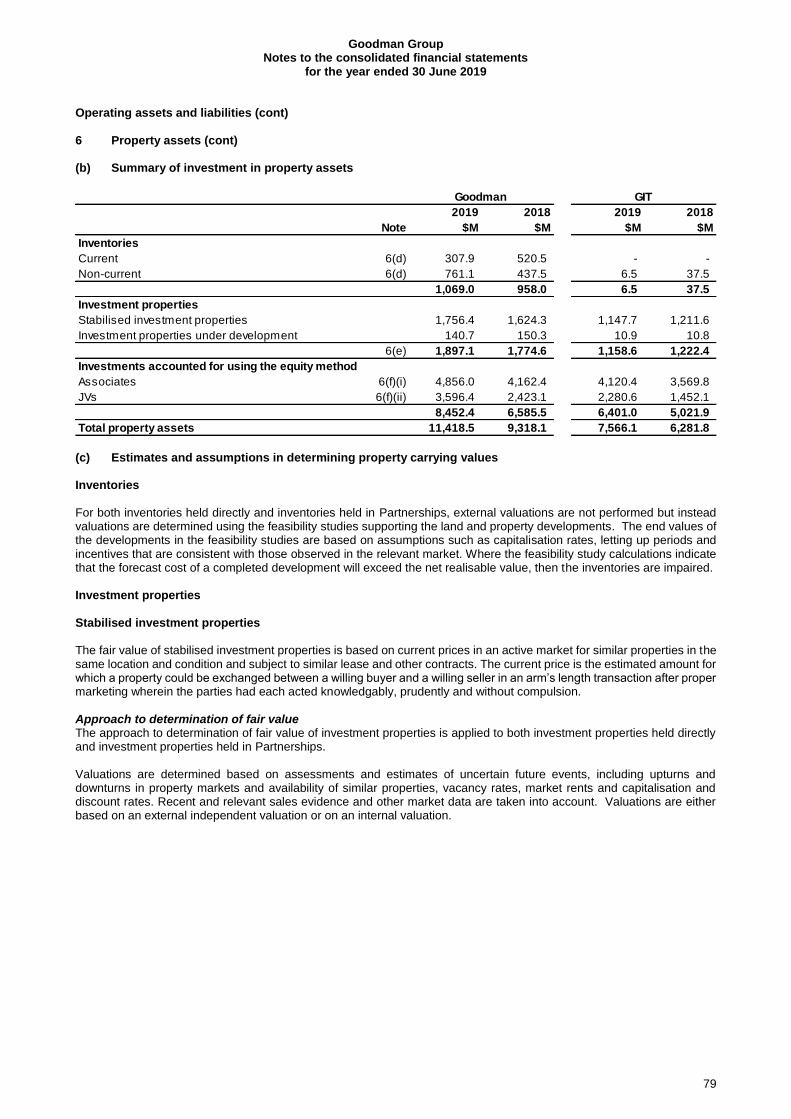

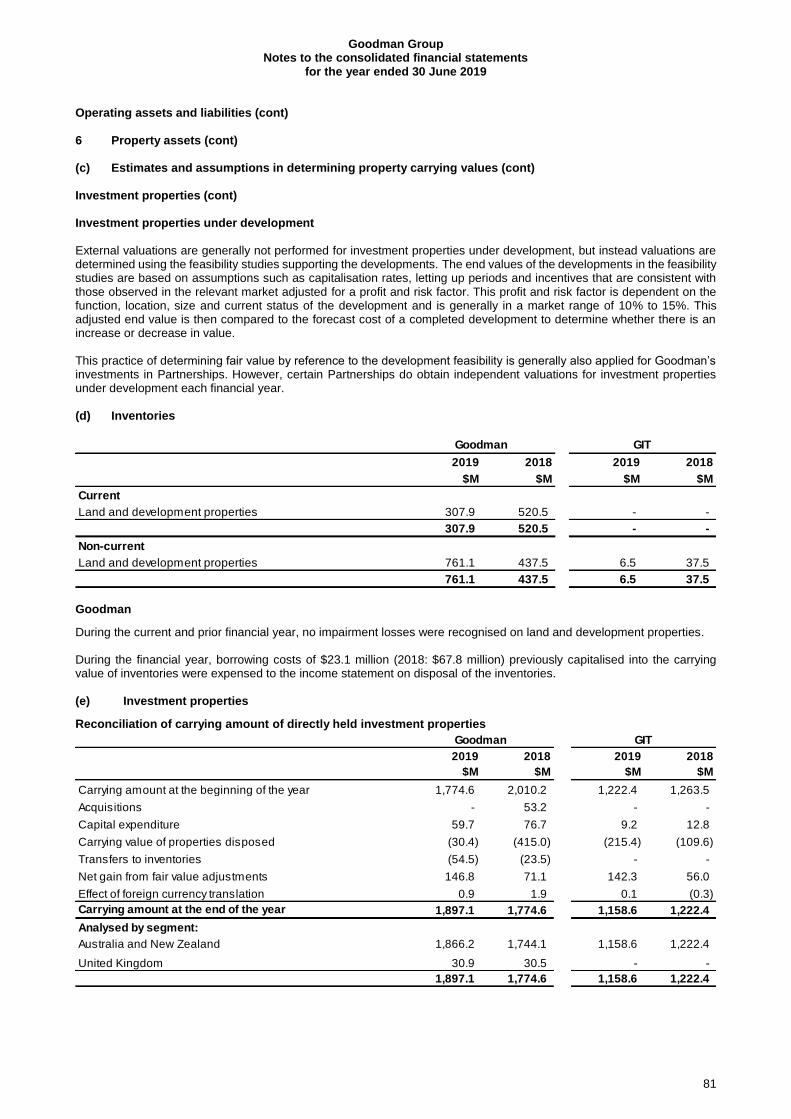
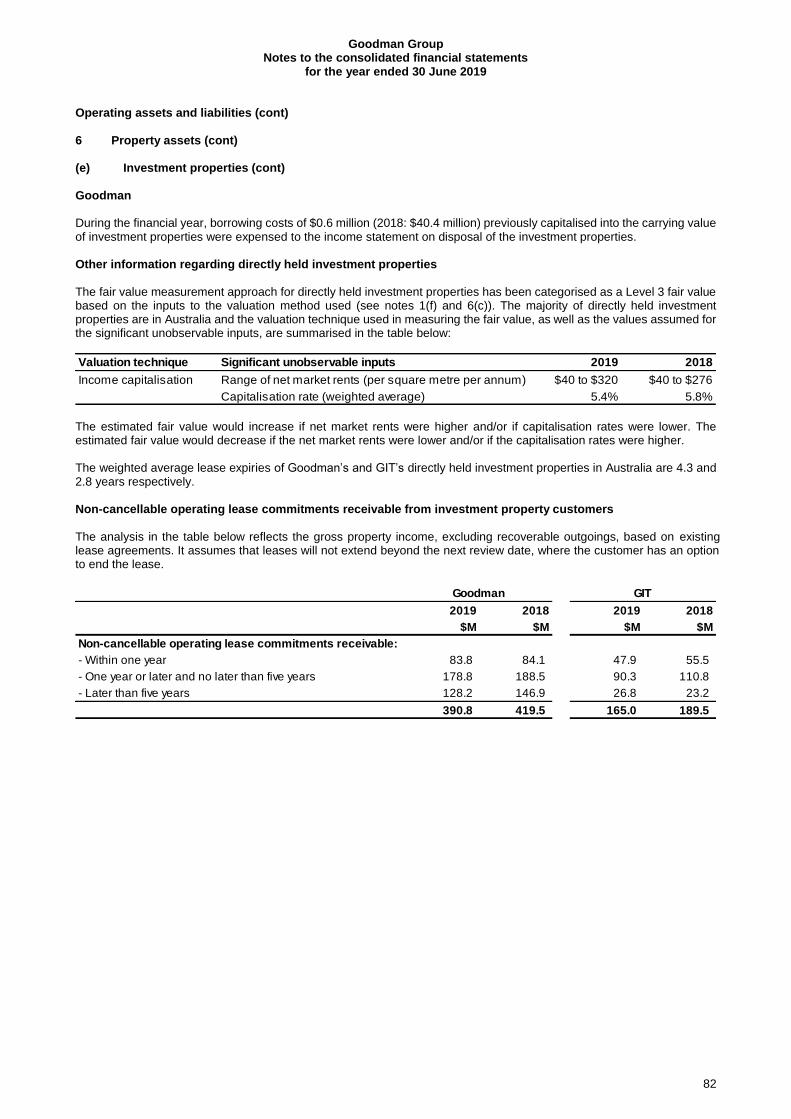
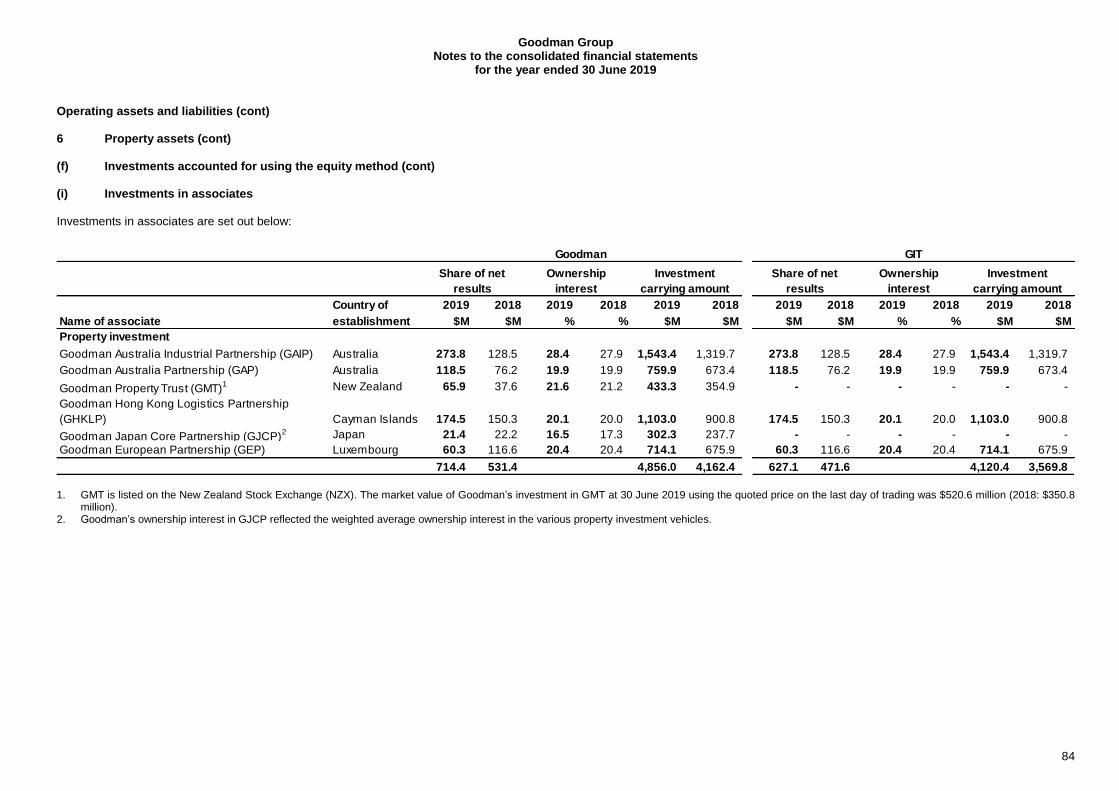

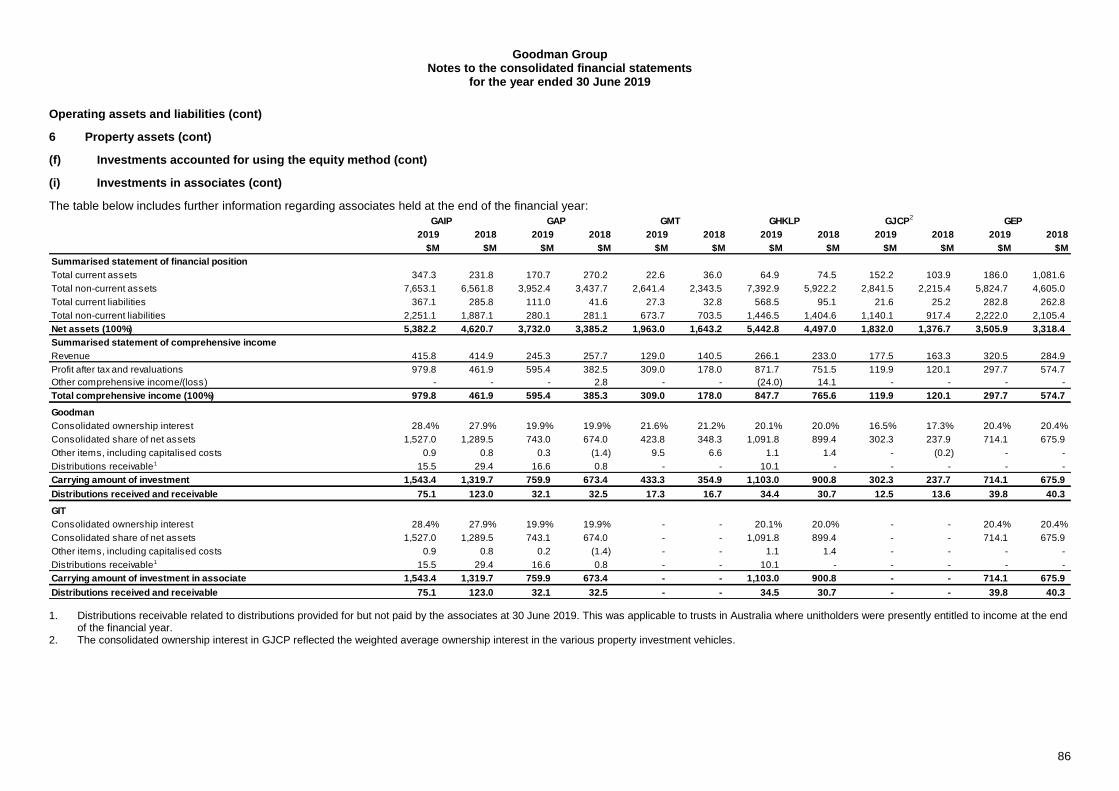


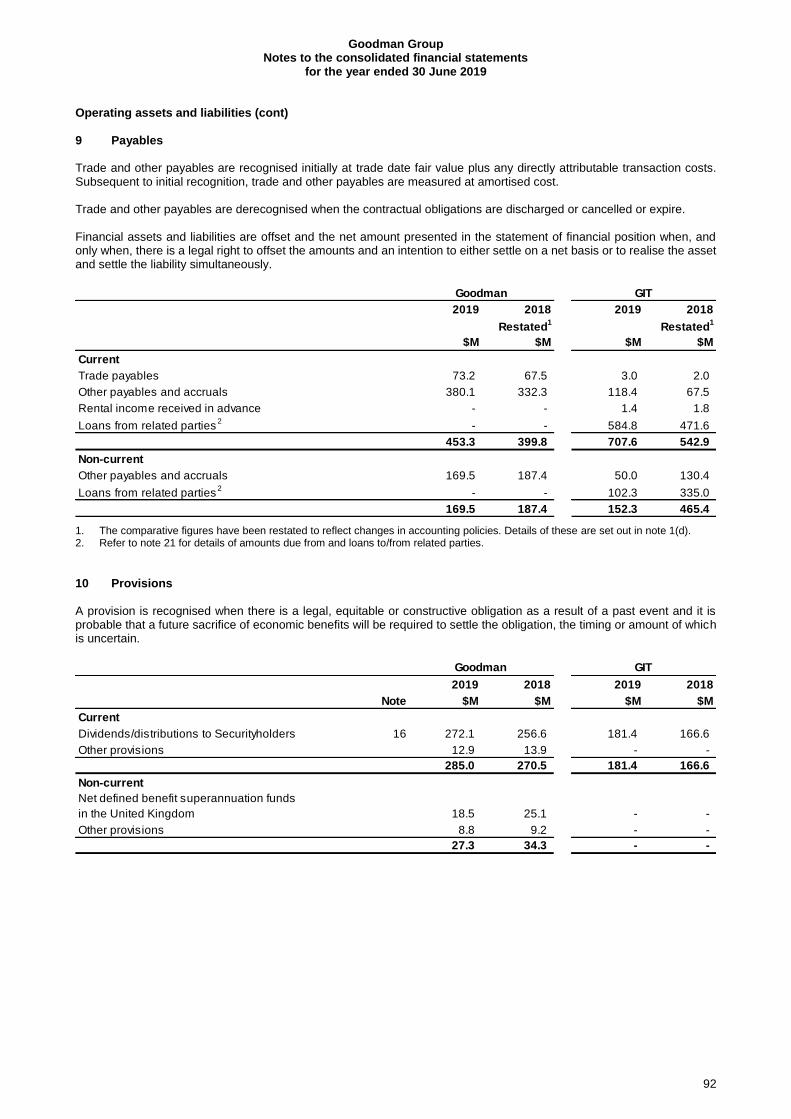


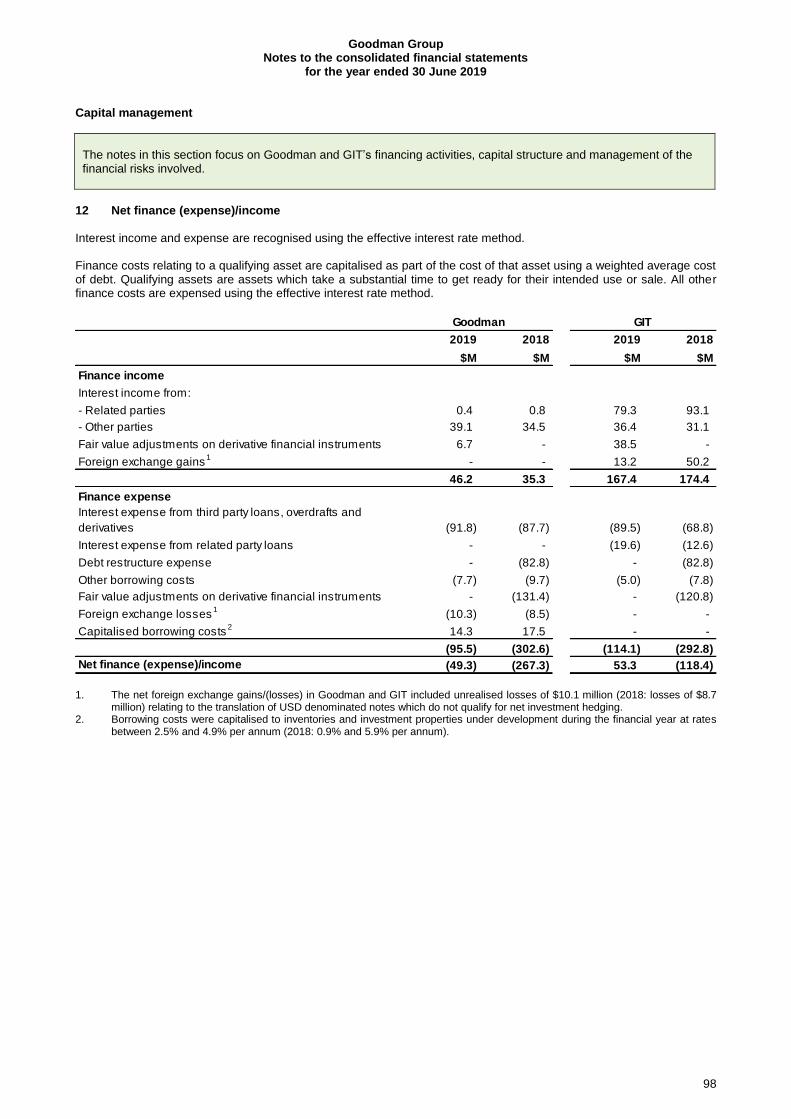


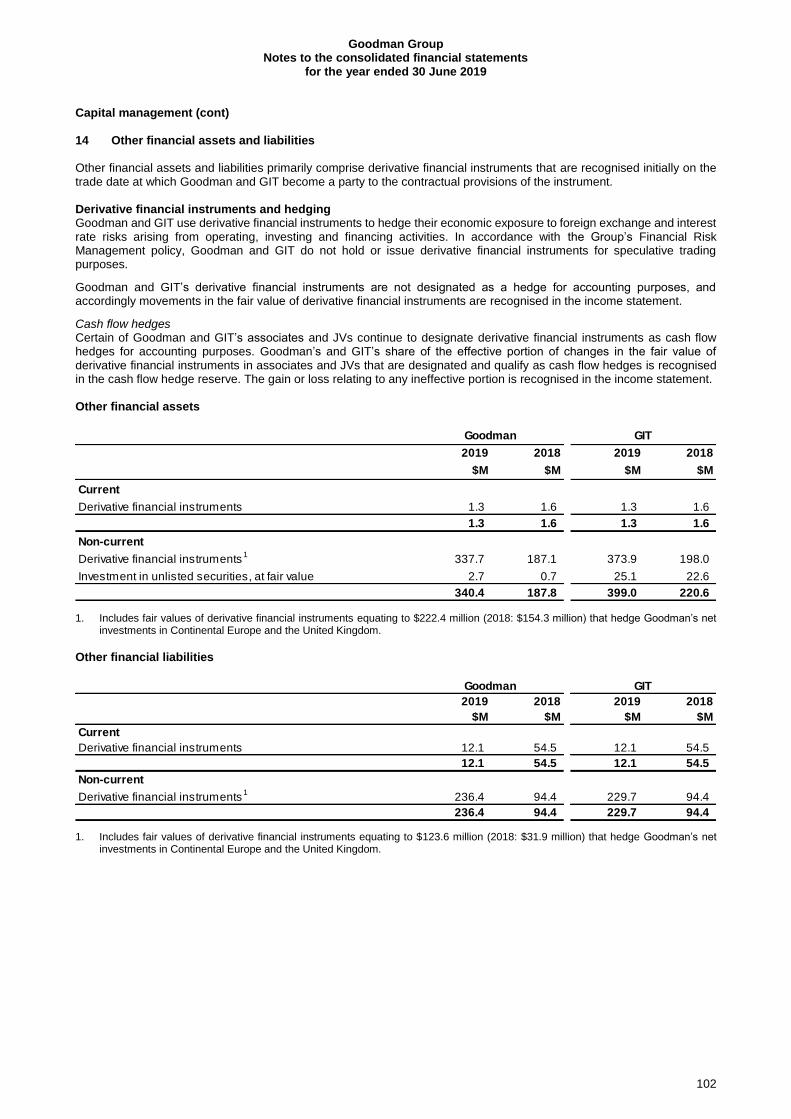


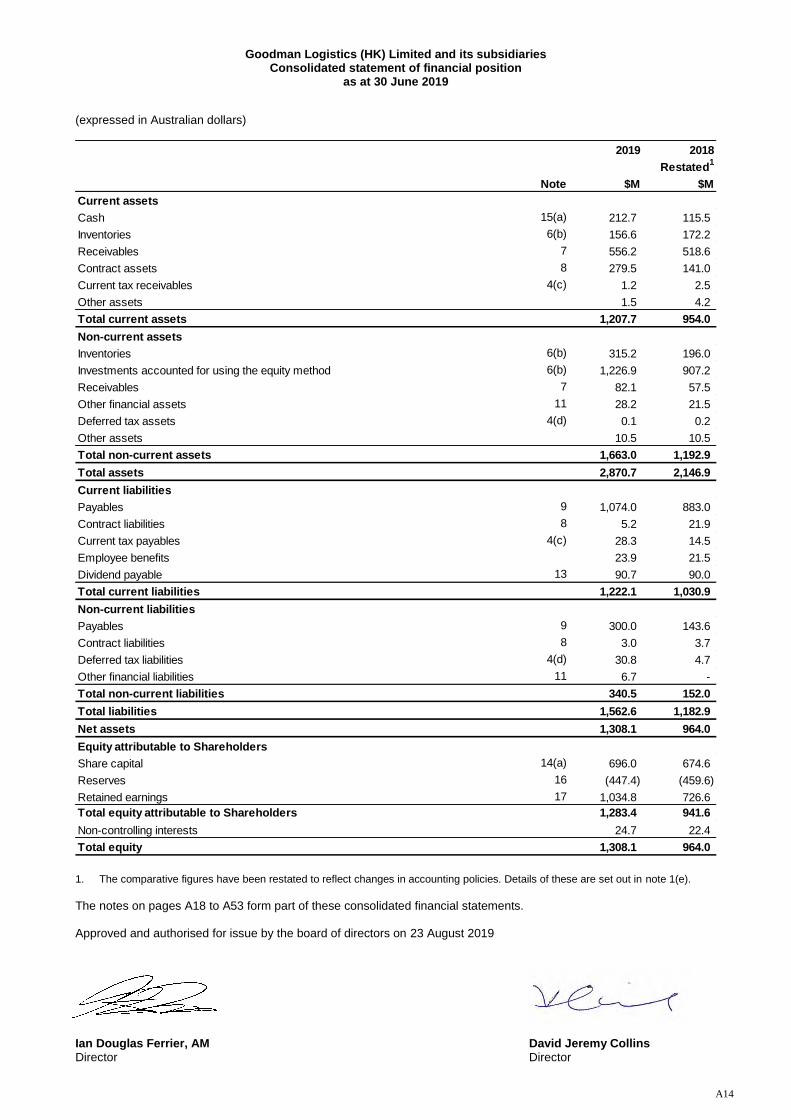


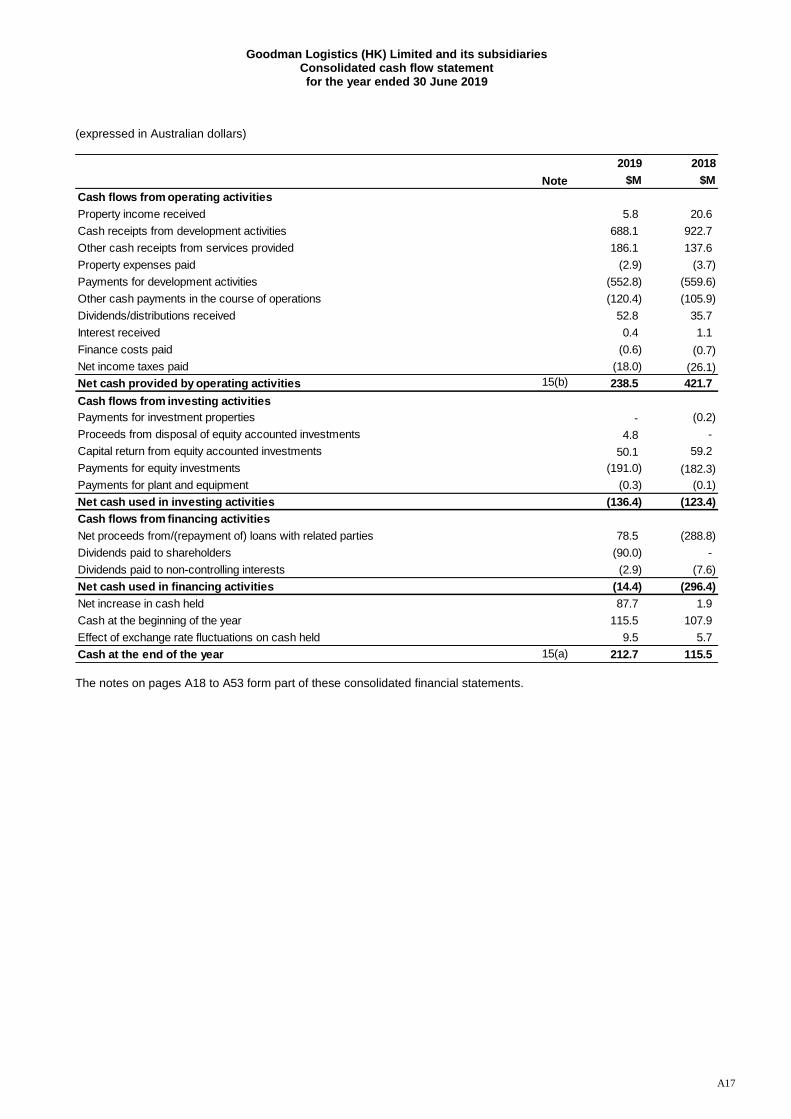


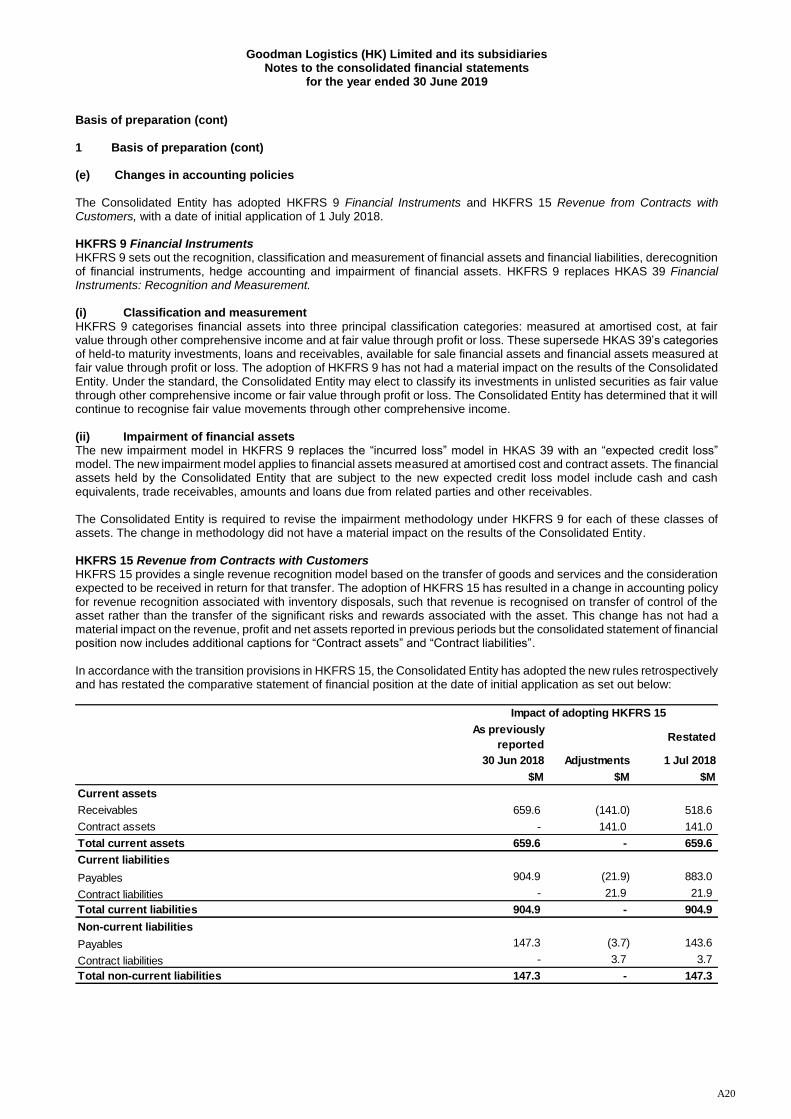


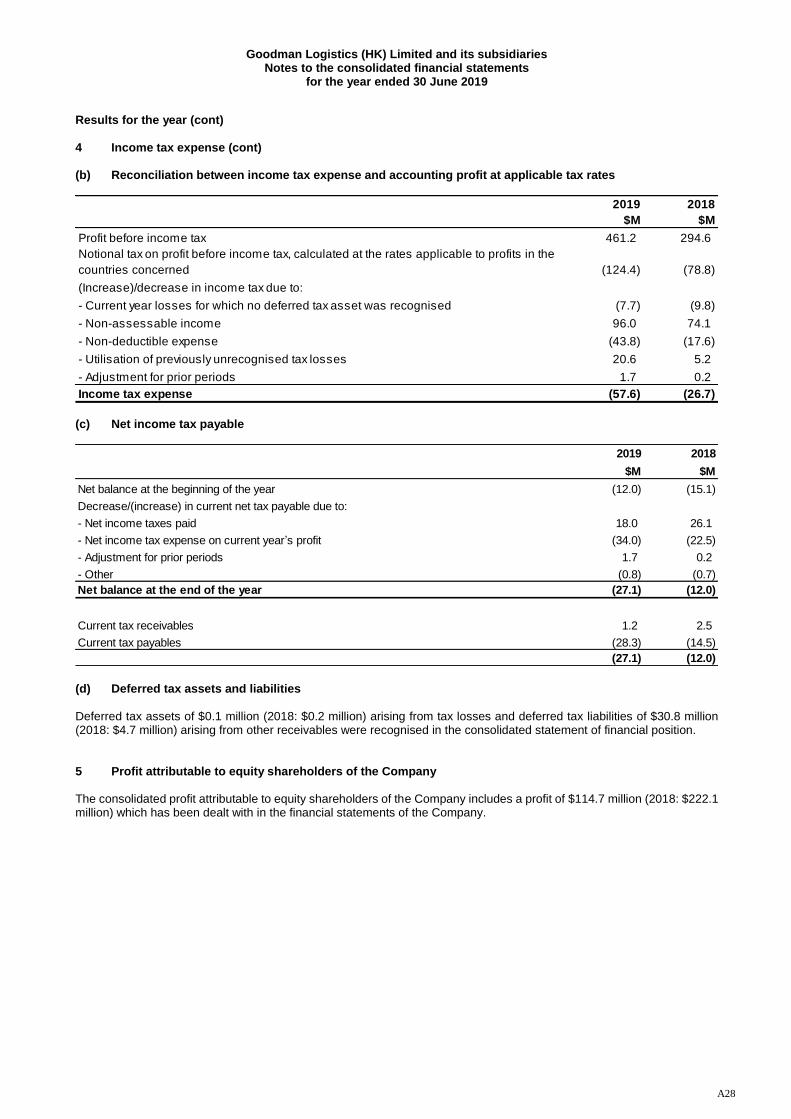

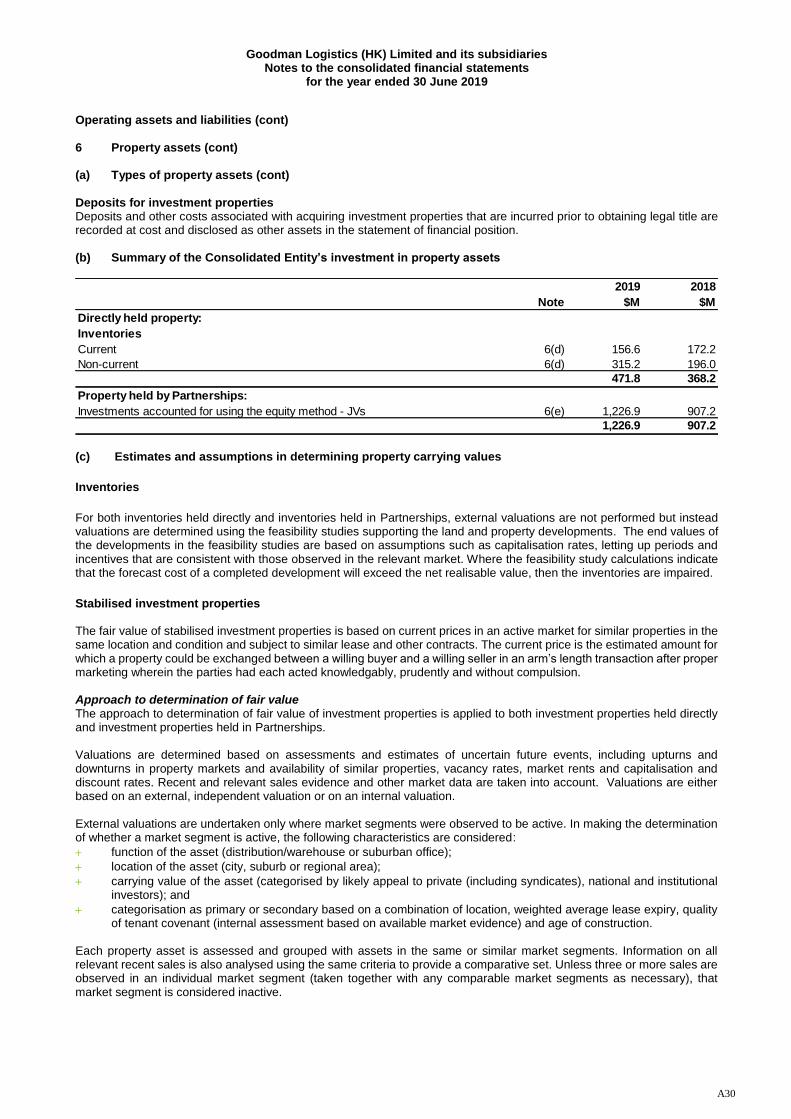

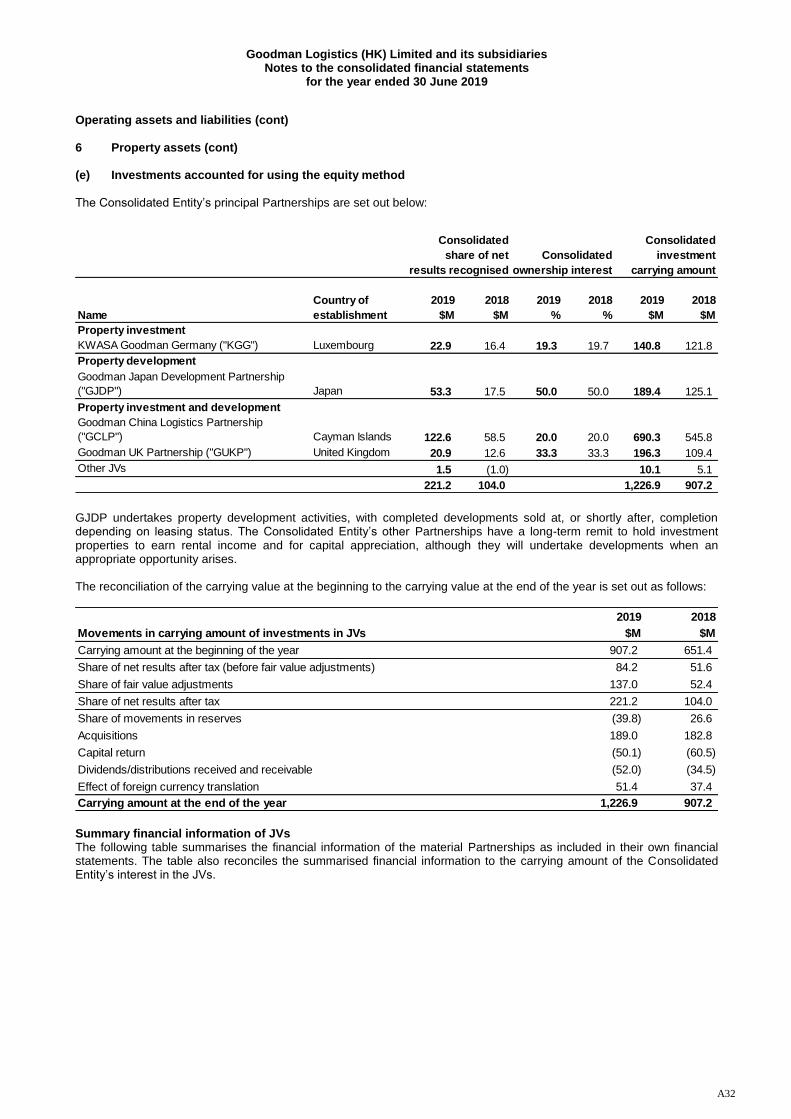
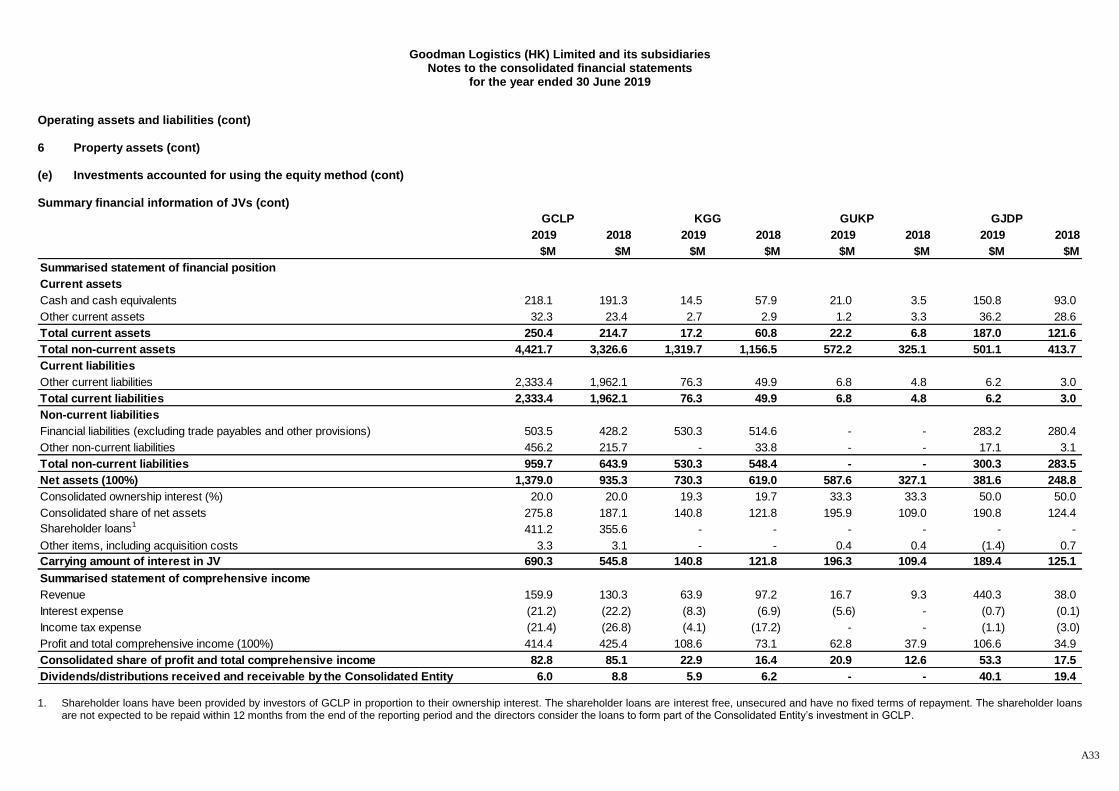
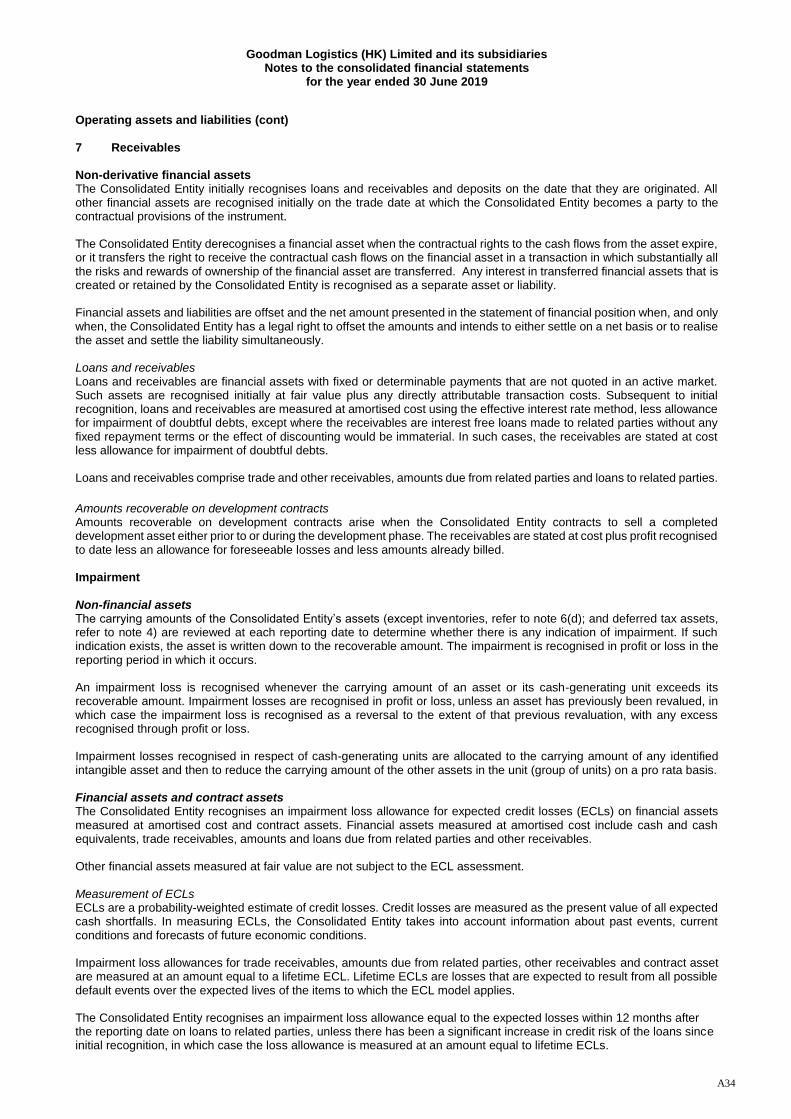
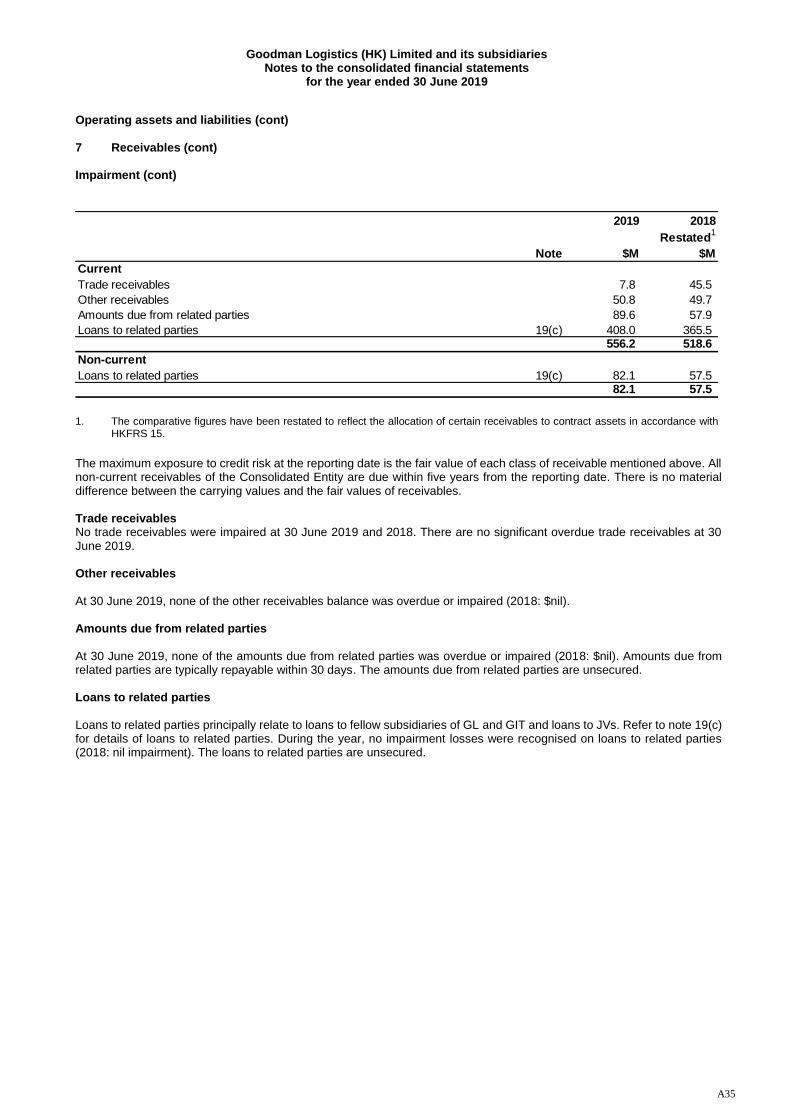


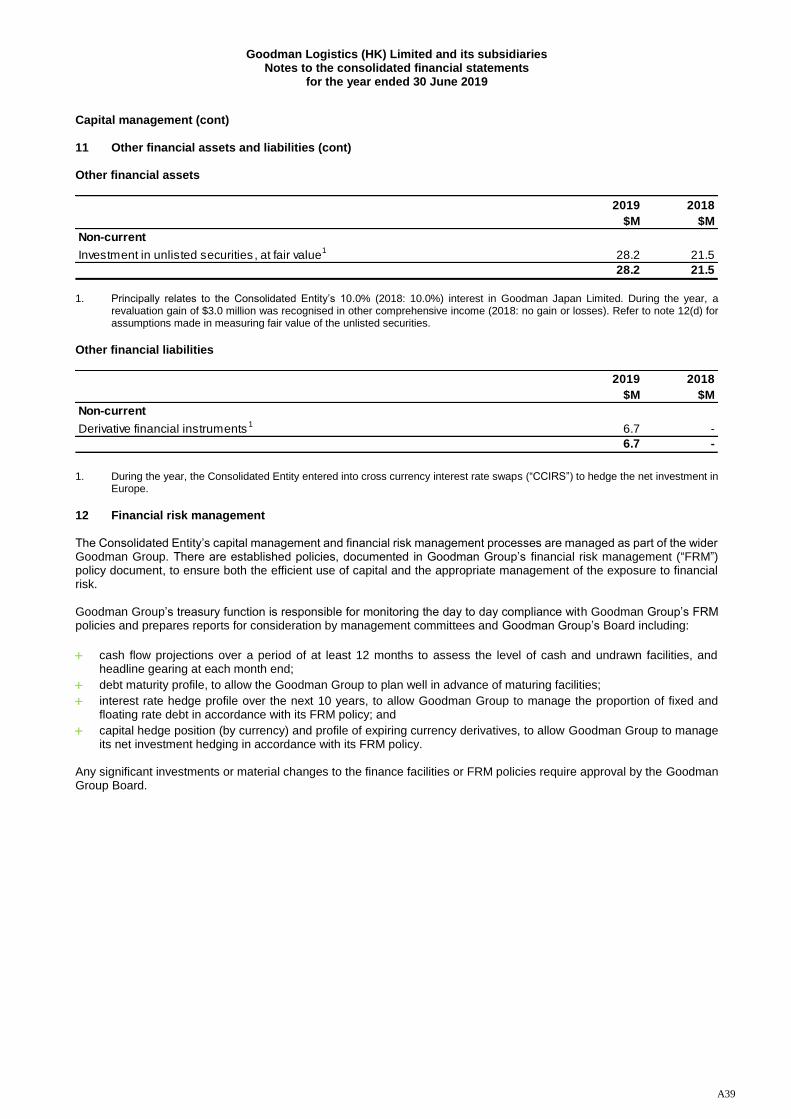


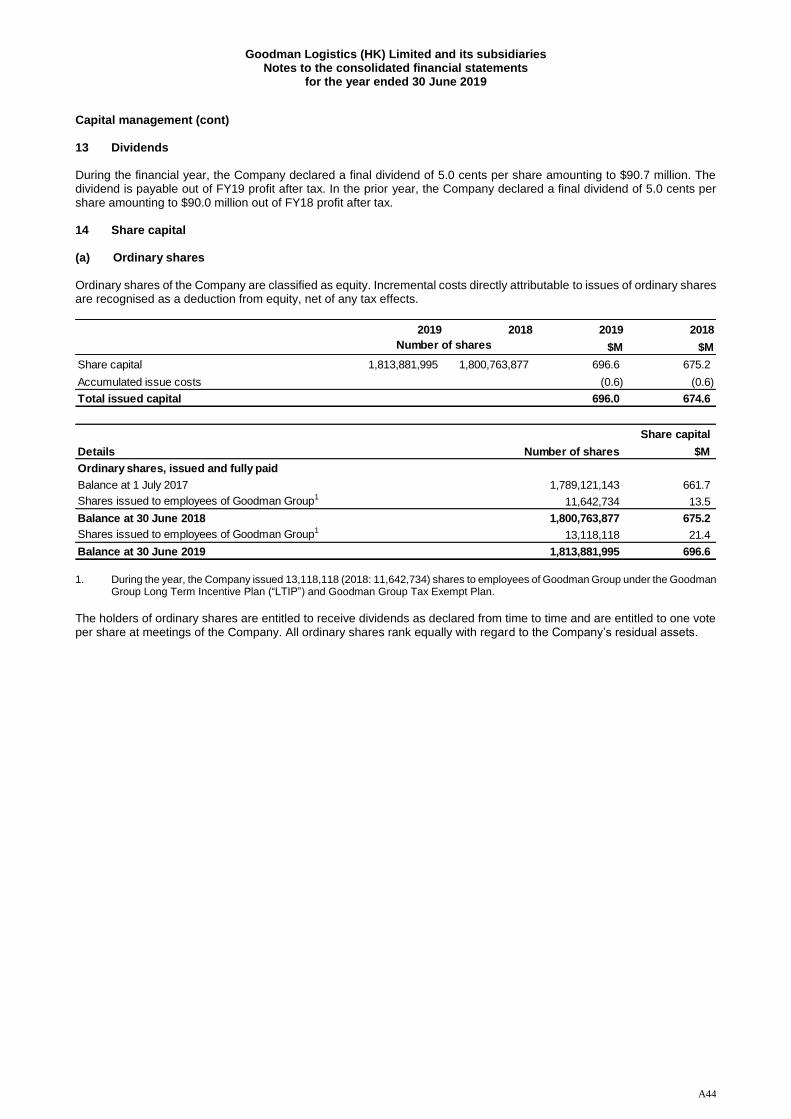
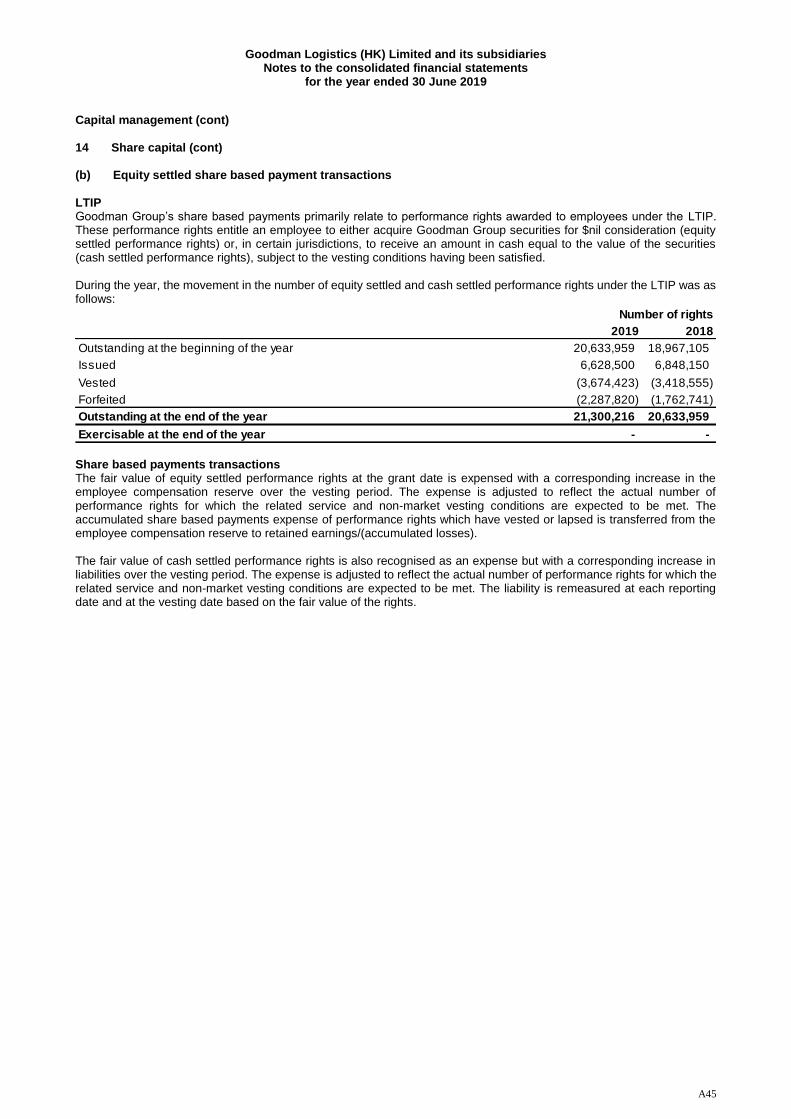


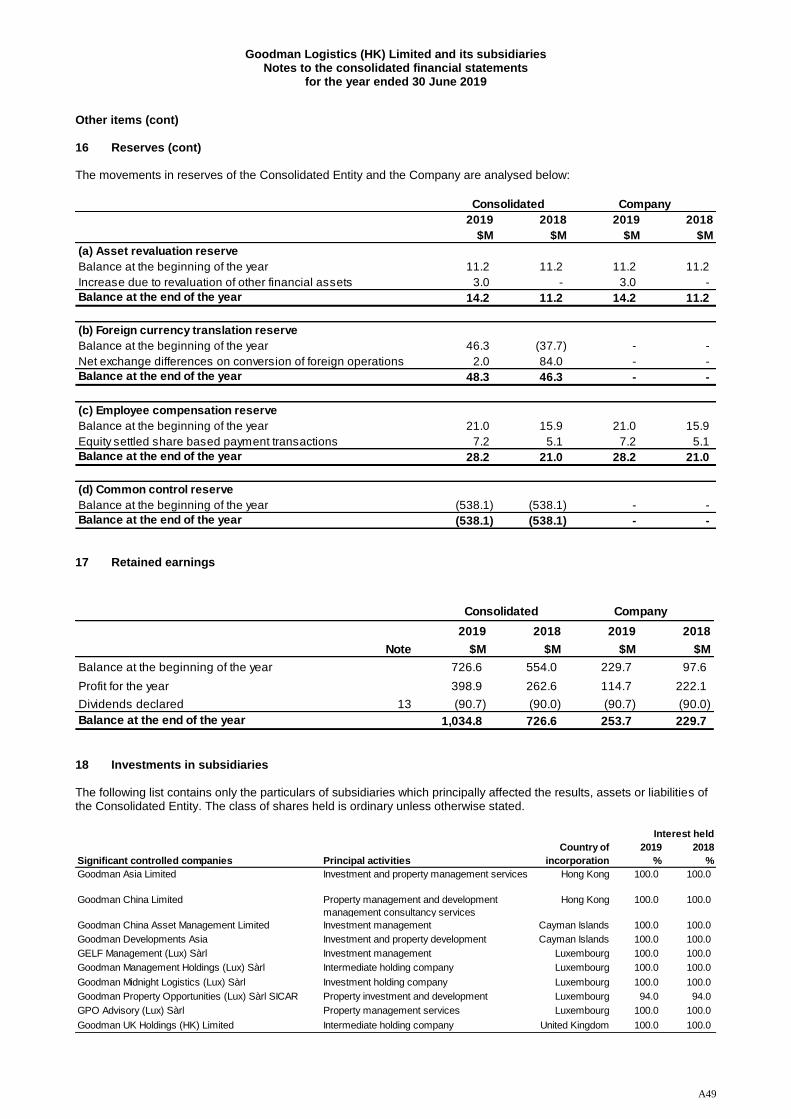


![ARB STEEL ARBN PLATED ARBX2 ARBNX2 RB · 2 T ® TENBLATT iornmno in 2//22 sistemi di fissaggio ARB ARBX2 RB TORX ARBN ARBNX2 LEGEND d [mm] Diametro filettatura > Thread diameter](https://static.documents.pub/doc/80x56/5fcdc26d1660a01dba083d04/arb-steel-arbn-plated-arbx2-arbnx2-rb-2-t-tenblatt-iornmno-in-222-sistemi-di.jpg)