Page 1 News Release Media Contacts: Lisa Bottle Phone: 704 423 7060 Gail Warner Phone: 704 423 7048 Investor Contact: Paul Gifford Phone: 704 423 5517 Goodrich Corporation Four Coliseum Centre 2730 West Tyvola Road Charlotte, NC 28217-4578 Tel: 704 423 7000 Fax: 704 423 7127 www.goodrich.com Goodrich Announces Second Quarter 2004 Results, Increases Sales and Earnings Outlook for Full Year 2004 • Second quarter net income per diluted share of $0.32 on sales of $1,134 million. • Second quarter cash flow from operations of $82 million, quarter-end cash balance of $356 million. • Commercial aftermarket and military and space sales continue to grow. • Sales outlook increased to $4.70 - $4.75 billion for 2004. • Fully diluted EPS outlook increased to $1.30 - $1.40 for 2004. CHARLOTTE, NC, July 29, 2004 – Goodrich Corporation announced today its results for the second quarter and year-to-date 2004 and increased its sales and earnings outlook for the full year 2004. The company reported second quarter 2004 net income of $39 million, or $0.32 per diluted share, on sales of $1,134 million. During the quarter, foreign currency translation had a favorable impact on sales of approximately $14 million, compared to the second quarter 2003. During the second quarter 2003, net income was $14 million, or $0.12 per diluted share, on sales of $1,095 million. The second quarter 2004 results include after tax charges for asset impairments and facility closure and headcount reduction actions totaling $2 million, or $0.02 per fully diluted share, compared to similar charges of $19 million, or $0.16 per fully diluted share, for the second quarter 2003.
Transcript
Page
News ReleaseMedia Contacts:
Lisa Bottle Phone: 704 423 7060 Gail Warner Phone: 704 423 7048 Investor Contact: Paul Gifford Phone: 704 423 5517
Goodrich Corporation Four Coliseum Centre 2730 West Tyvola Road Charlotte, NC 28217-4578 Tel: 704 423 7000 Fax: 704 423 7127 www.goodrich.com
Goodrich Announces Second Quarter 2004 Results, Increases Sales and Earnings Outlook for Full Year 2004
• Second quarter net income per diluted share of $0.32 on sales of $1,134 million. • Second quarter cash flow from operations of $82 million, quarter-end cash balance of
$356 million. • Commercial aftermarket and military and space sales continue to grow. • Sales outlook increased to $4.70 - $4.75 billion for 2004. • Fully diluted EPS outlook increased to $1.30 - $1.40 for 2004.
CHARLOTTE, NC, July 29, 2004 – Goodrich Corporation announced today its results for the second quarter and year-to-date 2004 and increased its sales and earnings outlook for the full year 2004. The company reported second quarter 2004 net income of $39 million, or $0.32 per diluted share, on sales of $1,134 million. During the quarter, foreign currency translation had a favorable impact on sales of approximately $14 million, compared to the second quarter 2003. During the second quarter 2003, net income was $14 million, or $0.12 per diluted share, on sales of $1,095 million. The second quarter 2004 results include after tax charges for asset impairments and facility closure and headcount reduction actions totaling $2 million, or $0.02 per fully diluted share, compared to similar charges of $19 million, or $0.16 per fully diluted share, for the second quarter 2003.
1
Page 2
Commenting on the company’s performance and the current market environment, Marshall Larsen, Chairman, President and Chief Executive Officer said, “Second quarter commercial aerospace aftermarket sales improved 9 percent over the same period last year, and we continued to see growth in our military and space sales. These increases were the primary drivers of our improved segment operating income, compared to the same quarter last year. We now expect commercial aircraft original equipment sales to be slightly higher this year, compared to 2003, as we begin product deliveries in late 2004 to support expected increases in 2005 aircraft deliveries by the original equipment manufacturers. We are seeing the benefits of our balanced sales mix in the bottom-line results, and continue to expect margin expansion as the overall cycle improves.” Income from continuing operations increased $24 million over the second quarter 2003. The increase was primarily due to reduced charges for facility closure and headcount reduction actions, reduced asset impairment expenses and improved operating income from higher sales volume in key market channels. In the second quarter 2004, Goodrich experienced reduced earnings relating to the impact of foreign currency translation of net non-U.S. dollar exposure totaling approximately $4 million after-tax, or $0.04 per diluted share, compared to the second quarter 2003. After tax costs for certain medical expenses, liability insurance premiums, litigation costs and performance-based management incentive compensation expenses were $3 million, or $0.03 per diluted share, higher in the second quarter 2004 compared to the second quarter 2003. During the second quarter 2004, stock-based compensation expense reduced diluted earnings per share by $0.01. In the second quarter 2004, Goodrich implemented FASB Staff Position 106-2 “Accounting and Disclosure Requirements Related to the Medicare Prescription Drug, Improvement and Modernization Act of 2003”, which resulted in an increase in after tax income of $1 million, or $0.01 per diluted share. For the first six months of 2004, the company reported net income of $86 million, or $0.71 per diluted share, on sales of $2,296 million. During the first six months of 2003, net income was $44 million, or $0.37 per diluted share, on sales of $2,189 million. The increased sales of $107 million are attributable to increases due to foreign currency translation impacts of $41 million and increased sales for military and space, commercial aftermarket and regional, business and general aviation original equipment and aftermarket parts and services.
Page 3
Year-to-Date – First six months 2004 2003
Sales and Earnings – Additional Details
Sales & After-tax earnings
($ in Millions)
Diluted
EPS
Sales & After-tax earnings
($ in Millions)
Diluted
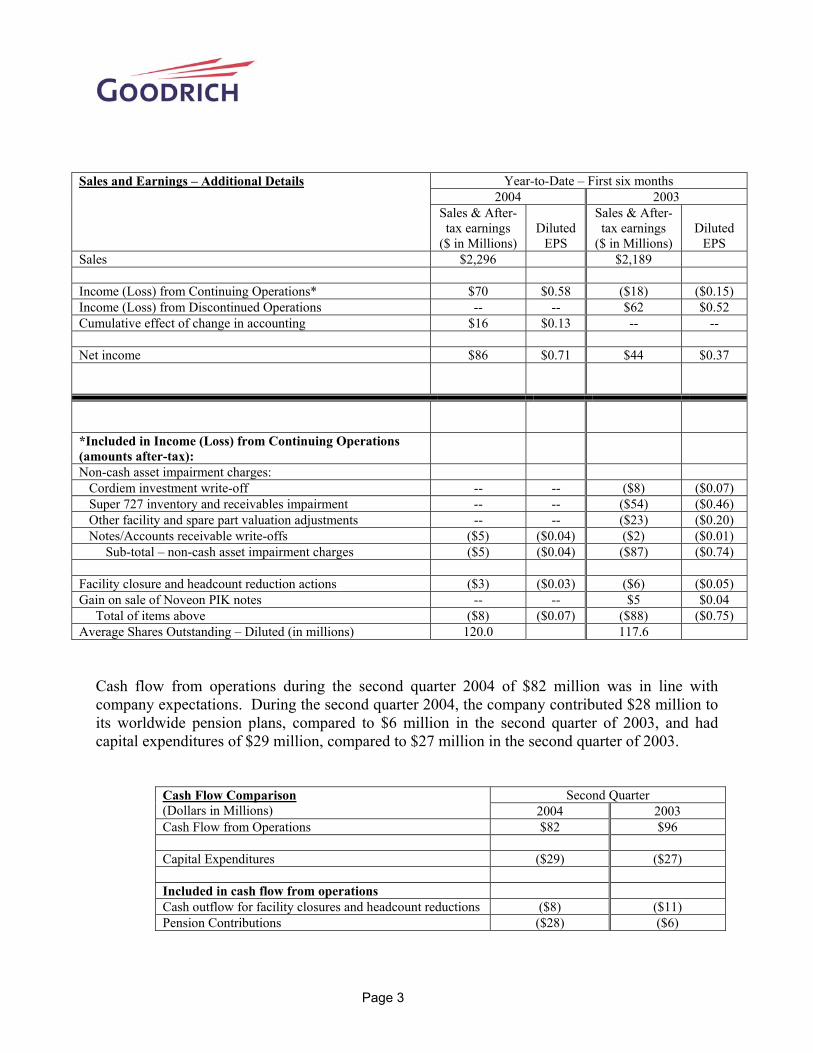
EPS Sales $2,296 $2,189 Income (Loss) from Continuing Operations* $70 $0.58 ($18) ($0.15) Income (Loss) from Discontinued Operations -- -- $62 $0.52 Cumulative effect of change in accounting $16 $0.13 -- -- Net income $86 $0.71 $44 $0.37
*Included in Income (Loss) from Continuing Operations (amounts after-tax):
Non-cash asset impairment charges: Cordiem investment write-off -- -- ($8) ($0.07) Super 727 inventory and receivables impairment -- -- ($54) ($0.46) Other facility and spare part valuation adjustments -- -- ($23) ($0.20) Notes/Accounts receivable write-offs ($5) ($0.04) ($2) ($0.01) Sub-total – non-cash asset impairment charges ($5) ($0.04) ($87) ($0.74) Facility closure and headcount reduction actions ($3) ($0.03) ($6) ($0.05) Gain on sale of Noveon PIK notes -- -- $5 $0.04 Total of items above ($8) ($0.07) ($88) ($0.75) Average Shares Outstanding – Diluted (in millions) 120.0 117.6
Cash flow from operations during the second quarter 2004 of $82 million was in line with company expectations. During the second quarter 2004, the company contributed $28 million to its worldwide pension plans, compared to $6 million in the second quarter of 2003, and had capital expenditures of $29 million, compared to $27 million in the second quarter of 2003.
Second Quarter Cash Flow Comparison (Dollars in Millions) 2004 2003 Cash Flow from Operations $82 $96 Capital Expenditures ($29) ($27) Included in cash flow from operations Cash outflow for facility closures and headcount reductions ($8) ($11) Pension Contributions ($28) ($6)
Page 4
Year-to-Date – First six months Cash Flow Comparison
(Dollars in Millions) 2004 2003 Cash Flow from Operations $130 $211 Capital Expenditures ($51) ($47) Included in cash flow from operations: Cash outflow for facility closures and headcount reductions ($15) ($21) Pension Contributions ($41) ($36)
The cash balance of $356 million at June 30, 2004 increased by $26 million from the balance of $330 million at March 31, 2004, primarily as a result of the improved net income and positive cash flow from operations. Second Quarter Business Highlights
• Goodrich announced the next step in its deleveraging efforts by requesting the redemption in full of the outstanding $60 million of Special Facilities Airport Revenue Bonds, series 1993 (TRAMCO, INC. Project) issued by Pilchuck Development Public Corporation. The bonds will be redeemed on August 1, 2004 at the redemption rate of 101% of the principal outstanding plus accrued and unpaid interest from February 1, 2004. The bonds will be redeemed utilizing cash on hand.
• Goodrich received another significant award from Boeing related to the 7E7 Dreamliner aircraft. On June 24, Goodrich was selected to provide the Proximity Sensing System for the 7E7. Earlier this year, Goodrich was selected to provide the nacelles and thrust reversers for both the GE and Rolls-Royce engine options and to provide the Fuel Quantity Indicating System and the Fuel Management Software for the 7E7. These three awards are expected to generate over $4 billion in sales over the initial contract periods.
• Boeing selected Goodrich to supply the main landing gear for a follow-on order of F/A-18 E/F “Super Hornet” aircraft. The contract is expected to generate in excess of $80 million in sales from 2006 – 2011.
• Goodrich was selected by BAE Systems to provide the ice detection system for the F-35 Joint Strike Fighter (JSF) aircraft. The system will be used on all versions of the aircraft, and will advise pilots when icing conditions are present.
• The Engine Alliance, a joint venture between GE Aircraft Engines and Pratt & Whitney, has selected Goodrich to perform the post-shipment final assembly
Page 5
and engine build-up of the GP7200 engine, which will be available on both the passenger and freighter versions of the Airbus A380 aircraft.
• Two airlines selected Goodrich to provide comprehensive aftermarket support for their aircraft. Independence Air selected Goodrich to provide the wheels, carbon brakes and overhaul services for its new Airbus A319 fleet, while AirTran Airways selected Goodrich to supply nacelle system aftermarket support for its entire fleet of Boeing 717 and 737 aircraft.
Outlook The company’s 2004 outlook for sales and fully diluted EPS has been revised upward, based on improving market conditions as noted below:
• While 2004 deliveries of Boeing and Airbus large commercial aircraft are expected to be approximately flat when compared to 2003, large commercial aircraft original equipment deliveries are expected to increase in 2005. Goodrich expects to begin its deliveries in late 2004 to support these increases, which should positively impact Goodrich sales during the second half of 2004. Total sales to the large commercial aircraft manufacturers are expected to be slightly higher in 2004 than they were in 2003.
• Goodrich expects capacity growth in the global airline system, as measured by available seat miles (ASMs), to continue to be strong, although the capacity increase experienced during the second quarter should moderate during the third and fourth quarters of 2004. Goodrich’s sales to airlines for large commercial and regional aircraft aftermarket parts and service are expected to grow approximately 6 percent in 2004, compared to 2003, as a result of these increases in capacity.
• Regional and business new aircraft production is expected to increase by about 8 – 10 percent when compared to 2003.
• Military sales (OE and aftermarket) should increase slightly greater than global military budgets, in the 10 - 12 percent range, when compared to 2003.
Based on current expectations for these key market trends, 2004 sales are expected to be in the $4.70 - $4.75 billion range. The 2004 outlook for operating income and earnings per share (EPS) is based on many external and internal factors that may have a material impact on projected results, some of which were discussed in detail as part of the year-end 2003 results press release dated February 5, 2004. To the extent that any of the factors highlighted in that press release have changed significantly, they are discussed below:
Page 6
• Foreign exchange – Goodrich is currently hedged on approximately 93 percent of its estimated foreign exchange exposure for the balance of 2004. The company now expects its unfavorable impact on earnings as a result of foreign currency translation of net non-U.S. dollar exposure for 2004 to be approximately $15 million pre tax, compared to 2003, assuming continuation of current exchange rates. All of this impact occurred during the first half of 2004.
• Pension expense – Based on actuarial adjustments for 2004, the company now expects 2004 pension costs to decline by about $2 million, when compared to 2003. Previously, pre tax pension expense was expected to decline by about $7 million for the full year 2004 compared to 2003.
• Certain expenses included in Corporate G&A, Other Income (Expense) and segment operating results – In its February 5, 2004 press release, the company indicated that these costs were expected to increase, on a pre tax basis, by about $30 million. This increase is now expected to be approximately $20 - $25 million. The improvement is primarily the result of decreased expectations for retiree medical cost increases, and the second quarter 2004 implementation of FASB Staff Position 106-2 “Accounting and Disclosure Requirements Related to the Medicare Prescription Drug, Improvement and Modernization Act of 2003”, which is expected to result in an increase in pre tax income for the full year 2004 of approximately $5 million, spread evenly across all four quarters. As required by the FASB Staff Position, the impact reflected in the second quarter does not include the retroactive impact on the first quarter reported results, but is included in the year-to-date results. On a year-to-date basis, the total impact was $2 million, pre tax.
Taking into account the increase in sales discussed earlier in this press release, coupled with the items noted above, Goodrich now expects 2004 fully diluted EPS to be in the range of $1.30 - $1.40. EPS from continuing operations, including the new methodology of accounting for contracts at Aerostructures and stock-based compensation expensing, but excluding the one-time gain from the cumulative effect of accounting change, is expected to be between $1.17 - $1.27. Goodrich continues to expect cash flow from operations, minus capital expenditures, to approximate net income in 2004. The company expects capital expenditures in 2004 to be 20 – 30 percent higher than the 2003 capital expenditures of $125 million. The current earnings and cash flow from operations outlook does not include any impact of potential curtailment of production for the Boeing 717 program, premiums associated with potential early retirement of debt, resolution of the previously disclosed Rohr and Coltec tax litigation or potential contractual disputes with Northrop Grumman related to the purchase of Aeronautical Systems from TRW.
----------------------
Page 7
The supplemental segment discussion and tables that follow provide more detailed information about the second quarter 2004 results.
---------------------- Goodrich will hold a conference call on July 29, 2004 at 10:00 AM U.S. Eastern time to discuss this announcement. Interested parties can listen to a live webcast of the conference call, and view the related presentation materials, at www.goodrich.com, or listen via telephone by dialing 913-981-4902.
---------------------- Goodrich Corporation, a Fortune 500 company, is a leading global supplier of systems and services to the aerospace and defense industry. Goodrich technology is involved in making aircraft fly… helping them land… and keeping them safe. Serving a global customer base with significant worldwide manufacturing and service facilities, Goodrich is one of the largest aerospace companies in the world. For more information visit http://www.goodrich.com
---------------------- Forward-looking Statements Certain statements made in this release are forward-looking statements within the meaning of the Private Securities Litigation Reform Act of 1995 regarding the company's future plans, objectives and expected performance. Specifically, statements that are not historical facts, including statements accompanied by words such as “believe,” “expect,” “anticipate,” “intend,” “estimate,” or “plan,” are intended to identify forward-looking statements and convey the uncertainty of future events or outcomes. The company cautions readers that any such forward-looking statements are based on assumptions that the company believes are reasonable, but are subject to a wide range of risks, and actual results may differ materially. Important factors that could cause actual results to differ include, but are not limited to:
• the extent to which the company is successful in integrating Aeronautical Systems in a manner and a timeframe that achieves expected cost savings and operating synergies;
• potential contractual disputes with Northrop Grumman related to the purchase of Aeronautical Systems;
• the nature, extent and timing of the company's proposed restructuring and consolidation actions and the extent to which the company is able to achieve savings from these actions;
• the possibility of additional restructuring and consolidation actions beyond those previously announced by the company;
• demand for and market acceptance of new and existing products, such as the Airbus A380, the Joint Strike Fighter, the Boeing 7E7, the Embraer 190 and the Boeing 717;
• the health of the commercial aerospace industry, including the impact of bankruptcies in the airline industry;
• global demand for aircraft spare parts and aftermarket services; • threats associated with and efforts to combat terrorism, including the current situation in
Iraq; • the impact of Severe Acute Respiratory Syndrome (SARS) or other airborne respiratory
illnesses on global travel; • potential cancellation of orders by customers; • successful development of products and advanced technologies; • the extent to which expenses relating to employee and retiree medical and pension
benefits continue to rise; • competitive product and pricing pressures; • the payment of premiums by the company in connection with the early retirement of debt; • the resolution of tax litigation involving Coltec Industries Inc and Rohr, Inc. • the company's ability to recover from third parties under contractual rights of
indemnification for environmental and other claims arising out of the divestiture of the company's tire, vinyl and other businesses;
• possible assertion of claims against the company on the theory that it, as the former corporate parent of Coltec Industries Inc, bears some responsibility for the asbestos-related liabilities of Coltec and its subsidiaries, or that Coltec's dividend of its aerospace business to the company prior to the EnPro spin-off was made at a time when Coltec was insolvent or caused Coltec to become insolvent;
• the effect of changes in accounting policies; • domestic and foreign government spending, budgetary and trade policies; • economic and political changes in international markets where the company competes,
such as changes in currency exchange rates, inflation, deflation, recession and other external factors over which the company has no control; and
• the outcome of contingencies (including completion of acquisitions, divestitures, litigation and environmental remediation efforts).
Further information regarding the factors that could cause actual results to differ materially from projected results can be found in the company's filings with the Securities and Exchange Commission, included in the company's Annual Report on Form 10-K for the year ended December 31, 2003. The company cautions you not to place undue reliance on the forward-looking statements contained in this release, which speak only as of the date on which such statements were made. The company undertakes no obligation to release publicly any revisions to these forward-looking statements to reflect events or circumstances after the date on which such statements were made or to reflect the occurrence of unanticipated events.
###
Page 9
Supplemental Segment Review Total Segment Results 2Q 2004 2Q 2003 Sales and Pre-
tax earnings ($ in Millions)
Margin %
Sales and Pre-tax earnings
($ in Millions)
Margin %
Sales $1,134 $1,095 Segment Operating Income $127 11.2% $81 7.4% Included below is a summary discussion of sales and operating income changes by segment: Airframe Systems – Sales in the second quarter of 2004 increased about $9 million, or 2 percent, from $395 million in the second quarter of 2003 to $404 million in the second quarter of 2004. The increase was primarily due to foreign currency translation of non-U.S. dollar sales and increased sales of aircraft wheels and brakes, airframe heavy maintenance services and engineered polymer products during the second quarter 2004, compared to the second quarter 2003, partially offset by lower sales of actuation products. Operating income in the second quarter of 2004 increased approximately $2 million, from $23 million in the second quarter of 2003 to $25 million in the second quarter of 2004. Asset impairment, facility closure and headcount reduction charges recorded in the second quarter of 2003 totaled $3 million, with none recorded in the second quarter of 2004. Excluding these charges, operating income was approximately flat as improved results for the airframe heavy maintenance and engineered polymers businesses were offset by lower sales volumes in the actuation systems business and higher new program research and development expenditures. Engine Systems - Sales in the second quarter of 2004 increased $25 million, or 6 percent, from $424 million in the second quarter of 2003 to $449 million in the second quarter of 2004. This was due to increased commercial aircraft aftermarket sales for in-production aircraft, partially offset by decreased commercial aircraft original equipment sales, in the Aerostructures business. Also contributing to the sales growth were increased military and space and regional aircraft product sales in the Turbine Fuel Technologies business, higher commercial aftermarket sales for the Cargo Systems business, increased maintenance, repair and overhaul sales in Customer Services and foreign currency translation. Operating income in the second quarter of 2004 increased $43 million from $26 million in the second quarter of 2003 to $69 million in the second quarter of 2004. The improvement in operating income was primarily due to the sales increases noted above, improved sales mix with more commercial aftermarket sales and a $22 million reduction in asset impairment, facility closure and headcount reduction charges, compared to the second quarter 2003, partially offset by higher new program research and development expenditures and the impact of foreign currency translation of net non-U.S. dollar expenses.
Page 10
Electronic Systems – Sales in the second quarter of 2004 increased $6 million, or 2 percent, from $275 million in the second quarter of 2003 to $281 million in the second quarter of 2004. This was primarily due to increased sales of regional and business aircraft original equipment and aftermarket products for the De-Icing & Specialty Systems, Sensor Systems and Power Systems businesses, and foreign currency translation. These increases were partially offset by decreased sales for Optical & Space Systems products. Operating income in the second quarter of 2004 decreased by less than $1 million, and remained at approximately $32 million in the second quarter of both 2003 and 2004. The slight change is primarily attributable to a $1 million decrease in asset impairment, facility closure and headcount reduction charges, compared to the second quarter 2003, primarily offset by higher new product development expenditures and the impact of a two week strike in the De-Icing and Specialty Systems business.
Page 11
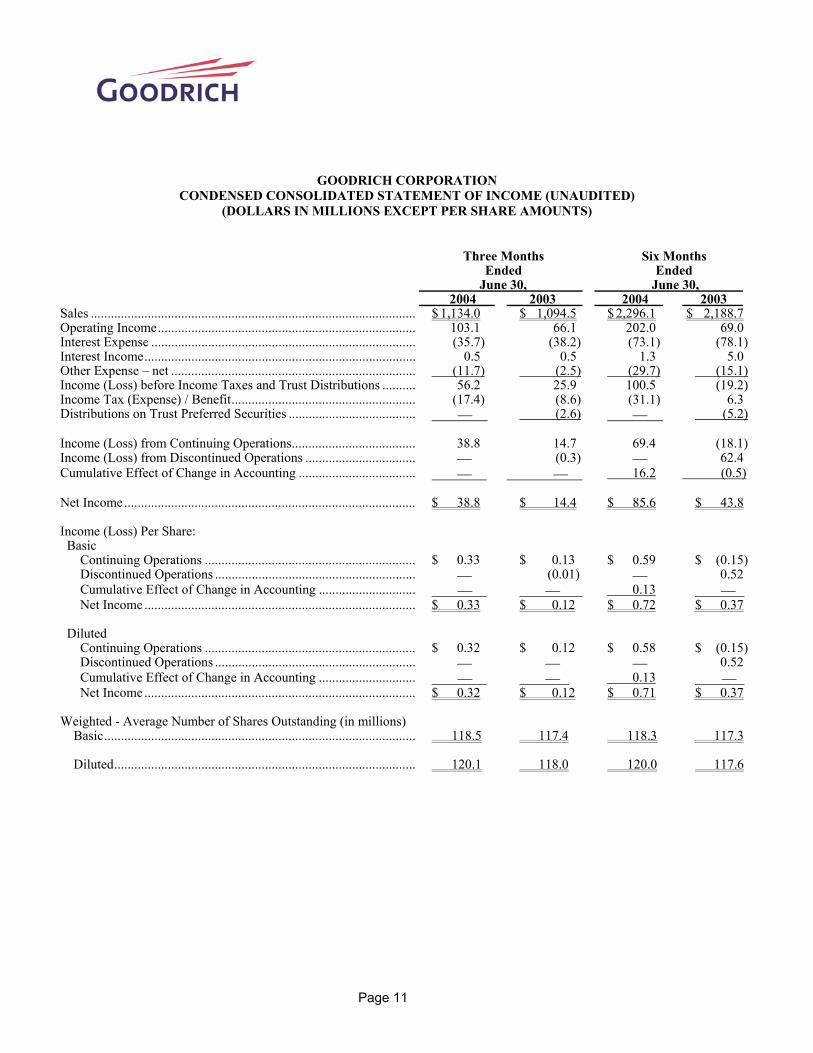
GOODRICH CORPORATION CONDENSED CONSOLIDATED STATEMENT OF INCOME (UNAUDITED)
(DOLLARS IN MILLIONS EXCEPT PER SHARE AMOUNTS)
Three Months Ended
June 30,
Six Months Ended
June 30, 2004 2003 2004 2003 Sales ................................................................................................. $ 1,134.0 $ 1,094.5 $ 2,296.1 $ 2,188.7 Operating Income............................................................................. 103.1 66.1 202.0 69.0 Interest Expense ............................................................................... (35.7) (38.2) (73.1) (78.1) Interest Income................................................................................. 0.5 0.5 1.3 5.0 Other Expense – net ......................................................................... (11.7) (2.5) (29.7) (15.1) Income (Loss) before Income Taxes and Trust Distributions .......... 56.2 25.9 100.5 (19.2) Income Tax (Expense) / Benefit....................................................... (17.4) (8.6) (31.1) 6.3 Distributions on Trust Preferred Securities ...................................... (2.6) (5.2) Income (Loss) from Continuing Operations..................................... 38.8 14.7 69.4 (18.1) Income (Loss) from Discontinued Operations ................................. (0.3) 62.4 Cumulative Effect of Change in Accounting ................................... 16.2 (0.5) Net Income....................................................................................... $ 38.8 $ 14.4 $ 85.6 $ 43.8 Income (Loss) Per Share: Basic Continuing Operations ............................................................... $ 0.33 $ 0.13 $ 0.59 $ (0.15) Discontinued Operations ............................................................ (0.01) 0.52 Cumulative Effect of Change in Accounting ............................. 0.13 Net Income ................................................................................. $ 0.33 $ 0.12 $ 0.72 $ 0.37 Diluted Continuing Operations ............................................................... $ 0.32 $ 0.12 $ 0.58 $ (0.15) Discontinued Operations ............................................................ 0.52 Cumulative Effect of Change in Accounting ............................. 0.13 Net Income ................................................................................. $ 0.32 $ 0.12 $ 0.71 $ 0.37 Weighted - Average Number of Shares Outstanding (in millions) Basic............................................................................................. 118.5 117.4 118.3 117.3 Diluted.......................................................................................... 120.1 118.0 120.0 117.6
Page 12
GOODRICH CORPORATION SEGMENT REPORTING
(DOLLARS IN MILLIONS)
Three Months Ended
June 30,
Six Months Ended
June 30, 2004 2003 2004 2003 Sales: Airframe Systems......................................................................... $ 403.8 $ 395.4 $ 806.4 $ 797.5 Engine Systems ............................................................................ 449.2 423.8 947.7 847.4 Electronic Systems ....................................................................... 281.0 275.3 542.0 543.8 Total Sales........................................................................................ $ 1,134.0 $ 1,094.5 $ 2,296.1 $ 2,188.7 Operating Income (Loss): Airframe Systems......................................................................... $ 25.3 $ 22.9 $ 46.4 $ 44.7 Engine Systems ............................................................................ 69.4 25.8 143.8 (9.4) Electronic Systems ....................................................................... 31.8 32.0 54.7 64.2 Total Segment Operating Income .................................................... 126.5 80.7 244.9 99.5 Corporate General and Administrative Costs................................... (23.4) (14.6) (42.9) (30.5) Total Operating Income ................................................................... $ 103.1 $ 66.1 $ 202.0 $ 69.0 Segment Operating Income as a Percent of Sales: Airframe Systems......................................................................... 6.3% 5.8% 5.8% 5.6% Engine Systems ............................................................................ 15.4% 6.1% 15.2% (1.1)% Electronic Systems ....................................................................... 11.3% 11.6% 10.1% 11.8% Total Segment Operating Income as a Percent of Sales................... 11.2% 7.4% 10.7% 4.5%
Page 13
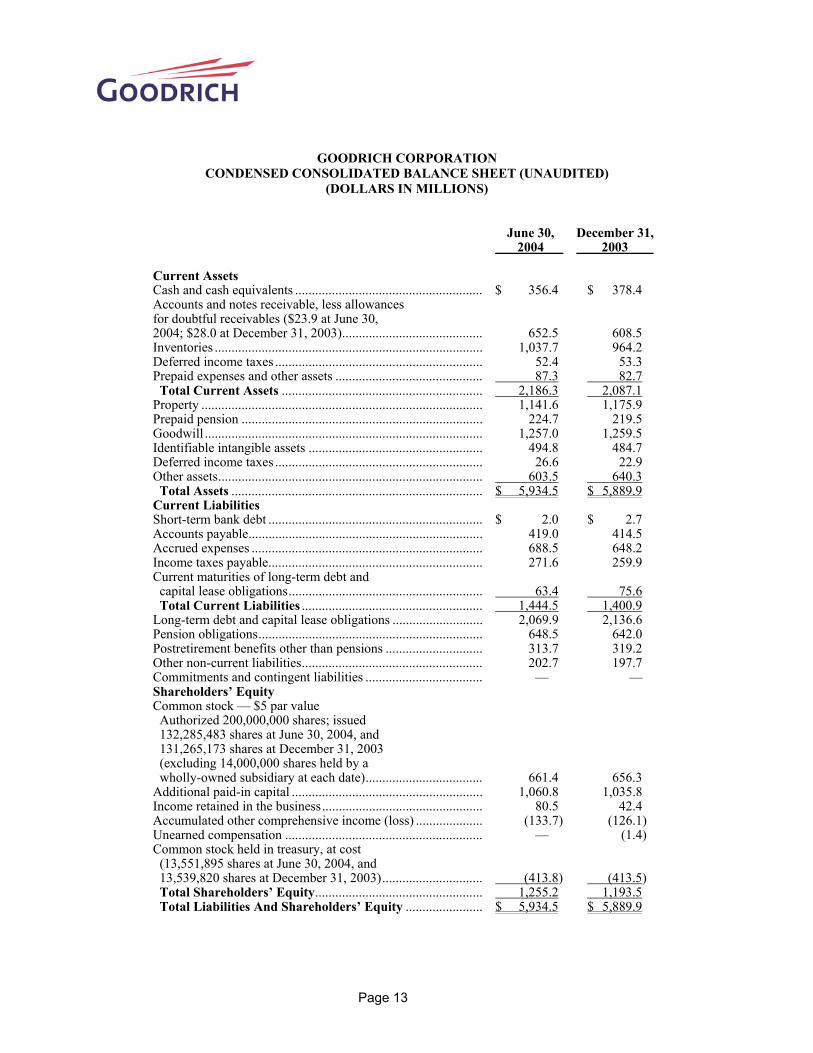
GOODRICH CORPORATION
CONDENSED CONSOLIDATED BALANCE SHEET (UNAUDITED) (DOLLARS IN MILLIONS)
June 30, 2004
December 31, 2003
Current Assets Cash and cash equivalents ........................................................ $ 356.4 $ 378.4 Accounts and notes receivable, less allowances for doubtful receivables ($23.9 at June 30, 2004; $28.0 at December 31, 2003).......................................... 652.5 608.5 Inventories ................................................................................ 1,037.7 964.2 Deferred income taxes .............................................................. 52.4 53.3 Prepaid expenses and other assets ............................................ 87.3 82.7 Total Current Assets ............................................................ 2,186.3 2,087.1 Property .................................................................................... 1,141.6 1,175.9 Prepaid pension ........................................................................ 224.7 219.5 Goodwill ................................................................................... 1,257.0 1,259.5 Identifiable intangible assets .................................................... 494.8 484.7 Deferred income taxes .............................................................. 26.6 22.9 Other assets............................................................................... 603.5 640.3 Total Assets ........................................................................... $ 5,934.5 $ 5,889.9 Current Liabilities Short-term bank debt ................................................................ $ 2.0 $ 2.7 Accounts payable...................................................................... 419.0 414.5 Accrued expenses ..................................................................... 688.5 648.2 Income taxes payable................................................................ 271.6 259.9 Current maturities of long-term debt and capital lease obligations.......................................................... 63.4 75.6 Total Current Liabilities ...................................................... 1,444.5 1,400.9 Long-term debt and capital lease obligations ........................... 2,069.9 2,136.6 Pension obligations................................................................... 648.5 642.0 Postretirement benefits other than pensions ............................. 313.7 319.2 Other non-current liabilities...................................................... 202.7 197.7 Commitments and contingent liabilities ................................... — — Shareholders’ Equity Common stock — $5 par value Authorized 200,000,000 shares; issued 132,285,483 shares at June 30, 2004, and 131,265,173 shares at December 31, 2003 (excluding 14,000,000 shares held by a wholly-owned subsidiary at each date)................................... 661.4 656.3 Additional paid-in capital ......................................................... 1,060.8 1,035.8 Income retained in the business................................................ 80.5 42.4 Accumulated other comprehensive income (loss) .................... (133.7) (126.1) Unearned compensation ........................................................... — (1.4) Common stock held in treasury, at cost (13,551,895 shares at June 30, 2004, and 13,539,820 shares at December 31, 2003).............................. (413.8) (413.5) Total Shareholders’ Equity.................................................. 1,255.2 1,193.5 Total Liabilities And Shareholders’ Equity ....................... $ 5,934.5 $ 5,889.9
Page 14
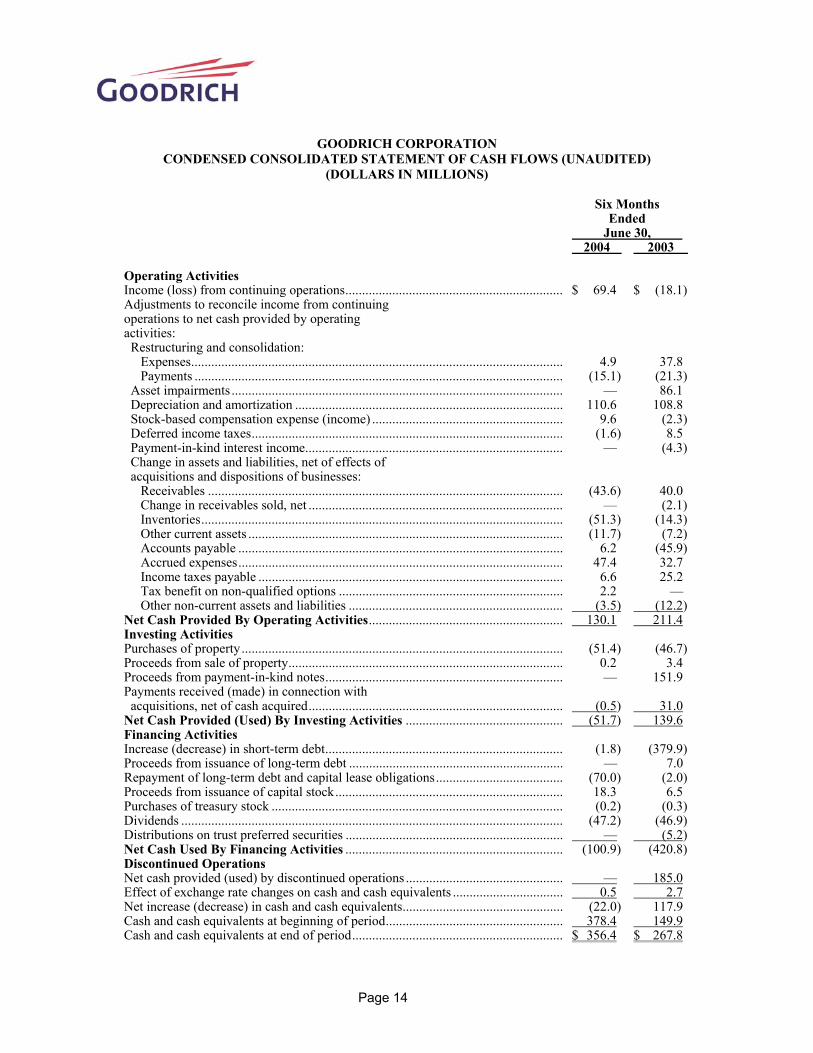
GOODRICH CORPORATION CONDENSED CONSOLIDATED STATEMENT OF CASH FLOWS (UNAUDITED)
(DOLLARS IN MILLIONS)
Six Months Ended June 30,
2004 2003 Operating Activities Income (loss) from continuing operations................................................................. $ 69.4 $ (18.1)Adjustments to reconcile income from continuing operations to net cash provided by operating activities: Restructuring and consolidation: Expenses............................................................................................................... 4.9 37.8 Payments .............................................................................................................. (15.1) (21.3) Asset impairments ................................................................................................... — 86.1 Depreciation and amortization ................................................................................ 110.6 108.8 Stock-based compensation expense (income) ......................................................... 9.6 (2.3) Deferred income taxes............................................................................................. (1.6) 8.5 Payment-in-kind interest income............................................................................. — (4.3) Change in assets and liabilities, net of effects of acquisitions and dispositions of businesses: Receivables .......................................................................................................... (43.6) 40.0 Change in receivables sold, net ............................................................................ — (2.1) Inventories............................................................................................................ (51.3) (14.3) Other current assets .............................................................................................. (11.7) (7.2) Accounts payable ................................................................................................. 6.2 (45.9) Accrued expenses................................................................................................. 47.4 32.7 Income taxes payable ........................................................................................... 6.6 25.2 Tax benefit on non-qualified options ................................................................... 2.2 — Other non-current assets and liabilities ................................................................ (3.5) (12.2)Net Cash Provided By Operating Activities.......................................................... 130.1 211.4 Investing Activities Purchases of property................................................................................................ (51.4) (46.7)Proceeds from sale of property.................................................................................. 0.2 3.4 Proceeds from payment-in-kind notes....................................................................... — 151.9 Payments received (made) in connection with acquisitions, net of cash acquired............................................................................ (0.5) 31.0 Net Cash Provided (Used) By Investing Activities ............................................... (51.7) 139.6 Financing Activities Increase (decrease) in short-term debt....................................................................... (1.8) (379.9)Proceeds from issuance of long-term debt ................................................................ — 7.0 Repayment of long-term debt and capital lease obligations...................................... (70.0) (2.0)Proceeds from issuance of capital stock.................................................................... 18.3 6.5 Purchases of treasury stock ....................................................................................... (0.2) (0.3)Dividends .................................................................................................................. (47.2) (46.9)Distributions on trust preferred securities ................................................................. — (5.2)Net Cash Used By Financing Activities ................................................................. (100.9) (420.8)Discontinued Operations Net cash provided (used) by discontinued operations ............................................... — 185.0 Effect of exchange rate changes on cash and cash equivalents ................................. 0.5 2.7 Net increase (decrease) in cash and cash equivalents................................................ (22.0) 117.9 Cash and cash equivalents at beginning of period..................................................... 378.4 149.9 Cash and cash equivalents at end of period............................................................... $ 356.4 $ 267.8
Page 15
GOODRICH CORPORATION SUPPLEMENTARY FINANCIAL INFORMATION
(DOLLARS IN MILLIONS)
Six Months Ended June 30,
2004 2003 Non-Segment Expenses: Net Interest Expense.................................................................................... $ (71.8) $ (73.1) - Payment-in-Kind Interest Income ........................................................... $ — $ 4.3 (included in Net Interest Expense above) Other Income (Expense), Net: ..................................................................... $ (29.7) $ (15.1) - Discontinued Retiree Health Care........................................................... $ (9.4) $ (10.4) - Other Income (Expense) ......................................................................... $ (20.3) $ (4.7)
Six Months Ended June 30,
2004 2003 Preliminary Balance Sheet and Cash Flow Data: Short-term Bank Debt ................................................................................. $ 2.0 $ — Current Maturities of Long-term Debt and Capital Lease Obligations ....... $ 63.4 $ 3.5 Manditorily Redeemable Preferred Securities of Trust (QUIPS)................ $ — $ 125.6 Long-term Debt and Capital Lease Obligations .......................................... $ 2,069.9 $ 2,133.2 Total Debt1 + QUIPS................................................................................. $ 2,135.3 $ 2,262.3 Cash and Cash Equivalents ......................................................................... $ 356.4 $ 267.8 Net Debt + QUIPS .................................................................................... $ 1,778.9 $ 1,994.5 Dividends .................................................................................................... $ 47.2 $ 46.9 Depreciation and Amortization ................................................................... $ 110.6 $ 108.8 - Depreciation............................................................................................ $ 80.1 $ 78.8 - Amortization ........................................................................................... $ 30.5 $ 30.0
1 Total Debt (defined as short-term debt plus current maturities of long-term debt and capital lease obligations plus long-term debt and capital lease obligations) and Net Debt (defined as Total Debt minus
cash and cash equivalents) are non-GAAP financial measures that the Company believes are useful to rating agencies and investors in understanding the Company’s capital structure and leverage. Because all companies do not calculate these measures in the same manner, the Company's presentation may not be comparable to other similarly titled measures reported by other companies.