Page 1
Goodwill Impairment and Earnings Management
in the year of the pandemic
By
Christine Dicken
Oskar Unger
Master’s Programme in Accounting and Finance
Supervisor: Kristina Artsberg
Examiner: Karin Jonnergård
Page 3
I
Abstract
Seminar date: 3rd of June 2021
Course: BUSN79 Degree Project in Accounting and Finance, Master Level, 15 Credits
Authors: Christine Dicken and Oskar Unger
Advisor/Examiner: Kristina Artsberg/Karin Jonnergård
Key words: Goodwill Impairment, Earnings Management, Discretion, IFRS 3, IAS 36,
COVID-19
Purpose: The purpose of the research is to analyze managers’ use of accounting discretion in
goodwill impairment losses of European firms in 2020 – a year of financial distress caused by
the COVID-19 pandemic – and whether the discretion employed reflects earnings management.
Methodology: The difference in earnings between impairers and non-impairers is analyzed by
employing a Mann-Whitney U-test and an independent T-test. Consequently, a multivariate
tobit regression is used to investigate the association between big bath earnings management
and goodwill impairment in times of financial crisis (2020) compared to previous years. Finally,
an OLS regression is applied to analyze discretionary impairment in 2020. The quantitative
findings are complemented by flexible semi-structured interviews.
Theoretical perspectives: Previous literature on goodwill impairment regarding value
relevance and managerial discretion, linked to signaling theory and agency theory respectively,
are used to assist in explaining the effectiveness of impairment tests and why managers may
engage in earnings management and discretionarily recognize goodwill impairments.
Empirical foundation: The empirical data consists of primary data from interviews with 7
European managers and secondary data from financial databases such as Bloomberg. 8,974
firm-year observations of European companies between 2010 and 2020 were analyzed.
Conclusion: Our findings suggest that the majority of companies that chose to impair in 2020
did not do so to take a big bath. However, negative pre-impairment earnings levels as
opportunity to take a big bath seem to be a significant determinant of goodwill impairment,
with stronger association in times of crisis. When analyzing discretionary goodwill impairment,
we find that negative pre-impairment earning levels even tended to motivate an understatement
of goodwill impairment compared to the economically induced value loss.
Page 4
II
Acknowledgements
We would like to thank our supervisor, Kristina Artsberg, for her valuable feedback and
supervision along the way.
Furthermore, we owe our gratitude to our dearest family and friends for supporting us in this
busy study period.
Lund, 28th of May 2021
Christine Dicken Oskar Unger
Page 5
III
Table of contents
1. Introduction.......................................................................................................................... 1
1.1. Background................................................................................................................... 1
1.2. Problematization ........................................................................................................... 5
1.3. Research question & Purpose ........................................................................................ 8
1.4. Contribution.................................................................................................................. 9
1.5. Outline of Thesis........................................................................................................... 9
2. Literature Review ............................................................................................................... 11
2.1. Value relevance (signaling theory) .............................................................................. 11
2.2. Managerial discretion (agency theory)......................................................................... 13
3. Hypothesis Development .................................................................................................... 16
4. Methodology ...................................................................................................................... 18
4.1. Qualitative Research approach .................................................................................... 19
4.2. Quantitative research approach.................................................................................... 19
4.3. Econometric Method ................................................................................................... 20
4.3.1. Diagnostic Tests .................................................................................................. 23
4.3.2. Limitations .......................................................................................................... 23
5. Data ................................................................................................................................... 26
5.1. Data Collection & Sample ........................................................................................... 26
5.1.1. Dependent Variable ............................................................................................. 27
5.1.2. Explanatory Variable ........................................................................................... 27
5.1.3. Control Variables................................................................................................. 28
5.2. Descriptive Statistics ................................................................................................... 32
6. Empirical Findings ............................................................................................................. 37
6.1. Qualitative Findings .................................................................................................... 37
6.1.1. Interview Findings ............................................................................................... 37
6.2. Quantitative Findings .................................................................................................. 43
6.2.1. Diagnostic Test results ......................................................................................... 43
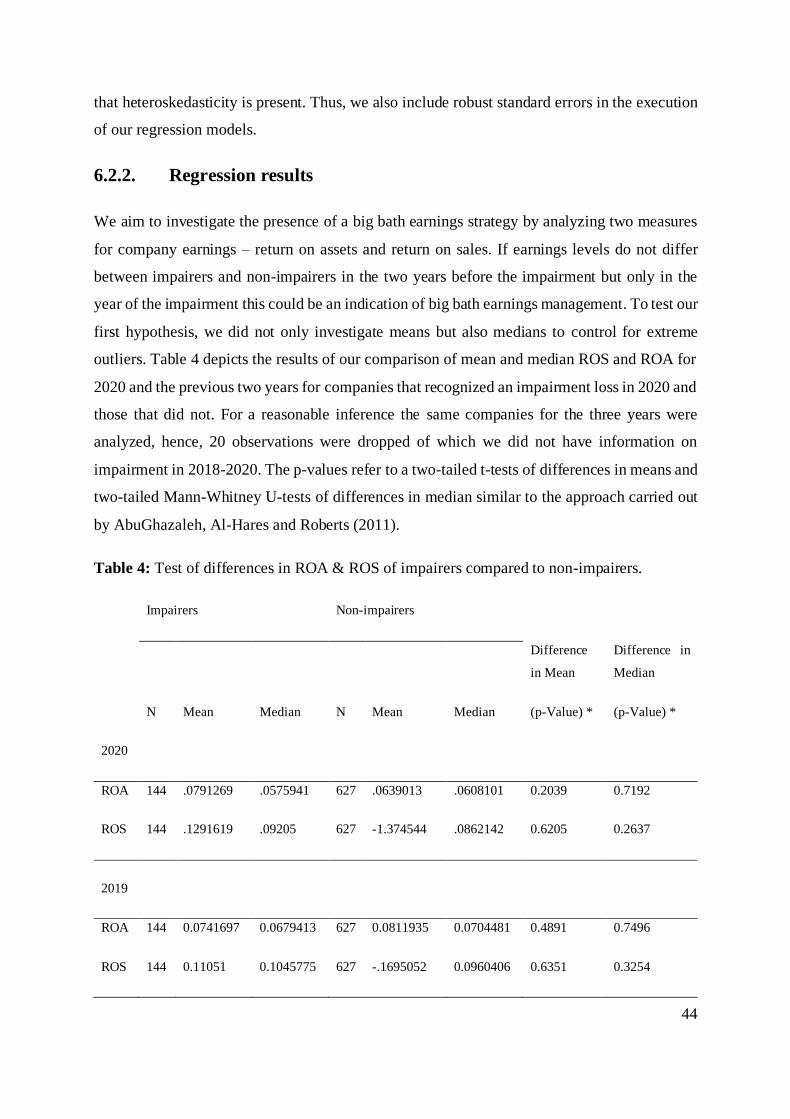
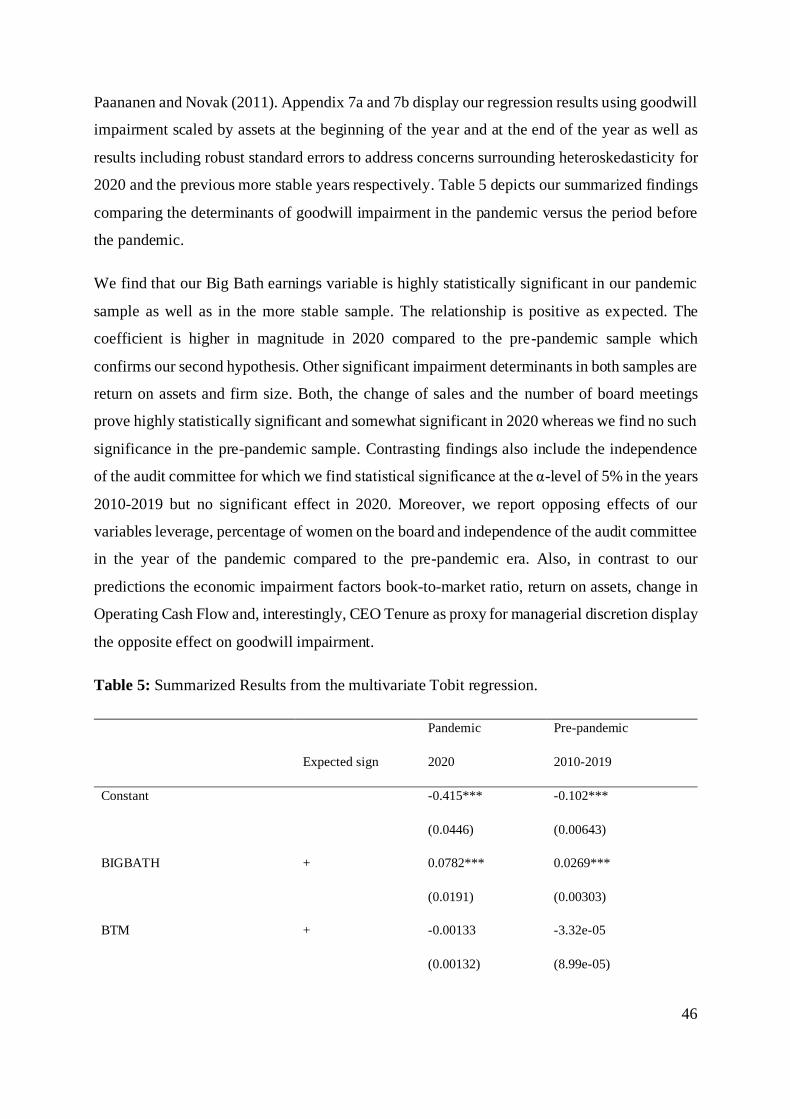
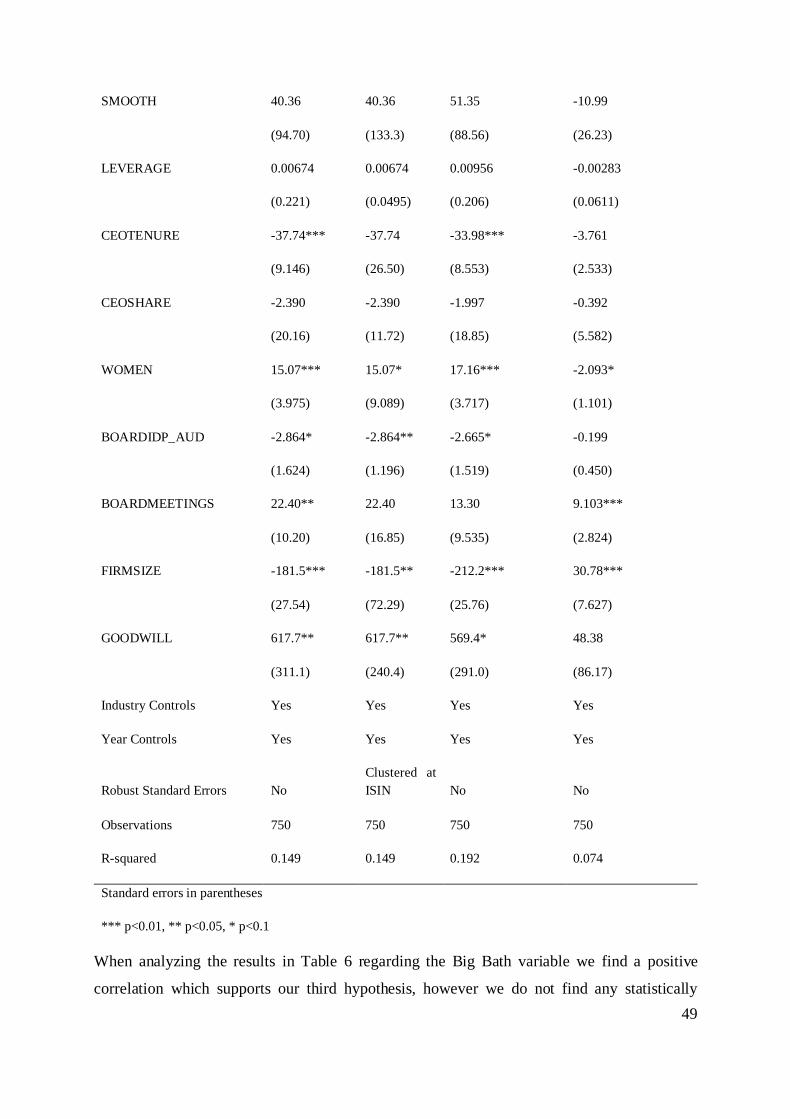
6.2.2. Regression results ................................................................................................ 44
7. Analysis ............................................................................................................................. 51
8. Discussion and Conclusion ................................................................................................. 55
Reference List ........................................................................................................................... 58
Appendix ................................................................................................................................... 63
Page 6
IV
List of Tables
Table 1: Sample Construction ................................................................................................. 33
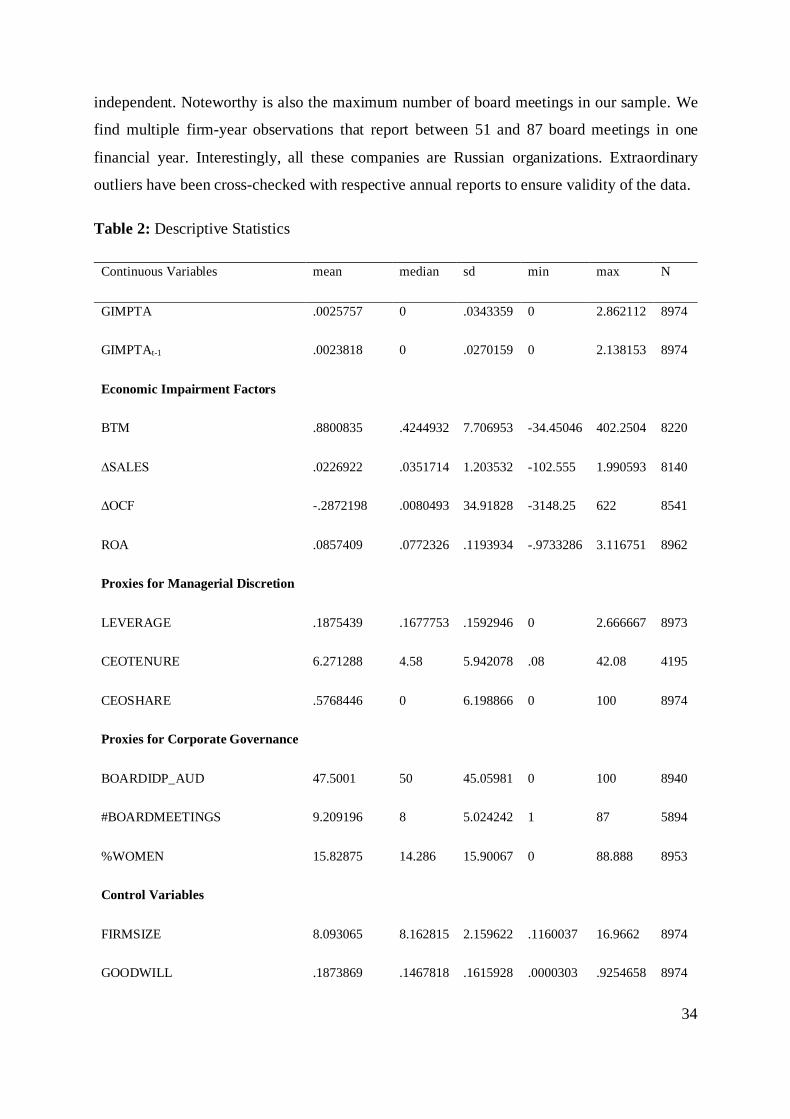
Table 2: Descriptive Statistics ................................................................................................. 34
Table 3: Goodwill impairments scaled by total assets in 2020 by GIC industry. ................... 36
Table 4: Test of differences in ROA & ROS of impairers compared to non-impairers.......... 44
Table 5: Summarized Results from the multivariate Tobit regression. ................................... 46
Table 6: Results of the OLS model on discretionary goodwill impairment ............................ 48
Page 7
V
List of Figures
Figure 1: Evolution of goodwill impairments and market capitalization of S&P Europe 350
companies 2005-2014 ................................................................................................................ 4
Page 8
1
1. Introduction
Even though the impairment-only approach has been adopted since the introduction of the new
standards on goodwill accounting SFAS No. 142 and IFRS 3 in the early 2000s, the debate on
whether the impairment test itself really does deliver the promised increased information
content and better depiction of the underlying economics of the acquisition compared to the
previous amortization approach as claimed by the standard setters (IFRS Foundation, 2020)
remains questionable. In 2015, in its Post-Implementation Review of IFRS 3 based on
comments received from preparers, auditors, academics and investors, the IASB acknowledged
that there are several issues surrounding the impairment test such as complexity, the
unfavorable high costs incurred in the valuation process, the fact that it requires significant
managerial judgement and the tendency of management to recognize impairments in an
untimely manner. Consequently, goodwill impairment was taken on as a research project on the
standard setter’s agenda. In a Discussion Paper in 2020 the IASB elaborated on stakeholders’
concerns regarding the effectiveness of the impairment test and explored whether one can make
it less costly and complex. The Board received numerous comment letters in response
thematizing the managerial discretion in the process and calling for the consideration of the re-
introduction of goodwill amortization. However, the Boards preliminary conclusion remains
unchanged claiming that the impairment test is the “best way to hold a company’s management
to account for its acquisition decisions” (IFRS Foundation, 2020). In contrast, the FASB has
undertaken significant efforts to simplify the heavily criticized impairment test as part of its
technical agenda. In fact, at its meeting in December 2020 the Board explored goodwill
amortization periods and methods for an impairment-with-amortization model (FASB, 2021).
These contrasting courses of action from the standard setting bodies highlight the uncertainty
and ambiguity surrounding goodwill impairment.
1.1. Background
Prior to the introduction of SFAS No. 142 in 2001, SFAS No. 121 dictated goodwill to be
amortized over its estimated useful life but no longer than 40 years. Additionally, if indicators
arose that pointed towards the possibility that the carrying amount of the goodwill could prove
unrecoverable then an assessment of the recoverability of the carrying amount was required (Li
& Sloan, 2017). The carrying amount is perceived as potentially unrecoverable when the
estimated undiscounted future cash flows expected from the asset were lower than the carrying
Page 9
2
amount. If that was the case the carrying amount was to be written down (Li & Sloan, 2017).
The revised standards not only eliminated the amortization of goodwill but also introduced an
annual impairment test. According to SFAS 141 and 142 goodwill is impairment tested at a
reporting unit level in a two-step process. First, the fair value of the reporting unit as a whole is
determined. If this estimated fair value lies above the carrying amount of the reporting unit then
the second step needs to be performed. Here the fair value of all the assets and liabilities
included in the reporting unit is estimated. The residual value of the fair value of the reporting
unit is allocated to goodwill stipulating the implied fair value of that asset. If that fair value
exceeds the carrying amount, then goodwill ought to be impaired to its fair value. Whereas the
fair value is defined as “the amount at which that asset (or liability) could be bought (or
incurred) or sold (or settled) in a current transaction between willing parties, that is, other than
in a forced or liquidation sale” according to the FASB (FASB, 2001). If such a price is not
determinable, then a present value estimation is mentioned as the best alternative, though
multiple valuation is also permitted to some extent (FASB, 2001). As a response to
stakeholders’ criticism regarding the cost and complexity of the impairment test, the FASB has
published Accounting Standards Updates No. 2011-08, Intangibles—Goodwill and Other
(Topic 350): Testing Goodwill for Impairment, and No. 2017-04, Intangibles—Goodwill and
Other (Topic 350): Simplifying the Test for Goodwill Impairment. Thereafter, the first step of
the aforementioned two-step impairment test was relaxed so that preparers could choose to
carry out a qualitative evaluation in order to assess whether the carrying amount of the reporting
unit is more likely than not to exceed its fair value. The outcome of this evaluation determines
whether the preparers must conduct the two-step goodwill impairment test (FASB, 2011; Wen
& Moehrle, 2016). Additionally, the Update in 2018 eliminated step 2 of the impairment test in
the Board’s effort to simplify the procedure even more. Hence, preparers no longer had to
estimate the implied fair value of goodwill but only compared the reporting unit’s fair value to
its carrying amount in order to assess any impairment loss (FASB, 2018).
In 2004, as part of the convergence project between the IASB and FASB, IFRS 3 - Business
Combinations in connection with the revised IAS 36 - Impairment of Assets introduced the new
impairment-only goodwill accounting approach to IFRS adopting countries. Under IAS 36
companies are required to identify any goodwill impairment at least annually at the cash
generating unit (CGU) level (IAS 36.9, IAS 36.66). An impairment is required when the
carrying amount of the CGU exceeds the recoverable amount which is defined as the higher of
Page 10
3
an asset’s fair value less cost of disposal and its value in use (IAS 36.6). Due to difficulties
obtaining market prices many companies opt for the estimation of the value in use which is the
present value of future cash flows expected to be derived from the cash-generating unit. Any
identified impairment loss is recognized as an expense first from the carrying amount of any
goodwill allocated to the cash-generating unit and thereafter, impairment is allocated to the
other assets of that unit (IAS 36.60, IAS 36.104).
When questioning why goodwill accounting was changed in the first place, we find multiple
reasons in the accounting literature. Firstly, the revision of the respective standards aimed to
provide a consistent and comparable accounting treatment of business combinations that
represent the underlying economic substance and value development more appropriately than
the previous amortization method (Seetharaman, Sreenivasan, Sudha & Yee, 2006; Donnelly
& Keys 2002; Jong-Seo, C. & Ji-Ahn, N., 2020). The straight-line amortization of goodwill
was often criticized for its “arbitrary assessment of useful life” (Wines, Daqwell & Windsdor,
2007, p.868) which required extensive managerial judgement. Wen and Moehrle (2016) also
point out that the recoverability test under the previous SFAS 121 impairment test was flawed
since it hardly ever led to the detection of any impairment losses. Ramanna (2008) finds that
the introduction of the impairment-only approach in the US was a result of political pressure
on the FASB exerted by lobbying firms that were discontent with the abolishment of the pooling
method of goodwill accounting which resulted in mandatory amortization of goodwill and thus
a yearly adverse effect on earnings. Other explanations for the shift to the impairment approach
include that the amortization method was said to provide no information to investors about the
performance of a firm’s acquisitions (Ravlic, 2003). In his empirical research Clinch (1995)
found no significant relationship between market reactions and goodwill amortization. Hence
the impairment regime – so the argument goes – is thought to increase the value of information
content conveyed in financial reports available to users of the financial statements (Colquitt &
Wilson, 2002) and better support them in decision-making (Wines, Daqwell & Windsdor,
2007).
In its efforts to inform the debate on goodwill accounting the European Financial Reporting
Advisory Group (EFRAG) conducted a quantitative study depicting the development of
goodwill in Europe and other parts of the world. The study finds, among other results, that
goodwill reported on the balance sheet of the S&P Europe 350 Index companies has increased
by 43 % over the period from 2005 to 2014 (EFRAG, 2015). Further, it shows that goodwill
Page 11
4
constitutes not only the biggest component of the companies’ intangible assets with an average
of 62% but that it also represents up to a noteworthy 19,5% of companies’ total assets
(excluding financial firms) (EFRAG, 2015). These statistics demonstrate that research
surrounding goodwill accounting and the debate over such an increasingly important asset is
highly relevant. Figure 1 depicts the evolution of goodwill impairment of these 350 blue-chip
companies containing firms from 16 different countries in Europe. We note that reported
impairments fluctuate to a great extent yet are highest in years when market capitalization
suffered due to economic downturn such as 2008 or 2011. Interestingly, impairment losses
remained significantly high even after market conditions had already recovered in 2012.
Notes: Numbers in billion euros.
Source: EFRAG (2015)
Figure 1: Evolution of goodwill impairments and market capitalization of S&P Europe 350
companies 2005-2014
A year of economic crisis, such as COVID-19 impacted 2020, which has had severe financial
implications gives rise to the question to what extent European companies are affected and more
specifically, whether the goodwill on their balance sheets has suffered an impairment loss. Due
to the discretionary elements inherent in the estimation of the value in use, one would be curious
whether any recognized impairment charges were economically induced or the result of
managerial decision.
Page 12
5
1.2. Problematization
Goodwill impairment has been associated with a wide spectrum of research in the past,
exploring the implications of the impairment-only approach in various ways. The most
controversial question based on previous studies seems to be whether the impairment test really
is effective. The question of effectiveness not only relates to whether the impairment test
actually accounts for the economic value development of goodwill but also whether it leads to
the timely recognition of an impairment. When effectiveness is achieved, then the impairment
test ought to provide useful information to the users of financial statements, whereas the IASB
considers useful information as such that helps investors to “assess the performance of
companies that have made acquisitions” and “more effectively hold a company’s management
to account for management’s decisions to acquire those businesses” (IFRS Foundation, 2020).
The empirical findings in this field are fragmented. Several studies investigate the market
reactions to impairment announcements (Bens, Heltzer & Segal 2011; Li, Shroff,
Venkataraman, & Zhang, 2011; Hamberg, Paananen & Novak, 2011). The underlying premise
of these studies is that if shareholders significantly react to such announcements, then the
information conveyed by such an announcement must be value relevant to the investors’
assessment of the company and, thus, the impairment test is considered to be somewhat
effective. Bens, Heltzer and Segal (2011), for example, report a significant negative stock
market reaction to discretionary induced goodwill, however, the reaction tends to be weakened
when there is low information asymmetry in the first place or in cases when the impairment test
presents itself to be particularly expensive.
Research on the determinants of impairment losses closely relate to the debate on discretionary
incentives to impair. Multiple studies find support that the economic deterioration of a
company’s goodwill is associated with goodwill impairment but also find managerial incentives
to be a decisive factor which makes the reliability of the financial information questionable
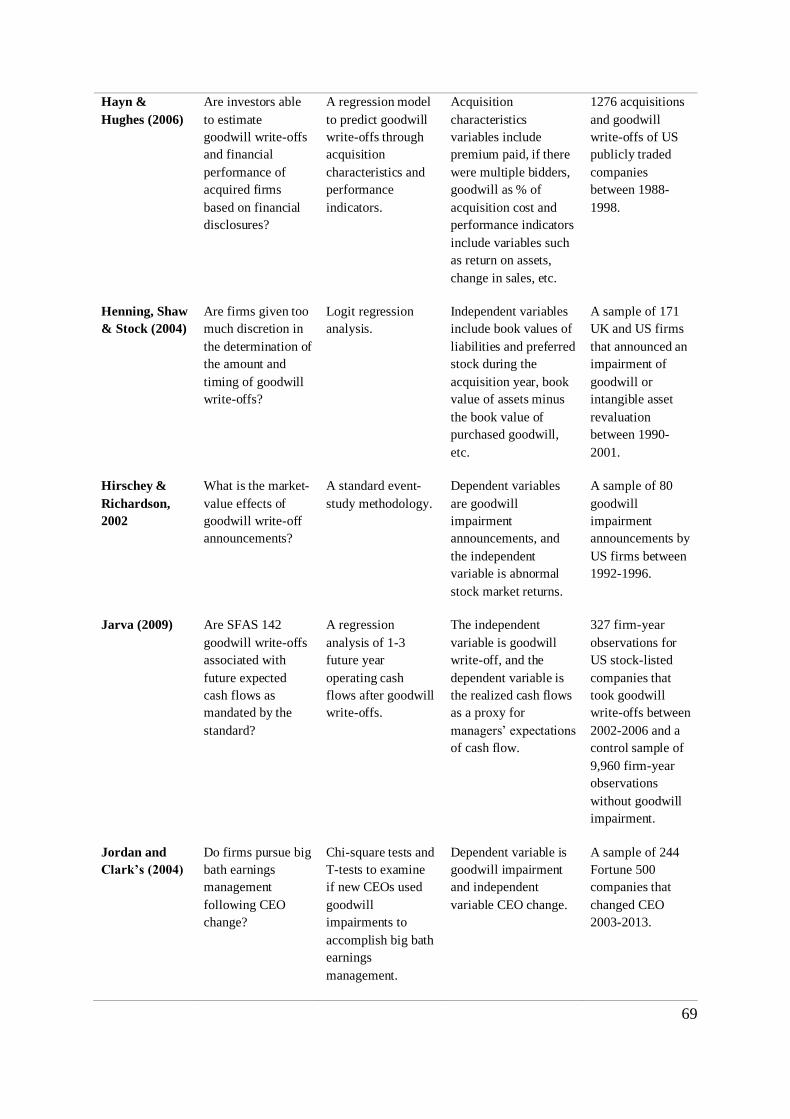
(Jarva, 2009; Henning, Shaw & Stock, 2004; Hayn & Hughes, 2006; Romanna & Watts, 2012).
Yet, studies investigating the discretionary elements inherent in the impairment test seem to
reach contrasting conclusions. Beatty and Weber (2006) find that a company’s leverage, CEO
change, CEO bonuses as well as any market delisting concerns influence not only the
impairment decision but also its timing. AbuGhazaleh, Al-Hares and Roberts (2011) find that
goodwill impairments are associated with managerial agendas such as earnings management or
Page 13
6
management changes but conclude that in the presence of effective disciplining devices
discretionary judgement in the impairment test relates to management’s private information
about the company’s value which they wish to convey to the investors rather than any
opportunistic behavior confirming the IASB’s objectives in the development of the standard.
In contrast, Ramanna and Watts (2012) find support for the exploitation of the discretion
inherent in the impairment test motivated by private incentives and reject the private
information hypothesis. Li and Sloan hypothesized that goodwill under the impairment regime
would only be written down “in the face of overwhelming evidence” (2017, p. 965).
The debate surrounding managerial incentives and goodwill impairment arises from the
numerous assumptions required in the fair value estimation based on present value techniques
and the allocation of goodwill to a cash generating unit. The value in use estimation, more
particularly, the three main variables- the cash flow forecasts, the growth rate and the discount
rate - all allow for great discretionary leeway (Avallone & Quagli, 2015). The resulting fair
values are nearly impossible to verify by investors (Ramanna & Watts, 2012). The impairment
test is conducted at unit level which involves the allocation of goodwill to these units when an
acquisition is made and gives way for opportunistic behavior (Zhang, 2008; Wines, Daqwell &
Windsdor, 2007). Watts (2003) describes this allocation process as unverifiable and arbitrary,
especially in businesses with increasing number and size of units. This “shielding” of goodwill
in the unit could generate unrecognized losses or gains, thus creating units with a high prospect
of delaying or accelerating impairments respectively (Ramanna & Watts, 2012). There is no
clear allocation key and managers could assign goodwill to multiple units as they see
“reasonable and supportable” (SFAS 142.34). Also, the fact that the reversal of any goodwill
impairment losses is prohibited (IAS 36.124; SFAS 142.15) may cause managers to be reluctant
to recognize an impairment until the value deterioration is undeniable (Knauer & Wöhrmann,
2016).
According to agency theory managers will exploit the discretionary elements for their own
benefit (Ramanna & Watts, 2012). Reputational incentives could motivate managers to impair
goodwill on becoming a newly appointed CEO to “clean the slate” from their predecessor and
escape accountability (Francis, Douglas & Linda, 1996; Jordan & Clark, 2015). Remuneration
incentives based on reported earnings may also influence a manager’s decision to avoid
impairment (Ramanna & Watts, 2012). Other studies have found that managers pursue earnings
management strategies in this context (Jordan & Clark, 2004). Kirschenheiter and Melumad
Page 14
7
(2002) argue that earnings management is a natural strategy by management to improve
earnings precision conveyed to investors. They describe an optimal disclosure policy where
managers take a big bath when news is “sufficiently bad” (2002, p. 761) and smooth earnings
when the news is good. Yet, most papers in this field perceive this behavior as undesirable
manipulation or even threat to the integrity of financial reporting (Sevin & Schroeder, 2005).
Some studies in this context have suggested that the big bath strategy is especially exploited in
times of economic crisis (Hayn 1995; Giner & Pardo 2015). When financial performance is
plummeting due to economic circumstances management tends to take advantage of this
depressed earnings situation. This way the economic circumstances are at fault for the
impairment loss and attention is shifted away from the real reasons for poor performance. In
the same vein, an economic crisis could justify the recognition of an impairment loss of an
acquisition which has been underperforming for some time. The underlying rationale for this
tactic is that investors react relatively the same to slightly underperforming companies
compared to very poorly performing companies (Jordan & Clark, 2015).
Previous research on the controversial impairment-only approach seems to have focused on
Anglo-Saxon countries and pre-dominantly investigated the SFAS No 142 setting in the US
(AbuGhazaleh, Al-Hares & Roberts, 2011; Henning, Shaw & Stock, 2004; Wines, Daqwell &
Windsdor, 2007; among many more). We find that studies on the application of IFRS 3/IAS 36
are underrepresented in the literature, even more so at a European level (Knauer & Wöhrmann,
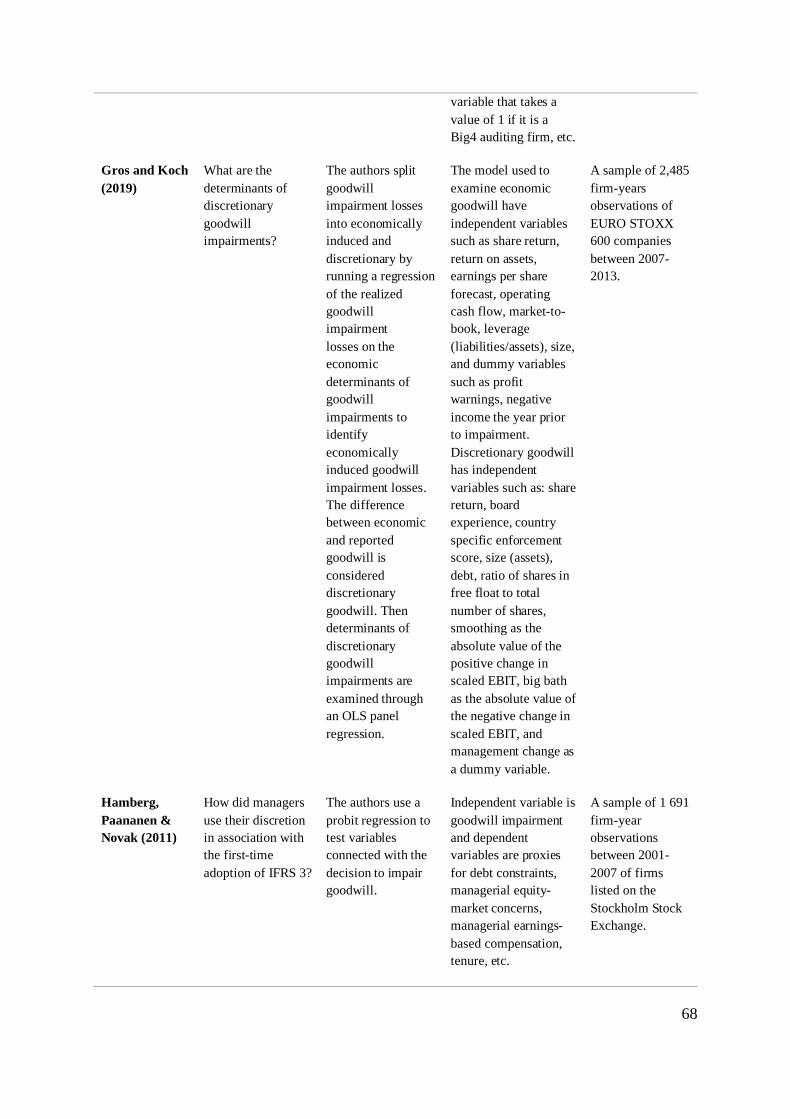
2016; Gros & Koch, 2019; Hamberg, Paananen & Novak, 2011). Also, past studies on goodwill
impairment and earnings management such as big bath have concentrated on this phenomenon
in connection with CEO change (Jordan & Clark, 2015) or studied this topic in general (Elliott
& Shaw, 1988; Kirschenheiter & Melumad, 2002; Sevin & Schroeder, 2005). To our knowledge
only very few empirical studies investigated this relationship in a context of economic crisis in
Europe.1
Investigating Europe’s goodwill impairments in this context compared to American studies
would be value adding due to the differences of the two continents. One difference concerns
the predominant legal environment or enforcement regime. Knauer and Wöhrmann (2016), for
1 Giner and Pardo (2015) study the determinants of the goodwill impairment decision of Spanish companies
between 2005 and 2011 including effects of the financial crisis.
Page 15
8
example, find differences in the market reaction to goodwill impairment based on the investor
protection situation in countries which depends on the legal system (civil law versus common
law). Hence, the divergence in legal regulations can influence the inference of goodwill
impairment studies. Furthermore, the economic environment is slightly different, the 2019 GDP
growth in the United States was 2,2% compared to only 1,6% in the European Union
(Worldbank, 2021). The impact of COVID-19 on the two economies possibly also differs but
the full consequences remain to be seen. Moreover, the US’s net investment rate in nonfinancial
assets has consistently exceeded that in the EU for the past ten years (Worldbank, 2021)
possibly giving rise to higher goodwill recognition on American balance sheets. As stipulated
in Section 1.1. the impairment test under SFAS 142 and IAS 36 is similar but not the same due
to Updates by the FASB which affect the recognition of impairments. Furthermore, we argue
that there may be differences in management styles regarding the pursuit of earnings
management. US studies by Ibrahim, Xu and Rogers (2011) as well as Aubert and Grudnitski
(2014) claim that there is a shift away from such behavior. It is worth exploring whether such
a development can also be observed in Europe.
This paper aims to fill this gap and contribute to the current discussion on the effectiveness of
the impairment-only approach by analyzing discretionary goodwill impairment in a year of
significant economic downturn due to the outbreak of COVID-19. The research links the
findings to contemporary challenges with goodwill accounting such as subjectivity, earnings
management and agency-conflicts.
1.3. Research question & Purpose
The purpose of this paper is to analyze goodwill impairments in a time of financial crises. The
current impairment test has been subject to criticism concerning the influence of managerial
discretion. This study builds on the current literature by exploring discretionary induced
goodwill impairment and linking it to managerial opportunistic behaviors such as earnings
management, more specifically big bath earnings management.
The objective of our research is to investigate the following research question:
Is goodwill impairment in 2020 primarily a result of the economic impacts caused by COVID-
19 or managerial discretion?
Page 16
9
In our efforts to understand this relevant question we wish to dig a little deeper by adding more
depth to our research with the following sub-questions:
• Have companies that chose to impair in 2020 already been performing poorly in
previous years?
• How does big bath management as impairment determinant differ in crisis-ridden 2020
compared to previous more stable years?
• Why would management discretionarily choose to impair in times of crisis?
1.4. Contribution
In contrast to prior research, this study analyzes discretionary goodwill impairment losses in
2020 - a year of financial distress for many companies and industries. Moreover, there is little
empirical evidence based on a European (IFRS) setting. Thus, this research contributes to filling
this research gap by examining discretionary goodwill impairment and earnings management
of European firms. The results offer standard-setters, enforcers, investors and other
stakeholders findings of how the complexity and discretion in goodwill impairment tests are
used in times of a financial crisis and to what extent management acts opportunistically to
manage earnings. The research provides relevant information that could be useful in IASB’s
ongoing research project and discussion on the effectiveness of the impairment test, and the
insights can potentially help standard-setters, auditors and other enforcers to identify certain
drawbacks in the current accounting standards.
1.5. Outline of Thesis
The remainder of this research paper is structured in seven key chapters: Literature review,
Hypothesis Development, Methodology, Data, Empirical Findings, Analysis and Discussion &
Conclusion.
Chapter 2: The Literature Review gives a synthesized overview of previous research on
goodwill impairment and elaborates on the two main literature strands identified in this field –
value relevance and managerial discretion.
Page 17
10
Chapter 3: Hypothesis Development discusses the main hypotheses we attempt to test in our
effort to answer our research questions which are derived from the theories developed by past
studies.
Chapter 4: Methodology elaborates on our research approach containing quantitative
econometric techniques and qualitative elements and discusses the operationalization of our
hypotheses and any limitations to our research.
Chapter 5: Data sheds light on our data collection method, sample size, conduct of interviews,
variables included in our regression model and descriptive statistics.
Chapter 6: Empirical Findings presents our results derived from the interviews and
quantitative research in light of our hypotheses.
Chapter 7: Analysis elaborates on our finding and related implications and also interpretates
our insights in the theoretical context.
Chapter 8: Discussion & Conclusion discusses the main inferences that can be made based on
the empirical evidence and concluding thoughts on our research. In addition, further work in
this field and limitations of our research are described.
Page 18
11
2. Literature Review
In the following section, an overview of empirical research on goodwill write-downs is
outlined. Previous research on goodwill impairment seems to be split into two main strands 1.)
value relevance and 2.) managerial discretion of goodwill impairments. These studies disagree
on the fundamental question of effectiveness of the impairment test, however findings within
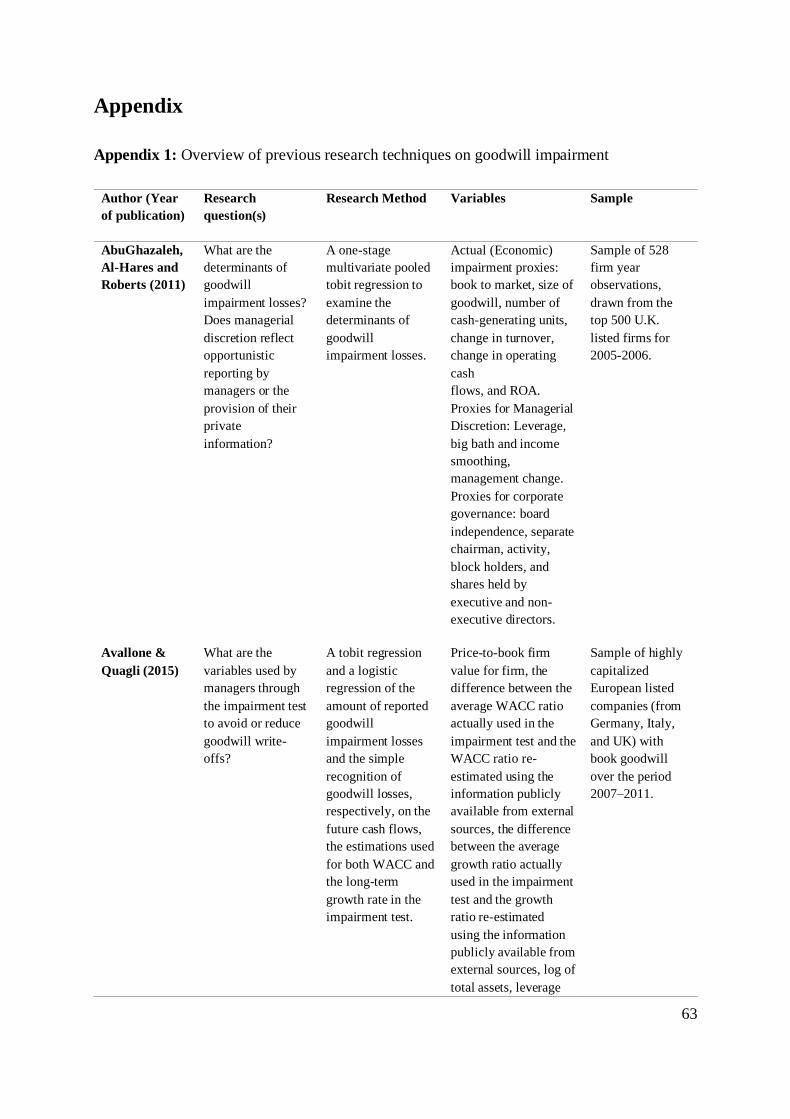
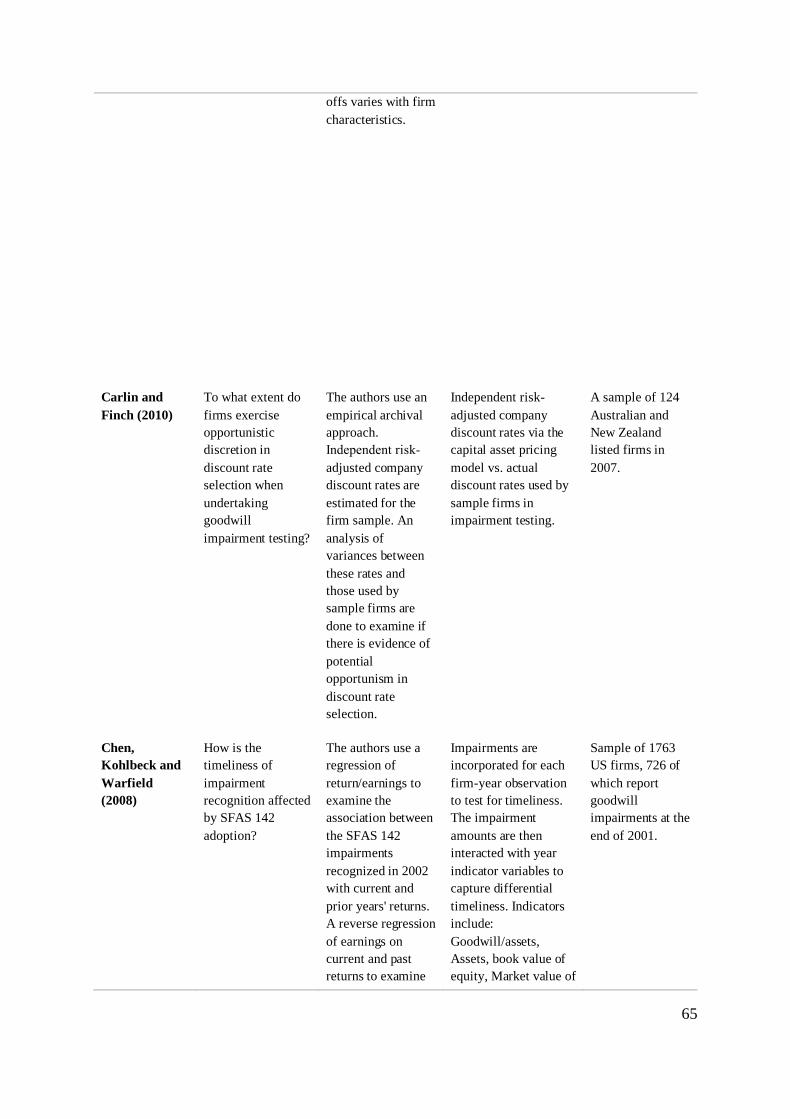
the fields are also fragmented. An overview of the research techniques used in the following
referenced literature can be found in Appendix 1.
2.1. Value relevance (signaling theory)
If goodwill impairments represent new information to investors about future cash flows, it
would be expected that share prices decline upon the announcement. Alternatively, if
managements delay impairments, share prices may drop ahead of announcements due to
investors capturing impairment company value effects in advance, and announcements would
then only have confirmatory value (Boennen & Glaum, 2014). Additionally, positive signaling
effects may occur in cases where an impairment announcement signals that management
acknowledges the goodwill deterioration and will act to improve future cash flows (Francis,
Douglas & Linda, 1996; Hirschey & Richardson, 2002).
This phenomenon is examined in numerous information content and value relevance studies,
which generally find negative correlation between stock returns and goodwill impairment
reporting. Thus, these studies conclude that the impairment-only approach enables managers to
convey new value relevant information to capital markets. For example, Francis, Douglas and
Linda (1996) find that stock prices show significant negative effects to impairment
announcements for US firms in the years 1989-92, indicating that announcements on average
provide value relevant information and decrease investor expectations to a greater extent than
any potential positive signaling effects. Similarly, Hirschey and Richardson (2002) find
significant negative abnormal return for US companies in the years 1992-96 after goodwill
impairment announcements. In the same vein, AbuGhazaleh, Al-Hares and Roberts (2011) find
a significantly negative association between goodwill impairment charges and stock prices in a
UK-based study under IAS 36. Xu, Anandarajan and Curatola (2011) find that goodwill
impairment charges generally are viewed as new and value-relevant information, however, the
signal is moderated by company profitability. For profitable firms, goodwill impairment
Page 19
12
charges decrease investor expectations but for unprofitable firms the negative signals are muted.
The results of these studies indicate that a goodwill impairment announcement is viewed as
reliable indicator of economic performance and future cash flows and is incorporated in
company valuations by investors.
Chen, Kohlbeck and Warfield (2008) find that the timeliness of goodwill impairment
announcements improved after the adoption of SFAS 142. Moreover, Jarva (2009) finds
evidence that goodwill impairment losses under SFAS 142 have a significant correlation to
future operating cash flows, which is supported by Lee (2011), who finds evidence that
goodwill impairment recognition has improved prediction of companies’ future cash flow after
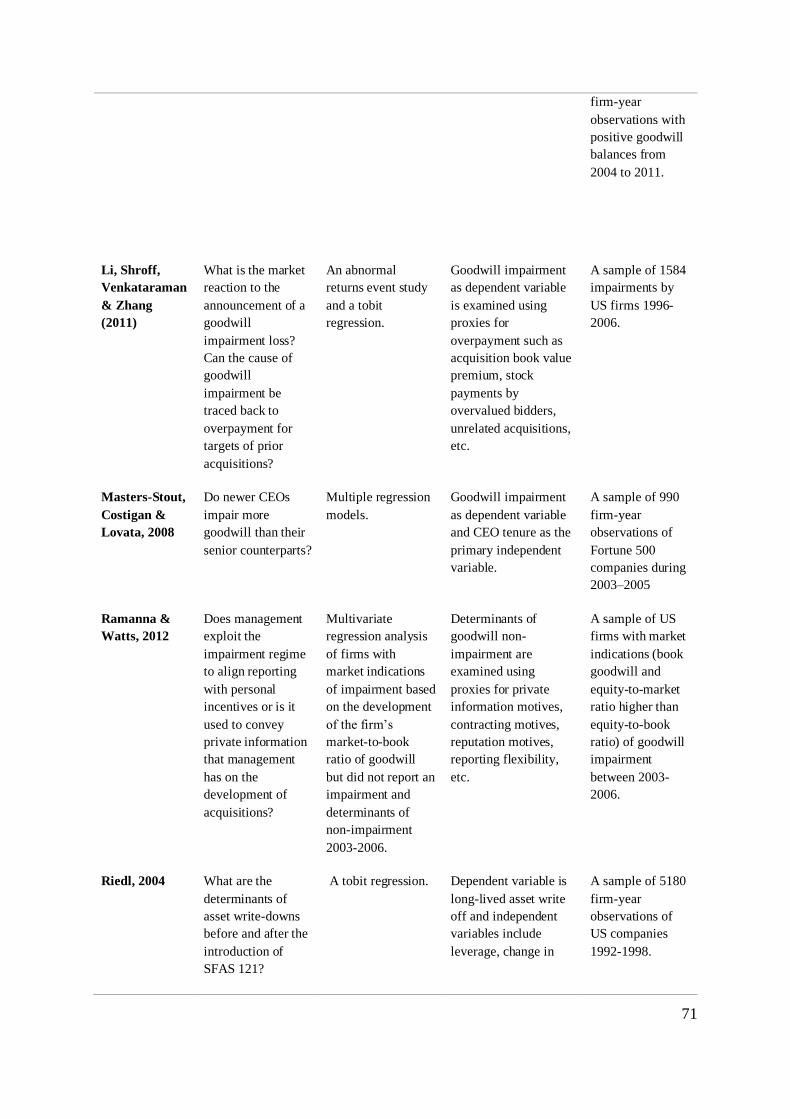
the adoption of SFAS 142. Li, Shroff, Venkataraman and Zhang (2011) also report that
goodwill impairment charges are negatively correlated with income and sales growth for the
two following years after it has been reported. These findings generally indicate that the
impairment test is associated with the underlying economic performance of an organization.
In this context, the results of Bens, Heltzer and Segal (2011) and Li et al. (2011) are noteworthy.
The studies compare information content of goodwill impairment announcements prior to and
after the adoption of SFAS 142. These studies analyze US companies for the years 1996-2006
and both studies find value relevance of goodwill impairment announcements but that there has
been a significant weakening of negative stock impacts of goodwill announcements after the
introduction of SFAS 142, suggesting that goodwill impairments have become less reliable after
the adoption of SFAS 142. The authors speculate that the lower impact, however, may be
attributable to smaller and more frequent goodwill impairments more common in the
impairment-only era. Bens, Heltzer and Segal (2011) also find evidence that the information
content of goodwill impairment announcements has declined for companies with low
information asymmetry, using analyst followings as a proxy. Li and Sloan (2017) report similar
evidence of impairments under SFAS 142 being less timely than under SFS 121. Moreover,
their findings suggest that goodwill impairments lag deteriorating economic performance and
stock returns by at least two years suggesting managers use discretion in their goodwill
impairment by delaying its reporting. Analyzing impairment recordings under IAS 36 and
SFAS 142, Knauer and Wöhrmann (2016) find a more negative market reaction to impairment
announcement in civil-law countries which tend to have lower levels of investor protection
compared to common-law countries.
Page 20
13
2.2. Managerial discretion (agency theory)
Numerous studies also investigate whether managers strategically delay or accelerate write-offs
to manage earnings (Hayn & Hughes, 2006; Zang, 2008; Ramanna & Watts, 2012; Li & Sloan,
2014). This is often discussed in the context of income smoothing and big bath earnings
management. Income smoothing involves overstating goodwill impairment when pre-
impairment earnings are exceptionally high to stabilize income over time. By recording an
impairment loss, management may cause the earnings to be closer to the expected level (Riedl,
2004; AbuGhazaleh, Al-Hares& Roberts, 2011; Siggelkow & Zülch, 2013). Big bath
accounting involves overstating impairment when pre-impairment earnings are exceptionally
low in order to improve future earnings (Henning, Shaw & Stock, 2004).
There are conflicting findings and evidence on the use of income smoothing and big bath
accounting when it comes to goodwill impairments. Managers have been shown to manipulate
growth rates to manage earnings and convince auditors and analysts that there is no need for
impairment (Avallone & Quagli, 2015). Zucca and Campbell (1992) find that asset impairments
and write-downs are more likely to be reported in periods with unexpectedly low earnings,
which is consistent with big bath earnings theory. A more recent study focused on European
companies under IFRS by Van de Poel, Maijoor and Vanstraelen (2009) finds that firms impair
goodwill more frequently when earnings are unusually low or high, indicating that managers
use big bath accounting and income smoothing. AbuGhazaleh, Al-Hares and Roberts (2011)
also find evidence that managers are exercising discretion in the reporting of goodwill
impairments following the adoption of IFRS 3. Specifically, goodwill impairments are
associated with income smoothing and big bath reporting behaviors. However, managers
disciplined by effective governance mechanisms are less likely to act opportunistically but
instead exercise their accounting discretion to convey their private information about future
cash flows. Gros and Koch (2019) take an alternative approach by dividing goodwill
impairment losses into economically induced and discretionary parts and analyze the
determinants of discretionary parts instead of the fully reported goodwill amount. The results
suggest that discretionary goodwill impairment losses are used opportunistically rather than
informatively, but also that opportunistic behavior is constrained by strong corporate
governance and enforcement mechanisms. Jordan and Clark’s (2004) results suggest that
Fortune 100 companies practice big bath earnings management upon the adoption of SFAS No.
Page 21
14
142. Sevin and Schroeder (2005) find support for Jordan and Clark’s (2004) findings of big
bath earnings management in SFAS 142’s year of adoption. Additionally, the study shows that
small firms exercised big bath earnings management while large firms displayed no such signs.
Francis, Douglas and Linda (1996) find contrasting results of income smoothing and big bath
theories: write-offs are less likely for companies with unusually poor or good performance. This
study, however, was made before the impairment-only approach and relates to all sorts of
discretionary asset write-offs and is therefore not focused on goodwill impairments specifically.
Research has shown that agency motives lead managers to manipulate earnings through
goodwill impairment discretion. Ramanna and Watts (2012) investigate the goodwill
impairments and agency-based management incentives and find evidence that managers use the
discretion inherent in goodwill impairment opportunistically instead of conveying private
information. The findings are supported by Li and Sloan (2017) and Carlin and Finch (2010)
who find evidence of opportunistic behavior such as delayed impairments and discount rate
manipulation. Managers may exploit the discretion in goodwill accounting to manage earnings
for their personal motives. This may be done to protect personal income and wealth (Darrough,
Guler & Wang, 2014). There is evidence that suggests companies with cash bonuses tied to
earnings report less goodwill write-offs (Beatty & Weber, 2006; Ramanna & Watts, 2012).
Lapointe-Antunes, Courmier and Magnan (2008) find that organizations with managers that
hold a high level of stock options are less likely to write off goodwill.
Another motive for earnings management discussed in studies on goodwill impairment is the
potential effect of the impairments on managers' reputation. Several studies find negative
association between goodwill impairment and CEO tenure (Francis, Douglas & Linda, 1996;
Beatty & Weber 2006; Masters-Stout, Costigan & Lovata, 2008; Zang 2008; Hamberg,
Paananen & Novak, 2011; Ramanna & Watts 2012) creating a clear motive for managers to
delay impairments in order to avoid reputational damage. Goodwill of acquisitions made by
previous CEOs has been shown to be more likely to be impaired by newly appointed CEOs
who do not hold responsibility for the acquisition. A reason for this may be that new CEOs
exercise big bath accounting to improve future financial performance without causing personal
reputational damage. Moreover, financial results are generally irrelevant to managerial
compensation during the first financial year of tenure. Formal compensation contracts usually
come into operation at the start of the second year of tenure (Wells, 2002). Contrasting to these
findings, Jordan and Clark (2015) find that goodwill impairments reported in the US no longer
Page 22
15
seem to be recorded opportunistically by new CEOs. The opportunistic use of discretion to
delay goodwill impairments may also involve more firm-wide motives and can stem from
factors such as binding debt covenants or other debt related variables (Beatty & Weber, 2006;
Ramanna & Watts, 2012; Riedl, 2004; Zang, 2008).
Studies on big bath management have found significant results when analyzing times of crisis.
Giner and Pardo (2015), studied goodwill impairment losses of Spanish-listed companies
between 2005 and 2011, a period that embraces the financial crisis. Their results suggest that
managers are exercising significant discretion, using big bath and smoothing strategies to
control goodwill impairment losses. The analysis suggests that the macroeconomic
environment influences opportunistic and unethical behaviors. Although a different type of
crisis, Cheng, Park, Pierce and Zhang (2019) find that companies experiencing a natural disaster
are more likely to take a goodwill impairment loss. They find signs of opportunistic behaviors,
with firms experiencing natural disasters being associated with increased year-over-year
changes in ROA, higher buy-and-hold returns, and relatively higher executive compensation in
the years following the natural disaster.
To summarize, it can be concluded that previous research has found strong evidence that
goodwill impairment announcements under SFAS 142 and IFRS 3 provide value-relevant
information to capital markets. However, there seem to be conflicting findings on whether
SFAS 142 and IFRS 3 improved the reliability and timeliness of goodwill impairment reporting.
Likewise, there is an intense debate in academia on the degree of opportunistic contra effective
use of the inherent discretion in impairment-only rules. However, the majority of studies in this
line of research find evidence that managers exploit the discretion inherent in the accounting
rules opportunistically to some extent. The few studies on managerial discretion during crises
suggest that the opportunistic side of the discretion is amplified in times of poor macroeconomic
environments through big baths to improve future earnings. Our research adds upon the research
by Giner & Pardo (2015) and Cheng et al. (2019) about the presence of big bath earnings
management in times of crises and natural disasters by analyzing managerial discretions in the
pandemic filled year of 2020. Moreover, the study focuses on goodwill impairments of
European companies under IFRS, an area which has received less research attention compared
to US firms.
Page 23
16
3. Hypothesis Development
Inspired by previous studies on the managerial discretion inherent in the goodwill impairment
test we would like to investigate the effect of earnings management in various ways. Hence, we
formulate multiple hypotheses in order to answer our research questions and related sub-
questions. As stipulated by previous research a big bath strategy is most likely pursued when
the current year earnings are generally relatively low (Sevin & Schroeder, 2005) or “news is
sufficiently bad” as described by Kirschenheiter and Melumad (2002, p. 761). In their
comparison study of companies reporting goodwill impairment in 2002 to those that did not,
Jordan and Clark (2004) argue that the future cash flow potential inherent in the value of
goodwill does not deteriorate within one year and that an impairment is only warranted when a
company has been subject to declining economic performance for a certain number of years,
thus, any impairers that report similar earning levels to non-impairers in the years prior to the
impairment but depressed earnings in the year of impairment must have carried out the write-
down as an opportunistic attempt to “clear the decks” (2004, p. 63). Sevin and Schroeder
confirm (2005) these findings in a similar study of large and small firms in 2002.
However, interestingly, in their research of more recent companies, Jordan and Clark (2015)
find that the performance of impairers is, in fact, negatively associated with depressed earnings
in the years prior to the impairment and is economically warranted rather than the result of any
opportunistic discretion. These ambiguous findings lead us to investigate the performance of
companies that recorded an impairment in 2020 compared to companies without any goodwill
write-down. We formulate the following hypothesis:
H1: Relative to non-impairers, the performance of impairers was lower in the year of goodwill
impairment and the previous years.
If rejected and earnings were only depressed in the year of impairment with no prior evidence
of undesired performance development, the presence of big bath earnings management could
be implied. It seems doubtful that one year of poor performance would cause the value in use
and the inherent future cashflow predictions to be significantly affected and that year would
arguably present itself to be a good time to “take the hit” (Jordan & Clark, 2004).
Alternatively, one could argue that COVID-19 is an extraordinary situation with uncertain
economic implications for the years to come. As the value in use of goodwill or more
Page 24
17
specifically, the CGU, is based on management’s estimation of future cash flow the uncertainty
regarding the future recovery of financial stability may actually warrant a goodwill impairment,
especially in industries that were significantly negatively affected by COVID-19 measures. We
believe the input derived from the semi-structured interviews will assist us in our inference of
the quantitative findings to this hypothesis.
“Clearing the deck” seems to be even more the case in times of a general economic downturn
or financial crisis which can be taken advantage of in order to recognize impairments
discretionarily. Cheng et al. (2019) suggest that exogenous shocks such as hurricanes or other
natural disasters for which the exact financial consequences are difficult for shareholders to
verify create a possibility for management to reverse previous upward earnings management
by taking a big bath so that desirable earnings levels can be re-established in the following
years. Such circumstances are attractive since the market does not punish managers more for
admitting poor performance when the economic environment in general is underperforming
compared to market expectations (Jordan & Clark, 2015).
Sandell and Svensson (2017) have found that when disclosing reasons for the impairment losses
the market is often used as an excuse to escape personal accountability. When performance
does not live up to shareholders’ expectations the cause is conveniently attributed to external
factors which are not within management’s control. An unexpected crisis such as COVID-19,
for example, constitutes an event that could not possibly be anticipated by management which
makes it a somewhat acceptable excuse (Sandell & Svensson, 2017). We, therefore, expect
impairers in 2020 to have determined their goodwill impairment based on opportunistic
earnings management motives, more so than in years prior to the negative economic impact.
This discussion leads us to our second hypothesis:
H2: There is a stronger association between big bath earnings management and goodwill
impairment in times of economic crisis compared to previous more stable years.
We wish to take this analysis of big bath earnings management even further by differentiating
between expected goodwill impairment based on anticipated impairment due to economic
factors and unexpected or “discretionary” goodwill impairment similar to approaches carried
out by Li et al. (2011) and Gros and Koch (2019). This brings us to our third hypothesis:
H3: The pursuit of big bath earnings management is positively correlated with discretionary
goodwill impairment in times of crisis.
Page 25
18
4. Methodology
Based on the theoretical foundation established in previous research on goodwill impairment
we intend to adopt a deductive approach. We aim to transform the above-stated hypotheses into
an operational empirical form. While deductive research gives a clear direction of the research
process, it also contains an inductive component (Bryman & Bell, 2017). When reflecting on
our empirical results we will revisit academic literature and reflect on how our findings fit into
the theoretical background.
According to Bhattacherjee (2012) deductive or so-called theory-testing research reaps greater
insights when multiple contrasting theoretical strands surrounding the same research field are
established. Regarding goodwill impairment, we have identified two main strands with multiple
facets that present competing opinions on whether the exercise of discretion inherent in the
goodwill impairment is either a signal of value relevance or private information conveyed by
management about the future earnings potential of a company’s acquisitions or a sign of
opportunistic behavior such as earnings management. Since we aim to investigate goodwill
impairment in the context of an existing theory i.e., big bath earnings management which we
wish to verify in times of crisis we find a deductive approach most suitable.
In light of our research questions and the numeric nature of goodwill impairment we opt for a
quantitative method in order to analyze the relationship between the numeric figures and
opportunistic behavior. While quantitative findings help to identify any relationships between
variables, we also wish to deepen our understanding of why companies engage in such behavior
as part of our research and desire to supplement our insights with a qualitative technique. The
technique applied should be geared to answering the respective research question(s). While the
application of a mixed method approach has been subject to increasing popularity and
acceptance (Bryman & Bell, 2017), it does hold some pitfalls. Based on the paradigm argument
claiming that qualitative and quantitative research are separate paradigms Bryman and Bell
(2017) recommend to fully integrate the two components with each other and interweave the
findings as many researchers only connect the two superficially resulting in a fragmented
research design.
We aim to pursue the facilitation approach of mixed methods research where we employ a
qualitative research technique in order to support the quantitative research strategy. As the data
Page 26
19
collected for our econometric analysis forms the basis for selecting our interviewees, these
interviews ought to provide us with contextual insights on why managers pursue big bath
earnings management, support for interpretation of the relationship between variables and some
validity for the proxies used. To our knowledge, almost all academic studies on goodwill
impairment carry out quantitative research of some sort. To facilitate comparison and validity
of our contribution we wish to follow previous quantitative work yet aim to add more value by
providing a “more rounded picture” (Bryman & Bell, 2017, p. 640).
4.1. Qualitative Research approach
In order to guide the quantitative analysis, we employ a qualitative research approach in the
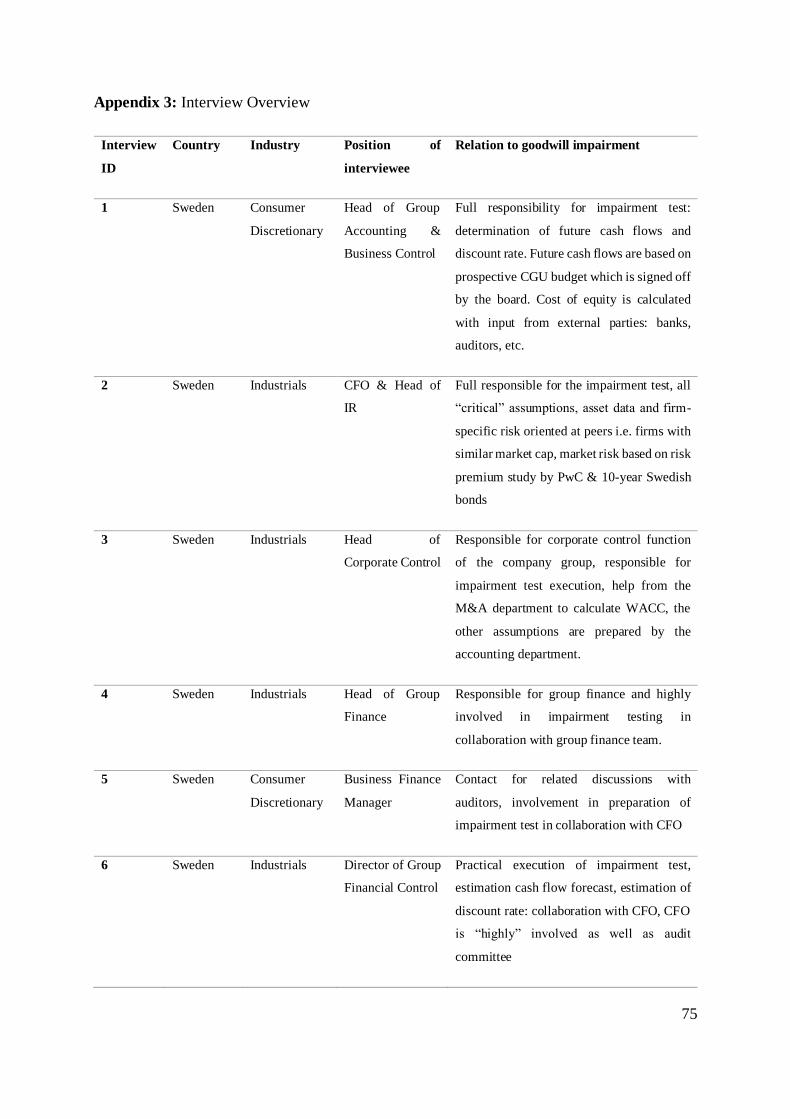
form of flexible semi-structured interviews with seven managers at different companies with
hands-on experience of goodwill impairment tests under IAS 36. This qualitative approach
proves to be a helpful starting point in our research approach as it facilitates the development
of our quantitative model by gathering in-depth practical information from practitioners in the
field.
Previous studies in the research field are overwhelmingly quantitative, and thus, we incorporate
qualitative aspects to our research with the intention to increase the understanding of the link
between goodwill impairment and managerial discretion and enhance the generality (Bryman
& Bell, 2017) of our findings. Our interview questions were formulated in a manner to obtain
detailed information to answer the sub-question as to why managers would discretionarily
choose to impair goodwill in times of crises. The qualitative research provides contemporary
insights from practitioners and adds a layer of context that facilitates interpretation of the
quantitative findings. By adopting a mixed method approach we therefore overcome some
limitations of the research in this field, which has predominantly relied on quantitative methods.
For instance, the incorporation of qualitative data helps us challenge and verify many of the
assumptions made in the research field.
4.2. Quantitative research approach
The quantitative techniques employed in previous related research are diverse. Appendix 1
depicts an overview of the research approaches chosen by past studies as well as variables
included in the regressions employed. Past techniques involve tests of descriptive statistics,
Page 27
20
tobit, probit, logistics, OLS regressions, event studies and many more variations. Appendix 1
was used as guidance for the development of our quantitative techniques and set-up of the
regression models. In order to investigate our initial hypothesis concerning the earnings
situation of impairment companies in 2020 and prior years relative to non-impairers we will
employ a test of differences in the mean and median of financial performance similar to Jordan
and Clark (2004).
The second hypothesis relates to the investigation of determinants, especially big bath earnings
management of goodwill impairment. This relationship can best be analyzed using a tobit
regression (AbuGhazaleh, Al-Hares & Roberts, 2011) incorporating a number of determinants
such as accounting-based measures, market indicators, managerial discretion motives,
corporate governance mechanisms, other firm characteristics and a macro-economic variable.
A tobit regression is a suitable technique due to our dependent variable being left censored i.e.,
goodwill impairment has a lower limit of zero.
Finally, as part of our third hypothesis we aim to estimate the economically induced impairment
by means of a OLS regression on the identified economic impairment factors and analyze the
effect of the pursuit of big bath earnings management on the discretionary impairment in times
of crisis, whereas times of crisis refers to the year of the pandemic crisis in 2020.
4.3. Econometric Method
Our research investigates not only the effect of the pursuit of a big bath earnings strategy on the
impairment decision in 2020, but also the difference in determinants to previous years and
discretionary determinants.
The method employed to test our initial hypothesis concerning potential big bath motives in the
year of impairment by investigating the profitability of businesses prior to the impairment in
2020 relative to non-impairers is a statistical test of differences in the median of financial
performance employing a Mann-Whitney U-test and an independent T-test for differences in
means. The sample of companies will be separated into a group of firms that reported a goodwill
impairment in 2020 (“impairers”) and those without any goodwill write-down (“non-
impairers”) based on an impairment dummy variable. Thereafter, the median and mean
financial performance in 2020 and the previous two years of these two groups will be compared
for each year separately, similar to the approach conducted by Jordan and Clark (2004). As
Page 28
21
measure of financial performance, we use two metrics commonly identified as “big bath
indicators” in previous studies (Jordan & Clark, 2004; Sevin & Schroeder, 2005; Abuaddous,
Hanefah & Laili, 2014; AbuGhazaleh, Al-Hares & Roberts, 2011): return on sales (ROS) and
return on assets (ROA) whereas these refer to EBIT before goodwill impairment scaled by sales
and total assets, respectively.
In our ambition to gain in-depth understanding of what determined a goodwill impairment in
2020 compared to previous more stable years and test our second hypothesis we run a
multivariate tobit regression for our sample in 2020 and separately for the previous “more
stable” 10 years (2010-2019) and aim to compare and discuss the estimated determinants.
Following Lapointe-Antunes, Courmier and Magnan (2008), Beatty and Weber (2006) and
Francis, Hanna and Vincent (1996) we employ a tobit regression to analyze the determinants
of the goodwill impairment. As argued by AbuGhazaleh, Al-Hares and Roberts (2011) and
validated by several researchers (Jong-Seo & Ji-Ahn, 2020, among others) a tobit regression
model is best suited to investigate a dependent left censored variable such as goodwill
impairment which has a lower limit of zero since goodwill impairment cannot be reversed.
We state the following baseline regression model:
Goodwill Impairmentit = β0 + β1 Big Bathit + β2 (Proxies for Managerial Discretionit) + β3
(Proxies for Corporate Governanceit) + β4 (Economic Impairment Factorsit) + β5 (Firm-specific
Controlsit) + β6 GDP + Year Controls + Industry Controls + μ
(1)
The dependent variable is goodwill impairment measured in multiple ways to ensure robustness
of our results as discussed in Section 5.1.1, big bath earnings management is measured as an
indicator variable for negative pre-impairment earnings as elaborated in Section 5.1.2., proxies
for managerial discretion include leverage, earnings smoothing, CEO tenure and shares held by
the CEO. Proxies for corporate governance consist of board independence of the audit
committee, number of board meetings and percentage of women on the board. Economic
impairment factors include the book-to-market ratio, change in sales, change in operating cash,
and return on assets (see Section 5.1.3), firm-specific controls include the amount of goodwill
and firm size. We further control for GDP to eliminate the effect of economic downturn on the
Page 29
22
outcome variable as well as any industry effects. The change in GDP ought to control for any
dynamics in the macroeconomic environment.
Thereafter, inspired by Li et al. (2011) and Gros and Koch (2019) we aim to predict the
economically induced or “expected” goodwill impairment and wish to analyze the unexpected
component as part of our overall research question and test our third hypothesis. In order to
estimate the economically induced goodwill impairment we regress the economic impairment
factors identified in model (1) on goodwill impairment using an ordinary least squares
regression on our whole sample for the time period 2010-2020. Using the fitted values from
that regression we predict the expected goodwill impairment. The difference between the
estimated economically induced impairment and the reported impairment stipulates the
unexpected component. It seems that the execution of an OLS regression is the most common
econometric technique used in prior studies (Giner & Pardo, 2015; Avallone, & Quagli,2015;
Ramanna & Watts, 2012) despite any concerns of bias due to the censored distribution of
goodwill write-off (Maddala, 1991) and Madalla (1991) suggests that an OLS may be
appropriate under certain circumstances. Thus, in order to understand the effect of different
variables relating to opportunistic behavior on the unexpected impairment component of
impairments in 2020 (time of economic crisis) we employ the following regression model:
Discretionary Goodwill Impairmentit = β0 + β1 Big Bathit + β2 Smooth + β3 Leverage + β4 CEO
Tenure+ β5 CEO Shares+ β6 Board Independence of Audit Committee + β7 Number of Board
Meetingsit + β8 %Women on Board + β9 (Firm-specific Controlsit) + Year Controls + Industry
controls + μ
(2)
The variables used to investigate the discretionary goodwill impairment are the same as
subsumed in model (1) as proxies for managerial discretion and corporate governance. Previous
studies on goodwill impairment have found either a positive impact or a mitigating effect of
these variables on discretionary leeway when estimating goodwill impairment. We would find
it an interesting endeavor to analyze these variables in the context of discretionary goodwill and
not just the whole reported amount to see which factors dominate when economic impairment
factors are taken aside. The proxies employed are elaborated in Section 5.
Page 30
23
4.3.1. Diagnostic Tests
4.3.1.1. Multicollinearity
Multicollinearity is present when independent variables are perfectly correlated which results
in omission of one of the variables and unreliable statistical results. In order to analyze the
existence of potential multicollinearity between explanatory variables we examine the variance
inflation factor.
4.3.1.2. Heteroskedasticity
We will conduct a White’s tests and examine a histogram for the presence of heteroskedasticity
in our regressions which indicates that the variance between the variables and the error term is
not constant negatively affecting the reliability of the standard errors in the OLS regressions.
The null hypothesis underlying the White’s test predicts homoskedasticity, if rejected,
heteroskedasticity is indicated and robust standard errors will be adopted in the OLS regressions
to address the problem.
4.3.2. Limitations
Regarding possible shortcomings of our models, we would like to shed light on any concerns
of omitted variable bias that arise from the limited data access and time constrains of this
research. CEO compensation is commonly used in previous literature (Beatty & Weber, 2006;
Darrough, Guler & Wang, 2014; Hamberg, Paananen & Novak, 2011) as a proxy for private
incentives to carry out goodwill impairments discretionarily or rather avoid impairments
(Ramanna & Watts, 2012). The omitted variable bias is determined by the effect of CEO bonus
on goodwill impairment and the correlation of CEO bonus and our main explanatory variable -
big bath earnings management. Based on previous findings by Beatty and Weber (2006), among
others, we have reason to believe that CEO compensation negatively affects goodwill
impairment. Certain performance-based bonuses tend to be dependent on reported earnings
making unattractive any impairment which would reduce earnings thus indicating a negative
relationship. Darrough, Guler and Wang (2014) find that the recognition of goodwill
impairments results in a reduction in option based as well as cash-settled CEO bonuses and
argue that this shall act as a deterrent for excessive risk-taking regarding acquisitions. Despite
these findings they acknowledge that some compensation committees may correct CEO pay to
Page 31
24
exclude extraordinary items such as goodwill impairment. Two interviewees confirm this
notion and describe that they do not perceive CEO compensation to be a relevant factor in
determining goodwill impairment because 1) goodwill impairment is corrected in calculating
the basis for CEO bonuses and 2) the CEO is not even involved in the impairment test. Thus,
whether CEO compensation really has a significant effect on goodwill impairment is
questionable, nevertheless, any bias resulting from the omission of such a variable would also
depend on the relationship between CEO bonus and big bath earnings management. In which
direction CEO earnings-based bonus plans affect the pursuit of earnings management is unclear.
Possibly, taking a big bath to “clear the decks” and lighten up future earnings levels is positively
related to CEO bonuses, and so the omission of CEO compensation would indicate a negative
bias.
Furthermore, our model may suffer precision due to unobservability of CGU-specific data. The
performance for Cash Generating Units is not retrievable, thus, following previous studies such
as Gros and Koch (2019); AbuGhazaleh, Al-Hares and Roberts (2011) we carried out the
regression based on firm-wide impairment indicators.
The majority of the studies in this research field are based on US data, with a few additional
UK, Australian and EU studies. One should be cautious in generalizing and applying findings
from one institutional environment to another. There are, for example, indications of uneven
application of IFRS between different countries because of differing accounting traditions
(Kvaal & Nobes, 2012; Glaum, Schmidt, Street & Vogel, 2013) which may cause national
differences in goodwill impairment accounting treatment, even for countries under the same
accounting standards. These differences may limit the generalizability of our research. As
shown in the literature review, research indicates that impairments are influenced by factors
such as managerial incentive programs, debt covenants and corporate governance. However,
managerial incentive schemes, capital markets and governance differ across countries (Conyon
and Murphy, 2000), and thus managerial discretion and opportunistic behavior likely varies
across national borders as well. National differences in corporate governance and enforcement
mechanism also impacts the level of managerial discretion in goodwill accounting. High
enforcement countries and companies with strong corporate governance are more likely to
eventually impair goodwill (Verriest & Gaeremynck, 2009; Filip, Lobo & Paugam, 2021)
indicating that the absence of corporate governance and enforcement increase managerial
discretion and opportunistic behavior.
Page 32
25
Lastly, we would like to address any issues of reverse causality. Reverse causality in our
research would imply that goodwill impairments cause big bath earnings management instead
of causality running from big bath earnings management to goodwill impairment. Theoretically,
one could argue that the identification of an impairment could depress earnings to a negative
level but since our BIGBATH variable is measured as pre-impairment earnings levels we do
not observe any concerns of reverse causality.
Even though we find semi-structured interviews to be the most appropriate approach for our
qualitative research, the technique has several limitations worth addressing. For example, the
time to organize and conduct the interviews limits our ability to cover large samples, and thus,
our smaller sample size of seven interviews may negatively affect the reliability of the findings.
However, our sample of seven interviews is within the sample size recommended by Kuzel
(1992) for semi-structured interviews of 5-25. There is also an issue of interviewer bias where
the interviewer may steer the questions in a manner to support the hypotheses. We address this
by formulating flexible and open-ended questions as well as conducting the interview in a
manner that emphasizes how the interviewees understand the concepts and behaviors from their
point of view and experience. We also found it challenging to find a good geographical spread
of our interview participants. The majority of the interviewees work for Swedish companies.
This is due to the fact that of the 100 interview requests, responses were far more positive for
Swedish companies than foreign ones, resulting in an unanticipated uneven geographical spread
of participants.
Since opportunistic behavior is primarily considered an unethical accounting practice,
extracting transparent and reliable information about such behavior may be challenging in our
qualitative interview approach. For example, interviewees may avoid disclosing information
about opportunistic practices to protect the interest of the interviewee and the company. In order
to address this limitation, we made a decision to keep the interview participants’ names and
companies’ names confidential in order to encourage transparency and honesty and to respect
their privacy.
Page 33
26
5. Data
5.1. Data Collection & Sample
We use a combination of multiple databases as source of secondary data for our quantitative
analysis. Accounting data was retrieved from Compustat and Bloomberg, market data and
corporate governance variables from Bloomberg and GDP growth from OECD.
We selected all companies of the EUROSTOXX 800 extended by additional corporations listed
at the Xetra Frankfurt, Euronext Amsterdam and NASDAQ Stockholm stock exchange
reporting under IFRS with goodwill on their balance sheet at the beginning of 2020. Data was
collected for the period between 2010 and 2020 resulting in 8,974 firm-year observations. We
supplemented the EUROSTOXX firms with companies from these stock exchanges to obtain a
larger more representative sample of European companies. We consider these to be significant
stock exchanges in Europe and add some diversity to the EUROSTOXX as we include more
bank-based countries such as Germany and market-based countries such as The Netherlands
and Sweden as categorized by Bijlsma and Zwart (2013) in their analysis of factors of national
financial structure. Following previous research, we exclude financial firms or any companies
with majority public ownership. Companies are classified based on the first two digits of the
Global Industry Classification Standard (GICS Code) stipulating 10 key industry segments
(excluding financial).
We collected primary data by conducting semi-structured interviews with company
representatives with experience of goodwill impairment tests under IAS 36. The interview
questions were formulated to target our research question, and to particularly emphasize the
why sub-question of our research. The questions therefore cover aspects such as impairment
testing procedures, managerial discretion and situational impacts of macro-economic
environments on earnings management. See Appendix 2 on the interview questions.
100 companies from our sample (EUROSTOXX 800, Xetra Frankfurt, Euronext Amsterdam
and NASDAQ Stockholm stock exchange) were randomly selected and contacted via their
investor relations email addresses obtained from their respective company webpages. The
interview invitation stated the topic and purpose of the interview and study at large to ensure
potential interviewees were familiar with the topic and interested in providing insights to the
Page 34
27
study. Out of the 100 interview requests, seven positive responses were received. Upon
accepting the interview invitation, interviewees were further briefed on the topic via email
including an interview overview document outlining the interview questions.
The interviews were conducted and recorded via Zoom. Since managerial discretion involves
opportunistic behavior such as big bath and income smoothing, the decision was made to keep
the company names and representatives of the interviews anonymous. This decision was made
to respect the privacy of those who participate (Bryman & Bell, 2017) and also to encourage
participants to speak freely and transparently.
5.1.1. Dependent Variable
GIMP: We employ two measures of goodwill impairment in our tobit regression model to
ensure robustness of our results. The most often used measure in similar studies is goodwill
impairment scaled by total assets whereas some researchers use total assets at the beginning of
the financial year (Li & Sloan, 2017; Choi & Nam, 2020; Ramanna & Watts, 2012) and some
at the end of the period (AbuGhazaleh, Al-Hares & Roberts, 2011; Francis, Hanna & Vincent,
1996; Riedl, 2004; Lapointe-Antunes, Courmier and Magnan, 2008 and Zang, 2008). We will
be using both metrics, yet goodwill scaled by total assets at year-end will be our main dependent
variable of reference for testing our OLS regression to limit the complexity of this study.
5.1.2. Explanatory Variable
BIGBATH: As our main explanatory variable, we are interested in how big bath earnings
management affects the recognition of goodwill impairment. As management philosophies are
not observable, we turn to proxies for big bath earnings management used in similar research.
A big bath is often undertaken via goodwill impairment. Previous research, for example, has
measured big bath earnings management by the magnitude of extra-ordinary charges (Cheng et
al., 2019; Elliott & Shaw, 1988). We argue that this measures the execution of a big bath
strategy per se i.e., taking the big bath. To address any issues of reverse causality we consider
our big bath variable to measure the opportunity to take a big bath which may result in the
recognition of an impairment. As described by Zucca and Campbell the “big bath” is perceived
“as a probable motivation for recording asset write downs” (1992, p. 35).
Page 35
28
The opportunity to take a big bath is characterized by an already depressed earnings situation
prior to the impairment, thus, we adopt an indicator variable equal to one when pre-impairment
earnings are negative (Jordan & Clark, 2004; Masters-Stout, Costigan & Lovata, 2008; Giner
& Pardo, 2015). Based on the theoretical background surrounding big bath earnings
management elaborated earlier we anticipate a positive relationship between our big bath
variables and goodwill impairment.
5.1.3. Control Variables
5.1.3.1. Economic impairment factors
BTM: The most common impairment indicator mentioned in literature on goodwill impairment
is the book-to-market ratio of equity (Beatty & Weber, 2006; Francis et al. 1996; Giner & Pardo,
2015). We use a standard book-to-market measure defined as the book value of equity divided
by its market value. We predict a positive association with our dependent variable (Kabir &
Rahmen, 2016).
∆SALES: Another economic impairment factor used by Hayn & Hughes (2005), among other
researchers (AbuGhazaleh, Al-Hares & Roberts, 2011; Riedl, 2004), in their impairment
prediction model, is the percentage change or growth of sales from t-1 to t.
∆OCF: The percentage change in operating cashflow from t-1 to t is also used as an economic
performance indicator (Choi & Nam, 2020; Kabir & Rahmen, 2016).
ROA: Return on assets measured as EBIT divided by total assets at the end of the year is one
of the most common used variables in quantitative research on goodwill impairment. Li and
Sloan claim this accounting measure “speaks to the fair value of the underlying assets” (2017,
p. 975).
A declining ∆SALES, ∆OCF and ROA could be indications for reduced future outlooks and
possibly, a goodwill impairment, hence, we predict a negative relationship between these
variables and our dependent variable.
In line with previous research, we scale all our economic impairment factors (except BTM) by
total assets at the end of the year to reduce issues arising from endogeneity and standardize
Page 36
29
measures in light of differing reporting currencies (Zhang, 2008; Lapointe-Antunes; Cormier
& Magnan, 2008).
5.1.3.2. Proxies for Managerial Discretion
SMOOTH: According to Kirschenheiter and Melumad (2002) there exists an equilibrium of
optimal earnings management. They claim that in times of desirable performance management
will report higher net income but will tend to smooth earnings to avoid excessive high earnings
that could impact the perceived precision of reported earnings by investors and potentially make
investors adjust their expectations to unrealistic high levels. In order to control for the effect of
such earnings smoothing on goodwill impairment we employ the variables SMOOTH and
predict a positive effect on impairment. Admittedly, a significant effect of smoothing in our
regressions on impairment in 2020 will probably be the exception. Companies reporting
extraordinarily high earnings so to that they may be incentivized to smooth earnings by
undertaking a goodwill impairment in a time of economic downturn are most likely very
limited. We measure earnings smoothing as an indicator variable equal to one if the absolute
change in pre-impairment earnings from the prior year scaled by total assets is above the
industry median of the pre-impairment earnings change (Choi & Nam, 2020; AbuGhazaleh, Al-
Hares & Roberts, 2011).
LEVERAGE: Leverage and related debt-covenants are said to influence management’s
decision to impair because a significant reduction in earnings could result in the violation of
covenants which is costly (Beatty & Weber, 2006; Zhang, 2008; Riedl, 2004). Alternatively, a
company’s assets may be subject to scrutiny exercised by borrowers which restricts any
opportunistic behavior (Giner & Pardo, 2011; AbuGhazaleh, Al-Hares & Roberts, 2011). Riedl
(2004), for example, finds a significant negative association between leverage and goodwill
impairment. As data on debt-covenants are not retrievable we turn to leverage as commonly
used proxy (Avallone & Quagli, 2015; Chalmers, Godfrey & Webster, 2011). Arguably, debt
covenants will only have a significant influence on impairment decisions in highly leveraged
companies (Godfrey & Koh, 2009). Leverage is measured as the ratio between total debt to
total assets by the end of the year. Due to ambiguous opinions on how leverage impacts
impairment, we do not specify the direction of the relationship.
CEO TENURE: Numerous research papers related to goodwill impairment have focused on the
relationship between new CEOs and impairment. The underlying premise is that a CEO who
Page 37
30
has not undertaken the respective acquisition is more likely to recognize write-offs since poor
performance of previous acquisitions can be attributed to former management (Elliott & Shaw,
1988; Francis, Vincent & Hanna, 1996; Lapointe-Antunes, Cormier & Magnan, 2008). Beatty
and Weber (2006) argue that CEOs with a shorter tenure have less incentives to avoid
impairment charges compared to the CEO who has made the acquisition decision in the first
place. They find a significant effect of CEO tenure on the decision to impair as well as the
magnitude of goodwill impairment. We employ CEO tenure as the number of years a CEO has
been in office at fiscal year-end to control for the increased likelihood for impairments for new
CEOs. A negative relationship is predicted.
CEO SHARE: Concerning CEO ownership, agency theory predicts that giving executives
shares will align their interests with those of shareholders and mitigate any opportunistic
behavior (Jensen & Meckling, 1976). AbuGhazaleh, Al-Hares and Roberts (2011) find that
executive ownership as proxy for corporate governance is positively related to goodwill
impairment. However, Interviewee 2 names the fear for the negative market reaction as one of
the main reasons for managers to avoid impairments discretionarily. We believe that this may
be even more so when management themselves own shares. Thus, we expect that the sign for
the CEO SHARE coefficient could be negative or positive. This variable is measured as the
percentage of common shares outstanding held by the CEO at fiscal year-end.
5.1.3.3. Proxies for Corporate Governance
A strand of literature has investigated the role of measures of corporate governance on
opportunistic behavior. Kabir and Rahmen (2016) find that effective corporate governance
mechanisms restrict discretionary goodwill impairment and strengthen the relationship between
goodwill impairment and economic impairment factors, however, such mechanisms cannot
fully eliminate opportunistic use of discretion. We incorporate corporate governance
mechanisms as variables to control for their effect on goodwill impairment, however, their
detailed interpretation and significance are not the focus of this study.
BOARDIDP_AUD: The independence of board members is commonly described as a crucial
mechanism for strong corporate governance (Lapointe-Antunes, Cormier & Magnan, 2008;
Gros & Koch, 2019). Klein (2002), for example, finds that firms with more independent
members of the audit committee have lower abnormal accruals which is said to be a financial
line item subject to managerial discretion. We employ board independence as percentage of
Page 38
31
independent board directors of the audit committee to capture this constrain of management’s
accounting discretion on determining goodwill impairment.
%WOMEN: Inspired by the growing strand of research on board diversity and female
representation on supervisory boards we employ the percentage of women on a company’s
board as an additional measure for corporate governance. Adams and Ferreira (2009) suggest
that more gender-balanced boards dedicate higher effort to monitoring in terms of meeting
attendance and committee memberships. Post and Byron (2015) confirm a positive relationship
between monitoring effectiveness and women on the supervisory board. Hillman, Canella and
Harris (2002) emphasize the vast experience, diverse educational background and network that
female representation can bring to the board.
#BMEETINGS: Xie, Davidson and DaDalt (2003) have found a positive association of frequent
board meetings and increased financial reporting quality. We argue that a high number of board
meetings indicate that the board is exercising increased monitoring tasks which could decrease
the opportunity for managers to exploit discretion in accounting rules. This variable is measured
as the number of supervisory board meetings in a respective financial year.
These proxies for Corporate Governance may have a negative effect on goodwill impairment
where the above-mentioned mechanisms restrict any discretionary impairments which are
motivated by smoothing or big bath motives or they could have a positive effect where they
promote an impairment if economically warranted and discipline management in their attempts
to avoid such an undesirable charge. Hence, the effect could be positive or negative.
5.1.3.4. Firm-specific Controls
FIRMSIZE: Consistent with prior research we control for firm size measured as natural
logarithm of total assets. Firm size may be related to several factors: quality of financial
reporting, managerial know-how, audit mandate, cost and complexity of the impairment test
(Chalmers, Godfrey & Webster, 2011) or simply the “ability to follow the provisions
established in IFRS 3” (Giner & Pardo, 2015, p. 30).
GOODWILL: Similar to Masters-Stout, Costigan & Lovata we use pre-impairment goodwill
scaled by total assets as additional control.
Page 39
32
5.1.3.5. Other controls
GDP: We control for effects of the economic recession induced by the impact of the pandemic
by employing a macroeconomic measure such as national GDP growth. As COVID-measures
or, more specifically, lockdown measures to stop the spread were taken on a national level,
countries’ economies were affected to different extents by the consequences of COVID-19,
therefore, we believe a national measure to be a more suitable control for macroeconomic
dynamics than the Europe-wide GDP growth. The GDP variable is measured as the percentage
change in GDP compared to the previous year.
INDUSTRY: Similarly, we include industry dummy controls in our regression model to
account for the fact that some industries may have suffered more financially due to restrictions
whereas other industries such as health care, for example, have prospered in the times of
pandemic.
YEAR: Year Dummies control for any other effects that occurred in a certain year and may
somehow affect goodwill impairment.
5.2. Descriptive Statistics
Table 1 shows the construction of our sample by industry. Our sample is based on the
EUROSTOXX 800 supplemented by companies listed at the Xetra Frankfurt, Euronext
Amsterdam and NASDAQ Stockholm stock exchange excluding firms without goodwill in
2020 resulting in 8,974 firm-year observations. Missing data on some variables results in an
unbalanced panel data structure. As depicted in Table 1 our sample primarily consists of
industrial companies followed by companies in the Consumer Discretionary and Information
Technology industry. The most underrepresented industry in our sample is Real Estate with
only 11 firm-year observations. Possibly most real estate companies do not recognize any
goodwill upon acquisition since their target’s assets mainly consist of real estate properties
rather than any intangible assets that would give rise to any additional transferred consideration
i.e., goodwill. This would explain why our sample which excluded companies without goodwill
in 2020 is short of representation of Real Estate businesses. Table 1 also makes clear that
goodwill impairments occur infrequently. Among our 8,974 firm-year observations only 1,339
impairments were conducted, this equals approximately 15% of all observations. A similar
Page 40
33
trend can be observed when only looking at our observations in 2020. 19% out of 771
observations in 2020 recognized a goodwill impairment.
Table 1: Sample Construction
Firm-year observations
Communication Services 709
Consumer Discretionary 1392
Consumer Staples 733
Energy 303
Health Car 944
Industrials 2616
Information Technology 1062
Materials 813
Real Estate 11
Utilities 391
Final Sample 8974
Goodwill impairments 1339 (15% of total sample)
Observations belonging to 2020 144 (~19% of 2020 sample)
Non goodwill impairments 7635 (85% of total sample)
Observations belonging to 2020 627 (~81% of 2020 sample)
Table 2 presents descriptive statistics of all variables of our firm-year observations in the sample
period of 2010–2020 used in the regression models. With the majority of our observations being
non-impairments a median of zero of our goodwill impairment variables comes as no surprise.
This causes our data on the dependent variables to be slightly right skewed. Also, most
companies in our sample do not report negative pre-impairment earnings as indicated by the
zero median of our BIGBATH variable. Our BTM variable displays some extreme values.
Negative BTM are of little informative value since negative equity affects the inference. There
are some companies with extremely low market capitalization driving the maximum BTM in
our sample. Further, some companies have experienced a shockingly negative sales and
operating cash flow development as can be seen when observing the minimum values of
∆SALES and ∆OCF. These outliers negatively affect the mean. Most of the CEOs in our sample
serve 4,5 years with some very short exceptions, possibly only transitional appointments and
some very long serving CEOs with a maximum of 42.08 years. Other interesting findings
include that the mean as well as the median of BOARDIDP_AUD indicate that in fact around
50% of the members of the audit committee of our observations are non-executives. i.e.,
Page 41
34
independent. Noteworthy is also the maximum number of board meetings in our sample. We
find multiple firm-year observations that report between 51 and 87 board meetings in one
financial year. Interestingly, all these companies are Russian organizations. Extraordinary
outliers have been cross-checked with respective annual reports to ensure validity of the data.
Table 2: Descriptive Statistics
Continuous Variables mean median sd min max N
GIMPTA .0025757 0 .0343359 0 2.862112 8974
GIMPTAt-1 .0023818 0 .0270159 0 2.138153 8974
Economic Impairment Factors
BTM .8800835 .4244932 7.706953 -34.45046 402.2504 8220
∆SALES .0226922 .0351714 1.203532 -102.555 1.990593 8140
∆OCF -.2872198 .0080493 34.91828 -3148.25 622 8541
ROA .0857409 .0772326 .1193934 -.9733286 3.116751 8962
Proxies for Managerial Discretion
LEVERAGE .1875439 .1677753 .1592946 0 2.666667 8973
CEOTENURE 6.271288 4.58 5.942078 .08 42.08 4195
CEOSHARE .5768446 0 6.198866 0 100 8974
Proxies for Corporate Governance
BOARDIDP_AUD 47.5001 50 45.05981 0 100 8940
#BOARDMEETINGS 9.209196 8 5.024242 1 87 5894
%WOMEN 15.82875 14.286 15.90067 0 88.888 8953
Control Variables
FIRMSIZE 8.093065 8.162815 2.159622 .1160037 16.9662 8974
GOODWILL .1873869 .1467818 .1615928 .0000303 .9254658 8974
Page 42
35
Notes: absolute values are in millions. GIMPTA: goodwill impairment scaled by total assets at the end of the year;
GIMPTAt-1: goodwill impairment scaled by total assets at the beginning of the year; BTM: book value divided by
market value of equity; ∆SALES: absolute change in sales from prior year scaled by total assets; ∆OCF: absolute
change in operating cash flow from prior year scaled by total assets; ROA: Pre-impairment EBIT scaled by total
assets; LEVERAGE: Total Debt divided by Total Assets; CEOTENURE: number of years a CEO has been in
office; CEOSHARE: percentage of outstanding common shares held by CEO; BOARDIDP_AUD: percentage of
audit committee members that are not part of the executive/management board; #BOARDMEETINGS: number of
meetings of the supervisory board; %WOMEN: percentage of women on total board; FIRMSIZE: natural
logarithm of total assets; GOODWILL: pre-impairment goodwill scaled by total assets
Table 2 (Continued)
Dichotomous Variables mean p50 sd min max N
BIG BATH .1035483 0 .3046907 0 1 8962
SMOOTH .4570983 0 .4981838 0 1 8974
Notes: BIGBATH: dummy variable equal to 1 if pre-impairment earnings are negative; SMOOTH: dummy
variable equal to 1 if change in pre-impairment earnings is above industry median
Finally, we wish to gain an overview of the recognized goodwill impairments in 2020
specifically. When examining Table 3 we find that out of the 144 reported impairments mostly
industrial companies carried out a write-down. However, as elaborated earlier Industrials is the
most strongly represented industry in our sample. Consumer Discretionary, Communication
Services and Consumer Staples follow Industrials when it comes to the number of observations
reporting an impairment. It is worth mentioning, however, that Consumer Discretionary
companies recognized higher impairments in magnitude in relation to total assets than all the
other industries.
Page 43
36
Table 3: Goodwill impairments scaled by total assets in 2020 by GIC industry.
Industry Mean Median min max N
Communication Services .0175299 .0049405 .0000194 .0780024 17
Consumer Discretionary .1368694 .0087549 .0004056 2.862112 24
Consumer Staples .0097871 .0017526 .0000514 .0418411 14
Energy .0449908 .0024561 .0001616 .2149288 8
Health Care .0046681 .0029259 .0000221 .0191207 9
Industrials .0118748 .0045997 .000041 .1123126 41
Information Technology .0070745 .0030834 .0004243 .0321091 11
Materials .019167 .006442 .0006313 .0833052 11
Real Estate .0005466 .0005466 .0005466 .0005466 1
Utilities .0037721 .0013111 7.27e-06 .014003 8
Total .0342228 .0041797 7.27e-06 2.862112 144
Page 44
37
6. Empirical Findings
6.1. Qualitative Findings
6.1.1. Interview Findings
Appendix 3 gives an overview of the interviews conducted listed by country of incorporation
of the company interviewed, job position of the person we interviewed and the involvement in
the impairment test in order to validate that the interviewee possesses relevant know-how and
can contribute reasonably to our questions. The interviews are indexed with an ID number since
the names of the companies and persons we interviewed are anonymized. In the following
section the key insights on the execution of the impairment test in practice, the exploitation of
discretion inherent in the impairment test related to the ability to manage earnings and any
impacts caused by COVID-19 on the estimations gained from the interviews are summarized.
Interview 1
Interviewee 1 confirms that he would have the ability to manage earnings by taking goodwill
impairments discretionarily. However, he mentions that the basis for the estimation of future
cash flows is the prospective budget for the CGUs which is signed off by the board and simply
“handed to him”, thus, he does not have any influence on the budget which is the cornerstone
of the forecast. Yet, he could “tweak” the assumptions on growth rates. However, these
assumptions are scrutinized by auditors and generally questioned “a lot”. After “convincing the
auditors”, the audit committee also has to sign off the impairment test.
Regarding the impact of the pandemic on the company’s impairment test Interviewee 1 says
that since the impairment test is solely based on the future and they assume a greater demand
for their products in years to come based on the future trend of more people working from
home, COVID-19 had a limited effect on their estimation of the value in use. The WACC was
adjusted upwards due to the different outlooks in the different markets they operate in, resulting
in a little less headroom before an impairment is warranted.
There is a high likelihood according to Interviewee 1 that some companies use the pandemic
crisis to “clean up their balance sheets” and improve earnings levels going forward by
undertaking overly pessimistic assumptions in their calculations. It is an opportunity to “get
Page 45
38
rid” of assets which were at the limit of being written down anyway. As motives for such a
move he mentions that the focus from the external market would be shifted towards the negative
financial effects caused by COVID which are out of management’s control e.g., the closure of
factories. The picture is “blurred” for investors and management is held less accountable for
any undesirable performance. He does not see any CEO remuneration incentives to impair
discretionarily and also, the CEO is not involved in the impairment test.
Interview 2
Interviewee 2 describes the execution of their impairment test in detail. The forecast for the first
three years is based on a detailed budget for each CGU drafted by group management. For year
4 and 5 they simply use a 2% growth assumption for sales and cost. They create a full balance
sheet forecast for all five years. The two percent growth assumption for the last two years of
the explicit forecast are very cautiously chosen. The past years have shown an average growth
rate of around 17%, even in 2020 they reported 10% growth. Furthermore, they do an extensive
sensitivity analysis with a zero-growth assumption and an increase of the discount rate of up to
3% to analyze headroom of goodwill. The CFO together with the CEO decide on the allocation
of goodwill upon acquisition. As indicators for an impairment Interviewee 2 mentions
significant underperformance of a CGU based on key metrics such as profit, sales and net
working capital. Return on assets and the book-to-market ratio are also indicators included in
their estimation model. The pandemic has influenced the parameters of the company quite
significantly. The WACC used in the value in use calculation was increased by 1,5% and the
growth assumption for 2022 and 2023 decreased by 5% which has reduced the goodwill
headroom quite significantly but is still quite large according to Interviewee 2.
When asked about the ability to manage earnings via goodwill impairment Interviewee 2
strongly agreed and referred to previous employments as CFO in other companies. One of them
had almost no headroom related to the recoverable amount of goodwill and the management
team was advised by the chairman of the audit committee on how to minimize WACC so that
an impairment could be avoided and how to get these assumptions approved by the auditors.
From his experience assumptions tend to be more optimistic the further the forecast goes into
the future. While auditors do question the assumptions Interviewee 2 emphasizes that it is
difficult for auditors to verify management’s assumptions and will most likely only oppose the
Page 46
39
estimations made when there is a significant increase in sales or profitability forecasts compared
to the prior year’s valuation.
As motives to impair or rather not to impair Interviewee 2 mentions the negative market
reaction to goodwill impairments as a main factor. Often CEOs are compensated based on the
stock price or the development of a project which contributes to the adverse attitude to
impairments. However, if one does identify an impairment, it is attractive to recognize it in
times of general economic downturn such as COVID-19 or the financial crisis over ten years
ago because managers can use these macroeconomic changes as scapegoats to conduct some
extra write-down of goodwill, inventory or other assets. “Also, it’s easier to do it because the
performance has already gone bad.”, says Interviewee 2. Lastly, he mentions that every now
and then investors have questions related to impairments but not very often.
Interview 3
When asked about indications for impairment at his company Interviewee 3 says that a
significant market downturn in a specific country or the loss of a significant customer would be
such an indication rather than financial metrics during the year. The estimation of future cash
flows is based on the forecast from the local entities which are collected three times a year
including a forecasted balance sheet and a long-range plan. For the impairment test they simply
consolidate these forecasts on group level into their Discounted Cashflow spreadsheet model.
In that sense, the estimations are bottom up according to Interviewee 3 and discussed with the
local CFOs of the operating segment, hence he does not really have any impact on those
numbers.
The CGUs are defined as the individual countries resulting in around 20 CGUs. Upon
acquisition goodwill is attributed to the group company that is undertaking the acquisition at
the lowest level i.e., attributed to that country CGU. So, the allocation process is “quite clear”
and “straight forward”. In 2020 a goodwill impairment was identified; however, it was due to
the loss of a very large customer contract which immensely impacted cash flow projections and
unrelated to any impacts caused by the pandemic.
Interviewee 3 confirms that he would have the ability to manage earnings in his position but
says “it’s not that simple”. Calculations need to be supported by information as auditors look
at this quite thoroughly and the assumptions have to be defended in front of the audit committee
Page 47
40
which has to approve the calculations. Also, there are some checks of balances that can be done
to check if the value in use is somewhat realistic by comparing it to the market capitalization
of the company.
Regarding incentives to manage earnings Interviewee 3 does not confirm any such incentives
arising from programs based on earnings per share even though share price would “take a hit”
since impairments “do not look good”, he believes that this would be adjusted for in the “follow-
up”. Instead, he finds the real incentive for an impairment to be the improvement of “visible”
key ratios such as Return on Equity and Return on Capital Employed for the years following
the impairment.
As concluding remarks Interviewee 3 mentions that he would prefer the return to the
amortization regime, not only because the process is somewhat costly but because of the
extraordinary workload. Also, he says that many analysists would disregard goodwill and
impairment effects just as they disregard amortization in their analyses of company values so if
goodwill is really just “a residual somewhat fictive item” - why not just undertake amortization
and make everyone's lives easier?
Interview 4
As an investment company that has acquired and operates more than 200 subsidiaries, the
interviewee describes that it is unsustainable to test these companies independently. Instead,
the company has apportioned goodwill to eight cash-generating units, which for the company
is equated with its eight operating segments. These operating segments contain a large number
of companies and the interviewee states that this procedure is industry standard, and peers do it
in a similar manner. Newly acquired businesses with goodwill balances and contingent earn-
outs are tested separately.
In addition to an annual impairment test, interviewee 4 describes that additional impairment
reviews may be triggered in cases when it becomes apparent that actual financial results of cash
generating units significantly underperform the cash flow forecasts used in the previous
impairment tests. In reference to the goodwill impairment loss the company took in 2020 for
one CGU, interviewee 4 explains that the financial results for the corresponding operating
segment had been underperforming for several years, especially due to poor performance of a
few entities in the segment. The interviewee also states that she is unsure whether the pandemic
Page 48
41
had any significant impact and was also unsure whether the timing of the impairment had
anything to do with the financial crisis in 2020.
When asked about the ability to manage earnings through goodwill impairments she asserts that
auditors nowadays question and challenge goodwill assumptions to a high degree, which
constraints the flexibility and managerial discretion in the fair value estimation. Additionally,
she states that auditors increasingly ask for more documentation and reasoning about the
estimation. However, she says there is some flexibility in the current rules that can be exploited
despite auditors restricting this flexibility. For example, she states that the flexibility might be
exploited by new CEOs to take asset impairments, and she thinks this phenomenon is quite
common.
Interview 5
Interviewee 5 gave us an overview of goodwill at his company. It is a traditional organic growth
company and goodwill was acquired for the first time in 2019 upon the acquisition of a systems
developer and allocated to one of the two existing CGUs which consist of the two main
operating segments. The acquired company itself does not generate any revenue stream so the
cash flow forecast is primarily based on the projections of the residual pre-existent operating
business. The goodwill recognized is an immaterial amount, hence auditors do not perceive it
as significant financial line item. The pandemic has had a boosting effect for his company so
there were no indications for impairment identified.
He assumes that many other companies have used COVID-19 and the financial crisis as an
excuse to undertake an impairment that have previously been avoided or delayed. From a
managerial point of view, he believes that an impairment in 2020 might be relatively less
reputationally damaging because blame can be directed away from the real reason for the
underperformance. When asked about the ability to manage earnings he replies that it may be
possible in the short term, but such an ability is constrained by auditors’ investigations as they
follow up forecasts and compare the assumptions with those of last year.
Interview 6
Interviewee 6 explains that a primary indication for impairment would be a significant deviation
from the strategic plans of the operating segments such as the withdrawal of business from a
Page 49
42
specific market. Market to book ratio could be an indicator but one has to know that while the
market does “say something” about the underlying performance sometimes “there is just a
positive momentum with the shares”. However, the decrease in market value could be an
indication as it reflects the belief of shareholders regarding poor performance. If the market
value does decrease below the book value – that is a high indication for impairment.
Even though there was no impairment undertaking in 2020 because the demand for the
company’s business was not negatively impacted by the pandemic, Interviewee 6 says she
would have the ability to manage earnings via goodwill impairments. However, auditors would
not only look at the detailed data and discount rate of the current impairment test, but also
follow up how the assumptions are reflected in the coming period and challenge these
assumptions in terms of how reasonable they are. Hence, one cannot be “too far off” with one’s
judgement.
At times when the performance is already under expectations one “might as well write-down
any goodwill on the balance sheet” according to Interviewee 6. This would be attractive in order
to make the balance sheet leaner and improve capital employed and it will be more unnoticed
than in a good year. In a general downturn of the economy goodwill is “under the radar” and
one does not have to explain as much in front of shareholders.
Interview 7
Interviewee 7 says that the impairment test is highly standardized at her company and the
managerial leeway in estimating the parameters is rather small. Since the company is doing
very well financially, she does not really pay attention to any metrics as impairment indicators.
While the pandemic did impact the sensitivity analysis and the assumptions under a worst-case
scenario the headroom for an impairment was still very large. She sees the most potential for
opportunistic “tweaking” in the determination of the terminal growth rate and the forecasted
EBIT margin. When asked about any scrutiny from auditors Interviewee 7 replies that “there
are no questions - not at all”.
Incentives to take goodwill impairment according to Interviewee 7 would definitely be that
investors are more understanding in times of crisis and “nobody wants to take responsibility for
bad results” when “things are going well”. Regarding the impairment test in general Interviewee
7 explains that she would rather prefer the old amortization regime since the current
Page 50
43
impairment-only approach makes it difficult to “get rid” of huge assets such as goodwill.
Amortization would be “healthier”. She finds the impairment approach to be “very theoretical”
and all in all a “strange concept”.
Interview Summary
To summarize, most of the interview participants confirm that there is flexibility inherent in the
goodwill impairment test and acknowledge their ability to use the discretion to manage earnings
to some degree. However, controls such as auditors and audit committees constrain the
managerial discretion in their impairment test assumptions, especially when goodwill is a
material balance in the financial statements. The interviewees identify numerous incentives to
discretionarily recognize goodwill impairments such as cleaning up balance sheets, improving
key ratios and improving future earnings level. Moreover, the interview participants seem to be
in agreement that in a year of global economic crisis, taking an impairment is more attractive
because the macroeconomic environment can be used as a scapegoat for the impairment.
6.2. Quantitative Findings
6.2.1. Diagnostic Test results
In the following section we wish to describe the diagnostic tests we carried out to ensure validity
of our regression results.
6.2.1.1. Multicollinearity
Appendix 4 displays the Diagnostic Test for Multicollinearity. The Real Estate Industry
Dummy as well as the 2020 Year Dummy have been dropped from the analysis due to perfect
collinearity. When analyzing the Variance Inflation Factor, we find that all variables depict a
value below 4 whereas most values range between 1 and 2. Hence, we do not detect any issues
of multicollinearity affecting the quality of our results.
6.2.1.2. Heteroskedasticity
We analyzed a histogram of our OLS regression as well as conducted a White’s test for
heteroskedasticity. The histogram in Appendix 5 depicts that the residuals vary unevenly, thus
indicating heteroskedasticity. A white test shown in Appendix 6 with a p-value of 0.00 confirms
Page 51
44
that heteroskedasticity is present. Thus, we also include robust standard errors in the execution
of our regression models.
6.2.2. Regression results
We aim to investigate the presence of a big bath earnings strategy by analyzing two measures
for company earnings – return on assets and return on sales. If earnings levels do not differ
between impairers and non-impairers in the two years before the impairment but only in the
year of the impairment this could be an indication of big bath earnings management. To test our
first hypothesis, we did not only investigate means but also medians to control for extreme
outliers. Table 4 depicts the results of our comparison of mean and median ROS and ROA for
2020 and the previous two years for companies that recognized an impairment loss in 2020 and
those that did not. For a reasonable inference the same companies for the three years were
analyzed, hence, 20 observations were dropped of which we did not have information on
impairment in 2018-2020. The p-values refer to a two-tailed t-tests of differences in means and
two-tailed Mann-Whitney U-tests of differences in median similar to the approach carried out
by AbuGhazaleh, Al-Hares and Roberts (2011).
Table 4: Test of differences in ROA & ROS of impairers compared to non-impairers.
Impairers Non-impairers
N Mean Median N Mean Median
Difference
in Mean
(p-Value) *
Difference in
Median
(p-Value) *
2020
ROA 144 .0791269 .0575941 627 .0639013 .0608101 0.2039 0.7192
ROS 144 .1291619 .09205 627 -1.374544 .0862142 0.6205 0.2637
2019
ROA 144 0.0741697 0.0679413 627 0.0811935 0.0704481 0.4891 0.7496
ROS 144 0.11051 0.1045775 627 -.1695052 0.0960406 0.6351 0.3254
Page 52
45
2018
ROA 144 0.0840367 0.0734681 627 0.0920193 0.0791284 0.5244 0.5329
ROS 144 0.1245999 0.1070787 627 -0.0788061 0.0947285 0.6077 0.3491
*derived from an independent two-tailed t-tests of differences in means.
**derived from a two-tailed Mann-Whitney U-tests of differences in median.
When analyzing our results in Table 4 we find no significant differences in performances
between the two groups – neither in 2020, nor in the previous two years. Interestingly, we find
that impairers report a superior ROS in all three years of comparison when looking at the mean
and the median. The median ROA of impairers is consistently below that of the non-impairers.
The mean ROA exceeds that of non-impairers in 2020 while underperforming slightly in the
previous years. Hence, we do not find any supporte for our first hypothesis. Relative to non-
impairers, the performance of impairers was not significantly lower in the year of goodwill
impairment nor in the previous years. With exception of the median ROA in 2020 the impairers
performed slightly better overall in 2020 than those companies that did not carry out an
impairment. Yet, the ROA (median and mean) was below that of non-impairers in 2018 and
2019 but not significantly when looking at the p-values. Summing up, we did not find any
significant difference regarding the two metrics between our comparison groups for any of the
years under analysis. In that sense we cannot confirm the findings by Jordan and Clark (2004)
or Sevin and Schroeder (2005) that companies use the opportunity in a year of already depressed
earnings to carry out an impairment i.e., take a big bath. If that were the case, then there would
be a significant difference in performance in 2020 between impairers and non-impairers and
none in the previous years.
In order to test our second hypothesis whether there is a stronger association between big bath
earnings management and goodwill impairment in times of economic crisis compared to
previous more stable years we separate our sample into observations in 2020 – the year of the
pandemic – and the previous more stable ten years 2010-2019. The change in GDP controls for
the change in the macroeconomic environment between these subsamples. The subsamples
include impairers as well as non-impairers of the respective years. Due to the lower limit feature
of our dependent variable, we employ a multivariate tobit regression consistent with Hamberg,
Page 53
46
Paananen and Novak (2011). Appendix 7a and 7b display our regression results using goodwill
impairment scaled by assets at the beginning of the year and at the end of the year as well as
results including robust standard errors to address concerns surrounding heteroskedasticity for
2020 and the previous more stable years respectively. Table 5 depicts our summarized findings
comparing the determinants of goodwill impairment in the pandemic versus the period before
the pandemic.
We find that our Big Bath earnings variable is highly statistically significant in our pandemic
sample as well as in the more stable sample. The relationship is positive as expected. The
coefficient is higher in magnitude in 2020 compared to the pre-pandemic sample which
confirms our second hypothesis. Other significant impairment determinants in both samples are
return on assets and firm size. Both, the change of sales and the number of board meetings
prove highly statistically significant and somewhat significant in 2020 whereas we find no such
significance in the pre-pandemic sample. Contrasting findings also include the independence
of the audit committee for which we find statistical significance at the α-level of 5% in the years
2010-2019 but no significant effect in 2020. Moreover, we report opposing effects of our
variables leverage, percentage of women on the board and independence of the audit committee
in the year of the pandemic compared to the pre-pandemic era. Also, in contrast to our
predictions the economic impairment factors book-to-market ratio, return on assets, change in
Operating Cash Flow and, interestingly, CEO Tenure as proxy for managerial discretion display
the opposite effect on goodwill impairment.
Table 5: Summarized Results from the multivariate Tobit regression.
Expected sign
Pandemic
2020
Pre-pandemic
2010-2019
Constant
-0.415*** -0.102***
(0.0446) (0.00643)
BIGBATH + 0.0782*** 0.0269***
(0.0191) (0.00303)
BTM + -0.00133 -3.32e-05
(0.00132) (8.99e-05)
Page 54
47
CSALES - -0.275*** -0.000365
(0.0496) (0.000631)
COCF - 0.000529 4.61e-05
(0.000723) (7.09e-05)
ROA - 0.980*** 0.0263***
(0.0418) (0.00705)
SMOOTH + 0.00695 0.000778
(0.0146) (0.00187)
LEVERAGE +/- -0.000157 1.20e-07
(0.000196) (7.50e-08)
CEOTENURE - 0.000781 0.000179
(0.00120) (0.000194)
CEOSHARE +/- -0.000793 -0.000258
(0.00287) (0.000267)
WOMEN +/- 0.000301 -8.32e-05
(0.000561) (7.68e-05)
BOARDIDP_AUD +/- -0.000342 6.51e-05**
(0.000226) (2.61e-05)
BOARDMEETINGS +/- 0.00236* 0.000182
(0.00141) (0.000205)
FIRMSIZE
0.0201*** 0.00385***
(0.00423) (0.000553)
GOODWILL 0.0449 0.0227***
(0.0463) (0.00629)
GDP
-0.110 -0.0559
(0.246) (0.0451)
Industry Controls
Yes Yes
Page 55
48
Year Controls
Yes Yes
Observations 750 6,681
Standard errors in parentheses
*** p<0.01, ** p<0.05, * p<0.1
Notes: Dependent variable is Goodwill scaled by total assets at the end of the year.
For the analysis of discretionary goodwill impairment as part of our final hypothesis test, we
run an OLS regression using only the economic impairment factors on the whole sample for the
years 2010-2020 following Gros and Koch (2019). We focused the execution of this model on
goodwill scaled by total assets at the end of the fiscal year to avoid making the study too
extensive. To ensure the robustness of our results we also carried out the regression including
robust standard errors clustered at ISIN (firm) level. Results of the regression are depicted in
the Appendix 8. The derived estimates were used to predict the economically induced or
“expected” goodwill impairment. Consistent with Lapointe-Antunes, Cormier and Magnan
(2008) we replace the economically induced goodwill with zero if the prediction resulted in a
negative amount since this would imply a reversal of impairment. The expected impairment is
multiplied by total assets to arrive at the absolute amount and deducted from the reported
impairment amount to calculate the discretionary goodwill impairment. Thereafter, the
discretionary goodwill impairment is employed as dependent variable in an OLS regression on
our sample in 2020 using the proxies for managerial discretion and corporate governance
described in Section 5.1.3. In order to understand the dynamics of the effects the different
variables more we also investigated negative and positive discretionary goodwill impairment.
Table 6: Results of the OLS model on discretionary goodwill impairment
VARIABLES DiscGIMP DiscGIMP
negDiscGIMP
(Understatement of
impairment)
posDiscGIMP
(Overstatement of
impairment)
Constant 935.6*** 935.6** 1,149*** -213.1***
(227.0) (374.5) (212.3) (62.87)
BIGBATH 188.1 188.1 135.6 52.58
(122.2) (175.9) (114.3) (33.84)
Page 56
49
SMOOTH 40.36 40.36 51.35 -10.99
(94.70) (133.3) (88.56) (26.23)
LEVERAGE 0.00674 0.00674 0.00956 -0.00283
(0.221) (0.0495) (0.206) (0.0611)
CEOTENURE -37.74*** -37.74 -33.98*** -3.761
(9.146) (26.50) (8.553) (2.533)
CEOSHARE -2.390 -2.390 -1.997 -0.392
(20.16) (11.72) (18.85) (5.582)
WOMEN 15.07*** 15.07* 17.16*** -2.093*
(3.975) (9.089) (3.717) (1.101)
BOARDIDP_AUD -2.864* -2.864** -2.665* -0.199
(1.624) (1.196) (1.519) (0.450)
BOARDMEETINGS 22.40** 22.40 13.30 9.103***
(10.20) (16.85) (9.535) (2.824)
FIRMSIZE -181.5*** -181.5** -212.2*** 30.78***
(27.54) (72.29) (25.76) (7.627)
GOODWILL 617.7** 617.7** 569.4* 48.38
(311.1) (240.4) (291.0) (86.17)
Industry Controls Yes Yes Yes Yes
Year Controls Yes Yes Yes Yes
Robust Standard Errors No
Clustered at
ISIN No No
Observations 750 750 750 750
R-squared 0.149 0.149 0.192 0.074
Standard errors in parentheses
*** p<0.01, ** p<0.05, * p<0.1
When analyzing the results in Table 6 regarding the Big Bath variable we find a positive
correlation which supports our third hypothesis, however we do not find any statistically
Page 57
50
significant effect. Moreover, the magnitude of the effect seems to be driven by the association
of our variable with negative rather than positive discretionary goodwill. Significant
determinants of discretionary goodwill impairment seem to be CEO Tenure, percentage of
women on the board, independence of the audit committee and the number of board meetings.
Concerning CEO Tenure, we observe a highly significant negative effect which is in contrast
to our findings in Table 5 of our tobit regression. The inference of this effect becomes more
concrete when looking at the regression on negative discretionary goodwill impairment where
CEO Tenure remains highly statistically significant and negative. The reported sign of this
variable is now in line with earlier predictions. This supports findings by Beatty & Weber
(2006) that CEOs that have been in their position longer are more likely to have authorized the
acquisition decision which may now be subject to impairment and are reluctant to recognize
such a loss since it may be perceived as a failure or a poor acquisition decision by the market.
This could motivate them understate impairment compared to that which is economically
warranted. The percentage of women on the board seems to have a highly statistically positive
effect on discretionary goodwill impairment. This effect seems to be dominated by the effect
on negative goodwill impairment i.e., the understatement of impairment, however, we also find
a somewhat statistically significant negative effect on positive goodwill impairment i.e.,
overstatement. Regarding the independence of board members of the audit committee we report
a negative effect on the understatement of impairment significant at an α-level of 10%. This
means that an increasing percentage of independent board member on the audit committee
results in less understatement of impairment indicating a disciplining function to managers that
may have reputational motives to minimize the impairment charge. The last noteworthy finding
from this regression is the coefficient of the number of board meetings. We find a statistically
significant positive effect on discretionary goodwill impairment overall and even a highly
significant effect on positive discretionary impairment.
Page 58
51
7. Analysis
The results of our first hypothesis test leave us wondering what the reasons for these findings
in contrast to previous studies could be. It is noteworthy that the studies that have taken the
same research approach, namely Jordan and Clark (2004) and Sevin and Schroeder (2005)
focused their research on a US sample and more specifically, on the year of adoption of SFAS
142 in 2002. They find significant differences in the median ROA and ROS between impairers
and non-impairers in 2002 but not in 2001 pointing towards management taking an impairment
because the financial situation is generally already poor and not because performance has been
deteriorating for some time. While poor earnings levels per se boast an opportunity to reduce
earnings even more by “removing any burden” and, hence, boosting future earnings (Jordan &
Clark, 2004), there was also another incentive to write-down in 2002 which could have
somewhat affected the inference of findings in these studies. In 2002, companies could report
initial impairment charges as accounting changes below the bottom line, thus, not affecting
operating income which definitely formed an incentive to undertake an impairment. Nowadays
impairment losses go through profit and loss and negatively affect reported earnings levels.
This clearly creates a “steeper penalty” (Jordan & Clar, 2004, p. 69).
In addition, while Jordan & Clark (2004) hypothesized that an impairment may be warranted
after multiple periods of plummeting firm economics, we find that - based on our Interviews
with practitioners - the impairment test is rather detached from current or past company
performance. Naturally, the cash flow forecast is somewhat oriented on past numbers, however,
the estimation of the value in use as a whole is primarily a forward-looking exercise. The
assumptions regarding growth rate and forecasted EBIT margin are based on what management
expects the market outlook to be in the future. Interviewee 1 also emphasized that it is “solely
about the future” when asked about the impact of the pandemic on the estimations. Two of our
interviewees’ companies recognized a goodwill impairment but both explained that this was
unrelated to the pandemic because they believe it will not have any long-term negative effect
on revenue. We gain the overall impression that either the pandemic has not had a negative
effect on business at all – some industries even benefitted from the developments that the
COVID-19 measures brought - or the adverse effect on business is not perceived to be so long-
lasting as to significantly affect the future cash flow estimation.
Page 59
52
In conclusion, our results suggest that the majority of companies that chose to impair goodwill
in 2020 did not do so because their reported earnings were already depressed and saw it as an
opportunity to take a big bath - this would have meant a significant lower performance than
non-impaired in 2020 - but did so based on the estimated future outlook of their CGUs
independent of any short-term effects that the outbreak of COVID-19 may have had on the 2020
financial results. This would explain why there is no significant difference in ROS and ROA
neither in 2020, nor in the previous two years, between companies that reported a goodwill
impairment in 2020 and those that did not. In fact, we find that only 39 out of the 144 impairers
in 2020 reported negative pre-impairment earnings. Our findings confirm claims made by Xu
and Rogers (2011) as well as Aubert and Grudnitski (2014) who suggest a shift away from such
earnings management tactics.
Our quantitative findings in Table 5 suggest that our big bath earnings variable is more strongly
associated with goodwill impairment in the year of the pandemic compared to previous more
stable years. When questioning why this may be the case, we turn to the insights gained from
our interviews. Interviewees mention cleaning up the balance sheet, getting rid of assets which
were on the edge of being written down anyway, improving earnings levels and capital
employed going forward as general incentives to impair discretionarily when earnings are
already poor. But in a year of global economic downturn such as 2020 they say recognizing an
impairment is more attractive because the macroeconomic changes can be used as scapegoats,
the focus from the external market would be shifted towards the negative financial effects
caused by COVID-19 which are out of management’s control. Furthermore, one interviewee
says that he believes that an impairment in 2020 might be relatively less reputationally
damaging because blame can be directed away from the real reason for the underperformance.
In such a year, impairment losses would go more unnoticed since goodwill is “under the radar”
according to a different interviewee. That the change in sales has played a significant role in
determining impairments in 2020 does not come as a surprise. Closures of shops or restrictions
on purchasing of a specific product caused by COVID-19 restrictions will first and foremost
affect sales. The question is whether these effects are believed to be so significant in the future
to adversely affect future cash flow estimation in the determination of value in use. Regarding
the relationship between CEO Tenure and goodwill impairment we cannot confirm findings by
Beatty and Weber (2006) since we find a positive relationship. For the results relating to 2020
we argue that possibly long serving CEOs who, under normal circumstances, would be reluctant
Page 60
53
to admit that the acquisition they originally made has turned out to be not as fruitful as they had
hoped can now escape accountability by blaming the undesired development on external
factors.
Table 6 reports that the magnitude of the relationship between goodwill impairment and our big
bath earnings variable seems to be higher related to negative discretionary goodwill impairment
rather than positive impairment. This finding could indicate that companies which reported
negative pre-impairment earnings in 2020 exploited the discretion inherent in the impairment
test more to understate impairment i.e., to impair less than what is economically induced –
maybe not to make the financial situation worse than it already is - rather than to overstate
impairment and take a big bath. We have to keep in mind that our big bath variable is an
indicator variable measuring whether the company reported negative pre-impairment earnings
which would pose the opportunity to take the big bath but does not measure taking the big bath
per se.
The findings gained from the conducted interviews have not only broadened our understanding
of the execution of the impairment test in practice but also assisted our inference of our
quantitative findings as to why companies would impair in 2020 and gave validation to our
variables. Multiple interviewees mentioned the audit committee as a factor of restraining
managerial leeway in the assumptions required in the impairment test. We believe that this
disciplining effect is most likely enhanced when the audit committee consists of independent
board members who are not entrenched. Interviewee 2 describes a past occupation at an
organization where the chairman of the audit committee was actively interfering in the value in
use estimations and describing how to minimize WACC to avoid an impairment. Possibly this
director was not independent which would once more highlight the importance of independent
actors for effective oversight and justifies a respective variable in our regression models.
Moreover, interviewees mentioned the book-to-market ratio, return on assets and sales as
considerable factors in their impairment test, hence these inputs validate the inclusion of such
variables. Interestingly, interviewee 3 mentions market capitalization as reference point for the
estimated value in use. In theory, market capitalization stipulates what the market thinks a
company is worth so should equal what a market participant is willing to pay for a company
i.e., fair value, however, the market capitalization based on the share price reflects market
expectations which can also be highly speculative. In this sense another interviewee relativizes
Page 61
54
the informative value of market capitalization as she says the share price could just depict a
“momentum” of the market expectations and is only partially related to the underlying
performance of a company.
The overall impression gained from the practitioners is that it is not that easy to exploit the
discretion inherent in impairment testing and the preparers are very aware of the governance
mechanisms such as auditors and board directors. Nearly all interviewees mention the scrutiny
exercised by auditors and their questioning of assumptions as main mitigating factors for
opportunistic behavior. Only interviewee 2 relativizes the auditors’ function by saying that they
only really challenge significant changes to assumptions compared to the previous year and
interviewee 7 explains that auditors do not question the impairment test at all. The preparers we
spoke to seem to be rather cautious in their impairment tests. One interviewee described that
they undertake overly extensive sensitivity analysis. All interviewees identify similar incentives
why it may be attractive to undertake an impairment in 2020: to use COVID-19 as a scapegoat.
Such an opportunistic exploitation of the general economic downturn by means of impairment,
nevertheless, may only pose an opportunity for companies that hold goodwill that has been on
the edge of being impaired. However, most of the companies interviewed seem to have
considerable headroom in their goodwill so that an impairment is very unlikely in the near
future.
Page 62
55
8. Discussion and Conclusion
Using a sample of 8,974 firm-year observations of European companies between 2010 and
2020, this research paper sought to investigate whether goodwill impairment in 2020 primarily
was a result of the economic impacts caused by COVID-19 or managerial discretion. The
findings from the test of differences (H1) suggests that the majority of the firms that recognized
a goodwill impairment loss in 2020 did not do so because of big bath earnings management.
There was no significant difference in ROS and ROA between companies that reported a
goodwill impairment in 2020 and those that did not, neither in 2020 nor in the previous two
years, indicating that the majority of firms taking a goodwill impairment charge in 2020 did not
have an already depressed earnings situation to take advantage of but conducted an impairment
based on their assessment of future earnings. These findings are consistent with the insights
gained by interviews with practitioners.
Nevertheless, the results of our tobit regression (H2) suggest that big bath earnings management
is a significant goodwill impairment determinant. This finding implies that those companies
that reported negative pre-impairment earnings did in fact recognize a goodwill impairment
indicating a big bath. Moreover, the association between big bath and goodwill impairment was
stronger in 2020 compared to previous years. Several interviewees underscored that a potential
explanation for this may be that a financial crisis provides an extraordinary situation that
managers can use in order to escape accountability for CGU underperformance. The test of H2
also shows that a change in sales is a significant goodwill impairment determinant, which is
logical considering a negative change in sales may influence growth and future cash flow
estimates.
The OLS regression (H3) shows that the magnitude of the relationship between goodwill
impairment and big bath is more related to negative discretionary goodwill impairment than
positive impairment. The result suggests that firms which reported negative pre-impairment
earnings in 2020 exploited the discretion inherent in the impairment test more to understate
impairment, which leads to the rejection of our third hypothesis of big bath earnings
management. These findings suggests that the use of goodwill impairment to pursue big bath
earnings management was not as prevalent as hypothesized. On a grand scale it seems that
European companies used the discretion in 2020 to impair less than predicted economically
induced goodwill impairment.
Page 63
56
The interview results showed strong support for the notion that possibilities exist to exploit the
discretion inherent in impairment testing accounting rules. A common view among the
interview participants, however, is that governance and enforcement mechanisms such as
auditors and board directors significantly limit the exploitation of discretion. As evidenced by
multiple interviewees, there is a perceived incentive for managers to take big bath goodwill
impairments in order to improve earnings levels and ratios such as return on assets.
Additionally, several managers stated that it may be more favorable to recognize an impairment
during times of financial crisis as the macroeconomic environment can be used as a scapegoat.
These hypotheses, however, did not find support in our quantitative analysis which suggests
companies understated impairments in 2020 rather than using it to take a big bath.
The results, which showed that big bath is a significant determinant of goodwill impairment
and that companies may have understated goodwill impairments in 2020, highlights the
challenges and issues with the discretion inherent in IFRS goodwill accounting rules. The
implications are that managers and firms have the ability to act opportunistically to some extent
and manage earnings with goodwill impairments. It highlights the need for regulators and
enforcers to identify procedures and systems to limit the discretion in order to improve goodwill
accounting accuracy and reliability. For instance, more extensive goodwill impairment test
disclosure requirements in annual reports would increase transparency in this area. Along with
rigorous enforcement, this may mitigate some of the issues with the current accounting rules.
While this study incorporated corporate governance mechanisms as control variables, the
interpretation and inference on the effectiveness of these mechanisms is out of scope of this
study. Thus, the discussion of these factors is limited in this paper. Future research could
investigate the effect of corporate governance mechanisms on discretionary goodwill
impairment in more depth. For example, it could be interesting to investigate how the
percentage of women on the board affects discretionary goodwill impairments as the inference
of our results are unclear. Also, a more detailed analysis of discretionary goodwill as predicted
by our regression model with further investigation of the variables, or the inclusion of
interaction terms may bring further insights. Unfortunately, such an endeavor as part of a larger
study was not feasible given the available resources and time constraints. Moreover, it would
also be interesting to conduct a similar study in a similar COVID-19 context in the United States
as this would enable analysis and comparisons of discretionary goodwill impairments in the
accounting regimes.
Page 64
57
This study predicted economically induced impairment based on current and historic economic
metrics whereas the value in use is very forward looking. Future research could potentially
improve estimates and insights about economically induced goodwill significantly by
incorporating forward-looking economic predictors in regression models. Finally, building
upon the comment letters submitted to the IASB on possible changes to IFRS 3 several
interviewees expressed preference of the old amortization regime as it is more straight forward,
less complex and costly to perform, and makes it easier to unload goodwill from the balance
sheet. Further study of advantages of a return to the former regime or a combined approach
could be value adding to the debate.
Page 65
58
Reference List
Abuaddous, M., Hanefah, M., & Laili, N. (2014). Accounting standards, goodwill impairment, and earnings
management in Malaysia, International Journal of Economics and Finance, vol. 6, pp. 201-211
AbuGhazaleh, N. M., Al-Hares, O. M. & Roberts, C. (2011). Accounting Discretion in Goodwill Impairments:
UK Evidence, Journal of International Financial Management & Accounting, vol. 22, no.3, pp. 165–204
Adams, R. B. & Ferreira, D. (2009). Women in the boardroom and their impact on governance and performance,
Journal of Financial Economics, vol. 94, no. 2, pp. 291–309
Aubert, F. & Grudnitski, G. (2014). The impact of SOX on opportunistic management behavior , International
Review of Financial Analysis, vol 32, pp. 188-198
Avallone, F. & Quagli, A. (2015). Insight into the variables used to manage the goodwill impairment test under
IAS 36. Advances in Accounting, incorporating Advances in International Accounting, vol. 31, no. 1, pp.
107-114
Beatty, A. & Weber, J. (2006). Accounting Discretion in Fair Value Estimates: An Examination of SFAS 142
Goodwill Impairments, Journal of Accounting Research, vol. 44, no. 2, pp. 257–288
Bens, D. A., Heltzer, W., & Segal, B. (2011). The information content of goodwill impairment and the adoption
of SFAS 142, Journal of Accounting, Auditing & Finance, vol. 26, no. 3, pp. 527–555
Bhattacherjee, A. (2012). Social science research: Principles, methods, and practices: USF Tampa Bay Open
Access Textbooks Collection, Available Online:
http://scholarcommons.usf.edu/cgi/viewcontent.cgi?article=1002&context=oa_textbooks [Accessed April
4 2021]
Bijlsma, M. J., & Zwart, G. T. J. (2013). The changing landscape of financial markets in Europe, the United States
and Japan., working paper, Bruegel. Available Online: http://www.bruegel.org/publications/
publication-detail/publication/774-the-changing-landscape-offinancial-markets-in-europe-the-united-
states-and-japan/ [Accessed April 4 2021]
Boennen, S. & Glaum, M. (2014). Goodwill Accounting: A Review of the Literature. Available Online: [Boennen,
Sascha and Glaum, Martin, Goodwill Accounting: A Review of the Literature (July 4, 2014). Available
Online : https://ssrn.com/abstract=2462516 or http://dx.doi.org/10.2139/ssrn.2462516 [Accessed April 4
2021]
Bryman, A., & Bell, E. (2017). Business Research Methods. Third Edition. Oxford University Press: New York
Carlin, T. & Finch, N. (2010). Evidence on IFRS goodwill impairment testing by Australian and New Zealand
firms, Managerial Finance, vol. 36, no. 9, pp. 785-798
Chalmers, K., Godfrey, J., & Webster, J. (2011). Does a goodwill impairment regime better reflect the underlying
economic attributes of goodwill? Journal of Accounting and Finance, vol. 51, no. 3, pp. 634–660
Chen, C., Kohlbeck, M., & Warfield, T. (2008). Timeliness of impairment recognition: evidence from the initial
adoption of SFAS 142. Advances in Accounting, vol. 24, no. 1, pp. 72–81
Cheng, Y., Park, J., Pierce, S. & Zhang, T. (2019). Big Bath Accounting Following Natural Disasters, Available
Online: https://ssrn.com/abstract=3305478 [Accessed April 4 2021]
Page 66
59
Choi, J.S. & Nam, J.A. (2020). Does managerial discretion affect the value relevance of goodwill impairment
information under IFRS? Korean evidence, Asia-Pacific Journal of Accounting & Economics, vol. 27, no.
1, pp. 1-23
Clinch, G. (1995). Capital markets research and the goodwill debate, Australian Accounting
Review, vol. 5, no. 1, pp. 22-30
Colquitt, L. & Wilson, A. (2002). The elimination of pooling-of-interests and goodwill
amortisation and its effect on the insurance industry, Journal of Insurance Regulation,
vol. 20, no. 3, pp. 338-351
Conyon, M. J. and Murphy, K. J. (2000), The Prince and the Pauper? CEO Pay in the United States and United
Kingdom, The Economic Journal, vol. 110, no. 467, pp. 547–846
Darrough, M., Guler, L., & Wang, P. (2014). Goodwill impairment losses and CEO compensation. Journal of
Accounting, Auditing & Finance, vol. 29, no. 4, pp. 435–463
Donnelly, T. & Keys, R. (2002). Business combinations and intangible assets, Australian
CPA, vol. 72, no. 4, pp. 68-92
Elliott, J. & Shaw, W. (1988): Write-offs as accounting procedures to manage perceptions, I: Journal of Accounting
Research, vol. 26, Supplement, pp. 91-119
Filip, A., Lobo, G. J. & Paugam, L. (2021). Managerial discretion to delay the recognition of goodwill impairment:
The role of enforcement, Journal of Business Finance & Accounting, vol. 48, no. 1-2, pp. 36–69
Financial Accounting Standards Board (FASB). (2001). Statement of Financial Accounting Standards No. 142:
Goodwill and Other Intangibles, FASB, Norwalk, CT. Available Online:
https://www.fasb.org/jsp/FASB/Document_C/DocumentPage?cid=1218220124961&acceptedDisclaimer
=true
Financial Accounting Standards Board. (2021). Identifiable Intangible Assets and Subsequent Accounting of
Goodwill: Project Update, FASB, Norwalk, CT. Available Online:
https://www.fasb.org/jsp/FASB/FASBContent_C/ProjectUpdateExpandPage&cid=1176171566054&pf=t
rue [Accessed April 12 2021]
Francis, J, Douglas H. & Linda V. (1996). Causes and Effects of Discretionary Asset Write-Offs, Journal of
Accounting Research, vol. 34, no. 3, pp. 117–134
Giner, B. & Pardo, F. (2015). How Ethical are Managers’ Goodwill Impairment Decisions in Spanish-Listed
Firms?, Journal of Business Ethics, vol. 132, no.1, pp. 21–40
Glaum M., Schmidt, P., Street, D.L. & Vogel., S. (2013). Compliance with IFRS 3- and IAS 36- required
disclosures across 17 European countries: company- and country-level Determinants, Accounting and
Business Research, vol. 43, no. 3, pp. 163–204
Gros, M. & Koch, S. (2019). Discretionary goodwill impairment losses in Europe, Journal of Applied Accounting
Research, vol. 21, no. 1, pp. 106–124
Hamberg, M., Paananen, M. & Novak, J. (2011). The adoption of ifrs 3: The effects of managerial discretion and
stock market reactions, European Accounting Review, vol. 20, no. 2, pp. 263–288
Page 67
60
Hayn, C. (1995). The information content of losses, Journal of Accounting & Economics, vol. 20, no.2, pp. 125–
153
Hayn, C. & Hughes, P. J. (2006). Leading Indicators of Goodwill Impairment, Journal of Accounting, Auditing &
Finance, vol. 21, no.3, pp. 223–265
Henning, S. L., Shaw, W. H., & Stock, T. (2004). The amount and timing of goodwill write-offs and revaluations:
Evidence from U.S., & U.K. firms, Review of Quantitative Finance and Accounting, vol. 23, pp. 99–121
Hillman, A. J., Canella Jr., A. A. & Harris, I. C. (2002). Women and racial minorities in the boardroom: How do
directors differ?, Journal of Management, vol. 28, no. 6, pp. 747–763
Hirschey, M. & Richardson, V.J. (2002). Information Content of Accounting Goodwill Numbers, Journal of
Accounting and Public Policy, vol. 21, no. 3, pp. 173–191
Ibrahim, S., Xu, L., & Rogers, G. (2011). Real and accrual-based earnings management and its legal
consequences: Evidence from seasonal equity offerings, Accounting Research Journal, vol. 24, pp. 50-78
IFRS Foundation. (2020). Business Combinations—Disclosures, Goodwill and Impairment, Discussion Paper,
Available Online: https://cdn.ifrs.org/-/media/project/goodwill-and-impairment/goodwill-and-impairment-
dp-march-2020.pdf [Accessed April 12 2021]
International Accounting Standards Board – IFRS Organisation (2021). IAS 36 Impairment of Assets, Available
Online: https://www.ifrs.org/issued-standards/list-of-standards/ias-36-impairment-of-assets/#about
[Accessed April 7 2021]
Jarva, H. (2009). Do firms manage fair value estimates? An examination of SFAS 142 Goodwill impairments,
Journal of Business Finance and Accounting, vol. 36, no. 6, pp. 1059-1086
Jensen, M. C. and Meckling, W. H. (1976). Theory of the Firm: Managerial Behavior, Agency Costs and
Ownership Structure, Journal of Financial Economics, vol. 3, no.4, pp. 305–360
Jordan, C. & Clark, S. (2004). Big bath earnings management: the case of goodwill impairment under SFAS No.
142, Journal of Applied Business Research, vol. 20, pp. 63–70
Jordan, C. & Clark, S. (2015). Do New CEOs Practice Big Bath Earnings Management Via Goodwill
Impairments?, Journal of Accounting & Finance, vol. 15, no. 7, pp. 11–21
Kabir, H. & Rahman, A. (2016). The role of corporate governance in accounting discretion under IFRS: Goodwill
impairment in Australia, Journal of Contemporary Accounting & Economics, vol. 12, pp. 290-308
Klein, A. (2002). Audit Committee, Board of Director Characteristics, and Earnings Management, Journal of
Accounting and Economics, vol. 33, no. 3, pp. 375-400
Knauer, T. & Wöhrmann, A. (2016). Market Reaction to Goodwill Impairments, European Accounting Review,
vol. 25, no.3, pp. 421–449
Kuzel, A. (1999). Sampling in qualitative inquiry. In W. Miller & B. Crabtree, Doing qualitative research, 2nd
ed., pp. 33–45
Kvaal, E. & Nobes, C. (2012) IFRS Policy Changes and the Continuation of National Patterns of IFRS Practice.
European Accounting Review, vol. 21, no 2, pp. 343-371
Page 68
61
Lapointe‐Antunes, P., Cormier, D. & Magnan, M. (2008). Equity recognition of mandatory accounting changes:
the case of transitional goodwill impairment losses, Canadian Journal of Administrative Sciences, vol. 25,
no. 1, pp. 37-54
Lee, C. (2011). The Effect of SFAS 142 on the Ability of Goodwill to Predict Future Cash Flows, Journal of
Accounting and Public Policy, vol. 30, no. 3, pp. 236–255
Li, K. & Sloan, R. (2017). Has goodwill accounting gone bad?, Review of Accounting Studies, vol. 22, no. 2, pp.
964–1003
Li, Z., Shroff, R., Venkataraman, R., & Zhang, I. (2011). Causes and consequences of goodwill impairment losses,
Review of Accounting Studies, vol. 16, pp. 745–778
Maddala, G.S. (1991). A Perspective on the Use of Limited-Dependent and Qualitative Variables Models in
Accounting Research, The Accounting Review, vol. 66, pp. 788–807
Masters-Stout, B., Costigan, M.L., & Lovata, L.L. (2008) Goodwill impairments and chief executive officer
tenure, Critical Perspectives on Accounting, vol. 19, pp. 1370–1383
Post, C. & Byron, K. (2015). Women on boards and firm financial performance: A meta-analysis, Academy of
Management Journal, vol. 58, no. 5, pp. 1546–1571
Ramanna, K. (2008). The implications of unverifiable fair-value accounting: evidence from the political economy
of goodwill accounting, Journal of Accounting and Economics, vol. 45, no. 2–3, pp. 253–281
Ramanna, K. & Watts, R. (2012). Evidence on the use of unverifiable estimates in required goodwill impairment,
Review of Accounting Studies, vol. 17, no. 4, pp. 749–780
Riedl, E. I. (2004). An Examination of Long-Lived Asset Impairments, Accounting Review, vol. 79, no. 3, pp.
823–852
Ravlic, T. (2003). Goodwill hunting, Australian CPA, vol. 73, no. 3, pp. 69-70
Sandell, N. & Svensson, P. (2017). Writing write-downs: the rhetoric of goodwill impairment, Qualitative
Research in Accounting & Management, vol. 14, no. 1, pp. 81-102
Seetharaman, A., Sreenivasan, J., Sudha, R. & Yee, T. Y. (2006). Managing impairment of goodwill, Journal of
Intellectual Capital, vol. 7, no. 3, pp. 338–353
Sevin, S., & Schroeder, R. (2005). Earnings management: evidence from SFAS No.142 reporting, Managerial
Auditing Journal, vol. 20, no. 1, pp. 47–54
Siggelkow, L. & Zülch, H. (2013). Determinants of the write-off decision under IFRS: evidence from Germany,
International Business & Economics Research Journal, vol. 12, no. 7, pp. 737-754
The European Financial Reporting Advisory Group (EFRAG). (2016). What do we really know about goodwill
impairment? A quantitative study. Available Online:
https://www.efrag.org/Assets/Download?assetUrl=/sites/webpublishing/SiteAssets/EFRAG%2520Quantit
ative%2520Study%2520Goodwill%25202016.pdf [Accessed April 20 2021]
Van de Poel, K., Maijoor, S. & Vanstraelen, A. (2009). IFRS Goodwill Impairment Test and Earnings
Management: The Influence of Audit Quality and the Institutional Environment, Working Paper,
Universiteit Antwerpen.
Page 69
62
Verriest, A., Gaeremynck, A., (2009). What Determines Goodwill Impairment? Review of Business and Economic
Literature, vol. 54, no. 2, pp. 106-128
Watts, R. (2003). Conservatism in accounting part I: Explanation and implications, Accounting Horizons, vol. 17,
pp. 207–221
Wells, P. (2002). Earnings management surrounding CEO changes, Journal of Accounting and Finance, vol.42,
pp. 169-193
Wen, H. & Moehrle, S. R. (2016). Accounting for goodwill: An academic literature review and analysis to inform
the debate, Research in Accounting Regulation, vol. 28, no. 1, pp. 11–21
Wines, G., Daqwell, R., & Windsdor, C. (2007). Implications of the IFRS goodwill accounting treatment,
Managerial Auditing Journal, vol. 22, no. 9, pp. 862-880
Xie, B., Davidson, W.N. & DaDalt, P.J. (2003). Earnings management and corporate governance: the role of the
board and the audit committee, Journal of Corporate Finance, vol. 9, no. 3, pp. 295–316
Xu, W., Anandarajan, A. & Curatola, A. (2011). The value relevance of goodwill impairment, Research in
Accounting Regulation, vol. 23, no. 2, pp. 145–148
Zang, Y. (2008). Discretionary Behaviour with Respect to the Adoption of SFAS No. 142 and the Behaviour of
Security Prices, Review of Accounting and Finance, vol. 7, pp. 38–68
Zucca, L. J. & Campbell, D. R. (1992). A Closer Look at Discretionary Writedowns of Impaired Assets,
Accounting Horizons, vol. 6, no.3, pp. 30–41
Page 70
63
Appendix
Appendix 1: Overview of previous research techniques on goodwill impairment
Author (Year
of publication)
Research
question(s)
Research Method Variables Sample
AbuGhazaleh,
Al-Hares and
Roberts (2011)
What are the
determinants of
goodwill
impairment losses?
Does managerial
discretion reflect
opportunistic
reporting by
managers or the
provision of their
private
information?
A one-stage
multivariate pooled
tobit regression to
examine the
determinants of
goodwill
impairment losses.
Actual (Economic)
impairment proxies:
book to market, size of
goodwill, number of
cash-generating units,
change in turnover,
change in operating
cash
flows, and ROA.
Proxies for Managerial
Discretion: Leverage,
big bath and income
smoothing,
management change.
Proxies for corporate
governance: board
independence, separate
chairman, activity,
block holders, and
shares held by
executive and non-
executive directors.
Sample of 528
firm year
observations,
drawn from the
top 500 U.K.
listed firms for
2005-2006.
Avallone &
Quagli (2015)
What are the
variables used by
managers through
the impairment test
to avoid or reduce
goodwill write-
offs?
A tobit regression
and a logistic
regression of the
amount of reported
goodwill
impairment losses
and the simple
recognition of
goodwill losses,
respectively, on the
future cash flows,
the estimations used
for both WACC and
the long-term
growth rate in the
impairment test.
Price-to-book firm
value for firm, the
difference between the
average WACC ratio
actually used in the
impairment test and the
WACC ratio re-
estimated using the
information publicly
available from external
sources, the difference
between the average
growth ratio actually
used in the impairment
test and the growth
ratio re-estimated
using the information
publicly available from
external sources, log of
total assets, leverage
Sample of highly
capitalized
European listed
companies (from
Germany, Italy,
and UK) with
book goodwill
over the period
2007–2011.
Page 71
64
ratio for firm i
estimated as the ratio
between total debt and
total assets, return of
assets, change in the
CEO during the year,
book goodwill for firm
Beatty &
Weber (2006)
What factors affect
management's
decision to
accelerate a
goodwill
impairment charge
as an SFAS 142
below-the-line
cumulative effect as
opposed to delaying
the recognition of
impairments into
future above-the-
line charges?
Two managerial
choices are studied:
1) using a probit
model to identify
covariates of the
decision to record a
transition charge. 2)
using a censored
regression to
estimate how these
same proxies are
associated with the
magnitude of the
charge.
Dependent variables:
Goodwill Impairment.
Hypothesized
determinants of write-
offs: Debt covenant
slack, CEO bonus,
CEO tenure, firm size,
leverage among other
proxies.
A sample of US
867 firms with a
goodwill balance
and a difference
between the
market and book
value of their
equity that is less
than their
recorded
goodwill. The
sample includes
firms that are
relatively more
likely to take
goodwill write-
offs.
Bens, Heltzer
and Segal
(2011)
How did the
adoption of SFAS
142 alter the
information content
of goodwill write-
offs?
To more accurately
capture the
information of
goodwill write-offs,
the authors first
create a model to
estimate expected
impairments. The
difference between
actual write-offs
and expected write-
offs represents
write-off surprises
or unexpected
goodwill write-offs.
They use a temporal
explanatory analysis
to examine
information content
pre-142 and post-
142, combined with
cross-sectional tests
to determine the
association between
returns and write-
Dependent variable:
abnormal returns after
impairment loss
announcements.
Independent variables:
information
asymmetry, the ability
of the firm to
efficiently implement
impairment tests and
firm complexity
proxied by analyst
following, firm size
and number of reported
segments respectively.
Sample of US
firms that took
intangible asset
write-offs of at
least 5% of lagged
assets over the
period 1996–
2006.
Page 72
65
offs varies with firm
characteristics.
Carlin and
Finch (2010)
To what extent do
firms exercise
opportunistic
discretion in
discount rate
selection when
undertaking
goodwill
impairment testing?
The authors use an
empirical archival
approach.
Independent risk‐
adjusted company
discount rates are
estimated for the
firm sample. An
analysis of
variances between
these rates and
those used by
sample firms are
done to examine if
there is evidence of
potential
opportunism in
discount rate
selection.
Independent risk-
adjusted company
discount rates via the
capital asset pricing
model vs. actual
discount rates used by
sample firms in
impairment testing.
A sample of 124
Australian and
New Zealand
listed firms in
2007.
Chen,
Kohlbeck and
Warfield
(2008)
How is the
timeliness of
impairment
recognition affected
by SFAS 142
adoption?
The authors use a
regression of
return/earnings to
examine the
association between
the SFAS 142
impairments
recognized in 2002
with current and
prior years' returns.
A reverse regression
of earnings on
current and past
returns to examine
Impairments are
incorporated for each
firm-year observation
to test for timeliness.
The impairment
amounts are then
interacted with year
indicator variables to
capture differential
timeliness. Indicators
include:
Goodwill/assets,
Assets, book value of
equity, Market value of
Sample of 1763
US firms, 726 of
which report
goodwill
impairments at the
end of 2001.
Page 73
66
earnings recognition
lag is also
undertaken.
equity, Market to book
value of equity,
Annual return, Size-
adjusted annual return,
Income before
extraordinary items
and impairments,
Adoption impairment,
Year 1 impairment,
Total impairments,
Income before
extraordinary items &
Return on assets.
Darrough,
Guler and
Wang (2014)
Are CEO
compensation
reduced when fair
values of acquired
business units are
written down?
Univariate analysis
and Multivariate
analysis.
Dependent variable is
CEO compensation
(Cash, options or
restricted stock
compensations)
independent variables
are actors specific to
the firm (stock
performance, return on
assets, size, etc.), the
acquisitions (write-
down, restructure, etc.)
and the CEO (tenure
etc.).
Sample of 3,572
US firm-years
with goodwill and
2,670 firm-year
observations with
no goodwill
impairments for
the years 2002 to
2009.
Filip, Lobo and
Paugam,
(2021)
Are goodwill non-
impairment
decisions
opportunistically
exercised through
overly optimistic
valuation
assumptions and
future cash flow
forecasts? Do
enforcement
constraints
influence
impairment
decisions?
Univariate and
multivariate
descriptive
statistics.
3,916 firm-year
observations from
36 countries
between 2007 and
2014 that require
reporting under
IFRS.
Page 74
67
Francis,
Douglas &
Linda (1996)
What are the
determinants of
managements'
write-off decisions?
What are the
security price
reactions to firms'
write-off
announcements?
Multivariate
Analysis of the
Factors Influencing
Write-Offs
(Specific Tobit
Models)
Numerous proxies
such: Prior Five-Year
Return (%), Ind.-Adj.
Book-to-Market (%),
Change in Book-to-
Market (%), Change in
Return-on-Assets (%),
Industry Sales Growth
(%), Change Ind.
Book-to-Market (%),
Change Ind. Return-
on-Assets. For stock
market reactions:
Amount of Write-
Off/Assets,
Unexpected
Earnings/Assets,
Change in
Dividends/Assets,
Unusual Gain/Assets,
Unusual Loss/Assets,
Log of Sales Revenue
3,909 potential
write-off
announcements of
US firms
Giner and
Pardo (2015)
How Ethical are
Managers’
Goodwill
Impairment
Decisions in
Spanish-Listed
Firms?
Probit regression to
assess the
probability of firms
impairing goodwill
and goodwill and
OLS regression to
examine the amount
of goodwill that was
actually impaired
and a tobit
regression that
included all firm-
year observations.
Dependent variables in
the probit model:
goodwill impairment
as 1 (0 if not), and in
the OLS and tobit
models: reported
goodwill impairment
loss. Independent
variables in the probit
and OLS models:
leverage ratio,
smoothing, carrying
amount of goodwill,
adjusted return on
equity, market return,
expected goodwill
impairment.
Dichotomous
variables: Goodwill
impairment loss, big
bath is an indicator
variable that takes a
value of 1 if pre-
impairment earnings
are negative at time t
and lower than
earnings at time t - 1,
auditor is an indicator
A sample of
Spanish-listed
companies
between 2005 and
2011. The sample
compromise 663
firm-year
observations.
Page 75
68
variable that takes a
value of 1 if it is a
Big4 auditing firm, etc.
Gros and Koch
(2019)
What are the
determinants of
discretionary
goodwill
impairments?
The authors split
goodwill
impairment losses
into economically
induced and
discretionary by
running a regression
of the realized
goodwill
impairment
losses on the
economic
determinants of
goodwill
impairments to
identify
economically
induced goodwill
impairment losses.
The difference
between economic
and reported
goodwill is
considered
discretionary
goodwill. Then
determinants of
discretionary
goodwill
impairments are
examined through
an OLS panel
regression.
The model used to
examine economic
goodwill have
independent variables
such as share return,
return on assets,
earnings per share
forecast, operating
cash flow, market-to-
book, leverage
(liabilities/assets), size,
and dummy variables
such as profit
warnings, negative
income the year prior
to impairment.
Discretionary goodwill
has independent
variables such as: share
return, board
experience, country
specific enforcement
score, size (assets),
debt, ratio of shares in
free float to total
number of shares,
smoothing as the
absolute value of the
positive change in
scaled EBIT, big bath
as the absolute value of
the negative change in
scaled EBIT, and
management change as
a dummy variable.
A sample of 2,485
firm-years
observations of
EURO STOXX
600 companies
between 2007-
2013.
Hamberg,
Paananen &
Novak (2011)
How did managers
use their discretion
in association with
the first-time
adoption of IFRS 3?
The authors use a
probit regression to
test variables
connected with the
decision to impair
goodwill.
Independent variable is
goodwill impairment
and dependent
variables are proxies
for debt constraints,
managerial equity-
market concerns,
managerial earnings-
based compensation,
tenure, etc.
A sample of 1 691
firm-year
observations
between 2001-
2007 of firms
listed on the
Stockholm Stock
Exchange.
Page 76
69
Hayn &
Hughes (2006)
Are investors able
to estimate
goodwill write-offs
and financial
performance of
acquired firms
based on financial
disclosures?
A regression model
to predict goodwill
write-offs through
acquisition
characteristics and
performance
indicators.
Acquisition
characteristics
variables include
premium paid, if there
were multiple bidders,
goodwill as % of
acquisition cost and
performance indicators
include variables such
as return on assets,
change in sales, etc.
1276 acquisitions
and goodwill
write-offs of US
publicly traded
companies
between 1988-
1998.
Henning, Shaw
& Stock (2004)
Are firms given too
much discretion in
the determination of
the amount and
timing of goodwill
write-offs?
Logit regression
analysis.
Independent variables
include book values of
liabilities and preferred
stock during the
acquisition year, book
value of assets minus
the book value of
purchased goodwill,
etc.
A sample of 171
UK and US firms
that announced an
impairment of
goodwill or
intangible asset
revaluation
between 1990-
2001.
Hirschey &
Richardson,
2002
What is the market-
value effects of
goodwill write-off
announcements?
A standard event-
study methodology.
Dependent variables
are goodwill
impairment
announcements, and
the independent
variable is abnormal
stock market returns.
A sample of 80
goodwill
impairment
announcements by
US firms between
1992-1996.
Jarva (2009) Are SFAS 142
goodwill write-offs
associated with
future expected
cash flows as
mandated by the
standard?
A regression
analysis of 1-3
future year
operating cash
flows after goodwill
write-offs.
The independent
variable is goodwill
write-off, and the
dependent variable is
the realized cash flows
as a proxy for
managers’ expectations
of cash flow.
327 firm-year
observations for
US stock-listed
companies that
took goodwill
write-offs between
2002-2006 and a
control sample of
9,960 firm-year
observations
without goodwill
impairment.
Jordan and
Clark’s (2004)
Do firms pursue big
bath earnings
management
following CEO
change?
Chi-square tests and
T-tests to examine
if new CEOs used
goodwill
impairments to
accomplish big bath
earnings
management.
Dependent variable is
goodwill impairment
and independent
variable CEO change.
A sample of 244
Fortune 500
companies that
changed CEO
2003-2013.
Page 77
70
Knauer and
Wöhrmann
(2016)
Are capital market
reactions upon
announcements of
goodwill
impairment
associated with the
likelihood of
opportunistic
disclosure?
An event-study
design and
regression model
that analyze the
association between
abnormal returns
and the amount of
unexpected
goodwill write-off.
The main dependent
variable is cumulative
abnormal returns,
independent variables
include unexpected
goodwill write-off
among other factors.
A sample of 564
goodwill write-
down under either
IAS 36 or SFAS
142
announcements
between 2005-
2009.
Lapointe-
Antunes (2008)
Can reporting
incentives and
constraints be
associated with the
magnitude of
transitional
goodwill
impairment losses
reported by
Canadian firms?
A multivariate tobit
model to assess the
determinants of
transitional
goodwill
impairment losses.
Dependent variable is
reported transitional
goodwill
impairment loss
deflated by lagged total
assets. Independent
variables include
return on equity,
Percentage of
acquisitions financed
entirely with cash or
debt change of CEO
for the years preceding
the adoption of Section
3062, number of
reporting units, etc.
All firms listed on
the TSX that
report under
Canadian GAAP
and have a
positive goodwill
balance at the
year-end
preceding the
adoption of
Section 3062. The
sample consists of
331 firms.
Lee (2011) Does SFAS 142’s
treatment for
goodwill enhances
or dampens the
ability of goodwill
to predict future
cash flows? What
effect does
managerial
reporting discretion
have on goodwill’s
ability to predict
future cash flows?
Regression analysis
models.
Using one-year and
two-year ahead cash
flows as dependent
variables and
independent variables
such as net income etc.
A sample of 4825
US firms and
13,848 firm-year
observations for
the years 1995-
2006.
Li & Sloan
(2017)
What is the impact
of SFAS 142 on the
accounting for and
valuation of
goodwill?
Frequency analysis
of impairments and
cross-sectional
regressions of future
stock returns on the
financial indicator
for goodwill impairments.
Future stock returns as
dependent variable and
goodwill impairment
as independent
variable controlling for
proxies for information
environment through
A pre-142
subsample
of 9049 firm-year
observations with
positive beginning
goodwill balances
from 1996 to 2000
and a post-142
subsample that
includes 19,290
Page 78
71
firm-year
observations with
positive goodwill
balances from
2004 to 2011.
Li, Shroff,
Venkataraman
& Zhang
(2011)
What is the market
reaction to the
announcement of a
goodwill
impairment loss?
Can the cause of
goodwill
impairment be
traced back to
overpayment for
targets of prior
acquisitions?
An abnormal
returns event study
and a tobit
regression.
Goodwill impairment
as dependent variable
is examined using
proxies for
overpayment such as
acquisition book value
premium, stock
payments by
overvalued bidders,
unrelated acquisitions,
etc.
A sample of 1584
impairments by
US firms 1996-
2006.
Masters-Stout,
Costigan &
Lovata, 2008
Do newer CEOs
impair more
goodwill than their
senior counterparts?
Multiple regression
models.
Goodwill impairment
as dependent variable
and CEO tenure as the
primary independent
variable.
A sample of 990
firm-year
observations of
Fortune 500
companies during
2003–2005
Ramanna &
Watts, 2012
Does management
exploit the
impairment regime
to align reporting
with personal
incentives or is it
used to convey
private information
that management
has on the
development of
acquisitions?
Multivariate
regression analysis
of firms with
market indications
of impairment based
on the development
of the firm’s
market-to-book
ratio of goodwill
but did not report an
impairment and
determinants of
non-impairment
2003-2006.
Determinants of
goodwill non-
impairment are
examined using
proxies for private
information motives,
contracting motives,
reputation motives,
reporting flexibility,
etc.
A sample of US
firms with market
indications (book
goodwill and
equity-to-market
ratio higher than
equity-to-book
ratio) of goodwill
impairment
between 2003-
2006.
Riedl, 2004 What are the
determinants of
asset write-downs
before and after the
introduction of
SFAS 121?
A tobit regression. Dependent variable is
long-lived asset write
off and independent
variables include
leverage, change in
A sample of 5180
firm-year
observations of
US companies
1992-1998.
Page 79
72
sales, proxies for big
bath, etc.
Sevin and
Schroeder
(2005)
Does SFAS No.
142 allow for the
earnings
management
technique termed
“big bath”? Does
firm size play a role
in earnings
management?
An analysis of
goodwill
impairments,
comparing financial
metrics, and
calculating the
proportion of firms
with negative versus
positive earnings.
Independent variables
such as goodwill to
total assets, return on
assets and return on
sales are financial
metrics used.
A random
selection of US
companies that
made goodwill
impairments in
2002 and 82 firms
that did not
impair.
Siggelkow &
Zülch, 2013
What factors
influence the write-
off decisions in
German-listed
companies?
A probit regression
to find the
impairment
incentives.
Goodwill impairment
as dependent variable
and independent
variables include
leverage, profitability,
cash-flow and market-
to-book ratios.
A sample of 805
firm-year
observations of
German firms
2004-2010.
Van den Poel
et al. (2009)
Are firms more
likely to take a
goodwill
impairment when
their earnings are
‘unexpectedly’ low
or high?
Regression analysis. Determinants of
goodwill impairment
including independent
variables such as
auditors and legal
environments.
2,622 firm-year
observations from
listed companies
in 15 EU countries
preparing
financial
statements under
IFRS in the period
2005-2006.
Verriest &
Gaeremynck
(2009)
What are the
goodwill
impairment
determinants?
Including goodwill
impairment
disclosures.
Multiple regression
models.
Impairment as
dependent variable and
independent variables
include free float of
shares, the percentage
of independent
members on the board,
etc.
A sample of 62
FTSE 300
companies.
Wells (2002) Does CEO tenure
effect earnings
management?
Regression analysis
and quantitative
tests of CEO
changes.
Dependent variable are
XX independent
variables are XX
A sample of
Australian firms
listed on ASX
between 1984 and
1994
Xu,
Anandarajan
and Curatola
(2011)
Are goodwill
impairments value
relevant?
A price model and a
return model.
The price model uses
earnings and book
value to explain share
price. The return
model is based on the
price model and adds
A sample of 431
US firm-year
observations with
goodwill
impairment
charges
Page 80
73
change in sales and
change in return on
assets.
recognized 2003-
2006.
Zang, 2008 Do managers
manipulate the
transitional
goodwill
impairment loss
upon adoption of
SFAS 142 and if so,
why? How does the
stock market react
to the
announcement of
transitional
impairment and
increased earnings
due to the
eliminated
amortization?
In an event-study
framework tobit
model is used to test
for earnings
management.
Two managerial
discretionary variables
are used: firm leverage
and change in
management to
investigate cross-
sectional variations in
the initial impairment
loss after controlling
for the actual economic
goodwill impairments
proxied by variables
such as past asset and
stock performance,
size, industry, etc.
A sample of 870
firms that
completed a
transitional
goodwill
impairment test in
the adoption year.
Zucca and
Campbell
(1992)
Does a timing
pattern of goodwill
impairments exist?
Information content
study and a random
walk model.
Quantitative test of
earnings
management by
calculating expected
earnings levels of
sample firms,
simple regression
analysis on whether
write-down firms
engage in merger
activity, a one-way
analysis of variance
of financial health.
Financial health of
firms wase measured at
6 points in time the
years before and after
the write-down
through the following
financial variables:
Cash Dividend
Growth,
Earnings/Price Ratio,
Debt to Equity Ratio,
and Quarterly Return
on Assets.
77 write-downs
taken by 67 firms
1978- 1983.
Page 81
74
Appendix 2: Interview Questions
General impairment test related questions
• Who is responsible for the execution of the impairment test, more specifically: the
determination of the recoverable amount (value in use?)? The discount rate?
• What would be indications for an impairment at [company name]? Do metrics such as
market-to-book ratios or return on assets play a role?
• How are management estimates considered in the calculation? Who is involved in the
process gives input on future cash flows, for example? Are any third parties
consulted?
• What factors are considered when estimating future cash flows? How long is the explicit forecast period?
• How many CGU containing goodwill does [company name] employ?
• Who decides on the allocation of goodwill to CGU upon acquisitions? Impairment in 2020
• Has a goodwill impairment been identified in 2020?
o If yes, what were the causes? o If not, why?
• Has Covid-19 affected the estimation of the value in use? If so, how?
• Has the CGU been underperforming for the periods prior to the impairment?
Discretion in impairment testing
• Given the flexibility of discretion inherent in the IAS 36 impairment test, do you think
you have the ability to manage earnings if you wished to do so by managing goodwill impairments? I.e. by making overly optimistic/pessimistic value assumptions.
• Past research on goodwill impairment finds that goodwill impairment losses are
recognized above predicted economically induced impairments (Gros & Koch, 2019;
Ramanna & Watts, 2012). Why do you think this is the case? Do factors such as
leverage, potential market reactions or CEO tenure influence the impairment decision?
• Do you think the financial crisis caused by Covid-19 can be used as a scapegoat for poor performance of acquired business units and be used to justify goodwill
impairment?
• Do shareholders generally tend to question impairment losses i.e. is there a need for
detailed justification (beyond disclosures in the financial report)?
• If a goodwill impairment is identified, is it more attractive to recognize such a loss
when earnings levels are already depressed? Why?
• Have investors generally been more accepting of goodwill impairments taken in times
of general economic downturn?
• Can you identify any incentives you may have had to take discretionary goodwill
impairments in 2020?
Page 82
75
Appendix 3: Interview Overview
Interview
ID
Country Industry Position of
interviewee
Relation to goodwill impairment
1 Sweden Consumer
Discretionary
Head of Group
Accounting &
Business Control
Full responsibility for impairment test:
determination of future cash flows and
discount rate. Future cash flows are based on
prospective CGU budget which is signed off
by the board. Cost of equity is calculated
with input from external parties: banks,
auditors, etc.
2 Sweden Industrials CFO & Head of
IR
Full responsible for the impairment test, all
“critical” assumptions, asset data and firm-
specific risk oriented at peers i.e. firms with
similar market cap, market risk based on risk
premium study by PwC & 10-year Swedish
bonds
3 Sweden Industrials Head of
Corporate Control
Responsible for corporate control function
of the company group, responsible for
impairment test execution, help from the
M&A department to calculate WACC, the
other assumptions are prepared by the
accounting department.
4 Sweden Industrials Head of Group
Finance
Responsible for group finance and highly
involved in impairment testing in
collaboration with group finance team.
5 Sweden Consumer
Discretionary
Business Finance
Manager
Contact for related discussions with
auditors, involvement in preparation of
impairment test in collaboration with CFO
6 Sweden Industrials Director of Group
Financial Control
Practical execution of impairment test,
estimation cash flow forecast, estimation of
discount rate: collaboration with CFO, CFO
is “highly” involved as well as audit
committee
Page 83
76
7 Switzerland Materials Deputy Head of
Consolidation and
Reporting
Full responsibility for preparing and
executing the impairment test including
determination of WACC.
Appendix 4: Collinearity Diagnostics of OLS Regression (SPSS Output)
Coefficients
Model Unstandardized
Coefficients
Standardized
Coefficients
T Sig. Collinearity
Statistics
B Std. Error Beta Tolerance VIF
(Constant)
GDP
FIRM SIZE
ROA
LEVERAGE
GOODWILL
∆OCF
∆SALES
BIGBATH
BOARDIDP_AUD
BOARD-
MEETINGS
% WOMEN
CEO TENURE
CEO
SHARE
0,000 0,003 0,170 0,865
0,007 0,018 0,006 0,367 0,714 0,418 2,393
0,000 0,000 -0,015 -1,099 0,272 0,586 1,708
0,083 0,003 0,285 24,328 0,000 0,847 1,180
1,712E-08 0,000 0,004 0,379 0,705 0,994 1,006
0,008 0,003 0,037 3,208 0,001 0,879 1,137
2,887E-06 0,000 0,003 0,272 0,786 0,996 1,004
0,000 0,000 -0,009 -0,791 0,429 0,996 1,004
0,013 0,001 0,115 9,623 0,000 0,810 1,235
-9,126E-06 0,000 -0,016 -1,155 0,248 0,626 1,597
0,000 0,000 0,043 2,922 0,003 0,526 1,899
-3,424E-05 0,000 -0,016 -1,067 0,286 0,546 1,831
-9,694E-05 0,000 -0,014 -1,138 0,255 0,746 1,341
-1,963E-05 0,000 -0,004 -0,341 0,733 0,963 1,038
-0,002 0,002 -0,017 -1,194 0,232 0,604 1,657
Page 84
77
Industry IT
Industry Consumer
Staples
Industry Health
Care
Industry Energy
Industry
Communication
Services
Industry Materials
Industry Utilities
SMOOTH
Year2011
Year2012
Year2013
Year2014
Year2015
Year2016
Year2017
Year2018
Year2019
Industry Industrials
-0,002 0,002 -0,017 -1,290 0,197 0,697 1,434
-0,002 0,002 -0,019 -1,454 0,146 0,648 1,543
-0,001 0,002 -0,003 -0,240 0,810 0,757 1,321
-0,002 0,002 -0,018 -1,404 0,160 0,697 1,436
-0,002 0,002 -0,018 -1,367 0,172 0,673 1,486
0,001 0,002 0,005 0,438 0,662 0,743 1,346
-0,001 0,001 -0,020 -1,778 0,075 0,944 1,059
-0,005 0,002 -0,042 -2,125 0,034 0,296 3,377
-0,006 0,002 -0,047 -2,694 0,007 0,381 2,623
-0,005 0,002 -0,040 -2,143 0,032 0,331 3,022
-0,005 0,002 -0,041 -2,297 0,022 0,360 2,775
-0,005 0,002 -0,041 -2,253 0,024 0,355 2,814
-0,005 0,002 -0,044 -2,163 0,031 0,284 3,516
-0,005 0,002 -0,044 -2,193 0,028 0,286 3,495
-0,006 0,002 -0,051 -2,583 0,010 0,295 3,390
-0,004 0,002 -0,034 -1,823 0,068 0,330 3,035
-0,001 0,001 -0,012 -0,760 0,447 0,480 2,082
Page 85
78
Appendix 5: Scatterplot of residuals of OLS Regression (H3)
Appendix 6: White’s Test for Heteroskedasticity (Model 2)
White's test for Ho: homoskedasticity
against Ha: unrestricted heteroskedasticity
chi2(471) = 6586.21
Prob > chi2 = 0.0000
Page 86
79
Appendix 7a: Multivariate Tobit Regression results (Model 1) in 2020
2020 (Unstable Year)
VARIABLES GIMPTA GIMPTA GIMPTAt-1
Constant -0.415*** -0.415*** -0.312***
(0.0446) (0.0797) (0.0337)
BIGBATH 0.0782*** 0.0782*** 0.0591***
(0.0191) (0.0207) (0.0144)
BTM -0.00133 -0.00133** -0.00103
(0.00132) (0.000630) (0.00101)
∆SALES -0.275*** -0.275*** -0.205***
(0.0496) (0.0717) (0.0374)
∆OCF 0.000529 0.000529 0.000391
(0.000723) (0.000563) (0.000547)
ROA 0.980*** 0.980*** 0.733***
(0.0418) (0.184) (0.0316)
SMOOTH 0.00695 0.00695 0.00463
(0.0146) (0.0138) (0.0110)
LEVERAGE -0.000157 -0.000157 -0.000117
(0.000196) (0.000206) (0.000148)
CEOTENURE 0.000781 0.000781 0.000587
(0.00120) (0.00111) (0.000909)
CEOSHARE -0.000793 -0.000793 -0.000644
(0.00287) (0.00254) (0.00217)
WOMEN 0.000301 0.000301 0.000213
(0.000561) (0.000558) (0.000423)
BOARDIDP_AUD -0.000342 -0.000342* -0.000250
Page 87
80
(0.000226) (0.000205) (0.000170)
BOARDMEETINGS 0.00236* 0.00236* 0.00175*
(0.00141) (0.00124) (0.00106)
FIRMSIZE 0.0201*** 0.0201*** 0.0152***
(0.00423) (0.00590) (0.00319)
GOODWILL 0.0449 0.0449 0.0354
(0.0463) (0.0437) (0.0349)
GDP -0.110 -0.110 -0.0884
(0.246) (0.228) (0.186)
Industry Controls Yes Yes Yes
Year Controls Yes Yes Yes
Robust Standard Errors No Yes No
Observations 750 750 750
Standard errors in parentheses
*** p<0.01, ** p<0.05, * p<0.1
Appendix 7b: Multivariate Tobit Regression results (Model 1) in 2010-2019
2010-2019 (More stable years)
VARIABLES GIMPTA GIMPTA GIMPTAt-1
Constant -0.102*** -0.102*** -0.0938***
(0.00643) (0.00972) (0.00592)
BigBathDummy1 0.0269*** 0.0269*** 0.0236***
(0.00303) (0.00445) (0.00279)
BTM -3.32e-05 -3.32e-05 -3.29e-05
(8.99e-05) (6.74e-05) (8.26e-05)
CSALES -0.000365 -0.000365 -0.000280
Page 88
81
(0.000631) (0.000437) (0.000603)
COCF 4.61e-05 4.61e-05 4.03e-05
(7.09e-05) (6.65e-05) (6.50e-05)
ROA 0.0263*** 0.0263*** 0.0233***
(0.00705) (0.0100) (0.00651)
SMOOTH 0.000778 0.000778 0.00100
(0.00187) (0.00186) (0.00172)
LEVERAGE 1.20e-07 1.20e-07** 1.13e-07
(7.50e-08) (5.90e-08) (6.88e-08)
CEOTENURE 0.000179 0.000179 0.000148
(0.000194) (0.000175) (0.000179)
CEOSHARE -0.000258 -0.000258 -0.000243
(0.000267) (0.000243) (0.000249)
WOMEN -8.32e-05 -8.32e-05 -7.23e-05
(7.68e-05) (7.13e-05) (7.05e-05)
BOARDIDP_AUD 6.51e-05** 6.51e-05** 5.88e-05**
(2.61e-05) (2.70e-05) (2.40e-05)
BOARDMEETINGS 0.000182 0.000182 0.000226
(0.000205) (0.000214) (0.000188)
FIRMSIZE 0.00385*** 0.00385*** 0.00351***
(0.000553) (0.000603) (0.000508)
GOODWILLASSETS 0.0227*** 0.0227*** 0.0209***
(0.00629) (0.00646) (0.00578)
GDP -0.0559 -0.0559 -0.0532
(0.0451) (0.0376) (0.0415)
Industry Controls Yes Yes Yes
Year Controls Yes Yes Yes
Page 89
82
Robust Standard Errors No Yes No
Observations 6,681 6,681 6,680
Standard errors in parentheses
*** p<0.01, ** p<0.05, * p<0.1
Appendix 8: OLS Regression of Economic Impairment Factors on Goodwill Impairment
scaled by total assets at the end of the year including the whole sample (2010-2020)
VARIABLES GIMPTA GIMPTA
Constant -0.00268 -0.00268
(0.00229) (0.00613)
BTM 1.49e-05 1.49e-05
(5.36e-05) (2.39e-05)
CSALES -0.000309 -0.000309
(0.000326) (0.000353)
COCF -9.31e-07 -9.31e-07
(1.09e-05) (1.64e-06)
ROA 0.0713*** 0.0713
(0.00336) (0.0701)
FIRMSIZE -0.000450** -0.000450
(0.000214) (0.000349)
GOODWILL 0.00563** 0.00563**
(0.00280) (0.00287)
GDP -0.00111 -0.00111
(0.0189) (0.0111)
Industry Controls Yes Yes
Year Controls Yes Yes
Page 90
83
Robust Standard Errors No Yes -Clustered at ISIN
Observations 7,431 7,431
R-squared 0.061 0.061
Standard errors in parentheses
*** p<0.01, ** p<0.05, * p<0.1