Page 1
U.S. Department of the Interior Bureau of Reclamation Technical Service Center Denver, Colorado March 2015
Goose Bay Marina Concession Financial Feasibility Evaluation (Final)
Canyon Ferry Reservoir, Broadwater County, Montana
Page 2
Mission Statements
The mission of the Department of the Interior is to protect and
provide access to our Nation’s natural and cultural heritage and
honor our trust responsibilities to Indian Tribes and our
commitments to island communities.
The mission of the Bureau of Reclamation is to manage, develop,
and protect water and related resources in an environmentally and
economically sound manner in the interest of the American public.
Page 3
1.1.3
U.S. Department of the Interior Bureau of Reclamation Technical Service Center Denver, Colorado
Goose Bay Marina Concession Financial Feasibility Evaluation
Canyon Ferry Reservoir, Broadwater County, Montana
Prepared by
United States Department of the Interior Bureau of Reclamation Technical Service Center Economics, Planning, & Technical Communications Denver, Colorado
Page 4
This page intentionally left blank.
Page 5
Page i of 32
1 INTRODUCTION..............................................................................................................1 1.1 Goose Bay Marina Concession Area ................................................................................1
2 Financial Feasibility Evaluation .......................................................................................2 2.1 Overview of Financial Feasibility Studies ........................................................................2 2.2 Financial Feasibility Evaluation Framework ....................................................................2 2.3 Measures of Financial Feasibility .....................................................................................4 2.4 Key Factors Affecting Financial Feasibility .....................................................................5 2.5 Financial Feasibility Evaluation of Proposed Commercial Services at
Goose Bay Marina ............................................................................................................7 2.5.1 Common Analytical Assumptions ...........................................................................8 2.5.2 Marina Services .......................................................................................................9
2.5.3 Day-use Services ....................................................................................................14 2.5.4 Marina Store Services ............................................................................................18 2.5.5 RV Camping Services ............................................................................................22 2.5.6 All Services Combined ..........................................................................................27 2.5.7 Financial Feasibility Evaluation Sensitivity Analysis ...........................................30
Page 6
Page 1 of 32
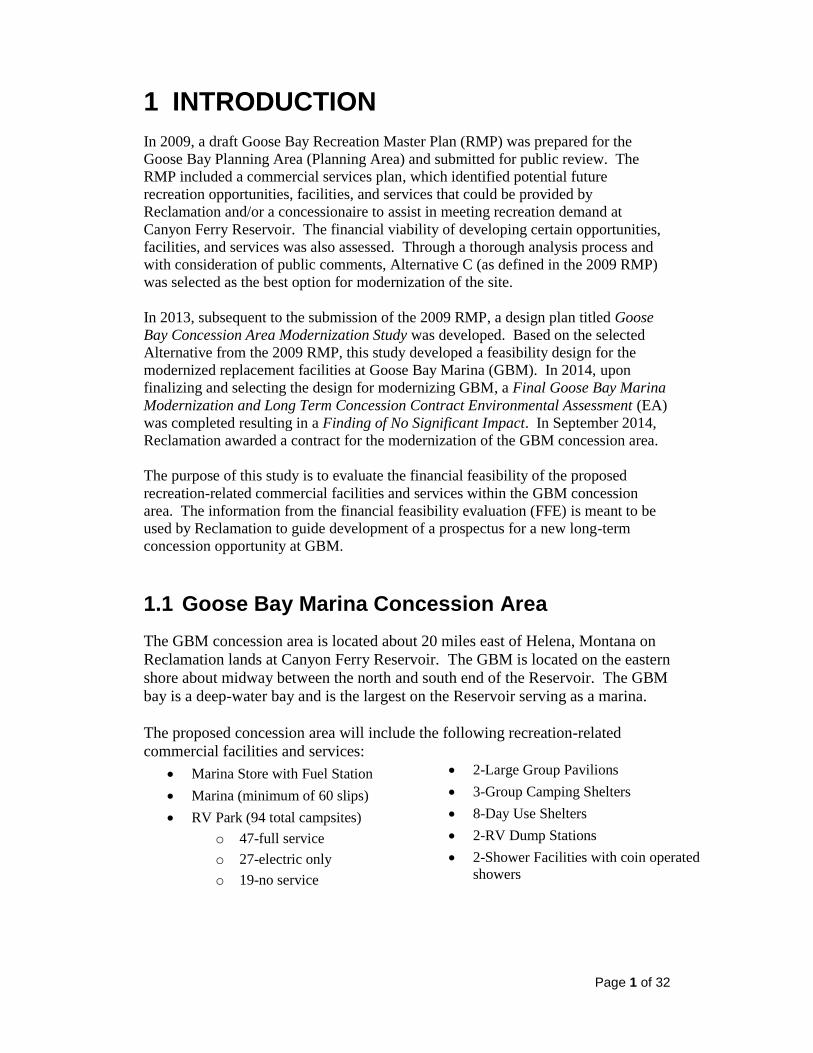
1 INTRODUCTION
In 2009, a draft Goose Bay Recreation Master Plan (RMP) was prepared for the
Goose Bay Planning Area (Planning Area) and submitted for public review. The
RMP included a commercial services plan, which identified potential future
recreation opportunities, facilities, and services that could be provided by
Reclamation and/or a concessionaire to assist in meeting recreation demand at
Canyon Ferry Reservoir. The financial viability of developing certain opportunities,
facilities, and services was also assessed. Through a thorough analysis process and
with consideration of public comments, Alternative C (as defined in the 2009 RMP)
was selected as the best option for modernization of the site.
In 2013, subsequent to the submission of the 2009 RMP, a design plan titled Goose
Bay Concession Area Modernization Study was developed. Based on the selected
Alternative from the 2009 RMP, this study developed a feasibility design for the
modernized replacement facilities at Goose Bay Marina (GBM). In 2014, upon
finalizing and selecting the design for modernizing GBM, a Final Goose Bay Marina
Modernization and Long Term Concession Contract Environmental Assessment (EA)
was completed resulting in a Finding of No Significant Impact. In September 2014,
Reclamation awarded a contract for the modernization of the GBM concession area.
The purpose of this study is to evaluate the financial feasibility of the proposed
recreation-related commercial facilities and services within the GBM concession
area. The information from the financial feasibility evaluation (FFE) is meant to be
used by Reclamation to guide development of a prospectus for a new long-term
concession opportunity at GBM.
1.1 Goose Bay Marina Concession Area
The GBM concession area is located about 20 miles east of Helena, Montana on
Reclamation lands at Canyon Ferry Reservoir. The GBM is located on the eastern
shore about midway between the north and south end of the Reservoir. The GBM
bay is a deep-water bay and is the largest on the Reservoir serving as a marina.
The proposed concession area will include the following recreation-related
commercial facilities and services:
Marina Store with Fuel Station
Marina (minimum of 60 slips)
RV Park (94 total campsites)
o 47-full service
o 27-electric only
o 19-no service
2-Large Group Pavilions
3-Group Camping Shelters
8-Day Use Shelters
2-RV Dump Stations
2-Shower Facilities with coin operated
showers
Page 7
Page 2 of 32
2 Financial Feasibility Evaluation
This section presents the financial evaluation for prospective commercial services
at the GBM concession area. The FFE analysis developed in this study focuses
on those commercial services that would be provided under concessions contracts.
This section first provides a brief general overview of financial feasibility studies.
Second, the framework of the FFE is discussed including the key factors and
assumptions used to estimate financial feasibility. Third, the summary results of
the FFE are reported and discussed as it relates specifically to the proposed
commercial services to be provided at GBM.
The FFE presented in this study is based on planning-level estimates of capital
and development costs and operating revenues and expenses. Accordingly, the
results are not intended to provide assurances regarding the financial profit or loss
of prospective commercial services at GBM. Instead, the results of the FFE
should be considered in the context of the analytical assumptions implicit to the
analysis and used as an indicator of the financial performance of prospective
commercial services. Note that this study has been developed in accordance with
Reclamation policy as a preliminary assessment of concession opportunities at
GBM, and it is recommended prospective applicants conduct an external financial
feasibility and business analysis.
2.1 Overview of Financial Feasibility Studies
The primary purpose of the FFE is to determine whether proposed commercial
services are financially viable. Ancillary purposes include estimating fees to be
returned to the federal government, providing justification for the proposed length
of term of concessions contracts and estimating capital investment responsibilities
for the concessionaire and Reclamation.
An FFE, in the broadest sense, refers to the assessment of the potential success or
failure of a business measured against specific financial thresholds. If, in the
planning for a new business, a potential entrepreneur or investor concludes that
the business will meet or exceed those thresholds, the business may be considered
to be financially feasible.
2.2 Financial Feasibility Evaluation Framework
The framework used to conduct the FFE is founded on basic financial and
accounting concepts and reflects Reclamation Policy as outlined in LND 04-01.
This section provides an overview of financial concepts that have been applied to
prospective commercial services at GBM concession area. For each of the
proposed commercial services, the following financial information is provided in
Section 2.5.
Page 8
Page 3 of 32
Income and Expense Statement An income and expense statement, or simply an income statement, is a “snapshot”
of a business’ financial status during a specified period, such as a month, quarter,
or year. The income statement measures the profitability of a business by
comparing operating and non-operating revenues and expenses and determining
the net income of the business.
For this study, operating revenues represent gross revenues and are organized by
operating department (i.e., revenue source). For example, a store may realize
revenues from gas sales, grocery sales, and fishing supply sales; estimated
revenues are tracked separately for each. Operating expenses include payments to
labor, cost of goods sold, utilities, and repairs and maintenance. Non-operating
expenses include general and administrative expenses, such as rent, interest,
depreciation, reserve accounts,1 and payments to the federal government as
franchise and occupancy fees.
Cash-Flow Analysis A cash-flow analysis takes into account the timing of revenues and expenses. It
allows an analyst to evaluate financial performance at different periods of time.
For example, initial capital investment costs typically generate negative cash flow
in the early years of business ventures. A cash-flow analysis does not allow for
the depreciation of assets over time as it looks at when resources are actually
expended. For example, if a dock is constructed in year 0 of a contract term then
all the resources to construct the dock are accounted for in year 0; this is true if
the capital is privately sourced or financed. The cash-flow analysis also considers
periodic capital replacement costs and reimbursement for fixed assets at the end
of a contract. It should be noted that cash is not involved in depreciation because
depreciation reduces net income on the income statement, but it does not reduce
the cash account on the balance sheet (i.e., depreciation is a non-cash expense).
Capital Investment Requirements The capital investment requirements of any business venture can greatly affect
financial feasibility. Capital costs associated with the proposed commercial
services at GBM include the costs of facility development (e.g., structures and
utilities); outfitting facilities, landscaping, etc.; and any ongoing capital
replacement. Capital investments by Reclamation were established from the bid
abstracts submitted by potential contractors for the GBM modernization contract.
Estimates of capital investments required by prospective concessionaires were
prepared by Reclamation’s TSC. The base assumptions for the capital investment
estimates are discussed separately for each service to be provided at GBM in
Section 2.5.
1 Reserve accounts can come in the form of a Reserve Account for Facility Improvement (RAFI),
which is needed to make funds systematical available for the ongoing improvement,
construction, and renovation of concession facilities, specifically, significant nonrecurring
capital improvement projects.
Page 9
Page 4 of 32
2.3 Measures of Financial Feasibility
Profitability is the primary goal of all business ventures, without profitability the
business will not be sustainable over the “long run.” Determining the financial
feasibility of a business typically involves some measure of profitability.
Common financial metrics for determining probability include net profit
(income/expense statement); earnings before interest, taxes, depreciation, and
amortization (EBITDA); net present value of annual cash flow; and internal rate
of return (IRR).
Net profit refers to the difference between revenues from all sources and any
associated costs. It includes both operating and non-operating measures, the
former arising from the actual sale of the specific goods and services produced by
the enterprise. Non-operating costs reflect the administrative and related
expenses required for running a business, but not specific to the goods and
services being sold. If net profits are determined to be positive a business is
expected to be profitable, however, this metric does not take into account the
timing of revenues and expenses and alone is not sufficient for determining the
long-run viability of a business.
EBITDA is a quantitative description of the “operating profitability” of a
business. It is measured by subtracting operating and non-operating costs,
excluding interest, taxes, depreciation, and amortization from total operating
revenues all costs. These costs are excluded because they may vary significantly
even among businesses of similar size within the same industry. Because
EBITDA excludes these expenses, it is considered a better measure of the actual
operating finances of a business than net profit. Differences arise because of
variation in many areas, including:
Assets – current (e.g., cash and inventory), versus fixed (e.g. buildings and
machinery)
Liabilities – debt (i.e., owed to lenders), versus equity capital provided by
business owners
Interest expenses – which may differ because of when loans were
obtained, amount debt financed, term length, and guarantees and collateral
required by lenders
Depreciation –will differ depending on the useful life of capital assets,
salvage value of capital assets, and when they were purchased.
Taxes –will vary depending on different rate structures (e.g., federal, state,
county, income level)
Amortization – which typically refers to the payment of a loan over a
specified number of periods and differs based on term length and the cost
of capital (interest)
Page 10
Page 5 of 32
The following two approaches vary from the first two in that they account for the
timing of revenues and costs and take into consideration the “time value of
money” (TVM). The underlying premise of the TVM is that the value of an asset
is equal to the present value of all at expected benefits to be received from the
asset in the future. These approaches explicitly recognize that money has a time
value, which implies a dollar today is worth more than one dollar to be received
one year from now. The receiving of an asset in the future may be valued less
than an asset obtained in the present for at least two reasons: (1) uncertainty of
future conditions, (2) the rate of return that could be earned on the next best
alternative investment (opportunity cost of capital).
The net present value (NPV) of an enterprise’s cash flow is defined as the present
value of the cash inflows minus the present value of the cash outflows, with both
flows being discounted at a determined threshold rate (discount rate). If the NPV
of annual cash flows are greater than zero, then the return on investment in the
enterprise is greater than the threshold rate and the enterprise is considered
financially viable at that rate.
The internal rate of return (IRR) approach, as contrasted to the NPV, does not
solve the present value formula for excess present value (NPV>0), but rather is
that discount rate which makes the present value of the cash inflows equal to the
present value of the cash outflows. In future value terms, the computed IRR
discount rate is equivalent to the annualized effective compounded return rate that
can be earned on invested capital. In other words, over the investment period, an
investor can assume to receive a return on invested capital equal to the discount
rate computed in the IRR approach.
2.4 Key Factors Affecting Financial Feasibility
There are a number of key factors that affect the financial feasibility of all of the
proposed recreation-oriented services. Each factor is discussed in detail below
and by service in Section 2.5.
Visitation Levels One of the primary factors affecting the financial viability of recreation-based
commercial opportunities is visitation. An initial estimate of annual visitation for
the proposed GBM concession area was developed based on historic traffic count
data for Goose Bay Road from 2009 to 2013. The sum of average monthly traffic
count data over the period was approximately 21,200; assuming an average of 2.3
persons per vehicle2 results in an initial visitation estimate of about 48,800
visitors annually. The “baseline condition” visitation estimates for the new GBM
concession area were set to 48,000.
2 Based on discussions with Canyon Ferry Reservoir site managers.
Page 11
Page 6 of 32
In addition to the estimation of the baseline conditions, visitation estimates were
forecasted into the future over the proposed contract term. The baseline visitation
estimate is projected to grow at the same rate as the counties providing the
majority of the historical visitation to GBM. Based on discussion with site
managers, the majority of visitation was estimated to come from two counties
south of the recreation area in Broadwater and Gallatin Counties. Estimates of
annual population projections by County were obtained from the Montana
Department of Commerce. The annual growth rate for the Counties ranged from
.5 to 1.7 percent depending on the year. The baseline condition for visitation
growth was estimated at one percent annually. Note that this study does not
explore the possible effects of water level fluctuations at Canyon Ferry Reservoir
on demand for concession services at GBM.
Length of Season The expected length of the recreation season can have a significant impact on the
FFE at GBM. The length of the recreation season is primarily driven by weather
conditions (e.g., air and water temperatures, snow and ice conditions). The
minimum season length required for this analysis has been set to May 15–
September 15, equating to 123 days of operation.
Rates The rates charged by prospective commercial operators have a direct influence on
operating revenues. Rates for all commercial services operated under a
concessions contract must be approved by Reclamation on an annual basis.
Differences in rates across seasons can also factor into concessions planning, with
higher rates charged during peak demand periods and lower rates in off-peak
periods.
Term of Concessions Contract Reclamation policy (LND 04-01) states that the term of all contracts should be
limited to the shortest period practical and be based on the investment required of
the concessionaire. The term of the contract requiring minimal or no new capital
investment should generally not exceed five years, and when substantial
investment is required, the term should be set to ensure that concessionaires
receive a “reasonable rate of return” on their investment. The prospective
commercial services under consideration at GBM require a moderate capital
investment for facility development. As a result, the “base case” conditions for
the term of the concessions contract has been set at a term of 20 years.
Reasonable Rate of Return on Capital Investment By definition, capital is a scarce resource with many potential uses with equally
many potential returns and risks. The owners of capital can be reasonably
assumed to seek a minimum level of financial return on the capital they invest in a
business venture. Frequently, that minimum is approximated as the sum of a
relatively risk-free return (e.g., U.S. Government debt instruments) and an
allowance for risk. The incremental desired return for risk varies widely among
capital investors, depending on such factors as their knowledge of and experience
in particular businesses. For example, if a government security of a particular
Page 12
Page 7 of 32
maturity yields a risk-free 2 percent annual return and a capital investor requires
an additional annual return of 8 percent annual to compensate for their risk, the
threshold return for that investor would be 10 percent annually. If investors
determine that the capital investment is likely to provide a return of at least the
determined threshold level, the investment opportunity would be accepted as a
potential investment and vice-versa. The reasonable rate of return was set at 10
percent for this analysis.
Fees Paid to the Federal Government Fees paid to the federal government for the right to operate commercial services
at Reclamation facilities may include capital recovery and investment fees,
franchise fees, and various forms of occupancy fees (e.g., lease fee). Capital
recovery fees are often in the form of reserve accounts, which are used for the
ongoing improvement, construction, and renovation of concession facilities;
specifically, significant non-recurring capital improvement projects. Capital
recovery fees are in addition to the regular maintenance costs calculated for each
service. Franchise fees are typically payments made to the government based on
a percentage of gross revenues. Occupancy fees are often a form of flat-rate fees
paid by the concessionaire for the use of the federal facilities/estate. For the
purpose of this analysis, the franchise fee on all potential concession services has
been set to three percent of gross revenues with an additional three percent of
gross revenues to be set aside in a reserve fund for ongoing capital recovery. Fees
paid to the federal government are typically negotiated during the competitive
solicitation process, on a case-by-case basis, depending on the specific
circumstances of each commercial opportunity.
2.5 Financial Feasibility Evaluation of Proposed Commercial Services at Goose Bay Marina
This section presents the assumptions and results of the financial feasibility
evaluation for prospective commercial services at Goose Bay Marina. The focus
of the FFE is on those services that would be operated under concessions
contracts, rather than a special use permit. Only the required minimum services
are included in this analysis; other authorized uses, which can be provided at the
discretion of the concessionaire, are excluded from this analysis.
Based on the results of the commercial service planning process, there are four
sets of commercial services being constructed at GBM and considered in this
FFE: (1) marina services, (2) RV camping services, (3) concession store services,
and (4) day-use services. A set of analytical assumptions common to all services
is presented first and represents the “base case” for the financial evaluation.
Following the common assumptions, each concession service is analyzed
independently and then aggregated to present the financial feasibility of the whole
operation. The financial performance of each service is evaluated, and key
financial metrics based on an estimate of capital investment costs, annual
operating income and expenses, and a cash-flow analysis are reported. In the
Page 13
Page 8 of 32
final section of the FFE, a sensitivity analysis is conducted by varying key
assumptions such as the franchise fee and estimated visitation levels.
2.5.1 Common Analytical Assumptions
For the purposes of the FFE, several key analytical assumptions were made that
are applicable to all concessions opportunities under review. The varying of these
assumptions can affect the financial feasibility of the concession opportunities,
which is illustrated by the sensitivity analysis in Section 2.5.6. The key
assumptions and their initial parameters are as follows:
Visitation – As discussed in Section 2.4, visitation is projected to increase
by approximately 1.0 percent annually based on population growth
estimates in the primary market area.
Length of Season – The minimum required operating season is from May
15 through September 15.
Term of Concessions Contract – Concessions contracts are assumed to be
20 years in length.
Discount Rate – The discount rate is set at the reasonable rate of return
threshold of 10 percent. Thus, if the NPV is found to be positive for a
particular service or the operation as a whole, then the concessionaire is
projected to receive at least a 10 percent return on capital investment
annually.
Fees Paid to the Federal Government – The Franchise fee on all potential
concession services is set to 3 percent of gross revenues. An additional 3
percent is set aside in a reserve fund for ongoing capital recovery.
Interest (Cost of Capital) – Due to the large degree of speculation required
to estimate interest expenses (e.g., amount of capital financed and loan
terms), they are not typically included in capital budgeting (income
expense statement). Further, the basic economic decisions of whether a
particular project should be undertaken or not should not be influenced
because of the current funding source available. Interest payments should
never be included in a cash flow analysis as all financing costs and their
associated tax implications are accounted for in the discounting
mechanism.
Taxes – Taxes like interest expenses are highly variable and speculative,
however, unlike interest expenses, all potential concessionaires will face
the costs of taxes. Thus, in an effort to include the cost of taxes a rough
approximation of 20 percent of EBITDA minus depreciation and has been
made and included in the analysis.
Page 14
Page 9 of 32
Operating Expenses (excluding labor costs) – Operating expenses are
calculated as a percentage of the “gross margin”3 for each service. These
percentage estimates are held constant for each service and were
developed by surveying financial reports from similar concession
operations. Although the total dollar value of operating expenses will vary
between services, based on revenues, the proportion of operating revenues
remains the same. This is a reasonable assumption, even though the
distribution of operating costs among the services may vary, the total
operating costs of the concession facilities as a whole remains constant.
Labor Costs – Labor costs were based on estimated hours per day
allocated to various tasks (e.g., landscaping & maintenance) and 2013
median wage rates estimates for Montana from the Bureau of Labor
Statistics.4
Depreciation – A straight line depreciation method is utilized, i.e., costs
are charged evenly over the useful life of an asset.
Dollar Values – All costs and revenues have been index to 2013 dollars
utilizing the Consumer Price Index (CPI)5.
2.5.2 Marina Services
Description & Design The proposed marina to be developed by the concessionaire, provides docks for
mooring with a minimum of 60 slips. Other infrastructures related to the marina,
such as parking lots and a boat ramp, have been previously constructed by
Reclamation and are not included in the capital investment analysis. Fuel service
will also be provided, but it will be located on shore and managed by the store.
The financial feasibility evaluation for the proposed marina services is based on
the development of a new marina with a minimum capacity of 60 boat slips. The
following sample marina construction design was developed for capital cost
estimation. This is only meant to be as sample, and no design or location
requirements have been mandated for the marina.
The proposed sample marina consists of the following:
All docks are of the floating type.
A primary dock is constructed off the Reclamation installed elevated gangway.
Approximately 400-ft. long & 5-ft. wide (totaling 2000 ft2).
3 An enterprise’s remaining revenue after the cost-of-goods-sold (COGS) have been subtracted
from gross revenues. [Gross Margin = Net Sales – COGS] 4 Bureau of Labor Statistics, U.S. Department of Labor, Occupation Employment Statistics
[March, 2015] [http://www.bls.gov/oes/current/oes_mt.htm] 5 Bureau of Labor Statistics, U.S. Department of Labor, Consumer Price Index – All Urban
Consumers [March, 2015] [http://www.bls.gov/cpi/#data]
Page 15
Page 10 of 32
An 80-ft. long & 4-ft. wide elevated gangway with hinges and rollers to provide
access to the primary docks from the Reclamation installed elevated gangway.
This gangway is necessary to ensure compliance with ADA requirements when
Reservoir levels fluctuate.
All boat slips are uncovered and accommodate various size boats with an average
length of 24 ft. and an average width of 10 ft.
Each slip is accessed by a 3-ft. wide individual finger pier (Approx. 4500 ft2).
Docks are assumed to have a useful life of 20 years.
Capital Investment Costs Construction costs for the primary marina docks and the elevated gangway are
based on price per square foot. The average full costs per square foot for the
primary docks are estimated to be $30. The total estimated surface area of the
primary marina docks is roughly 6500 ft2 equating to an investment cost of
$195,000. The average full costs for the elevated gangway are estimated to be
$35 per square foot. The total estimated surface area of the elevated gangway is
roughly 320 ft2 equating to an investment cost of $11,200. An additional 10
percent the total investment costs was included as a contingency. The total costs
for the marina sums to nearly $215,000. These costs estimates were based on a
sample of comparable marina developments at other sites. Table 2.5.2-1 shows
the estimated capital investment costs for the marina.
Table 2.5.2-1. Capital Investment Costs for Marina Services (2013$)
Total Area of Elevated Gangway to be Constructed (ft2) 320 ft
2
Assumed Cost Per Square Foot $35
Subtotal of Investment Costs for Elevated Gangway $11,200
Total Area of Primary Dock to be Constructed (ft2) 6500 ft
2
Assumed Cost Per Square Foot $30
Subtotal of Investment Costs for Primary Dock $195,000
Subtotal of Capital Investment Costs $206,200
10% Construction Contingency $20,620
Total Dock Investment Costs $226,820
Revenues The marina services derive revenue by offering slips for rental. Revenues for slip
rentals are calculated by multiplying an estimated slip rental rate by an occupancy
rate. Slip rental and occupancy rates were estimated by surveying similar marina
services in the area and historic rates from the previous GBM operation. Table
2.5.2-2 summarizes the occupancy and rental rates.
Page 16
Page 11 of 32
Table 2.5.2-2. Revenue Assumptions for Marina Services (2013$)
Boat Slip Rental Rental Rate
Customer Distribution
6
Average Seasonal
Occupancy Rate7
Monthly $300 20% 18%
Season $700 80% 72%
Weighted Season Average8 $800 N/A 90%
Operating Expenses Operating expenses for marina services include the labor and the other operating
costs identified below in Table 2.5.2-3. As stated in the common assumptions,
operating expenses for marina services were developed based primarily on
surveying annual financial statements and operating trends for existing marina
operations on Canyon Ferry Reservoir and similar operations in other areas.
Labor costs were developed by approximating the hours per day spent on various
tasks and an assumed wage rate. Over the contract period, annual labor costs
(hours and wage) are assumed to be constant in real dollar terms. The estimated
operating costs as a percentage of gross margin can be found in Table 2.5.2-3 and
annual labor cost estimates in Table 2.5.2-4.
Table 2.5.2-3. Estimated Operating Costs for Marina Services
Cost Percentage of Gross Margin
Operating & Maintenance Supplies 10.0%
General and Administrative 2.0%
Licenses/Fees 3.0%
Insurance 5.0%
Utilities 7.0%
Miscellaneous 3.0%
Total 30.0%
Table 2.5.2-4. Estimated Labor Costs for Marina Services
Task Hour/Unit/
Day Units
Total Hours/Day
Days in Operation
Use Rate
Total Annual Hours
Median Wage $/hour
Annual Labor Cost
Maintenance 1.00 1 1.00 123 1 123 $11.09 $1,364
Single Vault Toilets 0.10 2 0.20 123 1 24.6 $11.09 $273
Assumed Wage Rates Subtotal $1,637
Occupation Median $/Hour (2013$)
15% Contingency $ 246
Landscaping & Groundskeeping Worker
$11.09 10%
Management $ 164
Total $2,047
6 The percentage of marina customers utilizing the various services (used for determining the
weighted average.) 7 The percentage of the total available boat slips that are rented at any given time over the season.
8 Weighted Season Average Rental Rate = (700 ∗ 0.80) + ($300 ∗ 0.20) ∗ (4 months) = $800.
Page 17
Page 12 of 32
Income and Expense Statement The income and expense statement for marina services is displayed in Table
2.5.2-5 on the following page. Gross annual operating revenues are fixed at
$43,200 over the contract term as the occupancy rate and slip rental fees are held
constant in real dollar terms. Boat slip rental is the only source of revenue
evaluated in this analysis.
Accounting for operating income and expenses, estimates of EBITDA for marina
services are roughly $28,200 per year. Taking into account taxes, depreciation
and federal fees, net annual profits are estimated at approximately $11,400 per
year.
Table 2.5.2-5. Income and Expense Statement for Marina Services
Average Annual Values
Years 1-5 6-10 11-15 16-20 Term Totals
Total Visitation 48,970 51,468 54,093 56,825
Revenues By Operating Department
Slip Rental Fees $43,200 $43,200 $43,200 $43,200
Total Gross Revenues $43,200 $43,200 $43,200 $43,200 $864,000
Cost of Goods Sold (COGS)
N/A $0 $0 $0 $0
Gross Margin (Revenues – COGS) $43,200 $43,200 $43,200 $43,200 $864,000
Expenses
Operating & Maintenance Supplies $4,320 $4,320 $4,320 $4,320 General and Administrative $864 $864 $864 $864 Licenses/Fees $1,296 $1,296 $1,296 $1,296 Insurance $2,160 $2,160 $2,160 $2,160 Utilities $3,024 $3,024 $3,024 $3,024 Miscellaneous $1,296 $1,296 $1,296 $1,296 Labor $2,046 $2,046 $2,046 $2,046
Aggregated Expenses $15,006 $15,006 $15,006 $15,006 $300,100
EBITDA $28,194 $28,194 $28,194 $28,194 $563,900
Additional Expenses
Depreciation $11,341 $11,341 $11,341 $11,341 Taxes (20% of EBITDA - Depreciation) $3,371 $3,371 $3,371 $3,371 Annual Lease $0 $0 $0 $0 Reserve Account $1,296 $1,296 $1,296 $1,296 Franchise Fee $1,296 $1,296 $1,296 $1,296
Total Additional Expenses $17,304 $17,304 $17,304 $17,304 $346,100
Net Profit $10,890 $10,890 $10,890 $10,890 $217,800
Cash-Flow Analysis Individual year estimates of annual cash flows over the contract term are
displayed in Table 2.5.2-6 on the next page. The initial total concessionaire
capital investments are reflected in year 0. It is assumed that the capital
investments made in marina services (i.e., the docks and elevated gangway) have
a useful life equal to the proposed 20 year contract term with regular maintenance.
At the end of the contract term, estimated cash holdings are approximately
$217,806.
Page 18
Page 13 of 32
Table 2.5.2-6. Cash-Flow Analysis for Marina Services Year 0 1 5 10 15 20
Cash Inflow
Beginning Cash $0 ($226,820) ($137,895) ($26,738) $84,418 $195,575
Total Sales $0 $43,200 $43,200 $43,200 $43,200 $43,200
Miscellaneous Revenues
$0 $0 $0 $0 $0 $0
Total Available Cash $0 ($183,620) ($94,695) $16,462 $127,618 $238,775
Cash Outflow
Cost of Goods Sold $0 $0 $0 $0 $0 $0
Labor Costs $0 $2,046 $2,046 $2,046 $2,046 $2,046
Operating Expenses $0 $12,960 $12,960 $12,960 $12,960 $12,960
Franchise Fee & Lease Payments
$0 $1,296 $1,296 $1,296 $1,296 $1,296
Reserve Account $0 $1,296 $1,296 $1,296 $1,296 $1,296
Taxes $0 $3,371 $3,371 $3,371 $3,371 $3,371
Capital Investments $226,820 $0 $0 $0 $0 $0
Total Cash Out $226,820 $20,969 $20,969 $20,969 $20,969 $20,969
Annual Cash-Flow ($226,820) $22,231 $22,231 $22,231 $22,231 $22,231
Cumulative Cash-Flow
($226,820) ($204,589) ($115,663) ($4,507) $106,650 $217,806
Present Value of Annual Cash-
Flow (10%) ($226,820) $20,210 $13,804 $8,571 $5,322 $3,305
Cumulative Present Value of
Cash-Flow ($226,820) ($206,61) ($142,546) ($90,218) ($57,727) ($37,552)
Financial Summary9 Table 2.5.2-7, on the following page, displays the summary results of the FFE for
the proposed marina, as measured by key financial metrics of profitability. Over
the proposed 20-year contract term, EBITDA and net profit are projected to sum
to $564,000 and $218,000, respectively. These results indicate, based on the
estimated capital investments and assumptions made in this study, that an
investment in marina services would likely be a profitable venture. However, in
net present value terms, at a 10 percent discount rate, the cumulative cash flow
over the contract term is roughly ($38,000). A negative NPV metric signals that,
although profitable, the projected return on an investment in marina services does
not meet the established 10 percent reasonable rate of return threshold. This is
further confirmed by the estimated IRR of 7.5 percent. Based on these metrics,
the investment in marina services would likely be a profitable venture, however,
the returns are less than the 10 percent reasonable rate of return established in this
study by nearly 3 percentage points.
9 The summary of financial information for all perspective concessions at GBM are based on
planning-level estimates and are not intended to ensure the profit or loss of any concession
opportunity considered in this study.
Page 19
Page 14 of 32
Table 2.5.2-7. Results of the FFE for Marina Services (2013$)
Financial Metric Annual Average Cumulative
EBITDA $28,200 $564,000
Net Profit $10,900 $218,000
Present Value of Cash-Flow (10% Discount Rate) N/A ($37,600)
IRR N/A 7.5%
2.5.3 Day-use Services
Descriptions & Design Reclamation plans to construct five group use shelters in and around the RV Park.
The prospective concessionaire will be required to provide approximately 150
total picnic tables for all of the proposed recreation facilities including 30 tables
for the group shelters. In an effort to recovery the concessionaire’s investment in
the picnic tables for the day-use areas and associated operating costs (e.g.,
maintenance and landscaping), at minimum, a reservation fee for the shelters will
be permitted. Other infrastructures related to the shelters and day-use areas, such
as parking lots and toilets, have been previously constructed by Reclamation and
are not included in the capital investment analysis.
The financial feasibility evaluation for the proposed day-use services is based on
the investment in approximately 30 picnic tables to be used in the group shelters
and operating costs associated with the day use areas.
Capital Investment Costs Capital investment costs are based on a per unit costs for picnic tables. Picnic
tables are assumed to be ADA compliant and 8 foot in length with thermoplastic
coating. All picnic tables are assumed to have a 20-year useful life. Unit prices
for the assumed picnic tables are estimated to be $650 per table, after any “bulk
price” discounts. The total estimated cost of the required 30 picnic tables is
nearly $21,500 in 2013 dollars. Table 2.5.3-1 shows the estimated capital
investment costs for the marina.
Table 2.5.3-1. Capital Investment Costs for Day-use Services (2013$)
Picnic Table Quantity Required for Group Shelters 30
Estimated Cost Per Unit $650
Subtotal of Capital Investment Costs $19,500
10% Installation Costs $1,950
Total Dock Investment Costs $21,450
Revenues In an effort to recovery the concessionaire’s investment in the picnic tables for the
day-use areas and associated operating costs (e.g., maintenance and landscaping),
at minimum, a reservation fee for the shelters will be permitted. Revenues from
Page 20
Page 15 of 32
reservation are calculated by multiplying an estimated daily reservation rate by an
assumed occupancy rate (i.e., the percentage of days that a shelter is reserved).
Reservation and occupancy rates were estimated by surveying similar marina
services in the area and historic rates from the previous GBM operation. Table
2.5.3-2 summarizes the occupancy and reservation rates.
Table 2.5.3-2. Revenue Assumptions for Day-use Services (2013$)
Group Shelter Reservations
Rental Rate
Number of Shelters
Average Seasonal
Occupancy Rate
10
Season Average $35 5 35%
Operating Expenses Operating expenses for day-use services include the labor and the other operating
costs identified in Table 2.5.3-3. As stated in the common assumptions, operating
expenses for day-use services were developed based primarily on surveying
annual financial statements and operating trends for existing day-use operations
on Canyon Ferry Reservoir and similar operations in other areas. Labor costs
were developed by approximating the hours per day spent on various tasks and an
assumed wage rate. Over the contract period, annual labor costs (hours and wage)
are assumed to be constant in real dollar terms. The estimated operating costs as a
percentage of gross margin can be found in Table 2.5-3-3 and annual labor cost
estimates in Table 2.5.3-4.
Table 2.5.3-3. Estimated Operating Costs for Day-use Services
Cost Percentage of Gross Margin
Operating & Maintenance Supplies 10.0%
General and Administrative 2.0%
Licenses/Fees 3.0%
Insurance 5.0%
Utilities 7.0%
Miscellaneous 3.0%
Total 30.0%
Table 2.5.3-4. Estimated Labor Costs for Day-use Services
Task Hour/Unit/
Day Units
Total Hours/Day
Days in Operation
Use Rate
Total Annual Hours
Median Wage $/hour
Annual Labor Cost
Maintenance 0.50 5 2.50 123 0.35 107.6 $11.09 $1,194
Single Vault Toilets 0.10 1 0.1 123 1 12.3 $11.09 $136
Assumed Wage Rates Subtotal $1,330
Occupation Median $/Hour (2013$)
15% Contingency $200
Landscaping & Groundskeeping Worker
$11.09 10%
Management $133
Total $1,663
10
The percentage of days that a shelter is rented out on average over the recreation season.
Page 21
Page 16 of 32
Income and Expense Statement The income and expense statement for day-use services is displayed in Table
2.5.3-5. Gross average annual operating revenues are fixed at near $7,500 over
the contract term as the occupancy rate and rental fees are held constant in real
dollar terms. Accounting for operating income and expenses, estimates of
EBITDA for marina services are roughly $3,600 per year. Taking into account
taxes, depreciation and federal fees, net annual profits are estimated at
approximately $1,580 per year.
Table 2.5.3-5. Income and Expense Statement for Day-use Services
Average Annual Values
Years 1-5 6-10 11-15 16-20 Term Totals
Total Visitation 48,970 51,468 54,093 56,825
Revenues By Operating Department
Reservation Rental Fees $7,534 $7,534 $7,534 $7,534
Total Gross Revenues $7,534 $7,534 $7,534 $7,534 $150,700
Cost of Goods Sold (COGS)
N/A $0 $0 $0 $0
Gross Margin (Revenues – COGS) $7,534 $7,534 $7,534 $7,534 $150,700
Expenses
Operating & Maintenance Supplies $753 $753 $753 $753 General and Administrative $151 $151 $151 $151 Licenses/Fees $226 $226 $226 $226 Insurance $377 $377 $377 $377 Utilities $527 $527 $527 $527 Miscellaneous $226 $226 $226 $226 Labor $1,662 $1,662 $1,662 $1,662
Aggregated Expenses $3,922 $3,922 $3,922 $3,922 $78,400
EBITDA $3,612 $3,612 $3,612 $3,612 $72,200
Additional Expenses
Depreciation $1,073 $1,073 $1,073 $1,073 Taxes (20% of EBITDA - Depreciation) $508 $508 $508 $508 Annual Lease $0 $0 $0 $0 Reserve Account $226 $226 $226 $226 Franchise Fee $226 $226 $226 $226
Total Additional Expenses $2,033 $2,033 $2,033 $2,033 $40,700
Net Profit $1,579 $1,579 $1,579 $1,579 $31,600
Cash-Flow Analysis Individual year estimates of annual cash flows over the contract term are
displayed in Table 2.5.3-6. The initial total concessionaire capital investments are
reflected in year 0. It is assumed that the capital investments made in day-use
services (i.e., the picnic tables) have an useful life equal to the proposed 20 year
contract term if regular maintenance is completed. At the end of the contract
term, estimated cash holdings are approximately $31,600.
Page 22
Page 17 of 32
Table 2.5.3-6. Cash-Flow Analysis for Day-use Services Year 0 1 5 10 15 20
Cash Inflow
Beginning Cash $0 ($21,450) ($10,845) $2,410 $15,666 $28,922
Total Sales $0 $7,534 $7,534 $7,534 $7,534 $7,534
Miscellaneous Revenues
$0 $0 $0 $0 $0 $0
Total Available Cash $0 ($13,916) ($3,312) $9,944 $23,200 $36,455
Cash Outflow
Cost of Goods Sold $0 $0 $0 $0 $0 $0
Labor Costs $0 $1,662 $1,662 $1,662 $1,662 $1,662
Operating Expenses $0 $2,260 $2,260 $2,260 $2,260 $2,260
Franchise Fee & Lease Payments
$0 $226 $226 $226 $226 $226
Reserve Account $0 $226 $226 $226 $226 $226
Taxes $0 $508 $508 $508 $508 $508
Capital Investments $21,450 $0 $0 $0 $0 $0
Total Cash Out $21,450 $4,882 $4,882 $4,882 $4,882 $4,882
Annual Cash-Flow ($21,450) $2,652 $2,652 $2,652 $2,652 $2,652
Cumulative Cash-Flow
($21,450) ($18,799) ($8,194) $5,061 $18,317 $31,573
Present Value of Annual Cash-Flow
(10%) ($21,450) $2,410 $1,646 $1,022 $635 $394
Cumulative Present Value of Cash-Flow
($2,1450) ($19,040) ($11,400) ($5,160) ($1,285) $1,121
Financial Summary Table 2.5.3-6 displays the summary results of the FFE for the proposed marina, as
measured by key financial metrics of profitability. Over the proposed 20-year
contract term, EBITDA and net profit are projected to sum to approximately
$72,000 and $32,000, respectively. These results indicate, based on the estimated
capital investments and assumptions made in this study, that the investment in
day-use services would likely be a profitable venture. Further, in net present
value terms, at a 10 percent discount rate, the cumulative cash flow over the
contract term is roughly $1,100. A positive NPV metric signals that the projected
return on an investment in day-use services exceeds the established 10 percent
reasonable rate of return threshold. This is further confirmed by the estimated
IRR of 10.8 percent. Based on these metrics, the investment in marina services
would likely be a profitable venture and financially viable over the long term.
Table 2.5.3-6. Results of the FFE for Day-use Services (2013$)
Financial Metric Annual Average Cumulative
EBITDA $3,600 $72,000
Net Profit $1,600 $32,000
Present Value of Cash-Flow (10% Discount Rate) N/A $1,100
IRR N/A 10.8%
Page 23
Page 18 of 32
2.5.4 Marina Store Services Description & Design A proposed 1,024 square foot marina store is to be constructed by Reclamation.
Reclamation will also take responsibility for constructing other support
infrastructures such as parking lots and utilities. Prospective concessionaires will
be required to invest in outfitting the store (e.g., display cases and refrigerators)
and store supplies. A fuel service station is also required to be provided by the
concessionaire. It is assumed that the station will be located in proximity to the
store and managed through store operations. Capital investments made by
Reclamation are not included in this analysis.
Capital Investment Costs Table 2.5.4-1 shows the estimated capital investment costs for the marina.
Investment costs for the marina store are based on an outfitting cost price per
square foot and unit costs for items such as freezers. The average outfitting cost
per square foot is assumed to be $12.16 per ft2.11
Unit costs were based on
average market costs for items installed in similar type stores. The total estimated
investment cost to outfit the marina store sums to approximately $25,000,
including a 15 percent contingency for uncertainties.
The total investment costs for the fuel service station sum to roughly $24,500.
The system is assumed to consist of a 1,000 gallon aboveground double-wall
“Convault style” steel reinforced concrete tank system, a fuel management
system, and necessary piping. Installation costs are assumed to be 20 percent of
the total costs for components.
Table 2.5.4-1. Capital Investment Costs for the Marina Store (2013$)
Expense Total Units Cost Per Unit Investment Cost
Store Outfitting 1024 $12.16 $12,452
Refrigerators 2 $3,135 $6,270
Freezer 1 $5,959 $5,959
Fuel System 1 $24,500 $24,500
Total -- -- $49,200
Revenues The marina store derives revenue from selling purchased goods (e.g., fishing
supplies) and fuel at a markup. The quantity of goods purchased, or cost-of-
goods-sold (COGS) in dollar terms, is estimated on a value-of-goods-purchased-
per-visitor (VGPPV). The VGPPV was approximated by reviewing financial
reports from similar-type marina operations. The annual amount of fuel sold is
set at an average of 10,000 gallons based on historic sales at GBM and similar
11
Chain Store Age, 2013 Store construction and outfitting survey,
[http://www.chainstoreage.com/sites/chainstoreage.com/files/ConstructionSurvey_2013.pdf]
Page 24
Page 19 of 32
marinas in the area. Markup percentages are based on the U.S. Department of the
Interior’s (DOI) Technical Bulletin: 2015 Convenience Store Markup Percentages
that ensures comparability with private sector markup percentages.
Marina store revenues from selling goods are calculated by multiplying the
estimated VGPPV by the forecasted visitation in each year and then again
multiplied by the established markup percentages. Fuel sale revenues are
calculated by multiplying the assumed wholesale fuel price per gallon by the
number of gallons purchased annually and then again by the established markup
percentage. For clarification, Table 2.5.4-2 summarizes these procedures for the
initial year of the analysis.
Table 2.5.4-2. Year One Revenues for the Marina Store (2013$)
Expense Annual
Visitation Average VGPPV
Cost of Goods Sold
Markup Percentages
Gross Revenues
Wine & Beer 48000 $0.16 $7,680 35% $10,368
Fishing/Marina Supply Sales
48000 $0.13 $6,240 60% $9,984
General Grocery Sales
48000 $0.83 $39,840 60% $63,744
Wholesale Price/Gal
Number of Gallons Purchased
Total Cost Markup
Percentages Gross
Revenues
Fuel Supply $3.00 10,000 $30,000.00 20% $36,000
Operating Expenses As stated in the common assumptions, operating expenses for services were
developed based primarily on surveying annual financial statements and operating
trends for existing day-use operations on Canyon Ferry Reservoir and similar
operations in other areas. Labor costs were developed by approximating the
hours per day spent on various tasks and an assumed wage rate. Over the contract
period, annual labor costs (hours and wage) are assumed to be constant in real
dollar terms. As discussed above, in addition to the operating expenses, the
COGS must also be accounted and subtracted from gross revenues to calculate net
revenues. The estimated operating costs as a percentage of gross margin can be
found in Table 2.5.4-3 and annual labor cost estimates in Table 2.5.4-4.
Table 2.5.4-3. Estimated Operating Costs for the Marina Store
Cost Percentage of Gross Margin
Operating & Maintenance Supplies 10.0%
General and Administrative 2.0%
Licenses/Fees 3.0%
Insurance 5.0%
Utilities 7.0%
Miscellaneous 3.0%
Total 30.0%
Page 25
Page 20 of 32
Table 2.5.4-4. Estimated Labor Costs for the Marina Store
Task Hour/Unit/
Day Units
Total Hours/Day
Days in Operation
Use Rate
Total Annual Hours
Median Wage $/hour
Annual Labor Cost
Landscaping & Grounds
Maintenance 0.50 1 0.50 123 1 61.5 $11.09 $682
Store Attendant
12.00 1 12.00 123 1 1476 $11.04 $16,295
Assumed Wage Rates Subtotal $16,977
Occupation Median $/Hour (2013$)
10% Contingency
$1,698
Landscaping & Groundskeeping Worker
$11.09
15% Management
$2,547
Counter and Rental Clerk $11.04 Total $21,222
Income and Expense Statement The income and expense statement for the marina store is displayed in Table
2.5.4-5. The average annual gross margin increases with growing visitation and is
approximately $39,000 over the contract term. Accounting for operating income
and expenses, estimates of EBITDA for the marina store are roughly $6,400 per
year on average. Taking into account taxes, depreciation and federal fees, net
annual profits are estimated at approximately $800 per year.
Table 2.5.4-5. Income and Expense Statement for Marina Store Services Average Annual Values
Years 1-5 6-10 11-15 16-20 Totals
Total Visitation 48,970 51,468 54,093 56,825
Gross Revenues
Wine & Beer Sales $10,577 $11,117 $11,684 $12,280 Fishing/Marina Supply Sales $10,186 $10,705 $11,251 $11,825 General Grocery Sales $65,032 $68,349 $71,835 $75,500 Fuel Sales $36,000 $36,000 $36,000 $36,000
Total Gross Revenues $121,795 $126,171 $130,770 $135,605 $2,572,000
Cost of Goods Sold (COGS)
Wine & Beer Sales $7,835 $8,235 $8,655 $9,096 Fishing/Marina Supply Sales $6,366 $6,691 $7,032 $7,391 General Grocery Sales $40,645 $42,718 $44,897 $47,187 Fuel Sales $30,000 $30,000 $30,000 $30,000
Total Cost of COGS $84,846 $87,644 $90,584 $93,674
Gross Margin (Revenues – COGS) $36,949 $38,527 $40,186 $41,931 $788,000
Expenses
Operating & Maintenance Supplies $3,695 $3,853 $4,019 $4,193 General and Administrative $739 $771 $804 $839 Licenses/Fees $1,108 $1,156 $1,206 $1,258 Insurance $1,847 $1,926 $2,009 $2,097 Utilities $2,586 $2,697 $2,813 $2,935 Miscellaneous $1,108 $1,156 $1,206 $1,258 Labor $21,221 $21,221 $21,221 $21,221
Aggregated Expenses $32,304 $32,780 $33,278 $33,801 660,800
EBITDA $4,643 $5,748 $6,909 $8,130 $127,200
Additional Expenses
Depreciation $2,459 $2,459 $2,459 $2,459 Taxes (20% of EBITDA - Depreciation) $1,116 $1,337 $1,569 $1,813 Annual Lease $0 $0 $0 $0 Reserve Account $1,108 $1,156 $1,206 $1,258 Franchise Fee $1,108 $1,156 $1,206 $1,258
Total Additional Expenses $5,113 $5,428 $5,760 $6,109 $112,000
Net Profit -$470 $319 $1,149 $2,021 $15,100
Page 26
Page 21 of 32
Cash-Flow Analysis Individual year estimates of annual cash flows over the contract term are
displayed in Table 2.5.4-6. The initial total concessionaire capital investments are
reflected in year 0. It is assumed that the capital investments made for the marina
store have a useful life equal to the proposed 20 year contract term if regular
maintenance is completed. At the end of the contract term, estimated cash
holdings are approximately $15,100.
Table 2.5.4-6. Cash-Flow Analysis for Marina Store Services Year 0 1 5 10 15 20
Cash Inflow
Beginning Cash $0 ($49,181) ($30,670) ($4,003) $26,770 $61,859
Total Sales $0 $120,096 $123,511 $127,975 $132,666 $137,597
Miscellaneous Revenues
$0 $0 $0 $0 $0 $0
Total Available Cash $0 $70,915 $92,840 $123,971 $159,437 $199,456
Cash Outflow
Cost of Goods Sold $0 $83,760 $85,943 $88,797 $91,796 $94,948
Labor Costs $0 $21,221 $21,221 $21,221 $21,221 $21,221
Operating Expenses $0 $10,901 $11,270 $11,753 $12,261 $12,795
Franchise Fee & Lease Payments
$0 $1,090 $1,127 $1,175 $1,226 $1,279
Reserve Account $0 $1,090 $1,127 $1,175 $1,226 $1,279
Taxes $0 $351 $523 $749 $986 $1,235
Capital Investments $49,181 $0 $0 $0 $0 $0
Total Cash Out $49,181 $118,413 $121,211 $124,870 $128,716 $132,757
Annual Cash-Flow ($49,181) $1,683 $2,299 $3,104 $3,950 $4,839
Cumulative Cash-Flow
($49,181) ($47,498) ($39,234) ($25,342) ($7,301) $15,098
Present Value of Annual Cash-Flow
(10%) ($49,181) $1,530 $1,428 $1,197 $946 $719
Cumulative Present Value of Cash-Flow
($49,181) ($47,651) ($41,751) ($35,283) ($30,057) ($26,022)
Financial Summary12 Table 2.5.4-7 displays the summary results of the FFE for the proposed marina
store, as measured by key financial metrics of profitability. Over the proposed
20-year contract term, EBITDA and net profit are projected to sum to $127,200
and $15,100 respectively. These results indicate, based on the estimated capital
investments and assumptions made in this study, that an investment in a marina
store would likely be a profitable venture. However, in net present value terms, at
a 10 percent discount rate, the cumulative cash flow over the contract term is
roughly ($26,000). A negative NPV metric signals that, although profitable, the
12
The summary of financial information for all perspective concessions at GBM are based on
planning-level estimates and are not intended to ensure the profit or loss of any concession
opportunity considered in this study.
Page 27
Page 22 of 32
projected return on an investment in a marina store does not meet the established
10 percent reasonable rate of return threshold. This is further confirmed by the
estimated IRR of 2.3 percent. Based on these metrics, the investment in marina
services would likely be a profitable and viable venture; however, the returns are
less than the 10 percent reasonable rate of return established in this study by
nearly 8 percentage points.
Table 2.5.4-7. Results of the FFE for Marina Store Services (2013$)
Financial Metric Annual Average Cumulative
EBITDA $6,400 $127,200
Net Profit $755 $15,100
Present Value of Cash-Flow (10% Discount Rate) N/A ($26,000)
IRR N/A 2.3%
2.5.5 RV Camping Services
Description & Design The proposed RV Park is to consist of 93 total campsites with one full service site
being designated as a host site. Of the 92 total sites available for reservation, 46
will be full service, 27 will be electric only, and 19 will have no service. Full
service campsites will have water, sewer and electricity available. To
accommodate guests, the RV Park will also offer two RV dump stations and two
fee based shower facilities with flush toilets and four coin operated showers in
each building. Reclamation will be providing the initial capital investment for
constructing the RV Park and related infrastructure.
Prospective concessionaires will be required to provide approximately 150 total
picnic tables for all of the proposed recreation facilities including 120 tables for
the RV Park and associated picnic areas. In an effort to recover a
concessionaire’s investment in the picnic tables for these areas and any operating
costs associated with managing the RV Park (e.g., maintenance and landscaping),
at minimum, a reservation fee for the RV campsites will be permitted. Further, in
order to recover cost related to the operation and maintenance of the RV
dumpsites and shower facilities, prospective concessionaires are assumed to be
permitted to collect a fee for using the RV dumpsites and coin operated showers.
Capital Investment Costs Capital investment costs are based on a per unit costs for picnic tables. Picnic
tables are assumed to be ADA compliant and 8 foot in length with thermoplastic
coating. All picnic tables are assumed to have a 20-year useful life. Unit prices
for the assumed picnic tables are estimated to be $650 per table, after any “bulk
price” discounts. The total estimated cost for the 120 required picnic tables is
$86,000 in 2013 dollars. Table 2.5.5-1 shows the estimated capital investment
costs for the marina.
Page 28
Page 23 of 32
Table 2.5.5-1. Capital Investment Costs for RV Camping Services (2013$)
Picnic Table Quantity Required for Group Shelters 120
Estimated Cost Per Unit $650
Subtotal of Capital Investment Costs $78,000
10% Installation Costs $7,800
Total Investment Costs $85,800
Revenues The RV camping services derive revenue through reservation fees, RV dump
station fees, and coin-operated shower fees. Revenues from campsite reservations
are calculated by multiplying estimated reservation rates by an assumed
occupancy rate. Reservation rate estimates were developed by surveying similar
RV parks in the area and historic rates from the previous GBM operation. Table
2.5.5-2 summarizes the various assumptions made for estimating RV Camping
services.
Table 2.5.5-2. Revenue Assumptions for RV Camping Services (2013$)
RV Campsite Type
Rates Full Service
13
(46 Spaces) Electric Only (27 Spaces)
No Utilities (19 Spaces)
User14
Distribution
Average Seasonal
Occupancy Rate
15
Daily $30.00 $25.00 $20.00 40% 15%
Weekly (10% Discount)
$190.00 $160.00 $130.00 30% 11%
Monthly (20% Discount)
$740.00 $610.00 $490.00 30% 11%
Weighted Daily Average Rate per Visitor
16
$27.00 $23.00 $18.00 -- 35%
The revenues from both the dump stations and the showers were estimated based
on the VGPPV approach. In this approach the estimated VGPPV is multiplied by
the forecasted visitation in each year to calculate revenues. The VGPPV and was
approximated by reviewing financial reports from similar-type operations.
For clarification, Table 2.5.5-3 summarizes these procedures for the initial year of
the analysis.
Table 2.5.5-3. Year One Revenues for RV Camping Services (2013$)
Accommodation Annual
Visitation Average VGPPV
Gross Revenues
Coin-Op Showers
48000 $0.03 $1,440
RV Dump Stations
48000 $0.02 $960
13
Weighted Daily Average Rental Rate per Full Service Visitor = ($30 ∗ 0.4) +($190∗0.27)
7 days∗
($740∗0.27)
30.67 days≈ $27.
14 The percentage of RV park customers utilizing the various services (used for determining the weighted average).
15 The percentage of the total available boat slips that are rented at any given time over the season. 16 It is assumed that, on average, RV park occupancy rates during the weekdays will be at roughly 15 percent and on the
weekends they will climb to near 90 percent.
Page 29
Page 24 of 32
Operating Expenses Operating expenses for the RV Park include labor costs associated with managing
and maintain the RV Park, and the other operating costs as identified in Table
2.5.5-4. Operating expenses for RV camping services were developed based
primarily on surveying annual financial statements and operating trends for
existing marina operations on Canyon Ferry Reservoir and similar operations in
other areas, as detailed in Section 2.5.1. Labor costs were developed by
approximating the hours per day spent on various tasks and an assumed wage rate.
Over the contract period, annual labor costs (hours and wage) are assumed to be
constant in real dollar terms. The estimated operating costs as a percentage of
gross margin can be found in Table 2.5.5-4 and annual labor cost estimates in
Table 2.5.5-5.
Table 2.5.5-4. Estimated Operating Costs for RV Camping Services
Cost Percentage of Gross Margin
Operating & Maintenance Supplies 10.0%
General and Administrative 2.0%
Licenses/Fees 3.0%
Insurance 5.0%
Utilities 7.0%
Miscellaneous 3.0%
Total 30.0%
Table 2.5.5-5. Estimated Labor Costs for RV Camping Services
Task Hour/Unit/
Day Units
Total Hours/Day
Days in Operation
Use Rate
Total Annual Hours
Median Wage $/hour
Annual Labor Cost
Standard Campsite
0.10 92 9.20 123 0.35 396.1 $11.09 $4,393
Shower Facilities w/
Toilets 0.50 2 1.00 123 1 123 $11.09 $1,364
Landscaping & Grounds
Maintenance 1.00 1 1.00 123 1 123 $11.09 $1,364
Double Vault Toilets
0.15 7 1.05 123 1 129.2 $11.09 $1,433
RV Dump Stations
0.25 2 0.50 123 1 61.5 $11.09 $682
Assumed Wage Rates Subtotal $9,236
Occupation Median $/Hour (2013$)
15% Contingency $1,385
Landscaping & Groundskeeping Worker
$11.09 10%
Management $ 924
Total $11,545
Income and Expense Statement The income and expense statement for camping services is displayed in Table
2.5.5-6. Gross annual operating revenues increase slightly with visitation due to
the use of the RV dump stations and coin-operated showers and average around
$107,300 over the contract term.
Page 30
Page 25 of 32
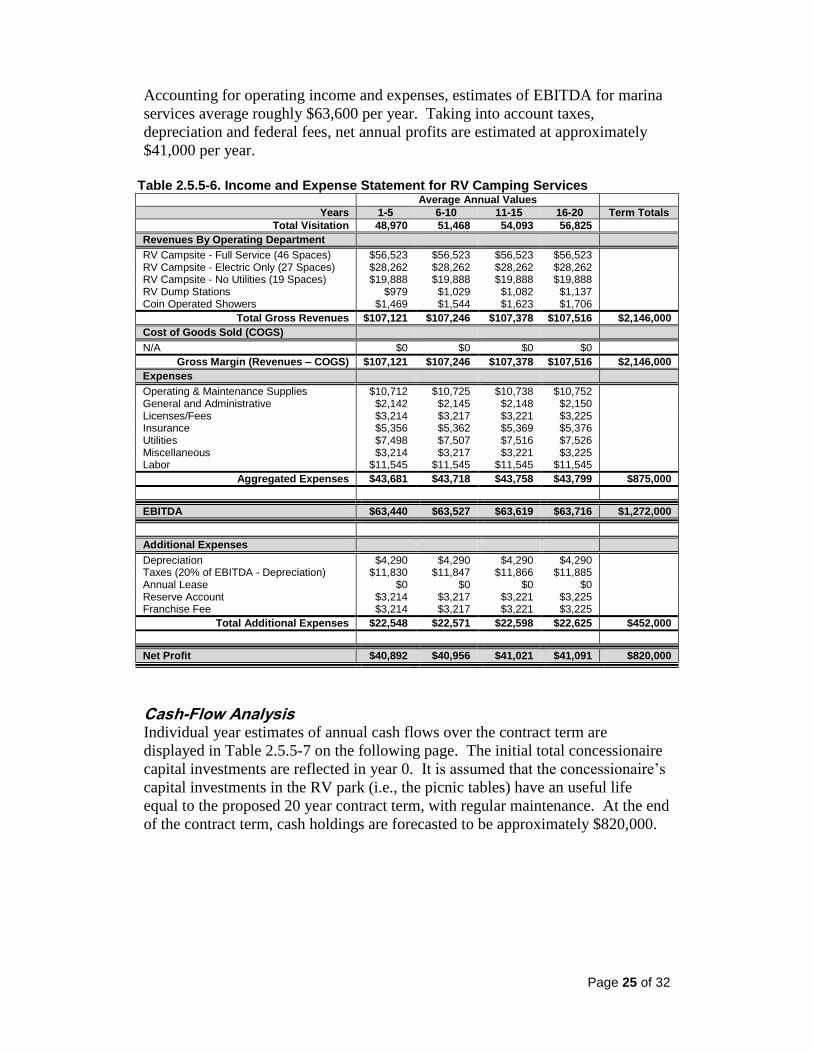
Accounting for operating income and expenses, estimates of EBITDA for marina
services average roughly $63,600 per year. Taking into account taxes,
depreciation and federal fees, net annual profits are estimated at approximately
$41,000 per year.
Table 2.5.5-6. Income and Expense Statement for RV Camping Services Average Annual Values
Years 1-5 6-10 11-15 16-20 Term Totals
Total Visitation 48,970 51,468 54,093 56,825
Revenues By Operating Department
RV Campsite - Full Service (46 Spaces) $56,523 $56,523 $56,523 $56,523 RV Campsite - Electric Only (27 Spaces) $28,262 $28,262 $28,262 $28,262 RV Campsite - No Utilities (19 Spaces) $19,888 $19,888 $19,888 $19,888 RV Dump Stations $979 $1,029 $1,082 $1,137 Coin Operated Showers $1,469 $1,544 $1,623 $1,706
Total Gross Revenues $107,121 $107,246 $107,378 $107,516 $2,146,000
Cost of Goods Sold (COGS)
N/A $0 $0 $0 $0
Gross Margin (Revenues – COGS) $107,121 $107,246 $107,378 $107,516 $2,146,000
Expenses
Operating & Maintenance Supplies $10,712 $10,725 $10,738 $10,752 General and Administrative $2,142 $2,145 $2,148 $2,150 Licenses/Fees $3,214 $3,217 $3,221 $3,225 Insurance $5,356 $5,362 $5,369 $5,376 Utilities $7,498 $7,507 $7,516 $7,526 Miscellaneous $3,214 $3,217 $3,221 $3,225 Labor $11,545 $11,545 $11,545 $11,545
Aggregated Expenses $43,681 $43,718 $43,758 $43,799 $875,000
EBITDA $63,440 $63,527 $63,619 $63,716 $1,272,000
Additional Expenses
Depreciation $4,290 $4,290 $4,290 $4,290 Taxes (20% of EBITDA - Depreciation) $11,830 $11,847 $11,866 $11,885 Annual Lease $0 $0 $0 $0 Reserve Account $3,214 $3,217 $3,221 $3,225 Franchise Fee $3,214 $3,217 $3,221 $3,225
Total Additional Expenses $22,548 $22,571 $22,598 $22,625 $452,000
Net Profit $40,892 $40,956 $41,021 $41,091 $820,000
Cash-Flow Analysis Individual year estimates of annual cash flows over the contract term are
displayed in Table 2.5.5-7 on the following page. The initial total concessionaire
capital investments are reflected in year 0. It is assumed that the concessionaire’s
capital investments in the RV park (i.e., the picnic tables) have an useful life
equal to the proposed 20 year contract term, with regular maintenance. At the end
of the contract term, cash holdings are forecasted to be approximately $820,000.
Page 31
Page 26 of 32
Table 2.5.5-7. Cash-Flow Analysis for RV Camping Services Year 0 1 5 10 15 20
Cash Inflow
Beginning Cash $0 ($85,800) $94,907 $321,069 $547,556 $774,385
Total Sales $0 $107,073 $107,170 $107,298 $107,432 $107,572
Miscellaneous Revenues
$0 $0 $0 $0 $0 $0
Total Available Cash
$0 $21,273 $202,077 $428,367 $654,988 $881,957
Cash Outflow
Cost of Goods Sold $0 $0 $0 $0 $0 $0
Labor Costs $0 $11,545 $11,545 $11,545 $11,545 $11,545 Operating Expenses $0 $32,122 $32,151 $32,189 $32,230 $32,272
Franchise Fee & Lease Payments $0 $3,212 $3,215 $3,219 $3,223 $3,227
Reserve Account $0 $3,212 $3,215 $3,219 $3,223 $3,227 Taxes $0 $11,823 $11,837 $11,855 $11,873 $11,893
Capital Investments $85,000 $0 $0 $0 $0 $0
Total Cash Out $85,000 $61,914 $61,963 $62,027 $62,094 $62,164
Annual Cash-Flow ($85,000) $45,159 $45,207 $45,271 $45,338 $45,408
Cumulative Cash-Flow
($85,000) ($40,641) $140,113 $366,340 $592,894 $819,794
Present Value of Annual Cash-Flow
(10%) ($85,000) $41,053 $28,070 $17,454 $10,854 $6,750
Cumulative Present Value of Cash-Flow
($85,000) ($44,747) $85,469 $191,961 $258,180 $299,359
Financial Summary17 Table 2.5.5-8 displays the summary results of the FFE for the proposed RV park,
as measured by key financial metrics of profitability. Over the proposed 20-year
contract term, EBITDA and net profit are projected to sum to approximately
$1,272,000 and $820,000, respectively. These results indicate, based on the
estimated capital investments and assumptions made in this study, that a
concessionaire’s investment in the RV camping services would likely be a
profitable venture. Further, in net present value terms, at a 10 percent discount
rate, the cumulative cash flow over the contract term is roughly $300,000. A
positive NPV metric signals that the projected return on an investment in marina
services exceeds the established 10 percent reasonable rate of return threshold.
This is further confirmed by the estimated IRR of 52.7 percent. Based on these
metrics, the investment in marina services would likely be a profitable venture
and financially viable over the long term.
17
The summary of financial information for all perspective concessions at GBM are based on
planning-level estimates and are not intended to ensure the profit or loss of any concession
opportunity considered in this study.
Page 32
Page 27 of 32
Table 2.5.5-8. Results of the FFE for RV Camping Services (2013$)
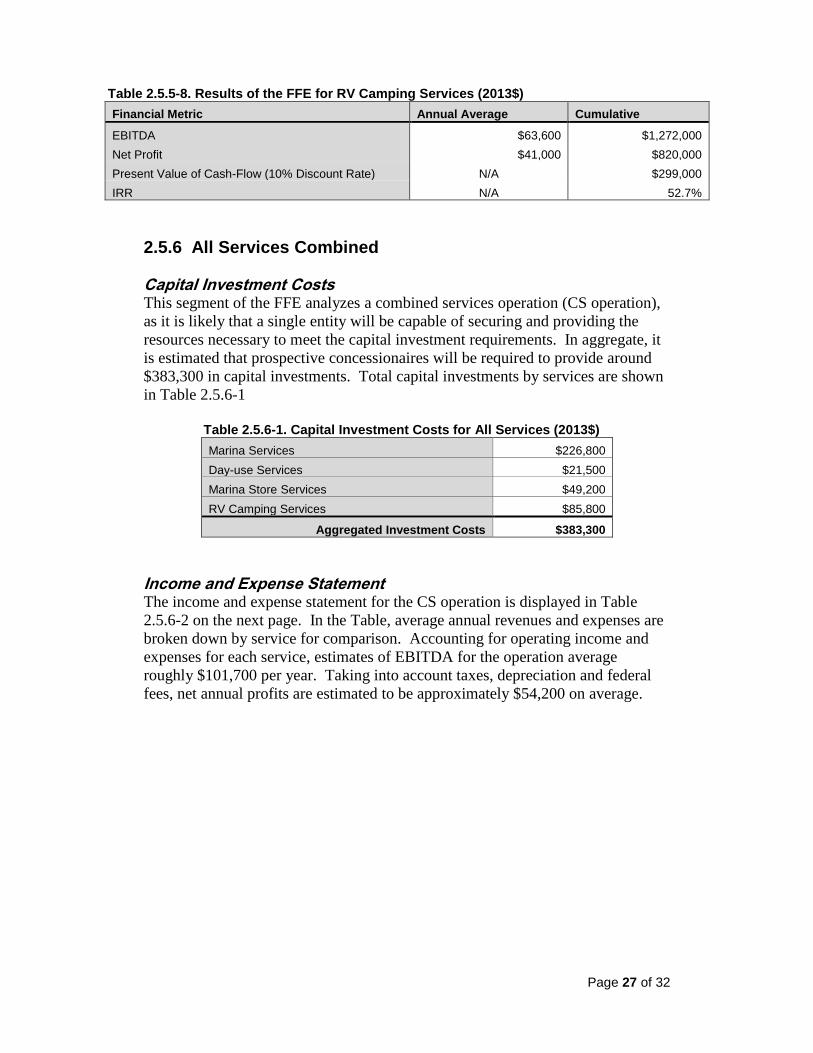
Financial Metric Annual Average Cumulative
EBITDA $63,600 $1,272,000
Net Profit $41,000 $820,000
Present Value of Cash-Flow (10% Discount Rate) N/A $299,000
IRR N/A 52.7%
2.5.6 All Services Combined
Capital Investment Costs This segment of the FFE analyzes a combined services operation (CS operation),
as it is likely that a single entity will be capable of securing and providing the
resources necessary to meet the capital investment requirements. In aggregate, it
is estimated that prospective concessionaires will be required to provide around
$383,300 in capital investments. Total capital investments by services are shown
in Table 2.5.6-1
Table 2.5.6-1. Capital Investment Costs for All Services (2013$)
Marina Services $226,800
Day-use Services $21,500
Marina Store Services $49,200
RV Camping Services $85,800
Aggregated Investment Costs $383,300
Income and Expense Statement The income and expense statement for the CS operation is displayed in Table
2.5.6-2 on the next page. In the Table, average annual revenues and expenses are
broken down by service for comparison. Accounting for operating income and
expenses for each service, estimates of EBITDA for the operation average
roughly $101,700 per year. Taking into account taxes, depreciation and federal
fees, net annual profits are estimated to be approximately $54,200 on average.
Page 33
Page 28 of 32
Table 2.5.6-2. Income and Expense Statement for All Services Average Annual Values
Years 1-5 6-10 11-15 16-20 Term Totals
Total Visitation 48,970 51,468 54,093 56,825
Revenues By Service
Marina $43,200 $43,200 $43,200 $43,200 Day-use $7,534 $7,534 $7,534 $7,534 Marina Store $121,795 $126,171 $130,771 $135,605 RV Camping $107,121 $107,246 $107,378 $107,515
Total Gross Revenues $279,650 $284,151 $288,883 $293,854 $5,733,000
Cost of Goods Sold (COGS)
Marina $43,200 $43,200 $43,200 $43,200 Day-use $7,534 $7,534 $7,534 $7,534 Marina Store $36,949 $38,528 $40,187 $41,931 RV Camping $107,121 $107,246 $107,378 $107,515
Gross Margin (Revenues – COGS) $194,804 $196,508 $198,299 $200,180 $3,950,000
Expenses by Service
Marina $15,006 $15,006 $15,006 $15,006 Day-use $3,923 $3,923 $3,923 $3,923 Marina Store $32,306 $32,780 $33,277 $33,801 RV Camping $43,681 $43,719 $43,758 $43,800
Aggregated Expenses $94,916 $95,428 $95,964 $96,530 $1,914,000
EBITDA $99,888 $101,080 $102,334 $103,651 $2,035,000
Additional Expenses
Marina $17,304 $17,304 $17,304 $17,304 Day-use $2,033 $2,033 $2,033 $2,033 Marina Store $5,113 $5,428 $5,760 $6,109 RV Camping $22,547 $22,572 $22,598 $22,626
Total Additional Expenses $46,997 $47,337 $47,695 $48,072 $941,000
Net Profit $52,892 $53,744 $54,639 $55,580 $1,084,271
Cash-Flow Analysis Individual year estimates of annual cash flows for each service over the contract
term are displayed in Table 2.5.6-3 on the proceeding page. The estimated total
capital investments required for all the CS operation are reflected in year 0. With
regular maintenance, it is assumed that all capital investments in a useful life
equal to at minimum the proposed 20 year contract term. At the end of the
contract term, cash holdings are forecasted to be approximately $1,084,000.
Page 34
Page 29 of 32
Table 2.5.6-3. Cash-Flow Analysis for All Services Year
0 1 5 10 15 20
Cash Inflow
Beginning Cash $0 ($383,251) ($95,367) $268,296 $636,389 $1,009,141 Total Sales $0 $277,903 $281,414 $286,006 $290,832 $295,903
Miscellaneous Revenues
$0 $0 $0 $0 $0 $0
Total Available Cash
$0 ($105,348) $186,047 $554,302 $927,221 $1,305,044
Cash Outflow
Cost of Goods Sold
$0 $83,760 $85,943 $88,797 $91,796 $94,948
Labor Costs $0 $36,475 $36,475 $36,475 $36,475 $36,475 Operating Expenses
$0 $58,243 $58,641 $59,163 $59,711 $60,286
Franchise Fee & Lease Payments
$0 $5,824 $5,864 $5,916 $5,971 $6,029
Reserve Account $0 $5,824 $5,864 $5,916 $5,971 $6,029
Taxes $0 $16,053 $16,239 $16,483 $16,738 $17,007
Capital Investments
$383,251 $0 $0 $0 $0 $0
Total Cash Out $383,251 $206,179 $209,026 $212,750 $216,662 $220,774
Annual Cash-Flow
($383,251) $71,724 $72,388 $73,257 $74,171 $75,130
Cumulative Cash-Flow
($383,251) ($311,527) ($22,979) $341,552 $710,560 $1,084,271
Present Value of Annual Cash-
Flow (10%) ($383,251) $65,204 $44,947 $28,244 $17,756 $11,168
Cumulative Present Value of
Cash-Flow ($383,251) ($318,047) ($110,227) $61,300 $169,111 $236,905
Financial Summary18 Table 2.5.6-4 displays the summary results of the FFE for the total CS operation,
as measured by key financial metrics of profitability. Over the proposed 20-year
contract term, EBITDA and net profit are projected to sum to approximately
$2,035,000 and $1,084,000, respectively. These results indicate, based on the
estimated capital investments and assumptions made in this study, that an
investment in the operation as a whole would likely be a profitable venture.
Further, in net present value terms, at a 10 percent discount rate, the cumulative
cash flow over the contract term is roughly $237,000. A positive NPV metric
signals that the projected return on capital investment exceeds the established 10
percent reasonable rate of return threshold. This is further confirmed by the
estimated IRR of 18.3 percent. Based on these metrics, the investment in marina
services would likely be a profitable venture and financially viable over the long
run.
18
The summary of financial information for all perspective concessions at GBM are based on
planning-level estimates and are not intended to ensure the profit or loss of any concession
opportunity considered in this study.
Page 35
Page 30 of 32
Table 2.5.6-4. Results of the FFE for All Services (2013$)
Financial Metric Annual Average Cumulative
EBITDA $101,700 $2,035,000
Net Profit $54,200 $1,084,000
Present Value of Cash-Flow (10% Discount Rate) N/A $237,000
IRR N/A 18.3%
2.5.7 Financial Feasibility Evaluation Sensitivity Analysis
The key assumptions and estimated capital costs developed in this study directly
influence the financial metrics used in determining the financial feasibility of the
proposed concession services. Table 2.5.7-1, on the next page, displays the
resulting impacts to the CS operation FFE of changing some of the most
significant assumptions and variables–only one key variable is changed at a time,
all other variables are held constant. Tables 2.5.7-2 through 2.5.7-4 show how
changing two key variables simultaneously would impact the IRR of the
combined services operation. Table 2.5.7-5 shows how the financial metrics
change when the total required capital cost estimates are altered.
Page 36
Page 31 of 32
Impacts of Varying Significant Variables and Assumptions The following table illustrates how changing some of the most significant
assumptions and variables would impact financial metrics of the CS operation.
Table 2.5.7-1. Sensitivity Analysis of CS Operation(2013$)1,2
Key Assumption
EBITDA (Annual
Average)
Net Profit (Annual Average)
Cumulative Present Value of
Cash-flow IRR
Contract Term
5 $99,888 $52,892 ($110,227) -2.0% 10 $100,484 $53,318 $61,300 13.6% 15 $101,101 $53,758 $169,111 17.1% 20 $101,738 $54,214 $236,905 18.3%
Total Sum of Franchise & Reserve Account Fees
3% $101,738 $60,137 $287,062 19.9% 6% $101,738 $54,214 $236,905 18.3%
10% $101,738 $46,316 $170,029 16.0% 15% $101,738 $36,443 $86,433 13.2% 20% $101,738 $26,571 $2,838 10.1%
Occupancy Fee (Annual Lease)
$0 $101,738 $54,214 $236,905 18.3% $1,000 $101,738 $52,114 $218,060 17.6% $2,500 $101,738 $48,964 $189,792 16.6% $5,000 $101,738 $43,714 $142,678 15.0%
$10,000 $101,738 $33,214 $48,452 11.7%
RV Camping - Occupancy Rates
32% $91,837 $47,141 $176,692 16.3% 35% $97,778 $51,385 $212,820 17.5% 37% $101,738 $54,214 $236,905 18.3% 40% $107,679 $58,457 $273,032 19.5% 45% $117,581 $65,529 $333,244 21.4%
Boat Slip Rentals
80% $98,378 $51,814 $216,472 17.6% 85% $100,058 $53,014 $226,689 17.9% 90% $101,738 $54,214 $236,905 18.3% 95% $103,418 $55,414 $247,121 18.6%
Starting Visitation Levels
40,000 $97,534 $51,210 $212,091 17.5% 48,000 $101,738 $54,214 $236,905 18.3% 55,000 $105,417 $56,841 $258,616 19.0% 60,000 $108,045 $58,718 $274,124 19.5%
1Bold emphasis added to indicate baseline conditions. 2This sensitivity analysis shows how varying a single parameter impacts financial metrics while holding all
other parameters constant at baseline levels.
Impacts of Simultaneously Varying Variables and Assumptions The following tables illustrate how varying two the most significant variables
simultaneously would impact the IRR of the CS operation.
Table 2.5.7-2. IRR Sensitivity Analysis–Contract Term Vs. Federal Fees
1
IRR Matrix
Total Sum of Franchise & Reserve Account Fees 3% 6% 10% 15% 20%
Con
tra
ct
Te
rm 5 0.5% -2.0% -5.6% -10.4% -15.6%
10 15.6% 13.6% 10.8% 7.1% 3.1%
15 18.9% 17.1% 14.7% 11.6% 8.2%
20 19.9% 18.3% 16.0% 13.2% 10.1% 1Bold emphasis added to indicate baseline conditions.
Page 37
Page 32 of 32
Table 2.5.7-3. IRR Sensitivity Analysis–Contract Term Vs. Occupancy Fees1
IRR Matrix
Occupancy Fees
$0 $1,000 $2,500 $5,000 $10,000 C
on
tra
ct
Te
rm 5 -2.0% -3.1% -4.7% -7.5% -13.2%
10 13.6% 12.8% 11.5% 9.4% 5.1%
15 17.1% 16.4% 15.4% 13.6% 9.9%
20 18.3% 17.6% 16.6% 15.0% 11.7% 1Bold emphasis added to indicate baseline conditions.
Table 2.5.7-4. IRR Sensitivity Analysis–Occupancy Fees Vs. Federal Fees
1
IRR Matrix
Total Sum of Franchise & Reserve Account Fees
3% 6% 10% 15% 20%
Occu
pa
ncy
Fe
es
$0 19.9% 18.3% 16.0% 13.2% 10.1%
$1,000 19.3% 17.6% 15.4% 12.5% 9.4%
$2,500 18.3% 16.6% 14.4% 11.4% 8.3%
$5,000 16.7% 15.0% 12.7% 9.7% 6.4%
$10,000 13.4% 11.7% 9.3% 6.1% 2.4% 1Bold emphasis added to indicate baseline conditions.
Variation in Capital Cost Estimates Table 2.5.7-5 presents the potential impacts to the IRR financial metric based on
variations in capital cost estimates and contract term lengths for the CS operation.
Table 2.5.7-5. IRR Sensitivity Analysis–Contract Term Vs. Total Investment
1
IRR Matrix
Total Investment Costs
$300,000 $350,000 $383,000 $400,000 $450,000
Con
tra
ct
Te
rm 5 6.4% 1.0% -2.0% -3.4% -7.0%
10 20.3% 15.9% 13.6% 12.5% 9.7%
15 23.0% 19.2% 17.1% 16.2% 13.8%
20 23.8% 20.2% 18.3% 17.4% 15.2% 1Bold emphasis added to indicate baseline conditions.