99
GOT DATA? Step-by-Step Guide to Making Data Work for You Center for Applied Research Solutions, Inc 771 Oak Avenue Parkway, Suite 3 Folsom, CA 95630 (916) 983-9506 TEL (916) 983-5738 FAX
| Date post: | 25-Dec-2015 |
| Category: |
Documents |
| Upload: | gwen-porter |
| View: | 215 times |
| Download: | 1 times |

GOT DATA?Step-by-Step Guide to Making Data
Work for You
Center for Applied Research Solutions, Inc771 Oak Avenue Parkway, Suite 3 Folsom, CA 95630
(916) 983-9506 TEL (916) 983-5738 FAX

Facilitators:
Kerrilyn Scott
Christina BorbelyProduced and Conducted by the Center for Applied Research Solutions, Inc. for the California
Department of Alcohol and Drug Programs
SDFSC Workshop-by-Request
May 16, 2005
Authored by Christina J. Borbely, Ph.D.
Safe and Drug Free Schools and Communities Technical Assistance Project
GOT DATA?Step-by-Step Guide to Making Data
Work for You

Objectives
Preparing to Use Data– Database options & structure– Identifying data– Coding & Entering – Storing & Cleaning
Methods for Summarizing Data– Basics: frequency & % change– Beyond Basics: mean scores; making comparisons
Interpreting Data Effective Report Writing Utilizing & Disseminating Findings
– Program improvement, Funders, Key Stakeholders
Ready, Set, Go!Preparing to Use Data
Database Options Identifying Data Coding Data Entering, Storing, & Cleaning Data

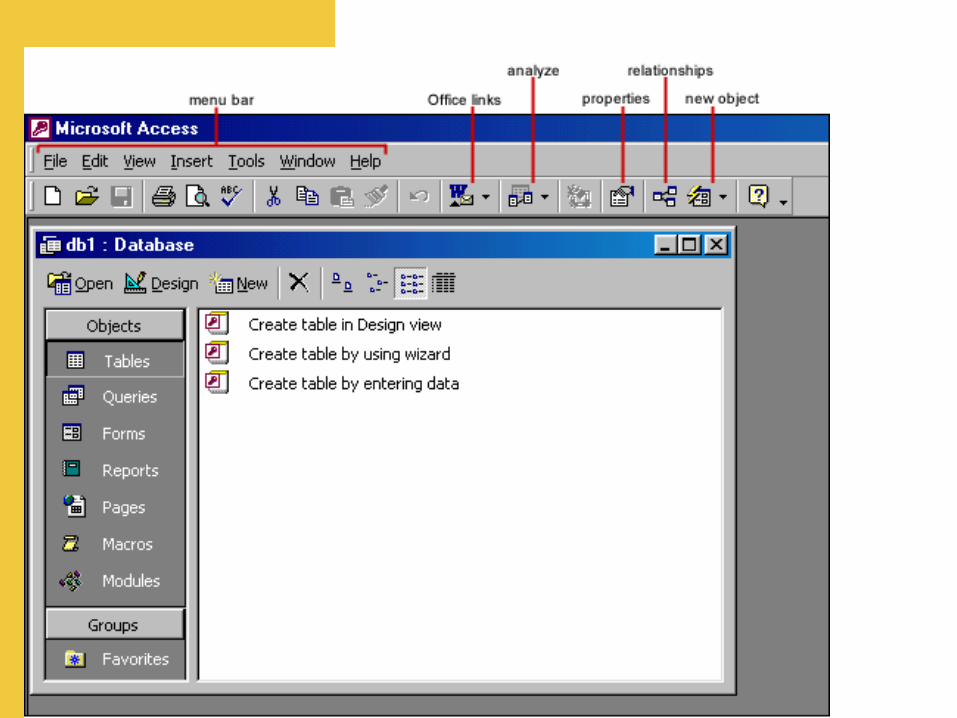
Database Options
Microsoft Excel Microsoft Access SPSS

Excel
Spreadsheet format Some computational functions Compatible with other MS software & statistical
software Comes with Microsoft Office package (or $299)
http://office.microsoft.com/en-us/FX010858001033.aspx


Access
User friendly design Requires some preparation prior to data entry Generates custom reports Good for qualitative (i.e. open-ended items) & quantitative
data Compatible with other Microsoft software &
statistical software (i.e. converts easily to Excel!) Comes with Microsoft Office package (or $299)
http://office.microsoft.com/en-us/FX010857911033.aspx

SPSS
Spreadsheet format Requires some tutorial (not always intuitive) One-touch data analysis! Pricing ranges from $599 to $1499
www.spss.com

Watcha Got?
Identifying data Variable names

Identifying Data
Each piece of information you have for a participant or a program is data.
Data are…# of completed surveys data
# of times a youth attended a session# of youth who attended a meeting
# of merchants contacted for outreachAge
Grade

FYI: Types of Data
Discrete, categoricalMale/Female
US Citizen/Non US CitizenFreshman, Sophmore, Junior, Senior
ContinuousAge
SalaryConflict Resolution Ability

Variable Names
Each piece of data is labeled with a unique (and hopefully meaningful) variable name.
Data Variable Name
Section E, item 3 E3
Age Age
Unit 1 total score Un1tot

Variable Names: Do’s & Don’ts
MeaningfulFor section E, item 6: E6 Variable124a
ShortDOB Date of BirthE6 Youth Survey Section E, Item #6
SystematicE6, E7, E9, F1, F2 1F, twoF, Fthree

Plan to reference data collection time points
First administration:BL (for baseline) or T1 (for time 1) or PRE (for pre-test)
BLE6, FUE6 E6, E6
Be consistent with the chosen system
T1E6, T2E6 E6T1, T2E6

Coding Key: Do’s
Translate into numeric valuesFor response scale: YES! Yes No NO!
YES! = 3Yes = 2No = 1NO! = 0
Record coding key directly onto measure & save!

Coding System Examples
Race
Black = 1
Hispanic = 2
White = 3
Asian = 4
Other = 5
Gender
Male = 1
Female = 2

Coding Key: Don’ts
Do not create a separate variable to code each response to an item.
1. What grade are you in? A. 6th B. 7th C. 8th
Variable name = BL1Codes A=1; B=2; C=3
NOTVariable name = BL1A; BL1B; BL1CCodes Yes=1; No=0

Advanced Coding
•Collapsing Variables by Code
Variable Name: “Reside”
Codes: house = 1
apartment = 2
barn = 3
1. Do you live in a house? Y/N
2. Do you live in an apartment? Y/N
3. Do you live in a barn? Y/N

Reverse CodingThe values of the coding system may need to be reversed to reflect the true meaning of the response.
1. Do you runaway from home? Often Sometimes Rarely Never2. Do your parents smile at you? Often Sometimes Rarely Never3. Are you happy at home? Often Sometimes Rarely Never
Variable codes: 4 3 2 1Reverse code: 1 2 3 4

Entering Data in Your Database
Create 1 row of variable names: Across
Create 1 column of names/id #s: Down
Enter post test & follow-ups by extending the row for each participant
ID BLgrade BLa23 T2grade T2a230025 6 2.5 7 3.1
Save regularly as you enter (don’t lose all that work!)

Storing Data
Hardcopies Electronic files

Under Lock n’ Key
Guard with your life until a back up is made
Keep all hardcopies as backup
Maintain back ups in different locations
Preserve confidentiality Separate identifying information from surveys Use passwords; locked file cabinets; secured offices

Cleaning Data: Quick, Easy, & Worth It!
Save yourself the grief of inexplicable scores…
Data should fall within an expected range (e.g. 1 to 5).
Scan data for unusual numbers by: Visual review A “sort by” function A “find” function A “minimum/maximum” or “range” function

Squeaky Clean!
Use a “missing” marker (e.g. 999) when a response is purposely missing (e.g. left blank, etc.)
Pros: easy to spot unintentionally unentered dataCons: extra step to remove missing marker later
Don’t forget to exclude “missing” data values, so it doesn’t mess up your computations!

FYI:How to use “missing” markers
1. Select number or symbol that will not naturally occur in the data
2. Enter marker when data point is unavailable
3. Clean data & look for “blanks”. Fill in un-entered or incomplete data.
4. After data is clean, delete or exclude the missing marker
5. Do data analysis

Recommendations
Consider using “in house” resources for entering & cleaning data
Consider outsourcing database development to a graduate student or local evaluator

FYI:Outliers
An outlier is a data point that does not cluster with other data points in the group.
Example: ages range from 12.1 to 14.3 years; there are 3 outliers age 17.4; 19.2; and 19.7 years.
It may skew data so that it is not representative of the sample.
Consider excluding outliers

Housekeeping Activity:Clean the Data

Guide: Step 1
Kids today!
Set up a database
Code and enter data
Clean database


Putting Data to WorkMethods for Summarizing Data
BasicsTaking It Up a Notch
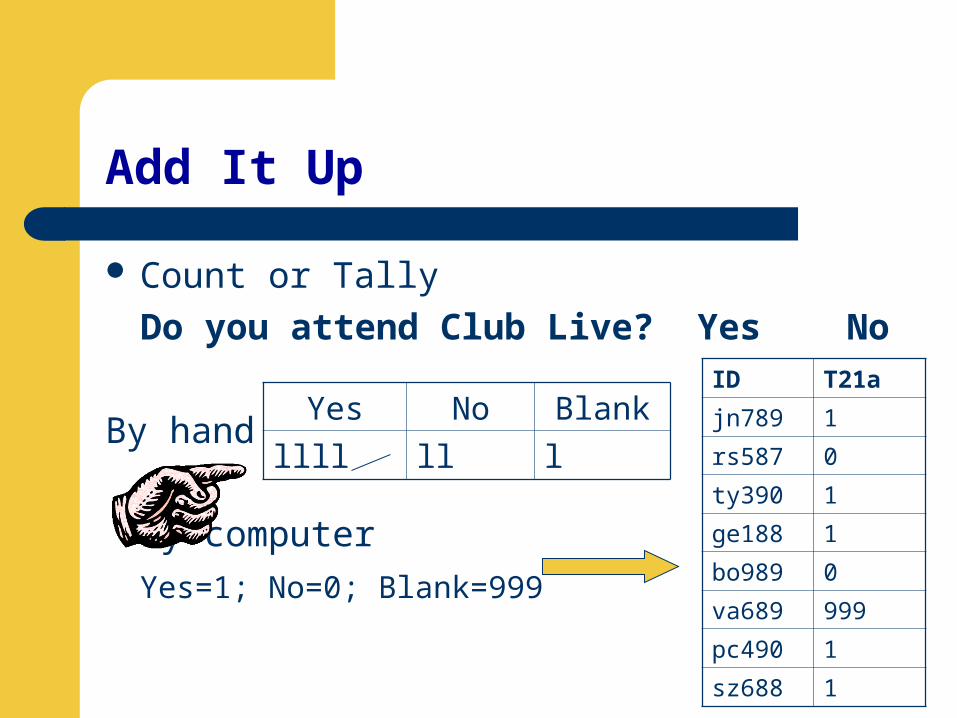
Add It Up
Count or Tally
Do you attend Club Live? Yes No
By hand
By computer
Yes=1; No=0; Blank=999
Yes No Blank
llll ll l
ID T21a
jn789 1
rs587 0
ty390 1
ge188 1
bo989 0
va689 999
pc490 1
sz688 1

Frequencies: Ratio & Percent Distribution
What race are you? Black White Asian Hispanic Other
Do you live with both biological parents?
Yes No
Quantifies rate of occurrence for categories of information
How much you like school? (circle one)YES! Yes No NO!
How old are you? _____
NOT As Useful for….
Useful for….

Calculating Frequency
Sum the number of times a given response occurs
Report a number: a ratio or percentage
Gender # of participants % of participants
Male 49 49%
Female 51 51%
Total 100 100%
Of the 100 participants, 49 were male. This year, almost half (51%) of the participants were females.

Common uses
Demographics to characterize participants or communityRace; gender; grade; homeowner status
Statistics to describe programNumber of program completers
% of city council members contacted
Impact statements on outcomes% of youth reporting ATOD use
Ratio of signage below adult eye-level

Reporting Frequencies
Frequency of participants reporting they are:
Male
Employed
Getting mostly B’s in math
Parents of a FNL youth
Frequency with which:
Decoy buys are successful
Alcohol-sponsored events occur

Sample:Excerpt of Frequency in Text
“Of clients with completed CBCL/YSR, well over half (56.9%) function in the lowest quartile of global competence. Specifically, clients demonstrate compromised ability related to engagement in age-appropriate activities, social interaction, and performance at school. Given that services are provided in the school context, it is not surprising that almost three-quarters of the clients (71.2%) function in the bottom quartile of school-related competence. Teachers and other school staff, individuals familiar with indicators of school competence, are the most common referral source of students. It is expected that competence in these domains will benefit from student participation in counseling services. Additional data is being collected to test for improvement over time.”

Change Score
Comparison of scores to assess changeProposed outcome:
80% of youth increased awareness of ATOD consequencesID T1consq T2consq Change Increase
jn789 3.4 3.4 0 No
rs587 2.1 3.6 +1.5 Yes
ty390 2.5 3.4 +.9 Yes
ge188 3.0 3.5 +.5 Yes
bo989 4.3 4.5 +.2 Yes
va689 999 2.9 999 N/A
pc490 3.2 2.9 -.3 No
sz688 1.6 2.5 +.9 Yes
5 of 7 youth increased scores = 71.4% of youth increased awareness of ATOD consequences

Taking It Up a Notch
Mean scores And beyond…

Mean Scores
The mean refers to a variables central tendency and is the sum of all a factors values divided by the number of values.
“Mean” and “average” refer to the same concept.

Calculating Means
Sum all the response values, then divide by the total number (of responses or items)
Provide a frame of reference (“out of how many”)
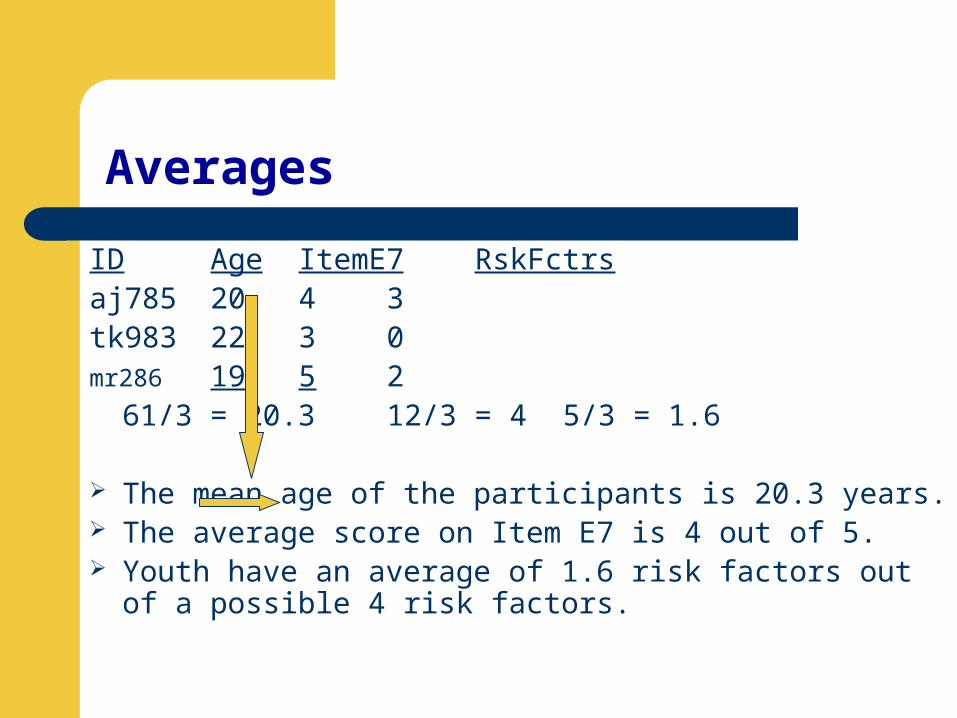
Averages
ID Age ItemE7 RskFctrsaj785 20 4 3tk983 22 3 0mr286 19 5 2
61/3 = 20.3 12/3 = 4 5/3 = 1.6
The mean age of the participants is 20.3 years. The average score on Item E7 is 4 out of 5. Youth have an average of 1.6 risk factors out of a possible 4
risk factors.

Common Uses
To make a generalized statement about a group.
Demographics to characterize participants or community
Age; Income level
Impact statements on outcomesLevel of ATOD use among youth
Sub-scale scores

Reporting Mean Scores
Report means of sub-scales Average score for “Community Connection” scale
Report mean scores of an individual itemItem E4: How often did you smoke pot in the past 7
days?
Report mean score of occurrenceAverage number of hours spent educating merchants

Sample:Excerpt of Mean Score in Text
“Of the districts completing Year 1 Superintendent Surveys, the majority indicated that counseling services were of a resource of high value. On a five-point scale with 5 being the highest value, the average value assigned to the Project X counseling services was 3.67. In addition, all districts indicated that parents, teachers, administrators, and school psychologists were largely receptive to and supportive of the resource. The majority of responding superintendents indicate that districts would benefit from expanding counseling services and improving the physical space allotted for service delivery. Clearly, Year 1 has culminated in substantiated need and the resolve to prioritize addressing the need. “

Analysis Activity: Finding Findings
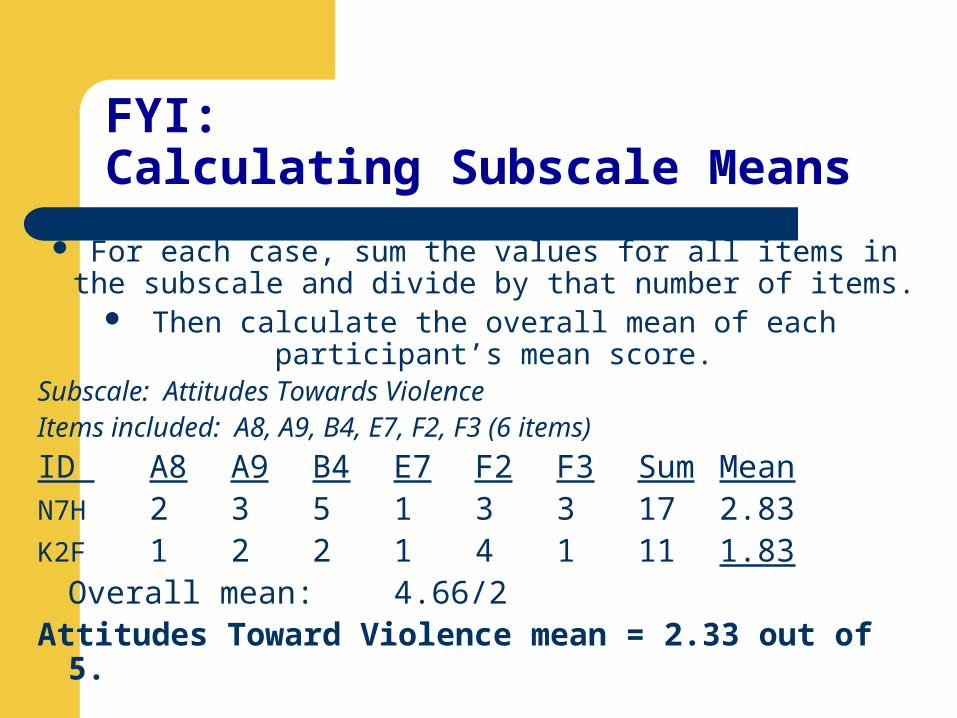
FYI:Calculating Subscale Means
For each case, sum the values for all items in the subscale and divide by that number of items.
Then calculate the overall mean of each participant’s mean score.
Subscale: Attitudes Towards ViolenceItems included: A8, A9, B4, E7, F2, F3 (6 items)
ID A8 A9 B4 E7 F2 F3 Sum MeanN7H 2 3 5 1 3 3 17 2.83K2F 1 2 2 1 4 1 11 1.83
Overall mean: 4.66/2Attitudes Toward Violence mean = 2.33 out of 5.

FYI:Other Measures of Central Tendency
ModeThe most frequently occurring value in a set of valuesThe modal response for the smoking subscale was 2.0 out of 5.0. This indicates that while youth may have tried smoking, most do not smoke on a regular basis.
MedianIt is the value that is the mid-point in a set of values where half the values are smaller & half are larger.The median cost of a home in the area is $350,000, well above the average family income for participating parents.

Apples to Apples?Comparing Frequencies & Means
Means to Means and Frequencies to Frequencies
Over timePre- to Post-Test Scores
Incidence statistics the year before to the year after the program
Across groupsProgram participants to control/comparison group
Merchants with low program participation to those with high program participation

Frequencies & Means:Method of Comparison
Eyeballing differences
Anyone can do it Limits interpretation
Testing differences
Requires a simple statistical test
Determines whether the difference is meaningful
Allows definitive statement about comparison

Recommendations
Consider using an evaluator or identifying a consultant (like a local graduate student) to do statistical tests or analyses.

Activity: Compare Scores

And beyond…
Normal distribution Standard deviation Statistical significance

FYI:Normal Distribution
Normal distribution refers to a group of data points that occur symmetrically and with a bell-shaped density and one peak.
Balasubramanian Narasimhan , Stanford University, July 22, 1996

FYI:Standard Deviation
Standard deviation is a standardized score to indicate where a finding falls on the
normal distribution.
Often means are reported with a standard deviation (SD).
For example, mean = 3.4 (.17).
Rule of thumb: SD between 0 and 2 are fine. Outside of this, finding may be skewed.

FYI:Statistical Significance
“Statistical significance” refers to the probability that the outcome of data analysis indicates an effect when there isn’t one.
When comparing means or frequencies (or other analysis outcomes), a test statistic is used to determine if there is a meaningful difference.
If a finding is “significant”, the outcome is considered true (with 95% certainty)

Guide: Step 2
Compute frequencies & means to describe program, participants, and outcomes
Compare findings

Making MeaningInterpreting Data
Bite your tongueSound bytesSpin

Bite your tongue
Do say
Is associated with…
This suggests…
May indicate…
Appears to…
*note specific limitations (e.g. “no baseline”)
Don’t say
Is caused by…
Is the result of…
Due to…
Because of…
Significantly differed… (unless tested)

Sound Bites
Put favorable findings in short, sweet sentences.
Statement to press:
Participation in FNL is associated with increases in self-esteem.
Presentation to key stakeholders:
Merchants with Responsible Merchant education are less likely to sell alcohol to children in our community.

Spin
Group your data to maximize findings (e.g. cut a 4 point scale into high/low scores)
“No change” is “maintenance”
Couch unanticipated or lack of findings in reasonable explanation or plans

Sample:Excerpt of “Spin”
“While scores from the Youth Survey’s ATOD use subscale indicate that participants increased their substance use over time (mean use at baseline = 3.2 out of 5; post-test = 4.0), this should be considered in context. Specifically, research reports a developmental (i.e. maturational) effect on adolescent use rates. When participant use rates were compared to rates reported for the same age group in Sutter County’s California Healthy Kids Survey, our youth were faring better…..
In addition, as noted in the previous section, youth attitudes towards substance use showed improvement over time. Within the literature, change in attitude is widely regarded as the first step in impacting behavior…”
Try Your Hand Activity: Translating Findings in Text

Guide: Step 3
Find your findings
Select key findings
Strategically frame findings


Read All About It!Effective Report Writing
Know Your AudienceShow Your WorkIf You’ve Got It, Flaunt ItA Picture Speaks a Thousand Words

Know Your Audience
Consider Who You Are Dealing With….
What do they care about?
How much time do they have?
What level of detail is ideal?
What do you expect to accomplish by sharing information with them?

Show Your Work
Don’t just report findings, report how you found them
Specify: measure development
administration details

Sample: Excerpt of Evaluation Methodology
“The evaluation components for the fifth year consisted of the following elements: Protégé Pre- and Post Surveys (Outcome), Participant Satisfaction Surveys (for both Mentors and Proteges), Program Advisor Surveys, County Coordinator Phone Interviews, and Site Visits (Primarily focusing on interviewing the youth participants). In addition, Monthly Reports and Mentoring Session Activity Logs were collected and analyzed. The following provides a more detailed description of each component and the sample size.
Protégé Pre- and Post-Surveys: These instruments are intended to measure the impact of FNLM on the Proteges. The survey measures constructs such as school attachment, decision making and goal setting, conflict resolution, refusal skills, and ATOD harm perceptions and use. The survey took approximately 30 minutes to complete and primarily consisted of likert scale rating items. A sub-sample of seven counties were administered the outcome survey and a total of 71 matched pre/post surveys were used for the data analysis” (FNL Year 5 Evaluation Report, 2003)

Describe program or evaluation “lessons learned” to account for modifications
Sample: Excerpt of Limitations“Over the course of the four years, tracking program attendance has posed a
major challenge. During the first two years of the program, valid attendance rates were not available due to hand-written attendance logs and a lack of documentation of program drop-outs. While the attendance data has improved dramatically over the course of the program, for the previous year tracking individual attendance rates was still not feasible. However, appropriate and consistent documentation of the number of mentors and protégés attending the mentoring sessions did allow for reporting average attendance levels by school site for mentors and protégés for each county; this method will be continued this year and will further benefit from the addition of an attendance summary sheet.” (FNL Year 5 Evaluation Report, 2003)

If You’ve Got It, Flaunt It
Insert statistics to describe the program, staff, and participants
Report overall outcome findings & include notable specifics
“At program end, fewer youth showed favorable attitudes toward alcohol use (17% versus 25%), especially girls (13% versus 29%).”

A picture speaks a thousand words
Use graphs & charts to illustrate findings
1
1.5
2
2.5
3
3.5
4
4.5
5
Pre Test Post Test
positive peerconnections
bonding withadult staff
0
5
10
15
20
25
2000 2001 2002 2003 2004
ATOD relatedhospitaldischargesDUI arrests
FNL survey relationship building mean scores (N = 204 youth) Community ATOD indicators per 1,000 population
35%
60%
5% HighMediumLow
Percentage of Participants at Risk (N = 100)

When To Use What Graphic
Line Graph: use to display values (data points) over time
Bar Chart: use to display a distribution of values across categories
0
5
10
15
20
25
2000 2001 2002 2003 2004
ATOD relatedhospitaldischargesDUI arrests
05
101520253035404550
Grades
Mostly Bs & As
Mostly Cs
Mostly Ds & Fs
Community ATOD indicators per 1,000 population

Grouped Bar Chart: use to display a distribution of values across categories for two+ variables
Pie Chart: use to display the distribution of cases across categories. Wedge=number or percentage.
1
1.5
2
2.5
3
3.5
4
4.5
5
Pre Test Post Test
positive peerconnections
bonding withadult staff
35%
60%
5% HighMediumLow
FNL survey relationship building mean scores (N = 204 youth)
Percentage of Participants at Risk (N = 100)
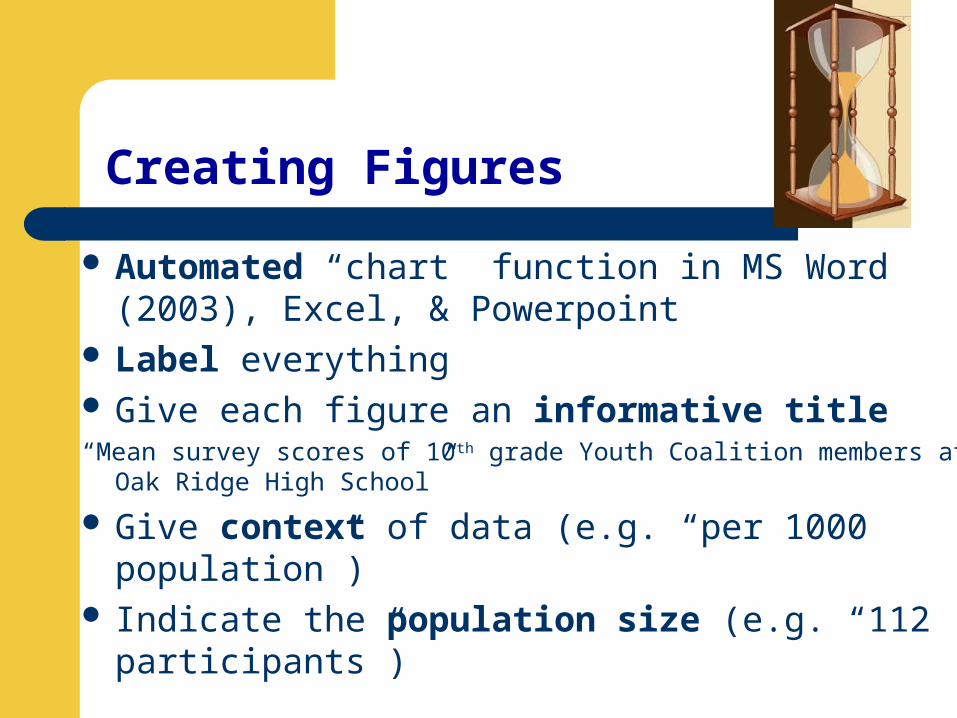
Creating Figures
Automated “chart” function in MS Word (2003), Excel, & Powerpoint
Label everything Give each figure an informative title“Mean survey scores of 10th grade Youth Coalition members at Oak Ridge
High School”
Give context of data (e.g. “per 1000 population”) Indicate the population size (e.g. “112
participants”)

Writing About Graphics
Do highlight key findings displayed in figure
Don’t reiterate in text every detail of the figure
Sample: Excerpt of Text for Figure“Retention Rates: The attrition rates continue to show a slight decrease this
year. A total of Fifty-two mentors (10%) and thirty-eight protégés (9%) were reported to drop-out of the program. In the previous year, attrition rates of 13% were seen for both the mentors (n=147) and proteges (n=141). The average number of protégés that dropped from all school sites was higher than for the mentors. “
(FNL Year 5 Evaluation Report, 2003)
Average Number of Protege Drops Per Site
PDPDS3PDPDS2PDPDS1
Me
an
5.0
4.5
4.0
3.5
3.0
2.5
2.0
1.5
1.0
2.02.0
2.5
Average Number of Mentor Drops Per Site
MDPCHGS3MDPCHGS2MDPCHGS1
Me
an
5.0
4.5
4.0
3.5
3.0
2.5
2.0
1.5
1.0
2.0
1.2

Writing Tips
Say it in numbersThe letter-writing campaign was successful.
The letter-writing campaign resulted in communication with 67 local government officials.
Say ONE thing at a timeMore than half of the original participants completed the program and
relationships with parents improved over time.More than half (57%) of the original participants completed the program.
These young people demonstrated a 12% improvement in relationships with parents over time.
Writing Tips
Be precise (not vague)
Program participants included high risk youth.Over one-third (36%) of program participants met at least one of three risk factors, including
school expulsion/drop out, juvenile arrest record, or free-lunch status.
Connect proposed outcomes to performance measures to findings.
A primary goal of the program was to reduce accessibility of tobacco to minors. Decoy buy assessments and focus groups with merchants involved in the merchant education
program indicate that tobacco accessibility is more stringent now compared to at Year 1.
Writing Tips
Add interpretation or explanation to outcomes.
Results from the Youth Survey indicate that teens showed healthier attitudes toward drug use, but increased drug use behavior over time.
Results from the Youth Survey indicate that teens showed healthier attitudes toward drug use, but increased drug use behavior over time.
It may be that the program is most effective in impacting youth attitudes, not behaviors related to drug use. Research suggests that
appropriate attitudes is a first step towards changing behavior.

Writing Tips
Use qualitative data to add depth to quantitative data.
Program records indicate that after a mid-year dip in attendance rates, regular participation exceeded expectations.
Program records indicate that after a mid-year dip in attendance rates, regular participation exceeded expectations. A focus group conducted with program staff at the end of the school year revealed that a gang violence incident on campus resulted in the temporary suspension of all after school activity programs. This corresponds with the dip in our program’s attendance rates.

Try Your Hand Activity: Writing Up Findings

Guide: Step 4
Describe how evaluation was conducted Include general and detailed findings Consider using graphics
Spread the WordUtilizing & Disseminating Findings

One-pager
Develop a 1 page summary to:– describe program – key impacts– recommendations or next steps

Sample: Excerpt of One Page Summary

Program Improvement
Identify strengths and weaknesses Use findings to inform strategic planning Regularly report impact to project staff to for
morale boosting sessions Highlight modifications made based on
lessons learned

Sample:Excerpt of Strengths & Weaknesses
Recruiting and Screening
Strengths ChallengesAt-Risk
•Very smooth getting at-risk youth – returning protégés already fit the profile•There were no problems recruiting at-risk youth, because we were working with that population anyways. •The at-risk group is attracted to FNL anyway, we had a wonderful group. It was trying at times, but they were paired with mentors that matched them so well – I saw some great moments.
•There were a lot more discipline problems such as lack of interest and lack of involvement.•There appears to be a stigma at this site about staying on campus after school hours•The screening process made finding these individuals more difficult because there are few students at the school who fit the criteria of a committed, good student who is not involved in conflicting extra-curricular activities

Reporting to Funders
Use the specified format Address the original grant initiatives as focal
point Use language that links back to original
proposal Highlight lessons learned Review sustainability

Sharing with Key Stakeholders
Be concise Use very basic statistics & graphics Make information accessible to broad audience Use exciting/interesting format Acknowledge contributions Highlight steps toward the future
For Policy-makers:
make specific recommendations

Get the News Out
Newsletter Press Release Newspaper Articles Local Television Station Organized meetings (program staff; city
council; school board; PTA)
Guide: Step 5
Audience-specific format

Activity:Ask the Wizard

Finally…
You now know how to:
Set up, code, enter, and clean data Translate data into findings
Add context and interpretation to findings Disseminate evaluation findings

The End.
(woo hoo!)


