45th Congress of the European Regional Science Association Land Use and Water Management in a Sustainable Network Society, 23-27 August 2005, Vrije Universiteit Amsterdam Authors: Ivana Rasic Bakaric ([email protected]), Marijana Sumpor ([email protected]), and Jelena Sisinacki ([email protected]) Institute of Economics, Zagreb Trg J.F. Kennedya 7, 10000 Zagreb, Croatia Governance Structures for Local Economic Development in Croatia - Abstract - Who should take care of local economic development in Croatia? This question seems trivial; however, there are still some open questions. According to current legislation, local economic development is an administrative task of the 21 counties, the current units of regional self- government. On the other hand, the cities and municipalities as units of local self-government regularly get involved in economic development activities, though this is not directly defined in the legislation. There is a contradiction concerning development capacity of cities and counties. Cities attract population and economic activity and are usually stronger than counties in terms of financial and human resources that are necessary for economic development activities. This research questions if the existing administrative-territorial setup and functions of counties in Croatia correspond to the needs of economic growth and development on local level. It is also intended to get some insights from concepts that derive from trade theory, location theory and economic geography. Governance relations between bigger cities and counties in fostering local economic development in Croatia will be examined. For this purpose, local and regional data will be analyzed and through the discussion on existing governance structures, qualitative insights on the appropriateness of the current situation will be presented. The main goal of this research paper is to find quantitative and qualitative justification for an appropriate governance structure for fostering local economic development in Croatia. 1 Key words: Local governance, local economic development, development capacity JEL: O 18, R 11, R 12 1 An earlier version of this paper has been presented at the OECD international conference on «Local Development and Governance in Central, East and South-East Europe», OECD LEED Trento Centre for Local Development, Trento, Italy, June 2005.
Transcript
45th Congress of the European Regional Science Association
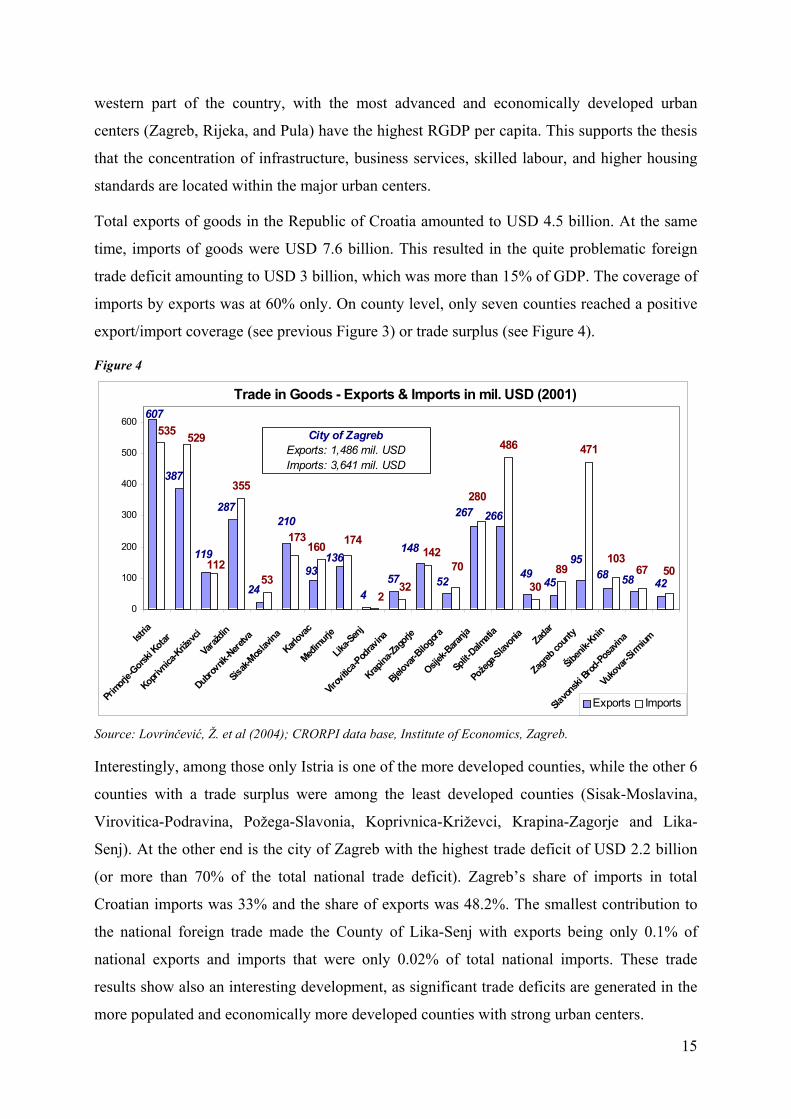
Land Use and Water Management in a Sustainable Network Society,
Institute of Economics, Zagreb Trg J.F. Kennedya 7, 10000 Zagreb, Croatia
Governance Structures for Local Economic Development in Croatia
- Abstract -
Who should take care of local economic development in Croatia? This question seems trivial; however, there are still some open questions. According to current legislation, local economic development is an administrative task of the 21 counties, the current units of regional self-government. On the other hand, the cities and municipalities as units of local self-government regularly get involved in economic development activities, though this is not directly defined in the legislation. There is a contradiction concerning development capacity of cities and counties. Cities attract population and economic activity and are usually stronger than counties in terms of financial and human resources that are necessary for economic development activities.
This research questions if the existing administrative-territorial setup and functions of counties in Croatia correspond to the needs of economic growth and development on local level. It is also intended to get some insights from concepts that derive from trade theory, location theory and economic geography. Governance relations between bigger cities and counties in fostering local economic development in Croatia will be examined. For this purpose, local and regional data will be analyzed and through the discussion on existing governance structures, qualitative insights on the appropriateness of the current situation will be presented. The main goal of this research paper is to find quantitative and qualitative justification for an appropriate governance structure for fostering local economic development in Croatia. 1
Key words: Local governance, local economic development, development capacity
JEL: O 18, R 11, R 12
1 An earlier version of this paper has been presented at the OECD international conference on «Local
Development and Governance in Central, East and South-East Europe», OECD LEED Trento Centre for Local
Development, Trento, Italy, June 2005.
2
Introduction
The thesis of this paper rests on the assumption that the existing administrative-territorial
setup and functions that derive from the related legislation in Croatia are not in accordance
with the needs of economic growth and development on local level. The main goal of this
research paper is to find quantitative and qualitative justification for an appropriate
governance structure for fostering local economic development in Croatia. With the aim to
investigate current local governance problems in Croatia, the focus of this research is on
relations between bigger cities and counties in promoting and fostering local economic
development.
Croatian counties are responsible for fostering and promoting economic development on local
level. At the same time, even though not formally stated in any of the fundamental legal
documents, most of the cities (towns) and many municipalities are very active in promoting
local economic development. Naturally, the stronger cities and towns are the driving forces in
local economic development in Croatia, whereby the competence of the counties in this
domain can be questioned. In practice, governance problems are visible and can be seen
through conflicts, competitive behaviour based on local politics, lacking communication and
cooperation, causing waste of scarce resources, inadequate support, duplication and neglect of
those who really need support. Regional development theories such as trade theory, location
theory and new economic geography can give some insight into spatial aspects of economic
activities, as well as more contemporary approaches to polycentric development that are
currently discussed among experts and academics in the European Union (EC, 2004). Besides
the economic focus on development such as promoting growth and competitiveness, the
adequacy of the institutional structures and modes of governance as a crucial development
aspect is now widely recognized.
The theoretical overview is presented in the first chapter of this paper. The second chapter is
devoted to the institutional analysis of the existing administrative-territorial setup, functions
and competences of the local governments in Croatia. This is the basis for identifying
shortcomings of the current governance structures for local economic development. The
analysis of economic activity on local level is presented in the third chapter of this paper.
Whereby, due to lack of data on the level of local self-governments, the analysis is based on
data for counties. According to theory as well as practice, some units of local self-
government, particularly bigger cities, attract population and economic activity and have
therefore more strength and capacity in supporting economic development activities than
3
counties. This is mostly evident through fiscal data, which exists for all local governments.
Therefore, the fourth chapter is devoted to the analysis of fiscal capacity for local economic
development. The fiscal analysis is focused on the case of three counties and their respective
county centers (economic and/or administrative), namely Sisak-Moslavina County (central
Croatia); Šibenik-Knin County (southern Croatia); and Virovitica-Podravina County (eastern
Croatia). The fifth chapter is devoted to the concluding discussion on the local economic
governance structures in Croatian counties and their internal economic development relations
with the county centers, whereby the insights gained from the analytical part on the
appropriateness of the current situation are presented.
1. Some theoretical insights for local and regional economic development
1.1 Specificities of locations in regional development theory
In theory, development relations between economic centers and its regions are the central
consideration of the very broad spectrum of local and regional economic theories. These
theories evolved primarily during the 20th century embedded in trade theory, location theory
and economic geography. Even though these theories were criticized and even considered as
not adequate in certain periods towards the end of the past century, a certain revival of the
basic concepts is occurring again, particularly in Europe. They are viewed now through a new
lens in the context of spatially oriented economic development policy that focuses on
competitiveness, networking and collaboration. In addition, these developments can also be
recognized in the concepts of territorial cohesion and polycentric development which are put
forward by European planning and regional development experts and scientists.
Some of the old theories still provide arguments for development strategies and many
strategies target sectoral or regional poles. According to Myrdal’s (1957) cumulative
causation theory, some markets and places or nodes attract capital and skilled labour force
accumulating competitive advantages compared to other locations. He also stressed that less
developed regions can have advantages from growth in developed regions due to spread
effects that derive from diffusion of innovations in lagging regions and rise in export markets
for products from these lagging regions. However, there is a tendency that the benefits will be
set off by backwash effects that occur because of movement of capital and labour from the
lagging regions towards the more prosperous regions. Dawkins (2003) explained that the
results of free trade among regions actually reinforce the process of cumulative causation,
whereby growth is further catalyzed in the more developed regions on expense of the lagging
regions. Another famous theory is Perroux’s (1950) growth pole theory based on his
4
perception of firms and industries viewed in space as a web being linked by centripetal forces.
According to growth pole theory, economic development strategies should focus on
investments in a certain growth pole or sector, in order to initiate development. He also
suggested that through adequate policies urban centers in a multi-regional context can become
growth poles. Growth pole theory was also criticized because of unbalanced benefits that
derive from implementation of such strategies as benefits initially flow into the growth pole,
but at the relative expense of other parts of the economy. Consequently, groups in other
sectors or parts of the region or national economy become impatient, since benefits trickle
down into sectors or regions with a certain time lag. Dawkins however stressed that the
application of growth pole strategies was abandoned during the 1980’s because of
implementation failures of such policies which were supposed to initiate new growth in
lagging regions. The emphasis on the process of structural change within growth poles
through time was missing.
A further significant contribution came from Hirschman (1958) who focused on backward
and forward linkages between firms, and made his research on how polarized development
could benefit a growing region and its environment. He also put forward the view that growth
in a developed region produces favourable trickle-down effects in lagging regions because
developed regions buy their products and employ their labour force. A further often
mentioned model is Friedmann’s (1966) center-periphery model. He referred to the traditional
export base theory of economic growth and stressed the important role of local politics,
economy and leadership as well as the impact of the development history of the region.
According to Friedmann, big urban areas have actually an initial advantage in competing for
new growth because of the advantages of lower urbanization costs of such economies.
According to this theory, all factors are in favour of central regions, and regions outside the
center differ according to their relative autonomy of their economy.
Location theory, which was initially introduced by Alfred Weber in 1929 and later developed
in the 1960s by Walter Isard, questions primarily through mathematical models why
economic activity is not equally spatially distributed and looks at factors that firms consider
when selecting a certain geographic location. According to this theory firms locate in the way
as to minimize costs, maximize opportunities to reach markets in order to maximize profits.
Stimson, Stough and Roberts (2002) added that significant attention was given to transport
costs, labour costs and other production costs, scale of operation and agglomeration
economies. Besides these factors that are still important, over time, attractiveness and
5
business climate, as well as networking possibilities became also important for firms in their
decisions on where to locate. A further important theory is agglomeration theory or external
economies of scale. Armstrong and Taylor (2000) explained that agglomeration economies
emerge on the basis of economic association of a big number of economic activities that do
not necessarily need to be within the same industry. Concentrations of a big number of firms
are created that together serve various industries, including for example urban transport and
communication, well organized labour markets, social and public services, cultural and
recreational activities, firms organized in clusters and geographic concentration of innovative
activities. All this contributes to the attractiveness of existing centers or growth poles creating
a cumulative process of growth. They recognized also that this can have negative impacts on
the less developed regions through backwash effects (e.g. skilled labour migrating to more
prosperous regions), causing negative cumulative causation effects. In addition, polarization
and fast growth can also result in external diseconomies (or negative externalities) such as
congestion, pollution, rising factor costs and living expenses.
An older often quoted theory is Christaller’s central place theory published in 1933, which
rests on the notion that centralization is a natural principle of order and that human
settlements follow it. He suggested that there are laws determining the number, size and
distribution of towns. This theory relied on two concepts, i.e. every good or service will have
a range (maximum distance consumers are prepared to travel to acquire goods) and a
threshold (minimum market needed to bring about the selling of a particular good or service).
According to Christaller, urban settlements are ordered according to a hierarchical structure of
central places of various sizes and functional complexity, and in every larger region exists a
systematic spatial order of central places (urban settlements). The various functions, which
these central places offer, reflect the variety of economic activity that serves the surrounding
population. The main criticism of this theory is that it was based on the assumption of
isotropic places in which density, purchasing power and consumer preferences are
homogenous. In reality, density and socio-economic characteristics of consumers significantly
differ through space.
One of the newer models is Krugman’s (1991) core-periphery model embedded in new
economic geography which is linked also to newer trade theories. He stressed that the regional
clustering of economic activities occur due to a combination of centrifugal (immobile factors,
land rent/commuting, congestion and other pure diseconomies) and centripetal forces
(linkages, thick markets, knowledge spillovers and other pure external economies). The
6
pattern of core and periphery is defined in the way that the total manufacturing industry will
be located in the core, while the total agricultural production will be located at the periphery.
This is sustainable with big internal economies of scale, low transport costs, and with a large
share of regional population which is employed in the manufacturing industry.
The briefly presented theoretical overview represents the fundaments of contemporary
regional development theory, though the focus has shifted more towards the complex relations
of competitiveness, cohesion and sustainability. For the purpose of this paper the main
theoretical points such as concentration and agglomeration, as well as the importance of
institutions and structural considerations are mentioned. Further, the economic importance of
certain locations (regions) and their developmental effects (positive as well as negative) on
the surrounding territory are recognized. The next section is devoted to the second but crucial
aspect of local and regional economic development, namely the theoretical background of the
popular concept of governance.
1.2 The levels of governance
Though there are numerous definitions of governance today, depending also on the context,
one of the often quoted definitions is the one put forward by UNDP. Accordingly, governance
can be defined as “the exercise of political, economic and administrative authority to manage
a society's affairs” (UNDP, 1997). While the economic, political and administrative aspects of
governance are often the focus, recognition of the need for a more holistic concept is growing.
Therefore, governance comprises mechanisms, processes and institutions through which
collective decisions are made and implemented, citizens, groups and communities pursue their
visions, articulate their interests, exercise their legal rights, meet their obligations and mediate
their differences. As defined in this manner, it emphasizes the nature and quality of
interactions among social actors and between social actors and the state.
Scientific and professional discussions on the issue of multi-level governance have intensified
during the 1990’s that can be linked to the integration and expansion processes of the
European Union. With the formulation of common policies on EU level, more complex
interrelations and requirements for the implementation of development policies between
different levels of government are occurring. Carmichael (2002) stressed that “government”
became more variegated within different levels of government (i.e. horizontally differentiated
or provided by multiple agencies). In addition, government is also geographically more
diverse (i.e. vertically differentiated or conducted on multiple levels). Therefore, multi-level
governance stresses the complexity of policy making, implementation and responsibilities
7
among different governmental and societal actors in their activities on supranational, national,
regional, local as well as quasi-governmental institutions. While government activities go
more in the direction of regulating public activities and to a lesser extent the redistribution of
funds. Changes in governing towards multi-level governance are primarily the result of
changes in the modes and nature of public sector activities. Multi-level governance has
changed the relation between policies and service delivery, and the emergence of different
tiers of government complicated the process of policy making. Therefore, the coordination of
services through several functional areas and levels of government is becoming more
problematic. Tensions are also growing between the static territorial space and dynamic
functional space creating also difficulties in governing. Hooghe and Marks (2003) pointed out
that the dispersion of governance throughout several jurisdictions actually stimulates
flexibility. They also stressed that centralised government can not answer all needs that derive
from variety. While through multi-level governance decision makers can adjust the levels of
governance and provide better for requirements that derive from heterogeneity.
Local and regional economic development (LED), as defined by the World Bank (2001) is a
process in which local and regional governments co-operate with the public and business
sector as well as with the civil society with the aim to facilitate better conditions for the
economic growth and the creation of employment. It offers local and regional government, the
private sector, the non-profit sectors and the local community the opportunity to mutually co-
operate in order to improve the local economy. LED encompasses many different disciplines,
such as planning, economics, and marketing. It also encompasses many local and regional
government and private sector functions including planning, infrastructure provision, real
estate development and finance. Good governance on the local level as defined by Romeo
(2002) is an institutional system for managing local public affairs, characterized by three
critical dimensions:
Performance of the local authorities (fiscal effort and discipline, allocative and
operational efficiency) in managing public resources and discharging their responsibilities
for delivery of economic and social services, protection of the environment and
management of natural resources, and promotion of economic development;
Participation of organized and individual citizens in local public sector decision-making,
through mechanisms that supplement and enhance, rather than replace or contradict, the
functioning of the institutions of democratic representation; and
8
Partnership between local authorities, civil society organizations and private sector units
for the provision and production of local collective goods and services.
He stressed also that the adoption of good local governance practices depends upon changes
in the policy, legal and regulatory framework governing political, administrative and fiscal
decentralization of public sector powers, responsibilities and resources, and the role and status
of civil society and private sector associations and organizations; as well as the build up of
local governments’ capacity along three dimensions: individual, institutional and systemic
capacity. Importantly, the build up of local government capacity is understood as a demand-
driven process. Crucial aspects of this process are the creation of financial and other
incentives for local governments to invest in the building of their own capacity, and the
establishment of clear local government accountability both “upward” to the national level
and “downward” to their constituencies with related systems for administrative and social
monitoring and auditing. As it is expected that good local governance has impacts on
improved services delivery and local economic development, it is evident that it is
complementary to and not in conflict with the local self-government functioning. Having a
good legislative framework in place for local self-governments is, although fundamental, only
one precondition for local development. Another dimension to be considered is how do local
self-governments work with this legislation, how do they practically implement all the rights
and responsibilities they have. The next part is hence devoted to the institutional structures for
governance in Croatia.
2. The Croatian institutional framework for local economic governance
2.1 The administrative-territorial structure
Formed in the early 1990s Croatia is a relatively new state and is consequently in the process
of local and regional reformation. This includes not only changes in administrative and
territorial arrangements, but also reforms connected with the decentralisation and
concentration-reduction issues. Furthermore, Croatia’s application to the European Union has
also initiated numerous other adjusting activities.
The legislative framework of the local and regional self-government in Croatia was
established in 1992 with the introduction of the local government system. In the following
years, different reforms of the territorial and institutional framework occurred. Consequently,
in 2001 a new Law of Local and Regional Self-Government (LLRSG) was adopted, where
counties were clearly defined as the units of regional self-government, while cities and
9
municipalities remained units of local self-government. Today, the Republic of Croatia is a
unitary state with 20 counties referred to as regions, and the capital city of Zagreb, which has
a County and City status. Sumpor (2004) stressed that until 2001 counties had dual functions
and were primarily responsible for performing delegated tasks from the national level, while
neglecting to a certain extent their own self-government role. The existence of basically two
kinds of public administrations on county level, i.e. the devolved RSGs and the
deconcentrated national government offices on county level, created a somewhat unclear
institutional structure on this level of government. Even though counties are referred to as
regional governments in Croatian legislation, they are actually too small to be considered as
regions in European terms, and belong in fact to the local government level (NUTS III level).
As Croatia is in the preparatory process for accession to the European Union, the Croatian
Central Bureau of Statistics (CBS) initiated a consultation process on possible scenarios for
dividing Croatia into NUTS II regions. Scenarios ranging from one, four or five regions are
still discussed in Croatia. Statistical regions would be comprised of a number of
administrative regional units, i.e. counties. But, a national consensus and decision on the most
adequate division can only be achieved through the national political process.
The Local Self-Government (LSG) level is comprised of 124 cities or towns and 426
municipalities, while the precise number of LSGs increases frequently (CBS, 2004). Besides
the major cities in Croatia such as Zagreb, Split, Rijeka, Osijek, or Varaždin most of the cities
are actually towns. However, the terminology in the Croatian legislation does not make a
distinction between these two terms. The city or town is a unit of local self-government with
more than 10,000 inhabitants, constituting a unitary urban, historical, natural, economic and
social space. The vast majority of towns have less than the minimal number of inhabitants,
since the Law prescribes a list of exemptions under which a municipality can gain a town
status. The municipality is a unit of local self-government, consisting of the territories of
several inhabited places representing a natural, economic and social entity, and which is
connected by the common interests of its inhabitants.
Decentralisation is based on three core principles of local government: autonomy (or liberty);
democracy (or participation); and, effectiveness. The structure of territorial organisation that
can be observed across different countries may be viewed as a reflection of the national focus
on one of these values over the others. Thus, a large number of smaller local units can be
viewed as a preference for autonomy or democracy, while fewer, larger local units would tend
to express the value of effectiveness. (Pigey et al., 2002)
10
2.2 The size and population of units on different levels of government
The Republic of Croatia covers 56.5 thousand km2 of continental surface and has a population
of 4.4 million inhabitants (Census, 2001). The total number of 571 local and regional
government units in comparison with the population of 4.4 million does not say much. But
knowing that from 1990 the number of LSGs increased five times and that it constantly
increases regardless of the fact that many of the existing LSGs are unable to fulfil their
functions (many being highly dependent on central government grants, it can be stated that
this is not sustainable in the long run.
The internal structure of distribution of local governments by population size is an important
factor to consider. The Croatian population density average is 78 inhabitants per square
kilometre. The analysis of the county organization further reveals significant differences
between them (see Figure 1):
Figure 1
Source: Republic of Croatia, Census 2001.
The most densely populated county is the Croatian capital city of Zagreb (779,145
inhabitants), then followed by the County of Međimurje (118,426 inhabitants). The lowest
population density has County of Lika-Senj (53,677 inhabitants). The population size of units
of local self-government also varies widely, whereby approximately 70% live in cities or
towns (urban) and 30% in municipalities (rural). Further, according to the Census 2001 data
only four cities have more than 100,000 inhabitants. There are also 28 municipalities that
Population density and % of population in county centres (2001)
147
116102 101
87 85 80 73 72 69
46 44 39 38
10
162
424750
84
0
20
40
60
80
100
120
140
160
180
Međim
urje/ Č
akovec
Varaž
din/ V
araždi
n
Krapin
a-Zag
orje/ K
rapina
Split-D
almatia
/ Split
Zagre
b cou
nty/ V
elika G
orica
Slavo
nski B
rod-Po
savina
/ Sl. B
rod
Primorj
e-Gors
ki Kota
r/ Rijek
a
Vuko
var-Si
rmium
/ Vink
ovci
Osijek-B
aranja
/ Osije
k
Istria
/ Pula
Kopri
vnica-
Križev
ci/ Ko
privnic
a
Dubrov
nik-Nere
tva/ D
ubrovn
ik
Bjelov
ar-Bilog
ora/ B
jelova
r
Pože
ga-Sl
avonia
/ Pože
ga
Virov
itica-P
odrav
ina/ V
iroviti
ca
Zada
r/ Zad
ar
Sisak-
Moslavi
na/ S
isak
Karlo
vac/ K
arlova
c
Šiben
ik-Knin
/ Šibe
nik
Lika-S
enj/ G
ospić
No. of inh./km 2
0%
10%
20%
30%
40%
50%
County-density County centre -Inhabitants
City of ZagrebDensity: 1,217 inh./km 2
11
have less than 1,000 inhabitants. But regardless of the actual size, LSGs have the same
responsibilities and accomplish the same functions.
The percentage of population living in county centres indicates concentration of urban
population. Five out of 20 counties (except City of Zagreb) have more than 40% of population
concentrated in county’s centre. The regional gross domestic product (RGDP) estimates by
counties show great differences between counties. For example, 53.1% of the national GDP
was produced in only 4 counties: City of Zagreb (30.1%), County of Primorje-Gorski Kotar
(8.1%) and County of Split-Dalmatia (7.9%) and County of Istria (6.3%).
2.3 Functions of local and county governments in Croatia
According to the LLRSG, units of local self-government should perform tasks of local
importance, which directly address the needs of citizens, and which are not assigned to state
bodies by the Constitution or by law. It is interesting to note that economic development, as a
task is not explicitly mentioned as a task of local government, but as a task of counties.
However, LED can be considered as a task of local importance. Croatia has a significant
number of municipalities that are actually far too weak to perform legally required functions
and tasks on their own. Such municipalities regularly rely on support and transfers from
higher levels of government. The regional self-governments, i.e. counties should perform
tasks of regional importance, especially tasks that relate to: education; health care; spatial
planning; economic development; transit and transport infrastructure; development of
educational, medical, social and cultural institutions. In addition, cities that have more than
30.000 inhabitants can take over some of the county services, if they have sufficient resources
for their provision. In 2001, as a part of the ongoing decentralization process, 32 of the
stronger local and all regional self-governments gained greater responsibilities in education,
health and social care, for which they receive also fiscal support through an equalisation fund.
The LLRSG only lists general mandatory functions of local and regional governments. While
detailed responsibilities are defined in a broad number of special laws and by-laws. However,
due to the vast number of such laws, by-laws and regulations, frequent changes, amendments
as well as new regulations, difficulties occur in the implementation on local level. Many of
these regulations are conflicting, contradictory, lacking of transparent financial flows and are
often neglected by the responsible levels of government, leading to poor or even no provision
of specific public services. The reason for this derives primarily from the fact that the many
shared responsibilities between the various levels of government, from national to local, are
not clearly defined. Therefore, it is useful to gain a better understanding on the nature of
12
various functions. According to Sumpor (2004), functions of local self-governments can be
categorised into three main groups, which can be:
the sole responsibility of local governments, e.g. pre-school, housing and utilities – the
delivery of such services depends entirely on own fiscal and human resources of the local
government;
shared responsibility with regional governments, e.g. recreation, culture and religion – the
delivery of such services depends on the capacities of the local as well as the regional
governments, particularly their cooperation and communication;
shared responsibility with the regional as well as central government, e.g. general public
services, elementary education, social security and welfare, mining, industry and
construction, roads, other economic affairs and services – the delivery of such services
depends very much on bottom-up and top-down relations.
All three groups show specific needs and problems of local governments in providing public
services according to their functional responsibility. Major problems arise when local
governments depend on other levels of government. If the problem of fragmentation is taken
into account as well as unclear legislation, significant efficiency problems occur. Also, the
still quite centralized Croatian Government, it is impossible to target all needs through
standard top-down decisions. While communication on real needs from below is difficult due
to inexisting mechanisms. On the other hand, counties, as an intermediary level between the
local and the national level, are administratively as well as fiscally still too weak to be the
balancing level in the provision of public services. The mentioned problems are less pressing
in the more developed, administratively and economically stronger local governments (i.e.
cities/towns), which are also more eager to take over new responsibilities.
3. Analysis of the local economies and economic governance in Croatia
3.1 Employment and active companies across sectors and counties
First of all, economic data on county level has to be treated carefully and the results are only
indications, as most of the data is based on estimates. Also, data on the level of local self-
governments is not collected by the Croatian central bureau of statistics. The lack of local data
is a serious problem faced in Croatia and is an obstacle for performance measurement on any
level of government. However, in this chapter the available economic data on county level is
presented, while in the next chapter some indications on the relations between counties and
cities will be presented based on fiscal results available for all local government units.
13
The structure of employed persons by groups of activity shows that in 2001 most employed
persons or 43.1% of total employment by sectors were in services (incl. construction,
wholesale and retail trade, hotels, restaurants, transport and communications, financial and
real estate services), and another 24.2% were employed in the public sector. While, 29.4%
worked in the secondary sector (manufacturing) and only 3.3% in the primary sector
(agriculture). When analyzing the employment structure across counties, significant
deviations from the national averages can be seen in the least developed counties like
Vukovar-Sirmium, Virovitica-Podravina and Lika-Senj, which show also higher shares of
employment in the primary sector (above 11%).
The unemployment rate in the Republic of Croatia, i.e. the ratio of unemployed persons to the
total economically active population, was 20.4 % in 2001. At counties’ level there were
marked deviations from this average figure as show in Figure 2.
Figure 2
Source: Republic of Croatia, Central Bureau of Statistics, Statistical Yearbook 2002.
An unemployment rate above national level was arrived at by ten counties; it varied between
22.6% in County of Lika-Senj and 31.1% in County of Šibenik-Knin. The lowest
unemployment rate was reached in the County of Međimurje (12.1%) and County of Krapina-