214
Government at a Glance 2015

Consult this publication on line at http://dx.doi.org/10.1787/gov_glance-2015-en.
This work is published on the OECD iLibrary, which gathers all OECD books, periodicals and statistical databases.Visit www.oecd-ilibrary.org for more information.
Government at a Glance 2015Government at a Glance 2015 provides the latest available data on public administrations in OECD countries. Where possible, it also reports data for Brazil, China, Colombia, India, Indonesia, Latvia, the Russian Federation, South Africa and Ukraine. This edition contains new indicators on public sector integrity, regulatory governance, the role of centres of government, digital government, budget practices and procedures, open government data, and a more comprehensive set of data on the level of access, responsiveness and quality of services to citizens. This edition also includes a special section on the impact of budget constraints on employment and compensation reforms in governments since 2009.
Each indicator in the publication is presented in a user-friendly format, consisting of graphs and/or charts illustrating variations across countries and over time, brief descriptive analyses highlighting the major findings conveyed by the data, and a methodological section on the definition of the indicator and any limitations in data comparability. For the first time, a database containing qualitative and quantitative indicators on government is available on line. It will be updated twice a year as new data are released. The database, countries fact sheets and other online supplements can be found at www.oecd.org/gov/govataglance.htm.
Contents
Chapter 1. Inclusive governments for a more inclusive society
Chapter 2. Public finance and economics
Chapter 3. Public employment
Chapter 4. Institutions
Chapter 5. Budgeting practices and procedures
Chapter 6. Human resource management
Chapter 7. Public sector integrity
Chapter 8. Regulatory governance
Chapter 9. Public procurement
Chapter 10. Digital government
Chapter 11. Core government results
Chapter 12. Serving citizens
isbn 978-92-64-23346-1 42 2015 08 1 P
Govern
ment at a G
lance 2015
Government at a Glance 2015


Government at a Glance2015

This work is published under the responsibility of the Secretary-General of the OECD. The
opinions expressed and arguments employed herein do not necessarily reflect the official
views of OECD member countries.
This document and any map included herein are without prejudice to the status of or
sovereignty over any territory, to the delimitation of international frontiers and boundaries
and to the name of any territory, city or area.
ISBN 978-92-64-23346-1 (print)ISBN 978-92-64-23347-8 (PDF)ISBN 978-92-64-23494-9 (HTML)
Government at a GlanceISSN 2221-4380 (print)ISSN 2221-4399 (online)
The statistical data for Israel are supplied by and under the responsibility of the relevant Israeli authorities. The useof such data by the OECD is without prejudice to the status of the Golan Heights, East Jerusalem and Israelisettlements in the West Bank under the terms of international law.
Photo credits: Chapters 2 to 12 © Shutterstock.com/kentoh.
Corrigenda to OECD publications may be found on line at: www.oecd.org/about/publishing/corrigenda.htm.
© OECD 2015
You can copy, download or print OECD content for your own use, and you can include excerpts from OECD publications, databases and
multimedia products in your own documents, presentations, blogs, websites and teaching materials, provided that suitable
acknowledgement of OECD as source and copyright owner is given. All requests for public or commercial use and translation rights should
be submitted to [email protected]. Requests for permission to photocopy portions of this material for public or commercial use shall be
addressed directly to the Copyright Clearance Center (CCC) at [email protected] or the Centre français d’exploitation du droit de copie (CFC)
Please cite this publication as:OECD (2015), Government at a Glance 2015, OECD Publishing, Paris.http://dx.doi.org/10.1787/gov_glance-2015-en

FOREWORD
Foreword
In this post-crisis period, governments in OECD countries continue to play an active role in the
economy while undertaking major reforms to increase value for money and improve the access and
quality of public services. The set of indicators presented in Government at a Glance 2015 provides
countries with solid evidence to support the design and implementation of public sector reforms and
good practices. It presents indicators on the entire production chain of government, including
resources (financial and human), practices and procedures and key trends in performance and
results. The opening chapter offers some general policy insights emerging from the data presented in
the publication. This edition focuses on the role of governments in fostering inclusive growth and a
more inclusive society.
This work was led by Zsuzsanna Lonti of the OECD Public Governance and Territorial
Development Directorate (GOV) under the direction of Rolf Alter and Edwin Lau. It is a major
component of GOV’s work programme, which seeks to help governments at all levels design and
implement strategic, evidence-based and innovative policies to strengthen public governance,
respond effectively to diverse and disruptive economic, social and environmental challenges and
deliver on governments’ commitments to citizens. The publication was drafted by
Santiago González, Guillaume Lafortune, Alessandro Lupi and Daniel Sanchez-Serra. Major drafted
contr ibut ions were received from Luiz De Mel lo, Edwin Lau, Stéphane Jacobzone,
Julio Bacio Terracino, Lisa Von Trapp and Paloma Baena Olabe (Chapter 1: Inclusive government for
a more inclusive society); Luiz De Mello (Chapter 2: Public finance and economics); Daniel Gerson,
Tatyana Teplova and Pinar Guven (Chapter 3: Public employment and compensation);
Andrew Davies and Andrea Urhammer (Chapter 4: Inst i tut ions) ; Ronnie Downes,
Ian Hawkesworth, Lisa Von Trapp, Camilla Vammalle and Ihssane Loudiyi (Chapter 5: Budgeting
practices and procedures); Daniel Gerson, Christoph Demkke and Alice Lazzati (Chapter 6: Human
resource management); Janos Bertok, Julio Bacio Terracino, Maria-Emma Cantera, Jovana Blagotic,
Yukihiko Hamada, Minjoo Son (Chapter 7: Public sector integrity); Céline Kaufmann,
Christiane Arndt, Faisal Naru, Daniel Trnka, Manuel Flores Romero, Rebecca Schultz (Chapter 8:
Regulatory governance); Janos Bertok, Julio Bacio Terracino, Paulo Magina, Maria-Emma Cantera,
Minjoo Son (Chapter 9: Public procurement); Barbara Ubaldi, Arthur Mickoleit and Ryan Androsoff
(Chapter 10: Digital government); Tatyana Teplova and Pinar Guven (Chapter 12: Serving citizens).
We thank Kate Lancaster, Katherine Kraig-Ernandes, Lia Beyeler and Laura Boutin for their help in
preparing the document for publication.
This publication is the result of contributions from a wide range of sources and expertise. It
benefited from inputs provided by the OECD Public Governance Committee and the Government at a
Glance Steering Group (details in Annex F); the OECD Committee on Statistics; the Public
Employment and Management Working Party; the Working Party of Senior Budget Officials; the
OECD Expert Group on Conflict of Interest; the Working Party of Senior Digital Government Officials
(E-Leaders); the Working Party of the Leading Practitioners on Public Procurement; the Expert Group
on Innovative and Open Government; and the Working Party on Territorial Indicators. Valuable
comments have also been received from Peter Van de Ven, Jennifer Ribarsky, Catherine La Rosa-
GOVERNMENT AT A GLANCE 2015 © OECD 2015 3

FOREWORD
Elkaim and Isabelle Ynesta (OECD Statistics Directorate); Michael Hewetson and Oliver Petzold
(Centre for Tax Policy), Gaetan Lafortune, (OECD Directorate for Employment, Labour and Social
Af fa i rs ) , Cor inne Heckman, Soumaya Maghnouj , Ignac io Mar in , Jor is Ranching ,
Katarzyna Kubacka, Julie Bélanger, Sophie Vayssettes (OECD Directorate for Education),
Yvan Guillemette and Sylvie Toly (OECD Economics Directorate), Messaoud Hammouya
(International Labour Organization, Geneva, Switzerland) and Zoltan Mikolas (Consultant).
GOVERNMENT AT A GLANCE 2015 © OECD 20154

TABLE OF CONTENTS
Table of contents
Preface . . . . . . . . . . . . . . . . . . . . . . . . . . . . . . . . . . . . . . . . . . . . . . . . . . . . . . . . . . . . . . . . . . . . 8
Executive summary . . . . . . . . . . . . . . . . . . . . . . . . . . . . . . . . . . . . . . . . . . . . . . . . . . . . . . . . . 11
Reader’s guide . . . . . . . . . . . . . . . . . . . . . . . . . . . . . . . . . . . . . . . . . . . . . . . . . . . . . . . . . . . . . 15
Introduction . . . . . . . . . . . . . . . . . . . . . . . . . . . . . . . . . . . . . . . . . . . . . . . . . . . . . . . . . . . . . . . 19
Chapter 1. Inclusive government for a more inclusive society . . . . . . . . . . . . . . . . . . . . . 25
Introduction. . . . . . . . . . . . . . . . . . . . . . . . . . . . . . . . . . . . . . . . . . . . . . . . . . . . . . . . . . . . 26
Towards an inclusive public sector: The importance of gender and age . . . . . . . . . 27
Inclusive policy-making processes. . . . . . . . . . . . . . . . . . . . . . . . . . . . . . . . . . . . . . . . . 31
Inclusive policies and results . . . . . . . . . . . . . . . . . . . . . . . . . . . . . . . . . . . . . . . . . . . . . 38
Conclusion . . . . . . . . . . . . . . . . . . . . . . . . . . . . . . . . . . . . . . . . . . . . . . . . . . . . . . . . . . . . . 47
Bibliography. . . . . . . . . . . . . . . . . . . . . . . . . . . . . . . . . . . . . . . . . . . . . . . . . . . . . . . . . . . . 47
Chapter 2. Public finance and economics . . . . . . . . . . . . . . . . . . . . . . . . . . . . . . . . . . . . . . . 51
General government fiscal balance . . . . . . . . . . . . . . . . . . . . . . . . . . . . . . . . . . . . . . . . 52
General government net saving . . . . . . . . . . . . . . . . . . . . . . . . . . . . . . . . . . . . . . . . . . . 54
General government structural balance . . . . . . . . . . . . . . . . . . . . . . . . . . . . . . . . . . . . 56
General government gross debt . . . . . . . . . . . . . . . . . . . . . . . . . . . . . . . . . . . . . . . . . . . 58
Financial net worth of general government . . . . . . . . . . . . . . . . . . . . . . . . . . . . . . . . . 60
Fiscal balance and debt by level of government. . . . . . . . . . . . . . . . . . . . . . . . . . . . . . 62
General government revenues . . . . . . . . . . . . . . . . . . . . . . . . . . . . . . . . . . . . . . . . . . . . 64
Structure of general government revenues. . . . . . . . . . . . . . . . . . . . . . . . . . . . . . . . . . 66
Revenue structure by level of government . . . . . . . . . . . . . . . . . . . . . . . . . . . . . . . . . . 68
General government expenditures. . . . . . . . . . . . . . . . . . . . . . . . . . . . . . . . . . . . . . . . . 70
Structure of general government expenditures by function (COFOG) . . . . . . . . . . . 72
Structure of general government expenditures by economic transaction. . . . . . . . 74
Expenditures structure by level of government . . . . . . . . . . . . . . . . . . . . . . . . . . . . . . 76
Government investment spending. . . . . . . . . . . . . . . . . . . . . . . . . . . . . . . . . . . . . . . . . 78
Production costs and outsourcing of general government . . . . . . . . . . . . . . . . . . . . . 80
Chapter 3. Public employment . . . . . . . . . . . . . . . . . . . . . . . . . . . . . . . . . . . . . . . . . . . . . . . . 83
Employment in the public sector . . . . . . . . . . . . . . . . . . . . . . . . . . . . . . . . . . . . . . . . . . 84
Women in public sector employment . . . . . . . . . . . . . . . . . . . . . . . . . . . . . . . . . . . . . . 86
Women in politics. . . . . . . . . . . . . . . . . . . . . . . . . . . . . . . . . . . . . . . . . . . . . . . . . . . . . . . 88
Chapter 4. Institutions . . . . . . . . . . . . . . . . . . . . . . . . . . . . . . . . . . . . . . . . . . . . . . . . . . . . . . . 91
Main institutional features of the centres of government in OECD countries. . . . . 92
Roles of the centres of government . . . . . . . . . . . . . . . . . . . . . . . . . . . . . . . . . . . . . . . . 94
Degree of influence of the centres of government. . . . . . . . . . . . . . . . . . . . . . . . . . . . 96
GOVERNMENT AT A GLANCE 2015 © OECD 2015 5

TABLE OF CONTENTS
Chapter 5. Budgeting practices and procedures . . . . . . . . . . . . . . . . . . . . . . . . . . . . . . . . . 99
Special feature: The fiscal sustainability challenge of health systems. . . . . . . . . . . 100
Performance-related budgeting and supreme audit institutions . . . . . . . . . . . . . . . 102
Cost benefit analysis of investment projects . . . . . . . . . . . . . . . . . . . . . . . . . . . . . . . . 104
Chapter 6. Human resource management . . . . . . . . . . . . . . . . . . . . . . . . . . . . . . . . . . . . . . 107
Special feature: Compensation reforms since 2008. . . . . . . . . . . . . . . . . . . . . . . . . . . 108
Special feature: Employment reforms in central government since 2008 . . . . . . . . 110
Chapter 7. Public sector integrity . . . . . . . . . . . . . . . . . . . . . . . . . . . . . . . . . . . . . . . . . . . . . . 113
Managing conflict of interest: Pre- and post-public employment . . . . . . . . . . . . . . . 114
Asset disclosure . . . . . . . . . . . . . . . . . . . . . . . . . . . . . . . . . . . . . . . . . . . . . . . . . . . . . . . . 116
Transparency and integrity in lobbying. . . . . . . . . . . . . . . . . . . . . . . . . . . . . . . . . . . . . 118
Whistleblower protection . . . . . . . . . . . . . . . . . . . . . . . . . . . . . . . . . . . . . . . . . . . . . . . . 120
Chapter 8. Regulatory governance . . . . . . . . . . . . . . . . . . . . . . . . . . . . . . . . . . . . . . . . . . . . . 123
Global trends in regulatory policy and governance . . . . . . . . . . . . . . . . . . . . . . . . . . . 124
Stakeholder engagement. . . . . . . . . . . . . . . . . . . . . . . . . . . . . . . . . . . . . . . . . . . . . . . . . 126
Regulatory Impact Analysis. . . . . . . . . . . . . . . . . . . . . . . . . . . . . . . . . . . . . . . . . . . . . . . 128
Ex post evaluation of regulation . . . . . . . . . . . . . . . . . . . . . . . . . . . . . . . . . . . . . . . . . . . 130
Governance of regulators. . . . . . . . . . . . . . . . . . . . . . . . . . . . . . . . . . . . . . . . . . . . . . . . . 132
Chapter 9. Public procurement . . . . . . . . . . . . . . . . . . . . . . . . . . . . . . . . . . . . . . . . . . . . . . . . 135
Size of public procurement . . . . . . . . . . . . . . . . . . . . . . . . . . . . . . . . . . . . . . . . . . . . . . . 136
Strategic public procurement . . . . . . . . . . . . . . . . . . . . . . . . . . . . . . . . . . . . . . . . . . . . . 138
E-procurement . . . . . . . . . . . . . . . . . . . . . . . . . . . . . . . . . . . . . . . . . . . . . . . . . . . . . . . . . 140
Central purchasing bodies. . . . . . . . . . . . . . . . . . . . . . . . . . . . . . . . . . . . . . . . . . . . . . . . 142
Chapter 10. Digital government . . . . . . . . . . . . . . . . . . . . . . . . . . . . . . . . . . . . . . . . . . . . . . . 145
Social media use by governments . . . . . . . . . . . . . . . . . . . . . . . . . . . . . . . . . . . . . . . . . 146
Digital government performance . . . . . . . . . . . . . . . . . . . . . . . . . . . . . . . . . . . . . . . . . . 148
Open government data . . . . . . . . . . . . . . . . . . . . . . . . . . . . . . . . . . . . . . . . . . . . . . . . . . 150
Use of e-government services by individuals and businesses . . . . . . . . . . . . . . . . . . 152
Chapter 11. Core government results. . . . . . . . . . . . . . . . . . . . . . . . . . . . . . . . . . . . . . . . . . . 155
Trust in government. . . . . . . . . . . . . . . . . . . . . . . . . . . . . . . . . . . . . . . . . . . . . . . . . . . . . 156
Redistribution of income . . . . . . . . . . . . . . . . . . . . . . . . . . . . . . . . . . . . . . . . . . . . . . . . . 158
Rule of law . . . . . . . . . . . . . . . . . . . . . . . . . . . . . . . . . . . . . . . . . . . . . . . . . . . . . . . . . . . . . 160
Public sector efficiency. . . . . . . . . . . . . . . . . . . . . . . . . . . . . . . . . . . . . . . . . . . . . . . . . . . 162
Public sector cost effectiveness . . . . . . . . . . . . . . . . . . . . . . . . . . . . . . . . . . . . . . . . . . . 164
Chapter 12. Serving citizens . . . . . . . . . . . . . . . . . . . . . . . . . . . . . . . . . . . . . . . . . . . . . . . . . . 167
The OECD serving citizens’ framework . . . . . . . . . . . . . . . . . . . . . . . . . . . . . . . . . . . . . 168
Citizen satisfaction with public services. . . . . . . . . . . . . . . . . . . . . . . . . . . . . . . . . . . . 170
Financial and geographic access to health care . . . . . . . . . . . . . . . . . . . . . . . . . . . . . . 172
Access to education . . . . . . . . . . . . . . . . . . . . . . . . . . . . . . . . . . . . . . . . . . . . . . . . . . . . . 174
Access to judicial systems and legal information . . . . . . . . . . . . . . . . . . . . . . . . . . . . 176
Responsiveness of health systems to patient needs . . . . . . . . . . . . . . . . . . . . . . . . . . 178
Responsiveness of schools to students’ needs . . . . . . . . . . . . . . . . . . . . . . . . . . . . . . 180
Responsiveness of judicial systems to citizen needs . . . . . . . . . . . . . . . . . . . . . . . . . 182
Quality of health care and patient safety . . . . . . . . . . . . . . . . . . . . . . . . . . . . . . . . . . . 184
Students’ performance and equity in education . . . . . . . . . . . . . . . . . . . . . . . . . . . . . 186
Effectiveness and fairness of judicial systems . . . . . . . . . . . . . . . . . . . . . . . . . . . . . . . 188
GOVERNMENT AT A GLANCE 2015 © OECD 20156

TABLE OF CONTENTS
Annex A. Implementation of the 2008 System of National Accounts . . . . . . . . . . . . . . . 191
Annex B. Methodology for revenue aggregates . . . . . . . . . . . . . . . . . . . . . . . . . . . . . . . . . . 193
Annex C. Classification of the Functions of Government (COFOG). . . . . . . . . . . . . . . . . . 194
Annex D. Detailed data on conflict of interest disclosure . . . . . . . . . . . . . . . . . . . . . . . . . 196
Annex E. OUR Data Index: Open, Useful, Reusable Government Data . . . . . . . . . . . . . . 201
Annex F. Members of the Steering Group . . . . . . . . . . . . . . . . . . . . . . . . . . . . . . . . . . . . . . . 204
Glossary . . . . . . . . . . . . . . . . . . . . . . . . . . . . . . . . . . . . . . . . . . . . . . . . . . . . . . . . . . . . . . . . . . . 205
Look for the StatLinks2at the bottom of the tables or graphs in this book.
To download the matching Excel® spreadsheet, just type the link into your
Internet browser, starting with the http://dx.doi.org prefix, or click on the link from
the e-book edition.
Follow OECD Publications on:
This book has... StatLinks2A service that delivers Excel® files from the printed page!
http://twitter.com/OECD_Pubs
http://www.facebook.com/OECDPublications
http://www.linkedin.com/groups/OECD-Publications-4645871
http://www.youtube.com/oecdilibrary
http://www.oecd.org/oecddirect/ OECD
Alerts
GOVERNMENT AT A GLANCE 2015 © OECD 2015 7

GOVERNANCE AT A CRITICAL TIME FOR PUBLIC POLICIES
Governance at a Critical Timefor Public Policies
This fourth edition of Government at a Glace offers a comprehensive panorama of the
capacities and performance of government in OECD countries and key partners at a moment
when many are grappling with huge economic challenges and painful trade-offs. Ambitious
goals contrast with the reality of a recovery that is still fragile in many places. Reforms and
other essential programmes must proceed in a context of limited public investment. At the
same time, societies have to urgently confront long-term challenges, including sustainability
and climate change. Rising inequality is also excluding large segments of society from the
benefits of growth and is constraining the return to full economic potential. The fact that
trust in public institutions is strained does not make the task easier.
Governments are striving to leave the crisis behind and build the foundations for
strong, sustainable and inclusive economic growth. They are also trying to restore the trust
of citizens in their institutions. Government processes can help make policy outcomes
more effective and inclusive by fostering transparency and engagement, generating
evidence on the distributive effects of policies and reinforcing the system of checks and
balances to ensure that policies and regulations both serve the public interest. Open
government data (OGD) strengthens inclusiveness by proactively providing access to
information, thereby increasing transparency and creating opportunities for citizens,
businesses and civil society organisations to reuse the data in new ways.
Government at a Glance 2015 demonstrates that there is substantial scope for improving
stakeholder engagement in making and evaluating policies – a critical component of
inclusive growth. The report underlines that information and communications
technologies (ICTs) are not sufficient on their own to give citizens a greater role in
decisions that affect their quality of life. The new OECD OURdata Index reveals that many
countries have made progress in making public data more available and accessible, but
large variations remain, not least with respect to the quality of data provided.
Governments need to make participation initiatives more accessible, targeted, relevant and
appealing.
The publication also underscores that public sector integrity remains an area of
particular attention in the eyes of citizens and business. More can be done to avoid policy
and regulatory capture by vested interests. Governments must provide effective protection
to whistle blowers and extend private interest disclosure requirements to the judiciary
branch and “at risk” actors including tax and customs officials, procurement agents and
financial authorities.
GOVERNMENT AT A GLANCE 2015 © OECD 20158

GOVERNANCE AT A CRITICAL TIME FOR PUBLIC POLICIES
These themes and others are reflected in the set of indicators presented in this
edition. They enable evidence-based decision making and allow governments to compare
their practices and performance to others. By extending the scope and timeliness of our
governance indicators and analysis, and providing them in a variety of electronic formats,
Government at a Glance 2015 will be a critical resource for policy makers, citizens, and
researchers in their pursuit of better governance and more inclusive policies for better
lives.
Yours sincerely,
Angel Gurría
GOVERNMENT AT A GLANCE 2015 © OECD 2015 9


Government at a Glance 2015
© OECD 2015
Executive summary
The recovery is under way and economic growth is slowly starting to pick up in the
OECD area. Fiscal consolidation is proceeding, although unemployment remains high,
while productivity growth has been low. Inequalities, in the distribution of income and
other outcomes that matter for people’s well-being, are also widening. Governments must
address these challenges to deliver stronger, more inclusive growth in the years to come; a
multidimensional approach to public policy making is needed.
Governments possess many policy levers to build the foundations for more
sustainable and inclusive societies. However, without appropriate mechanisms to prevent
the “capture” of public policy making by special interest groups, ensure effective
implementation and promote thorough monitoring and evaluation, even well-designed
policies may not deliver their expected results. The indicators provided in Government at a
Glance 2015 shed light on how inclusive governments are in terms of employment, policy-
making processes and policy outcomes.
Key findings
The overall fiscal balance of OECD countries is improving
● The budget balance of OECD countries improved by 4.2 p.p, moving from a deficit of 8.4%
of GDP in 2009 to a deficit of 4.2% of GDP in 2013.
● In 2013, the structural fiscal balance reached an average deficit of 3.5% as a share of
potential GDP in OECD countries, an improvement of 3.6 p.p. compared to 2009.
● As a result of consolidation efforts, the majority of OECD countries improved their net
saving ratio (difference between current revenues and current expenditures)
between 2009 and 2013, including countries with highly negative ratios such as Greece,
Ireland and Portugal.
● In 2013, the average debt level in OECD countries reached 109.3% of GDP. From 2013
to 2014, debt decreased in Czech Republic, Ireland, Norway and Slovak Republic, while
the highest increases in debt occurred in Slovenia, Spain, Italy and Belgium.
Government investment is low and down significantly from 2009
● Between 2009 and 2013, government investment declined by 0.8 p.p. as a share of GDP
and 1.4 p.p. as a share of total expenditures on average in OECD countries. In 2013,
government investment represented 3.3% of GDP and 7.8% of total expenditure on
average.
● In 2013, sub-central governments spent on average about 60% of total government
investment. However, in countries such as Chile, Greece and the Slovak Republic more
than 70% of government investment was carried out by central government.
11

EXECUTIVE SUMMARY
Despite reforms, public sector employment remains relatively stable as a shareof the labour force
● Employment and remuneration reforms have been used extensively by the central
governments of most OECD countries to reduce spending.
● Different tools have been used in employment reforms, including non- or partial
replacement of retiring staff, recruitment freezes, outsourcing and adjusting
remunerations, notably by reducing the remuneration for top-level officials and pay
freezes. On average, reforms have led to a moderate increase of perceived stress levels
and work intensity.
● Despite the reforms, the size of public sector employment (not limited to central
government) as a share of the labour force remains relatively stable, at just above 19%
in 2013.
Stakeholder engagement in regulatory policies is widespread but takes placeat a very late stage
● Through the 2012 OECD Recommendation on Regulatory Practices and Policies,
OECD countries committed to a “whole-of-government” approach to regulatory
practices. Many have introduced formal requirements, making substantial progress in
improving regulatory practices and quality and in complying with some OECD Council
recommendations.
● Nevertheless, the extent to which governments conduct regulatory impact assessment
and ex post evaluations of costs and benefits, trade-offs and synergies across regulations
varies significantly.
● Substantial scope remains to improve stakeholder engagement in rule-making. Citizens,
businesses, civil society organizations, etc., are generally consulted late in the process,
often when the legislative draft is presented to the government. They are rarely asked for
feedback to inform performance assessment or better implementation of regulations,
nor systematically included in early-stage discussions on the nature of the problem and
possible solutions.
Public integrity efforts are growing, but major loopholes remain
● OECD countries are paying increasing attention to conflicts of interest, but unlike post-
public employment, pre-public employment (for instance former private sector
employees, or lobbyists) is largely unregulated.
● Requirements for public officials with higher decision-making power to disclose private
interests have been further developed in most OECD countries, although the judiciary
branch and “at risk” areas – including tax and customs officials, procurement agents and
financial authorities – display a lower level of disclosure compared to the executive and
legislative branches.
● Undue influence on the policy-making processes by vested interests is a persistent risk due
to loopholes such as unbalanced representation of interests in government advisory groups
and the movement of people between regulators and the regulated (i.e. “revolving doors”).
● Since 2009, there has been a significant increase in adoption of whistleblower protection
laws. In practice, however, effective protection remains a challenge.
GOVERNMENT AT A GLANCE 2015 © OECD 201512

EXECUTIVE SUMMARY
Countries are implementing open government data good practices
● Open government data empowers a new generation of citizens, businesses and civil
servants to create socio-economic value and can increase government transparency.
● According to the new OURdata Index, open data efforts were the highest in Korea, France,
the United Kingdom, Australia, Canada and Spain.
● While most countries have made significant efforts to make data available and easily
accessible, the extent to which governments actively support the reuse of public data
varies (especially with regard to the reuse inside public administrations).
Government tax benefit systems have significantly mitigated the rise in marketincome inequalities, but non-income inequalities require action
● Government transfers and transfer payments represent a powerful tool to limit the
effects of rising market inequalities. In 2011, income redistribution by governments of
OECD countries reduced the GINI coefficient by more than 16 p.p.
● In some countries, government spending cuts have increased the share of expenditures
paid directly by citizens to access services, which may further increase financial barriers
for low-income people.
● A citizen-centred approach to service delivery, focusing on vulnerable people (low-income
people, immigrants, disabled, youth, etc.), and fully exploiting the potential of new
technologies may provide opportunities for more inclusive service delivery and outcomes.
GOVERNMENT AT A GLANCE 2015 © OECD 2015 13


READER’S GUIDE
Reader’s guide
In order to accurately interpret the data included in Government at a Glance 2015, readers
need to be familiar with the following methodological considerations that cut across a
number of indicators. The standard format for the presentation of indicators is on two
pages. The first page contains text that explains the relevance of the topic and highlights
some of the major differences observed across OECD countries. It is followed by a
“Methodology and definitions” section, which describes the data sources and provides
important information necessary to interpret the data. Closing the first page is the “Further
reading” section, which lists useful background literature providing context to the data
displayed. The second page showcases the data. These figures show current levels and,
where possible, trends over time. A glossary of the main definitions of the publication can
be found in the final chapter of the book.
Calendar year/fiscal year in National Accounts dataUnless specified, data from the OECD National Accounts are based on calendar years.
Data for Australia and New Zealand refer to fiscal years: 1 July of the year indicated to
30 June for Australia and 1 April of the year indicated to 31 March for New Zealand. For
Japan, data regarding sub-sectors of general government and expenditures by COFOG refer
to fiscal year.
The data based on the System of National Accounts (SNA) were extracted from the OECD
National Accounts Statistics (database) and the Eurostat Government finance statistics (database)
on 8 May 2015.
Country coverageGovernment at a Glance 2015 includes data for all 34 OECD countries based on available
information. The statistical data for Israel are supplied by and under the responsibility of
the relevant Israeli authorities. The use of such data by the OECD is without prejudice to
the status of the Golan Heights, East Jerusalem and Israeli settlements in the West Bank
under the terms of international law.
Some additional non-member countries, such as Colombia, Latvia and the Russian
Federation* (accession countries to the OECD), other major economies of the world
(i.e. Brazil, People’s Republic of China, India, Indonesia and South Africa) as well as others
that have participant status to the Public Governance Committee of the OECD (e.g. Ukraine)
also supplied data for some indicators. Data for these non-member countries are
presented separately at the end of tables and figures.
* With regard to the Russian Federation, on 12 March 2014, the OECD Council “postponed activitiesrelated to the OECD accession process for the Russian Federation for the time being” (www.oecd.org/newsroom/statement-by-the-oecd-regarding-the-status-of-the-accession-process-with-russia-and-co-operation-with-ukraine.htm).
GOVERNMENT AT A GLANCE 2015 © OECD 2015 15

READER’S GUIDE
Abbreviation codes
OECD averages and totalsAverages
In figures, the OECD average is presented either as unweighted, arithmetic mean and/
or weighted average of the OECD countries for which data are available. It does not include
data for non-member countries. In the notes, OECD countries with unavailable data are
listed. In the text, the reference is made for the OECD weighted average, unless otherwise
indicated.
When the two OECD averages are not shown in an indicator, the OECD average refers
to the unweighted, arithmetic mean.
If a figure depicts information for one or more years, the OECD average includes all
OECD countries with available data. For instance, an OECD average for 2009 includes all
current OECD countries with available information for that year, even if at that time they
were not members of the OECD.
In the case of National Accounts data, OECD averages are calculated until 2013, as not all
OECD countries (mainly, OECD non-European countries) have available data for 2014 .
TotalsOECD totals are most commonly found in tables and represent the sum of data in the
corresponding column for the OECD countries for which data are available. Totals do not
include data for non-member countries. In the notes, OECD countries with unavailable
data are mentioned.
OECD countries
Australia AUS Portugal PRT
Austria AUT Slovak Republic SVK
Belgium BEL Slovenia SVN
Canada CAN Spain ESP
Chile CHL Sweden SWE
Czech Republic CZE Switzerland CHE
Denmark DNK Turkey TUR
Estonia EST United Kingdom GBR
Finland FIN United States USA
France FRA
Germany DEU OECD accession countries*
Greece GRC Colombia COL
Hungary HUN Latvia LVA
Iceland ISL Russian Federation (hereafter “Russia”) RUS
Ireland IRL
Israel ISR Other major economies
Italy ITA Brazil (participant to the OECD Public Governance Committee) BRA
Japan JPN People’s Republic of China (hereafter “China”) CHN
Korea KOR India IND
Luxembourg LUX Indonesia IDN
Mexico MEX South Africa (participant to the OECD Public Governance Committee) ZAF
Netherlands NLD
New Zealand NZL Other participant to the OECD Public Governance Committee
Norway NOR Ukraine UKR
Poland POL
* With regard to the Russian Federation, see footnote above. On 9 April 2015, the OECD Council decided to open accessiondiscussions with Costa Rica and Lithuania (data for these two countries are not included in the publication).
GOVERNMENT AT A GLANCE 2015 © OECD 201516

READER’S GUIDE
Online supplementsSeveral indicators include additional online tables and figures that present country-
specific data. When available, these are noted in the “Methodology and definitions” section
of the indicator. Government at a Glance 2015 also offers access to StatLinks, a service that
allows readers to download the corresponding Excel files of the data featured. StatLinks is
found at the bottom right-hand corner of the tables or figures and can be typed into a web
browser or, in an electronic version of the publication, clicked on directly.
In addition, the following supplementary materials are available online at:
www.oecd.org/gov/govataglance.htm:
● Country fact sheets that present key data by country compared with the OECD average.
● Government at a Glance statistical database that includes regularly updated data for a
selection of quantitative indicators via OECD.Stat and the publication of qualitative data
for the GOV surveys via a dedicated web platform.
● Country contextual notes that present contextual information describing some key
features of the political and administrative structures for each member country.
Per capita indicatorsSome indicators (e.g. expenditures, revenues and government debt) are shown on a
per capita (e.g. per person) basis. The underlying population estimates are based on the
System of National Accounts notion of residency. They include persons who are resident in
a country for one year or more, regardless of their citizenship, and also include foreign
diplomatic personnel and defense personnel together with their families, students
studying and patients seeking treatment abroad, even if they stay abroad for more than
one year. The one-year rule means that usual residents who live abroad for less than one
year are included in the population, while foreign visitors (for example, vacationers) who
are in the country for less than one year are excluded. An important point to note in this
context is that individuals may feature as employees of one country (contributing to the
GDP of that country via production), but residents of another (with their wages and salaries
reflected in the gross national income of their resident country).
Purchasing power paritiesPurchasing power parities (PPPs) are the rates of currency conversion that equalise the
purchasing power of different countries by eliminating differences in price levels between
countries. When converted by means of PPPs, expenditures across countries are in effect
expressed at the same set of prices, meaning that an equivalent bundle of goods and
services will have the same cost in both countries, enabling comparisons across countries
that reflect only the differences in the volume of goods and services purchased.
PPPs for current and historical series should be read with the following information:
● 2007, 2009 and 2013: PPPs for European countries are annual benchmark results provided
by Eurostat. PPPs for non-European countries and Russia are OECD estimates.
● 2008, 2011: PPPs for all OECD countries and Russia are triennial benchmark results
calculated jointly by the OECD and Eurostat.
● 2014: PPPs for all countries are preliminary OECD estimates and should be taken with caution.
● Chile: Data for Chile from 2007 to 2009 are OECD estimates and have been revised with
the introduction of the 2011 benchmark results.
● More information is available on the OECD PPP Internet site: www.oecd.org/std/prices-ppp.
GOVERNMENT AT A GLANCE 2015 © OECD 2015 17

READER’S GUIDE
Composite indicatorsThe publication includes several descriptive composite indexes in narrowly defined
areas related to conflict of interest and open government data. These composite indexes
are a practical way of summarising discrete, qualitative information. The composites
presented in this publication were created in accordance with the steps identified in the
Handbook on Constructing Composite Indicators (Nardo et al., 2008).
Details about the variables and weights used to construct the conflict of interest and
open government data composites are available in Annex D and Annex E, respectively.
While the composite indicators were developed in co-operation with OECD countries and
are based on theory and/or best practices, the variables composing the indexes and their
relative weights are based on expert judgments and, as a result, may change over time.
Signs and abbreviations.. Missing values
x Not applicable (unless otherwise stated)
p.p. Percentage points
UWA Unweighted average
WA Weighted average
PPP Purchasing Power Parities
EUR euros
USD US dollars
GOVERNMENT AT A GLANCE 2015 © OECD 201518

INTRODUCTION
Introduction
The main objective of the Government at a Glance series is to provide reliable,
internationally comparative data on government activities and their results in
OECD countries and beyond. In turn, these data can be used by countries to benchmark
their governments’ performance, to track their own and international developments over
time and to provide evidence to their public policy making.
The indicators in Government at a Glance are becoming themselves a measuring
standard in many fields of public governance. In addition to the core indicators that
constitute the trademark of the publication, this third edition includes a selection of new
indicators and additional data sources, allowing for a more complete picture of public
administrations across OECD countries.
What’s new in Government at a Glance 2015?Like in every edition, this 2015 edition of Government at a Glance provides a mix
between core chapters that are repeated in every edition and new features. The core
chapters of Government at a Glance are Chapter 2: Public finance and economics, Chapter 3:
Public employment and compensation, Chapter 7: Public sector integrity, Chapter 9: Public
procurement and Chapter 11: Core government results (entitled “Strategic governance” in
the previous edition). In addition to those core chapters, this Government at a Glance
2015 edition presents a series of new and consolidated features:
● A new chapter on “Institutions” (Chapter 4) is introduced, focusing this year on the
centres of government, which play a key role in ensuring strategic foresight and a whole-
of-government approach to public policy reform and implementation. Depending on the
country, the centre of government institutions correspond to the Cabinet Office, the
Ministry of Finance and/or Treasury Board. This chapter is based on the responses
provided by the delegates of the OECD Network of Senior Officials from Centres of
Government to a survey conducted in 2013. Data collected through this network
represent one of the first cross-national empirical assessments of centres of
government. The content highlights the main functions and policy tools of these
institutions and provides a unique knowledge base that countries can draw on to
benchmark the performance and evolution of their centres of government.
● Chapter 8 on “Regulatory Governance” is not an entirely new chapter but had not been
updated for some time (it was last published in 2009). Recent developments in this area
have modified in large part the content of the chapter. In this year’s edition, the chapter
on regulations provides a series of indicators on the regulatory cycle and the process of
making regulations including stakeholders’ engagement and ex post evaluation. These
indicators are based on the 2014 Survey on Regulatory Policy and Governance, which builds
on the 2012 Recommendation of the Council on Regulatory Policy and Governance,
where countries have agreed to adhere to the principles of open government, including
transparency and participation in the regulatory process.
GOVERNMENT AT A GLANCE 2015 © OECD 2015 19

INTRODUCTION
● Chapter 12 on “Serving citizens”, provided as a special feature in 2013, has been
consolidated and now provides a broader set of internationally comparable measures on
services to citizens. Developed in close collaboration with other OECD directorates
specialised in health care and education and in close collaboration with OECD countries,
this year’s chapter focuses on three sectors: health care, education and justice. It builds
on a consolidated and structured framework to assess the degree of access,
responsiveness and quality of services to citizens.
● In addition to the new and consolidated chapters, the publication also provides new
indicators in the areas of public finances (financial net worth, gross debt), human resource
management (focus on the impact of budget constraints on HRM practices), budgeting
(health budgeting, cost-benefit analysis) and digital government (social media use by
governments and a new OURdata Index: Open, Useful, Reusable Government Data).
Definition of governmentData on public finances are based on the definition of the sector “general government”
found in the System of National Accounts (SNA). Accordingly, general government comprises
ministries/departments, agencies, offices and some non-profit institutions at the central,
state and local level as well as social security funds. Data on revenues and expenditures are
presented both for central and sub-central (state and local) levels of government and
(where applicable) for social security funds. However, data on employment refer to the
public sector, which covers both general government as well as public corporations, such
as publicly owned banks, harbours and airports. Finally, data on public management
practices and processes refer to those practices and processes in the central level of
government only.
Framework and structure of the publicationGovernment at a Glance covers more than the 34 OECD countries, including data, when
available, on accession countries (Colombia, Latvia and Russia) as well as other major
economies of the world such as Brazil, China, India, Indonesia and South Africa. For some
indicators, data from participant countries to the Public Governance Committee
(e.g. Ukraine) have been included. These countries play a significant and increasing role in
the world economy and in international political structures.
This third edition of Government at a Glance includes contextual information as well as
input, process, output and outcome indicators. Figure 0.1 presents the conceptual
framework for Government at a Glance.
Context
Contextual factors (online) present information on some key features of the political
and administrative structures for each OECD country. Considering contextual information
makes it possible to understand the major institutional differences and similarities
amongst countries, and thereby identify better comparators for benchmarking purposes.
In addition, the Country fact sheets (online) provide a country-by-country storyline on how
the data provided in the Government at a Glance publication apply to the specific context of
public sector reforms in OECD countries and some accession countries.
Inputs
Inputs refer to the resources used by governments in their production function, as well
as the way in which they are mixed; these resources correspond to labour and capital. The
GOVERNMENT AT A GLANCE 2015 © OECD 201520

INTRODUCTION
nment 10)
chapters that describe these inputs are Public finance and economics, Public employment
and compensation, including indicators on government expenditures, production costs,
employment, and the role and characteristics of centres of government. Differences in
these indicators can help to understand the different capacities of governments in
producing and delivering public goods to citizens.
Figure 0.1. Conceptual framework for Government at a Glance 2015
Contextual factors and country notesWhat is the social, political and economic context in which government operates?
Contextual factors (online) and country fact sheets (online)
Inputs What is the size and role of government? How much revenue does government collect?
How much and what kind of resources does government use?
Public finance and economics (Chapter 2)
Public employment(Chapter 3)
Institutions (Chapter 4)
ProcessesHow does the government work? What does government do and how does it do it?
Budgeting practices and procedures
(Chapter 5)
Human resource management (Chapter 6)
Public sector integrity (Chapter 7)
Regulatory governance (Chapter 8)
Public procurement (Chapter 9)
Digital gover(Chapter
Outputs and outcomesWhat goods and services does the government produce? What is the resulting impact on citizens and businesses?
Core government results (Chapter 11)
Serving citizens (Chapter 12)
GOVERNMENT AT A GLANCE 2015 © OECD 2015 21

INTRODUCTION
Processes
Processes refer to the public management practices and procedures undertaken by
governments to implement policies. These address the means used by public
administrations to fulfil their duties and obtain their goals. In consequence, they are often
essential for ensuring the rule of law, accountability, fairness and openness of government
actions. Public sector reforms are usually targeted towards the improvement of processes;
as such they capture most of the public’s attention. This edition includes information on
institutions (centre of government), budget practices and procedures, human resource
management in times of austerity, public sector integrity (managing conflicts of interest,
lobbying rules and procedures, and asset disclosure of public servants), regulatory
governance, public procurement and digital government.
Outputs and outcomes
The dividing line between outputs and outcomes can be blurry. While outputs refer to
the amount of goods and services produced by governments, outcomes show the effects of
policies and practices on citizens and businesses. The success of a given policy should be
measured, at a first stage, by outputs but should ultimately be judged by the outcomes it
achieves. Generally speaking, outcomes refer to the effects of public programmes and
services on citizens, in terms of welfare gains, health gains, educational/learning gains,
and so on. While these outcomes can certainly be affected by the quality of programmes
and services provided, they can also be affected by other factors, such as the socio-
economic background of the population and individual behavioural factors.
In Government at a Glance 2015, the measures of outputs and outcomes are provided in
two distinct chapters:
● The Core government results chapter focuses on whole-of-government aspects such as
the confidence of citizens in their national government, perception of corruption, the
rule of law, income redistribution and broad measures of public sector efficiency
(output-based) and cost effectiveness (outcome-based).
● The Serving citizens chapter follows a sectoral approach to measuring outputs and
outcomes of public sector activities. Based on a consolidated framework developed
horizontally with other OECD directorates and in collaboration with OECD countries, the
chapter provides measures of services to citizens in terms of access, responsiveness and
quality. This year’s edition focuses on three sectors: health care, education and the
judicial system.
Future activitiesIn order to produce Government at Glance, the OECD works in close co-operation with
other organisations, including the International Labour Organization (ILO), the World
Justice Project, the European Commission for the Efficiency of Justice (CEPEJ), Gallup and
the European Commission, to provide a comprehensive view of what governments do and
how they do it, while avoiding duplication of data collection.
Co-operation is to be strengthened as a way of ensuring the comparability of data
across countries that are covered in the publication.
For future editions of the publication, the Government at a Glance team is planning to:
● Map public sector agencies and their characteristics.
● Update and expand the data collection on the characteristics of the public sector
workforce through the strategic HRM survey (age, gender, education level, etc.).
GOVERNMENT AT A GLANCE 2015 © OECD 201522
INTRODUCTION
● Repeat the data collection on public sector compensation.
● Collect new data on open government practices and stakeholder and citizen
engagement mechanisms in public administrations.
● Collect data on the efficiency and performance of judicial systems for all OECD
countries, using the survey instrument of the European Commission for the Efficiency of
Justice.
Regional and country-focused editions of Government at a GlanceFor the first time in 2014, a regional edition of Government at a Glance was released.
Government at a Glance: Latin America and the Caribbean 2014: Towards Innovative Public
Financial Management focused on the most relevant policy issues and topics in the region. In
addition, a country-focused edition, Government at a Glance: How Hungary Compares, was
released in May 2015, focusing on the key aspects of public sector reforms in Hungary and
comparing trends to neighbouring countries. More regional and country-focused editions
of Government at a Glance are expected to be published later in 2015 and in 2016.
All data and indicators on public governance now accessible online!Another new feature this year is that all data collected by the OECD Public Governance
Directorate for the production of Government at a Glance (including the previous editions)
and for other purposes are available online on the OECD website. Readers interested in
using the data presented in this publication for further analysis and research are
encouraged to consult the full documentation of definitions, sources and methods
presented in the Government at a Glance publication and online. This database includes both
qualitative and quantitative indicators on public sector inputs, processes, outputs and
outcomes and will be updated on a regular basis as new data are released.
GOVERNMENT AT A GLANCE 2015 © OECD 2015 23

Government at a Glance 2015
© OECD 2015
Chapter 1
Inclusive governmentfor a more inclusive society
25

1. INCLUSIVE GOVERNMENT FOR A MORE INCLUSIVE SOCIETY
IntroductionInclusive growth is crucial not only for a fairer society but also for a stronger economy.
Income gaps between rich and the poor have widened, and these inequalities undermine
economic growth and strain the relationship between government and citizens. Countries
are searching for new ways to improve living standards, while sharing the benefits of
growth more evenly across all groups in society. In responding to the challenge of inclusive
growth, the public sector has an important role to play, with respect to the inclusiveness of
the public sector itself, the inclusiveness of policy-making processes, and the inclusiveness
of the outcomes that governments seek to promote.
First, we ask whether the public sector, a major employer in the economy, is
representative of the society it serves, whether it should aspire to being an “inclusive
employer” and, if so, what that would entail. For example, Government at a Glance data show
that while women are well represented – even over-represented – in the public sector
workforce as a whole, the “glass ceiling” is still in place in the public sector as well: the higher
the level of responsibility, the fewer women hold positions. The results presented here also
illustrate the data gaps: additional breakdowns by ethnic and religious minorities, disabled
people, immigrants or indigenous populations are not available, as no internationally
comparative data exist about their representation in public employment in OECD countries.
Second, promoting inclusive growth requires strong, inclusive processes and institutions
to counteract the forces that produce inequality. In the last three decades, efficiency became
one of the most important guiding principles of how governments operate and how services
are delivered in OECD countries, often putting equity or fairness considerations on the back
burner. In pursuing inclusive public policies and practices, efficiency and equity are not
viewed as mutually exclusive; rather, inclusiveness becomes a key dimension of
effectiveness. In an inclusive approach to public policies, equity and fairness considerations
are introduced by looking at the impact of various policy options on different groups in
society. Inclusive government processes also allow civil society and the wider public to be
involved in policy making, regulation and service delivery. By gathering more input from
citizens about their needs and the impact of policies on them, open government makes
public policies more effective and public services more user friendly and user driven.
Finally, and perhaps most importantly, the test of an effective policy of inclusive
growth is whether public policies achieve their wider societal goals, from increasing access
to education and educational attainment across society to reducing disparities in life
expectancy and other key health indicators and lowering income inequality through
better-targeted tax policies. Inclusiveness – reflected in access (financial and geographical)
to public services such as education, health care and justice – in turn shapes the growth
potential of economies and the level of societal well-being.
Exploring the role of government in fostering inclusive growth requires a new look at
what we know about government performance, one that goes beyond traditional
parameters of efficiency and effectiveness. The working hypothesis of this approach is that
a more inclusive approach to policy making will play a key role in achieving inclusive
GOVERNMENT AT A GLANCE 2015 © OECD 201526

1. INCLUSIVE GOVERNMENT FOR A MORE INCLUSIVE SOCIETY
growth, and that inclusive growth, in turn, represents a more sustainable economic model
for our societies. OECD countries have made progress in some areas – governments are
becoming more open, consultative, gender-aware, and so on – but there is much work still
to do. This chapter provides a preliminary overview, drawing on data from various editions
of Government at a Glance, to launch the debate. Over time, the reflection on how
governments and the policies and services they deliver can be organised better in the
interest of more inclusive societies will undoubtedly entail a deeper review of how we
assess the performance of government and the indicators that we use to measure it.
Towards an inclusive public sector: The importance of gender and ageGovernments are increasingly concerned about the importance of diversity in public
institutions, to ensure that the needs, aspirations and experiences of a diverse range of
citizens are reflected in the decision-making process (OECD, 2011b; OECD, 2014f). To
achieve that goal, governments in OECD countries have worked over the last decades to
establish public sector employment frameworks that guarantee attention to fundamental
values such as fairness, equality, justice and social cohesion (OECD, 2008b).
Depending on the policy area or sector, a more representative public administration
can better access previously overlooked knowledge, networks and perspectives for
improved policy development and implementation. The notion of which groups should be
represented in the public administration has expanded over the years (Pitts and Wise,
2010), and now includes a range of dimensions such as women; racial, ethnic and religious
minorities; the poor; the elderly; the disabled; and other minority groups such as
indigenous populations.
Of all these groups, internationally comparable data are available mainly on the
representation of women in the public sector.Women are overall well represented in the public
sector workforce but still face important barriers in reaching senior leadership positions.
In 2013, on average, 59% of the OECD public sector workforce was female (Figure 1.1). Many
public sector occupations such as nurses or teachers are female-dominated. Some may offer
Figure 1.1. Share of women in the public sector and total economy, 2013
Note: Data for Austria, Czech Republic, Finland, Ireland, Iceland, Israel, Korea, the Netherlands, Turkey and theUnited States are not available. Data for New Zealand are expressed in full-time equivalents (FTEs). Data forAustralia, Greece, Hungary and Slovenia are for 2012 rather than 2013. Data for Denmark, Luxembourg andNew Zealand are for 2011 rather than 2013.Source: International Labour Organization (ILO), ILOSTAT Database.
1 2 http://dx.doi.org/10.1787/888933247964
%
0
10
20
30
40
50
60
70
80
Total economy Public sector
SVNSWE
DNKGBR
NORES
TCAN
POLSVK
HUNFR
ACHL ITA
OECD
AUSNZL CHE
MEXBEL PRT
ESP
GRCLU
XJP
NBRA
LVA
ZAFCOL
GOVERNMENT AT A GLANCE 2015 © OECD 2015 27

1. INCLUSIVE GOVERNMENT FOR A MORE INCLUSIVE SOCIETY
more flexible working conditions, better work and family life balance and greater benefits
than private sector occupations. Still, there are important variations in the representation of
women in public sectors across OECD countries. In Sweden, Slovenia and Denmark, women
represent more than 67% of the public sector workforce, while in Mexico, Luxembourg,
Greece and Japan, the share of women in the public sector workforce is below 50%, which
may also reflect a different range of public sector functions in those countries.
The public sector has, on average, a higher share of women in the labour force than the
total economy (Figure 1.1). Japan is the only OECD country that displays a smaller share of
women working in the public sector than in the total economy.
However, the gender imbalance found in senior levels of central government
considerably limits the role of women in the decision-making process. According to OECD
(2013a), in 2010 only 29% of the top manager positions in the central government were
occupied by women across OECD countries. Similarly, in 2010 only 29% of seats for first and
second instance court presidents were filled by women (OECD, 2013a). Another illustration
of this gender imbalance can be seen in terms of political representation. In 2014, on
average, women held 26.9% of ministerial positions (Figure 1.2). The extent to which
women hold ministerial positions varies considerably among OECD countries. The
Swedish and Finnish governments were the only ones where women are equally
represented. The largest gaps between women and men in ministerial positions can be
found in the Czech Republic, the Slovak Republic, Greece and Turkey, where fewer than
10% of ministerial positions are occupied by women.
A similar trend can be found in the parliaments of OECD countries. In 2014, the
composition of these assemblies, elected by citizens to take decisions that affect every
aspect of their lives, did not reflect gender equality. On average, fewer than 30% of seats in
the lower and upper parliamentary houses of OECD countries were filled by women
(Figure 1.3). Those that came closest to gender balance were the lower parliamentary
houses of Sweden, Finland and Belgium and the higher parliamentary houses of Australia,
Canada and Belgium.
Figure 1.2. Share of women ministers2015
Note: Deputy prime ministers and ministers are included. Prime ministers/heads of government were also included whenthey held ministerial portfolios. Vice-presidents and heads of governmental or public agencies have not been included.Source: Inter-Parliamentary Union (2015), “Women in Politics”.
1 2 http://dx.doi.org/10.1787/888933248658
%
0
10
20
30
40
50
60
70
FINSWEFR
ANOR
NLD EST ISL ITA SVN
CHECHL
DEU NZL AUTCAN
ESPOEC
D IRL
PRTPOL
LUX
DNKUSA
BEL GBRJP
NCZE ISR
MEX AUSGRC
KORTU
RHUN
SVKCOL
LVA
GOVERNMENT AT A GLANCE 2015 © OECD 201528

1. INCLUSIVE GOVERNMENT FOR A MORE INCLUSIVE SOCIETY
Governments also are seeking to respond to the demographic challenges that are
currently facing OECD countries. The changing demands of an ageing society, for example,
lead to increasing employment in health and elderly care services. Moreover, the
government workforce itself is also ageing. According to previous results, (OECD, 2009a)
central government workforces are ageing more rapidly than the rest of the society. On
average, a very large proportion (33.9%) of the central government workforce was over
50 years old in 2009. This percentage is 6.2 percentage points higher than the share of
elderly working in the total economy (Figure 1.4). Nonetheless, the share of elderly people
in the central government workforce varies considerably across OECD countries. Japan,
Figure 1.3. Share of women in parliament, 2015
Note: South Africa: The figures on the distribution of seats in the Upper House do not include the 36 special rotatingdelegates appointed on an ad hoc basis, and all percentages given are therefore calculated on the basis of the54 permanent seats. United States of America: Total refers to all voting members of the House.Source: Inter-Parliamentary Union (2015), “Women in Politics”.
1 2 http://dx.doi.org/10.1787/888933247973
Figure 1.4. Percentage of workers 50 years or older in central governmentand the total economy, 2009
Note: Data for the Czech Republic, Turkey and Luxembourg are not available.Source: OECD (2010), 2010 OECD Survey on Strategic HRM in Central/Federal Government, OECD, Paris; and InternationalLabour Organization (ILO), ILOSTAT Database. Data for Spain were provided by national authorities.
1 2 http://dx.doi.org/10.1787/888933247983
%
0
10
20
30
40
50
60
SWEFINISLES
PNOR
BELMEX
DNKNLDSVN
DEUNZLPRTITAAUTCHE
LUX
AUSFR
ACAN
POLGBR ISR
GRCZST
USACZE
SVKKOR IR
LCHL
TURHUN
JPN
ZAFCHN
COLLV
AID
NRUS
INDUKR
BRA
% Women in parliament (Lower or Single House) % Women in parliament (Upper House or Senate)
OECD
%
0
10
20
30
40
50
60
HUNNOR
NLD ISRDNK IR
LAUT
USASWE
GRCSVK
DEU ISLBEL ES
P ITAJPN
KORCHL
EST
MEXAUS
NZL PRTCHE
POLSVN
GBR FIN FRA
CANOEC
D
Central government Total economy
GOVERNMENT AT A GLANCE 2015 © OECD 2015 29
1. INCLUSIVE GOVERNMENT FOR A MORE INCLUSIVE SOCIETY
Korea, Chile, Estonia and Mexico displayed a lower share of elderly in the workforce in the
central government than in the total economy. On the other hand, Belgium, Spain and Italy
had a considerably greater share of elderly in the central government than in the total
economy (difference of 18 p.p.).
Population ageing creates challenges for governments but also opportunities. Indeed,
the large share of the central government workforce who will retire over a relatively short
period of time creates an opportunity to bring staff with new skills into government. In
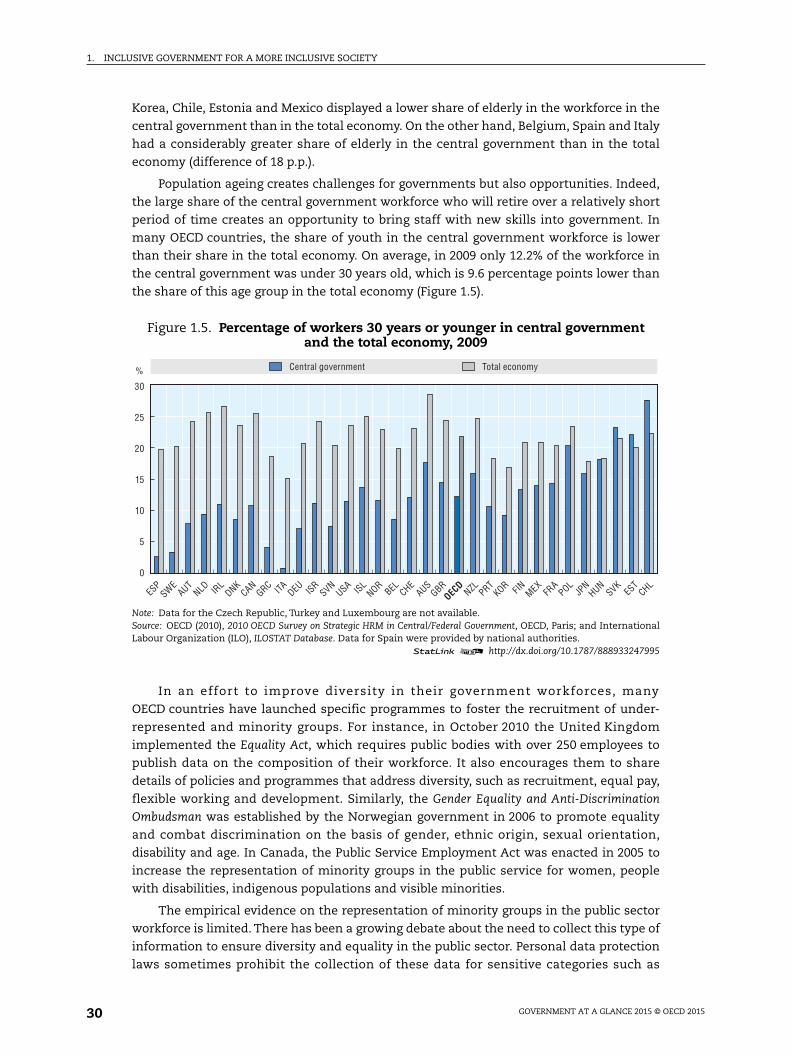
many OECD countries, the share of youth in the central government workforce is lower
than their share in the total economy. On average, in 2009 only 12.2% of the workforce in
the central government was under 30 years old, which is 9.6 percentage points lower than
the share of this age group in the total economy (Figure 1.5).
In an effort to improve diversity in their government workforces, many
OECD countries have launched specific programmes to foster the recruitment of under-
represented and minority groups. For instance, in October 2010 the United Kingdom
implemented the Equality Act, which requires public bodies with over 250 employees to
publish data on the composition of their workforce. It also encourages them to share
details of policies and programmes that address diversity, such as recruitment, equal pay,
flexible working and development. Similarly, the Gender Equality and Anti-Discrimination
Ombudsman was established by the Norwegian government in 2006 to promote equality
and combat discrimination on the basis of gender, ethnic origin, sexual orientation,
disability and age. In Canada, the Public Service Employment Act was enacted in 2005 to
increase the representation of minority groups in the public service for women, people
with disabilities, indigenous populations and visible minorities.
The empirical evidence on the representation of minority groups in the public sector
workforce is limited. There has been a growing debate about the need to collect this type of
information to ensure diversity and equality in the public sector. Personal data protection
laws sometimes prohibit the collection of these data for sensitive categories such as
Figure 1.5. Percentage of workers 30 years or younger in central governmentand the total economy, 2009
Note: Data for the Czech Republic, Turkey and Luxembourg are not available.Source: OECD (2010), 2010 OECD Survey on Strategic HRM in Central/Federal Government, OECD, Paris; and InternationalLabour Organization (ILO), ILOSTAT Database. Data for Spain were provided by national authorities.
1 2 http://dx.doi.org/10.1787/888933247995
%
0
5
10
15
20
25
30
NZL PRTKOR FIN MEX
FRA
POLJP
NHUN
SVKES
TCHL
SWEES
PAUT
NLD IRL
DNKCAN
GRC ITA DEU ISRSVN
USA ISLNOR
BEL CHEAUS
GBR
Central government Total economy
OECD
GOVERNMENT AT A GLANCE 2015 © OECD 201530
1. INCLUSIVE GOVERNMENT FOR A MORE INCLUSIVE SOCIETY
ethnicity, race and religion. Census and official surveys as well as administrative data are
the main sources of sensitive personal data; however, even their reliability could be
questioned (Simon, 2007). Despite all these difficulties, the United Kingdom, based on its
Labour Force Survey, observed that minority ethnic groups were somewhat under-
represented in the public workforce. In 2010, the representation of black, Asian and other
ethnic minority groups in the public workforce was 8.8%, compared to 9.7% in the private
workforce (Local Government Group, 2010). Collecting further information about the
composition of the public sector workforce in an internationally comparative way would be
a key way to help countries rethink the inclusiveness of their public sectors.
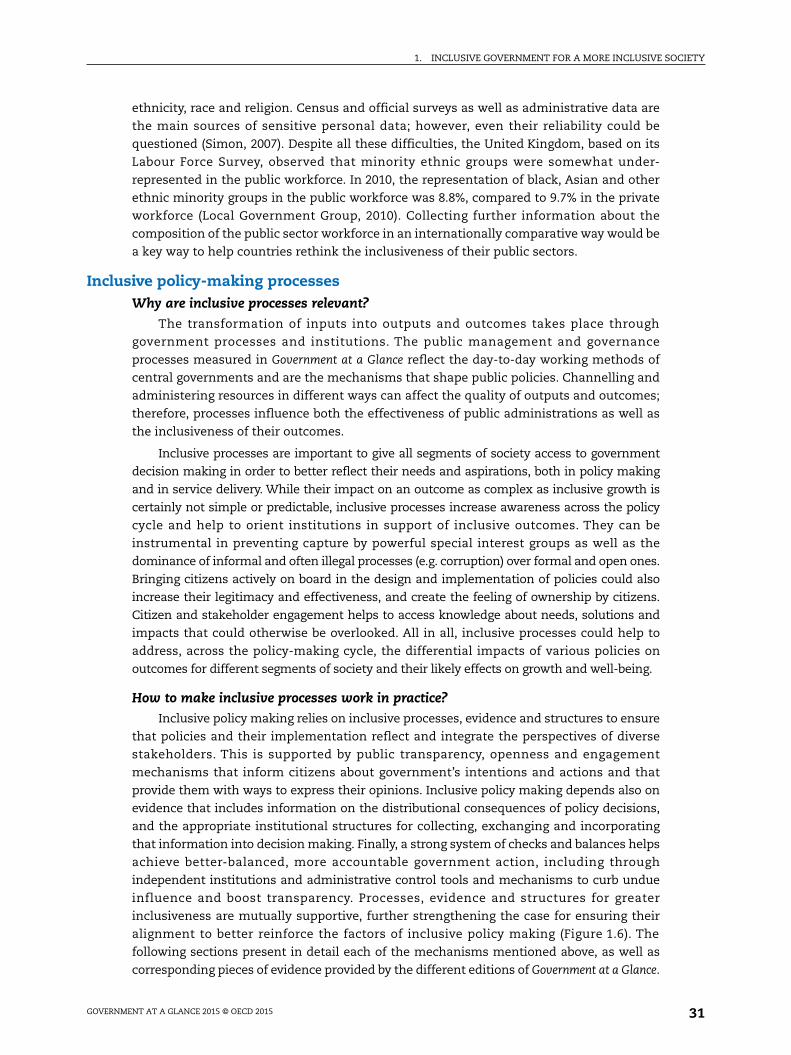
Inclusive policy-making processesWhy are inclusive processes relevant?
The transformation of inputs into outputs and outcomes takes place through
government processes and institutions. The public management and governance
processes measured in Government at a Glance reflect the day-to-day working methods of
central governments and are the mechanisms that shape public policies. Channelling and
administering resources in different ways can affect the quality of outputs and outcomes;
therefore, processes influence both the effectiveness of public administrations as well as
the inclusiveness of their outcomes.
Inclusive processes are important to give all segments of society access to government
decision making in order to better reflect their needs and aspirations, both in policy making
and in service delivery. While their impact on an outcome as complex as inclusive growth is
certainly not simple or predictable, inclusive processes increase awareness across the policy
cycle and help to orient institutions in support of inclusive outcomes. They can be
instrumental in preventing capture by powerful special interest groups as well as the
dominance of informal and often illegal processes (e.g. corruption) over formal and open ones.
Bringing citizens actively on board in the design and implementation of policies could also
increase their legitimacy and effectiveness, and create the feeling of ownership by citizens.
Citizen and stakeholder engagement helps to access knowledge about needs, solutions and
impacts that could otherwise be overlooked. All in all, inclusive processes could help to
address, across the policy-making cycle, the differential impacts of various policies on
outcomes for different segments of society and their likely effects on growth and well-being.
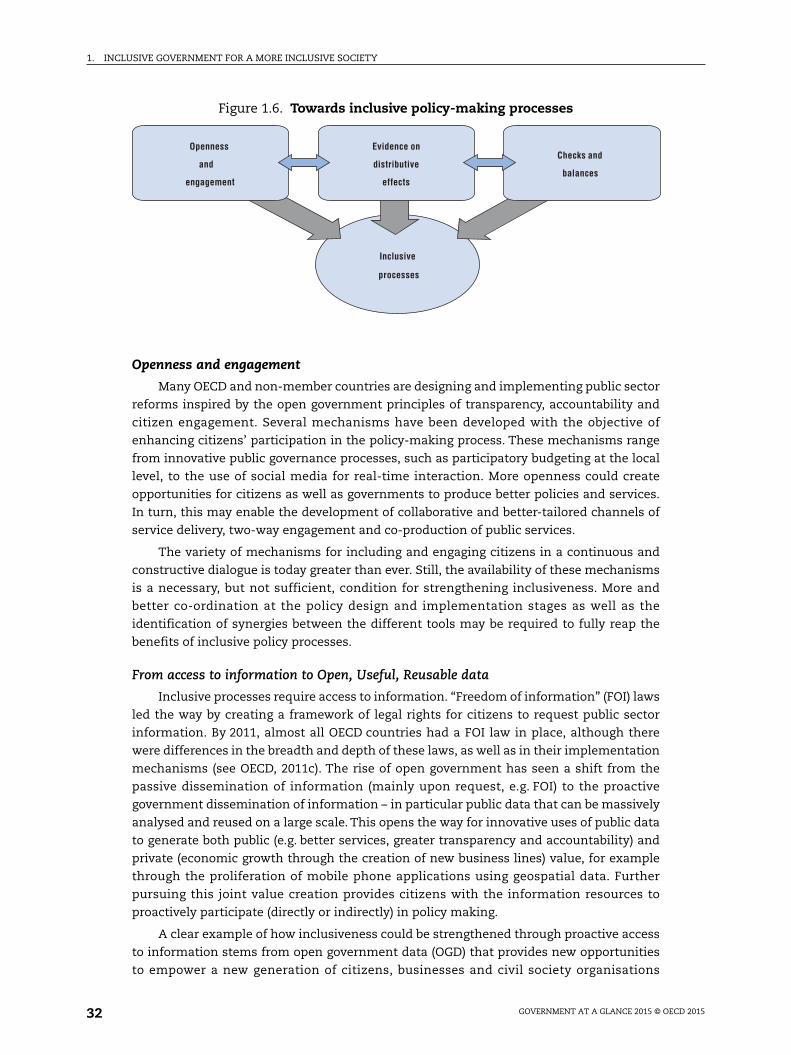
How to make inclusive processes work in practice?Inclusive policy making relies on inclusive processes, evidence and structures to ensure
that policies and their implementation reflect and integrate the perspectives of diverse
stakeholders. This is supported by public transparency, openness and engagement
mechanisms that inform citizens about government’s intentions and actions and that
provide them with ways to express their opinions. Inclusive policy making depends also on
evidence that includes information on the distributional consequences of policy decisions,
and the appropriate institutional structures for collecting, exchanging and incorporating
that information into decision making. Finally, a strong system of checks and balances helps
achieve better-balanced, more accountable government action, including through
independent institutions and administrative control tools and mechanisms to curb undue
influence and boost transparency. Processes, evidence and structures for greater
inclusiveness are mutually supportive, further strengthening the case for ensuring their
alignment to better reinforce the factors of inclusive policy making (Figure 1.6). The
following sections present in detail each of the mechanisms mentioned above, as well as
corresponding pieces of evidence provided by the different editions of Government at a Glance.
GOVERNMENT AT A GLANCE 2015 © OECD 2015 31
1. INCLUSIVE GOVERNMENT FOR A MORE INCLUSIVE SOCIETY
Openness and engagement
Many OECD and non-member countries are designing and implementing public sector
reforms inspired by the open government principles of transparency, accountability and
citizen engagement. Several mechanisms have been developed with the objective of
enhancing citizens’ participation in the policy-making process. These mechanisms range
from innovative public governance processes, such as participatory budgeting at the local
level, to the use of social media for real-time interaction. More openness could create
opportunities for citizens as well as governments to produce better policies and services.
In turn, this may enable the development of collaborative and better-tailored channels of
service delivery, two-way engagement and co-production of public services.
The variety of mechanisms for including and engaging citizens in a continuous and
constructive dialogue is today greater than ever. Still, the availability of these mechanisms
is a necessary, but not sufficient, condition for strengthening inclusiveness. More and
better co-ordination at the policy design and implementation stages as well as the
identification of synergies between the different tools may be required to fully reap the
benefits of inclusive policy processes.
From access to information to Open, Useful, Reusable data
Inclusive processes require access to information. “Freedom of information” (FOI) laws
led the way by creating a framework of legal rights for citizens to request public sector
information. By 2011, almost all OECD countries had a FOI law in place, although there
were differences in the breadth and depth of these laws, as well as in their implementation
mechanisms (see OECD, 2011c). The rise of open government has seen a shift from the
passive dissemination of information (mainly upon request, e.g. FOI) to the proactive
government dissemination of information – in particular public data that can be massively
analysed and reused on a large scale. This opens the way for innovative uses of public data
to generate both public (e.g. better services, greater transparency and accountability) and
private (economic growth through the creation of new business lines) value, for example
through the proliferation of mobile phone applications using geospatial data. Further
pursuing this joint value creation provides citizens with the information resources to
proactively participate (directly or indirectly) in policy making.
A clear example of how inclusiveness could be strengthened through proactive access
to information stems from open government data (OGD) that provides new opportunities
to empower a new generation of citizens, businesses and civil society organisations
Figure 1.6. Towards inclusive policy-making processes
Inclusive
processes
Openness
and
engagement
Evidence on
distributive
effects
Checks and
balances
GOVERNMENT AT A GLANCE 2015 © OECD 201532

1. INCLUSIVE GOVERNMENT FOR A MORE INCLUSIVE SOCIETY
through the reuse of these data and increased transparency. The OECD OURdata Index
measures government efforts to implement the G8 Open Data charter based on the
availability, accessibility and government support to promote the reuse of data, focusing on
the central OGD portal in each country (see Figure 1.7 and two-pager on open data). While
many countries are well advanced in the process of implementing the Charter, especially
regarding availability and access to data, there are still large variations in the extent to
which governments provide active support for the reuse of the data through specific
events, incentives and training programmes both out- and inside public administrations.
Given the speed of developments, some countries are already implementing important
reforms to their central open government data (OGD) programmes and portals, which
could lead to rapid improvements on this indicator in the coming years.
From one-way consultation to two-way collaboration across the policy-making process
Meaningful citizen engagement is at the heart of inclusive policy making. Engagement
implies giving citizens a greater role in decisions that affect their quality of life, not only
through consultation, but through collaboration and joint deliberation, so that policies
reflect and integrate the perspectives of those affected by them. Overall, enhanced public
engagement could increase trust in public institutions and contribute to closing the gaps
between citizens’ expectations and government responses, therefore resulting in better
public policies. Still, achieving meaningful engagement relies on strong leadership, and
requires creating and developing adequate communication channels, effective guidance
and proper incentives to facilitate both governments and citizens’ involvement.
Most OECD countries are still at the early stages of this public engagement, although
in some areas progress has been important, such as regulatory policy. The OECD
Recommendation on Regulatory Policy and Governance encourages governments to
“actively engage […] all relevant stakeholders during the regulation-making process and
design […] in consultation processes to maximise the quality of the information received
and its effectiveness” (OECD, 2012b). According to the OECD regulatory indicators survey, a
majority of OECD countries engage stakeholders in developing both primary laws and
subordinate regulations. Figure 1.8 presents the trend in the number of countries that have
incorporated mandatory public consultation mechanisms as part of developing new draft
Figure 1.7. OURdata Index: Open, Useful, Reusable Government data, 2014
Source: 2014 OECD Survey on Open Government Data.1 2 http://dx.doi.org/10.1787/888933249180
%
0
0.1
0.2
0.3
0.4
0.5
0.6
0.7
0.8
0.9
1.0
KORFR
AGBR
AUSCAN
ESP
PRTNOR
USAMEX FIN GRC
AUTJP
NNZL DEU BEL CHL
DNKSLV CHE
IRL ITA ES
TNLD SVK
SWEPOL
TURCOL
Total score OECD
No
natio
nal O
GD
port
al
GOVERNMENT AT A GLANCE 2015 © OECD 2015 33
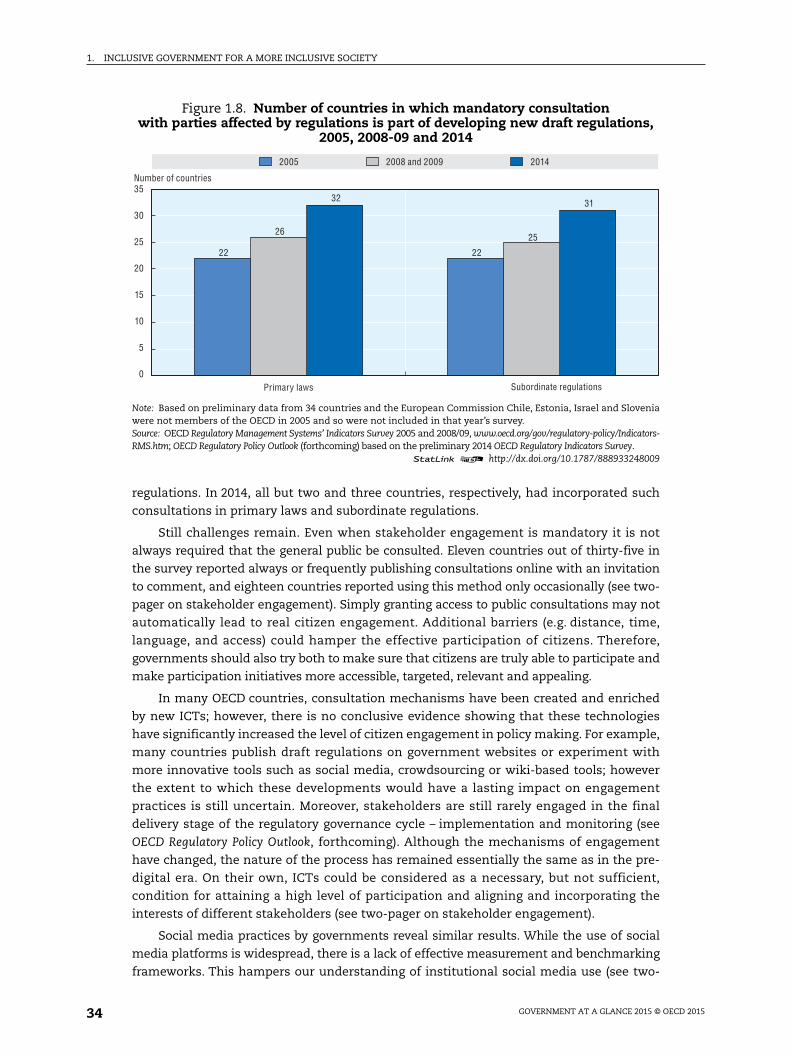
1. INCLUSIVE GOVERNMENT FOR A MORE INCLUSIVE SOCIETY
regulations. In 2014, all but two and three countries, respectively, had incorporated such
consultations in primary laws and subordinate regulations.
Still challenges remain. Even when stakeholder engagement is mandatory it is not
always required that the general public be consulted. Eleven countries out of thirty-five in
the survey reported always or frequently publishing consultations online with an invitation
to comment, and eighteen countries reported using this method only occasionally (see two-
pager on stakeholder engagement). Simply granting access to public consultations may not
automatically lead to real citizen engagement. Additional barriers (e.g. distance, time,
language, and access) could hamper the effective participation of citizens. Therefore,
governments should also try both to make sure that citizens are truly able to participate and
make participation initiatives more accessible, targeted, relevant and appealing.
In many OECD countries, consultation mechanisms have been created and enriched
by new ICTs; however, there is no conclusive evidence showing that these technologies
have significantly increased the level of citizen engagement in policy making. For example,
many countries publish draft regulations on government websites or experiment with
more innovative tools such as social media, crowdsourcing or wiki-based tools; however
the extent to which these developments would have a lasting impact on engagement
practices is still uncertain. Moreover, stakeholders are still rarely engaged in the final
delivery stage of the regulatory governance cycle – implementation and monitoring (see
OECD Regulatory Policy Outlook, forthcoming). Although the mechanisms of engagement
have changed, the nature of the process has remained essentially the same as in the pre-
digital era. On their own, ICTs could be considered as a necessary, but not sufficient,
condition for attaining a high level of participation and aligning and incorporating the
interests of different stakeholders (see two-pager on stakeholder engagement).
Social media practices by governments reveal similar results. While the use of social
media platforms is widespread, there is a lack of effective measurement and benchmarking
frameworks. This hampers our understanding of institutional social media use (see two-
Figure 1.8. Number of countries in which mandatory consultationwith parties affected by regulations is part of developing new draft regulations,
2005, 2008-09 and 2014
Note: Based on preliminary data from 34 countries and the European Commission Chile, Estonia, Israel and Sloveniawere not members of the OECD in 2005 and so were not included in that year’s survey.Source: OECD Regulatory Management Systems’ Indicators Survey 2005 and 2008/09, www.oecd.org/gov/regulatory-policy/Indicators-RMS.htm; OECD Regulatory Policy Outlook (forthcoming) based on the preliminary 2014 OECD Regulatory Indicators Survey.
1 2 http://dx.doi.org/10.1787/888933248009
0
5
10
15
20
25
30
35
22 22
2625
32 31
20142005 2008 and 2009
Primary laws Subordinate regulations
Number of countries
GOVERNMENT AT A GLANCE 2015 © OECD 201534

1. INCLUSIVE GOVERNMENT FOR A MORE INCLUSIVE SOCIETY
pager on the use of social media by governments). The OECD Recommendation on Digital
Government Strategies acknowledges that it is necessary to “encourage the engagement and
participation of public, private and civil society stakeholders in policy making and service
delivery” through several different mechanisms such as the development of institutional
capacities and the development of a digital government “ecosystem” (see OECD , 2014a).
Generating evidence on distributive effects for decision making
Mechanisms to involve stakeholders both benefit from and contribute to evidence on
the possible distributive effects of policy. This evidence helps inform the decision-making
process, allowing policy makers to better understand impacts and to adjust policy. This
includes generating relevant information and using methodologies such as cost-benefit
analysis (CBA) to select investment projects, or regulatory impact assessment (RIA) to
assess the effects of regulatory policies (see two-pagers on Cost-Benefit Analysis and
Regulatory Impact Assessment). If properly designed, such mechanisms can also show the
distributional effects of different policy options across different stakeholders. More
recently, a new generation of assessment tools allow governments to better understand
distributive implications in terms of environmental impacts (EIA), poverty impacts (PIA) or
gender (gender-responsive budgeting).
When considering public investment opportunities, OECD countries recognise that
CBA is an important tool for deciding the merits of investment projects. Furthermore,
many countries (France, the United Kingdom and Canada) have been able to extend the use
of CBA beyond the infrastructure projects for which it was originally developed. Such a
shift has been triggered by evolving demands from citizens in areas such as environmental
protection, technological development and innovation, scientific research and culture and
leisure. However, in other countries (Italy, Sweden), CBA remains restricted to large
infrastructure projects. As technical problems are often similar across countries, a pool of
evidence is thus available for countries seeking to expand the application of CBA to other
projects and policies.
While a common core methodological framework for economic appraisal of
investment through CBA is generally well developed, certain aspects of it are still under-
developed, notably risk analysis (more developed in the United Kingdom, Sweden, Canada,
Germany and the Netherlands), or virtually absent, such as the distribution of project
outcomes across different groups (available in the United Kingdom only, although some
qualitative stakeholder analysis is indicated for Canada) and regional distribution analysis
(apparently unknown or only episodically carried out). Generating more and better CBA
information and generalising the use of distributional analysis would help improve the
understanding of the effects on inclusiveness of a given policy or project (Box 1.1).
In the regulatory area, OECD countries tend to assess the distributional effects of
regulation through RIA. However, in the majority of cases this assessment focuses on large
groups (i.e. government, business, community) without going into specific population
subgroups and without targeting inequality per se. Some OECD countries also use RIA to
monitor a number of impacts, such as those on: i) disadvantaged social groups; ii) gender
equality; iii) poverty; and iv) job creation. However, this practice remains relatively limited
and is fraught with methodological issues. Critical challenges involve gathering the
relevant information and developing standard models and tools to measure social impacts,
quantify the qualitative impacts and tackle the lack of adequate skills and resources within
ministries. As a result, broadening the application of impact assessment methodologies to
other groups or other areas will require a proportionate approach as promoted in the
GOVERNMENT AT A GLANCE 2015 © OECD 2015 35

1. INCLUSIVE GOVERNMENT FOR A MORE INCLUSIVE SOCIETY
Recommendation of the Council on Regulatory Policy and Governance. For instance, the
use of specific assessment tools or criteria for the impact assessment would be triggered
once the effects of regulation in a specific field (social, environmental) reach a certain level.
Rebalancing policy processes to give a voice to all groups: the example of gender-responsive budgeting
Another argument for involving key stakeholders in the policy-making process stems
from historical and cultural patterns of discrimination affecting specific groups such as
women, ethnic minorities and immigrants. These groups have often been excluded from
the policy-making process and as a result have experienced the results of systematically
biased policy outcomes. In order to redress such patterns, it is important to incorporate
balancing mechanisms at all stages of the policy design and implementation process.
Gender-responsive budgeting (GRB) is such a mechanism as it incorporates a gender
perspective at all stages of the budgetary process. The idea behind GRB is to analyse
whether allocations contribute to gender equality. In 2011, the OECD collected data on the
extent to which member countries were applying GRB (see OECD, 2013a). At that time, only
ten countries reported using GRB.
Box 1.1. The use of CBA in the United Kingdom
CBA has a long intellectual tradition for the evaluation of public investment projects.Under this methodology the desirability of a project is achieved when the total benefits ofan intervention, to whomever might occur, exceed the cost of that intervention. Benefitsare defined as increases in human well-being (utility) and the trade-offs involved inchoosing among different policy options are clearly identified. The United Kingdom hasone of the most solid traditions in project appraisal to select investments under budgetconstraints. The Green Book is a reference document for how policies, programmes andprojects must be evaluated. Currently, there is no legal requirement for the application ofCBA. However, the use of the methods and frameworks set out in the Green Book ismandatory for all policies, programmes and projects benefiting from central governmentsupport. All proposals involving regulation, spending or public assets are covered andshould be based on clear and objective evidence supporting their social value. Thepeculiarity of the Green Book is that it does not define rigid procedures to be followed.Instead, it provides a general and flexible approach for an analytical methodologyconducive to objective and transparent decision-making for public investments and forother socio-economic proposals. Instructions are not binding; rather, they are intended asguidelines that reflect the moral suasion that comes from the strong position of theTreasury in the system of financial delegation to spending departments.
The logical sequence of the appraisal process, as pointed out in the latest edition of theGreen Book, is the following:
● clearly define the objectives of the policy, programme or project under assessment;
● identify a shortlist by systematically considering a long list of options to achieve theidentified actions;
● applying social CBA or Cost Effectiveness Analysis (CEA), if appropriate, to the shortlistin order to select the preferred option;
● developing and implementing the solution, which is the selected option;
● paying attention to consultations throughout the preparation of the proposal; and
● using ex post CBA as a policy learning tool.
GOVERNMENT AT A GLANCE 2015 © OECD 201536

1. INCLUSIVE GOVERNMENT FOR A MORE INCLUSIVE SOCIETY
Implementing GRB would require important changes to how standard processes are
carried out as well as the type of information generated. In the first phase, GRB requires
building the capacity and sensitivity of key stakeholders and guaranteeing the involvement of
civil society as a crucial channel for raising awareness. The analysis by relevant stakeholders
of the implementation of policies and the associated outcomes are key to assessing the
inequalities generated by policies as well as actions to address those inequalities.
Furthermore, governments have a crucial role in generating the information required to
analyse the gender effects of budget proposals. Such information entails that the demand for
a given service must be broken down between men and women. Without this information, it
is difficult to compare women’s demand for the service with the supply budgeted for, and
therefore assess the neutrality of budgetary proposals. Finally, GRB should be accompanied
by mechanisms guaranteeing the accountability of agencies. All in all, GRB is an example of
a process that requires raising awareness and involving relevant stakeholders while
generating information to evaluate the effects of public policies on different groups.
The contribution of performance management
Integrating inclusiveness objectives into government performance frameworks can
help raise awareness of the impact of resource allocation and implementation decisions in
different sectors and for different groups. To be effective, performance budgeting and
management should be aligned with high-level, politically agreed key national indicators
that focus on the outcomes that matter most to citizens. Implementing enhanced
performance management frameworks requires monitoring and co-ordination across
government with a strong role from the central budget agency or centre of government to
ensure that cross-sectoral dimensions are taken into account.
Performance information is also a key tool for governments seeking to improve
transparency and public accountability. In addition to good reporting practices by
governments, supreme audit institutions (SAIs), which have traditionally provided
important financial accountability and compliance checks, are increasingly conducting
performance audits (see two-pager on performance-related budgeting and supreme audit
institutions). SAIs taking up this challenge can improve government accountability for
major performance objectives, including distributive impacts.
Anchoring inclusive policy making through checks and balancesA strong system of checks and balances is essential for the legitimacy, but also the
inclusiveness, of policy making, from problem definition to accurate evaluation. Checks
and balances underpin inclusive governance by interpreting and enforcing regulation
equally for all, protecting the vulnerable, providing independent, evidence-based inputs
and curbing the risks of undue influence and corruption. Increasingly, the challenge is how
to not only set up effective structures and mechanisms of checks and balances, but to
create an “ecosystem” where these institutions and mechanisms, within their respective
functions, reinforce and complement each other.
The role of independent institutions in fostering transparency
Independent bodies have an important role in supporting transparency in a variety of
areas. They can be either temporary or permanent. They may include bodies such as
productivity commissions or independent fiscal institutions (IFIs). In essence, these institutions
can provide an external expert view on the likely effects of policy options and inform the public
debate. (see OECD, 2013a). By doing so, they raise awareness among the general public and
relevant stakeholders about the consequences of government action.
GOVERNMENT AT A GLANCE 2015 © OECD 2015 37
1. INCLUSIVE GOVERNMENT FOR A MORE INCLUSIVE SOCIETY
Public transparency and accountability
Making the decision-making process inclusive requires recognising that it is
vulnerable to capture by vested interests. Efforts to make processes inclusive will not work
in practice if the access and influence of a powerful few are not averted. The growing
inequality in societies and the increasing concentration of resources in the hands of a few
creates a vicious circle by which those that hold the resources capture the design and
implementation of policies in their favour, further concentrating resources and
exacerbating inequality.
Practice has shown that OECD countries are not immune to the risk of policy capture
at the expense of the public interest. The 2008 crisis showed the extent of capture of
financial policies, although the risk is present to different degrees in countries. The main
forms of capture can be averted by managing conflict of interest, enhancing integrity and
transparency in lobbying practices and ensuring balanced political finance. The OECD has
advanced understanding on each of the elements of the policy-making process and has
developed a “better policy-making framework” to mitigate the risks of policy capture at
both individual and institutional levels.
Individual resilience against capture and corruption is strengthened through
measures to manage conflict of interest, including private interest disclosure by decision
makers, follow-up of disclosures, and enforcement in case of non-compliance. The
OECD Guidelines for Managing Conflict of Interest (OECD, 2003) set core principles for public
officials to identify and manage conflict-of-interest situations: serving the public interest,
supporting transparency, promoting individual responsibility and creating an
organisational culture that resists undue influence and policy capture. Yet, attention is
needed on emerging concerns, such as the unbalanced representation in government
advisory groups and the “revolving door” phenomenon.
Vested interest groups wield influence through lobbying and providing financial
resources to political parties and campaigns. To level the playing field among all
stakeholders in the policy-making process, the OECD adopted in 2010 the Recommendation
on Transparency and Integrity in Lobbying, aiming at mitigating lobbying-related risks of
corruption and undue influence. While lobbying is receiving increasing attention in
OECD countries, and recent years have seen an acceleration of regulations to promote
transparency, political finance remains a weak point. Money in politics is a double-edged
sword. It is a necessary component of the democratic processes, enabling representation and
facilitating democratic competition. Yet, if the financing of political parties and election
campaigns is not adequately regulated, money may also be a means for undue influence.
The OECD has developed a Framework on Financing Democracy that maps relevant risk
areas and provides policy options to promote a level playing field, transparency and integrity
in the financing of political parties and electoral campaigns to avert policy capture.
The combination of these policy measures, together with effective measures that
promote a culture of integrity in the public and private sectors, will curb the risks of
capture within the policy-making process and lay a solid foundation for inclusive policy
making and growth.
Inclusive policies and resultsThe context
Inclusive processes create better circumstances for making informed public policy
decisions, but they do not guarantee inclusive policy results. There is growing recognition
that inclusiveness of policy outcomes is a multidimensional concept, affecting not only
GOVERNMENT AT A GLANCE 2015 © OECD 201538

1. INCLUSIVE GOVERNMENT FOR A MORE INCLUSIVE SOCIETY
theentlthds
ingossithies
iary
ds.011
10ears
material living standards but also well-being. This is important, because some population
groups tend to accumulate different types of inequalities, hampering government’s ability
to provide equal opportunities to the entire citizenry. Income and non-income inequalities
mutually reinforce each other, possibly perpetuating a vicious cycle of exclusion and
inequality. For example, being born in a disadvantaged family still has an impact on a
student’s performance and access to tertiary education, which, in turn, has an impact on
earnings, employment status and life expectancy (Box 1.2). Indeed, recent evidence
suggests that income and non-income inequality have a detrimental impact on economic
activity, social cohesion and on the functioning of democracies and political fairness
(Cingano, 2014; OECD, 2015c; OECD, 2015d).
Since the 1980s, income and non-income inequalities have risen sharply in most
OECD countries, and even more so if detailed evidence on the top 1% is included (Box 1.3).
Even during the recent financial crisis, the highest income group increased its income
more (or lost less) on average than people at the bottom of the income distribution.
Evidence also suggests that there might be persistent issues of access and equity in service
delivery (such as in health care and education) for certain population groups.
Box 1.2. The cumulative nature of inequalities
Income level, educational attainment, employability and health status are all linked. For instance,inability to access good higher education for financial reasons can lead to a higher level of unemploym(or more difficult and unstable employment conditions), more stress and more physical and mental heaproblems. Furthermore, people from low-income groups are more likely to report unmet health care neethan higher-income people, which may further increase health inequalities. One of the most strikinequalities among people from different socio-economic groups relates to their life expectancy. Acr15 OECD countries, people with better education live on average 6 years longer at age 30 than people wthe lowest level of education (Figure 1.9). Taking actions to reduce income and non-income inequalitmay have a multiplier effect and significantly increase people’s well-being.
Figure 1.9. People with higher education are more likely to earn more and live longerGap in life expectancy at age 30 by sex and educational level, 2012
Note: The figures show the gap in the expected years of life remaining at age 30 between adults with the highest level (terteducation) and the lowest level (below upper secondary education) of education. Data for the Netherlands are for 2011.Source: Eurostat Database, complemented with national data collected by the OECD Health statistics for Israel, Mexico and the Netherlan
1 2 http://dx.doi.org/10.1787/888933248
05101520 0 2 4 6 8
SVK
PRTNLDNORMEXDNKFIN
ITASWE
ISR
SVNPOL
CZE
HUNEST
17.815.0
12.111.6
9.17.7
6.95.85.55.45.25.1
4.54.3
3.73.6
5.28.1
5.55.0
4.44.2
3.54.7
3.53.8
4.63.9
4.21.8
3.01.8
OECD (15)
Men Women
Gap in years Gap in y
GOVERNMENT AT A GLANCE 2015 © OECD 2015 39

1. INCLUSIVE GOVERNMENT FOR A MORE INCLUSIVE SOCIETY
ceed.32blevein
%)asge
om14).
asthe11:
3
026
ase
R
The income gap and a greater concentration of income and wealth at the top may
undermine political fairness and participation in the political process. Concentrated
wealth may increase the risk of policy capture by the wealthiest individuals and large
corporations. It can translate into a greater ability to shape election results, legislative
priorities and favourable regulations (Glaeser, Scheinkman, and Schleifer, 2002; You and
Khagram, 2005). In addition, when people have the feeling that economic gains inevitably
go to the wealthiest, this may lead to disillusionment with politics and lower turnouts at
elections, thereby further increasing the power of the wealthiest to influence public
decisions (Reich, 2013b). In the words attributed to Louis Brandeis (former United States
Supreme Court Justice): “[…] we may have a democracy, or we may have great wealth
concentrated in the hands of a few, but we cannot have both” (Dilliard, 1941).
Box 1.3. Medium-term trends in income inequalities in OECD countries
Income inequalities have reached, in the aftermath of the Great Recession, levels that we have not seen sinthe end of the 19th century. Evidence shows that, in developed countries, income inequalities have reachalmost unprecedented level in recent years. The GINI coefficient increased from 0.29 in the mid-1980s to 0in 2013 on average in OECD countries, with a value of one equalling the highest level of inequality possi(Figure 1.10) (OECD, 2015c). This increase affected nearly all countries, including those that used to harelatively low levels of inequality (e.g. Nordic countries). Countries that already had high levels of inequalitythe mid-1980s have also seen an increase (Mexico, the United States, Israel, and United Kingdom).
Another way to measure income inequality is to look at the evolution of earnings at the top (1%, 10% or 20and at the bottom. A recent OECD study shows that the share of the richest 1% in total pre-tax income hincreased in most OECD countries in the past three decades (OECD, 2015d). Moreover, in 2010, the averaincome of the richest 10% of the population was equivalent to 9.5 times the income of the poorest, up fr7 times twenty-five years ago (OECD, 2011a; OECD2015d) – similar to levels in the late 19th century (Piketty, 20
During the recent financial and economic crisis, the gap between the richest and the poorest hcontinued to widen. On average in OECD countries, between 2007 and 2011, people in the top 10% ofincome scale suffered a smaller decrease in relative income than people in the bottom 10% (see chapterCore government results – Income redistribution).
Figure 1.10. Income inequality increased in most OECD countries between 1985 and 201Gini coefficients of income inequality, mid-1980s and 2013, or latest year available
Note: Little change in inequality refers to changes of less than 1.5 percentage points. Data year for 2013 (or latest year).Source: OECD Income Distribution Database (IDD), 2015, www.oecd.org/social/income-distribution-database.htm.
1 2 http://dx.doi.org/10.1787/888933248
0.15
0.20
0.25
0.30
0.35
0.40
0.45
0.50
1985 2013 or latest
Increase Little change Decre
DNKCZE
NOR FIN SWEHUN
DEU LUX
CANAUS ITA NZL JP
NGBR ISR
USAMEX
OECD22
BEL NLD FRA
GRCTU
GOVERNMENT AT A GLANCE 2015 © OECD 201540

1. INCLUSIVE GOVERNMENT FOR A MORE INCLUSIVE SOCIETY
Increased inequality affects perceived fairness, with risks for real fraud and corruption
and reduced confidence of citizens in public authorities. Rising income inequalities and
unequal access to key services such as education and health may foster greater public
dissatisfaction and greater polarisation of political opinions, possibly leading to higher
social instability (OECD, 2015d). Greater inequality in income and wealth leads people to
feel less constrained about cheating others (Mauro, 1998) and about evading taxes (Oswiak,
2003; Uslaner, 2003). Using evidence from the World Values Survey and the World Bank
measures of corruption, You and Khagram (2005) found that inequalities have the same
negative impact on perceived and real corruption as the level of development of a country.
In addition to its impact on the good functioning of democracies, rising inequalities
may also affect economic growth (Box 1.4). Governments possess a range of policy levers to
prevent the rise of inequalities and also to reduce them (notably through income
redistribution and in-kind transfers), but evaluating the trade-offs and synergies among
different policy options can help to better deliver the expected results.
Policy levers to reduce income and non-income inequalities
Governments have a range of tools for reducing income and non-income inequalities,
including:
1. tax and social transfer policies (in the form of unemployment insurance, social
assistance, wage subsidies, family benefits and pension benefits, tax credits, etc.);
2. employment policies and policies affecting the wage-bargaining process;
3. in-kind benefits through public services and spending for education, health and other
important services, either delivered publicly or privately;
4. regulatory levers such as reducing barriers to accessing economic opportunity; and
Box 1.4. Exploring the impact of inequalities on economic growth
Some studies have pointed to possible negative effects of rising income inequalities oneconomic growth in developed countries. A recent OECD study estimated that loweringinequality by 1 Gini coefficient point (the main measure of income inequalities) couldtranslate into an increase in cumulative growth of 0.8 percentage points of GDP in thefollowing 5 years (or 0.15 points per year) (Cingano, 2014). This study also suggests thatlowering inequality by increasing the income of people at the bottom of the incomedistribution has a greater overall positive impact on economic performance, because thiscategory of people tend to consume a greater proportion of their disposable income, thanreducing the income of those at the top of the income scale. Inequalities can have adetrimental impact on domestic demand, productivity (less investment in human capitalfrom low-income people) and investment (Cingano, 2014; OECD, 2015c).
New evidence also suggests that greater income redistribution and transfer paymentshave no negative impact on economic growth, especially in countries with already highlevels of income inequalities. A recent study carried out by the International MonetaryFund found no evidence of a trade-off between redistribution and economic growth inOECD countries (Ostry et al., 2014). On the contrary, greater redistribution has a direct andindirect (through lower inequalities) positive effect on economic growth. These resultswere obtained by using a measure of redistribution that captures only direct taxes andtransfers, without looking at the redistributive effects of in-kind government provision forhealth and education, which, in theory, would further strengthen this conclusion.
GOVERNMENT AT A GLANCE 2015 © OECD 2015 41

1. INCLUSIVE GOVERNMENT FOR A MORE INCLUSIVE SOCIETY
rs
249258
RCHL
5. more broadly, strengthening the rule of law, reducing special status or loopholes, and
ensuring inclusive policy development processes and effective policy implementation
(see section on inclusive policy-making processes).
As many observers have pointed out, reducing inequalities cannot be done through
taxes and government transfers alone; a broader and multidimensional approach is most
likely required for greater impact, including public services such as employment, education
and health care policies combined with effective policy design and implementation (Reich,
2008; 2013; Piketty, 2014; OECD, 2008a; 2012; 2015d). Assessing the trade-offs, synergies and
complementarities between these different policy levers is crucial.
Designing tax-and-transfer systems for efficient redistribution
Government can redistribute income through tax and social transfer policies. When
adequately designed, public cash transfers, as well as income taxes and social security
contributions, can play a significant role in reducing market income inequality
(Figure 1.11). The effects of a government’s income redistribution policy can be measured
by comparing the Gini coefficient before and after taxes and transfers. In 2011, most
OECD countries were able to achieve a sizeable reduction in market income inequalities
through taxes and transfers, with the exception of Chile and Korea (however, in Korea, the
market income inequality before taxes and transfers was much lower than in other
countries). The largest reductions that could be attributed to government intervention by
taxes and transfers took place in Ireland (26 p.p.) and Greece (22 p.p.), both severely
affected by the global financial and economic crisis.
However, compared with the 1980s, the tax and transfer systems in many
OECD countries have become less redistributive, while market income inequalities were
rising. The rapid increase of market income inequality from the 1980s to the late 2000s has
not been counterbalanced by more redistributive fiscal policies in most OECD countries.
Market income inequality continued to rise, but the stabilising effect of taxes and transfer
payments on household income inequality has mostly declined, especially since the mid-
1990s. Moreover, despite the large gains of high-income earners in some countries, income
Figure 1.11. Differences in income inequality pre and post-tax and government transfe2011
Note: Data for Belgium are for 2010 rather than 2011. Data for Australia and the Netherlands are for 2012 rather than 2011.Source: OECD, Income Distribution Database.
1 2 http://dx.doi.org/10.1787/888933
%
0.20
0.25
0.30
0.35
0.40
0.45
0.50
0.55
0.60
0.310
0.472
IRL
GRCBEL FIN AUT
SVNDEU LU
XCZE
FRA
PRTGBR ITA DNK
ESP
NORPOL
OECD
SWEES
TSVK ISL
NLD AUSNZL CAN
USAISR
CHETUR
KO
After taxes and transfers Before taxes and transfers
GOVERNMENT AT A GLANCE 2015 © OECD 201542
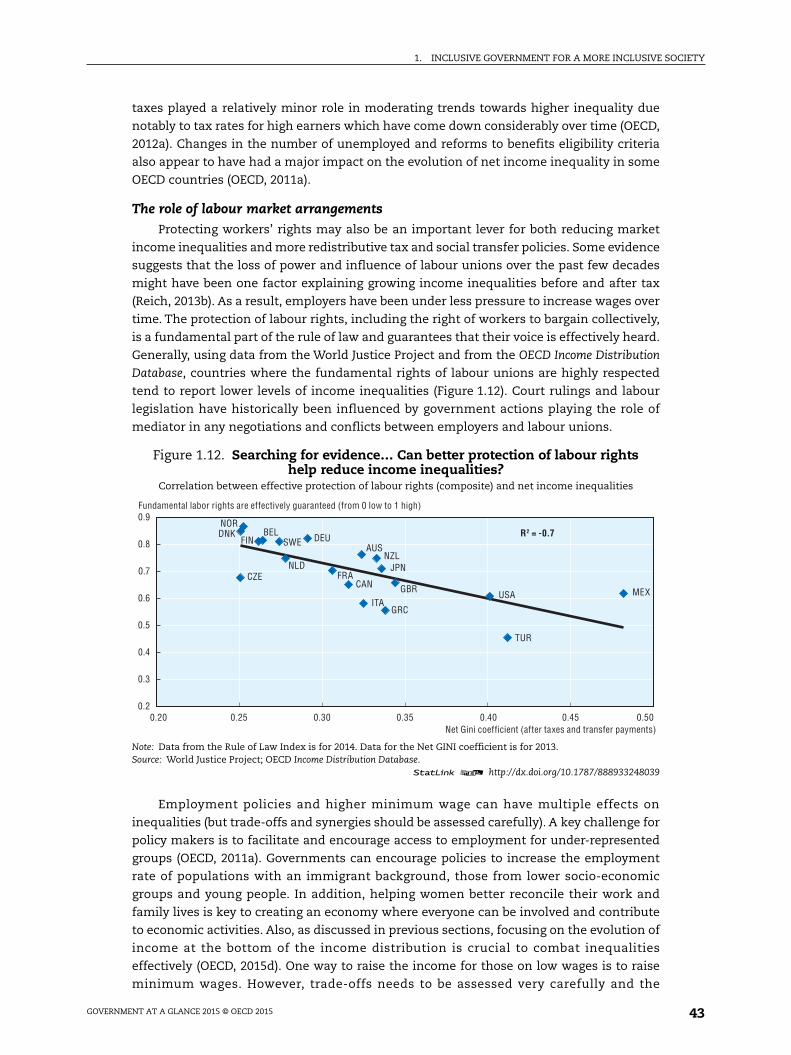
1. INCLUSIVE GOVERNMENT FOR A MORE INCLUSIVE SOCIETY
taxes played a relatively minor role in moderating trends towards higher inequality due
notably to tax rates for high earners which have come down considerably over time (OECD,
2012a). Changes in the number of unemployed and reforms to benefits eligibility criteria
also appear to have had a major impact on the evolution of net income inequality in some
OECD countries (OECD, 2011a).
The role of labour market arrangementsProtecting workers’ rights may also be an important lever for both reducing market
income inequalities and more redistributive tax and social transfer policies. Some evidence
suggests that the loss of power and influence of labour unions over the past few decades
might have been one factor explaining growing income inequalities before and after tax
(Reich, 2013b). As a result, employers have been under less pressure to increase wages over
time. The protection of labour rights, including the right of workers to bargain collectively,
is a fundamental part of the rule of law and guarantees that their voice is effectively heard.
Generally, using data from the World Justice Project and from the OECD Income Distribution
Database, countries where the fundamental rights of labour unions are highly respected
tend to report lower levels of income inequalities (Figure 1.12). Court rulings and labour
legislation have historically been influenced by government actions playing the role of
mediator in any negotiations and conflicts between employers and labour unions.
Employment policies and higher minimum wage can have multiple effects on
inequalities (but trade-offs and synergies should be assessed carefully). A key challenge for
policy makers is to facilitate and encourage access to employment for under-represented
groups (OECD, 2011a). Governments can encourage policies to increase the employment
rate of populations with an immigrant background, those from lower socio-economic
groups and young people. In addition, helping women better reconcile their work and
family lives is key to creating an economy where everyone can be involved and contribute
to economic activities. Also, as discussed in previous sections, focusing on the evolution of
income at the bottom of the income distribution is crucial to combat inequalities
effectively (OECD, 2015d). One way to raise the income for those on low wages is to raise
minimum wages. However, trade-offs needs to be assessed very carefully and the
Figure 1.12. Searching for evidence… Can better protection of labour rightshelp reduce income inequalities?
Correlation between effective protection of labour rights (composite) and net income inequalities
Note: Data from the Rule of Law Index is for 2014. Data for the Net GINI coefficient is for 2013.Source: World Justice Project; OECD Income Distribution Database.
1 2 http://dx.doi.org/10.1787/888933248039
0.20 0.25 0.30 0.35 0.40 0.45 0.500.2
0.3
0.4
0.5
0.6
0.7
0.8
0.9
R2 = -0.7
AUS
BEL
CANCZE
DEUDNKFIN
FRAGBR
GRCITA
JPN
MEX
NLD
NOR
NZLSWE
TUR
USA
Fundamental labor rights are effectively guaranteed (from 0 low to 1 high)
Net Gini coefficient (after taxes and transfer payments)
GOVERNMENT AT A GLANCE 2015 © OECD 2015 43
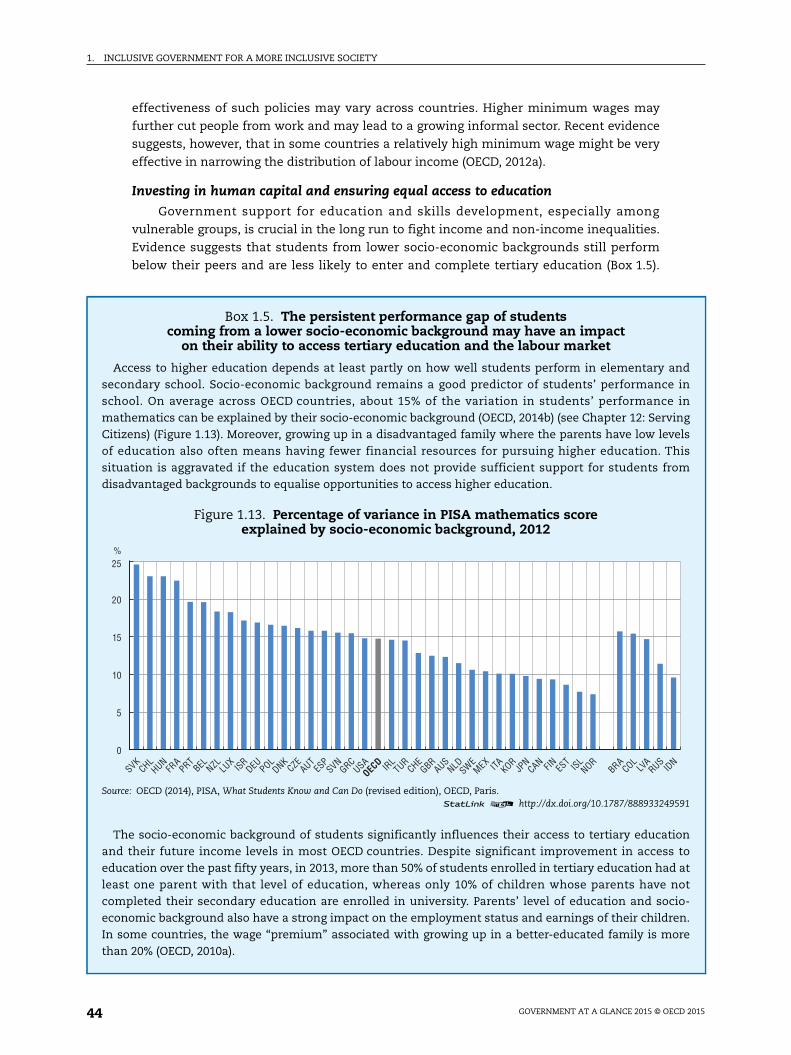
1. INCLUSIVE GOVERNMENT FOR A MORE INCLUSIVE SOCIETY
ndinin
ingelshisom
iontoatot
io-en.ore
591
N
effectiveness of such policies may vary across countries. Higher minimum wages may
further cut people from work and may lead to a growing informal sector. Recent evidence
suggests, however, that in some countries a relatively high minimum wage might be very
effective in narrowing the distribution of labour income (OECD, 2012a).
Investing in human capital and ensuring equal access to educationGovernment support for education and skills development, especially among
vulnerable groups, is crucial in the long run to fight income and non-income inequalities.
Evidence suggests that students from lower socio-economic backgrounds still perform
below their peers and are less likely to enter and complete tertiary education (Box 1.5).
Box 1.5. The persistent performance gap of studentscoming from a lower socio-economic background may have an impact
on their ability to access tertiary education and the labour market
Access to higher education depends at least partly on how well students perform in elementary asecondary school. Socio-economic background remains a good predictor of students’ performanceschool. On average across OECD countries, about 15% of the variation in students’ performancemathematics can be explained by their socio-economic background (OECD, 2014b) (see Chapter 12: ServCitizens) (Figure 1.13). Moreover, growing up in a disadvantaged family where the parents have low levof education also often means having fewer financial resources for pursuing higher education. Tsituation is aggravated if the education system does not provide sufficient support for students frdisadvantaged backgrounds to equalise opportunities to access higher education.
The socio-economic background of students significantly influences their access to tertiary educatand their future income levels in most OECD countries. Despite significant improvement in accesseducation over the past fifty years, in 2013, more than 50% of students enrolled in tertiary education hadleast one parent with that level of education, whereas only 10% of children whose parents have ncompleted their secondary education are enrolled in university. Parents’ level of education and soceconomic background also have a strong impact on the employment status and earnings of their childrIn some countries, the wage “premium” associated with growing up in a better-educated family is mthan 20% (OECD, 2010a).
Figure 1.13. Percentage of variance in PISA mathematics scoreexplained by socio-economic background, 2012
Source: OECD (2014), PISA, What Students Know and Can Do (revised edition), OECD, Paris.1 2 http://dx.doi.org/10.1787/888933249
0
5
10
15
20
25%
SVKCHL
HUNFR
APRT
BEL NZL LUX
ISRDEU POL
DNKCZE
AUTES
PSVN
GRCUSA
OECD IR
LTUR
CHEGBR
AUSNLDSWE
MEX ITA KORJP
NCAN FIN ES
T ISLNOR
BRACOL
LVA
RUSID
GOVERNMENT AT A GLANCE 2015 © OECD 201544

1. INCLUSIVE GOVERNMENT FOR A MORE INCLUSIVE SOCIETY
Studies carried out at the OECD demonstrate that more educated people earn more, are
less likely to be unemployed over their lifetime, are in better health, trust other people
more and participate more actively in social activities (OECD, 2015d). Therefore, improving
access to early childhood education, ensuring the equitable distribution of instructional
resources, raising the quality of the teaching workforce through lifelong learning
programmes and increasing access and financial support to tertiary education students
may help foster a more equal society. Many countries have introduced significant cuts
between 2007 and 2013 in spending in education as part of broader austerity programmes,
which may have an impact on their ability to compete and prosper in an increasingly
knowledge-based economy and exacerbate inequalities over the medium and long run.
Ensuring financial and geographic access to health careEnsuring access to health care for all the population, regardless of their ability to pay
and geographic location, improves people’s opportunities to participate in the labour
market and to benefit from economic and employment growth. In all OECD-EU countries
low income people are more likely to report unmet care needs due to financial barriers
(Box 1.6). Governments can improve access to needed health services by reducing financial
barriers. In contrast to publicly funded care, which in theory is based on need, direct out-
of-pocket (OOP) payments by households rely on people’s ability to pay. If the financing of
health care becomes more dependent on OOP payments, the burden shifts, in theory,
towards those who use services more and possibly from high- to low-income households
that often have greater health care needs. In 2012, about 3% of total household
consumption was dedicated to medical spending on average in OECD countries (see
Chapter 12: Serving citizens). In some countries that have been hit particularly hard by the
crisis and where public coverage for certain health services and goods has been reduced,
the share of OOP spending has increased in recent years.
Access to medical care also requires an adequate number and proper distribution of
physicians in all parts of the country. In OECD countries, the density of physicians is
consistently greater in urban regions, reflecting the concentration of specialised services
such as surgery and physicians’ preferences to practice in urban settings. In many
OECD countries, different types of policy tools have been used to attract and retain
physicians in underserved areas. These include the provision of financial incentives such
as one-time subsidies to help them set up a practice and recurrent payments such as
income guarantees and bonus payments (OECD, 2013b).
Fostering a whole-of-government approach to regulatory policies for greater impact
Regulatory policies in a wide range of areas such as the labour market, product
markets, education and health are powerful tools for governments to foster more equal
economic opportunities and reduce discrimination. The financial and economic crisis
of 2008 has reinforced the need for and importance of a well-functioning regulatory
framework for transparent and efficient markets with the right incentives. Fair,
transparent and clear regulatory frameworks are also a basic condition for dealing
effectively with a society’s economic and social challenges. For instance, evidence suggests
that quality regulations can have a significant positive impact on reducing race and gender
discrimination in the labour market by introducing specific favourable measures for these
population groups (OECD, 2014f). In addition, regulatory policies can also influence income
distribution directly, e.g. through deregulation in product markets, changes in social
GOVERNMENT AT A GLANCE 2015 © OECD 2015 45

1. INCLUSIVE GOVERNMENT FOR A MORE INCLUSIVE SOCIETY
ileveenforOPortalyst.
are
ostntster
049
transfers, wage-setting mechanisms, or workers’ bargaining power (OECD, 2015d).
Connecting various regulations together and ensuring that their distributive effects are
assessed rigorously and systematically is key to fostering more inclusive growth and more
inclusive societies.
Strengthening the rule of law and ensuring effective policy enforcement
Designing inclusive public policies taking into account their distributional effects is
important, but may end up having little impact if the policies are not enforced effectively.
For example, raising the top income and capital tax rates without improving compliance
mechanisms and combatting tax evasion may not reduce income inequalities.
Box 1.6. After years of improvement, self-reported unmet care needsfor low-income people have increased in EU countries between 2010 and 2013
Financial access to health care deteriorated in several OECD countries during the Great Recession. Whnearly all OECD countries have achieved and maintained universal coverage for health care, many hareduced the level of coverage for different services and pharmaceutical drugs, thereby increasing the burdof direct out-of-pocket (OOP) spending by households. This may create barriers to health care, particularlylow-income groups which must pay a higher share of their disposable income on health care when direct Opayments increase. In all European countries, people with low income were more likely in 2013 to repunmet care needs than people with high income (Figure 1.14). The gap was particularly large in Hungary, Itand Greece. The most common reason reported by low-income people for unmet health care needs is coOn average across EU countries, people with low incomes are eight times more likely to report unmet cneeds for financial reasons than people from high-income groups in 2013.
Health systems in OECD countries differ in the degree of coverage for health services and goods. In mcountries, public coverage is higher for hospital care and doctor consultations, while direct OOP paymeare higher for pharmaceuticals, dental care and eye care (glasses), resulting in a relatively greaproportion of people reporting unmet care needs for the latter group of health services and goods.
Figure 1.14. On average across EU countries, people with low incomes are eight timesmore likely to report unmet care needs for financial reasonsUnmet care needs for financial reasons by income level (EU27 average) (2005-13)
Source: EU Survey on Income and Living Conditions (EU-SILC), 2013.1 2 http://dx.doi.org/10.1787/888933248
0
1
2
3
4
5
6
7
8%
2005 2006 2007 2008 2009 2010 2011 2012 2013
Low income High income
GOVERNMENT AT A GLANCE 2015 © OECD 201546
1. INCLUSIVE GOVERNMENT FOR A MORE INCLUSIVE SOCIETY
ConclusionCreating conditions for inclusive growth has many implications for governments. For
example, this could involve building a government workforce that is more representative
of society. It could also mean developing policies in new ways that are based more on
evidence, constructive dialogue and the participation of citizens, and that promote
increased transparency and accountability. Governments could also try to increase
inclusiveness by ensuring that the distributional effects of each policy and decision on
income and non-income inequalities are systematically and rigorously evaluated.
Traditionally, governments look at the effects of a given policy on particular outcomes in
isolation. However, addressing inequality requires a more integrated, “whole-of-
government” approach that measures the multi-dimensional impacts, trade-offs and
synergies of public policies. For instance, fiscal policies may affect environmental, health
and education outcomes. Higher public health spending can have potentially positive
effects on employment and incomes, but may also imply higher taxation and hence less
material consumption. Moreover, the emphasis of these distributional impact assessments
should probably be on the distribution points (i.e. the median income) rather than the
mean. The release of the OECD multi-dimensional living standard focusing on median
household income and on three well-being dimensions (unemployment, household
income and life expectancy) goes in that direction (OECD, 2014).
The evidence on the available strategies and tools is incomplete, and more data is
needed to better chart the relationship between government action and inclusive growth.
Awareness of the stakes for rebuilding citizen trust and improving policy effectiveness,
however, is a starting point. Improving access to public services and strengthening the
quality and effectiveness of those services, for example, not only have a direct impact on
outcomes such as life expectancy and education attainment, but also seem to improve
social inclusiveness in other ways such as strengthening labour market access and
participation, reducing gender gaps and improving overall life opportunities and social
mobility. These are desirable outcomes in and of themselves, but are also increasingly
proving to be necessary ingredients to overall improvements in growth and well-being. In
order to achieve a better understanding of the public sector’s impact on inclusive growth,
governments need to continue searching in this direction, while collecting the evidence
necessary to inform better inform their efforts.
Bibliography
Cingano, F. (2014), “Trends in Income Inequality and its Impact on Economic Growth”, OECD Social,Employment and Migration Working Papers, No. 163, OECD, http://dx.doi.org/10.1787/5jxrjncwxv6j-en.
Dilliard, I. (1941), “Mr. Justice Brandeis, Great American; Press Opinion and Public Appraisal”, TheModern View Press, Saint Louis, Missouri.
Florio, M., S. Gastaldo and I. Loudiyi (2015), “The Use of Cost-Benefit Analysis for Capital InvestmentPlanning in OECD Countries”, Journal on Budgeting, OECD, Paris, forthcoming.
Galor, O. and J. Zeira (1988), “Income Distribution and Investment in Human Capital: MacroeconomicsImplication”, Working Paper, No. 197, Department of Economics, Hebrew University.
Galor, O., and J. Zeira (1993), “Income Distribution and Macroeconomics”, Review of Economic Studies 60, 3552.
Glaeser, E.L., J. Scheinkman and A. Shleifer. (2003), “The Injustice of Inequality,” Journal of MonetaryEconomics, 50:199-222.
Local Government Group (2010), Local Government Demographics, Produced by Local GovernmentAssociation Analysis and Research.
GOVERNMENT AT A GLANCE 2015 © OECD 2015 47

1. INCLUSIVE GOVERNMENT FOR A MORE INCLUSIVE SOCIETY
Mauro, P. (1997), “Why Worry About Corruption?”, Economic Issues, No.°6, International Monetary Fund,Washington DC, https://www.imf.org/EXTERNAL/PUBS/FT/ISSUES6/issue6.pdfl.
Mauro, P. (1998), “Corruption: Causes, Consequences, and Agenda for Further Research,” Journal ofFinance and Development, International Monetary Fund, 11-14 March.
OECD (2003), Recommendation of the Council on Guidelines for Managing Conflict of Interest in thePublic Service, OECD, Paris, www.oecd.org/gov/ethics.
OECD (2005), OECD Regulatory Management Systems’ Indicators Survey, www.oecd.org/gov/regulatory-policy/42059593.pdf.
OECD (2007), OECD Guidelines for Managing Conflict of Interest in the Public Service: Report on Implementation,OECD, Paris, www.oecd.org/corruption/ethics/39691164.pdf.
OECD (2008a), Growing Unequal? Income Distribution and Poverty in OECD Countries, OECD, Paris, http://dx.doi.org/10.1787/9789264044197-en.
OECD (2008b), The State of the Public Service, OECD, Paris, http://dx.doi.org/10.1787/9789264047990-en.
OECD (2009a), Government at a Glance 2009, OECD, Paris, http://dx.doi.org/10.1787/9789264075061-en.
OECD (2009b), Regulatory Management Systems’ Indicators Survey, OECD, Paris, http://www.oecd.org/gov/regulatory-policy/47829549.pdf.
OECD (2010a), PISA 2009 Results: Overcoming Social Background: Equity in Learning Opportunities andOutcomes (Volume II), PISA, OECD Publishing, Paris, http://dx.doi.org/10.1787/9789264091504-en.
OECD (2010b), PISA 2009 Results: What Students Know and Can Do: Student Performance in Reading,Mathematics and Science (Volume I), PISA, OECD, Paris, http://dx.doi.org/10.1787/9789264091450-en.
OECD (2011a), Divided We Stand: Why Inequality Keeps Rising, OECD, Paris, http://dx.doi.org/10.1787/9789264119536-en.
OECD (2011b), Public Servants as Partners for Growth: Toward a Stronger, Leaner and More EquitableWorkforce, OECD, Paris, http://dx.doi.org/10.1787/9789264166707-en.
OECD (2012a), “Reducing Income Inequality While Boosting Economic Growth: Can It Be Done?”, inOECD, Economic Policy Reforms 2012: Going for Growth, OECD, Paris, http://dx.doi.org/10.1787/growth-2012-47-en.
OECD (2012b), Recommendation of the Council on Regulatory Policy and Governance, OECD, Paris.
OECD (2013a), Government at a Glance 2013, OECD, Paris, http://dx.doi.org/10.1787/gov_glance-2013-en.
OECD (2013b), Health at a Glance 2013: OECD Indicators, OECD, Paris, http://dx.doi.org/10.1787/health_glance-2013-en.
OECD (2013c), OECD Regions at a Glance 2013, OECD, Paris, http://dx.doi.org/10.1787/reg_glance-2013-en.
OECD (2014a), Recommendation of the Council on Digital Governance Strategies, OECD, Paris.
OECD (2014b), Education at a Glance 2014: OECD Indicators, OECD, Paris, http://dx.doi.org/10.1787/eag-2014-en.
OECD (2014c), The Governance of Regulators, OECD Best Practice Principles for Regulatory Policy, OECD, Paris,http://dx.doi.org/10.1787/9789264209015-en.
OECD (2014d), OECD Regulatory Indicators Survey, www.oecd.org/gov/regulatory-policy/Indicators-RMS.htm.
OECD (2014e), “Top Incomes and Taxation in OECD Countries: Was the Crisis a Game Changer?”, OECD,Paris, www.oecd.org/social/OECD2014-FocusOnTopIncomes.pdf.
OECD (2014f), Women, Government and Policy Making in OECD Countries: Fostering Diversity forInclusive Growth, OECD, Paris, http://dx.doi.org/10.1787/9789264210745-en.
OECD (2015a), OECD Regulatory Policy Outlook, OECD, Paris (forthcoming).
OECD (2015b), “Promoting Inclusive Growth Through Better Regulation: The Role of Regulatory ImpactAssessment”, GOV/RPC(2015)4, OECD, Paris.
OECD (2015c); In It Together: Why Less Inequality Benefits All, OECD Publishing, Paris, http://dx.doi.org/10.1787/9789264235120-en.
OECD (2015d), All on Board: Making Inclusive Growth Happen, OECD, Paris, http://dx.doi.org/10.1787/9789264218512-en.
GOVERNMENT AT A GLANCE 2015 © OECD 201548
1. INCLUSIVE GOVERNMENT FOR A MORE INCLUSIVE SOCIETY
Ostry, J.D., A. Berg and C.G. Tsangarides (2014), “Redistribution, Inequality, and Growth”, IMF ResearchDepartment, Staff discussion note.
Owsiak, S. (2003), “The Ethics of Tax Collection”, Finance and Common Good, 13/14: 65-77.
Piketty, T. (2014), Capital in the Twenty-First Century, The Belknap Press of Harvard University Press,Cambridge, Massachusetts.
Pitts, D.W. and L.R. Wise (2010), “Workforce Diversity in the New Millennium: Prospects for Research”,Review of Public Personnel Administration, Vol. 30, No. 1, pp. 44-69.
Reich, R. (2013a), Aftershock: The Next Economy and America’s Future, Vintage, New York.
Reich, R. (2013b), Beyond Outrage: What has Gone Wrong with Our Economy and Our Democracy, and How toFix It, (Expanded Edition), Vintage, New York.
Reich, R. (2015), Saving Capitalism: For the Many Not the Few, Knopf, New York.
Simon, P. (2007), “‘Ethnic’ Statistics and Data Protection in the Council of Europe Countries”, StudyReport, European Commission against Racism and Intolerance, Strasbourg.
Stiglitz, J.E. (2012), The Price of Inequality: How Today’s Divided Society Endangers Our Future, W.W. Norton& Company, New York.
Uslaner, E.M. (2002), The Moral Foundations of Trust, Cambridge University Press, New York.
Uslaner, E.M. (2003), “Trust and Civic Engagement in East and West”, in G. Bedescu and E.M. Uslaner(eds.), Social Capital and the Transition to Democracy, Routledge, London.
Uslaner, E.M. (2008), Corruption, Inequality and the Rule of Law: The Bulging Pocket Makes the Easy Life,Cambridge University Press, New York.
World Justice Project (2014), The Rule of Law Index 2014, World Justice Project, Washington, DC.
You, J.S. and S. Khagram (2005), “A Comparative Study of Inequality and Corruption,” AmericanSociological Review, 70 (February), pp. 136-157.
GOVERNMENT AT A GLANCE 2015 © OECD 2015 49


GOVERNMENT AT A GLANCE 2015 © OEC
2. PUBLIC FINANCE AND ECONOMICS
General government fiscal balance
General government net saving
General government structural balance
General government gross debt
Financial net worth of general government
Fiscal balance and debt by level of government
General government revenues
Structure of general government revenues
Revenue structure by level of government
General government expenditures
Structure of general government expenditures by function (COFOG)
Structure of general government expenditures by economictransaction
Expenditures structure by level of government
Government investment spending
Production costs and outsourcing of general government
D 2015 51

2. PUBLIC FINANCE AND ECONOMICS
General government fiscal balance
Governments spend money in order perform their activi-ties, and the required financial resources to cover govern-ment expenditures are obtained through the collection oftaxes or by contracting debt. The fiscal balance is the differ-ence between government revenues and spending. If in agiven year, a government receives more than it spends, asurplus occurs. Conversely, when the government spendsmore than it receives in revenues, there is a deficit. Consec-utive deficits will lead to mounting debt levels and conse-quently higher payments of interest. The primary balancethat is the balance before interest payments signals thecapacity of governments to honour debt without the needfor further indebtedness.
On average OECD countries reported deficits reaching 4.2%of GDP in 2013. The largest deficits occurred in Slovenia(14.6%), Greece (12.3%) and Japan (8.5%) in the cases of Slo-venia (4.9%) and Greece (3.5%) deficits decreased substan-tially in 2014 as, amongst others, the resources required tocapitalize the banking system were a one off featureaccounted mainly in 2013. Six OECD countries ran sur-pluses in 2013; from those Norway (11.3%), Korea (1.3%) andLuxembourg (0.9%) reported the highest figures. From 2013to 2014, half of the countries with available informationexperienced improvements in their fiscal balances withDenmark (1.2%) and Estonia (0.6%) moving also their bal-ances from a deficit to a surplus.
The average deficit in 2013 was 4.2 percentage points lowerthan in 2009 when it reached a peak of 8.4%, as the effectsof the global financial and economic crisis were moreacute. However, compared to an average deficit of 1.5%in 2007 the current levels are still far from the pre-crisis lev-els. Furthermore, between 2009 and 2013 the fiscal balancedeteriorated in three OECD countries: Slovenia (8.4 p.p.),Sweden and Switzerland (both 0.7 p.p.).
On average, the deficit of the primary balance for OECDcountries was 1.3% of GDP in 2013. However, it varied sub-stantially across countries. Norway (12%), Korea (3.1%), Ice-land (3.0%), Germany (2.2%) and Hungary (2.1%) experiencedhigher surpluses. On the other end of the spectrum, Slovenia(12%), Greece (8.3%) and Japan (6.4%) had primary deficitshigher than 5%. According to the 2013 data, primary deficitsoccurred in around half of OECD countries implying a needto rely on debt to cover their spending. The two countries ofGreece (0.4%) and Estonia (0.7%) shifted from a primary defi-cit in 2013 to a primary surplus in 2014. Consecutive primarydeficits seriously threaten the sustainability of publicfinances in the medium term. For countries with a largepublic debt, achieving a primary balance is often seen as anecessary, though not sufficient condition to stabilize ordiminish debt levels.
Interest payments are the result of previous deficits and inconsequence linked to the size of public debt. On average,in 2013, interest payments in OECD countries amounted to2.9% of GDP; however they ranged from around 5% in Ice-land, Italy and Portugal to less than 0.5% in Estonia andLuxembourg. In OECD countries with available information
no major changes occurred between 2013 and 2014 on thelevel of interest payments (notable is the increase of 1 p.p.of GDP recorded for Slovenia). While paying interest doesnot represent per se a negative feature, if debt continues togrow, it might add further pressure to the sustainability ofpublic finances.
Further reading
OECD (2014a), National Accounts at a Glance 2014, OECD,Paris, http://dx.doi.org/10.1787/na_glance-2014-en.
OECD (2014b), OECD Factbook 2014: Economic, Environmentaland Social Statistics, OECD, Paris, http://dx.doi.org/10.1787/factbook-2014-en.
Figure notes
Data for Colombia and Russia are 2012 rather than 2013.
2.1: Data for Chile and Turkey and are not included in the OECD averagebecause of missing time series. Data for China are 2012 ratherthan 2013.
2.2: Data for Chile and Turkey are not available.
Information on data for Israel: http://dx.doi.org/10.1787/888932315602.
Methodology and definitions
Fiscal balance data are derived from the OECDNational Accounts Statistics (database), based on theSystem of National Accounts (SNA), a set of internation-ally agreed concepts, definitions, classifications andrules for national accounting. The SNA frameworkhas been revised and most of the OECD countrieshave partly or entirely implemented the updated 2008SNA methodology (see Annex A for details). UsingSNA terminology, general government consists ofcentral government, state government, local govern-ment and social security funds. Fiscal balance, alsoreferred to as net lending (+) or net borrowing (-) ofgeneral government, is calculated as total govern-ment revenues minus total government expendi-tures. Revenues encompass taxes, net socialcontributions, and grants and other revenues. Expen-ditures comprise intermediate consumption, com-pensation of employees, subsidies, property income(including interest spending), social benefits, othercurrent expenditures (mainly current transfers) andcapital expenditures (i.e. capital transfers and invest-ments). The primary balance is the fiscal balance netof interest payments on general governmentliabilities.
Gross domestic product (GDP) is the standard mea-sure of the value of goods and services produced by acountry during a period.
GOVERNMENT AT A GLANCE 2015 © OECD 201552

2. PUBLIC FINANCE AND ECONOMICS
General government fiscal balance
2.1. General government fiscal balance as a percentage of GDP, 2007, 2009, 2013 and 2014
Source: OECD National Accounts Statistics (database). Data for the other major economies of Brazil, India, Indonesia and Ukraine are from the IMFEconomic Outlook (April 2015).
1 2 http://dx.doi.org/10.1787/888933248058
2.2. General government primary balance and interest spending as a percentage of GDP, 2013 and 2014
Source: OECD National Accounts Statistics (database).1 2 http://dx.doi.org/10.1787/888933248065
-20
-15
-10
-5
0
5
10
15
20% 201320092007 2014
SVNGRC
JPN
ESP IR
LGBR
USAPRT
OECD W
AISR
FRA
POL ITA BEL
OECD U
WACAN
AUSSVK FIN HUN
NLD ISLSWE
AUTCZE
DNKNZL CHL
EST
CHEMEX
DEU LUX
KORNOR
TURIN
DZAF
UKRBRA
IDN
LVA
COLCHN
RUS
-15
-10
-5
0
5
10
15% Primary balance Interest
2013
2014
2013
2014
2013
2014
2013
2014
2013
2014
2013
2014
2013
2014
2013
2014
2013
2014
2013
2014
2013
2014
2013
2014
2013
2014
2013
2014
2013
2014
2013
2014
2013
2014
2013
2014
2013
2014
2013
2014
2013
2014
2013
2014
2013
2014
2013
2014
2013
2014
2013
2014
2013
2014
2013
2014
2013
2014
2013
2014
2013
2014
2013
2014
2013
2014
2013
2014
2013
2014
2013
2014
2013
2014
2013
2014
SVNGRC
JPN
ESP
GBRUSA
FRA
POLIR
L
OECD W
A FIN NLD SVKAUS
SWE
OECD U
WAES
TISR
PRTCZE
BEL CANDNK
CHEAUT
LUX
NZLMEX ITA HUN
DEU ISLKOR
NORZAF
LVA
COLRUS
GOVERNMENT AT A GLANCE 2015 © OECD 2015 53
2. PUBLIC FINANCE AND ECONOMICS
General government net saving
General government net saving is the difference betweencurrent revenues and current expenditures. In other words,it corresponds to the fiscal balance excluding capitalexpenditures; therefore it does not take into accountinvestment expenditures or capital transfers (e.g. transfersto rescue financial institutions). More generally, govern-ment net saving is typically associated with the “GoldenRule” concept, namely that government current revenuesshould, on average, cover current expenditures in thecourse of an economic cycle. Having consistent negativesavings may thus indicate a situation of unsustainable gov-ernment finances.
In 2013, across OECD countries net saving on averagereached -3.3% of GDP, but varied widely from -7.2% in Japanto 12.6% in Norway. While net saving has recovered from anaverage of -6.3% of GDP in 2009 when the global economicand financial crisis reached its peak, it is still far from theaverage value in 2007 of -0.2%. Between 2009 and 2014 forthe OECD countries with available information the net sav-ing deteriorated in Norway (1.4 p.p.), Korea (0.9 p.p.), Sweden(0.8 p.p.) and Finland (0.7 p.p.). However, in the cases ofKorea and Norway it reports positive balances of 4.0% and10.6% respectively as a share of GDP.
The difference between net lending/borrowing and net sav-ing is equal to the size of capital expenditures. Large differ-ences could either indicate substantial investmentprogrammes such as in Mexico or an outflow of capitaltransfers as was the case in Slovenia and Greece. Six OECDcountries, namely Korea, Luxembourg, Germany, Mexico,Norway and Switzerland experienced a surplus in the fiscalbalance after capital expenditures in 2013. A similar patternis observed in 2014 for these countries with available infor-mation and additionally for Denmark and Estonia.
On average across OECD countries the deficit (net lending/borrowing) was 0.9 p.p. higher than the net saving in 2013.The highest negative differences between net lending/bor-rowing and net saving occurred in Slovenia (11.5 p.p.) andGreece (8.5 p.p.). In the case of Slovenia, the bulk of the dif-ference is due to the net capital transfers (10% of GDP)mainly explained by the plan launched in late 2013 by theSlovenian government to restructure the banking sector,including important injections of cash and governmentsecurities. In the case of Greece, where a similar pattern isobserved, it partially corresponded to the capitalisation ofthe Hellenic Financial Stability Fund, established in 2010 tocontribute to the maintenance of the Greek banking sys-tem. In 2014 the situation of both of these countries drasti-cally changed as most of the adjustment was accountedin 2013; therefore the differences between net lending/bor-rowing and net saving amounted to -2.4 p.p. in the case ofSlovenia and to +0.9 p.p. in the case of Greece, for the latterthe improved fiscal balance was the result of positive netcapital transfers amounting to 1.2 as a share of GDP in 2014.
Further reading
OECD (2014a), National Accounts at a Glance 2014, OECD,Paris, http://dx.doi.org/10.1787/na_glance-2014-en.
Figure notes
2.3 and 2.4: Data for Chile are not available. Data for Colombia andRussia are 2012 rather than 2013.
2.3: Data for Turkey and are not included in the OECD average because ofmissing time series.
2.4: Data for Turkey are not available.
Information on data for Israel: http://dx.doi.org/10.1787/888932315602.
Methodology and definitions
Data are derived from the OECD National Accounts Sta-tistics (database), based on the System of NationalAccounts (SNA), a set of internationally agreed con-cepts, definitions, classifications and rules for nationalaccounting. The SNA framework was revised and mostof the OECD countries have partly or entirely imple-mented the updated 2008 SNA methodology (seeAnnex A for details). Government net saving repre-sents current revenues minus current expendituresincluding depreciation. In the case of gross saving, thecosts of depreciation have not been deducted from cur-rent expenditures. Gross saving plus net capital trans-fers (i.e. capital transfers received minus paid) minusgovernment investments (i.e. gross capital formationand acquisitions less disposals of non-producednon-financial assets) equals the fiscal balance of netlending/borrowing. (For additional information on gov-ernment fiscal balance, see the “methodology and def-initions” section of this indicator). In this respect, netlending/borrowing reflects the fiscal position afteraccounting for capital expenditures: net lending, orgovernment surplus, means that government is pro-viding financial resources to other sectors, whereasnet borrowing, or government deficit, signifies thatgovernment on balance requires financial resourcesfrom other sectors to finance part of its expenditures.As compared to net lending/borrowing, net saving hasthe advantage of avoiding possible one-off distortionscoming from extra-ordinary and possibly very largecapital transfers. It also avoids putting too much pres-sure on government investments in times of austerityprogrammes and increasing deficits. Figure 2.5, Netcapital transfers as percentage of GDP is availableonline at: http://dx.doi.org/10.1787/888933248090.
GOVERNMENT AT A GLANCE 2015 © OECD 201554

2. PUBLIC FINANCE AND ECONOMICS
General government net saving
2.3. General government net saving as a percentage of GDP, 2007, 2009, 2013 and 2014
Source: OECD National Accounts Statistics (database).1 2 http://dx.doi.org/10.1787/888933248077
2.4. General government net saving versus net lending/borrowing as a percentage of GDP, 2013 and 2014
Source: OECD National Accounts Statistics (database).1 2 http://dx.doi.org/10.1787/888933248082
-15
-10
-5
0
5
10
15
20% 2013
JPN
ESP IR
LPRT
USAGBR
GRCSVK
OECD W
AISR
SVNPOL
HUNFR
A ITA CZENLD BEL FIN CAN
OECD U
WA ISLAUS
AUTSWE
DNKDEU CHE
EST
NZLMEX
LUX
KORNOR
TURZAF
LVA
COLRUS
2007 2009 2014
-15
-10
-5
0
5
10
15
% Net saving, 2013 Net lending/borrowing, 2013
SVNGRC
JPN
ESP IR
LGBR
USAPRT
OECD W
AISR
FRA
POL ITA BEL
OECD U
WACAN
AUSSVK FIN HUN
NLD ISLSWE
AUTCZE
DNKNZL ES
TCHE
MEXDEU LU
XKOR
NORZAF
LVA
COLRUS
Net saving, 2014 Net lending/borrowing, 2014
GOVERNMENT AT A GLANCE 2015 © OECD 2015 55

2. PUBLIC FINANCE AND ECONOMICS
General government structural balance
The structural or underlying fiscal balance is the differencebetween government revenues and expenditures correctedby the effects that could be attributed to the economic cycleand one off events. This indicator aims to capture struc-tural trends in order to assess whether the fiscal policy of acountry is expansionary, neutral or restrictive for a givenperiod. In fact, government revenues and expenditures arehighly sensitive to economic developments. For example,during an economic downturn, cyclical deficits result inlower revenues while at the same time public spendingincrease as higher unemployment determine additionalspending on unemployment benefits. In consequence,eliminating the fluctuations occurred in the economiesenable policy makers to identify the underlying trend of fis-cal policies that are associated with the sustainability ofpublic finances in the long run.
In 2013, the structural fiscal balance reached an averagedeficit of 3.5% as a share of potential GDP in OECD coun-tries and decreased to an average of 3.1% in 2014. Accord-ing to the latest avai lable data Japan (-7 .2%) ,the United Kingdom (-5.8%) and the United States (-4.2%)experienced the largest cyclically adjusted deficits. Oppo-sitely, five OECD countries; Luxembourg (2.1%), Estonia(1.9%), New Zealand (1.5%), Greece (1.3%) and Denmark(1.1%) reported structural surpluses above 1% of potentialGDP. In the case of Greece it is worth mentioning thereverted structural balance recorded in 2013 as comparedto the previous years of continuous structural deficits. Infact, for this country after six years of deep recession andmajor consolidation efforts growth is projected to return toa positive trend if structural reforms continue and debt lev-els are prudently managed (OECD 2014).
Between 2007 and 2014 the structural deficit increased by0.2 p.p. on average across OECD countries. However, thisunderlying balance experienced movements in oppositedirections during this time period. Between 2013 and 2014the average def ic i t decreased by 0.4 p.p. whi lebetween 2007 and 2013 it increased by 0.6 p.p. althoughrecovering substantially compared to the 2009 peak deficitof 7.1% of the potential GDP reached as the result of theeffects of the crisis. Between 2007 and 2009 the structuralfiscal situation deteriorated the most in Iceland (11.5 p.p.),Spain (9.7 p.p.), the United States (5.6 p.p.), New Zealand(5.4 p.p.), Australia (5.2 p.p.), Ireland (5.1 p.p.) and Greece(5.0 p.p.).
It is important to notice that the differences between theunderlying balance and the net lending/borrowing (fiscalbalance) could be remarkable. For example in 2013 Greecereported an underlying balance with a surplus of 3.5% as ashare of potential GDP, whereas the corresponding fiscal
balance experienced a deficit of 12.3% as share of GDP, thedifference between both indicators was due to a combina-tion of cyclical components and one off factors as the capi-talisation of a fund to rescue the banking sector (seeindicators on General government fiscal balance and Gen-eral government net saving).
Across OECD countries, the projections of the structuralbalance as a share of potential GDP display a diminishingtrend for deficits, reaching an average of 2.7% and 2.3% as ashare potential GDP in 2015 and 2016 respectively. As eco-nomic growth strengthens and fiscal consolidation contin-ues to ease, temporary cyclical obstacles hampering therecovery could be removed, under this scenario thedecreasing trend in structurally adjusted deficits isexpected to continue (OECD, 2014).
Further reading
OECD (2015), OECD Economic Outlook: Vol. 2015/1 (Prelimi-nary version), OECD Publishing, Paris, http://dx.doi.org/10.1787/eco_outlook-v2015-1-en.
Figure notes
Data for Chile, Mexico, the Slovak Republic and Turkey are not available.OECD unweighted average is not presented.
Information on data for Israel: http://dx.doi.org/10.1787/888932315602.
Methodology and definitions
Data are drawn from the OECD Economic Outlook,No. 97 (database).
The structural fiscal balance, or underlying balance,represents the fiscal balance as reported in the Systemof National Accounts (SNA) framework adjusted for twofactors: the state of the economic cycle (as measuredby the output gap) and one-off fiscal operations. Theoutput gap measures the difference between actualand potential GDP, the latter being an estimate of thelevel of GDP that would prevail if the economy wereworking at full capacity. Potential GDP is not directlyobservable and estimates are subject to substantialmargins of error. One-off factors include both excep-tional and irregular fiscal transactions as well as devi-ations from trend in net capital transfers. For moredetails, see OECD Economic Outlook “Sources and Meth-ods” (www.oecd.org/eco/sources-and-methods).
GOVERNMENT AT A GLANCE 2015 © OECD 201556

2. PUBLIC FINANCE AND ECONOMICS
General government structural balance
2.6. General government structural balance as a percentage of potential GDP, 2007, 2009, 2013 and 2014
Source: OECD Economic Outlook, No. 97 (Preliminary version), May 2015.1 2 http://dx.doi.org/10.1787/888933248109
-20
-15
-10
-5
0
5
10%
JPN
GBRUSA
ISR IRL
POL
OECD W
AFR
AES
PSVN
CANBEL PRT
NLD FIN HUNAUS
AUT ISLSWE
NORCZE ITA DNK
DEU CHEES
TKOR
NZL LUX
GRC
20132007 2009 2014
2.7. General government projected structural balance as a percentage of potential GDP in 2015 and 2016
Source: OECD Economic Outlook, No. 97 (Preliminary version), May 2015.1 2 http://dx.doi.org/10.1787/888933248116
-10
-5
0
5
10%
JPN
GBR ISRUSA
HUNPOL
OECD W
AES
PSVN IR
LFR
AAUS
BEL FIN DNKCAN
CZENLD NOR
AUTPRT
SWE ISLKOR
DEU ITA CHEGRC
EST
LUX
NZL
2015 2016
GOVERNMENT AT A GLANCE 2015 © OECD 2015 57

2. PUBLIC FINANCE AND ECONOMICS
General government gross debt
Governments accumulate debt to finance expendituresabove their revenues. As a result of the crisis, manyOECD countries raised spending via stimulus packages andinterventions to support financial institutions, thereforeincurring public debt. In many OECD countries revenue col-lections also decreased, adding pressure to public finances.
In 2013, the average debt level in OECD countries reached109.3% of GDP. Between 2007 and 2013, debt increased by34.7 p.p. across OECD countries, with general governmentdebt increasing except in Israel, Sweden, Switzerland andNorway. The highest increases were in Ireland, Greece andPortugal, countries severely affected by the crisis and tar-geted by special EU financial rescue programmes.From 2013 to 2014, debt decreased in Czech Republic,Ireland, Norway and Slovak Republic, while the highestincreases in debt occurred in Slovenia, Spain, Italy andBelgium. Between 2007 and 2013, the annual averagegrowth rate of real government debt per capita inOECD countries was 6.7%, reaching an average ofUSD 42 863 PPP in 2013. Nonetheless, debt per capita varieswidely, from USD 86 682 PPP in Japan to USD 3 491 PPP inEstonia. However, in Japan, the majority of governmentdebt is domestically owned, which has contributed to a sta-ble issuance.
Public debt instruments have different types; the mostcommon are loans granted by financial institutions or debtsecurities, which are bonds issued by governments. InOECD countries debt securities represented on average 77%of overall debt in 2013, ranging from around 90% in Koreaand Israel to 11% in Estonia. In contrast, in Greece (74.6%)and Estonia (63.5%) the majority of debt was represented inloans.
Figure notes
Data for New Zealand are not available. Data for Korea and Switzerlandare for 2012 rather than 2013.
2.8: Data for Turkey are not included in the OECD average because ofmissing time-series.
2.8 and 2.9: Data for Mexico are not included in the OECD average due tomissing time-series.
2.10: Data for Mexico are not available. Data for Australia, Canada,Iceland, Sweden and the United States are not adjusted for theunfunded pension liabilities.
Information on data for Israel: http://dx.doi.org/10.1787/888932315602.
Methodology and definitions
Data are derived from the OECD National Accounts Sta-tistics (database) and Eurostat Government finance statis-tics (database), which are based on the System ofNational Accounts (SNA). The SNA framework wasrevised and most of the OECD countries have partly orentirely implemented the updated 2008 SNA method-ology (see Annex A). Debt is a commonly used con-cept, defined as a specific subset of liabilitiesidentified according to the types of financial instru-ments included or excluded. Generally, it is defined asall liabilities that require payment or payments ofinterest or principal by the debtor to the creditor at adate or dates in the future. All debt instruments areliabilities, but some liabilities such as shares, equityand financial derivatives are not debt.
Debt is thus obtained as the sum of these liabilitycategories, whenever available/applicable in the finan-cial balance sheet of the general government sector:currency and deposits; debt securities; loans; insurance,pension and standardised guarantee schemes; and
other accounts payable, as well as, in some cases spe-cial drawing rights (SDRs) (the last two includedunder other liabilities in Figure 2.10). According to theSNA, most debt instruments are valued at marketprices, when appropriate (although some countriesmight not apply this valuation, in particular for debtsecurities).
The treatment of government liabilities in respect oftheir employee pension plans varies across countries,making international comparability difficult. Inthe 1993 SNA, only the funded component of the gov-ernment employee pension plans was reflected in itsliabilities. However, the 2008 SNA recognises theimportance of the liabilities of employers’ pensionschemes, regardless of whether they are funded orunfunded. For pensions provided by government totheir employees, countries have some flexibility inrecording unfunded liabilities in the core tables; thishas also been followed by the ESA 2010, its Europeanequivalent (although a new supplementary table willbe added showing liabilities and associated flows ofall pension schemes, whether funded or unfunded).Some OECD countries, e.g. Australia, Canada, Iceland,Sweden and the United States (including otherswhose data source is the IMF Economic Outlook), recordemployment-related pension liabilities, funded orunfunded, in government debt data. For those coun-tries (except non-OECD ones), an adjusted govern-ment debt ratio is calculated by excluding from thedebt these unfunded pension liabilities. Governmentdebt here is recorded on a gross basis, not adjusted bythe value of government-held assets.
The SNA debt definition differs from the definitionapplied under the Maastricht Treaty, which is used toassess EU fiscal positions.
For information on the calculation of governmentdebt per capita see the “methodology and definitions”section of the government revenues indicator. Figure2.11, “Annual average growth rate of real governmentdebt per capita, 2007-13, 2009-13 and 2009-14”, avail-able online at http://dx.doi.org/10.1787/888933248150.
GOVERNMENT AT A GLANCE 2015 © OECD 201558

2. PUBLIC FINANCE AND ECONOMICS
General government gross debt
2.8. General government debt as a percentage of GDP, 2007, 2009, 2013 and 2014
Sources: OECD National Accounts Statistics (database); Eurostat Government Finance Statistics (database). Data for the other major economies and Russia arefrom the IMF Economic Outlook (April 2015).
1 2 http://dx.doi.org/10.1787/888933248129
2.9. General government debt per capita, 2009, 2013 and 2014
Sources: OECD National Accounts Statistics (database); Eurostat Government Finance Statistics (database). Data for the other major economies and Russia arefrom the IMF Economic Outlook (April 2015).
1 2 http://dx.doi.org/10.1787/888933248134
2.10. Structure of government debt by financial instruments, 2013
Sources: OECD National Accounts Statistics (database); Eurostat Government finance statistics (database).1 2 http://dx.doi.org/10.1787/888933248145
0
40
80
120
160
200
240%
IND
BRACOL
ZAFLV
AUKR
CHNID
NRUS
04080
120160200240
2013 201420072009
JPN
GRC ITA PRTIR
LBEL
USA
OECD W
AFR
AUSA
ISL
ESP
GBR
CAN
HUNCAN
AUT ISL
OECD U
WADEU SVN ISR
NLD FIN POLSVK
CZE
AUS
DNKCHE
SWE
SWE
TURAUS
NORKOR
LUX
CHLES
TMEX
Unadjusted debt (including unfunded pension liabilities)
10 000
0
20 000
30 000
40 000
50 000
60 000
70 000
80 000
90 000
20 000
0
40 000
60 000
80 000
2013 20142009Unadjusted debt (including unfunded pension liabilities)
JPN IR
LUSA ITA BEL GRC
OECD W
AFR
AAUT
CANPRT
GBR ISLNLD DEU ES
P
OECD U
WALU
X FIN CHEISR
DNKNOR
SVNHUN
SWECZE
AUSSVK
POLKOR
TURCHL
EST
MEXBRA
LVA
COLZAF
CHNUKR
IND
RUSID
N
AUSCAN ISL
SWEUSA
USD PPP
%
0
20
40
60
80
100
Debt securities Loans Currency and deposits Insurance pension and standardised guarantees Other liabilities
KOR ISRGBR
JPN
AUTBEL ITA SVN
USASVK
TURCZE
NLD ESP
FRA
POLCHL
DEU FIN DNKHUN
CANSWE
IRL
CHENOR
PRTLU
X ISLAUS
GRCES
T
OECD W
A
OECD U
WACOL
LVA
GOVERNMENT AT A GLANCE 2015 © OECD 2015 59

2. PUBLIC FINANCE AND ECONOMICS
Financial net worth of general government
The analysis of the difference between the financial assetsand liabilities held by governments (also known as finan-cial net worth or as a broad description of net governmentdebt), gives an extensive measure of the government’scapacity to meet its financial obligations. While the assetsreflect a source of additional funding and income availableto government, liabilities reflect the debts accumulated bygovernment. Thus, a consistent increase in the govern-ment’s financial net worth over time indicates good finan-cial health. Conversely, net worth may be depleted by debtsaccumulated by government, indicating a worsening of fiscalposition and ultimately forcing governments to either cutspending or raise taxes.
In 2013, OECD countries recorded on average a negativefinancial net worth of 65.3% of the GDP. This figure almostdoubles the pre-crisis negative level (38.1% in 2007) reflect-ing the effects of the global financial crisis on governmentdeficit and debt. Japan, Italy and Greece were the countrieswith the largest negative financial net worth (showing val-ues above their GDP), while only eight OECD countriesshowed a positive financial net worth. Among the latter,Norway was the country with the largest positive financialnet worth (above two times their GDP). In 2014, countrieslike Portugal and Belgium also showed negative financialnet worth above their GDP.
Between 2007 and 2013, the largest declines in financial networth occurred in Ireland (84.4 p.p.), Spain (51.5 p.p.) andIceland (47.8 p.p.), showing the financial impact of govern-ment interventions into the banking sector over thisperiod. To a lesser extent, other OECD countries such asPortugal and the United States showed their financial networth drop during this period due to sharp decreases in thevalue of assets and increased liabilities from fiscal stimuluspackages. Only four OECD countries saw their net worthincrease between the years 2007 and 2013, namely, Estonia(3.8 p.p.), Norway (66.9 p.p.), Sweden (8.7 p.p.) and Switzer-land (1.4 p.p.). Trend that was also maintained between theyear 2007 and 2014.
On average, the financial net worth representedUSD -25 504 PPP per capita in 2013 (around USD 7 000 lowerthan in 2009). The levels observed across countries vary sig-nificantly, from USD -44 610 in Japan and USD -41 734 inthe United States to USD 134 075 in Norway. Additionally,among all OECD countries, less than a quarter of them(Estonia, Greece, Korea, Sweden, Turkey and Norway) dis-played an improvement of the government financial networth per capita between the years 2009 and 2013.
Further reading
OECD (2014), National Accounts at a Glance 2014, OECD, Paris,http://dx.doi.org/10.1787/na_glance-2014-en.
Figure notes
Data for New Zealand are not available. Data for Mexico are not includedin the OECD average due to missing time-series. Data for Korea andSwitzerland are for 2012 rather than 2013. Data for Chile, Japan andKorea are reported on a non-consolidated basis.
2.12: Data for Turkey are not included in the OECD average due to miss-ing time-series.
Information on data for Israel: http://dx.doi.org/10.1787/88932315602.
Methodology and definitions
Data are derived from the OECD National Accounts Sta-tistics (database) and Eurostat Government finance statis-tics (database), which are on the System of NationalAccounts (SNA), a set of internationally agreedconcepts, definitions, classifications and rules for
national accounting. The SNA framework has beenrevised and most of the OECD countries have partly orentirely implemented the updated 2008 SNA method-ology (see Annex A for details). The financial networth of the general government sector is the totalvalue of its financial assets minus the total value ofits outstanding liabilities. The SNA defines the finan-cial assets and the corresponding liabilities whereapplicable/available in the financial balance sheet ofthe institutional sector: monetary gold and SDRs; cur-rency and deposits; debt securities; loans; equity andinvestment fund shares; insurance, pension and stan-dardised guarantee schemes; financial derivativesand employee stock options; and other accountsreceivable/payable. According to the SNA, stocks offinancial assets and liabilities are valued at marketprices, when appropriate (although some countriesmight not apply this valuation, in particular for debtsecurities). Data are based on consolidated financialassets and liabilities except for Chile, Japan andKorea.
This indicator can be used as proxy measure for netgovernment debt as, similarly to the definition ofgross debt, the net debt can be restricted to gross debtminus financial assets corresponding to debt instru-ments (concept as defined in the Public Sector Debt Sta-tistics: Guide for Compilers and Users).
The institutional set-up of recording unfunded liabili-ties of government employees can have an impact onfinancial net worth of general government in diversecountries, making international comparability difficult.This is the case for some OECD countries such asAustralia, Canada, Iceland, Sweden and theUnited States. For that reason, in analogy to the gov-ernment gross debt an adjusted financial net worth iscalculated for these countries.
For information on the calculation of financial networth per capita please see “methodology and defini-tions” section of government revenues indicator.
GOVERNMENT AT A GLANCE 2015 © OECD 201560

2. PUBLIC FINANCE AND ECONOMICS
Financial net worth of general government
2.12. General government financial net worth as a percentage of GDP, 2007, 2009, 2013 and 2014
Sources: OECD National Accounts Statistics (database); Eurostat Government Finance Statistics (database).1 2 http://dx.doi.org/10.1787/888933248163
-180
-140
-100
-60
-20
20
60
100
140
180
220
260%
-100
-60
-20
20
60
2013 201420072009
JPN ITA GRC
PRTBEL IR
LUSA
HUNFR
AES
PGBR
OECD W
AAUT
ISRDEU NLD CAN
POLSVK
OECD U
WA ISLSVN
TURCZE
CHEDNK
CHLAUS
SWEES
TKOR
LUX FIN NOR
MEXCOL
LVA
Unadjusted financial net worth(including unfunded pension liabilities)
AUSCAN ISL
SWEUSA
2.13. General government financial net worth per capita, 2009, 2013 and 2014
Sources: OECD National Accounts Statistics (database); Eurostat Government Finance Statistics (database).1 2 http://dx.doi.org/10.1787/888933248172
-70 000
-50 000
-30 000
-10 000
10 000
30 000
50 000
70 000
90 000
110 000
130 000
150 000
-70 000
-50 000
-30 000
-10 000
10 000
30 000
2013 2009 2014USD PPP
JPN
USA ITA IRL
BEL GRCPRT
FRA
OECD W
AGBR
AUTES
PDEU NLD ISR
CANHUN ISL
SVKPOL
OECD U
WASVN
CZECHE
TURDNK
CHLAUS
EST
SWEKOR FIN LU
XNOR
MEXCOL
LVA
Unadjusted financial net worth(including unfunded pension liabilities)
AUSCAN ISL
SWEUSA
GOVERNMENT AT A GLANCE 2015 © OECD 2015 61

2. PUBLIC FINANCE AND ECONOMICS
Fiscal balance and debt by level of government
Fiscal balance for a given level of government (fromnational to local) is achieved when expenditures and reve-nues are balanced. The situation where revenues exceedexpenses (positive balance) is called a surplus. On the con-trary, a negative balance is called a deficit. While balancesare consolidated across all levels of government, dependingon the political and administrative structure, central andsub-central governments share different degrees of fiscalsovereignty. For example in federal countries, states havehigher autonomy to contract debt and levy taxes. The gen-eral government debt (across all levels of government)might be affected by modest changes in debt by a largenumber of sub-central governments. Liabilities fromsub-central governments resulting from the need tofinance deficits through borrowing are considered as debtof the sub-central governments. However, the capacity ofsub-central governments to incur debt is often limitedsince they are usually subject to tight fiscal rules.
In 2013, central governments had a fiscal deficit reachingon average 3.5% of GDP, 0.7 percentage points lower thanthe average deficit of the general government (4.2%).Greece and Slovenia were the two OECD countries withlarger deficits at the central government level (close to 15%of the GDP). In contrast, Norway, Chile and New Zealandshowed a surplus (12%, 2% and 0.02% of the GDP respec-tively). In 2014, countries such as Norway, Denmark,Germany, Estonia, and Canada also experienced a surplus.In federal (or quasi-federal) states such as Spain, theUnited States, Canada and Australia over a quarter of 2013general government balances were driven by the statelevel.
On average, sub-central debt accounted for 20.7% of GDPin 2013. Six OECD member countries have figures above theOECD average, namely Canada (55.9%), Japan (37.3%),Germany (29.8%), Spain (29.3%), Switzerland (22.3%) andthe United States (22.2%). Additionally, in 2013 and 2014debt levels at sub-central level were on average higher infederal states, and sometimes state government debt waseven higher than central government debt (e.g. Canada).
The structure of debt across levels of governmentbetween 2007 and 2013 indicates that debt for sub-centralgovernments as a share of total debt decreased on averageby 6.2 percentage points. A considerable decline in theshare of sub-central debt occurred in the United States(13.7 p.p.), Estonia (11.8 p.p.), Iceland (10.9 p.p.), Denmark(8.9 p.p.), the United Kingdom (8.3 p.p.) and Ireland(7.1 p.p.). However, as overall debt levels have continued toincrease in these countries, the declines can be attributedto a slower growth of the debt at the sub-central levelscompared to the growth of debt at the central level.
Further reading
OECD (2013), OECD Regions at a Glance 2013, OECD, Paris,http://dx.doi.org/10.1787/reg_glance-2013-en.
Vammalle, C. and C. Hulbert (2013), “Sub-national Financesand Fiscal Consolidation: Walking on Thin Ice”, OECDRegional Development Working Papers, 2013/02, OECD, http://dx.doi.org/10.1787/5k49m8cqkcf3-en.
Figure notes
Local government is included in state government for Australia andthe United States. Australia does not operate government socialinsurance schemes. For Japan data for sub-sectors of general govern-ment refer to fiscal year. Social security funds are included in centralgovernment in Norway, the United Kingdom and the United States.
2.15 and 2.16: Data for Chile and New Zealand are not available. Data forKorea and Switzerland are for 2012 rather than 2013. Data for Japan,Korea, Switzerland and the United States are reported on a non-consolidated basis.
2.14: Data for Turkey are not available. Data for Chile are not included inthe OECD average. Data for Colombia are for 2012 rather than 2013.Social security funds are included in central government in Ireland.
2.15: Data for Mexico are not available.
2.16: Data are consolidated within the subsectors of general govern-ment. However, at the level of general government, flows betweenlevels of government are included. Data for Mexico and Turkey arenot included in the OECD average due to missing time-series.
Information on data for Israel: http://dx.doi.org/10.1787/88932315602.
Methodology and definitions
Data are derived from the OECD National Accounts Sta-tistics (database) and Eurostat Government finance statis-tics (database), which are based on the System ofNational Accounts (SNA), a set of internationallyagreed concepts, definitions, classifications and rulesfor national accounting. The SNA framework hasbeen modified and most of the OECD countries havepartly or entirely implemented the updated 2008 SNAmethodology (see Annex A for details). Using SNA ter-minology, general government consists of central,state and local governments, and social securityfunds. State government is only applicable to the nineOECD countries that are federal states: Australia,Austria, Belgium, Canada, Germany, Mexico, Spain(considered a quasi-federal country), Switzerland andthe United States.
Fiscal balance also referred to as net leading (+) or netborrowing (-) of general government, is calculated astotal government revenues minus total governmentexpenditures.
For additional information on debt, see the “method-ology and definitions” section of the governmentgross debt indicator.
GOVERNMENT AT A GLANCE 2015 © OECD 201562

2. PUBLIC FINANCE AND ECONOMICS
Fiscal balance and debt by level of government
2.14. Government fiscal balances across levels of government as percentage of GDP, 2013 and 2014
Sources: OECD National Accounts Statistics (database).1 2 http://dx.doi.org/10.1787/888933248182
2.15. Government gross debt across levels of government as percentage of GDP, 2013 and 2014
Sources: OECD National Accounts Statistics (database); Eurostat Government Finance Statistics (database).1 2 http://dx.doi.org/10.1787/888933248190
2.16. Distribution of government gross debt across levels of government, 2007 and 2013
Sources: OECD National Accounts Statistics (database); Eurostat Government Finance Statistics (database).1 2 http://dx.doi.org/10.1787/888933248201
%
2013
2014
2013
2014
2013
2014
2013
2014
2013
2014
2013
2014
2013
2014
2013
2014
2013
2014
2013
2014
2013
2014
2013
2014
2013
2014
2013
2014
2013
2014
2013
2014
2013
2014
2013
2014
2013
2014
2013
2014
2013
2014
2013
2014
2013
2014
2013
2014
2013
2014
2013
2014
2013
2014
2013
2014
2013
2014
2013
2014
2013
2014
2013
2014
2013
2014
2013
2014
2013
2014
2013
2014
-15
-10
-5
0
5
10
15Central government State government Local government Social security funds
GRCSVN
JPN IR
LGBR
HUNPRT
ESP
ISRUSA FIN POL
OECD W
AFR
A ITA
OECD U
WASVK
BEL ISLKOR
CZEAUS
AUTDNK
LUX
SWENLD MEX
CANDEU ES
TCHE
NZL CHLNOR
LVA
%
2013
2014
2013
2014
2013
2014
2013
2014
2013
2014
2013
2014
2013
2014
2013
2014
2013
2014
2013
2014
2013
2014
2013
2014
2013
2014
2013
2014
2013
2014
2013
2014
2013
2014
2013
2014
2013
2014
2013
2014
2013
2014
2013
2014
2013
2014
2013
2014
2013
2014
2013
2014
2013
2014
2013
2014
2013
2014
2013
2014
2013
2014
2013
2014
2013
2014
2013
2014
0
50
100
150
200
250
JPN
GRCPRT
IRL ITA BEL GBR
HUN ISRFR
AES
PUSA ISL
AUTSVN
NLD SVKPOL FIN CZE
DEU DNKTUR
CANSWE
KORAUS
LUX
CHENOR
EST
COL
050
100150200250
2013
2014
2013
2014
2013
2014
2013
2014
2013
2014
Central government State government Local government Social security
Unadjusted debt (including unfunded pension liabilities)
OECD W
A
OECD U
WA
AUSCAN ISL
SWEUSA
%
2007
2013
2007
2013
2007
2013
2007
2013
2007
2013
2007
2013
2007
2013
2007
2013
2007
2013
2007
2013
2007
2013
2007
2013
2007
2013
2007
2013
2007
2013
2007
2013
2007
2013
2007
2013
2007
2013
2007
2013
2007
2013
2007
2013
2007
2013
2007
2013
2007
2013
2007
2013
2007
2013
2007
2013
2007
2013
2007
2013
2007
2013
2007
2013
2007
2013
2007
2013
2007
2013
0
20
40
60
80
100Central government State government Local government Social security
IRL
HUN ISRGRC
MEXKOR
SVNPRT
SVK ITA CZEGBR
TUR ISLPOL
AUTJP
NBEL FIN DNK
LUX
NLD USAFR
ASWE
ESP
AUSES
TDEU NOR
CHECAN
OECD U
WA
OECD W
ACOL
GOVERNMENT AT A GLANCE 2015 © OECD 2015 63

2. PUBLIC FINANCE AND ECONOMICS
General government revenues
Revenues raised by governments are used to finance theprovision of goods and services and carry out a redistribu-tive role. The main two sources of government revenues aretaxes and social contributions. The amount of revenuesraised by governments is related to the economic fluctua-tions associated to the business cycle as well as historicaland current policy choices. For example, governmentscould choose to provide pensions directly, or allow the pro-vision of retirement benefits by private providers. Theirdecision will affect how much government revenue theyneed to raise and by which instrument (e.g. taxes or socialcontributions). While for a certain period of time additionalrevenue requirements could be financed by acquiring debt,in the long run, revenues and expenditures should be bal-anced to guarantee the sustainability of public finances.
In 2013, general government revenues represented on aver-age 37.7% of GDP across OECD countries, a similar figure topre-crisis levels (37.5% in 2007). However, between 2007and 2009 average revenues decreased by 1.4 percentagespoints reaching 36.0% of GDP. This decline could be primar-ily attributed to sluggish or diminishing economic growthduring the global financial and economic crisis. In 2013 theamount of revenues collected across countries varied sig-nificantly. On the one hand, the general government reve-nues in Denmark, Norway, Finland, France, Sweden andBelgium were above 50% of GDP. On the other end of thedistribution Australia, Japan, Switzerland, the United Statesand Korea collected around one third of GDP, while Mexicowas below one quarter. According to the latest data, onlyavailable for a subset of OECD countries, government reve-nues remained fairly stable between 2013 and 2014.Denmark (2.5 p.p.) experienced the highest increase in reve-nues that can be partially attributed to the return of eco-nomic growth and enhanced internal demand (OECD 2014a).
An alternative way of comparing the size of government rev-enues is by looking at the revenues collected per capita.In 2013, OECD countries collected on average USD 16 851 PPPper capita, and the two countries with the highest collec-tions were Luxembourg and Norway (USD 40 295 PPP andUSD 36 431 PPP respectively). In the case of Luxembourg thiscould be explained by the relative importance of cross-bor-der workers who although working in Luxembourg, are notcounted as residents. In the case of Norway, collectionratios can be attributed to oil revenues. In contrast, reve-nues per capita are relatively lower in eastern Europeancountries that have, in general, weaker tax systems.
Between 2007 and 2013, the real government revenues percapita increased on average at an annual pace of 0.13%across OECD member countries. Nonetheless, the pacesped up between 2009 and 2013 of the real government rev-enues per capita increased by 2.4% each year and for OECDcountries with available information continued to be fairlystable when adding an additional year (i.e. for the 2009-14period). In contrast, accession countries and strategic part-
ners reported a vigorous growth rate in revenues per capitabetween 2009 and 2013, although with a slowdown whenan additional year is added (2009-14) in the cases wheredata are available. All in all, these figures show that theeffects of the global financial and economic crisis deeplychallenged the ability of governments to collect revenues inOECD countries compared to countries in other regions ofthe world. However, for this last group the trend seems tobe changing as economic growth is slowing down.
Further reading
OECD (2014), National Accounts at a Glance 2014, OECD, Paris,http://dx.doi.org/10.1787/na_glance-2014-en.
Figure notes
Data for Chile are not available. Data for Colombia and Russia are 2012rather than 2013.
2.17 and 2.18: Data for Turkey and are not included in the OECD averagedue to missing time-series.
2.19: Data for Turkey are not available.
Information on data for Israel: http://dx.doi.org/10.1787/888932315602.
Methodology and definitions
Revenues data are derived from the OECD NationalAccounts Statistics (database), which are based on theSystem of National Accounts (SNA), a set of internation-ally agreed concepts, definitions, classifications andrules for national accounting. There have been revi-sions in the SNA framework and most of theOECD countries have partly or entirely implementedthe updated 2008 SNA methodology (see Annex A fordetails). Using SNA terminology, general governmentconsists of central government, state government,local government and social security funds. Revenuesencompass taxes, net social contributions, and grantsand other revenues. Gross domestic product (GDP) isthe standard measure of the value of goods and ser-vices produced by a country during a period.
Government revenues per capita were calculated byconverting total revenues to USD 2011 using theOECD/Eurostat purchasing power parities (PPP) forGDP and dividing them by population. For the coun-tries whose data source is the IMF Economic Outlook animplied PPP conversion rate was used. PPP is the num-ber of units of country B’s currency needed to pur-chase the same quantity of goods and services incountry A.
GOVERNMENT AT A GLANCE 2015 © OECD 201564
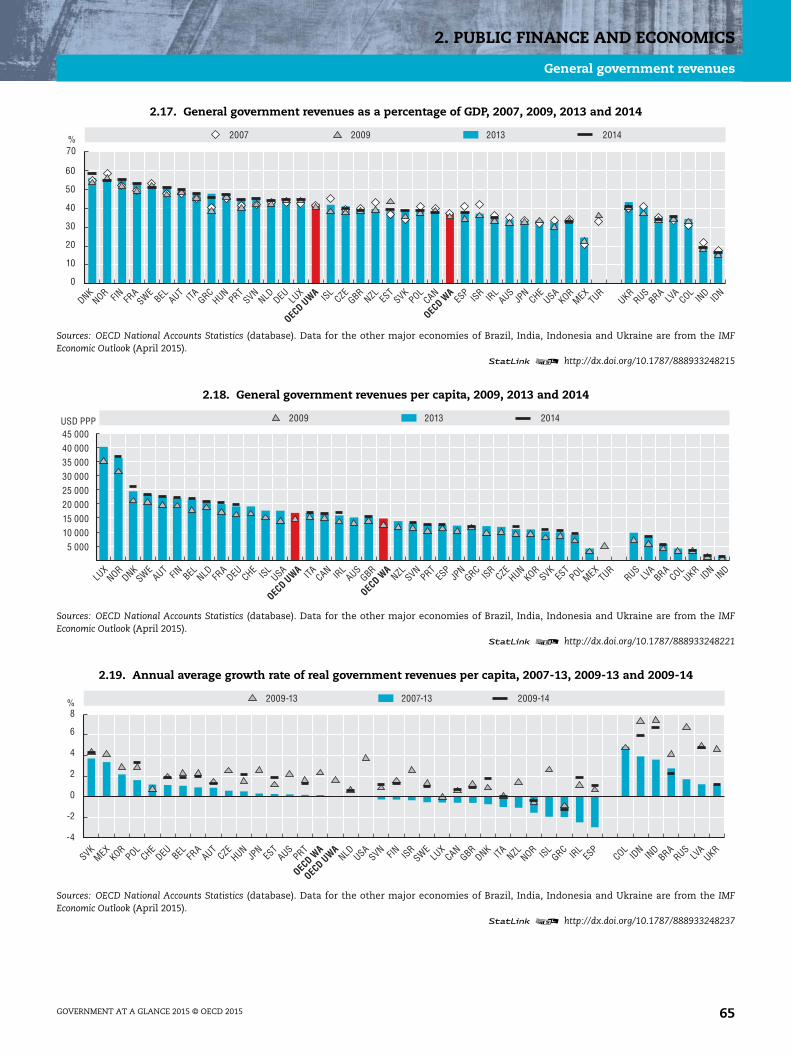
2. PUBLIC FINANCE AND ECONOMICS
General government revenues
2.17. General government revenues as a percentage of GDP, 2007, 2009, 2013 and 2014
Sources: OECD National Accounts Statistics (database). Data for the other major economies of Brazil, India, Indonesia and Ukraine are from the IMFEconomic Outlook (April 2015).
1 2 http://dx.doi.org/10.1787/888933248215
2.18. General government revenues per capita, 2009, 2013 and 2014
Sources: OECD National Accounts Statistics (database). Data for the other major economies of Brazil, India, Indonesia and Ukraine are from the IMFEconomic Outlook (April 2015).
1 2 http://dx.doi.org/10.1787/888933248221
2.19. Annual average growth rate of real government revenues per capita, 2007-13, 2009-13 and 2009-14
Sources: OECD National Accounts Statistics (database). Data for the other major economies of Brazil, India, Indonesia and Ukraine are from the IMFEconomic Outlook (April 2015).
1 2 http://dx.doi.org/10.1787/888933248237
%
0
10
20
30
40
50
60
70
201320092007 2014
DNKNOR FIN FR
ASW
EBEL AUT ITA GRC
HUNPRT
SVNNLD DEU LU
X
OECD U
WA ISLCZE
GBRNZL ES
TSVK
POLCAN
OECD W
AES
PISR IR
LAUS
JPN
CHEUSA
KORMEX
TURUKR
RUSBRA
LVA
COLIN
DID
N
USD PPP
5 00010 00015 00020 00025 00030 00035 00040 00045 000
20132009 2014
LUX
NORDNK
SWEAUT FIN BEL NLD FR
ADEU CHE ISL
USA
OECD U
WA ITA CAN IRL
AUSGBR
OECD W
ANZL SVN
PRTES
PJP
NGRC
ISRCZE
HUNKOR
SVKES
TPOL
MEXTUR
RUSLV
ABRA
COLUKR
IDN
IND
%
-4
-2
0
2
4
6
8
2007-132009-13 2009-14
SVKMEX
KORPOL
CHEDEU BEL FR
AAUT
CZEHUN
JPN
EST
AUSPRT
OECD W
A
OECD U
WANLD USA
SVN FIN ISRSWE
LUX
CANGBR
DNK ITA NZL NOR ISLGRC IR
LES
PCOL
IDN
IND
BRARUS
LVA
UKR
GOVERNMENT AT A GLANCE 2015 © OECD 2015 65

2. PUBLIC FINANCE AND ECONOMICS
Structure of general government revenues
In 2013, taxes represented the largest share (on average58.5%) of government revenues across OECD countries,around, one quarter were collected through net social con-tributions, while the remainder were for grants and otherrevenues. However, OECD countries finance their publicexpenditures in different ways. For example, Denmark andAustralia are relatively more dependent on taxes (over80%% of total revenues). In contrast, Japan and Germanyrelied relatively more on net social contributions (above37%) while in Mexico and Norway grants and other reve-nues exceeded 25% of total revenues, in both cases mostlyassociated with earnings derived from oil resources.
Between 2007 and 2013, the structure of government reve-nues remained stable on average across OECD countries.While the share of taxes decreased by 2.1 p.p. it was coun-terbalanced by relative increases in both net social contri-butions (1.2 p.p.) and grants other than revenues (0.9 p.p.).The highest declines in tax receipts occurred inthe Slovak Republic (7.3 p.p.) and Slovenia (6.7 p.p.). Netsocial contributions increased the most in Japan (5.7 p.p.)and Korea (4.5 p.p.). The highest increases in grants otherthan revenues occurred in Hungary (6.6 p.p.) andthe Slovak Republic (6.2 p.p.). From 2013 to 2014, in OECDcountries with available information, the largest change inthe structure of revenues occurred in Greece where taxesand net social contributions increased by 3.5 p.p. and1.4 p.p. respectively while grants decreased by 4.8 p.p.
Many policy makers define taxes to include social securitycontributions. Indeed this is the basis of tax revenue mea-sures in the OECD Revenue Statistics (see “methodologyand definitions”). On average (unweighted) across OECDcountries one third of tax revenues (including social secu-rity contributions) in 2012 were generated by taxes onincome and profits; another third by taxes on goods andservices; over a quarter from social security contributionsand the remaining from other types of taxes.
Between 2007 and 2012, the structure of tax revenues wasrelatively stable; the most relevant change across OECDmember countries was an average decrease of 2.3 p.p. onincome and profit taxes. The majority of tax revenues inDenmark, Australia and New Zealand were collectedthrough income and profits (over 55% of total taxation). Onthe contrary, 43.7% of taxes in Hungary were levied ongoods and services (increasing by 6 p.p. since 2007). Taxeson property are relatively higher (above 10%) inthe United Kingdom, the United States, Canada and Koreathan in other OECD countries.
Further reading
OECD (2014), Revenue Statistics 2014, OECD, Paris, http://dx.doi.org/10.1787/rev_stats-2014-en-fr.
Figure notes
2.20: Data for Chile are not available. In 2014, data for the OECDnon-European countries (apart from Canada and Korea) and forIceland, Turkey and Switzerland are not available. Data for Turkey arenot included in the OECD average due to missing time-series. Datafor Colombia and Russia are 2012 rather than 2013. Australia doesnot collect revenues via social contributions because it does notoperate government social insurance schemes.
2.21: For the OECD countries part of the European Union total taxationincludes custom duties collected on behalf of the European Union. 2012is the latest year for which data are available for all OECD countries.
Information on data for Israel: http://dx.doi.org/10.1787/888932315602.
Methodology and definitions
Revenues data are derived from the OECD NationalAccounts Statistics (database), which are based on theSystem of National Accounts (SNA), a set of internation-ally agreed concepts, definitions, classifications andrules for national accounting. There have been revi-sions in the SNA framework and most of theOECD countries have partly or entirely implementedthe updated 2008 SNA methodology (see Annex A fordetails). Revenues encompass taxes (e.g. taxes onconsumption, income, wealth, property and capital),net social contributions (e.g. contributions for pen-sions, health and social security; “net” means afterdeduction of social insurance scheme servicecharges, where applicable), and grants (e.g. from for-eign governments or international organisations) andother revenues (e.g. sales, fees, property income andsubsidies). These aggregates were constructed usingsub-account line items (see Annex B). The data pre-sented in Figure 2.21 are from OECD Revenue Statistics.
The OECD Revenue Statistics and the SNA differ in theirdefinitions of tax revenues. In the SNA, taxes are com-pulsory unrequited payments, in cash or in kind, madeby institutional units to the government. Net socialcontributions are actual or imputed payments to socialinsurance schemes to make provision for social bene-fits to be paid. These contributions may be compulsoryor voluntary and the schemes may be funded orunfunded. OECD Revenue Statistics treat compulsorysocial security contributions as taxes whereas the SNAconsiders them net social contributions because thereceipt of social security benefits depends, in mostcountries, upon appropriate contributions having beenmade, even though the size of the benefits is not nec-essarily related to the amount of the contributions. Fig-ure 2.22, Change in the structure of governmentrevenue, 2009 to 2013 (and 2014) is available online at:http://dx.doi.org/10.1787/888933248264.
GOVERNMENT AT A GLANCE 2015 © OECD 201566

2. PUBLIC FINANCE AND ECONOMICS
Structure of general government revenues
2.20. Structure of general government revenues, 2007, 2013 and 2014
Source: OECD National Accounts Statistics (database).1 2 http://dx.doi.org/10.1787/888933248244
2.21. Breakdown of tax revenues as a percentage of total taxation, 2007 and 2012
Source: OECD Revenue Statistics (2014).1 2 http://dx.doi.org/10.1787/888933248253
%
0
10
20
30
40
50
60
70
80
90
100
2007
2013
2007
2013
2007
2013
2007
2013
2007
2013
2007
2013
2007
2013
2007
2013
2007
2013
2007
2013
2007
2013
2007
2013
2007
2013
2007
2013
2007
2013
2007
2013
2007
2013
2007
2013
2007
2013
2007
2013
2007
2013
2007
2013
2007
2013
2007
2013
2007
2013
2007
2013
2007
2013
2007
2013
2007
2013
2007
2013
2007
2013
2007
2013
2007
2013
2007
2013
2007
2013
2007
2013
2007
2013
2007
2013
0
20
40
60
80
100
2014
2014
2014
2014
2014
2014
2014
2014
2014
2014
2014
2014
2014
2014
2014
2014
2014
2014
2014
2014
2014
2014
2014
2014
2014
Taxes Net social contributions Grants + Other revenues
2007 and 2013
2014
DNKAUS
NZLSWE ISL
IRL
GBR ISRCAN
LUX ITA CHE
USABEL ES
PTUR
AUT FIN NORPRT
KORFR
AES
THUN
JPN
DEU POLMEX
GRCSVN
CZENLD SVK
OECD U
WA
OECD W
ARUS
LVA
COL
DNKSWE
IRL
GBRCAN
LUX ITA BEL ES
PAUT
PRT FIN KORES
TGRC
FRA
NORHUN
DEU POLNLD SVN
CZESVK
LVA
%
2007
2012
2007
2012
2007
2012
2007
2012
2007
2012
2007
2012
2007
2012
2007
2012
2007
2012
2007
2012
2007
2012
2007
2012
2007
2012
2007
2012
2007
2012
2007
2012
2007
2012
2007
2012
2007
2012
2007
2012
2007
2012
2007
2012
2007
2012
2007
2012
2007
2012
2007
2012
2007
2012
2007
2012
2007
2012
2007
2012
2007
2012
2007
2012
2007
2012
2007
2012
2007
2012
2007
2012
2007
2012
0102030405060708090
100Income and profits Social security Payroll Property Goods and services Other
DNKAUS
NZL NORUSA
CANCHE ISL
IRL
CHLGBR
LUX
BELSWE FIN ITA JP
N ISRDEU ES
PKOR
AUTPRT
MEXNLD GRC
FRA
TURES
TPOL
CZESVN
SVKHUN
OECD U
WACOL
BRA
GOVERNMENT AT A GLANCE 2015 © OECD 2015 67

2. PUBLIC FINANCE AND ECONOMICS
Revenue structure by level of government
Revenues are collected differently across central, state andlocal governments as they differ in terms of their ability tolevy taxes and collect social contributions. The amount oftaxes collected by sub-central governments provides aproxy of their autonomous fiscal capacity, while the vol-ume of the revenue transfers between levels of governmentcan be considered a proxy of the fiscal interdependence.However, revenues include both own-source taxes andshared taxes and for these latter, there is no autonomousfiscal capacity. Limits on sub-central governments’ abilityto set their own local tax bases, rates and reliefs reducetheir power to generate their own revenue sources andpotentially their ability to provide more tailored publicgoods and services.
On average, central governments collected the majority ofgeneral government revenues in 2013 (50.6%), followed bystate governments (18.6%) and local governments (12.2%),while the remainder was collected through social securityfunds (18.6%). However, the revenue structure by levels of gov-ernment can be quite different across OECD member coun-tries. Central governments in Ireland, the United Kingdom,New Zealand and Norway collected over 85% of general gov-ernment revenues. In contrast, central governments inPoland, Korea, Finland, Spain, France, Canada, Switzerland,Germany and Japan collected less than 50.6% (the average ofOECD member countries). Central governments in Denmarkand Slovenia were the countries with the largest increase interms of share of general government revenues from 2013and 2014, while Korea was the one with the largest reduction.
The OECD member countries with the highest collection ofrevenues at sub-central level in 2013 were, on the onehand, three federal countries in which state governmentscollected the highest share of revenues: Canada (43.6%),the United States (42.5%) and Australia (38.0%). On theother hand local governments in Sweden, Korea and Japancollected a larger share of total revenues (34.6%, 33.9% and33.8% respectively).
In 2013, central government budgets across OECD membercountries were mainly financed by taxes, ranging from91.3% in Switzerland to 53.9% in Norway. By contrast,sub-central fiscal resources were mainly collected throughintergovernmental grants and other revenues. Only in fed-eral countries such as Germany, Canada, Switzerland andthe United States did state governments raise the majorityof revenues via tax receipts.
Further reading
OECD (2013), OECD Regions at a Glance 2013, OECD, Paris,http://dx.doi.org/10.1787/reg_glance-2013-en.
Figure notes
Data for Chile are not available. Australia does not operate governmentsocial insurance schemes. Data for Australia and Colombia refer tothe year 2012 rather than 2013.
2.23: In 2014, data for the OECD non-European countries (apart fromCanada and Korea) and for Iceland, Turkey and Switzerland are notavailable. Data for Turkey are not included in the OECD average dueto missing time series. Transfers between levels of government areexcluded (apart from Australia, Korea, Japan and Turkey). Local gov-ernment is included in state government for Australia andthe United States. Social security funds are included in central gov-ernment in Ireland, New Zealand, Norway, the United Kingdom andthe United States.
Information on data for Israel: http://dx.doi.org/10.1787/888932315602.
Methodology and definitions
Revenues data are derived from the OECD NationalAccounts Statistics (database), which are based on theSystem of National Accounts (SNA), a set of internation-ally agreed national accounting. There have been revi-sions in the SNA framework and most of the OECD
countries have partly or entirely implemented theupdated 2008 SNA methodology (see Annex A fordetails). Using SNA terminology, general governmentconsists of central, state and local governments, andsocial security funds. State government is only appli-cable to the nine OECD countries that are federalstates: Australia, Austria, Belgium, Canada, Germany,Mexico, Spain (considered a quasi-federal country),Switzerland and the United States. Data in Figures 2.23and 2.25 (available on line) exclude transfers betweenlevels of government in order to see the contribution ofeach sub-sector in general government total revenues,which are at this level consolidated. However, data onthe structure of revenues at the central, state and locallevels include transfers between levels of government.Table 2.25, Change in the distribution of governmentrevenues across levels of government, 2009 to 2013(and 2014), as well as Figures 2.26 and 2.27 (structure ofstate and local government revenues), are availableonline at http://dx.doi.org/10.1787/888933248298, http://dx.doi.org/10.1787/888933248307, http://dx.doi.org/10.1787/888933248315 respectively.
Revenues encompass taxes (e.g. taxes on consump-tion, income, wealth, property and capital), net socialcontributions (e.g. contributions for pensions, healthand social security; net means after deduction ofsocial insurance scheme service charges, whereapplicable), and grants and other revenues. Grantscan be from foreign governments, internationalorganisations or other general government units.Other revenues include sales, fees, property incomeand subsidies. These aggregates are not directly avail-able in the OECD National Accounts, and were con-structed using sub-account line items (see Annex B).
GOVERNMENT AT A GLANCE 2015 © OECD 201568

2. PUBLIC FINANCE AND ECONOMICS
Revenue structure by level of government
2.23. Distribution of general government revenues across levels of government, 2007, 2013 and 2014
Source: OECD National Accounts Statistics (database).1 2 http://dx.doi.org/10.1787/888933248279
2.24. Structure of central government revenues, 2013 and 2014
Source: OECD National Accounts Statistics (database).1 2 http://dx.doi.org/10.1787/888933248282
%
0
20
40
60
80
100
2007
2013
2007
2013
2007
2013
2007
2013
2007
2013
2007
2013
2007
2013
2007
2013
2007
2013
2007
2013
2007
2013
2007
2013
2007
2013
2007
2013
2007
2013
2007
2013
2007
2013
2007
2013
2007
2013
2007
2013
2007
2013
2007
2013
2007
2013
2007
2013
2007
2013
2007
2013
2007
2013
2007
2013
2007
2013
2007
2013
2007
2013
2007
2013
2007
2013
2007
2013
2007
2013
2007
2013
2007
2013
0
20
40
60
80
100
2014
2014
2014
2014
2014
2014
2014
2014
2014
2014
2014
2014
2014
2014
2014
2014
2014
2014
2014
2014
2014
2014
2014
2014
2014
Central government State government Local government Social security
IRL
GBRNZL NOR ISR
MEXGRC ISL
DNKES
TPRT
CZELU
XAUT
TURHUN
AUSSVK
USASWE
NLD BEL SVN ITA POLKOR FIN ES
PFR
ACAN
CHEDEU JP
N
OECD U
WA
OECD W
ACOL
LVA
2007 and 2013
2014
IRL
GBRNOR
GRCDNK
EST
PRTLU
XCZE
AUTHUN
SVKSWE
NLD BEL SVN ITA POLKOR FIN ES
PCAN
FRA
DEU LVA
%
2013
2014
2013
2014
2013
2014
2013
2014
2013
2014
2013
2014
2013
2014
2013
2014
2013
2014
2013
2014
2013
2014
2013
2014
2013
2014
2013
2014
2013
2014
2013
2014
2013
2014
2013
2014
2013
2014
2013
2014
2013
2014
2013
2014
2013
2014
2013
2014
2013
2014
2013
2014
2013
2014
2013
2014
2013
2014
2013
2014
2013
2014
2013
2014
2013
2014
2013
2014
2013
2014
2013
2014
0102030405060708090
100
CHEBEL ITA AUS
DEU JPN
SWELU
XDNK
CAN FIN NZL AUTES
PNLD FR
AKOR
POLISR ISL
IRL
HUNGBR
SVKPRT
SVNGRC
MEXES
TUSA
CZENOR
OECD U
WA
OECD W
ACOL
LVA
Taxes Net social contributions Grants + Other revenues
GOVERNMENT AT A GLANCE 2015 © OECD 2015 69

2. PUBLIC FINANCE AND ECONOMICS
General government expenditures
Public expenditures have two main objectives: produceand/or pay for the goods and services delivered to citizensand businesses, and redistribute income. In addition, theamount of financial resources spent by governments pro-vides an indication on the size of the public sector. Althoughgovernment expenditures are usually less flexible than gov-ernment revenues they are also sensitive to economic devel-opments associated with the business cycle and reflecthistorical and current political decisions. For example, gov-ernments could choose to transfer resources via subsidiesand grants or provide support by lowering tax rates to agiven economic sector or a group within the society.
Government expenditures represented on average 41.9% ofGDP across OECD countries in 2013. Greece (60.1%), Slove-nia (59.7%), and Finland (57.8%) spent the most, whereasKorea (31.8%) and Mexico (24.4%) spent the least.Between 2007 and 2009 expenditures increased on averageby 5.4 p.p. due mainly to measures adopted to counteractthe global financial and economic crisis. The largestincreases took place in Estonia (11.7 p.p.) and Ireland(11.6 p.p.), while a slight decrease occurred in Israel(0.6 p.p.).
The overall trend changed for the period between 2009and 2013, when government expenditures as a share ofGDP decreased on average by 2.5 p.p., mostly due to theslowdown (or reduction in some cases) of expenditurescompared to the growth of GDP. As a response to the finan-cial and economic crisis, countries implemented stimuluspackages mainly in 2008; however since 2009 most coun-tries have rather sought to cut back on expenditures. Thestrongest reductions occurred in Estonia (7.3 p.p.) andIreland (6.9 p.p.). In ten OECD countries expendituresindeed grew during this period. The highest increaseoccurred in Slovenia (11.2 p.p.), Greece (6.0 p.p.) andFinland (3 p.p.). In the case of Slovenia the raise combinessocial preferences for a well-developed welfare state andpoor expenditure controls. For Greece the change does notcorrespond to mounting expenditures; on the contrary it istriggered by the decrease of GDP at a higher pace thanexpenditures since 2009. Finally for Finland competitive-ness has deteriorated and output has fallen, as electronicsand forestry collapsed, while expenditures have continuedto growth.
In addition, according to the 2014 data, available for a sub-set of OECD countries, government expenditures from 2013to 2014 decreased substantially in Greece (10.7 p.p.) andSlovenia (9.9 p.p.) as one off expenditures to capitalize thebanking system were registered in 2013. In 2014 Finland(58.7%), France (57.3%) and Denmark (57.2%) reported thehighest spending as a share of GDP in 2014.
On average, across OECD countries government expendi-tures per capita represented USD 16 491 PPP per capitain 2013. However, OECD countries display large differences,ranging from USD 39 518 PPP in Luxembourg to USD 4 128PPP in Mexico, a difference over nine fold. Notwithstand-ing, Mexico experienced a stable positive annual growth
rate of 3.4% for both periods 2007-13 and 2009-13. On aver-age, across OECD countries, expenditures per capita haveincreased at an annual rate of 1.2% between 2007 and 2013,while an annual decrease of 0.2% occurred between 2009and 2013. Countries experienced similar trends when con-sidering the 2009-14 period, where data are available, apartfrom being reverted to slight increases for Austria (0.1%)and Norway (0.01%). For Italy and Greece, the annualgrowth rates were negative for the three periods analysed.
Further reading
OECD (2014), National Accounts at a Glance 2014, OECD, Paris,http://dx.doi.org/10.1787/na_glance-2014-en.
Figure notes
Data for Chile are not available. Data for Russia and Colombia are 2012rather than 2013.
2.28 and 2.29: Data for Turkey are not including in the OECD average dueto missing time-series.
2.30: Data for Turkey are not available.
Information on data for Israel: http://dx.doi.org/10.1787/888932315602.
Methodology and definitions
Expenditures data are derived from the OECD NationalAccounts Statistics (database), which are based on theSystem of National Accounts (SNA), a set of internation-ally agreed concepts, definitions, classifications andrules for national accounting. There have been revi-sions in the SNA framework and most of theOECD countries have partly or entirely implementedthe updated 2008 SNA methodology (see Annex A fordetails). In SNA terminology, general governmentconsists of central, state and local governments andsocial security funds. Expenditures encompass inter-mediate consumption, compensation of employees,subsidies, property income (including interest spend-ing), social benefits, other current expenditures(mainly current transfers) and capital expenditures(i.e. capital transfers and investments).
Gross domestic product (GDP) is the standard mea-sure of the value of the goods and services producedby a country during a period. Government expendi-tures per capita were calculated by converting totalgovernment expenditures to USD using the OECD/Eurostat purchasing power parities (PPP) for GDP anddividing by population (for the countries whose datasource is the IMF Economic Outlook an implied PPPconversion rate was used). PPP is the number of unitsof country B’s currency needed to purchase the samequantity of goods and services in country A.
GOVERNMENT AT A GLANCE 2015 © OECD 201570

2. PUBLIC FINANCE AND ECONOMICS
General government expenditures
2.28. General government expenditures as a percentage of GDP, 2007, 2009, 2013 and 2014
Source: OECD National Accounts Statistics (database). Data for the other major economies of Brazil, India, Indonesia and Ukraine are from the IMFEconomic Outlook (April 2015).
1 2 http://dx.doi.org/10.1787/888933248323
2.29. General government expenditures per capita, 2009, 2013 and 2014
Source: OECD National Accounts Statistics (database). Data for the other major economies of Brazil, India, Indonesia and Ukraine are from the IMFEconomic Outlook (April 2015).
1 2 http://dx.doi.org/10.1787/888933248335
2.30. Annual average growth rate of real government expenditures per capita, 2007-13, 2009-13 and 2009-14
Sources: OECD National Accounts Statistics (database). Data for the other major economies of Brazil, India, Indonesia and Ukraine are from the IMFEconomic Outlook (April 2015).
1 2 http://dx.doi.org/10.1787/888933248341
%
0
10
20
30
40
50
60
70
201320092007 2014
GRCSVN FIN FR
ADNK
BELSWE ITA AUT
PRTHUN
NLD GBR
OECD U
WADEU ES
PNOR ISL
LUX
JPN
CZEPOL
OECD W
AISR
SVK IRL
CANNZL ES
TUSA
AUSCHE
KORMEX
TURUKR
RUSBRA
LVA
COLIN
DID
N
5 000
0
10 000
15 000
20 000
25 000
30 000
35 000
40 00045 000USD PPP
20132009 2014
LUX
NORDNK
SWE FIN AUTBEL NLD FR
AUSA
DEU CHEIR
L ISL ITA
OECD U
WACAN
GBRSVN
OECD W
AAUS
GRCJP
NES
PNZL PRT
ISRCZE
HUNSVK
KORPOL
EST
MEXTUR
RUSLV
ABRA
UKRCOL
IDN
IND
%
-8
-6
-4
-2
0
2
4
6
82007-132009-13 2009-14
SVNSVK
KORMEX
JPN
POL FIN BEL AUSCHE
EST
OECD U
WAFR
A
OECD W
ADEU CAN
DNKISR
SWENLD USA
LUX
NZL AUT ISLCZE
PRTES
PGBR
NOR IRL
HUN ITA GRCCOL
LVA
RUSID
NIN
DBRA
UKR
GOVERNMENT AT A GLANCE 2015 © OECD 2015 71

2. PUBLIC FINANCE AND ECONOMICS
Structure of general government expenditures by function (COFOG)
The breakdown of governments’ expenditures by functionand its evolution over time reflect the main priorities andchallenges of governments. Higher debt burden, high andrising unemployment, the impact of ageing population, butalso common goals set by regional agreements (such as inOECD-EU countries) on energy, infrastructure and researchand development programmes are all reflected in the struc-ture of governments’ expenditures.
Governments in OECD countries spent the largest share oftotal expenditures on social protection in 2013. On averageclose to one third of government spending is dedicated tosocial protection (32.4%). These are particularly high inNordic countries, Luxembourg, France, Germany, Japan,Austria and Italy where they represent more than 40% oftotal government expenditures. In France more than half(55%) of social protection spending is on pensions 12% of itis dedicated to sickness/disability benefits 10% to family/children allowances and 8% to unemployment benefitsAlthough percentages vary (in particular for the share onunemployment benefits), many OECD countries have gen-erally a similar structure of social protection expenditures.
Governments’ spending on health care, general public ser-vices (which includes the debt servicing) and in educationalso represents important shares of government spending,each above 10% on average in 2013. Spending on economicaffairs is also significant (9.5%) and varies from more than25% in Greece to less than 7% in Denmark, Israel, Portugaland the United Kingdom.
In 2013, OECD governments spent relatively less on defence(5.5%), public order and safety (4.4%), housing and commu-nity amenities (1.5%), recreation culture and religion (1.5%)and environmental protection (1.2%) although dependingon countries this may vary quite significantly. Spending ondefence for instance is close to or above 10% in Israel(14.4%) and the United States (9.8%) whereas it is close to orbelow 1% in Hungary, Ireland, Iceland and Luxembourg.
Between 2007 and 2013, there has been an increase in totalgovernment spending on social protection and health care.Compared to before the financial crisis, governmentsspend a relatively larger share on social protection espe-cially in countries where unemployment had risen sharply(Spain, Ireland, Portugal and Italy). Over the same periodspending on health care has increased on average inOECD countries (+ 0.8 p.p.) driven to some extent by thegrowing share of health care spending in the Netherlands(+1.9 p.p.) and the United-States (+ 1.5 p.p.). In the fewcountries where social protection and health care spendingdecreased significantly over the period (Greece, Slovenia)this is mainly due to the high increase in spending on eco-nomic affairs (> 14 p.p. for both countries) to support eco-nomic growth and programmes to reduce the rate ofunemployment of certain population groups.
Overall in OECD countries, the greater share of spendingdedicated to social protection and health care over the
period has been compensated by a decrease of spending inall other categories and especially in education (-0.8 p.p.),general public services (-0.6 p.p.) and defence (-0.5 p.p.).In 2013, out of 29 OECD countries for which data are avail-able, 17 countries have reduced the share dedicated to edu-cation compared to 2007. The highest decrease took place inSlovenia (-3.2 p.p.) and in Iceland (-2.3 p.p.). Regarding gen-eral public services the biggest decrease over the period tookplace in Greece (-7.8 p.p.). This is mainly due to decreasingannual spending on debt servicing as a result of the negotia-tion and restructuration of the Greek government’s debt.
Table notes
Data are not available for Canada, Chile, Mexico, New Zealand andTurkey. Iceland: 2012 rather than 2013. Data for Spain in EconomicAffairs in 2013 include EUR 4 897 million of financial aids to the banks.
Information on data for Israel: http://dx.doi.org/10.1787/888932315602.
Methodology and definitions
Expenditures data are derived from the OECD NationalAccounts Statistics (database) and Eurostat Governmentfinance statistics (database), which are based on theSystem of National Accounts (SNA), a set of internation-ally agreed concepts, definitions, classifications andrules for national accounting. The SNA frameworkwas revised and most of the OECD countries havepartly or entirely implemented the updated 2008 SNAmethodology (see Annex A for details). Data onexpenditures are disaggregated according to the Clas-sification of the Functions of Government (COFOG),which divides expenditures into ten functions: gen-eral public services; defence; public order and safety;economic affairs; environmental protection; housingand community amenities; health; recreation, cultureand religion; education; and social protection. Furtherinformation about the types of expenditures includedin each category is available in Annex C.
Structure of governments by selected COFOG II levelpriority functions are shown in Figure 2.33 (generalpublic services), Figure 2.34 (public order and safety),Figure 2.35 (economic affairs), Figure 2.36 (healthcare), Figure 2.37 (education) and Figure 2.38 (socialprotection). These are available on line (http://dx.doi.org/10.1787/888933248370; http://dx.doi.org/10.1787/888933248384; http://dx.doi.org/10.1787/888933248399; http://dx.doi.org/10.1787/888933248407;http://dx.doi.org/10.1787/888933248412 ; http://dx.doi.org/10.1787/888933248422).
GOVERNMENT AT A GLANCE 2015 © OECD 201572
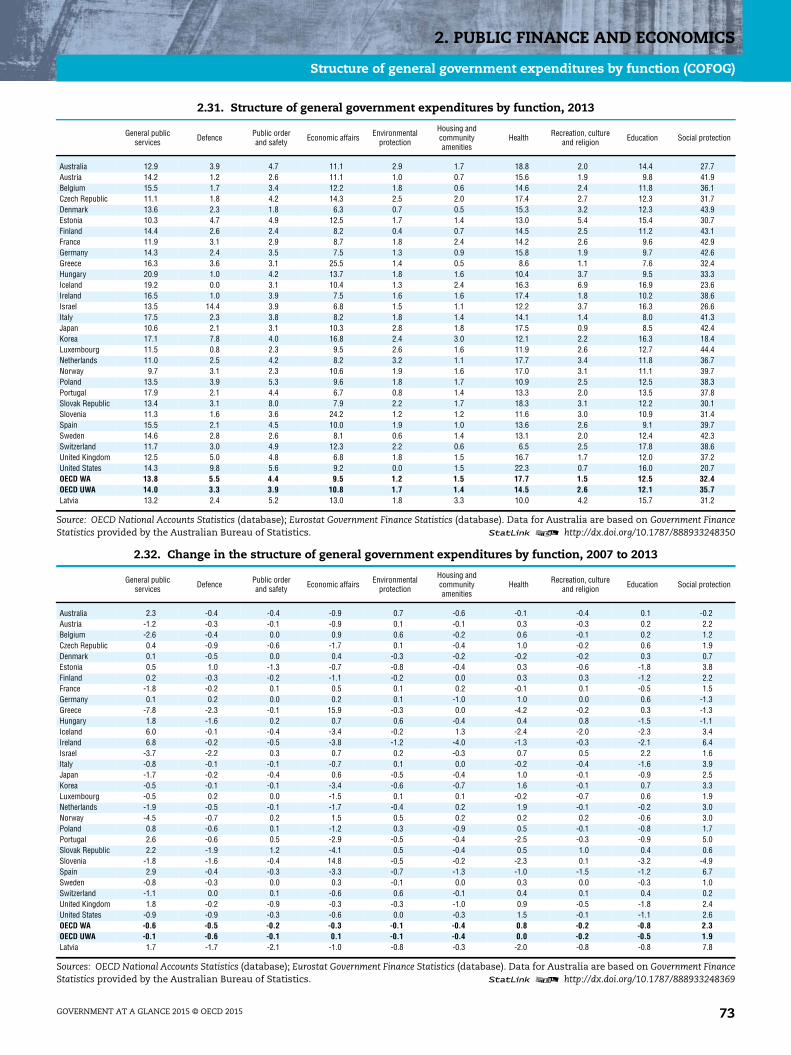
2. PUBLIC FINANCE AND ECONOMICS
Structure of general government expenditures by function (COFOG)
2.31. Structure of general government expenditures by function, 2013
General publicservices Defence Public order
and safety Economic affairs Environmentalprotection
Housing andcommunityamenities
Health Recreation, cultureand religion Education Social protection
Australia 12.9 3.9 4.7 11.1 2.9 1.7 18.8 2.0 14.4 27.7Austria 14.2 1.2 2.6 11.1 1.0 0.7 15.6 1.9 9.8 41.9Belgium 15.5 1.7 3.4 12.2 1.8 0.6 14.6 2.4 11.8 36.1Czech Republic 11.1 1.8 4.2 14.3 2.5 2.0 17.4 2.7 12.3 31.7Denmark 13.6 2.3 1.8 6.3 0.7 0.5 15.3 3.2 12.3 43.9Estonia 10.3 4.7 4.9 12.5 1.7 1.4 13.0 5.4 15.4 30.7Finland 14.4 2.6 2.4 8.2 0.4 0.7 14.5 2.5 11.2 43.1France 11.9 3.1 2.9 8.7 1.8 2.4 14.2 2.6 9.6 42.9Germany 14.3 2.4 3.5 7.5 1.3 0.9 15.8 1.9 9.7 42.6Greece 16.3 3.6 3.1 25.5 1.4 0.5 8.6 1.1 7.6 32.4Hungary 20.9 1.0 4.2 13.7 1.8 1.6 10.4 3.7 9.5 33.3Iceland 19.2 0.0 3.1 10.4 1.3 2.4 16.3 6.9 16.9 23.6Ireland 16.5 1.0 3.9 7.5 1.6 1.6 17.4 1.8 10.2 38.6Israel 13.5 14.4 3.9 6.8 1.5 1.1 12.2 3.7 16.3 26.6Italy 17.5 2.3 3.8 8.2 1.8 1.4 14.1 1.4 8.0 41.3Japan 10.6 2.1 3.1 10.3 2.8 1.8 17.5 0.9 8.5 42.4Korea 17.1 7.8 4.0 16.8 2.4 3.0 12.1 2.2 16.3 18.4Luxembourg 11.5 0.8 2.3 9.5 2.6 1.6 11.9 2.6 12.7 44.4Netherlands 11.0 2.5 4.2 8.2 3.2 1.1 17.7 3.4 11.8 36.7Norway 9.7 3.1 2.3 10.6 1.9 1.6 17.0 3.1 11.1 39.7Poland 13.5 3.9 5.3 9.6 1.8 1.7 10.9 2.5 12.5 38.3Portugal 17.9 2.1 4.4 6.7 0.8 1.4 13.3 2.0 13.5 37.8Slovak Republic 13.4 3.1 8.0 7.9 2.2 1.7 18.3 3.1 12.2 30.1Slovenia 11.3 1.6 3.6 24.2 1.2 1.2 11.6 3.0 10.9 31.4Spain 15.5 2.1 4.5 10.0 1.9 1.0 13.6 2.6 9.1 39.7Sweden 14.6 2.8 2.6 8.1 0.6 1.4 13.1 2.0 12.4 42.3Switzerland 11.7 3.0 4.9 12.3 2.2 0.6 6.5 2.5 17.8 38.6United Kingdom 12.5 5.0 4.8 6.8 1.8 1.5 16.7 1.7 12.0 37.2United States 14.3 9.8 5.6 9.2 0.0 1.5 22.3 0.7 16.0 20.7OECD WA 13.8 5.5 4.4 9.5 1.2 1.5 17.7 1.5 12.5 32.4OECD UWA 14.0 3.3 3.9 10.8 1.7 1.4 14.5 2.6 12.1 35.7Latvia 13.2 2.4 5.2 13.0 1.8 3.3 10.0 4.2 15.7 31.2
Source: OECD National Accounts Statistics (database); Eurostat Government Finance Statistics (database). Data for Australia are based on Government FinanceStatistics provided by the Australian Bureau of Statistics. 1 2 http://dx.doi.org/10.1787/888933248350
2.32. Change in the structure of general government expenditures by function, 2007 to 2013
General publicservices Defence Public order
and safety Economic affairs Environmentalprotection
Housing andcommunityamenities
Health Recreation, cultureand religion Education Social protection
Australia 2.3 -0.4 -0.4 -0.9 0.7 -0.6 -0.1 -0.4 0.1 -0.2Austria -1.2 -0.3 -0.1 -0.9 0.1 -0.1 0.3 -0.3 0.2 2.2Belgium -2.6 -0.4 0.0 0.9 0.6 -0.2 0.6 -0.1 0.2 1.2Czech Republic 0.4 -0.9 -0.6 -1.7 0.1 -0.4 1.0 -0.2 0.6 1.9Denmark 0.1 -0.5 0.0 0.4 -0.3 -0.2 -0.2 -0.2 0.3 0.7Estonia 0.5 1.0 -1.3 -0.7 -0.8 -0.4 0.3 -0.6 -1.8 3.8Finland 0.2 -0.3 -0.2 -1.1 -0.2 0.0 0.3 0.3 -1.2 2.2France -1.8 -0.2 0.1 0.5 0.1 0.2 -0.1 0.1 -0.5 1.5Germany 0.1 0.2 0.0 0.2 0.1 -1.0 1.0 0.0 0.6 -1.3Greece -7.8 -2.3 -0.1 15.9 -0.3 0.0 -4.2 -0.2 0.3 -1.3Hungary 1.8 -1.6 0.2 0.7 0.6 -0.4 0.4 0.8 -1.5 -1.1Iceland 6.0 -0.1 -0.4 -3.4 -0.2 1.3 -2.4 -2.0 -2.3 3.4Ireland 6.8 -0.2 -0.5 -3.8 -1.2 -4.0 -1.3 -0.3 -2.1 6.4Israel -3.7 -2.2 0.3 0.7 0.2 -0.3 0.7 0.5 2.2 1.6Italy -0.8 -0.1 -0.1 -0.7 0.1 0.0 -0.2 -0.4 -1.6 3.9Japan -1.7 -0.2 -0.4 0.6 -0.5 -0.4 1.0 -0.1 -0.9 2.5Korea -0.5 -0.1 -0.1 -3.4 -0.6 -0.7 1.6 -0.1 0.7 3.3Luxembourg -0.5 0.2 0.0 -1.5 0.1 0.1 -0.2 -0.7 0.6 1.9Netherlands -1.9 -0.5 -0.1 -1.7 -0.4 0.2 1.9 -0.1 -0.2 3.0Norway -4.5 -0.7 0.2 1.5 0.5 0.2 0.2 0.2 -0.6 3.0Poland 0.8 -0.6 0.1 -1.2 0.3 -0.9 0.5 -0.1 -0.8 1.7Portugal 2.6 -0.6 0.5 -2.9 -0.5 -0.4 -2.5 -0.3 -0.9 5.0Slovak Republic 2.2 -1.9 1.2 -4.1 0.5 -0.4 0.5 1.0 0.4 0.6Slovenia -1.8 -1.6 -0.4 14.8 -0.5 -0.2 -2.3 0.1 -3.2 -4.9Spain 2.9 -0.4 -0.3 -3.3 -0.7 -1.3 -1.0 -1.5 -1.2 6.7Sweden -0.8 -0.3 0.0 0.3 -0.1 0.0 0.3 0.0 -0.3 1.0Switzerland -1.1 0.0 0.1 -0.6 0.6 -0.1 0.4 0.1 0.4 0.2United Kingdom 1.8 -0.2 -0.9 -0.3 -0.3 -1.0 0.9 -0.5 -1.8 2.4United States -0.9 -0.9 -0.3 -0.6 0.0 -0.3 1.5 -0.1 -1.1 2.6OECD WA -0.6 -0.5 -0.2 -0.3 -0.1 -0.4 0.8 -0.2 -0.8 2.3OECD UWA -0.1 -0.6 -0.1 0.1 -0.1 -0.4 0.0 -0.2 -0.5 1.9Latvia 1.7 -1.7 -2.1 -1.0 -0.8 -0.3 -2.0 -0.8 -0.8 7.8
Sources: OECD National Accounts Statistics (database); Eurostat Government Finance Statistics (database). Data for Australia are based on Government FinanceStatistics provided by the Australian Bureau of Statistics. 1 2 http://dx.doi.org/10.1787/888933248369
GOVERNMENT AT A GLANCE 2015 © OECD 2015 73

2. PUBLIC FINANCE AND ECONOMICS
Structure of general government expenditures by economic transaction
Government expenditures go beyond production relatedexpenditures. In a government budget perspective, eco-nomic transactions such as gross capital formation, socialbenefit payments, interest payments generated by the pub-lic debt and subsidies are also included determining thetotal government expenditures. All these transactionstogether have the advantage of better capturing on whatgovernment spends taxpayers’ money and also its ability tostimulate the demand.
Generally, the largest expenditure component of generalgovernment is social benefits followed by the compensationof employees. In 2013, on average, these two itemsaccounted for 62.8% of the total government expendituresacross OECD countries. In general, OECD countries devoted39.8% of the total expenditures to social benefits. However,there are several differences across countries. On the oneside, social benefits in countries like Iceland, Israel, Mexico,Canada and Korea were between 14 and 30 p.p. lower thanthe OECD average. On the other side, Germany devoted13.7 p.p. more than the OECD average to this item. In gen-eral, OECD countries devoted 22.9% of the total expendituresto compensation of employees. Despite being on average thesecond largest share, several differences were found acrossOECD countries. The share of this item was 14.9 p.p. larger inMexico, where it almost reached 40% of total expenditures,and 9.3 p.p. larger in Iceland (exceeding 32% of the totalexpenditures). Intermediate consumption was the thirdlargest economic transaction, accounting for 14.8% of thetotal government expenditures. Finally, the capital expendi-tures accounted for 9.6% of total expenditures, 6.9% wasdevoted to property income (mostly interest payments)while the remaining 6% was devoted to other current expen-ditures and subsidies.
Between 2007 and 2013, the share of general governmentexpenditures across OECD countries devoted to social ben-efits was the economic transaction with the highestincrease (3.1 p.p.). This increment reflects the impact onOECD countries in supporting social phenomena related tothe economic crisis such as increases in unemployment.Specifically, the highest increases took place in countriessuch as Ireland and Spain (7.4 p.p. and 7.1 p.p. respectively).Nevertheless, over the same period some of theOECD countries experienced a decrease: Slovenia, Greeceand Hungary were the most affected (-5.8 p.p. and -1.7 p.p.and -1.5 p.p. respectively). Despite that, Greece reveals adifferent picture when analysing the evolution of this itemover the latest period 2013-14, showing an increase of theshare of social benefits by 7.8 p.p.
Over the period 2007-13, the share of compensation ofemployees to the total expenditures decreased signifi-cantly across OECD countries (-1.4 p.p.). Traditionally,adjustments in the wages or the number or employees ingovernment have been the main measures taken by OECDgovernments to decrease the compensation of employees.Despite this general trend, seven OECD countries displayedpositive figures namely, Norway (1.8 p.p.), Israel (0.8 p.p.),
Slovak Republic (0.7 p.p.), Germany and Canada (both0.3 p.p.) and Estonia and Switzerland (below 0.3 p.p.). Simi-larly, the share of capital expenditures over the total expen-ditures decreased across OECD countries (-1.3 p.p.). Irelandand the Czech Republic experienced the largest decreasesover this period (-10.6 p.p. and -4.9 p.p., respectively), asimilar trend that was also observed between theyears 2007 and 2014 (-9.0 p.p. and -4.2 p.p.).
Further reading
OECD (2014a), National Accounts at a Glance 2014, OECD Pub-lishing, Paris, http://dx.doi.org/10.1787/na_glance-2014-en.
OECD (2014b), OECD Factbook 2014: Economic, Environmentaland Social Statistics, OECD Publishing, Paris, http://dx.doi.org/10.1787/factbook-2014-en.
Figure notes
Data for Australia, Chile and Turkey are not available. Data for Colombiaand Russia refer to the year 2012 rather than 2013.
Information on data for Israel: http://dx.doi.org/10.1787/888932315602.
Methodology and definitions
Expenditures data are derived from the OECD NationalAccounts Statistics (database), which are based on theSystem of National Accounts (SNA), a set of internation-ally agreed concepts, definitions, classifications andrules for national accounting. There have been revi-sions in the SNA framework and most of theOECD countries have partly or entirely implementedthe updated 2008 SNA methodology (see Annex A fordetails). Expenditures encompass the following eco-nomic transactions: intermediate consumption, com-pensation of employees, subsidies, property income(including interest spending), social benefits (consist-ing of social benefits other than social transfers inkind and of social transfers in kind provided to house-holds via market producers), other current expendi-tures (mainly current transfers but also other minorexpenditures as other taxes on production, currenttaxes on income and wealth etc. and the adjustmentfor the change in pension entitlements) and capitalexpenditures (i.e. capital transfers and investments).All these transactions at the level of government arerecorded on a consolidated basis (i.e. transactionsbetween levels of government are netted out).Figure 2.40, Change in the structure of general gov-ernment expenditures by economic transaction, 2007to 2014 is available online at http://dx.doi.org/10.1787/888933248447.
GOVERNMENT AT A GLANCE 2015 © OECD 201574

2. PUBLIC FINANCE AND ECONOMICS
Structure of general government expenditures by economic transaction
2.39. Structure of general government expenditures by economic transaction, 2013 and 2014 and change 2007 to 2013
Intermediateconsumption
Compensationof employees
SubsidiesProperty income
(incl. interest)Social benefits
Other currentexpenditures
Capital expenditures
2013 2014Change2007-13
2013 2014Change2007-13
2013 2014Change2007-13
2013 2014Change2007-13
2013 2014Change2007-13
2013 2014Change2007-13
2013 2014Change2007-13
Austria 12.8 12.4 0.7 20.9 20.2 -0.3 2.8 2.8 -0.3 4.9 4.5 -1.5 45.2 44.6 2.5 6.5 6.2 0.7 7.0 9.3 -1.9
Belgium 7.3 7.3 -0.3 22.9 23.0 -1.0 5.4 5.3 0.7 5.7 5.7 -2.3 46.2 46.5 1.4 5.0 4.8 0.5 7.6 7.4 0.9
Canada 23.3 23.6 1.2 29.8 30.1 0.3 2.9 2.8 0.1 8.0 7.9 -2.5 22.9 23.2 0.8 2.9 2.9 0.1 10.2 9.5 0.1
Czech Republic 12.1 11.7 -1.8 17.2 17.0 -0.4 6.4 6.5 2.3 3.2 3.2 0.5 45.5 44.8 3.4 5.2 5.0 0.8 10.5 11.8 -4.9
Denmark 16.5 16.5 0.4 29.4 29.5 -1.5 3.8 3.9 0.0 3.0 2.7 -0.2 33.9 33.8 0.9 6.3 6.2 -0.3 6.9 7.4 0.8
Estonia 17.0 17.3 0.2 27.6 28.5 0.2 1.9 1.1 -0.6 0.4 0.3 -0.1 32.2 32.6 3.8 5.2 4.7 0.5 15.7 15.4 -3.8
Finland 20.1 20.1 1.1 25.0 24.4 -1.9 2.3 2.3 -0.3 2.2 2.2 -0.8 37.6 38.4 2.2 5.2 5.1 0.1 7.6 7.6 -0.3
France 9.1 8.9 0.2 22.6 22.7 -1.1 3.0 3.9 0.4 4.0 3.8 -1.0 45.1 45.5 1.5 7.0 6.8 0.5 9.1 8.5 -0.4
Germany 10.6 10.6 1.6 17.5 17.6 0.3 2.0 2.1 -0.3 4.5 4.0 -1.7 53.5 54.3 -0.7 5.0 4.9 1.0 6.9 6.6 -0.2
Greece 7.6 9.0 -6.5 20.0 24.3 -3.2 2.0 2.1 1.8 6.6 7.9 -3.1 35.0 42.8 -1.7 2.9 3.9 -0.8 25.9 10.1 13.5
Hungary 15.0 15.7 2.4 20.4 21.1 -2.5 2.7 2.6 -0.1 9.2 8.2 1.1 34.5 32.0 -1.5 6.7 7.1 1.2 11.6 13.3 -0.7
Iceland 25.5 .. 0.0 32.3 .. -2.7 3.9 .. -0.3 11.4 .. 5.3 16.0 .. 2.4 4.3 .. 0.1 6.5 .. -4.8
Ireland 11.5 12.0 -2.2 26.2 25.7 -1.9 2.3 2.4 -0.2 10.8 10.4 8.0 40.2 39.4 7.4 4.0 3.5 -0.4 4.9 6.5 -10.6
Israel 24.9 .. -0.4 25.3 .. 0.8 2.0 .. 0.2 9.7 .. -3.0 17.3 .. 0.8 12.1 .. 0.4 8.6 .. 1.2
Italy 11.0 10.9 0.6 20.1 19.8 -1.7 3.3 3.5 0.9 9.5 9.1 -0.7 44.3 45.0 3.5 4.7 4.5 0.0 7.1 7.1 -2.6
Japan 10.1 .. -0.3 14.1 .. -3.1 1.5 .. 0.0 5.1 .. -0.4 53.9 .. 3.4 3.5 .. 0.2 11.8 .. 0.2
Korea 14.2 13.7 -0.4 21.0 21.1 -2.1 0.9 0.9 -0.3 5.6 5.5 -1.0 25.6 26.8 4.6 12.3 12.7 2.3 20.5 19.3 -3.1
Luxembourg 8.6 8.4 0.6 18.9 19.1 -0.4 3.9 4.3 -0.5 1.0 0.8 0.3 48.4 48.3 1.1 8.2 8.3 0.9 11.0 10.8 -2.1
Mexico 12.2 .. 0.0 37.6 .. -1.4 4.5 .. 0.7 7.3 .. -0.4 9.3 .. 1.7 11.1 .. 2.6 18.1 .. -3.3
Netherlands 13.9 13.5 -0.7 19.8 19.7 -0.4 2.6 2.5 -0.4 3.3 3.1 -1.4 48.2 47.9 4.6 4.3 4.9 -0.5 8.0 8.4 -1.2
New Zealand 16.0 .. -0.2 23.5 .. -0.2 0.9 .. 0.1 4.4 .. 0.2 36.9 .. 0.7 6.8 .. 0.3 11.4 .. -0.9
Norway 13.6 13.5 0.2 30.9 30.5 1.8 4.3 4.2 0.1 1.5 1.4 -4.7 34.6 34.5 1.4 5.3 5.7 0.4 9.9 10.3 0.7
Poland 13.9 14.4 0.0 24.4 24.4 0.2 1.6 1.4 -0.6 5.9 4.7 0.8 38.5 38.9 1.5 5.5 5.2 -0.1 10.1 11.0 -1.9
Portugal 11.5 12.0 -0.7 24.8 24.2 -4.6 1.2 1.4 -0.5 9.8 10.1 3.2 40.7 40.2 4.4 5.9 5.5 0.4 6.1 6.6 -2.1
Slovak Republic 12.7 13.0 -0.8 20.6 20.9 0.7 2.6 2.3 -0.6 4.6 4.6 0.8 46.1 45.7 1.4 4.5 4.0 -0.1 8.8 9.4 -1.5
Slovenia 11.4 13.4 -1.8 21.0 23.2 -3.6 1.8 1.7 -1.9 4.2 6.5 1.3 32.2 37.0 -5.8 4.7 4.3 -0.2 24.7 13.8 11.9
Spain 12.0 12.0 -0.9 24.6 24.8 -0.9 2.2 2.4 -0.6 7.4 7.5 3.3 42.7 43.1 7.1 4.0 3.8 -0.1 7.0 6.5 -8.1
Sweden 15.9 16.0 0.3 23.7 23.9 -1.1 3.1 3.3 0.3 1.8 1.7 -1.7 33.4 33.0 0.7 13.1 13.1 1.1 8.9 9.0 0.4
Switzerland 12.9 .. 0.3 22.3 0.0 10.3 .. -0.6 1.9 .. -1.7 33.5 .. -0.4 6.6 .. 1.7 12.5 .. 0.6
United Kingdom 25.3 25.5 0.1 21.4 21.4 -3.4 1.2 1.3 -0.3 6.3 6.2 1.2 32.2 32.3 3.3 6.2 5.7 -0.3 7.4 7.7 -0.6
United States 17.5 .. -0.8 25.8 .. -1.4 0.9 .. -0.1 9.3 .. -0.4 36.8 .. 4.9 0.7 .. -0.1 8.9 .. -2.1
OECD WA 14.8 .. -0.3 22.9 .. -1.4 2.0 .. 0.0 6.9 .. -0.5 39.8 .. 3.1 4.0 .. 0.3 9.6 .. -1.3
OECD UWA 14.4 .. -0.2 23.6 .. -1.2 2.9 .. 0.0 5.6 .. -0.1 36.9 .. 2.0 6.0 .. 0.4 10.7 .. -0.9
Colombia 15.0 .. -0.9 22.3 .. -0.4 0.4 .. 0.1 7.3 .. -3.5 33.2 .. 2.0 10.9 .. 1.0 10.9 .. 1.7
Latvia 17.0 16.8 1.0 25.5 25.4 -3.9 1.6 1.8 -0.6 4.0 3.7 3.0 31.2 30.0 8.3 7.5 9.4 -1.9 13.2 12.8 -5.9
Russia 20.6 .. -0.7 28.1 .. 3.4 1.5 .. -0.5 1.6 .. 0.3 29.6 .. 5.5 5.9 .. -0.5 12.7 .. -7.4
Source: OECD National Accounts Statistics (database).1 2 http://dx.doi.org/10.1787/888933248435
GOVERNMENT AT A GLANCE 2015 © OECD 2015 75
2. PUBLIC FINANCE AND ECONOMICS
Expenditures structure by level of government
Governments are traditionally responsible for the provisionof public goods and services (e.g. education and healthcare) as well as for the redistribution of income (e.g. socialbenefits and subsidies). Furthermore, the responsibility forfinancing these tasks is shared between different levels ofgovernment. The need to improve the quality and effi-ciency of government spending has confirmed sub-centralgovernments as important players in the implementationof public policies. Indeed, sub-central governments couldbe considered better equipped than central governments toobtain information on local needs and better placed to tai-lor the provision of public services.
In 2013, 42.8% of general government expenditures wereundertaken by central governments across OECD countries.An additional 37.8% was covered by state and local govern-ments while the social security funds accounted for theremaining 19.4%. However, the level of decentralisationvaries considerably across OECD countries, and this alsohas an effect on the spending responsibilities. For example,in Ireland (unitary state), 90.4% of total spending was car-ried out by central government in 2013 and 91.2% in 2014,representing an increase of 9.4 percentage pointsbetween 2007 and 2014. In contrast, state and local govern-ments in Belgium, Canada, Germany, Spain, Switzerlandand Mexico (federal or quasi federal states) account for alarger share of public expenditures than the central govern-ment.
In general, central governments spend a relatively largeproportion of their budgets on social protection(e.g. pensions and unemployment benefits), general publicservices (e.g. executive and legislative organs, public debttransactions) and defence than state and local govern-ments. In half of OECD countries, expenditures on socialprotection represent the largest share of central govern-ment budgets. In Belgium and Spain, central governmentsallocate over 60% of their budgets to general public ser-vices.
Between 2007 and 2013, the share of expenditures corre-sponding to sub-central governments increased in severalcountries. Highest increases were recorded by Norway(2.4 p.p.), Canada (2.0 p.p.), Switzerland (1.5 p.p.) and Finland(1.1 p.p.). On the contrary, European countries with high fis-cal pressure during the crisis such as Slovenia (9.0 p.p.),Ireland (8.5 p.p.), Hungary (7.2 p.p.) and Greece (4.3 p.p.)experienced increases in the share of central governmentexpenditures to total government spending during thesame period.
Further reading
OECD (2013), OECD Regions at a Glance 2013, OECD, Paris,http://dx.doi.org/10.1787/reg_glance-2013-en.
Figure notes
Data for Chile are not available. In 2014, data for the OECD non-Euro-pean countries (apart from Canada and Korea) and for Iceland, Turkeyand Switzerland are not available. Data for Turkey are not included inthe OECD average due to missing time-series. Transfers between levelsof government are excluded (apart from Australia, Korea, Japan and Tur-key). Local government is included in state government for Australiaand the United States. Australia does not operate government socialinsurance schemes. Social security funds are included in central govern-ment in Ireland, New Zealand, Norway, the United Kingdom andthe United States. Australia and Colombia: 2012 rather than 2013.
Information on data for Israel: http://dx.doi.org/10.1787/888932315602.
Methodology and definitions
Expenditures data are derived from the OECD NationalAccounts Statistics (database) and Eurostat Governmentfinance statistics (database), which are based on theSystem of National Accounts (SNA), a set of internation-ally agreed concepts, definitions, classifications andrules for national accounting. There have been revi-sions in the SNA framework and most of the OECDcountries have partly or entirely implemented theupdated 2008 SNA methodology (see Annex A fordetails). Expenditures encompass intermediate con-sumption, compensation of employees, subsidies,property income (including interest spending), socialbenefits, other current expenditures (mainly currenttransfers) and capital expenditures (i.e. capital trans-fers and investments). General government consistsof central, state and local governments and socialsecurity funds. State government is only applicable tothe nine OECD countries that are federal states:Australia, Austria, Belgium, Canada, Germany, Mexico,Spain (considered a quasi-federal country), Switzerlandand the United States.
Data in Figure 2.41 and Table 2.42 (Change in the distri-bution of government expenditures across levels of gov-ernment, 2009 to 2013 and 2014) exclude transfersbetween levels of government and thus provide a roughproxy of the overall responsibility for providing goodsand services borne by each level of government. How-ever, data on the structure of expenditures at the cen-tral, state, and local levels (Figure 2.43 and Tables 2.44and 2.45) include transfers between levels of govern-ment and therefore illustrate how much is spent oneach function at each level of government. Figure 2.43and Tables 2.42, 2.44 and 2.45 are available online (http://dx.doi.org/10.1787/888933248478; http://dx.doi.org/10.1787/888933248464; http://dx.doi.org/10.1787/888933248482; http://dx.doi.org/10.1787/888933248492).
GOVERNMENT AT A GLANCE 2015 © OECD 201576

2. PUBLIC FINANCE AND ECONOMICS
Expenditures structure by level of government
2.41. Distribution of general government expenditures across levels of government, 2007, 2013 and 2014
Source: OECD National Accounts Statistics (database).1 2 http://dx.doi.org/10.1787/888933248456
%
2007
2013
2007
2013
2007
2013
2007
2013
2007
2013
2007
2013
2007
2013
2007
2013
2007
2013
2007
2013
2007
2013
2007
2013
2007
2013
2007
2013
2007
2013
2007
2013
2007
2013
2007
2013
2007
2013
2007
2013
2007
2013
2007
2013
2007
2013
2007
2013
2007
2013
2007
2013
2007
2013
2007
2013
2007
2013
2007
2013
2007
2013
2007
2013
2007
2013
2007
2013
2007
2013
2007
2013
2007
2013
0
20
40
60
80
100
0
20
40
60
80
100
2014
2014
2014
2014
2014
2014
2014
2014
2014
2014
2014
2014
2014
2014
2014
2014
2014
2014
2014
2014
2014
2014
2014
2014
2014
IRL
NZL GBR ISRES
TNOR
TURGRC
CZEAUS
PRTSVN
HUN ISLUSA
KORSVK
LUX
SWEAUT
MEXPOL
JPN
FRA
DNK ITA NLD FIN CANES
PBEL DEU CHE
OECD U
WA
OECD W
ACOL
LVA
2007 and 2013
Central government State government Local government Social security
2014
IRL
GBRES
TNOR
CZEPRT
HUNGRC
SVNKOR
SVKLU
XAUT
SWEPOL
FRA
DNK ITA NLD FIN CANES
PBEL DEU LV
A
GOVERNMENT AT A GLANCE 2015 © OECD 2015 77
2. PUBLIC FINANCE AND ECONOMICS
Government investment spending
Governments have various tools to promote economicgrowth and societal well-being. Government undertakeslong-term investments in public infrastructures as well asresearch and development that can contribute to balancingthe economic cycles, create new jobs and enhance produc-tivity by applying counter-cyclical policies).
In 2013, on average, OECD governments invested 7.8% oftotal government spending varying from 17.2% in Korea toless than 4% in Ireland. Between 2007 and 2013, OECDcountries experienced an average reduction of governmentinvestment by 1.3 p.p. While at the beginning of the crisisinvestment played a role as a tool for countercyclical fiscalpolicies; starting shortly afterwards, consolidation policieshave crowded out public investment hence increasing vol-atility and affecting the overall efficiency of public spend-ing. From 2013 to 2014, government investment as a shareof total government expenditure increased substantially inGreece and Slovenia (3.3 p.p. and 2.7 p.p. respectively)almost recovering to 2009 levels (-1 p.p. in both cases).
In 2013, government investment as a share of total invest-ment in the economy reached on average 15.9%. Greece isthe country with the largest share (23.2%) followed bySlovenia and Luxembourg (22.6% and 22.1% respectively).Between 2009 and 2013 the majority of OECD countriesreduced their government investment due to the imple-mentation of austerity programmes.
The investment patterns in OECD countries are shaped, toa great extent, by the political and administrative structure.In this respect, sub-central governments have an importantrole reaching in 2013 on average about 60% of the total gov-ernment investment. However, countries such as the Chile,Greece and the Slovak Republic experienced large propor-tions of government investment carried out by the centralgovernment (above 70%). Between 2007 and 2014, no com-mon trend exists toward investment decentralisation whileIreland has experienced a significant increase of centralgovernment investment (38.2 p.p.).
Further reading
OECD (2014), Recommendation on Effective Public InvestmentAcross Levels of Government, OECD, Paris, www.oecd.org/regional/regional-policy/Principles-Public-Investment.pdf.
OECD (2013), OECD Regions at a Glance 2013, OECD, Paris,http://dx.doi.org/10.1787/reg_glance-2013-en.
Figure notes
Data for Chile and Turkey are not included in the OECD average becauseof missing time series. Data for, Colombia and the Russia are for 2012rather than 2013. Differences in the data availability between 2.46and 2.47 are due to the use of different data tables within the OECDNational Accounts Statistics (database).
2.46: Data for Chile are not available.
2.47: Data for Iceland are not available. Data for Korea are not includedin the OECD average because of missing time series. Data for Koreaand Switzerland and China are for 2012 rather than 2013. Totalinvestment for Luxembourg and Turkey refers to gross capital forma-tion (i.e. acquisition less disposals of non-financial, non-producedassets are not included).
2.48: Data for Turkey are not available. Local government is included instate government for Australia and the United States. Australia doesnot operate government social insurance schemes. Social securityfunds are included in central government in Ireland, New Zealand,Norway, the United Kingdom and the United States.
Information on data for Israel: http://dx.doi.org/10.1787/88932315602.
Methodology and definitions
Data are derived from the OECD National Accounts Statis-tics (database), which are based on the System of NationalAccounts (SNA), a set of internationally agreed concepts,definitions, classifications and rules for nationalaccounting. There have been revisions in the SNAframework and most of the OECD countries have partlyor entirely implemented the updated SNA 2008methodology (see Annex A for details). General govern-ment investment includes gross capital formation andacquisitions, less disposals of non-produced non-financial assets. Gross fixed capital formation (alsonamed as fixed investment) is the main componentof investment consisting for government, mainly of
transport infrastructure but also including infra-structure such as office buildings, housing, schools,hospitals, etc. Moreover, with the SNA 2008 frame-work expenditures in research and development havebeen also included in fixed investment. Governmentinvestments together with capital transfers consti-tute the category of government capital expenditures.
Total investment refers to the investment spending ofthe entire economy, including expenditures by gen-eral government, non-financial corporations, finan-cial corporations, households and non-profitinstitutions.
Government consists of central, state and local govern-ments and social security funds. State government isonly applicable to the nine OECD countries that arefederal states: Australia, Austria, Belgium, Canada,Germany, Mexico, Spain (considered a quasi-federalcountry), Switzerland and the United States. Figures2.49, Government investment as percentage of GDP,2007, 2009, 2013 and 2014 and 2.50, Change in the dis-tribution of investment spending across levels of gov-ernment, 2007 to 2013 and 2014 are available on line(http://dx.doi.org/10.1787/888933248538; http://dx.doi.org/10.1787/888933248548).
GOVERNMENT AT A GLANCE 2015 © OECD 201578
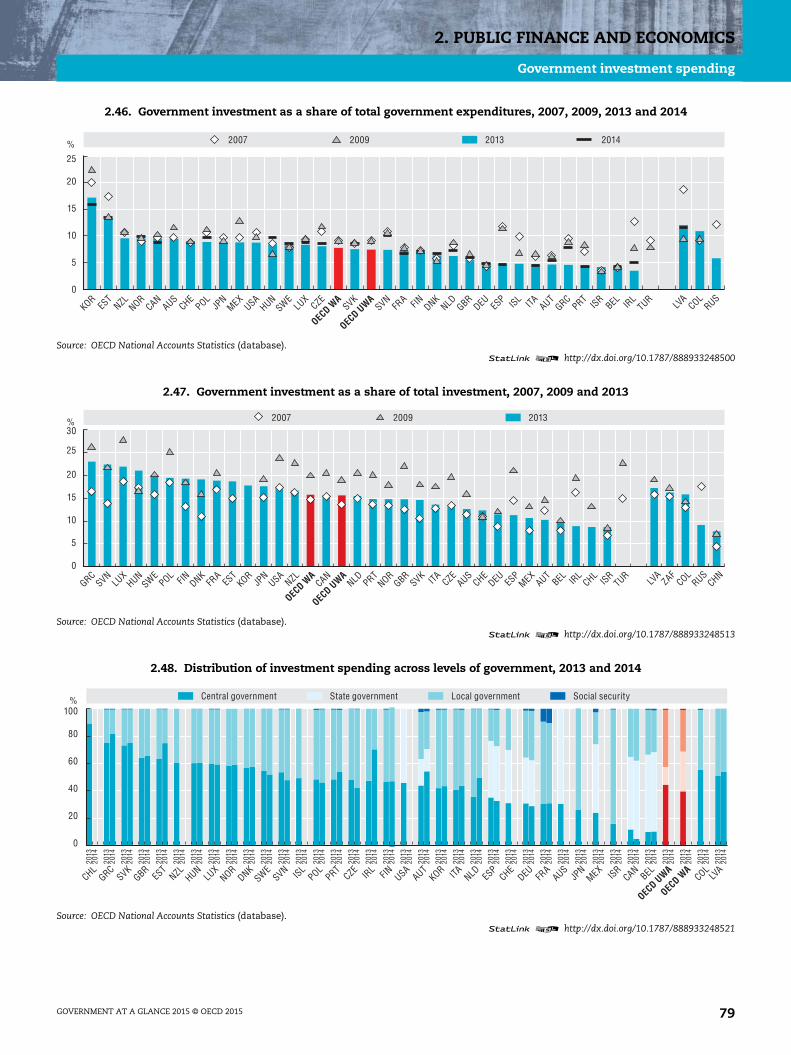
2. PUBLIC FINANCE AND ECONOMICS
Government investment spending
2.46. Government investment as a share of total government expenditures, 2007, 2009, 2013 and 2014
Source: OECD National Accounts Statistics (database).1 2 http://dx.doi.org/10.1787/888933248500
2.47. Government investment as a share of total investment, 2007, 2009 and 2013
Source: OECD National Accounts Statistics (database).1 2 http://dx.doi.org/10.1787/888933248513
2.48. Distribution of investment spending across levels of government, 2013 and 2014
Source: OECD National Accounts Statistics (database).1 2 http://dx.doi.org/10.1787/888933248521
%
0
5
10
15
20
25
201320092007 2014
KORES
TNZL NOR
CANAUS
CHEPOL
JPN
MEXUSA
HUNSWE
LUX
CZE
OECD W
ASVK
OECD U
WASVN
FRA FIN DNK
NLD GBRDEU ES
P ISL ITA AUTGRC
PRTISR
BEL IRL
TURLV
ACOL
RUS
%
0
5
10
15
20
25
30201320092007
GRCSVN
LUX
HUNSWE
POL FIN DNKFR
AES
TKOR
JPN
USANZL
OECD W
ACAN
OECD U
WANLD PRT
NORGBR
SVK ITA CZEAUS
CHEDEU ES
PMEX
AUTBEL IR
LCHL
ISRTUR
LVA
ZAFCOL
RUSCHN
%
2013
2014
2013
2014
2013
2014
2013
2014
2013
2014
2013
2014
2013
2014
2013
2014
2013
2014
2013
2014
2013
2014
2013
2014
2013
2014
2013
2014
2013
2014
2013
2014
2013
2014
2013
2014
2013
2014
2013
2014
2013
2014
2013
2014
2013
2014
2013
2014
2013
2014
2013
2014
2013
2014
2013
2014
2013
2014
2013
2014
2013
2014
2013
2014
2013
2014
2013
2014
2013
2014
2013
2014
2013
2014
0
20
40
60
80
100
CHLGRC
SVKGBR
EST
NZL HUNLU
XNOR
DNKSWE
SVN ISLPOL
PRTCZE
IRL FIN USA
AUTKOR ITA NLD ES
PCHE
DEU FRA
AUSJP
NMEX
ISRCAN
BEL
OECD U
WA
OECD W
ACOL
LVA
Central government State government Local government Social security
GOVERNMENT AT A GLANCE 2015 © OECD 2015 79
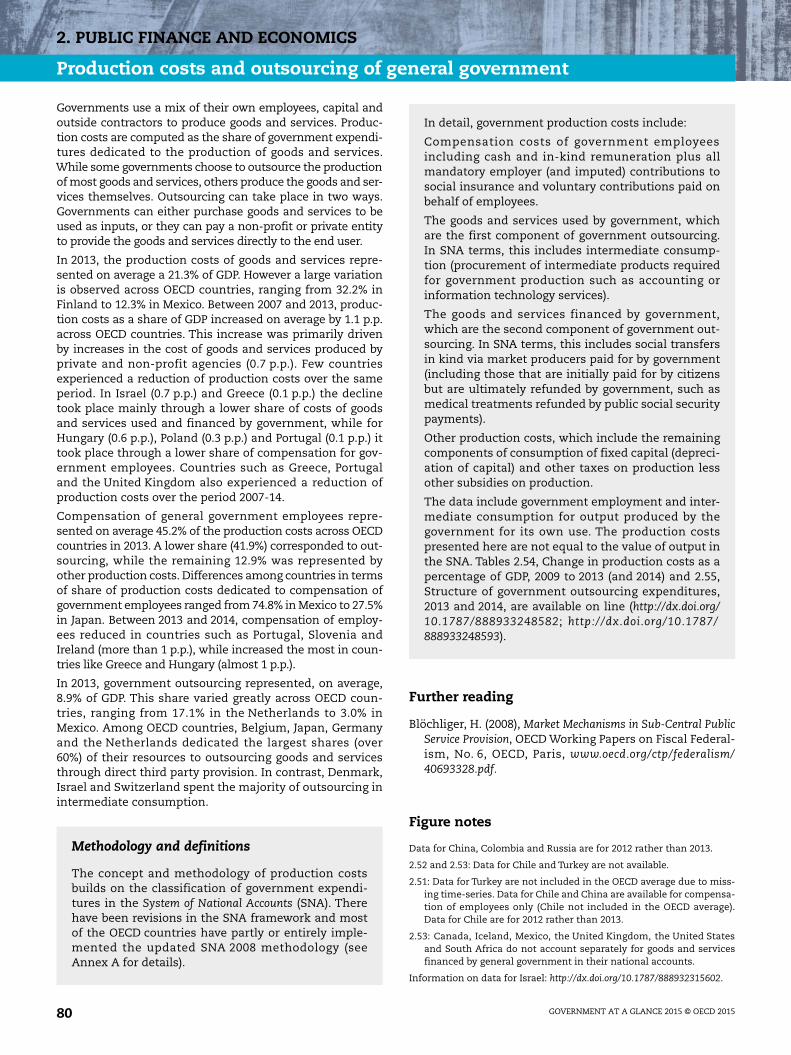
2. PUBLIC FINANCE AND ECONOMICS
Production costs and outsourcing of general government
Governments use a mix of their own employees, capital andoutside contractors to produce goods and services. Produc-tion costs are computed as the share of government expendi-tures dedicated to the production of goods and services.While some governments choose to outsource the productionof most goods and services, others produce the goods and ser-vices themselves. Outsourcing can take place in two ways.Governments can either purchase goods and services to beused as inputs, or they can pay a non-profit or private entityto provide the goods and services directly to the end user.
In 2013, the production costs of goods and services repre-sented on average a 21.3% of GDP. However a large variationis observed across OECD countries, ranging from 32.2% inFinland to 12.3% in Mexico. Between 2007 and 2013, produc-tion costs as a share of GDP increased on average by 1.1 p.p.across OECD countries. This increase was primarily drivenby increases in the cost of goods and services produced byprivate and non-profit agencies (0.7 p.p.). Few countriesexperienced a reduction of production costs over the sameperiod. In Israel (0.7 p.p.) and Greece (0.1 p.p.) the declinetook place mainly through a lower share of costs of goodsand services used and financed by government, while forHungary (0.6 p.p.), Poland (0.3 p.p.) and Portugal (0.1 p.p.) ittook place through a lower share of compensation for gov-ernment employees. Countries such as Greece, Portugaland the United Kingdom also experienced a reduction ofproduction costs over the period 2007-14.
Compensation of general government employees repre-sented on average 45.2% of the production costs across OECDcountries in 2013. A lower share (41.9%) corresponded to out-sourcing, while the remaining 12.9% was represented byother production costs. Differences among countries in termsof share of production costs dedicated to compensation ofgovernment employees ranged from 74.8% in Mexico to 27.5%in Japan. Between 2013 and 2014, compensation of employ-ees reduced in countries such as Portugal, Slovenia andIreland (more than 1 p.p.), while increased the most in coun-tries like Greece and Hungary (almost 1 p.p.).
In 2013, government outsourcing represented, on average,8.9% of GDP. This share varied greatly across OECD coun-tries, ranging from 17.1% in the Netherlands to 3.0% inMexico. Among OECD countries, Belgium, Japan, Germanyand the Netherlands dedicated the largest shares (over60%) of their resources to outsourcing goods and servicesthrough direct third party provision. In contrast, Denmark,Israel and Switzerland spent the majority of outsourcing inintermediate consumption.
Further reading
Blöchliger, H. (2008), Market Mechanisms in Sub-Central PublicService Provision, OECD Working Papers on Fiscal Federal-ism, No. 6, OECD, Paris, www.oecd.org/ctp/federalism/40693328.pdf.
Figure notes
Data for China, Colombia and Russia are for 2012 rather than 2013.
2.52 and 2.53: Data for Chile and Turkey are not available.
2.51: Data for Turkey are not included in the OECD average due to miss-ing time-series. Data for Chile and China are available for compensa-tion of employees only (Chile not included in the OECD average).Data for Chile are for 2012 rather than 2013.
2.53: Canada, Iceland, Mexico, the United Kingdom, the United Statesand South Africa do not account separately for goods and servicesfinanced by general government in their national accounts.
Information on data for Israel: http://dx.doi.org/10.1787/888932315602.
Methodology and definitions
The concept and methodology of production costsbuilds on the classification of government expendi-tures in the System of National Accounts (SNA). Therehave been revisions in the SNA framework and mostof the OECD countries have partly or entirely imple-mented the updated SNA 2008 methodology (seeAnnex A for details).
In detail, government production costs include:
Compensation costs of government employeesincluding cash and in-kind remuneration plus allmandatory employer (and imputed) contributions tosocial insurance and voluntary contributions paid onbehalf of employees.
The goods and services used by government, whichare the first component of government outsourcing.In SNA terms, this includes intermediate consump-tion (procurement of intermediate products requiredfor government production such as accounting orinformation technology services).
The goods and services financed by government,which are the second component of government out-sourcing. In SNA terms, this includes social transfersin kind via market producers paid for by government(including those that are initially paid for by citizensbut are ultimately refunded by government, such asmedical treatments refunded by public social securitypayments).
Other production costs, which include the remainingcomponents of consumption of fixed capital (depreci-ation of capital) and other taxes on production lessother subsidies on production.
The data include government employment and inter-mediate consumption for output produced by thegovernment for its own use. The production costspresented here are not equal to the value of output inthe SNA. Tables 2.54, Change in production costs as apercentage of GDP, 2009 to 2013 (and 2014) and 2.55,Structure of government outsourcing expenditures,2013 and 2014, are available on line (http://dx.doi.org/10.1787/888933248582; http://dx.doi.org/10.1787/888933248593).
GOVERNMENT AT A GLANCE 2015 © OECD 201580

2. PUBLIC FINANCE AND ECONOMICS
Production costs and outsourcing of general government
2.51. Production costs as a percentage of GDP, 2007, 2013 and 2014
Source: OECD National Accounts Statistics (database). Data for Australia are based on a combination of Government Finance Statistics and National Accountsdata provided by the Australian Bureau of Statistics.
1 2 http://dx.doi.org/10.1787/888933248552
2.52. Structure of production costs, 2013 and 2014
Source: OECD National Accounts Statistics (database). Data for Australia are based on a combination of Government Finance Statistics and National Accountsdata provided by the Australian Bureau of Statistics.
1 2 http://dx.doi.org/10.1787/888933248567
2.53. Expenditures on general government outsourcing as a percentage of GDP, 2013 and 2014
Source: OECD National Accounts Statistics (database). Data for Australia are based on a combination of Government Finance Statistics and National Accountsprovided by the Australian Bureau of Statistics.
1 2 http://dx.doi.org/10.1787/888933248576
%
2007
2013
2007
2013
2007
2013
2007
2013
2007
2013
2007
2014
2007
2013
2007
2013
2007
2013
2007
2013
2007
2013
2007
2013
2007
2013
2007
2013
2007
2013
2007
2013
2007
2013
2007
2013
2007
2013
2007
2013
2007
2013
2007
2013
2007
2013
2007
2013
2007
2013
2007
2013
2007
2013
2007
2013
2007
2013
2007
2013
2007
2013
2007
2013
2007
2013
2007
2013
2007
2013
2007
2013
2007
2013
2007
2013
2007
2013
2007
2013
2007
2013
0
5
10
15
20
25
3035
Compensation of government employees
Costs of goods and services used and financed by government, 2014Other production costs
Costs of goods and services used and financed by government
Other production costs, 2014Compensation of government employees, 2014
FIN DNKSWE
NLD FRA ISL
BEL CANNOR
SVN ISRAUT
HUN
OECD U
WACZE
GBRDEU PRT
NZL GRCSVK
EST ITA JP
NES
P
OECD W
AAUS
POLIR
LUSA
LUX
KORTUR
CHEMEX
CHLZAF
LVA
RUSCOL
CHN
%
0102030405060708090
100
2013
2014
2013
2014
2013
2014
2013
2014
2013
2014
2013
2014
2013
2014
2013
2014
2013
2014
2013
2014
2013
2014
2013
2014
2013
2014
2013
2014
2013
2014
2013
2014
2013
2014
2013
2014
2013
2014
2013
2014
2013
2014
2013
2014
2013
2014
2013
2014
2013
2014
2013
2014
2013
2014
2013
2014
2013
2014
2013
2014
2013
2014
2013
2014
2013
2014
2013
2014
2013
2014
2013
2014
2013
2014
2013
2014
MEXNOR
DNKPRT
IRL
GRC ISLSVN
USAES
PPOL
EST
CANCHE ITA BEL FR
AAUS FIN AUT
HUN ISRLU
XGBR
NZLSWE
SVKKOR
DEU CZENLD JP
N
OECD U
WA
OECD W
ARUS
ZAFLV
ACOL
Compensation of government employees Other production costsCosts of goods and services used and financed by government
%
0
4
8
12
16
20
Goods and services used by government, 2013 Goods and services financed by government, 2013Goods and services financed by government, 2014Goods and services used by government, 2014
NLD FIN DEU JPN
SWEBEL ISR
GBR ISLFR
ADNK
NZL CZEAUT
SVK
OECD U
WAHUN
CANAUS
OECD W
ASVN
LUX
EST ITA KOR
NORES
PPOL
PRTIR
LGRC
USACHE
MEXZAF
RUSCOL
LVA
GOVERNMENT AT A GLANCE 2015 © OECD 2015 81


GOVERNMENT AT A GLANCE 2015 © OEC
3. PUBLIC EMPLOYMENT
Employment in the public sector
Women in public sector employment
Women in politics
D 2015 83

3. PUBLIC EMPLOYMENT
Employment in the public sector
Governments across the OECD perform a wide range offunctions, all of which depend on a dedicated and skilledpublic sector workforce. The large differences in the rela-tive sizes of public sector employment across the OECDreflect the equally large variety of activities undertaken bygovernments and the ways they deliver public services.Services can be delivered in large part by governmentemployees or through a range of partnerships with the pri-vate or not-for-profit sectors. In some countries, the largemajority of health care providers, teachers and emergencyworkers, for example, are directly employed by the govern-ment. In other countries alternative delivery mechanismsmean that many of these professionals are employed byorganisations that are not state-owned, or as private con-tractors. The use of outsourcing, the relative size and struc-ture of the voluntary, charitable and/or not-for-profitsectors and the availability of private sector providers, alldetermine their use of public sector employment.
The size of public sector employment varies significantlyamong OECD countries. Nordic countries as Denmark, Nor-way and Sweden report high public sector employment levelsreaching near or over 30% of total employment. On the otherhand, OECD countries from the Asian and Latin Americanregions rely less on public sector employees. Only around 8%of Japan’s total employment is made up of public sectoremployment, while Chile and Mexico count just over 10%.
Although many OECD countries report sizeable reductionsin central government employment (see “Employmentreforms in central government since 2008” indicator), pub-lic sector employment as a percentage of total employmentacross OECD countries rose slightly between 2009and 2013, from 21.1% to 21.3%. This average hides somesmall variation among OECD countries. In Belgium, Polandand the United Kingdom public employment as a share oftotal employment decreased the most between 2009and 2013. In contrast, Denmark, Norway and Sloveniaexperienced increases of over one percentage point, whileSwitzerland displays the largest increase of three percent-age points over the same period.
When compared to the total labour force (including unem-ployed), public sector employment trends show similarbehaviour except in a few cases, which determined a rela-tively stable OECD average at just above 19% between 2009and 2013. Spain’s indicator shows slight reductions overthis period from 13.2% to 12.7% of total labour forcebetween 2009 and 2013 (compared to 16.2% to 17.4% asshare of total employment). Similarly in Greece, public sec-tor employment as a percentage of total labour forcedecreased between 2009 and 2013 (from 19.9% to 17.5%)while it slightly increased as a percentage of total employ-ment over the same time period (from 22.2% to 22.6%).However, it has to be noticed that in both countries theslight increase of the public sector in terms of total employ-ment was due to a faster decrease in the total employment
as compared to the public sector, thus not indicating realincreases in public sector employment.
Further reading
OECD (2011), Public Servants as Partners for Growth: Toward aStronger, Leaner and More Equitable Workforce, OECD, Paris,http://dx.doi.org/10.1787/9789264166707-en.
Figure notes
Data for Austria, Finland, Iceland, Israel, Korea, the Netherlands and theUnited States are not available. Data for Australia, Czech Republic,Germany, Ireland and Portugal are not included in the OECD averagedue to missing time series. Data for Czech Republic andNew Zealand are expressed in full-time equivalents (FTEs). Data forAustralia, Greece, Hungary, Slovenia and Spain and Ukraine arefor 2012 rather than 2013. Data for Denmark, Luxembourg,New Zealand and Turkey are for 2011 rather than 2013. Data forSwitzerland are for 2008 rather than 2009.
Methodology and definitions
Data were collected by the International Labour Orga-nization (ILO), ILOSTAT (database). Public sectoremployment covers all employment of general gov-ernment sector as defined in the System of NationalAccounts (SNA) plus employment of public corpora-tions. The general government sector comprises alllevels of government (central, state, local and socialsecurity funds) and includes core ministries, agen-cies, departments and non-profit institutions that arecontrolled by public authorities. Public corporationsare legal units producing goods or services for themarket and that are controlled and/or owned by gov-ernment units. Public corporations also includequasi-corporations. Data represent the total numberof persons employed directly by those institutions,without regard for the particular type of employmentcontract. The labour force, or active population, com-prises all persons who fulfil the requirements forinclusion among the employed or the unemployed.The employed comprise all persons of working agewho, during a specified brief period such as one weekor one day, were in the following categories: paidemployment or self-employment. For purposes ofinternational comparability, the working-age popula-tion is commonly defined as persons aged 15 yearsand older, although this might vary in some coun-tries. Labour force refers to all persons of working agewho furnish the supply of labour for the production ofgoods and services during a specified time-referenceperiod.
GOVERNMENT AT A GLANCE 2015 © OECD 201584

3. PUBLIC EMPLOYMENT
Employment in the public sector
3.1. Public sector employment as a percentage of total employment, 2009 and 2013
Source: International Labour Organization (ILO), ILOSTAT (database). Data for Italy are from the National Statistical Institute and the Ministry ofFinance. Data for Portugal are from the Ministry of Finance. Data for Korea were provided by national authorities.
1 2 http://dx.doi.org/10.1787/888933248603
0
5
10
15
20
25
30
35
40% 20092013
DNKNOR
SWESVK
HUNES
TLU
XPOL
IRL
GBRSVN
GRCBEL
OECD
CANFR
AAUS
CHE ITA ESP
PRTTUR
NZL MEXCHL
JPN
KORCZE
DEU LVA
UKRZAF
BRACOL
3.2. Public sector employment as a percentage of the labour force, 2009 and 2013
Source: International Labour Organization (ILO), ILOSTAT (database). Data for Italy are from the National Statistical Institute and the Ministry ofFinance. Data for Portugal are from the Ministry of Finance. Data for Korea were provided by national authorities.
1 2 http://dx.doi.org/10.1787/888933248615
0
5
10
15
20
25
30
35
40% 2013 2009
NORDNK
SWELU
XHUN
EST
SVKPOL
GBRSVN
BELOEC
DCAN
FRA
GRC IRL
CHE ITA AUSPRT
ESP
TURNZL
MEXCHL
JPN
CZEKOR
DEU LVA
UKRZAF
BRACOL
GOVERNMENT AT A GLANCE 2015 © OECD 2015 85

3. PUBLIC EMPLOYMENT
Women in public sector employment
Equal representation of women in public sector employ-ment helps achieve fairness, openness and representative-ness. It also improves the quality of service deliverythrough a better understanding of the citizenry. In theOECD countries for which data are available, women repre-sented, on average, 58% of the total public sector workforcein 2013 going from more than 70% in Sweden to 42% inJapan. Japan reported establishing targets for women at thesectoral level in areas where women are under-represented. On average in OECD countries, women aremore represented in the public sector (58.2%) as comparedto the whole economy where women employment as ashare of the total employment reached only 45.3%. It isimportant to note that the data don’t demonstrate theextent to which women hold managerial leadership posi-tions within the public sector.
Public sector employment is often more attractive forwomen because of its employment conditions. Women usu-ally find the flexible working hours, diverse career paths andoptions, relative job stability, good pay and benefit packagesattractive. Public service modernisation and strengtheningfundamental public service values and principles, such asmerit and diversity, may have also contributed to the increaseof women in public sector employment (OECD, 2014a).
On average in OECD countries between 2009 and 2013,women employment in the public sector grew faster(+0.6 p.p.) than in the whole economy (+0.3 p.p.) with anincrease in countries such as Luxembourg, Switzerland,Spain and Mexico. Women’s employment in the public sec-tor also grew significantly in Colombia. Counter to the gen-eral trend, the share of employed women in the economy inEstonia decreased by 1.6 p.p. over the same period. Thisdecrease is also seen in the share of women in the publicsector (-3.6 p.p.) over the period. It is important to note,however, that reaching gender equity between men andwomen in the public sector goes beyond numerical bal-ance. Evidence still suggests that women continue to facemajor difficulties in accessing management and leadershippositions, are still more frequently employed in part-timeand contractual jobs and that there is still an important gapin earnings between men and women (OECD, 2014a). Gov-ernments can play an important role in removing thesebarriers. Policies that support women’s equal representa-tion in the public sector include positive action policiessuch as diversity targets and employment equity laws,coaching, sponsorship and leadership development andawareness raising programmes, initiatives to ensure payequity, equal pay and work-life balance.
Further reading
OECD (2014a), Women, Government and Policy Making in OECDCountries: Fostering Diversity for Inclusive Growth, OECD,Paris, http://dx.doi.org/10.1787/9789264210745-en.
OECD/CAWTAR (2014b), Women in Public Life: Gender, Law andPolicy in the Middle East and North Africa, OECD, Paris, http://dx.doi.org/10.1787/9789264224636-en.
OECD (2012), Closing the Gender Gap: Act Now, OECD, Paris,http://dx.doi.org/10.1787/9789264179370-en.
Figure notes
3.3: Data for Austria, Czech Republic, Finland, Iceland, Ireland, Israel,Korea, the Netherlands, Portugal, Turkey and the United States arenot available. Data for Australia, Germany and Sweden are notincluded in the OECD average due to missing time series. Data forNew Zealand are expressed in full-time equivalents (FTEs). Data forAustralia, Greece, Hungary and Slovenia are for 2012 ratherthan 2013. Data for Denmark, Luxembourg and New Zealand arefor 2011 rather than 2013. Data for Switzerland are for 2008 ratherthan 2009.
Methodology and definitions
Data were collected by the International Labour Orga-nization (ILO), ILOSTAT (database). Public sectoremployment covers all employment of general gov-ernment sector as defined in the System of NationalAccounts (SNA) plus employment of public corpora-tions. The general government sector comprises alllevels of government (central, state, local and socialsecurity funds) and includes core ministries, agen-cies, departments and non-profit institutions that arecontrolled by public authorities. Public corporationsare legal units producing goods or services for themarket and which are controlled and/or owned bygovernment units. Public corporations also includequasi-corporations. Data represent the total numberof persons employed directly by those institutions,without regard for the particular type of employmentcontract. Total employment comprises all persons ofworking age who, during a specified brief period, suchas one week or one day, were in the following catego-ries: paid employment or self-employment. For pur-poses of international comparability, the working agepopulation is commonly defined as persons aged15 years and older, although this might vary in somecountries.
GOVERNMENT AT A GLANCE 2015 © OECD 201586

3. PUBLIC EMPLOYMENT
Women in public sector employment
3.3. Share of public sector employment filled by women and men, 2009 and 2013
Source: International Labour Organization (ILO), ILOSTAT (database). Data for Italy are from the National Statistical Institute and the Ministry offinance. Data for Portugal are from the Ministry of Finance.
1 2 http://dx.doi.org/10.1787/888933248622
0
10
20
30
40
50
60
70
80
90
100
2009
2013
2009
2013
2009
2013
2009
2013
2009
2013
2009
2013
2009
2013
2009
2013
2009
2013
2009
2013
2009
2013
2009
2013
2009
2013
2009
2013
2009
2013
2009
2013
2009
2013
2009
2013
2009
2013
2009
2013
2009
2013
2009
2013
2009
2013
2009
2013
2009
2013
2009
2013
2009
2013
2009
2013
2009
2013
Women Men
SWE SVN DNK NOR EST GBR CAN FRA HUN POL SVK NZL AUS PRT CHE BEL ITA ESP CHL DEU MEX LUX GRC JPN OECD LVA BRA ZAF COL
3.4. Share of employed women in total employment, 2009 and 2013
Source: International Labour Organization (ILO), ILOSTAT (database).1 2 http://dx.doi.org/10.1787/888933248632
%
0
10
20
30
40
50
60
2013 2009
EST
PRTFR
ACAN
SWEDNK
NORNZL GBR
DEU CHEHUN
BEL AUSES
PSVN
OECD
POLSVK
LUX
JPN ITA GRC
CHLMEX
LVA
ZAFBRA
COL
GOVERNMENT AT A GLANCE 2015 © OECD 2015 87

3. PUBLIC EMPLOYMENT
Women in politics
In many OECD countries, increasing the number of womenin parliament and the number of women appointed to min-isterial positions is an important objective. Greater genderbalance amongst politicians can improve the quality andresponsiveness of public policy by focusing attention onissues such as equal pay, work-life balance and gender vio-lence. Gender-sensitive parliaments can also improve gov-ernments’ efforts in effectively implementing genderequality and mainstreaming strategies, as parliamentarycommittees may also serve as important independentoversight and accountability mechanisms. Yet women stillface a “glass ceiling” blocking their full participation inpolitical life in the legislature and political executive, andremain generally under-represented in politics (OECD,2014).
On average in 2015, 27.9% of the seats in lower/single houseparliaments were occupied by women, ranging from morethan 40% in Sweden, Finland, Iceland and Spain to lessthan 10% in Japan (Figure 3.5). Between 2002 and 2012,women’s representation in parliament has only moderatelyincreased (+ 7 p.p.) and still only 16 OECD countries reach orexceed the 30% critical threshold in 2015.
Some of the barriers to greater participation of women inparliaments include, for instance, few female candidatesand uneven access to financing, lack of work-life balance,limited political encouragement, lack of commitment togender balance within parties and gender stereotypes.Many OECD countries have introduced gender quotas as amean (often temporary) for increasing women’s politicalrepresentation to close historical imbalances, as well ascorrect for or prevent rollbacks in gender equality. AcrossOECD countries, quotas are applied mainly during thenomination process (e.g. rules for placing women on partylists or to be nominated in an electoral district). These quo-tas can be legislated gender quotas (established by the con-stitution or electoral laws, they reserve a number of placeson electoral lists for female candidates) or voluntary partyquotas (targets set by political parties to include a certainpercentage of women as election candidates).
Representation of women in ministerial positions at thecentral/federal level of government is also somewhat lim-ited with about 29.3% of women appointed ministers onaverage in OECD countries in 2015. There is significantvariation of women’s representation in ministerial posi-tions among OECD countries. For instance, in 2015 whilegender parity was achieved in Finland, France and Swedenwomen still accounted for fewer than one in ten ministersin Hungary, Korea, the Slovak Republic and Turkey.Between 2005 and 2015, there has generally been anincrease in the representation of women in ministerialpositions in OECD countries (+ 8.2p.p) although it should benoted that data can vary significantly from one year toanother depending on political cycles and cabinetre-organisations. Following the elections in 2012, France forinstance saw a very large increase in the number of womenministers between 2012 and 2015 (+ 29.2 p.p.) and this is
also the case of Estonia, Italy and Slovenia, whereas incountries like Austria, Belgium and the Slovak Republicthere has been a significant decrease in the percentage ofwomen ministers during the same period.
Although the process of ministerial appointments differsdepending on a country’s political system (parliamentaryvoting or appointments versus presidential appointmentswith or without parliamentary approval), women are stillnot represented equally in many OECD countries.
Further reading
OECD (2014), Women, Government and Policy Making in OECDCountries: Fostering Diversity for Inclusive Growth, OECD, Paris,http://dx.doi.org/10.1787/9789264210745-en.
OECD/CAWTAR (2014), Women in Public Life: Gender, Law andPolicy in the Middle East and North Africa, OECD Publishing,Paris, http://dx.doi.org/10.1787/9789264224636-en.
Figure notes
3.5: Data for the Slovak Republic for 2002 are unavailable.
Methodology and definitions
Data for women parliamentarians refer to lower orsingle houses of parliament and were obtained fromthe Inter-Parliamentary Union’s PARLINE database.Data refer to share of women parliamentariansrecorded as of 1 December 2015, 31 October 2012 and25 October 2002. Countries in light blue representlower or single house parliaments with legislatedcandidate quotas as of January 2013. Legislative quo-tas are enshrined in the election law, political partylaw or other comparable law of a country. By defini-tion, both forms are based on legal provisions, oblig-ing all political entities participating in elections toapply them equally. Non-compliance with legislativequotas can result in penalties for those political enti-ties that do not apply to them. Data on gender quotaswere obtained from the Institute for Democracy andElectoral Assistance (IDEA) Global Database of Quotasfor Women.
Data on women ministers were obtained from theInter Parliamentary Union’s “Women in Politics” data-base. Data represent the percentage of appointedwomen ministers as of 1 February 2015, 1 January 2012and 1 January 2005. Data show women as a share oftotal ministers, including deputy prime ministers andministers. Prime ministers/heads of government werealso included when they held ministerial portfolios.Vice-presidents and heads of governmental or publicagencies have not been included in the total.
GOVERNMENT AT A GLANCE 2015 © OECD 201588

3. PUBLIC EMPLOYMENT
Women in politics
3.5. Share of women parliamentarians and legislated gender quotasLower or single house of parliament
Note: Bars in light orange represent countries with lower or single house parliaments with legislated candidate quotas as of 21 January, 2013.Source: Inter-Parliamentary Union (IPU), PARLINE (database), and IDEA Global Database of Quotas for Women.
1 2 http://dx.doi.org/10.1787/888933248642
%
0
5
10
15
20
25
30
35
40
45
50
2015 2012 2002
SWE FIN ISLES
PNOR
BEL DNKMEX
NLD SVNDEU NZL ITAPRT
AUTCHE
LUX
AUSOEC
DPOL
CANFR
AGRC
GBR ISRES
TUSA
CZESVK
KOR IRL
CHLTUR
HUNJP
NCOL
LVA
3.6. Share of women ministers
Source: Inter-Parliamentary Union (IPU) “Women in Politics”, 2005, 2012 and 2015.1 2 http://dx.doi.org/10.1787/888933248658
%
0
10
20
30
40
50
60
70
2015 2012 2005
FIN SWEFR
ANOR
NLD EST ISL ITA SVN
CHECHL
DEU NZL CANAUT
ESP
OECD
PRTIR
LPOL
LUX
DNKUSA
BEL GBRJP
NCZE
ISRMEX
AUSGRC
KORTUR
HUNSVK
COLLV
A
GOVERNMENT AT A GLANCE 2015 © OECD 2015 89


GOVERNMENT AT A GLANCE 2015 © OEC
4. INSTITUTIONS
Main institutional features of the centres of governmentin OECD countries
Roles of the centres of government
Degree of influence of the centres of government
D 2015 91

4. INSTITUTIONS
Main institutional features of the centres of government in OECD countries
The centre of government (CoG), also known as Chancellery,Cabinet Office, Office of the President, Presidencia, WhiteHouse Executive Office, Privy Council, Casa Civil, among oth-ers, is a support structure of a government. Its main objec-tive is to ensure evidence-based, strategic and consistentpolicy implementation by a government. The structure ofthe CoG reflects, on the one hand, constitutional and legalrequirements, which provide some architectural anchoring,and, on the other, an ability to be highly adaptable to theneeds, preferences and personality of the head of govern-ment of the moment. To be effective, the CoG needs to besmall enough to react rapidly to changing events; as it grows,it risks losing flexibility and becoming unwieldy. At the sametime, recent experience suggests that too small could meantoo little capacity, which, in turn, endangers the ability to theCoG to provide impartial, authoritative advice and support.
In 2011, total staff at the CoGs rarely exceeded 1 000, except inthe United States and Mexico and larger unitary states suchas France (2 100), Turkey (2 085), the United Kingdom (1 896),Chile (1 665) and Italy (1 246). In nine OECD countries, therewere fewer than 200 people working for the centre of govern-ment, namely, Switzerland (192), Belgium (160), Slovenia (153),Sweden (148), Estonia (103), the Netherlands (80), Norway (70),Israel (45) and Iceland (34).
CoGs represent a small fraction of total central governmentemployment. In 2011, CoGs accounted on average oneemployee per 1 150 employees in the total central govern-ment. This rate, even if it is low, varies largely across OECDcountries. While countries such as Chile, Switzerland andthe Great Britain had relatively large CoGs (10.70‰, 5.94‰and 3.87‰ respectively) others such as Norway and Israelhad CoGs that represented even less than 0.30‰ of centralgovernment employment.
Between 2008 and 2012, CoG institutions adapted to sup-port new policy directions, and these adaptations wereobserved in both increases and decreases in resources andsize. Sometimes, a more effective CoG can involve decreas-ing its financial resources and size. For example, for the lastfew years the government offices of Estonia and Italy havebeen transferring or eliminating functions. Additionally,new circumstances can also drive change at the centre ofgovernment. The establishment in 2010 of the UK CabinetOffice’s Efficiency and Reform team is an example of animportant change at the CoG driven by a changing eco-nomic context. Similarly, some specific events, such as theearthquake in New Zealand, have led to substantialstrengthening of capacity at the centre, also visible inincreased budgets and staff numbers.
Further reading
OECD (2015), “Centre Stage: Driving Better Policies from theCentre of Government”, GOV/PGC/MPM(2014)3, OECD,Paris, http://www2.oecd.org/oecdinfo/info.aspx?app=OLISco-teEN&Ref=GOV/PGC/MPm(2014)3.
Figure notes
Mexican figures are from INEGI (2014) Ingreso y gasto público enMéxico 2014, Edición Sede, Aguascalientes.
4.1: Centre of government employment data for Australia, Czech Republic,Greece, Hungary, Ireland, Luxembourg and Poland are not available.Australia, Austria, Czech Republic, Greece, Hungary, Iceland, Ireland,Luxembourg, Poland and the Slovak Republic are not included in theOECD average. Employment data for Germany, Israel, Ireland,Norway and Sweden are for 2010 rather than 2011. French employ-ment figures are approximations.
4.2 and 4.3: Data for Czech Republic, Greece, Ireland, Luxembourg, andPoland are not available. “Other” category refers to the situationwhere employment and budget both increased and decreasedbetween 2008 and 2012.
Information on data for Israel: http://dx.doi.org/10.1787/888932315602.
Methodology and definitions
Data were collected through the 2013 OECD Survey onthe Organisation and Functions of the Centre of Gov-ernment (33 countries, of which 28 OECD countriesand 5 non-members, and the European Commission,responded). Respondents were senior officials whoprovide direct support and advice to heads of govern-ment and the council of ministers, or cabinet and pro-vided information for the period 2008-12.
Centre of government (CoG) refers to the administra-tive structure that serves the Executive (president orprime minister, and the cabinet collectively). The cen-tre of government has a great variety of names acrosscountries, such as General Secretariat, Cabinet Office,Chancellery, Office/Ministry of the Presidency, Coun-cil of Ministers Office, etc. In many countries the CoGis made up of more than one unit, fulfilling differentfunctions. A unit that is shared by virtually all CoGs isthe unit that serves specifically the head of the gov-ernment, but not the CoG collectively. This too has avariety of names, such as the Cabinet of the PrimeMinister or the Private Office.
GOVERNMENT AT A GLANCE 2015 © OECD 201592
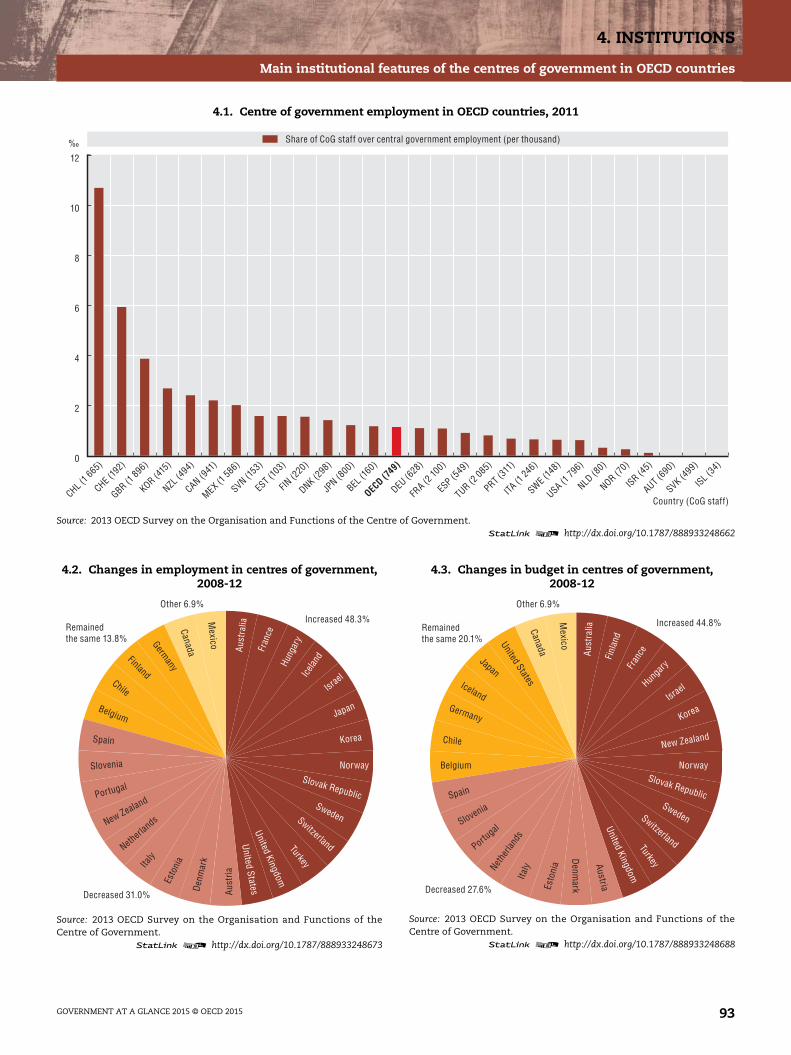
4. INSTITUTIONS
Main institutional features of the centres of government in OECD countries
4.1. Centre of government employment in OECD countries, 2011
Source: 2013 OECD Survey on the Organisation and Functions of the Centre of Government.1 2 http://dx.doi.org/10.1787/888933248662
‰
0
2
4
6
8
10
12
Share of CoG staff over central government employment (per thousand)
CHL (1 6
65)
CHE (19
2)
GBR (1 89
6)
KOR (415
)
NZL (4
94)
CAN (941
)
MEX (1 586)
SVN (153)
EST (
103)
FIN (2
20)
DNK (298)
JPN (8
00)
BEL (1
60)
OECD (7
49)
DEU (6
28)
FRA (2
100)
ESP (5
49)
TUR (2 085)
PRT (31
1)
ITA (1
246)
SWE (14
8)
USA (1 79
6)
NLD (8
0)
NOR (70)
ISR (45)
AUT (69
0)
SVK (499)
ISL (34)
Country (CoG staff)
4.2. Changes in employment in centres of government,2008-12
Source: 2013 OECD Survey on the Organisation and Functions of theCentre of Government.
1 2 http://dx.doi.org/10.1787/888933248673
Increased 48.3%
Decreased 31.0%
Remained the same 13.8%
Other 6.9%
Aust
ralia
Fran
ceHu
ngar
yIc
eland
Israel
Japan
Korea
NorwaySlovak Republic
SwedenSwitzerlandTurkey
United Kingdom
United StatesDenm
ark
Aust
ria
Esto
niaItaly
Netherl
andsNew Zealand
Portugal
Slovenia
Spain
Belgium
Chile
FinlandGerm
anyCanada
Mexico
4.3. Changes in budget in centres of government,2008-12
Source: 2013 OECD Survey on the Organisation and Functions of theCentre of Government.
1 2 http://dx.doi.org/10.1787/888933248688
Increased 44.8%
Decreased 27.6%
Remained the same 20.1%
Other 6.9%
Aust
ralia
Finl
and
Fran
ceHun
gary
Israel
Korea
New Zealand
NorwaySlovak Republic
SwedenSwitzerlandTurkey
United Kingdom
Austria
Denm
arkEsto
nia
ItalyNeth
erlan
ds
Portugal
SloveniaSpain
Belgium
Chile
Germany
Iceland
Japan
United StatesCanada
Mexico
GOVERNMENT AT A GLANCE 2015 © OECD 2015 93

4. INSTITUTIONS
Roles of the centres of government
Each country’s centre of government (CoG) is a product ofdiverse historical, cultural and political forces and hasdeveloped incrementally over time. Despite this heteroge-neity, strong similarities emerge with respect to the func-tions that the centre of government performs. CoGs havebeen traditionally responsible for serving the head of gov-ernment and cabinet; however they are increasinglyexpected to combine their traditional role with a moreactive role in other functions such as policy development,co-ordination, implementation and monitoring mecha-nisms, which require a higher level of integration and co-ordination with other government departments andagencies.
The financial and fiscal crises have put the spotlight on theability of governments to take decisive action and mobilisekey partners in support of those actions. Across the OECDcountries, a variety of constitutional models shape howdecisions are taken. In presidential systems, a combinationof bilateral meetings with key ministers or with groups ofadvisors tends to be more common, with full meetings ofcabinet occurring less frequently. For the majority of OECDcountries, regular cabinet meetings remain the principalchannel for policy discussion. In spite of the differences,the role of the CoG is to control the quality of evidence, ver-ify the objectivity and inclusiveness of options presented,and ensure that procedures are respected. Effective prepa-ration of these policy meetings includes a range of taskssuch as careful review of supporting materials andpre-meeting dispute resolution. Based on the available datafrom the OECD survey, on average, almost 60% of the CoGswere responsible for co-ordinating discussions of agendaitems with ministerial committees prior to cabinet meet-ings, while around 40% of the surveyed CoGs were alsoresponsible for the production of briefings or other tasks.On the other hand, CoGs in Spain, Norway and Hungary arenot responsible for the co-ordination of discussions prior tocabinet meetings.
According to the OECD survey carried out in 2013, CoGsprovide an additional range of services. Among all thefunctions undertaken by CoGs, the following four are themost relevant across OECD countries. Firstly, 89% of theCoGs analysed in OECD countries are the main playersresponsible for the preparation of cabinet meetings. Sec-ondly, 68% of the CoGs are responsible for policy co-ordina-tion across government units. Thirdly, the preparation ofthe government programme was one of the main prioritiesfor 57% of the OECD countries analysed. Finally, a largenumber (54%) of CoGs mentioned their responsibility formonitoring the implementation of government policies.
OECD countries vary considerably in the number of func-tions for which the CoG is responsible. On the one hand,centres of government in countries such as Italy andNew Zealand are exclusively responsible for 10 out of the15 functions analysed. On the other hand, CoG inthe United States and the Slovak Republic mainly shareresponsibilities with other government ministries and agen-cies (more than 10 out of 15 of the functions are shared).
Further reading
OECD (2015), “Centre Stage: Driving Better Policies from theCentre of Government”, GOV/PGC/MPM(2014)3, OECD,Paris, http://www2.oecd.org/oecdinfo/info.aspx?app=OLISco-teEN&Ref=GOV/PGC/MPm(2014)3.
Figure notes
Data for Czech Republic, Greece, Ireland, Luxembourg, Mexico and Polandare not available. Only OECD countries are included in the figure.
4.4: Data for Sweden are not available.
Information on data for Israel: http://dx.doi.org/10.1787/888932315602.
Methodology and definitions
Data were collected through the 2013 OECD Survey onthe Organisation and Functions of the Centre of Gov-ernment (33 countries, of which 28 OECD countriesand 5 non-members, and the European Commission,responded). Respondents were senior officials whoprovide direct support and advice to heads of govern-ment and the council of ministers, or cabinet and pro-vided information for the period 2008-12.
Centre of government (CoG) refers to the administra-tive structure that serves the Executive (president orprime minister, and the cabinet collectively). The cen-tre of government has a great variety of names acrosscountries, such as General Secretariat, Cabinet Office,Chancellery, Office/Ministry of the Presidency, Coun-cil of Ministers Office, etc. In many countries the CoGis made up of more than one unit, fulfilling differentfunctions. A unit that is shared by virtually all CoGs isthe unit that serves specifically the head of the gov-ernment, but not the CoG collectively. This too has avariety of names, such as the Cabinet of the PrimeMinister or the Private Office.
GOVERNMENT AT A GLANCE 2015 © OECD 201594

4. INSTITUTIONS
Roles of the centres of government
4.4. Responsibilities of centres of government for co-ordination discussions of agenda items prior to cabinet meetings
Source: 2013 OECD Survey on the Organisation and Functions of the Centre of Government.1 2 http://dx.doi.org/10.1787/888933248698
Share of responding countries, %
0
10
20
30
40
50
60
Yes No Yes No Yes No
Briefings Ministerial committees Other No responsibilities
4.5. Key roles of the CoGs classified according to their level of responsibilities
Prep
arin
gCa
bine
tm
eetin
gs
Com
mun
icat
ing
gove
rnm
entm
essa
ges
HRst
rate
gyfo
rthe
publ
icad
min
istra
tion
Publ
icad
min
istra
tion
refo
rm
Stra
tegi
cpl
anni
ng
Risk
man
agem
ent/
stra
tegi
cfo
resi
ght
Prep
arin
gth
eGo
vern
men
tPr
ogra
mm
e
Polic
yan
alys
is
Polic
yco
-ord
inat
ion
Regu
lato
ryqu
ality
and
cohe
renc
e
Mon
itorin
gpo
licy
impl
emen
tatio
n
Rela
tions
with
sub-
natio
nal
gove
rnm
ent
Rela
tions
with
the
Legi
slat
ure
Inte
rnat
iona
lDe
velo
pmen
tand
aid
Supr
anat
iona
lco
-ord
inat
ion/
polic
y
Australia ● ❍ ❑ ❍ ● ❍ ❍ ❍ ❍ ❍ ❍ ● ❍ ❍ ❍
Austria ● ● ❍ ❍ ❍ ❑ ❑ ❍ ● ❍ ❍ ● ❍ ❑ ❍
Belgium ● ● ❑ ❑ ● ● ● ● ● ❑ ● ● ❍ ❑ ❍
Canada ● ❍ ❍ ❍ ● ● ● ❍ ● ❑ ● ❍ ● ❑ ❑
Chile ● ❍ ❍ ● ● ● ● ❍ ● ❍ ● ❍ ● ❑ ❍
Denmark ● ❍ ❑ ❍ ● ❍ ● ❍ ● ❍ ❍ ❍ ❍ ❑ ●
Estonia ● ● ❑ ❍ ❍ ❍ ● ❍ ● ❍ ● ❑ ● ❑ ❍
Finland ● ● ❑ ❍ ● ❍ ❍ ❍ ● ❍ ● ❑ ❍ ❑ ❍
France ● ● ❍ ● ● ● ● ❍ ● ❍ ● ❍ ● ❑ ❍
Germany ● ❍ ❑ ❑ ● ❑ ● ❍ ● ❑ ❍ ❍ ❍ ❑ ❍
Hungary ❑ ❍ ❑ ❑ ❍ ❍ ● ❍ ❍ ❑ ● ❑ ❍ ❑ ❍
Iceland ● ❍ ❑ ❍ ❍ ❍ ● ❍ ● ● ● ❑ ● ❑ ❑
Israel ● ❍ ❍ ❍ ● ❍ ● ❍ ● ● ❑ ❑ ● ❑ ❑
Italy ● ● ● ● ❍ ❍ ● ❍ ● ● ● ● ● ❍ ❍
Japan ● ❍ ❍ ❍ ❍ ❍ ❍ ❑ ❍ ❍ ❑ ❑ ❍ ❑ ❑
Korea ❍ ❍ ❑ ● ❍ ❍ ❍ ● ● ● ● ❍ ❍ ❍ ❍
Netherlands ● ❍ ❑ ❑ ❍ ❑ ❍ ❑ ● ❑ ❍ ❑ ❍ ❑ ❍
New Zealand ● ❍ ● ● ● ● ● ❍ ● ● ● ❑ ● ❑ ❑
Norway ● ❍ ❑ ❑ ❍ ❍ ❍ ● ● ❑ ❑ ❑ ● ❑ ❑
Portugal ● ● ❑ ❑ ● ❑ ● ● ● ❍ ● ● ● ❍ ❍
Slovak Republic ● ● ❍ ❍ ❍ ❍ ❍ ❍ ❍ ❍ ● ❍ ● ❍ ❍
Slovenia ● ● ❑ ❑ ❍ ❍ ❍ ❍ ❍ ● ● ❑ ● ❑ ❑
Spain ❑ ❍ ❑ ❑ ❍ ● ● ❍ ❍ ❑ ❍ ❍ ❍ ❑ ❍
Sweden ● ❍ ❑ ❑ ● ● ● ❍ ❍ ❍ ❍ ❍ ❍ ❑ ❍
Switzerland ● ❍ ❑ ❍ ● ❑ ● ❑ ❍ ❍ ● ❍ ❍ ❑ ❑
Turkey ● ● ❍ ❍ ❑ ❑ ❑ ❑ ❍ ● ❍ ❑ ● ❑ ❑
United Kingdom ● ❍ ● ● ❍ ❍ ❍ ❍ ● ❍ ❍ ❍ ● ❑ ❍
United States ● ❍ ❍ ❍ ● ❍ ❍ ❍ ● ❍ ❍ ❍ ❍ ❍ ❍
OECD Total● 25 10 3 6 14 7 16 4 19 7 15 5 14 0 1❍ 1 18 9 13 13 15 10 20 9 14 10 12 14 6 18❑ 2 0 16 9 1 6 2 4 0 7 3 11 0 22 9
● Responsibility of the CoG.❍ Shared responsibility between the CoG and another body.❑ Responsibility of another part of government.Source: 2013 OECD Survey on the Organisation and Functions of the Centre of Government.
1 2 http://dx.doi.org/10.1787/888933248705
GOVERNMENT AT A GLANCE 2015 © OECD 2015 95

4. INSTITUTIONS
Degree of influence of the centres of government
Centres of government (CoGs) are currently taking a moreactive role to align multi-department workplans to govern-ment actions. This more active role for the centre of gov-ernment across the policy cycle suggests the need for newco-ordination and monitoring tools. Rather than organisingpolicy discussions, the CoG has to be able to set agendasand work with other government institutions, includingwith respect to human and financial resources. However,this horizontal co-ordination process managed by the CoGcould be even broader in terms of scope and participation.While policy co-ordination within the administration is akey focus for the CoG, the evolution of modern governmentmeans that the CoG is becoming more involved with actorsoutside the executive branch. Effective working at theinternational level is an increasingly important aspect ofgood governance at the domestic level and comes increas-ingly into the sphere of the CoG.
The degree of influence of CoGs over line ministries is het-erogeneous across OECD countries. The OECD survey onthe Organisation and Functions of the CoG conductedin 2013 reports that only 29.6% of the OECD countries showa high degree of influence over ministries to promote co-ordination, namely, Canada, Denmark, France, Japan,New Zealand, the Slovak Republic, Spain and Turkey. How-ever, the survey indicates that most CoG officials considerthat they exert a moderate degree of influence (59.3%). Thisis partly a result of the general institutional problem ofco-ordination in any large organisation. And in cases whereinfluence is low, such as in Austria and Portugal, it is clearlylinked to political traditions that give significant autonomyto ministers and their departments.
Additionally, in order to understand how the CoG can bestfulfil its key tasks it is important to analyse the figure of thehead of the CoG. Indeed, its role is demanding and complexsince the head of the CoG must be close to and trusted bythe head of government and his political staff, while alsoclose to and trusted by senior civil servants and, more gen-erally, respected by the civil service. Electoral changes gen-erally bring new directions, priorities and perspectives thatcan require an organisational response at the CoG.
Across OECD countries there is a clear split with respect tohow the position of head of the CoG is filled. Based on theOECD survey, in 53.57% of the countries surveyed, the headof the CoG was a political appointee and was replacedwhen the government changed (except insofar as thepost-holder was allowed to complete a fixed-term appoint-
ment before being replaced, as in Austria, for example). Inthe remaining countries (46.43%), the head of the centre ofgovernment was a civil servant, normally holding the mostsenior civil servant rank.
Further reading
OECD (2015), “Centre Stage: Driving Better Policies from theCentre of Government”, GOV/PGC/MPM(2014)3, OECD,Paris, http://www2.oecd.org/oecdinfo/info.aspx?app=OLISco-teEN&Ref=GOV/PGC/MPm(2014)3.
Figure notes
Data for Czech Republic, Greece, Ireland, Luxembourg, Mexico and Polandare not available. Only data from OECD countries were included inthe figures.
4.6: Data for Sweden are not available.
Information on data for Israel: http://dx.doi.org/10.1787/888932315602.
Methodology and definitions
Data were collected through the 2013 OECD Survey onthe Organisation and Functions of the Centre of Gov-ernment (33 countries, of which 28 OECD countriesand 5 non-members, and the European Commission,responded). Respondents were senior officials whoprovide direct support and advice to heads of govern-ment and the council of ministers, or cabinet and pro-vided information for the period 2008-12.
Centre of government (CoG) refers to the administra-tive structure that serves the Executive (president orprime minister, and the cabinet collectively). The cen-tre of government has a great variety of names acrosscountries, such as General Secretariat, Cabinet Office,Chancellery, Office/Ministry of the Presidency, Coun-cil of Ministers Office, etc. In many countries the CoGis made up of more than one unit, fulfilling differentfunctions. A unit that is shared by virtually all CoGs isthe unit that serves specifically the head of the gov-ernment, but not the CoG collectively. This too has avariety of names, such as the Cabinet of the PrimeMinister or the Private Office.
GOVERNMENT AT A GLANCE 2015 © OECD 201596

4. INSTITUTIONS
Degree of influence of the centres of government
4.6. Level of influence of CoG over line ministries to encourage them to co-ordinate with each other, 2013
Source: 2013 OECD Survey on the Organisation and Functions of the Centre of Government.1 2 http://dx.doi.org/10.1787/888933248713
High 29.6%
Moderate 59.3%
Low 11.1%
Cana
da
Denm
ark
Fran
ceJa
pan
New Zealand
Slovak Republic
Spain
Turkey
AustraliaBelgium
ChileEstonia
Germany
HungaryIc
elan
d
Isra
elItaly
Korea
NetherlandsNorway
Slovenia
Switzerland
United Kingdom
United States
Austria
Finland
Portugal
4.7. Status of the head of the centre of government, 2013
Source: 2013 OECD Survey on the Organisation and Functions of the Centre of Government.1 2 http://dx.doi.org/10.1787/888933248726
0
5
10
15
20
25
30
35
40
45
Highest civilservice rank
Minister orequivalent
Other Highest civilservice rank
Minister orequivalent
Other
Civil servant Political appointee
Share of responding countries, %
GOVERNMENT AT A GLANCE 2015 © OECD 2015 97


GOVERNMENT AT A GLANCE 2015 © OEC
5. BUDGETING PRACTICESAND PROCEDURES
Special feature: The fiscal sustainability challengeof health systems
Performance-related budgeting and supreme audit institutions
Cost benefit analysis of investment projects
D 2015 99

5. BUDGETING PRACTICES AND PROCEDURES
Special feature: The fiscal sustainability challenge of health systems
Health is the second largest government spending area;moreover according to recent research (OECD, 2010), in thefirst decade of the 21st century the growth of health spend-ing has consistently outpaced economic growth in mostOECD countries. Most governments in OECD countries arecurrently faced with consolidation pressures and the needto create room for additional spending without jeopardiz-ing the sustainability of their fiscal position or the stabilityof the economy (fiscal space). In this context, many coun-tries face the challenging task of financing more healthexpenditure while trying to meet their fiscal objectives.
There are two main reasons why health expenditures areparticularly complex. First, access to health is perceived bycitizens as a very high priority, and government policies inthis area are highly scrutinised. Second, many stakeholdersintervene between the beneficiary of health care (the citi-zen/patient) and public resources that finance it. Theseinclude purchasers (such as ministries of health, socialsecurity institutions, social insurance funds or sub-nationalgovernments), a wide range of providers of services (clini-cians, operating within hospitals and other health facili-ties), and providers of medicines, tests and equipment(pharmaceutical companies and laboratories).
The budgetary arrangements for health expenditures varygreatly across OECD countries, mainly depending on thehistorical legacy of how these systems were created andtheir degree of decentralisation. In countries that followedthe national health system as in the United Kingdom, healthis one regular area in the budget. In countries that devel-oped their public health system on the German socialinsurance model, health is mainly financed through socialcontributions, managed by an independent institution andnot part of the central government budget. In most (18 outof 26) OECD countries surveyed, health expenditure ispartly included in the central government budget, however,it often represents a very small share of total health expen-diture. For example, the amount reported in the budget isless than 5% of total public expenditure on health in coun-tries such as Germany, Austria or France.
Most OECD countries have in place some kind of budgetceiling over several years for government expenditure onhealth. However, over-spending in health remains com-mon; Iceland and Mexico consistently over-spent for atleast six out of the seven-year period between 2006and 2011. Consequently, a number of OECD member coun-tries have designed “early warning mechanisms” to takeearly corrective measures. However, timely information is apre-requisite for such a mechanism to work. In 7 out of the20 countries with available information, health expendi-tures are reported with an average delay of three to sixmonths. Furthermore, it takes up to 12 and 24 months toreport certain health expenditures in Switzerland andthe Netherlands respectively. For the latter this could be
due to the country’s mandatory health insurance system,whereby the government subsidises individuals’ purchaseof coverage from private providers.
The sustainability of health systems poses several chal-lenges ahead. Support for government spending on healthin the future will be shaped by views on redistribution asmuch as economic conditions affecting revenues. Indeed,publicly financed health systems, entail a high degree ofredistribution, not only from the healthy to the sick, butalso from the wealthier to the less affluent.
Further reading
OECD (2015), Fiscal Sustainability of Health Systems, BridgingHealth and Finance Perspectives, OECD Publishing, Paris,www.oecd.org/gov/budgeting/sbonetworkonhealthexpendi-tures.htm.
OECD (2010), Value for Money in Health Spending, OECD HealthPolicy Studies, OECD, Paris, http//dx.doi.org/10.1787/9789264088818-en.
Figure notes
5.1: In Austria, France, Germany, Sweden and Switzerland there is somehealth expenditure in the central government, but it represents avery small share of total health expenditure, which is mainlyfinanced by sub national governments or social security institutions.The Czech Republic, Estonia, France, Japan, Norway, Poland andthe Slovak Republic have a separate health/social security budget,which requires a legislative approval.
Methodology and Definitions
Most data presented comes from an OECD Survey ofBudget Officials on Budgeting Practices for Health,carried out between July and December 2013. The sur-vey was answered by 27 countries (including one nonOECD country, South Africa). The results were dis-cussed at a workshop held in January 2014 and at theOECD Senior Budget Officials-Health Officials JointNetwork on Fiscal Sustainability of Health Systems inApril 2014.
Over (under)-spending means that actual expenditurehigher (lower) than budgeted expenditure. Open-endedentitlement is a government programme guarantee-ing access to some benefit by members of a specificgroup, based on established rights or by legislation.Open-ended entitlements are demand driven expen-diture, and require the legislature to modify a law inorder to change the level of spending.
GOVERNMENT AT A GLANCE 2015 © OECD 2015100
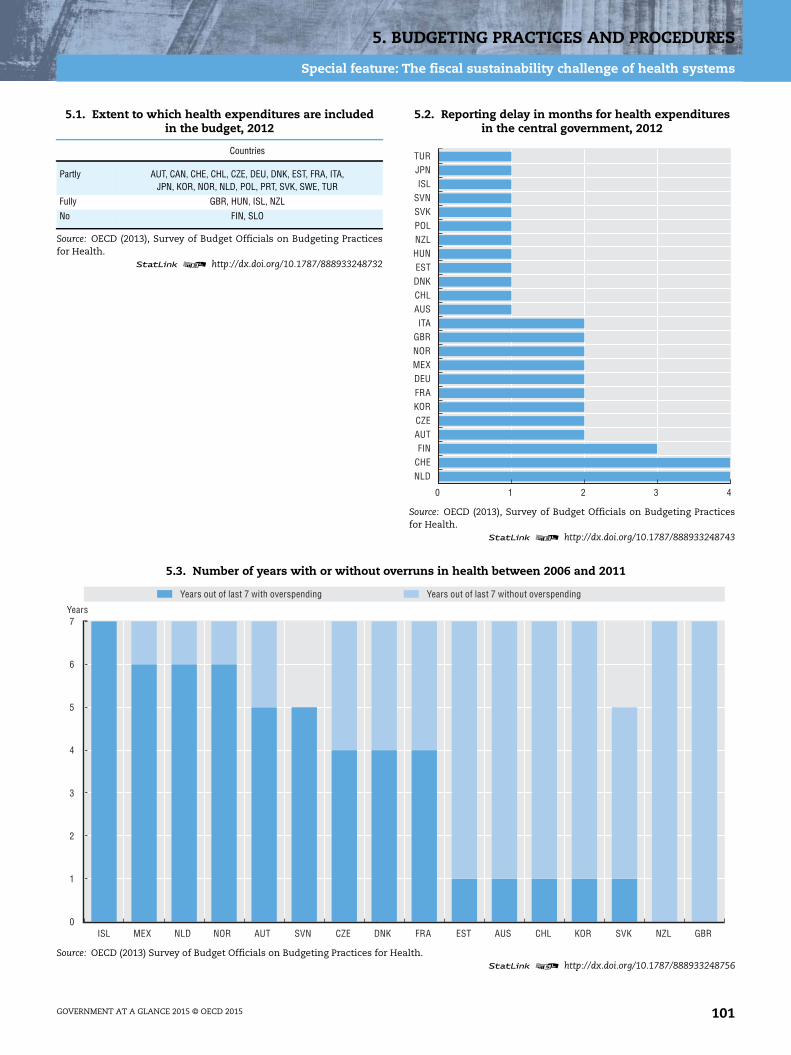
5. BUDGETING PRACTICES AND PROCEDURES
Special feature: The fiscal sustainability challenge of health systems
5.1. Extent to which health expenditures are includedin the budget, 2012
Countries
Partly AUT, CAN, CHE, CHL, CZE, DEU, DNK, EST, FRA, ITA,JPN, KOR, NOR, NLD, POL, PRT, SVK, SWE, TUR
Fully GBR, HUN, ISL, NZL
No FIN, SLO
Source: OECD (2013), Survey of Budget Officials on Budgeting Practicesfor Health.
1 2 http://dx.doi.org/10.1787/888933248732
5.2. Reporting delay in months for health expendituresin the central government, 2012
Source: OECD (2013), Survey of Budget Officials on Budgeting Practicesfor Health.
1 2 http://dx.doi.org/10.1787/888933248743
NLDCHEFIN
AUTCZEKORFRADEUMEXNORGBRITA
AUSCHLDNKEST
HUNNZLPOLSVKSVNISL
JPNTUR
0 1 2 3 4
5.3. Number of years with or without overruns in health between 2006 and 2011
Source: OECD (2013) Survey of Budget Officials on Budgeting Practices for Health.1 2 http://dx.doi.org/10.1787/888933248756
0
1
2
3
4
5
6
7
ISL MEX NLD NOR AUT SVN CZE DNK FRA EST AUS CHL KOR SVK NZL GBR
Years out of last 7 with overspending Years out of last 7 without overspending
Years
GOVERNMENT AT A GLANCE 2015 © OECD 2015 101

5. BUDGETING PRACTICES AND PROCEDURES
Performance-related budgeting and supreme audit institutions
Against the background of an increasingly complex gover-nance environment, limited fiscal space, and growingdemands for transparency and accountability, governmentsare continually challenged to demonstrate better perfor-mance and management of available resources. Supremeaudit institutions (SAIs) have also moved from a more tradi-tional focus on financial audits to looking at aspects of per-formance or value for money. Indeed the InternationalOrganization of Supreme Audit Institutions (INTOSAI) positsthat “performance auditing greatly enriches public account-ability and enables the SAI to make practical contributionsto improving the efficiency and effectiveness of the publicadministration” (INTOSAI, 2010). As such, SAIs have thepotential to contribute to better design and use of perfor-mance-related budgeting and management systems and toenhance public accountability in OECD countries.
Strengthening links between performance-related budget-ing and performance audit, and the shift towards more per-formance auditing also implies, in most cases, a need forSAIs to move away from their traditional focus on compli-ance and to develop new skill sets and capacities, as well asstrategies to communicate their work in this area to thelegislature and wider public.
Along the continuum of practices currently in place, themost common is for SAIs to conduct performance orvalue-for-money audits of their own design. But there iswide variation among countries in terms of the frequency ofperformance or value-for-money audits undertaken andpublished annually. Among the 26 OECD countries thatresponded to the OECD survey on SAIs and perfor-mance-related budgeting, slightly more than half repliedthat they undertake performance or value-for-money audits“always” (Australia, Austria, Japan, Mexico, Norway andthe United Kingdom) or “often” (Estonia, Finland, France,Hungary, Korea, New Zealand, Slovenia, Sweden andthe Netherlands). Three countries (Chile, Czech Republicand Spain) reported that they “never” carry out performanceaudits.
In those countries where the budget-related documentationincludes specific, clear and measurable performance objec-tives and targets, SAIs might be expected to use these objec-tives and targets in their performance audit exercises but ofthe 26 respondents, only five (Finland, Korea, Mexico, Norwayand the United Kingdom) reported that this happens as amatter of course (“always”) and similarly five (Austria,Estonia, Japan New Zealand and Turkey) indicated that thishappens “often”.
Just over half of the respondents also reported that the SAIsalways or often assess or critique the quality of the perfor-mance information used in the budget, or audit theachievement of performance objectives or targets in thebudget. Ideally this should allow for useful feedback to lineministries and the centre as they develop and refine perfor-mance information and seek to evaluate what they haveachieved. However, given that performance objectives ortargets are also used for internal management and learn-
ing, and may evolve or be refined based on that learning,audits that are overly focused on compliance only maymiss the mark. Finally, respondents indicated that it wasmuch less common for the SAI to assess the quality of theprogramme model being used, or to provide an overallassessment of the effectiveness of the performance-budgeting related system as a whole.
Further reading
INTOSAI (2010), “ISSAI 3100 – Performance Auditing Guide-lines: Key Principles”, approved at XXth Congress ofINTOSAI, Johannesburg.
OECD (2014), “Background Note: Mini-Survey on SupremeAudit Institutions and Performance-Related Budgeting”,prepared for the 10th Annual Meeting of the OECDSenior Budget Officials Performance and Results Net-work, OECD, Paris.
Figure notes
5.1: The US GAO has a long track record in performance audit and it car-ries out significant examinations of performance-related informa-tion, wich may not be included in the budget.
Methodology and definitions
The data for Table 5.4 were collected as part of a 2014survey of members of the OECD Senior Budget Offi-cials Performance and Results Network. Respondentswere predominantly senior officials in ministries offinance. Officials were able to consult with theirnational SAI when preparing the survey and severalreported doing so. Data does not cover information onthe quality of performance audits or the length oftime an SAI has been concluding such audits.Twenty-five OECD countries responded to survey. Thedata displayed here is based on questions around therole of SAIs in the performance-related budgetingsystem. The response scale had five categories:always, often, sometimes, seldom and never/notapplicable.
“Performance-related budgeting” seeks to establishclear links between financial allocations and non-finan-cial or “performance” information – e.g. outputs, results,outcomes and impacts – with the goal of improvingtransparency, accountability and quality in the alloca-tion and use of public resources and promoting betteroutcomes for citizens and for society.
According to the INTOSAI Performance Auditing Com-mittee, performance auditing provides independentand objective examination of economy, efficiency, andeffectiveness of government undertakings, servicesand activities.
GOVERNMENT AT A GLANCE 2015 © OECD 2015102

5. BUDGETING PRACTICES AND PROCEDURES
Performance-related budgeting and supreme audit institutions
5.4. Role of the SAI in the performance budgeting system
Audit financialinformation of public
bodies
Conduct “performanceaudits” or “VFM audits”
Audit the achievementof performance objectives
Assess the qualityof performance
information
Assess the qualityof the “programme logic
models” being used
Assess the performancebudgeting system
and may recommendreforms
Australia ● ● ◗ ◗
Austria ● ● ✦ ✦ ✦ ✦
Belgium ✦ ✦ ■
Czech Republic ✦ ■ ■ ■ ■ ■
Chile ● ■ ■ ■ ■ ■
Estonia ✦ ✦ ✦ ● ●
Finland ● ✦ ● ✦ ✦ ✦
France ● ✦ ■ ●
Hungary ● ✦ ■ ✦ ■
Iceland ✦ ■ ■ ■ ■
Ireland ● ■ ■ ■ ■
Italy ● ◗ ◗ ■ ■ ■
Japan ● ● ✦ ✦
Korea ● ✦ ● ● ● ✦
Mexico ● ● ● ● ● ✦
New Zealand ● ✦ ✦ ✦ ■ ◗
Norway ● ● ● ✦
Poland ● ◗
Slovenia ● ✦ ◗
Spain ● ■ ■ ■ ■ ■
Sweden ● ✦ ✦ ✦ ◗
Switzerland ✦ ◗ ■ ◗ ■
The Netherlands ● ✦ ✦ ✦
Turkey ● ✦ ✦ ■
United States ✦ ◗ ◗ ◗ ◗
United Kingdom ● ● ● ● ●
OECD Total
● Always 20 6 5 3 4 2
✦ Often 4 9 5 11 4 4
Sometimes 2 7 5 3 6 8
◗ Seldom 0 1 4 2 3 4
■ Never 0 3 7 7 9 8
Source: OECD (2014), Mini-Survey on Supreme Audit Institutions and Performance-related Budgeting.1 2 http://dx.doi.org/10.1787/888933248766
GOVERNMENT AT A GLANCE 2015 © OECD 2015 103

5. BUDGETING PRACTICES AND PROCEDURES
Cost benefit analysis of investment projects
Governments are faced with budget constraints and there-fore should invest in those projects that represent thegreatest benefits compared to costs. In addition, the pres-ence of market failures, which are situations in which mar-kets left on their own would produce inefficient results(e.g. monopolies), are commonly addressed by governmentintervention. Regardless of whether a project is carried outby traditional public provision, public-private partnerships,or others, its economic appraisal remains the responsibilityof government. Cost benefit analysis (CBA) is a methodol-ogy with a long intellectual and practical history for esti-mating the ex ante desirability of a project. It is designed todemonstrate whether or not the long-term social benefitsof a project are greater than its costs. In practice, it esti-mates the opportunity cost or benefit of goods and servicesand uses these accounting prices (or shadow prices) as amore appropriate signal than observed market prices,which may be distorted by a variety of reasons. Perfor-mance indicators are then computed; typically, a positivenet present value of benefits over costs is required in orderto conclude that ex ante a project is socially desirable.
According to the 2014 OECD survey on CBA, it was found thatthere is generally no nationwide legal requirement for CBA(55% of surveyed countries). However, legislation does existat the state/local levels (40% of countries) or it is recom-mended and promoted by central governments (15% ofcountries) . In some cases, such as Canada, theUnited Kingdom, Chile and Denmark, it is firmly prescribedas a tool for project selection and decision typically at thepre-feasibility stage or at an early stage of the decision mak-ing process in any case. Additionally 10 out of 20 countriesincluding Germany, the Netherlands, Mexico, Norway andFrance have reported CBA to be increasing in role and impor-tance. For instance, the government of the Netherlands hasrecently issued new guidelines with regard to the use ofCBAs covering all types of projects and policy areas.
When asked about the general objective of CBA accordingto legislation, regulation or official documents, the col-lected answers point to the key objective of providing a jus-tification for project selection/decision in the feasibilityphase (16 out of 19 countries). To a lesser extent, it is con-sidered a tool for transparency (11 out of 19 countries), atool for prioritising investment at the central level (10 out of19 countries), and as a technical assessment tool support-ing project design in the feasibility stage (10 out of 19 sur-veyed countries). According to the latest availableinformation, CBA is used for project monitoring in slightlymore than two-fifths of the surveyed countries, whilethe United Kingdom, Ireland and Estonia also use it as aninstrument for policy learning.
CBA is a feature of the decision-making process on publicinvestment at the central level in over two-thirds of sur-veyed member countries, albeit not in an exclusive way,
rather as a complement to other types of assessment. CBAwas indicated to be the key decision-making tool in allocat-ing funding to procuring authorities for particular projectsin the U.K., Canada, Ireland, Australia, Mexico and Chile.For the other surveyed countries, where the system is moredelegated to line procuring authorities and departments,CBA is considered an instrument among several deci-sion-making tools and the implementation of a CBA is del-egated to specific departments with regards to the sectorsin which they focus on.
Finally, CBA is more commonly used in large infrastructureprojects such as roads, railroads, airports and ports andless frequently in projects related to culture and leisure andscientific research. Germany, Ireland and Turkey are theonly countries performing CBA for all type of projects.
Further reading
Florio, M., S. Gastaldo and I. Loudiyi (forthcoming), OECDJournal on Budgeting, OECD, Paris.
Figure notes
5.5: In the UK CBA is not prescribed under a specific law but in the GreenBook, which is required guidance for all projects receiving centralgovernment funding; it is therefore a requirement even if it’s not alaw. In the Netherlands CBAs are required by law for long term proj-ects in infrastructure, transport and spatial planning.
Methodology and definitions
In 2014, the OECD conducted a Survey on Cost BenefitAnalysis following the framework on public invest-ment management by Rajaram et al. (2010). The sur-vey was answered by 20 OECD countries. It covers thescopes and objectives of CBA, roles and responsibili-ties under it, its content and methodology, as well asrelated public accountability and learning. It wasextended to all OECD member countries to collect evi-dence on how countries implement CBA, and whichare the relevant characteristics and methodologiesapplied. The survey was submitted to country repre-sentatives in ministries of finance or equivalentdepartments with central budgetary and/or publicinvestment roles (liaising with line departments andother key governmental stakeholders when relevant).In some cases, written questions were complementedby phone interviews to deepen some of the most sig-nificant aspects. Policy documents, guidelines andregulatory reference documents complemented theinformation base and were analysed when available.
GOVERNMENT AT A GLANCE 2015 © OECD 2015104

5. BUDGETING PRACTICES AND PROCEDURES
Cost benefit analysis of investment projects
$$$A SUPPRIMER$$$
5.5. The general objective of CBA in your country according to legislation, regulation or official documents
Legalfoundation
of CBA
General Objective of CBA Main Role of CBA
Tool forprioritisinginvestment
Justify projectselection/
decision andfinancing
Accountability/transparency
tool
An assessmentsupporting
project design
Tool forproject
monitoring
Tool for policylearning
Decision toolin allocatingfunding toagencies
Differsdependingon actors
One amongother decisionmaking tools
Does not playa decisivein decision
making
Is increasingin role andimportance
Australia ● ✓ ✓
Austria ✦ ✓ ✓ ✓
Canada ● ✓ ✓ ✓ ✓ ✓ ✓
Chile ● ✓ ✓
Czech Republic ■ ✓ ✓ ✓ ✓ ✓
Denmark ✧ ✓ ✓ ✓
Estonia ✧ ✓ ✓ ✓ ✓ ✓ ✓
France ● ✓ ✓ ✓ ✓ ✓
Germany ● ✓ ✓ ✓ ✓ ✓
Ireland ✧ ✓ ✓ ✓ ✓ ✓ ✓ ✓ ✓ ✓ ✓
Italy ● ✓ ✓ ✓ ✓
Mexico ● ✓ ✓ ✓ ✓ ✓ ✓
Netherlands ✦ ✓ ✓ ✓ ✓
New Zealand ✧ ✓ ✓
Norway ✧ ✓ ✓ ✓ ✓ ✓ ✓
Slovena ✧ ✓ ✓ ✓ ✓ ✓ ✓ ✓
Sweden ✧ ✓ ✓ ✓ ✓ ✓ ✓ ✓
Switzerland ✧ ✓ ✓ ✓ ✓ ✓
Turkey ● ✓ ✓ ✓ ✓ ✓ ✓ ✓
United Kingdom ✦ ✓ ✓ ✓ ✓ ✓ ✓ ✓ ✓
OECD Total 10 16 11 10 8 3 6 13 14 2 10
● Yes, CBA is mandatory nationwide by legislation for all capital investment projects above a certain financial threshold.■ Yes, there is a legal requirement nationwide for CBA, but only for specific category of projects.❒ Yes, there are different legal frameworks depending on procuring /regulatory agencies at national levels.✧ There is no nationwide legislation, but there is a legislation requiring CBA at state/regional/local government level.❍ No.✦ There is no legal requirement, but CBA is recommended by government and used anyway.X Not applicable.Source: OECD (2014), Survey on Cost Benefit Analysis.
1 2 http://dx.doi.org/10.1787/888933248774
5.6. Sectors in which CBA is usually performed (2014)
Sectors Countries
Road AUS, AUT, CAN, CHE, CHL, CZE, DEU, DNK, EST, FRA, GBR, IRL, ITA, MEX, NLD, NOR, SWE, TUR
Rail AUS, AUT, CAN, CHE, CHL, CZE, DEU, EST, FRA, GBR, IRL, ITA, MEX, NLD, NOR, SWE, TUR
Airports, ports and waterways AUS, AUT, CAN, CHE, CHL, CZE, DEU, DNK, GBR, IRL, ITA, MEX, NLD, NZL, NOR, SLO, SWE, TUR
Urban transport AUS, CAN, CHE, CHL, CZE, DEU, FRA, GBR, IRL, ITA, MEX, NLD, NOR, SLO, TUR
Water supply and wastewater AUS, CAN, CHE, CZE, DEU, EST, GBR, IRL, ITA, MEX, NLD, SLO, TUR
Solid waste management CAN, CHE, CZE, DEU, EST, GBR, IRL, ITA, SLO, SWE, TUR
Other environmental projects CAN, CHE, CZE, DNK, GBR, IRL, ITA, NLD, NOR, SWE, TUR
Energy AUS, CAN, CZE, DEU, GBR, IRL, ITA, MEX, NOR, SLO, TUR
Education AUS, CAN, CZE, DEU, FRA, GBR, IRL, ITA, MEX, NOR, SWE, TUR
Health AUS, CAN, CHE, DEU, FRA, GBR, IRL, ITA, NOR, SLO, TUR
ICT CAN, CHE, CHL, CZE, DEU, EST, GBR, IRL, NOR, NZL, SLO, TUR
Culture and leisure CAN, DEU, FRA, GBR, IRL, NOR, TUR,
Scientific research CAN, CHE, CZE, DEU, EST, FRA, GBR, IRL, NLD, NOR, SWE, SLO, TUR,
Technological development and innovation CZE, DEU, EST, IRL, NOR, TUR
Other AUT, CHE, GBR, FRA, NLD, NOR
Source: OECD (2014), Survey on Cost Benefit Analysis.1 2 http://dx.doi.org/10.1787/888933248785
GOVERNMENT AT A GLANCE 2015 © OECD 2015 105


GOVERNMENT AT A GLANCE 2015 © OEC
6. HUMAN RESOURCE MANAGEMENT
Special feature: Compensation reforms since 2008
Special feature: Employment reforms in central governmentsince 2008
D 2015 107

6. HUMAN RESOURCE MANAGEMENT
Special feature: Compensation reforms since 2008
Compensation reforms are used to alter the size and struc-ture of pay and benefits packages for the public sector work-force and have a direct impact on the overall cost ofgovernment. The 2008 financial crisis presented a dual chal-lenge for most OECD governments: how to restore financialsustainability while also maintaining high quality servicedelivery in times of rising demand. Given that employeecompensation accounts for 45.6% of OECD countries’ pro-duction costs, compensations reforms have been acommon response to these challenges. Significant reformsto employees’ compensation packages can be difficult toundertake, as they often involve union negotiations andother legal and political complexities. Additionally, whencompensation reductions are implemented, they can havenegative repercussions on worker motivation, which canundermine productivity and efficiency.
Between 2008 and 2013, almost all OECD countries intro-duced compensation reforms in their central governments.Altogether 15 OECD countries have frozen remuneration(sometimes for certain categories of staff), and seven coun-tries cut remuneration levels for all categories of staff.
Portugal implemented wage cuts, suspended performancebonuses and decreased overtime pay. Spain has imple-mented a salary cut and in 2012 the extra December pay-ment was not paid, although 25% of this payment was laterrefunded. In Poland, since 2009, pay in the civil service hasbeen frozen, the pay scale has been changed and a specialbonus was eliminated. Hungary eliminated the 13th monthsalary. Estonia abolished career-based salary components,such as additional remuneration for tenure, foreign lan-guages and academic degrees. In Belgium the reformsslowed down the career advancement of employees. InGermany, seniority is no longer taken into account for mid-dle and top management in setting their pay. InCzech Republic the average salaries for top-level managersincreased while the overall budget for remuneration wasdecreased by 10%, resulting in a decrease of salaries formany regular staff and an increase in salaries for somemanagers. Italy introduced limits to top-level managers’wages and also reduced compensation levels especially forthe top-level. Ireland reduced the cost of its public servicepaybill by 20% in seven years through universal and pro-gressive wage cuts, a pay freeze, a pay cap for senior offi-cials, reduced rates for new entrants, eliminatingperformance bonuses and certain allowances, and reduc-ing rates of overtime and other non-core pay.
Some countries, however, did not experience drasticreforms. Australia, Austria, Belgium, Chile, Germany, theNetherlands, New Zealand, Norway, Sweden, Switzerlandand the United States have not cut remuneration levels.
Performance-related pay, which has become a more com-mon practice in many OECD governments in recent years,
may be declining as a result of budgetary constraints.Since 2008, nine OECD countries have reduced bonuses,allowances and performance-related pay. However Greeceintroduced performance-related pay in 2014.
Further reading
Said, T., J. Le Louarn and M. Tremblay (2007), “The Perfor-mance Effects of Major Workforce Reductions”, Interna-tional Journal of Human Resource Management, Vol. 18,No. 12, pp. 2075-94.
Vaughan-Whitehead, D. (ed.) (2013), Public Sector Shock: TheImpact of Policy Retrenchment in Europe, Edward Elgar Pub-lishing Ltd, Cheltenham.
Figure notes
For the explanation of the options included in the category “Other”,please refer to the statlink: http://dx.doi.org/10.1787/888933248795.
Australia: The reforms contributed to cost control and containing wagegrowth. Austria: No reforms have been undertaken, but remunerationwas affected by a series of wage increases below inflation. Japan: TheNational Public Service Act stipulates that the remunerations ofnational public employees may at any time be changed by the Diet tobring them into accord with general conditions of society. New Zealand:Public sector wage growth has been slowed down and specifically haslagged private sector wage growth since 2010. Slovenia: There havebeen restrictions of promotions. Colombia: According to the jurispru-dence of the constitutional court, it is not possible to reduce the salariesof public sector workers.
Methodology and definitions
Data were collected through the 2014 OECD Survey onManaging Budgetary Constraints: Implications forHRM and Employment in Central Public Administra-tion. Respondents were predominantly senior offi-cials in central government HRM departments, anddata refer to the HRM practices in central governmentundertaken between 2008 and 2013. The survey wascompleted by all OECD countries except Denmark,Iceland, Israel, Luxembourg, and Turkey. Central pub-lic administration is defined, for the purposes of thissurvey, as organisations that are directly subordi-nated to national political power and are at the ser-vice of the central executive. The size and breadth ofcentral public administrations vary significantlyacross countries and should be considered whenmaking comparisons. In Table 6.1 the differencebetween moderate and frequent use was not quanti-tatively defined.
GOVERNMENT AT A GLANCE 2015 © OECD 2015108

6. HUMAN RESOURCE MANAGEMENT
Special feature: Compensation reforms since 2008
6.1. Compensation reforms implemented since 2008
Implementationof remuneration
reforms in the centralpublic administration
since 2008
Type of remuneration reforms implemented:
Reductionof remuneration
specificallyfor top-level
Reductionof remuneration
for all staff
Reductionor abolishmentof allowances
(e.g. Christmasallowance,
13th month salary)
Reduction ofperformance-related-
pay/bonusesPay freeze Other
Australia ● ✓
Austria ❍
Belgium ● ✓
Canada ● ✓
Chile ❍
Czech Republic ● ✓ ✓
Estonia ● ✓ ✓ ✓ ✓
Finland ❍
France ● ✓
Germany ● ✓
Greece ● ✓ ✓ ✓ ✓
Hungary ● ✓ ✓ ✓ ✓
Ireland ● ✓ ✓ ✓ ✓ ✓
Italy ● ✓ ✓ ✓
Japan ● ✓
Korea ● ✓
Mexico ● ✓ ✓
Netherlands ❍
New Zealand ● ✓
Norway ❍
Poland ● ✓ ✓
Portugal ● ✓ ✓ ✓ ✓
Slovak Republic ● ✓ ✓
Slovenia ● ✓ ✓ ✓ ✓ ✓
Spain ● ✓ ✓ ✓
Sweden ● ✓
Switzerland ❍
United Kingdom ● ✓ ✓
United States ❍
OECD Total 5 5 9 8 15 9
● Yes 22
❍ No 7
Brazil ● ✓
Colombia ● ✓
Latvia ● ✓ ✓ ✓
Source: 2014 OECD Survey on Managing Budgetary Constraints: Implications for HRM and Employment in Central Public Administration, OECD, Paris.1 2 http://dx.doi.org/10.1787/888933248795
GOVERNMENT AT A GLANCE 2015 © OECD 2015 109

6. HUMAN RESOURCE MANAGEMENT
Special feature: Employment reforms in central government since 2008
Employment reforms alter the size and composition of thepublic sector workforce to ensure alignment with strategicobjectives and financial sustainability. Given that a signifi-cant percentage of OECD countries’ finances are spent ontheir employees, employment reforms can have an impacton the overall cost of government. Between 2008 and 2013many OECD countries undertook numerous employmentreforms, often as a result of the 2008 financial crisis, in anattempt to restore financial sustainability while trying tomaintain service delivery standards and meet risingdemand. Large-scale employment reforms can be difficultto undertake, particularly when they involve high levels ofdownsizing over short periods of time. Conversely, coun-tries that do not take an active role in controlling the size oftheir public services risk growing public employment tolevels that are fiscally unsustainable.
From 2008 to 2013, significant downsizing trends tookplace in the central government employment of manyOECD countries. Most of the OECD EU countries are in aprocess of reducing the size of central government employ-ment. Among these, only Sweden has increased the num-ber of central government employees. Germany andCzech Republic have stabilised their numbers (in the caseof Germany after long years of reductions in central gov-ernment employment). Fewer countries continue toincrease employment in central government moderatelywhile only Norway reported high increases.
While the most significant downsizing takes place in thecountries most impacted by the 2008 financial crisis, thefact that downsizing takes place almost everywhereillustrates that central government employment levels donot only revolve around the economic and fiscal situationof a country. In fact, in some cases, countries reform pub-lic employment in the context of demographic chal-lenges, restructuring measures, governance reforms,decentralisation of public employment or the change ofwork methods.
Downsizing is a complex policy and includes a number ofdifferent (voluntary and obligatory) instruments and mea-sures. In this regard, OECD countries report significant dif-ferences concerning the choice of instruments and theimportance of measures. Overall, OECD countries thatdecide to reduce central government employment do so byusing the following broad strategies: recruitment freezes,across-the-board cuts, outsourcing, compulsory termina-tion, attrition and voluntary termination. Few countriesfocus on the dismissal of public employees. In fact, mostcountries are implementing other measures in order todownsize public employment such as recruitment freezes.
Figure notes
6.2: Czech Republic: The answer “No relevant change” is meant for theyear 2013. The biggest changes occurred in 2011 when the govern-ment cut the budget of state employee salaries by 10%. However, 2013witnessed no major change in public employment. So the overalltrend in the country is: No relevant change. France: There was a mod-erate decrease in the number of public employees (not only civil ser-vants) working in ministries (and not in agencies). Slovak Republic:Frequency of use could not be determined, the information includes allemployees within the scope of public administration (central adminis-tration, territorial self-administration, social and health insurancefunds). Switzerland: Information relates to the period 2005-13.United Kingdom: Central public administration is intended as govern-ment departments and their executive agencies (i.e. the civil service).
Methodology and definitions
Employment reforms aim to alter the size of the work-force through the use of tools such as dismissals,recruitment freezes, or privatisation. Data were col-lected through the 2014 OECD Survey on ManagingBudgetary Constraints: Implications for HRM andEmployment in Central Public Administration. Respon-dents were predominantly senior officials in centralgovernment HRM departments, and data refer to theHRM practices in central government. The survey wascompleted by all OECD countries except Denmark,Iceland, Israel, Luxembourg and Turkey. Central publicadministration is defined, for the purposes of this sur-vey, as organisations that are directly subordinated tonational political power and are at the service of thecentral executive. The size and breadth of central pub-lic administrations vary significantly across countriesand should be considered when making comparisons.
Data for Figure 6.2 are the responses to Question 1 forthe above-mentioned survey: Generally speaking,what is the overall trend in central public administra-tion employment in your country? Respondents chosefrom five possible answers: high decrease; moderatedecrease; no relevant change; moderate increase; highincrease. These categories were not quantitativelydefined, but are chosen subjectively by respondents. InTable 6.3, “dismissals” are terminations of employ-ment with or without notice; “recruitment freezes” arethe overall practice and/or policy of disallowing findingand selecting new staff to join an organisation (mostlyfor a certain period of time); “outsourcing” is obtaininggoods or services by contract from an outside supplier.The difference between moderate and frequent usewas not quantitatively defined.
GOVERNMENT AT A GLANCE 2015 © OECD 2015110

6. HUMAN RESOURCE MANAGEMENT
Special feature: Employment reforms in central government since 2008
6.2. Employment reforms in select OECD countries’ central public administrations
Source: 2014 OECD Survey on Managing Budgetary Constraints: Implications for HRM and Employment in Central Public Administration, OECD, Paris.1 2 http://dx.doi.org/10.1787/888933248809
High increase: (3.4% of responding countries)
Moderate increase: (20.6% of responding countries)
No relevant change: (10.3% of responding countries)
High decrease: (17.2% of responding countries)
Moderate decrease: (48.2% of responding countries)
Finl
and
Gree
ceIre
land
Japa
nPor
tugal
Austria
Belgium
Canada
Estonia
FranceHungaryItalyM
exicoPolandNetherlands
Slov
ak R
epub
lic
Slov
enia
SpainUn
ited K
ingdo
m
Czech R
epublic
GermanyNew Zealand
Australia
Chile
Korea
Sweden
Switzerland
United StatesNorw
ay
6.3. Employment reform tools used in OECD countries’ central public administrations
Dismissals Recruitment freezes OutsourcingAnnual productivity
targets
Non or partialreplacement
of retiring staffPrivatisation
Decentralisationof employment to lower
government level agencies
Australia ◗ ◗ .. ◗ ◗ .. ..
Austria ❍ ● ◗ ◗ ● ❍ ❍
Belgium ❍ ● ◗ ● ● ◗ ●
Canada ◗ ◗ ❍ ❍ ◗ ❍ ❍
Chile ◗ ❍ ◗ ❍ ◗ ❍ ❍
Czech Republic ● ● ● ● ◗ ◗ ◗
Estonia ◗ ◗ ❍ ❍ ❍ ❍ ◗
Finland ◗ ◗ ◗ ● ● ◗ ◗
France ❍ ◗ ◗ ◗ ◗ ❍ ◗
Germany ❍ ❍ ❍ ❍ ❍ ❍ ❍
Greece ◗ ◗ ◗ ◗ ● ❍ ❍
Hungary ◗ ● ❍ ◗ ● ❍ ❍
Ireland ❍ ◗ ◗ ● ● ❍ ❍
Italy ❍ ● ◗ ❍ ● ❍ ❍
Japan ❍ ◗ ● ❍ ● ◗ ❍
Korea ❍ ◗ ◗ ◗ ❍ ◗ ❍
Mexico ◗ ◗ ◗ ◗ ◗ ❍ ◗
Netherlands ❍ ◗ ◗ ◗ ● ◗ ◗
New Zealand ❍ ◗ ● ◗ ◗ ◗ ❍
Norway ❍ ❍ ❍ ❍ ❍ ❍ ❍
Poland ◗ ● ◗ ❍ ● ❍ ◗
Portugal ● ● ◗ ● ● ❍ ❍
Slovak Republic ● ● .. ❍ ● .. ..
Slovenia ◗ ● ❍ ● ● ❍ ❍
Spain ◗ ● ◗ ❍ ● ❍ ❍
Sweden ◗ ◗ ◗ ● ● ◗ ❍
Switzerland ◗ ◗ ❍ ◗ ◗ ❍ ❍
United Kingdom ❍ ● ◗ ◗ ◗ ◗ ❍
United States ◗ ◗ ◗ ❍ ◗ ❍ ❍
OECD Total ❒
● Frequent use 3 11 3 7 15 0 1
◗ Moderate use 14 15 17 11 10 9 7
❍ No use 12 3 7 11 4 18 19
Brazil ❍ ◗ ● ❍ ◗ ● ●
Colombia ❍ ◗ ◗ ❍ ❍ ❍ ❍
Latvia ● ◗ ◗ ◗ ◗ ❍ ❍
Source: 2014 OECD Survey on Managing Budgetary Constraints: Implications for HRM and Employment in Central Public Administration, OECD, Paris.1 2 http://dx.doi.org/10.1787/888933248811
GOVERNMENT AT A GLANCE 2015 © OECD 2015 111


GOVERNMENT AT A GLANCE 2015 © OEC
7. PUBLIC SECTOR INTEGRITY
Managing conflict of interest: Pre- and post-public employment
Asset disclosure
Transparency and integrity in lobbying
Whistleblower protection
D 2015 113

7. PUBLIC SECTOR INTEGRITY
Managing conflict of interest: Pre- and post-public employment
Increased mobility between the public and private sector –“revolving door” phenomenon – has raised public and gov-ernmental concerns of impropriety which can affect trustin public service. At the same time, it is also in the interestof the public and government to attract experienced andskilled workforce to serve the public interest. In this regard,conflict of interest situations should be appropriately andadequately identified and managed to ensure sound demo-cratic governance. An excessively strict approach couldresult not only in bureaucratic inefficiency but also in dis-couraging the employment of potential skilled and compe-tent workers in the public sector.
To properly manage the issue of post-public employment,22 OECD countries have stipulated specific rules and proce-dures for it. All OECD countries surveyed except for Swedenlegally require public officials not to use confidential orother “insider” information after they leave the public sector.Furthermore, 21 of them (66%) require a “cooling-off” period,restricting public officials leaving the public sector from lob-bying or engaging in official dealings, interacting with theirformer subordinates or colleagues in the public sector. Thelength of the cooling-off period varies across countries,examples of which include less-than-a-year cooling-offperiod required for civil servants in Austria and an up-to fiveyears of cooling-off period in Germany, where post-publicemployments linked to the former tasks of the civil servanthave to be disclosed and can be prohibited if public interestsare affected. The cooling-off period varies between publicofficials based on the seniority and the nature of the post asit is the case in Slovenia, the United Kingdom and theUnited States. During the cooling off period, only some cate-gories of public officials in Austria, Israel, Norway, Portugaland Spain receive compensation. For instance, in Spain,public officials receive 80% of their basic salaries as compen-sation and in Norway, compensation is awarded only forprohibitions on taking up a specific appointment, the levelof which is equivalent to the salary received at the time ofthe public official left public office.
In sharp contrast to post-public employment regulations,fewer restrictions exist with regard to pre-public employ-ment. Only seven OECD countries – Australia, Austria, France,Israel, Japan, the Netherlands and New Zealand – haverestrictions on both private sector employees or lobbyists andsuppliers to the government or those who negotiate publicsector contracts on behalf of a company, to fill a post in thepublic sector. Most restrictions take place during the recruit-ment process where the applicants’ previous employmentsare assessed for potential conflicts of interest. Once recruited,they are also expected to manage their conflicts of interestthrough recusal from involvement in an affected deci-sion-making process or restriction from certain information.
Further reading
OECD (2010), Post-Public Employment: Good Practices for Pre-venting Conflict of Interest, OECD, Paris.
OECD (2003), Recommendation of the Council on Guidelines forManaging Conflict of Interest in the Public Service, OECD,Paris.
OECD (1998), Recommendation of the Council on Improving Eth-ical Conduct in the Public Service Including Principles for Man-aging Ethics in the Public Service, OECD, Paris.
Figure notes
7.1: Data unavailable for Denmark and Luxembourg. In Chile, public offi-cials leaving public service after having performed oversight func-tion are not allowed to begin a working relationship for 6 monthswith any private sector entity subject to oversight by the agency fromwhich the officials have left. In Finland, there exist instructions onpost-public employment even though there is no regulation on it. InIsrael, political advisors/appointees would receive compensationonly if they served as civil servants. In the United Kingdom, seniorcivil servants and civil servants receive compensation in some veryexceptional cases when they are observing a waiting period.
7.2: Data unavailable for Denmark and Luxembourg. Government sup-pliers here could refer to suppliers to the government or those whonegotiate public sector contracts on behalf of a company.
Information on data for Israel: http://dx.doi.org/10.1787/88932315602.
Methodology and definitions
Data were collected through the 2014 OECD Survey onManaging Conflict of Interest in the Executive Branchand Whistleblower Protection. 32 OECD countriesresponded to the survey, as well as Brazil, Colombia,Latvia and Russia. Respondents to the survey werecountry delegates responsible for integrity policies incentral/federal government.
A conflict of interest involves a conflict between thepublic duty and private interests of a public official, inwhich the public official has private-capacity inter-ests which could improperly influence the perfor-mance of their official duties and responsibilities.
The term “public official” is defined as any personholding an executive office of a country, whetherappointed or elected, whether permanent or tempo-rary, whether paid or unpaid, irrespective of that per-son’s seniority; and any other person who performs apublic function, including for a public agency or pub-lic enterprise, or provides a public service, as definedin the domestic law of the country.
GOVERNMENT AT A GLANCE 2015 © OECD 2015114

7. PUBLIC SECTOR INTEGRITY
Managing conflict of interest: Pre- and post-public employment
7.1. Post-public employment: Compensation during the “cooling-off” period, 2014
President Prime MinisterMinister or Members
of Cabinet/OfficePolitical advisors/appointees Senior civil servants Civil Servants
Australia X ❍ ❍ ❍ ❍ ❍
Austria ● ● ● ❒ ❍ ❍
Belgium X ❒ ❒ ❒ ❒ ❒
Canada X ❍ ❍ ❍ ❍ ❍
Chile ❒ X ❒ ❒ ❒ ❒
Czech Republic ❒ ❒ ❒ ❒ ❒ ❒
Estonia ❒ ❒ ❒ ❒ ❍ ❍
Finland ❒ ❒ ❒ ❒ ❒ ❒
France ❒ ❒ ❒ ❍ ❍ ❍
Germany ❒ ❒ ❒ ❍ ❍ ❍
Greece ❒ ❒ ❒ ❒ ❒ ❒
Hungary ❒ ❒ ❒ ❒ ❒ ❒
Iceland ❒ ❒ ❒ ❒ ❒ ❒
Ireland ❒ ❒ ❒ ❍ ❍ ❍
Israel ❒ ❍ ❍ ● ● ●
Italy ❒ ❍ ❍ ❒ ❒ ❒
Japan X ❒ ❒ ❒ ❍ ❍
Korea ❍ ❍ ❍ ❍ ❍ ❒
Mexico ❍ X ❍ ❍ ❍ ❍
Netherlands X ❒ ❒ ❒ ❒ ❒
New Zealand X ❒ ❒ ❒ ❒ ❒
Norway X ● ● ● ● ●
Poland ❍ ❍ ❍ ❒ ❍ ❍
Portugal ● ❍ ❍ ❒ ❒ ❒
Slovak Republic ❒ ❒ ❒ ❒ ❒ ❒
Slovenia ❍ ❍ ❍ ❍ ❍ ❍
Spain X ● ● ❒ ❍ ❒
Sweden X ❒ ❒ ❒ ❒ ❒
Switzerland X ❒ ❒ ❒ ❍ ❍
Turkey ❒ ❒ ❒ ❍ ❍ ❍
United Kingdom X ❍ ❍ ❍ ❍ ❍
United States ❒ X ❍ ❒ ❍ ❍
OECD total
● Yes 2 3 3 2 2 2
❍ No 4 9 11 10 17 15
❒ No cooling-off period 15 17 18 20 13 15
Brazil ❒ X ● ● ● ❒
Colombia ❍ X ❍ ❍ ❍ ❍
Latvia ❍ ❍ ❍ ❍ ❍ ❍
Russia ❍ ❍ ❍ ❍ ❍ ❍
Source: OECD (2014), Survey on Managing Conflict of Interest in the Executive Branch and Whistleblower Protection, OECD, Paris.1 2 http://dx.doi.org/10.1787/888933248821
7.2. Restrictions on pre-public employment, 2014
Source: OECD, (2014), Survey on Managing Conflict of Interest in the Executive Branch and Whistleblower Protection, OECD, Paris.1 2 http://dx.doi.org/10.1787/888933248837
Gre
ece
Slov
ak R
epub
licUn
ited K
ingdo
m
United
Stat
es
Australia
Austria
France
IsraelJapanNetherlands
New ZealandChile
Hungary
Belgium
Canada
Czech Republic Es
toni
a
Finl
and
Germ
any
Irelan
d
Icelan
dIta
lyKorea
MexicoNorway
Poland
Portugal
Slovenia
SpainSweden
Switzerland
Turkey
No restrictions: 59.4%
On private sector employees or lobbyists: 12.5%
On both private sector employees or lobbyists and government suppliers: 21.9%
On government suppliers: 6.3%
GOVERNMENT AT A GLANCE 2015 © OECD 2015 115

7. PUBLIC SECTOR INTEGRITY
Asset disclosure
Fairness and impartiality are expected of public servants infulfilling their fundamental mission to serve the publicinterest. Public officials’ conflicts of interest pose a threatto public trust. In this context, assuring transparency andaccountability of public officials in their decision-makingprocess is key to restoring trust in the government.
Disclosure of private interests of public officials is an effec-tive tool for managing conflict of interest. Although itremains primarily public officials’ responsibility to managetheir conflict of interest situations, disclosure of their pri-vate interests can greatly aid in preventing apparent andpotential conflict of interest situations. Furthermore, pub-lic availability of the disclosed information allows the gen-eral public to hold public officials more accountable of theirofficial decisions and strengthens transparency in the pro-cess. However, disclosure and public availability of theinformation also concerns the public officials’ right toprivacy.
The level of disclosure and public availability of privateinterests differs across three primary branches of govern-ment, among which the legislative branch requires the high-est level of disclosure and public availability in vast majorityof the OECD countries surveyed. The “at risk” area includingtax and customs officials, procurement agents and financialauthorities display lower level of disclosure requirementcompared to the three branches of government.
Within the executive branch, disparity of disclosure andpublic availability levels is observed between public offi-cials. In OECD countries, the level of disclosure, on average,is closely related to the level of seniority. The top decisionmakers tend to have more obligations regarding disclosureof private interests followed by senior civil servants andpolitical advisors or appointees. Disclosure requirements ofprivate interests for public officials with higher decisionmaking power have continued to be further expanded anddeveloped in most OECD countries, especially for top deci-sion makers in the Executive branch, including President,Prime Minister and Ministers. In fact, in 2014 gifts are pro-hibited or have to be disclosed for 73% of the top decisionmakers in OECD countries surveyed compared to 68%in 2009.
Public officials in some OECD countries such as Chile,Greece, Hungary, Korea, the Netherlands, Sweden, Turkeyand the United States go beyond disclosing their own privateinterests and disclose as well those of some of their familymembers. In some countries, disclosure of family members’private interests is not obliged by law and is left at publicofficials’ discretion to disclose where potential conflicts ofinterest could arise. This is the case in Canada andthe Netherlands in an effort to balance transparency andpublic officials’ privacy.
Further readings
OECD (2007), OECD Guidelines for Managing Conflict of Interestin the Public Service: Report on Implementation, OECD, Paris.
OECD (2003), Recommendation of the Council on Guidelines forManaging Conflict of Interest in the Public Service, OECD,Paris.
OECD (1998), Recommendation of the Council on Improving Ethi-cal Conduct in the Public Service Including Principles for Man-aging Ethics in the Public Service, OECD, Paris.
Figure notes
7.3: Data unavailable for Denmark and Luxembourg. Data for Mexico onlegislative branch and judicial branch are from 2012.
7.4: Data unavailable for Denmark, Iceland and Luxembourg. SeeAnnex D for more detailed information.
Information on data for Israel: http://dx.doi.org/10.1787/88932315602.
Methodology and definitions
Data were collected through 2014 OECD Survey onManaging Conflict of Interest in the Executive Branchand Whistleblower Protection. 32 OECD countriesresponded to the survey, as well as Brazil, Colombia,Latvia and Russia. Respondents to the survey werecountry delegates responsible for integrity policies incentral/federal government.
“Executive branch” is one of the three primarybranches of a government in most democratic coun-tries – the other two being judicial and legislativebranches. It includes the Prime Minister, and/or thePresident, ministers or members of cabinet and allagencies/departments under his or her direct control.The term “legislative branch” covers the positions ofupper and lower house legislators. The term “judicialbranch” covers judges and prosecutors. The “at risk”areas include tax and customs officials, procurementagents and financial authorities.
Top decision maker’s level in Figure 7.4 is an averagebetween that of Head of Executive and Ministers.Head of Executive refers to President or Prime Minis-ter according to the country’s political system. Whereexecutive power is shared between President andPrime Minister, the average between the two is taken.More detailed information is available online at http://dx.doi.org/10.1787/888933248855.
When calculating an aggregate of the country-specificdata, all private interests and all positions weredeemed equally important and were thereforeassigned the same weights. The private interestsinclude assets, liabilities, income source and amount,paid and non-paid outside positions, gifts and previ-ous employment. Annex D provides detailed data onprivate interest disclosure and public availability andinformation on calculation methodology.
GOVERNMENT AT A GLANCE 2015 © OECD 2015116

7. PUBLIC SECTOR INTEGRITY
Asset disclosure
7.3. Level of disclosure and public availability of private interests across branches of government, 2014
Source: OECD (2014), Survey on Managing Conflict of Interest in the Executive Branch and Whistleblower Protection, OECD, Paris.1 2 http://dx.doi.org/10.1787/888933248848
0
10
20
30
40
50
60
70
80
90
100
Executive branch Legislative branch Judicial branch "At risk" areas
AUSAUT
BEL CANCHL
CZEES
T FIN FRA
DEU GRCHUN ISL
IRL
ISR ITA JPN
KORMEX
NLD NZL NORPOL
PRTSVK
SVNES
PSWE
CHETUR
GBRUSA
OECD
BRACOL
LVA
RUS
Hig
h le
vel
Low
leve
l
7.4. Level of disclosure and public availability of private interests by the level of public officials in the executive branch,2014
Source: OECD (2014), Survey on Managing Conflict of Interest in the Executive Branch and Whistleblower Protection, OECD, Paris.1 2 http://dx.doi.org/10.1787/888933248855
0
10
20
30
40
50
60
70
80
90
100
Top decision makers Political advisors/appointees Senior civil servants Civil servants
Hig
h le
vel
Low
leve
l
AUSAUT
BEL CANCHL
CZEES
T FIN FRA
DEU GRCHUN IR
LISLISR ITA JP
NKOR
MEXNLD NZL NOR
POLPRT
SVKSVN
ESP
SWECHE
TURGBR
USAOEC
DBRA
COLLV
ARUS
GOVERNMENT AT A GLANCE 2015 © OECD 2015 117

7. PUBLIC SECTOR INTEGRITY
Transparency and integrity in lobbying
Lobbying is a fact of public life in all countries. It has thepotential to promote democratic participation and can pro-vide decision makers with valuable insights, as well asfacilitate stakeholder access to public policy developmentand implementation. Yet, lobbying is often perceived as anopaque activity of dubious integrity, which may result inundue influence by special interests, unfair competitionand regulatory capture at the expense of fair, impartial andeffective policy making. There is evidence of an emergingconsensus on the need for transparency. While by 2014only 15 OECD countries have introduced lobbying regula-tions to this effect, there is a clear acceleration in this senseas 11 countries have done so in the last decade.
Regulations require lobbyists to disclose information abouttheir practices through a register. For example, Austria,Canada, France, Germany, Mexico, Poland, Slovenia andthe United States have lobbyist registers in place. Disclo-sure should provide enough pertinent information on keyaspects of lobbying activities to enable proper scrutiny.Countries with publicly accessible registers commonlyrequire lobbyists to file in the registers their names, contactdetails, their employer’s name, and the names of theirclients.
While it takes two to lobby, the ultimate responsibility forsafeguarding the public interest and rejecting undue influ-ence lies with those who are lobbied, namely public offi-cials. Most OECD countries have instituted principles,rules, standards or procedures that regulate public officials’conduct. For example, such regulations in Canada and Slo-venia specifically apply to their conduct in dealing withlobbyists while other countries such as Estonia, Norwayand Sweden, rely on more general regulations or codes ofconduct.
An increasing concern relating to lobbying is the practice of“revolving doors”- the movement of staff between relatedpublic and lobbying sectors –as it may heighten exposure toconflicts of interest and impropriety such as the misuse ofinsider information, position and contacts. Concern overrevolving doors has prompted countries to take measuresto prevent and contain conflict of interest in pre- andpost-public employment situations in order to ensure theintegrity of present and former public officials. Among the24 countries which responded to the 2013 OECD Survey onLobbying Rules and Guidelines, only half (12) have adoptedrestrictions on senior public officials in the executivebranch to engage in lobbying after they leave the govern-ment; and only 10 have restrictions on public officials.
Another emerging concern is the capture of advisorygroups by private interests to exert undue influence. When,for example, corporate executives or lobbyists advise gov-ernments as members of an advisory group, they act not asexternal lobbyists, but as part of the policy making processwith direct access to decision makers. There is often noobligation to ensure a balanced representation of interestsin advisory groups, except for Belgium, Estonia, Korea,Switzerland and the United States. In order to ensuretransparency in policy making, countries can, as a mini-mum, make membership information publicly available forscrutiny by other stakeholders.
Further reading
OECD (2014), Lobbyists, Governments and Public Trust, Volume3: Implementing the OECD Principles for Transparency andIntegrity in Lobbying, OECD, Paris, http://dx.doi.org/10.1787/9789264214224-en.
OECD (2012), Lobbyists, Governments and Public Trust,Volume 2: Promoting Integrity through Self-regulation, OECD,Paris, http://dx.doi.org/10.1787/9789264084940-en.
OECD (2010), “Recommendation on Principles forTransparency and Integrity in Lobbying”, OECD, Paris,www.oecd.org/corruption/ethics/oecdprinciplesfortransparencyandintegrityinlobbying.htm.
Figure notes
7.5: Data refers to the year of introduction of the first regulation inrespective countries. Ireland enacted the Regulation of Lobbying Actin March 2015.
7.6: Data unavailable for Australia, the Czech Republic, Denmark, Greece,Iceland, Israel, Japan, the Slovak Republic and Turkey.
Methodology and definitions
The data presents the results of the OECD 2013 Surveyon Lobbying Rules and Guidelines. Respondents tothe Survey were country delegates responsible forintegrity policies and/or lobbying rules and theirimplementation in central government. A total of24 OECD countries together with Brazil, completedthe survey. In addition, Denmark, Japan and theUnited Kingdom responded to selected questions.
GOVERNMENT AT A GLANCE 2015 © OECD 2015118

7. PUBLIC SECTOR INTEGRITY
Transparency and integrity in lobbying
7.5. Introduction of lobbying regulation, 1940-14
Source: OECD (2014), Lobbyists, Governments and Public Trust, Volume 3: Implementing the OECD Principles for Transparency and Integrity in Lobbying, OECD, Paris.1 2 http://dx.doi.org/10.1787/888933248864
0
1
2
3
4
5
6
7
8
9
10
11
12
13
14
15
16
1940s 1950s 1960s 1970s 1980s 1990s 2000s 2010-2014
DEU
AUSCAN
POLHUNISRFRA
MEXSVNAUTITANLDCHLGBR
USA
7.6. Rules on the balanced representation of interests in advisory groups, 2013
Is there an obligation to have a balancedcomposition of advisory/expert groups?
Are lobbyists allowed to sit in advisory/expertgroups in personal capacity?
Are corporate executives allowed to sitin advisory/expert groups in personal capacity?
Austria X ❍ ❍
Belgium ❍ X ❍
Canada X ❍ ❍
Chile X ❍ ❍
Estonia ❍ ❍ ❍
Finland X ❍ ❍
France X ❍ ❍
Germany X ❍ ❍
Hungary X X ❍
Ireland X ❍ ❍
Italy X ❍ ❍
Korea ❍ X ❍
Luxembourg X ❍ ❍
Mexico X ❍ ❍
Netherlands X ❍ ❍
New Zealand X X X
Norway X ❍ ❍
Poland X ❍ ❍
Portugal X ❍ ❍
Slovenia X ❍ ❍
Spain X X X
Sweden X ❍ ❍
Switzerland ❍ ❍ ❍
United Kingdom X ❍ ❍
United States ❍ ❍ ❍
OECD Total
❍ Yes 5 20 23
X No 20 5 2
Brazil X ❍ ❍
Source: OECD (2013), Survey on Lobbying Rules and Guidelines.1 2 http://dx.doi.org/10.1787/888933248872
GOVERNMENT AT A GLANCE 2015 © OECD 2015 119
7. PUBLIC SECTOR INTEGRITY
Whistleblower protection
The protection of employees who disclose wrongdoing, inthe context of their workplace (whistleblowers), is at thecore of an organisation’s integrity framework. In govern-ments, it is recognised as an essential element for safe-guarding the public interest, promoting a culture of publicaccountability, and in many countries is proving crucial inthe reporting of misconduct, fraud and corruption.
The importance of developing the necessary laws is evi-denced by the increase in OECD countries that have devel-oped a legal framework aimed at protecting whistleblowerssince 2009, including Belgium, Greece, Ireland and Switzer-land. Overall, 88% of OECD countries surveyed have a whis-tleblower protection law or legal provision that calls for theprotection of whistleblowers.
Whistleblower protection can originate from dedicatedlaw(s), or through a piecemeal approach, stemming fromprovisions in various laws. The majority of the OECD coun-tries that provide legal protection to whistleblowers do sothrough provisions found in one or more laws, such asanti-corruption laws, competition laws, corporate laws,public servants laws, labour laws and criminal codes. Whilemost apply this type of approach, the degree of protectionafforded within the provisions of these laws is often lesscomprehensive than the protection provided for withindedicated law(s),which often facilitate clarity and stream-line the processes and mechanisms involved in disclosing awrongdoing.
In terms of coverage, several OECD countries surveyed stillonly afford protection to public sector employees. 69% ofOECD countries that responded to the survey extend theircoverage to include employees in both the public and pri-vate sector to varying degrees, as evidenced in Estonia,Korea and Ireland.
Whistleblower protection laws and provisions, gain impactthrough effective awareness-raising, communication,training and evaluation efforts. In their drive to promotewhistleblowing, one third of OECD countries, whoresponded to the survey and report affording protection,including Australia, Belgium, Korea and the United States,have established various incentives for individuals to comeforward with disclosures. These incentives include expe-dited processes, follow up mechanisms and financialrewards. For instance in Korea, whistleblowers arerewarded with up to USD 2 million, if their report of corrup-tion has directly contributed to recovering or increasingrevenues or reducing expenditures for public agencies.
To discourage an abuse of the system the majority of OECDcountries surveyed have put measures in place to precludeindividuals from reporting allegations in bad faith.The Czech Republic, Greece, Ireland, Portugal andthe United Kingdom are the only OECD countries surveyednot to include such measures. Nevertheless, if individualshave been discovered to have reported in bad faith, in Ire-
land and the United Kingdom, they are dealt with by nor-mal disciplinary procedures.
Further reading
OECD (forthcoming), “Revisiting Whistleblower Protectionin OECD Countries: From Commitments to Effective Pro-tection”, OECD, Paris.
OECD (2012), “Study on G20 Whistleblower ProtectionFrameworks, Compendium of Best Practices and GuidingPrinciples for Legislation”, OECD, Paris.
OECD (1998), “Recommendation of the Council on Improv-ing Ethical Conduct in the Public Service Including Prin-ciples for Managing Ethics in the Public Service”, OECD,Paris.
Figure notes
7.7: Data unavailable for Denmark and Luxembourg. In the SlovakRepublic, the relevant law was approved in October 2014 and cameinto effect as of January 2015. The degree of protection may varyamong countries when protection is provided within provision(s) inother law(s).
7.8: Data unavailable for Denmark and Luxembourg. OECD countriesthat do not afford legal protection to whistleblowers were notincluded in the figure. Greece and Portugal afford legal protection towhistleblowers; however they were omitted from the figure, as in thecase of the former, the relevant prosecutor decides who is given thestatus of a whistleblower, while in the case of the latter the protec-tion of whistleblowers is limited to those in criminal proceedings. InCanada, a certain degree of whistleblower protection exists in theprivate sector for those who report criminal acts by their employer.In Switzerland, protection in the private sector does not result fromexplicit legal provisions, instead it stems from the Code of Obliga-tions as well as related case law. Furthermore, the degree of protec-tion granted is lower than in the public service since reintegration orreassignment to an equivalent position as the one occupied prior towhistleblowing is not possible .
Information on data for Israel: http://dx.doi.org/10.1787/88932315602.
Methodology and definitions
Data was collected through the 2014 OECD Survey onManaging Conflict of Interest in the Executive Branchand Whistleblower Protection. 32 OECD countriesresponded to the survey, as well as Brazil, Colombia,Latvia and Russia. Respondents to the survey werecountry delegates responsible for integrity policies incentral/federal government. In Figure 7.8, the degreeof coverage in the private sector varies, depending onthe particular type of law or laws that are applicable(e.g. competition, corporate, labour, etc.).
GOVERNMENT AT A GLANCE 2015 © OECD 2015120

7. PUBLIC SECTOR INTEGRITY
Whistleblower protection
7.7. Legal protection of whistleblower in OECD member countries, 2014
Source: OECD (2014), Survey on Managing Conflict of Interest in the Executive Branch and Whistleblower Protection.1 2 http://dx.doi.org/10.1787/888933248880
Aust
ralia
Belg
ium
Cana
da
Hungary
Ireland
Israel
Japan
KoreaNetherlandsNew ZealandSlovak Republic
United Kingdom
United States
Austria
Chile
Czec
h Rep
ublic
Es
toni
a
Fran
ce
Germ
any
GreeceIcelandItaly
Mexico
Portugal
Norway
Slovenia
Switzerland
Turkey
FinlandPoland
SpainSw
eden
Protection through provisions in other laws: 47%
Protection through dedicated law: 41%
No protection: 13%
7.8. Scope of whistleblower protection in the public and private sector, 2014
Public and private sector
Employees Consultants Suppliers Temporary employees Former employees Volunteers
Australia ● ■ ● ■ ● ❒ ● ❒ ● ❒ ❍
Austria ● ❒ ❍ ❒ ❍ ❒ ● ❒ ● ❒ ●
Belgium ● ❒ ❍ ❒ ❍ ❒ ● ❒ ❍ ❒ ❍
Canada ● ❒ ● ❒ ● ❒ ● ❒ ● ❒ ❍
Chile ● ❒ ❍ ❒ ❍ ❒ ❍ ❒ ❍ ❒ ❍
Czech Republic ● ■ ❍ ❒ ❍ ❒ ❍ ❒ ❍ ❒ ❍
Estonia ● ■ ● ■ ● ■ ● ■ ● ■ ●
France ● ■ ● ■ ● ■ ● ■ ● ■ ●
Germany ● ■ ● ■ ● ■ ● ■ ● ■ ❍
Hungary ● ■ ● ■ ● ■ ● ■ ● ■ ●
Iceland ● ❒ ❍ ❒ ❍ ❒ ● ❒ ❍ ❒ ❍
Ireland ● ■ ● ■ ● ■ ● ■ ● ■ ❍
Israel ● ■ ● ❒ ❍ ❒ ● ■ ● ■ ❍
Italy ● ❒ ● ❒ ❍ ❒ ● ❒ ● ❒ ❍
Japan ● ■ ❍ ❒ ❍ ❒ ● ■ ❍ ❒ ❍
Korea ● ■ ● ■ ● ■ ● ■ ● ■ ●
Mexico ● ■ ● ■ ● ■ ● ■ ● ■ ●
Netherlands ● ■ ❍ ❒ ❍ ❒ ● ■ ● ■ ❍
New Zealand ● ■ ● ■ ● ■ ● ■ ● ■ ●
Norway ● ■ ❍ ❒ ❍ ❒ ❍ ❒ ❍ ❒ ❍
Slovak Republic ● ❒ ❍ ❒ ❍ ❒ ❍ ❒ ❍ ❒ ❍
Slovenia ● ■ ● ■ ● ■ ● ■ ● ■ ●
Switzerland ● ■ ❍ ❒ ❍ ❒ ● ■ ❍ ❒ ❍
Turkey ● ❒ ● ❒ ❍ ❒ ● ❒ ❍ ❒ ❍
United Kingdom ● ■ ● ■ ● ■ ● ■ ❍ ❒ ❍
United States ● ■ ● ❒ ❍ ❒ ● ■ ● ■ ❍
OECD totalYes: ● (Public), ■ (Private) 26, 18 16, 11 12, 10 22, 15 16, 12 8No: ❍ (Public), ❒ (Private) 0, 8 10, 15 14, 16 4, 11 10, 14 18
Brazil ● ❒ ❍ ❒ ❍ ❒ ● ❒ ❍ ❒ ❍
Colombia ● ■ ● ■ ● ■ ● ■ ● ■ ❍
Latvia ● ■ ● ❒ ❍ ❒ ❍ ❒ ❍ ❒ ❍
Russia ● ❒ ❍ ❒ ❍ ❒ ❍ ❒ ❍ ❒ ❍
Source: OECD (2014), Survey on Managing Conflict of Interest in the Executive Branch and Whistleblower Protection.1 2 http://dx.doi.org/10.1787/888933248898
GOVERNMENT AT A GLANCE 2015 © OECD 2015 121


GOVERNMENT AT A GLANCE 2015 © OEC
8. REGULATORY GOVERNANCE
Global trends in regulatory policy and governance
Stakeholder engagement
Regulatory Impact Analysis
Ex post evaluation of regulation
Governance of regulators
D 2015 123
8. REGULATORY GOVERNANCE
Global trends in regulatory policy and governance
Regulatory policy refers to the set of rules, procedures andinstitutions introduced by government for the express pur-pose of developing, administering and reviewing regulation(both primary and subordinate). OECD member countrieshave acknowledged the critical importance of regulatorypolicy and made substancial efforts to ensure that regula-tions are of high quality and fit-for-purpose. The financialand economic crisis of 2008 has reinforced the need andhighlighted the importance of a well-functioning regula-tory framework for transparent and efficient markets withthe right incentives. Fair, transparent and clear regulatoryframeworks serve also as a sine qua non basic condition fordealing effectively with environmental and social chal-lenges in a society. Good regulatory practices and institu-tions can also help address global challenges and “harness”globalisation through more coherent and shared rules.
The 2012 OECD Recommendation on Regulatory Policy andGovernance recommends that OECD member countries“commit at the highest political level to an explicitwhole-of-government policy for regulatory quality”.In 2014, based on the latest Regulatory Indicators Survey,most countries show commitment towards an explicitwhole-of-government regulatory policy. Most countries(94%) have in place standard procedures to develop primarylaws and subordinate regulations. Similarly, more thanthree-quarters (80%) of countries also have nominated aMinister or a high-level official to be accountable for pro-moting government-wide progress on regulatory reform,and have developed and published an explicit regulatorypolicy. This high-level of commitment is a sign of wideadoption of a whole-of-government regulatory policyacross the OECD. The number of OECD countries withoutan explicit regulatory policy is shrinking fast (24 out of 34).
The 2012 Recommendation advocates to “establish mecha-nisms and institutions to actively provide oversight of reg-ulatory policy procedures and goals, support andimplement regulatory policy and thereby foster regulatoryquality”. Thirty two OECD member countries as well as theEuropean Commission have adopted oversight bodies toensure regulatory quality. Despite the wide adoption ofoversight bodies, substancial differences in institutionalcontexts and structures and differences in the maturitylevels of regulatory systems prevail across OECD countries.Many countries report not one but several oversight bodies,which can be located either within government, e.g. at theprime minister’s office or the ministry of finance, or out-side of government, e.g. as an independent body. Thisresult raises the question of the allocation of responsibilityacross the different bodies and a need for co-ordination.While specialisation may be warranted, too much fragmen-tation could erode the whole-of-government approach rec-ommended by the 2012 Recommendation. Likewise, thereis substantial variety across countries in relation to the
responsibilities of the oversight bodies. Similarly, the over-sight bodies can perform a wide range of functions, fromproviding advice and co-ordination of regulatory tools toacting as formal “gate-keepers” ensuring regulations can-not proceed to the next stage of development until a partic-ular criteria has been met.
Further reading
OECD (forthcoming), Regulatory Policy Outlook 2015, OECD,Paris.
OECD (2014), OECD Work on Regulatory Policy, OECD, Paris,www.oecd.org/gov/regulatory-policy/.
OECD (2012), Recommendation of the Council on Regulatory Policyand Governance, OECD, Paris, www.oecd.org/gov/regulatory-policy/2012-recommendation.htm.
Table and figure notes
The question “Are there standard procedures by which the administra-tion develops primary laws” is not applicable to the United States.
Information on data for Israel: http://dx.doi.org/10.1787/88932315602.
Methodology and definitions
The indicators draw upon country responses tothe 2014 OECD Regulatory Indicators Survey for allOECD member countries and the European Commis-sion. Responses were provided by delegates to theOECD Regulatory Policy Committee and central gov-ernment officials. The scope of the data covers onlyregulations initiated by the executive. All questionson primary laws are not appl icable to theUnited States, as the US executive does not initiateprimary laws at all.
Primary laws are regulations which must be approvedby the parliament or congress, while subordinate reg-ulations can be approved by the head of government,by an individual minister or by the cabinet – that is, byan authority other than the parliament/congress.Regulatory Impact Analysis (RIA) is the systematicprocess of identification and quantification of bene-fits and costs likely to flow from regulatory ornon-regulatory options for a policy under consider-ation. Minister refers to the most senior political rolewithin a portfolio. High level official refers to a seniorpublic official in the ministry, for example a Perma-nent Secretary, Departmental Secretary, State Secre-tary, Secretary-General or Deputy Minister.
GOVERNMENT AT A GLANCE 2015 © OECD 2015124

8. REGULATORY GOVERNANCE
Global trends in regulatory policy and governance
8.1. The adoption of an explicit whole-of-government policy for regulatory quality, 2014
Explicit publishedregulatory
policy exists
Standard procedures adopted
by which the administration
develops…
Minister/highlevel officialaccountable
for promotingregulatory
reform
Bodyresponsible
for promotingregulatory policy
and reportingon regulatory
quality
Area of responsibility for regulatory oversight body
Primary laws Subordinateregulations
RegulatoryImpact
Assessment
Administrativesimplification
or burdenreduction
Stakeholderengagement
Ex postanalysis
Legal quality
Australia ● ● ● ● ● ● ● ● ● ●
Austria ● ● ● ● ● ● ● ● ● ●
Belgium ● ● ● ❍ ● ● ● ● ● ❍
Canada ● ● ● ● ● ● ● ● ● ●
Chile ❍ ● ● ❍ ❍ ❍ ❍ ❍ ❍ ❍
Czech Republic ● ● ● ● ● ● ● ● ● ●
Denmark ● ● ● ● ● ● ● ● ● ●
Estonia ● ● ● ● ● ● ● ● ● ●
Finland ● ● ● ❍ ● ❍ ❍ ❍ ❍ ●
France ● ● ● ● ● ● ● ● ● ●
Germany ● ● ● ● ● ● ● ● ● ●
Greece ● ● ● ● ● ● ● ● ❍ ●
Hungary ● ● ● ❍ ● ❍ ● ❍ ● ●
Iceland ● ● ● ● ● ● ● ● ● ●
Ireland ● ● ● ❍ ● ● ● ❍ ❍ ●
Israel ● ● ● ● ● ❍ ● ● ● ❍
Italy ● ● ● ● ● ● ● ❍ ● ●
Japan ● ❍ ● ● ● ❍ ● ● ● ❍
Korea ● ● ● ● ● ● ● ● ● ●
Luxembourg ● ● ● ● ● ● ● ● ● ●
Mexico ● ● ● ● ● ● ● ● ● ❍
Netherlands ● ● ● ● ● ● ● ● ❍ ●
New Zealand ● ● ● ● ● ● ❍ ● ● ❍
Norway ❍ ● ❍ ● ❍ ❍ ❍ ❍ ❍ ❍
Poland ● ● ● ● ● ● ● ● ● ●
Portugal ● ● ● ● ● ❍ ● ● ● ●
Slovak Republic ● ● ● ● ● ● ● ● ● ❍
Slovenia ● ● ● ● ● ❍ ● ● ● ●
Spain ● ● ● ● ● ● ● ● ● ●
Sweden ● ● ● ● ● ● ● ● ❍ ●
Switzerland ● ● ● ● ● ● ● ● ● ●
Turkey ● ● ● ❍ ● ● ❍ ● ❍ ●
United Kingodom ● ● ● ● ● ● ● ● ● ●
United States ● X ● ● ● ● ● ● ● ❍
European Union ● ● ● ● ● ● ● ● ● ●
OECD Total● Yes 32 32 33 28 32 26 29 28 26 25❍ No 2 1 1 6 2 8 5 6 8 9X Not applicable 0 1 0 0 0 0 0 0 0 0
Source: OECD (forthcoming), Regulatory Policy Outlook 2015 based on the 2014 OECD Regulatory Indicators Survey results.1 2 http://dx.doi.org/10.1787/888933248903
8.2. Number of oversight bodies per country/jurisdiction, 2014
Source: OECD (forthcoming), Regulatory Policy Outlook 2015 based on the 2014 OECD Regulatory Indicators Survey results.1 2 http://dx.doi.org/10.1787/888933248915
0
2
4
6
8
10
0 1 2 3 4 5 6Number of oversight bodies indicated
Number of jurisdictions
GOVERNMENT AT A GLANCE 2015 © OECD 2015 125
8. REGULATORY GOVERNANCE
Stakeholder engagement
The central objective of regulatory policy is to ensure thatregulations are designed and implemented in the publicinterest. It can only be achieved with help from those con-cerned: citizens, businesses, civil society, public sectororganisations, etc. The 2012 OECD Recommendation onRegulatory Policy and Governance recommends that gov-ernments “actively engage … all relevant stakeholders dur-ing the regulation-making process and design …consultation processes to maximise the quality of theinformation received and its effectiveness” (OECD, forth-coming). OECD member countries acknowledge the impor-tance of listening to the voice of users, who need to be partof the regulatory development process. Moreover, stake-holder engagement is commonly considered as a key ele-ment of an open government policy.
A majority of OECD member countries have implemented arequirement to engage stakeholders in developing both pri-mary and subordinate regulations. Most countries alsoensure easy access to regulations and have policies onusing plain language. Many countries are using tripartiteconsultations to make sure that the views of workers andemployers are reflected in newly developed regulations. Onthe other hand, involvement of stakeholders in perfor-mance assessments of regulations and regulatory systemsis rather rare.
Stakeholder engagement should be part of all stages of theregulatory governance cycle. Most OECD member countriesengage with stakeholders especially when developing oramending regulations. Countries use various types of con-sultations in various phases of the regulation-making pro-cess, however a typical engagement takes place through apublic consultation over the internet at the final stage ofthe process when a legislative draft is submitted to the gov-ernment. Attempts exist to involve stakeholders in the pro-cess of reviewing the stock of available regulations. Somecountries such as Denmark now actively seek stakeholders’input on shaping regulatory reform programmes such asthose focusing on administrative simplification. Stakehold-ers are still rarely engaged in the final delivery stage of theregulatory governance cycle, implementation and monitor-ing. The UK Better Regulation Delivery Office’s co-operationwith stakeholders in improving regulatory delivery andinspections or Canada where regulators are required todevelop interpretation policies in co-operation with stake-holders are among the exceptions. Countries could moreactively engage with stakeholders at this stage to find waysto implement regulations most effectively, to limit unnec-essary burdens and to target better their enforcementmethods. Enhanced contact between regulators and regu-lated entities could result in improved measurement ofcompliance and a better understanding of the reasons fornon-compliance.
The use of ICTs in engaging stakeholders in regulatory pol-icy is widespread. It has become a standard practice thatcountries publish draft regulations on ministerial websitesor dedicated consultation portals. An increasing number ofcountries experiment with more innovative tools such associal media, crowdsourcing, wiki-based tools, etc. The
experience so far shows that ICTs have failed to signifi-cantly increase the level of engagement in policy making orto improve its quality. Despite the fact that the mecha-nisms of engagement have changed, the nature of the pro-cess has remained essentially the same as in the pre-digitalera. In general, the effect of the use of ICTs on the qualityand quantity of stakeholder engagement is behind expec-tations (OECD, forthcoming).
Further reading
OECD (forthcoming), Regulatory Policy Outlook 2015, OECD,Paris.
OECD (2014), “Evaluating Stakeholder Engagement in Regu-latory Policy”, Policy Findings and Workshop Proceed-ings, 6th Expert Meeting on Measuring RegulatoryPerformance, OECD, Paris.
OECD (2012), Recommendation of the Council on Regulatory Policyand Governance, OECD, Paris, www.oecd.org/gov/regulatory-policy/2012-recommendation.htm.
Table notes
8.4: Public consultation over the internet refers to consultation open toany member of the public, inviting them to comment with a clearindication how comments can be provided. The public should be ableto either submit comments online and/or send them to an e-mailaddress that is clearly indicated on the website. This excludes simplyposting regulatory proposals on the internet without provision forcomment.
Information on data for Israel: http://dx.doi.org/10.1787/88932315602.
Methodology and definitions
The indicators draw upon country responses tothe 2014 OECD Regulatory Indicators Survey for allOECD member countries and the European Commis-sion. Responses were provided by delegates to theOECD Regulatory Policy Committee and central gov-ernment officials. The data only cover primary lawsand subordinate regulations initiated by the execu-tive. All questions on primary laws are not applicableto the United States as the US executive does not ini-tiate primary laws at all.
Primary laws are regulations which must be approvedby the legislature, while subordinate regulations canbe approved by the head of government, by an indi-vidual minister or by the cabinet. Early-stage consul-tation refers to stakeholder engagement that occursat an early stage to inform officials about the natureof the problem and to inform discussions on possiblesolutions. Later-stage consultation refers to stake-holder engagement where the preferred solution hasbeen identified and/or a draft version of the regula-tion has been issued.
GOVERNMENT AT A GLANCE 2015 © OECD 2015126

8. REGULATORY GOVERNANCE
Stakeholder engagement
8.3. Requirements and types of stakeholder engagement, 2014
Requirement to conduct stakeholder engagementStakeholder engagement to inform officialsabout the problem and possible solutions
Consultation on draft regulations/proposed rules
Primary laws Subordinate regulations Primary laws Subordinate regulations Primary laws Subordinate regulations
Australia ◗ ■
Austria ◗ ◗ ◗ ◗ ◗ ◗
Belgium ■ ■
Canada ■ ■ ■ ■ ■
Chile ◗ ◗ ◗ ◗ ◗ ◗
Czech Republic ◗ ◗ ■ ■
Denmark ■ ◗ ◗ ◗ ■ ◗
Estonia ■ ◗ ◗ ■ ■
Finland ■ ■ ◗ ◗ ■ ■
France ◗ ◗ ◗ ◗ ◗
Germany ■ ■ ◗ ◗ ■ ■
Greece ■ ● ◗ ● ■
Hungary ■ ■ ● ● ■ ■
Iceland ◗ ● ◗ ◗ ◗ ◗
Ireland ◗ ◗ ◗ ● ■ ●
Israel ● ● ● ● ● ●
Italy ■ ■ ◗ ◗ ◗ ◗
Japan ● ● ● ● ◗
Korea ◗ ● ■ ■
Luxembourg ■ ■ ◗ ◗ ■ ■
Mexico ■ ■ ◗ ◗ ■ ■
Netherlands ◗ ● ● ● ◗ ◗
New Zealand ■ ■ ■ ■ ■ ■
Norway ■ ■ ◗ ◗ ■ ■
Poland ■ ■ ◗ ◗ ■ ■
Portugal ● ● ■ ■
Slovak Republic ■ ■ ◗ ◗ ■ ■
Slovenia ■ ■ ■ ■
Spain ■ ■ ◗ ◗ ■ ■
Sweden ■ ■ ◗ ◗ ■
Switzerland ■ ◗ ◗ ■
Turkey ■ ■ ◗ ◗
United Kingdom ■ ■ ◗ ■ ■
United States X ■ X ◗ X ■
European Union ● ■
OECD Total■ For all regulations 21 18 1 2 23 18
For major regulations 4 7 5 3 2 6◗ For some regulations 6 5 22 21 6 8● Never 2 4 5 8 2 2X Not applicable 1 0 1 0 1 0
Source: OECD (forthcoming), Regulatory Policy Outlook 2015 based on the 2014 OECD Regulatory Indicators Survey results.1 2 http://dx.doi.org/10.1787/888933248928
8.4. Use of ICTs to consult in different stages of regulation development, 2014
Government uses interactive websites to consult with stakeholders on: List of countries Number of countries
Public consultation conducted over the internet with invitationto comment
AUS, BEL, CAN, CHL, CZE, DNK, EST, FIN, FRA, DEU, GRC, ISL, IRL, ITA, JPN, KOR, MEX,NDL, NZL, NOR, POL, PRT, SVK, SVN, ESP, SWE, CHE, TUR, GBR, USA, European Union
31
Plans to regulate AUS, BEL, CAN, CHL, DNK, EST, FIN, DEU, KOR, MEX, NDL, NZL, NOR, POL, SVK, SVN,CHE, USA, European Union
19
Draft regulations AUS, BEL, CAN, CHL, DNK, EST, FIN, FRA, DEU, GRC, ISL, ITA, JPN, KOR, MEX, NDL, NZL,NOR, POL, SVK, SVN, CHE, GBR, USA
24
Plans to change existing regulations AUS, BEL, CAN, CHL, DNK, FIN, FRA, DEU, GRC, ITA, KOR, MEX, NDL, NZL, NOR, POL,PRT, SVK, SVN, CHE, GBR, USA, European Union
23
Finalised regulations AUS, BEL, CAN, CHL, DNK, EST, FIN, GRC, JPN, KOR, MEX, NDL, NZL, SVN, USA 15
Source: OECD (forthcoming), Regulatory Policy Outlook 2015 based on the 2014 OECD Regulatory Indicators Survey results.1 2 http://dx.doi.org/10.1787/888933248936
GOVERNMENT AT A GLANCE 2015 © OECD 2015 127

8. REGULATORY GOVERNANCE
Regulatory Impact Analysis
Regulatory Impact Analysis (RIA) is the systematic processof identification and quantification of benefits and costslikely to flow from regulatory or non-regulatory options fora policy under consideration. Countries apply a variety ofanalytic techniques as part of the RIA process, includingcost-benefit analysis, cost-effective analysis, and multi-criteria analysis. RIA represents a core tool for ensuring thequality of new regulations through an evidence-based pro-cess for decision making. A well-functioning RIA systemcan assist in promoting policy coherence by making trans-parent the trade-offs inherent in regulatory proposals. RIAimproves the use of evidence in policy making and reducesthe incidence of regulatory failure arising from regulatingwhen there is no case for doing so, or failing to regulatewhen there is a clear need. The process fosters integrityand trust in the regulation-making system through leversof transparency and accountability by disclosing the devel-opment process of the regulation. Yet, despite being one ofthe tools most widely adopted internationally as part ofregulatory policy, effective implementation of RIA remainselusive in many cases. This is evidenced, for instance, bythe existing gap between the legal mandate to conduct RIAand its actual practice and the limited number of countriesthat ensure that regulations guarantee a net benefit to soci-ety (Table 8.5).
Survey data shows that the majority of OECD countries haveboth established the requirement to conduct RIA in a legalor official document, and are conducting RIA in practice.However, there is a significant gap between requiring RIA,as established in a legal or official document, and theactual practice of RIA (Table 8.5). This gap is more pro-nounced in the case of subordinate regulation. Despite RIAbeing a cornerstone of evidence-based policy making andone of the most promoted regulatory policy tools by theOECD for the past 20 years, ensuring its even implementa-tion in all OECD countries remains a challenge.
High quality regulations are expected to bring benefits tosociety as a whole. At the same time, they also bring aboutcosts: implementation and compliance costs, administra-tive burdens and potential distortions in other markets.One of the core objectives of RIA is helping countries todesign and implement cost-effective regulations, whichadd to overall wealth of society, by providing net positivebenefits. It is common practice across OECD member coun-tries to identify benefits and costs of draft regulation aspart of the RIA process. However, only a small minority(about 34%) of OECD countries including the United Kingdomand Mexico amongst others ensure that the benefits of reg-ulations outweigh the costs (Table 8.5). In many cases, thisresult stems from a lack of human and capital resources toovercome methodological challenges in carrying out costand benefit analysis. Furthermore, this finding may dem-onstrate that RIA is used mainly as a tool to determinewhich regulatory proposals are the least costly. In any
event, much more needs to be done to systematically iden-tify benefits and thus fundamentally improve the utilisa-tion of RIA.
A key OECD recommendation for an effective RIA system isto establish a body that is responsible for reviewing thequality of RIAs prepared by line ministries and regulators.An oversight body for the RIA process has been establishedin the majority of OECD countries (Table 8.6). However, in asignificant number of cases, oversight bodies do not yetfunction as effective gatekeepers to guarantee regulatoryquality, namely the capacity to return the RIAs alongside thecorresponding draft regulation to line ministries and regula-tors when the oversight bodies deem them to be inadequateor inconsistent with regulatory principles. All in all, thequestion of the effectiveness of RIA systems in warrantingthat the implemented regulations are “fit-for-purpose”remains unanswered.
Further reading
OECD (forthcoming), Regulatory Policy Outlook 2015, OECD,Paris.
OECD (2014), “OECD Work on Regulatory Impact Analysis”,www.oecd.org/gov/regulatory-policy/ria.htm.
OECD (2012), Recommendation of the Council on RegulatoryPolicy and Governance, OECD, Paris, www.oecd.org/gov/regulatory-policy/2012-recommendation.htm.
Table note
Information on data for Israel: http://dx.doi.org/10.1787/88932315602.
Methodology and definitions
The indicators draw upon country responses tothe 2014 OECD Regulatory Indicators Survey for allOECD member countries and the European Commis-sion. Responses were provided by delegates to theOECD Regulatory Policy Committee and central gov-ernment officials. The data only covers primary lawsand subordinate regulations initiated by the execu-tive. All questions on primary laws are not applicableto the United States, as the US executive does not ini-tiate primary laws at all.
Primary laws are regulations which must be approvedby the parliament or congress, while subordinate reg-ulations can be approved by the head of government,by an individual minister or by the cabinet – that is, byan authority other than the parliament/congress.
GOVERNMENT AT A GLANCE 2015 © OECD 2015128

8. REGULATORY GOVERNANCE
Regulatory Impact Analysis
8.5. RIA – Formal requirements, practice and assessment of costs and benefits, 2014
Requirement to conducta RIA to inform
the development of:
RIA is conducted in practiceto inform the development
of regulations for:
Regulators are requiredto identify the costsof a new regulation
Regulators are requiredto identify the benefits
of a new regulation
Formal requirement existsfor regulators to demonstrate
that the benefits of a newregulation justify the costs
Primarylaws
Subordinateregulations
Primarylaws
Subordinateregulations
Primarylaws
Subordinateregulations
Primarylaws
Subordinateregulations
Primarylaws
Subordinateregulations
Australia ■ ■
Austria ■ ■ ■ ■ ■ ■ ■ ■ ● ●
Belgium ■ ◗ ■ ◗ ■ ■ ■ ■ ● ●
Canada ■ ■ ■ ■ ■ ■ ■ ■ ● ■
Chile ● ● ● ● ■ ● ■ ◗ ● ●
Czech Republic ■ ■ ■ ■ ■ ■ ■ ● ●
Denmark ■ ● ■ ◗ ■ ■ ■ ● ● ●
Estonia ■ ■ ■ ◗ ■ ■ ■ ■ ● ●
Finland ■ ◗ ■ ◗ ■ ■ ● ●
France ■ ■ ■ ■ ● ●
Germany ■ ■ ■ ■ ■ ■ ■ ■ ● ●
Greece ■ ■ ● ■ ■ ● ●
Hungary ■ ■ ■ ■ ■ ■ ■ ■ ■ ■
Iceland ■ ◗ ■ ◗ ■ ◗ ■ ● ■ ●
Ireland ■ ■ ■ ■ ■ ◗ ◗ ● ●
Israel ■ ■ ● ■ ■ ■ ■ ■ ● ●
Italy ■ ■ ■ ■ ■ ■ ■ ■ ● ●
Japan ■ ■ ● ●
Korea ■ ■ ■ ■ ■ ■ ■ ● ●
Luxembourg ■ ■ ● ● ■ ■ ● ● ● ●
Mexico ■ ■ ■ ■ ■ ■ ■ ■ ■ ■
Netherlands ■ ■ ■ ● ● ● ●
New Zealand ■ ■ ■ ■ ■ ■ ■ ■ ◗ ◗
Norway ■ ■ ◗ ◗ ◗ ◗ ■ ■ ● ●
Poland ■ ■ ■ ■ ■ ■ ■ ■ ● ●
Portugal ■ ■ ■ ■ ■ ■ ● ● ● ●
Slovak Republic ■ ■ ■ ■ ■ ■ ■ ■ ● ●
Slovenia ■ ■ ■ ■ ■ ■ ● ●
Spain ■ ■ ■ ■ ◗ ◗ ◗ ◗ ■ ■
Sweden ■ ■ ■ ■ ■ ■ ● ●
Switzerland ■ ■ ■ ■ ■ ■ ■ ■ ■ ■
Turkey ■ ◗ ■ ◗ ◗ ● ◗ ● ◗ ●
United Kingdom ■ ■ ■ ■ ■ ■ ■ ■ ■ ■
United States X X X X XEuropean Union
OECD Total■ For all regulations 30 22 26 16 30 24 24 17 6 6
For major regulations 2 6 3 8 0 5 3 8 1 2◗ For some regulations 0 4 1 7 3 3 3 3 2 1● Never 1 2 3 3 0 2 3 6 24 25X Not applicable 1 0 1 0 1 0 1 0 1 0
Source: OECD (forthcoming), Regulatory Policy Outlook 2015 based on the 2014 OECD Regulatory Indicators Survey results.1 2 http://dx.doi.org/10.1787/888933248940
8.6. The oversight of RIA, 2014
Government body outside the ministry sponsoring the regulationresponsible for reviewing the quality of the RIA exists
An oversight body can return RIA where deemed inadequate
Primary laws Subordinate regulations
AUS, AUT, BEL, CAN, CZE, DNK, EST, FRA, DEU, GRC, ISL, ITA,KOR, LUX, MEX, NDL, NZL, POL, SVK, ESP, SWE, CHE, TUR,
GBR, USA, European Unoin
AUS, AUT, CAN, CZE, EST, FRA, DEU, ISL,ITA, KOR, MEX, NDL, NZL, POL, SVK,
ESP, GBR, European Union
AUS, AUT, CAN, CZE, EST, FRA, DEU, ITA,KOR, MEX, NDL, NZL, SVK, ESP,
GBR, USA, European Union
26 18 17
Source: OECD (forthcoming), Regulatory Policy Outlook 2015 based on the 2014 OECD Regulatory Indicators Survey results.1 2 http://dx.doi.org/10.1787/888933248955
GOVERNMENT AT A GLANCE 2015 © OECD 2015 129

8. REGULATORY GOVERNANCE
Ex post evaluation of regulation
The evaluation of existing laws and regulations throughex post impact analysis is necessary to ensure that they areeffective and efficient. In the absence of a systematicreview process, the overall burden of complying with regu-lations tends to increase over time. This complicates thedaily life of citizens and impedes the efficient functioningof business. Ex post evaluation can be the final stage of theregulatory policy cycle, evaluating the extent to which reg-ulations met the goals they were designed for. It can also bethe initial point to understand the impacts, shortcomingsand advantages of a policy or regulation in place, and toprovide feedback for the design of new regulations.
The practice of ex post evaluation has stagnated acrossOECD member countries (Figure 8.7). Still, only some20 countries report having a mandatory requirement forex post evaluation in 2014. Similarly, automatic evaluationrequirement practices have not increased substantiallysince 2008/09. By contrast, sunsetting (the automatic repealof regulations a certain number of years after they havecome into force) is an area where country practices aredeveloping. Overall, however, very few OECD membercountries have actually deployed ex post evaluationsystematically. It is positive to note that some countries,such as the Czech Republic, have conducted an ex post eval-uation exercise in the last three years although ex post eval-uation is not mandatory. Yet there remain a few countriesthat have not conducted any ex post evaluation in the lastthree years despite being mandatory to do so.
The scope of existing requirements for ex post evaluation inOECD member countries seems to be quite limited(Table 8.8): requirements for periodic ex post evaluation, theuse of sunsetting and automatic evaluation requirementsoften only apply to some primary laws, i.e. they do notcover the entire body of regulations for which a systematicex post evaluation process would be relevant.
When conducting ex post evaluations, only about half ofOECD member countries report to include an assessmentof the achievement of the goals of regulations and comparethe actual vs. predicted regulatory impacts (Table 8.8). Thisdemonstrates that the general understanding of ex postevaluation remains low among OECD member countries, asone of the main purposes of ex post evaluation is to mea-sure the outcome of the regulation in relation to the initialpolicy objective. Instead, many OECD member countriesthat have conducted ex post evaluations in the past 12 yearsreport their evaluations to have been based on administra-tive burdens and compliance cost calculations (e.g. Icelandand Israel), so the focus still lies on partial ex post assess-ment of regulatory burdens.
An evaluation of legal consistency is part of ex post evalua-tions in fewer OECD member countries. Seventeen coun-tries require ex post evaluations to consider the consistencyof regulations and take steps to address areas of overlap,duplication or inconsistency, and only about a third ofOECD member countries require an assessment of the con-
sistency of regulations with comparable international stan-dards and rules. A potential innovative form of ex postevaluation could involve cross-country comparisons of reg-ulatory frameworks. This method to appraise the perfor-mance of the domestic regulatory environment consists ofcomparing regulations, regulatory processes and their out-comes across countries, regions or jurisdictions. For exam-ple, Australia and New Zealand carried out a cross-jurisdictional performance benchmarking of their businessregulation for food safety in 2009.
Further reading
OECD (forthcoming), Regulatory Policy Outlook 2015, OECD,Paris.
OECD (2012), “International Practices on ex post Evalua-tion”, in Evaluating Laws and Regulations: The Case of theChilean Chamber of Deputies, OECD, Paris, pp. 9-26, http://dx.doi.org/10.1787/9789264176263-en.
OECD (2012), Recommendation of the Council on Regulatory Policyand Governance, OECD, Paris, www.oecd.org/gov/regulatory-policy/2012-recommendation.htm.
Figure and table notes
8.5: Data for the question “Do regulations include automatic evaluationrequirements?” refers to primary laws only for 2005 and for Chile,Estonia, Israel and Slovenia for 2008/09. Data for 2005 are not avail-able for Chile, Estonia, Israel and Slovenia. Therefore, the figure isbased on data for 30 OECD countries and the European Commissionfor 2005, and 34 OECD countries and the European Commissionfor 2008/09 and 2014.
Information on data for Israel: http://dx.doi.org/10.1787/88932315602.
Methodology and definitions
For 2014, the indicators draw upon country responsesto the 2014 OECD Regulatory Indicators Survey for allOECD member countries and the European Commis-sion. For previous years, the indicators draw uponcountry responses to the OECD Regulatory Manage-ment Systems’ Indicators Survey conducted in 2005and 2008 for the 30 OECD member countries and theEuropean Commission, and in 2009 for the four coun-tries that joined the OECD in 2010 (Chile, Estonia,Israel and Slovenia). Responses for all years were pro-vided by delegates to the OECD Regulatory PolicyCommittee and central government officials.
Primary laws are regulations which must be approvedby the legislature, while subordinate regulations canbe approved by the head of government, by an indi-vidual minister or by the cabinet.
GOVERNMENT AT A GLANCE 2015 © OECD 2015130
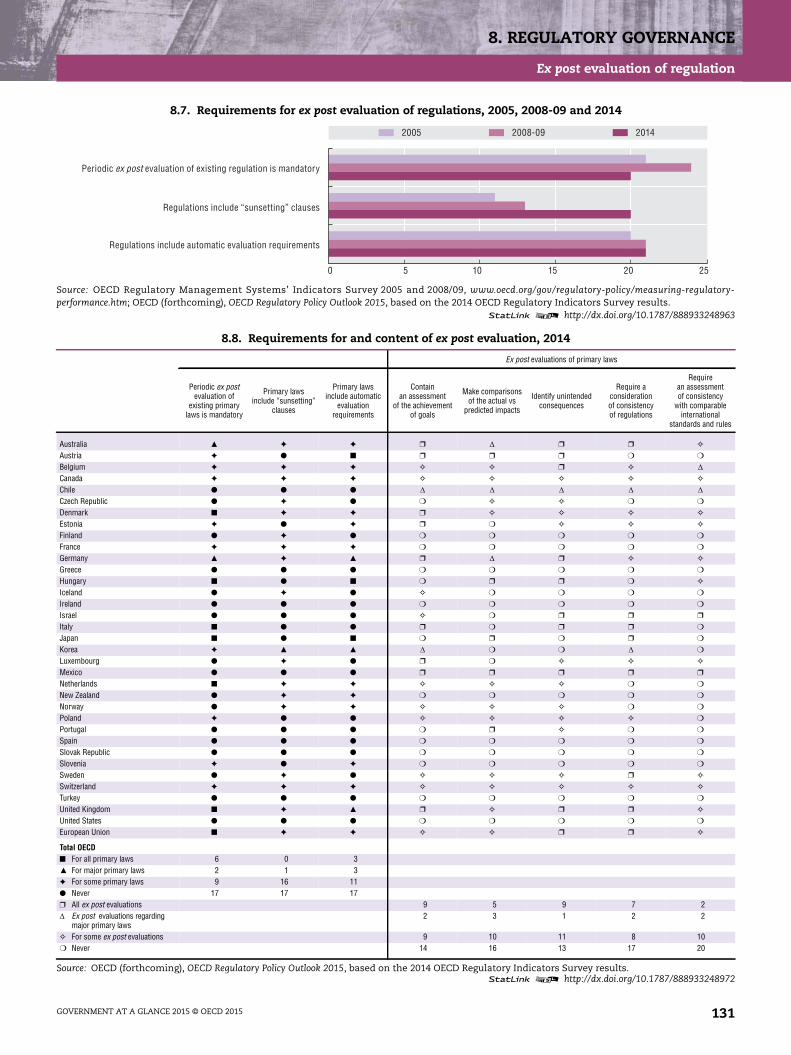
8. REGULATORY GOVERNANCE
Ex post evaluation of regulation
8.7. Requirements for ex post evaluation of regulations, 2005, 2008-09 and 2014
Source: OECD Regulatory Management Systems’ Indicators Survey 2005 and 2008/09, www.oecd.org/gov/regulatory-policy/measuring-regulatory-performance.htm; OECD (forthcoming), OECD Regulatory Policy Outlook 2015, based on the 2014 OECD Regulatory Indicators Survey results.
1 2 http://dx.doi.org/10.1787/888933248963
8.8. Requirements for and content of ex post evaluation, 2014
Ex post evaluations of primary laws
Periodic ex postevaluation of
existing primarylaws is mandatory
Primary lawsinclude “sunsetting”
clauses
Primary lawsinclude automatic
evaluationrequirements
Containan assessment
of the achievementof goals
Make comparisonsof the actual vs
predicted impacts
Identify unintendedconsequences
Require aconsiderationof consistencyof regulations
Requirean assessmentof consistency
with comparableinternational
standards and rules
Australia ✦ ✦ ❒ ❒ ❒ ✧
Austria ✦ ● ■ ❒ ❒ ❒ ❍ ❍
Belgium ✦ ✦ ✦ ✧ ✧ ❒ ✧
Canada ✦ ✦ ✦ ✧ ✧ ✧ ✧ ✧
Chile ● ● ●
Czech Republic ● ✦ ● ❍ ✧ ✧ ❍ ❍
Denmark ■ ✦ ✦ ❒ ✧ ✧ ✧ ✧
Estonia ✦ ● ✦ ❒ ❍ ✧ ✧ ✧
Finland ● ✦ ● ❍ ❍ ❍ ❍ ❍
France ✦ ✦ ✦ ❍ ❍ ❍ ❍ ❍
Germany ✦ ❒ ❒ ✧ ✧
Greece ● ● ● ❍ ❍ ❍ ❍ ❍
Hungary ■ ● ■ ❍ ❒ ❒ ❍ ✧
Iceland ● ✦ ● ✧ ❍ ❍ ❍ ❍
Ireland ● ● ● ❍ ❍ ❍ ❍ ❍
Israel ● ● ● ✧ ❍ ❒ ❒ ❒
Italy ■ ● ● ❒ ❍ ❒ ❒ ❍
Japan ■ ● ■ ❍ ❒ ❍ ❒ ❍
Korea ✦ ❍ ❍ ❍
Luxembourg ● ✦ ● ❒ ❍ ✧ ✧ ✧
Mexico ● ● ● ❒ ❒ ❒ ❒ ❒
Netherlands ■ ✦ ✦ ✧ ✧ ✧ ❍ ❍
New Zealand ● ✦ ✦ ❍ ❍ ❍ ❍ ❍
Norway ● ✦ ✦ ✧ ✧ ✧ ❍ ❍
Poland ✦ ● ● ✧ ✧ ✧ ✧ ❍
Portugal ● ● ● ❍ ❒ ✧ ❍ ❍
Spain ● ● ● ❍ ❍ ❍ ❍ ❍
Slovak Republic ● ● ● ❍ ❍ ❍ ❍ ❍
Slovenia ✦ ● ✦ ❍ ❍ ❍ ❍ ❍
Sweden ● ✦ ● ✧ ✧ ✧ ❒ ✧
Switzerland ✦ ✦ ✦ ✧ ✧ ✧ ✧ ✧
Turkey ● ● ● ❍ ❍ ❍ ❍ ❍
United Kingdom ■ ✦ ❒ ✧ ❒ ❒ ✧
United States ● ● ● ❍ ❍ ❍ ❍ ❍
European Union ■ ✦ ✦ ✧ ✧ ❒ ❒ ✧
Total OECD■ For all primary laws 6 0 3
For major primary laws 2 1 3✦ For some primary laws 9 16 11● Never 17 17 17❒ All ex post evaluations 9 5 9 7 2
Ex post evaluations regardingmajor primary laws
2 3 1 2 2
✧ For some ex post evaluations 9 10 11 8 10❍ Never 14 16 13 17 20
Source: OECD (forthcoming), OECD Regulatory Policy Outlook 2015, based on the 2014 OECD Regulatory Indicators Survey results.1 2 http://dx.doi.org/10.1787/888933248972
0 5 10 15 20 25
2005 2008-09 2014
Regulations include automatic evaluation requirements
Regulations include “sunsetting” clauses
Periodic ex post evaluation of existing regulation is mandatory
GOVERNMENT AT A GLANCE 2015 © OECD 2015 131
8. REGULATORY GOVERNANCE
Governance of regulators
Regulators are bodies that are empowered by law and haveregulatory powers to achieve policy outcomes such as thesecurity of food, public health or the provision of electricity orwater to consumers. They play a key role in the overall gover-nance of a sector, service or industry through the delivery ofgovernment policies and regulations to achieve positive out-comes for society, the environment and the economy. Havingthe right governance structures, good regulatory practicesand institutional arrangements in place is not only importantfor the performance of the regulator, but it also assists to cre-ate and maintain trust in public institutions and more gener-ally in the rule of law. This includes the regulator’s legalobjectives, powers, accountability requirements and the regu-lator’s independence from undue influence.
Data on regulatory management practices in network sec-tors was gathered as part of the 2013 update of the OECD’sproduct market regulation (PMR) database and as part of asurvey of water regulators (OECD, 2015). The PMR databasecontains information on regulatory structures and policiesacross OECD countries. Based on the PMR dataset the de juregovernance structures (independence, accountability and scopeof action) for regulators in network sectors vary across theelectricity, gas, telecommunications, rail transport, air trans-port and ports sectors in OECD member countries. OverallItaly, Germany and the United Kingdom appear to have thestrongest governance arrangements across OECD membercountries. Across the sectors, the governance structuresappear to be strongest in telecommunications, gas and elec-tricity, and weakest in the ports sector. There also tends tobe a positive association between countries that have a com-paratively strong governance structure in one sector andhaving better governance in the other sectors.
Independent regulators, separate from government minis-tries, with adjudicatory, rule-making or enforcementpowers are more common in the electricity, gas and tele-communications sectors among all OECD member coun-tries. However there are more regulators housed inside agovernment ministry (ministerial regulator) in these sec-tors in non-EU OECD member countries (Table 8.9) which ismainly due to mandatory requirements under EU law forhaving an independent regulator. The description of regu-lators as “referees” of the market seems to hold well asamong the most common actions or powers for regulatorsis to mediate (84% of all regulators) and take final decisionsbetween market actors (85% of all regulators), such as bythe Electricity Authority of New Zealand, and Autorita perle Garanzie Nelle Comunicazioni in Italy (telecommunica-tions). Also among the least common actions or powers ofregulators are the issuing of sanctions and penalties (67%of all regulators), and enforcing compliance with industrystandards and regulatory commitments (58% of all regula-tors). Regulators with these powers include the Authorityfor Consumers and Markets in the Netherlands and theCommission de régulation de l’énergie in France.
Network sector regulators are mostly accountable to thegovernment or the legislature (parliament or congress) andmost have requirements to have mechanisms for transpar-ency through the publication of reports on their activities,
regulatory decisions, resolutions and agreements, andthrough public consultations. Water regulators, forinstance, show a strong culture of consultation, both withregulated entities and the public at large before any regula-tory determination. Their regulatory decisions are also gen-erally underpinned by an economic assessment of thecosts and benefits (Table 8.10).
Further reading
OECD (2014), The Governance of Regulators, OECD Best Prac-tice Principles for Regulatory Policy, OECD, Paris, http://dx.doi.org/10.1787/9789264209015-en.
OECD (2015), The Governance of Water Regulators, OECD Stud-ies on Water, OECD, Paris, http://dx.doi.org/10.1787/9789264231092-en.
OECD (2012), Recommendation of the Council on Regulatory Policyand Governance, OECD, Paris, www.oecd.org/gov/regulatory-policy/2012-recommendation.htm.
Table note
Information on data for Israel: http://dx.doi.org/10.1787/88932315602.
Methodology and definitions
The data on regulatory governance of network sectorregulators in electricity, gas, telecoms, rail transport,air transport and ports was gathered as part ofthe 2013 update of the OECD’s product market regula-tion (PMR) database. The database is populatedthrough a questionnaire of around 1 400 questions, ofwhich about 300 were about regulatory managementpractices in the network sectors. The respondents tothe survey were central government official co-ordi-nators and the coverage rate of the dataset is 90% andfor many countries 100%. Countries with a rather lowcoverage rate include Japan (35%), Luxembourg (46%)and Canada (58%), typically because the questionswere not answered for the seven sectors. Verificationof the answers were through designated country offi-cials, delegates of the Regulatory Policy Committeeand Network of Economic Regulators in April 2014.
The data on water regulators was collected as part ofa survey carried out in close co-operation with thewater regulators of the Network of Economic Regula-tors between 2013 and 2014. It aimed to complementthe information collected on other sectors throughthe PMR and to provide the first sector application ofthe Best Practice Principles for the Governance of Reg-ulators. Thirty four regulators responded to the sur-vey in OECD and non OECD member countries.
Figure 8.11. Participants in the OECD survey on thegovernance of water regulators is available online athttp://dx.doi.org/10.1787/888933249004.
GOVERNMENT AT A GLANCE 2015 © OECD 2015132

8. REGULATORY GOVERNANCE
Governance of regulators
8.9. How is the status of regulatory agencies best described in network sectors? 2013
Regulator is an independent body with adjudicatory,rule-making or enforcement powers
Regulator is a ministerial departmentor agency
Regulator is an independent bodywith a purely advisory role
Netw
ork
sect
or
Electricity AUS, AUT, BEL, CHL, CZE, DNK, EST, FIN, FRA,DEU, GRC, HUN, IRL, ITA, LUX, MEX, NLD, NZL,NOR, POL, PRT, SVK, SVN, ESP, SWE, CHE, TUR,
GBR, ZAF, BGR, HRV, LVA, LTU, MLT, ROM
ISL, JPN, KOR, RUS ISR
Gas AUS, AUT, BEL, CZE, DNK, EST, FIN, FRA, DEU,GRC, IRL, ISR, ITA, LUX, MEX, NLD, NZL, POL,PRT, SVK, SVN, ESP, SWE, TUR, GBR, IND, ZAF,
BGR, HRV, LVA, LTU, MLT, ROM
CHL, HUN, JPN, KOR, NOR, BRA, RUS
Telecommunications AUS, AUT, BEL, CAN, CZE, DNK, EST, FIN,FRA, DEU, GRC, HUN, ISL, IRL, ITA, NLD,
NZL, NOR, POL, PRT, SVK, SVN, ESP, SWE,CHE, TUR, GBR, BRA, IND, RUS, ZAF, BGR,
HRV, LVA, LTU, MLT, ROM
CHL, ISR, KOR, MEX, NOR
Rail AUS, AUT, DNK, EST, FIN, FRA, DEU, GRC,HUN, LUX, NDL, NOR, POL, PRT, SVK, ESP,
SWE, GBR, LVA, ROM
CAN, CZE, ISR, ITA, KOR, MEX, SVN,TUR, BRA, RUS, LTU
BEL, CHE, BGR, HRV
Air transport AUS, BEL, IRL, ITA, NLD, NZL, NOR,POL, PRT, SWE, GBR, HRV, MLT
AUT, CAN, CHL, DNK, EST, FIN, FRA, GRC, HUN,ISR, KOR, MEX, SVN, CHE, BRA, RUS, ZAF, BGR
ESP
Ports AUS, CAN, ITA, KOR, NDL, ZAF, LTU AUT, CHL, DNK, EST, GRC, ISR, MEX, PRT, SVN,ESP, CHE, TUR, BRA, RUS, BGR, MLT
IND, HRV
Source: OECD Product Market Regulation (PMR) dataset.1 2 http://dx.doi.org/10.1787/888933248986
8.10. Use of tools of regulatory quality by water regulators, 2014
Requirement to consult with regulatedentities before making a regulatory
determination
Requirement to conduct publicconsultation before makinga regulatory determination
Economic assessment of the costsand benefits is required to justify
a regulatory decision
Obligation to conduct ex postevaluation of existing regulations
SystematicallyDone on anad hoc basis
No AlwaysDone on anad hoc basis
No SystematicallyIn somecases
NoFor all
regulationsFor certainregulations
Not required
AustraliaCapital territory ● ● ● ●
New South Wales ● ● ● ●
Victoria ● ● ● ●
Western Australia ● ● ● ●
BelgiumFlanders ● ● ● ●
Chile ● ● ● ●
Estonia ● ● ● ●
Hungary ● ● ● ●
Ireland ● ● ● ●
Italy ● ● ● ●
Portugal ● ● ● ●
United KingdomEngland and Wales ● ● ● ●
Northern Ireland ● ● ● ●
Scotland ● ● ● ●
United StatesHawai ● ● ● ●
Maine ● ● ● ●
Ohio ● ● ● ●
Pennsylvania ● ● ● ●
Tennessee ● ● ● ●
West Virginia ● ● ● ●
Colombia ● ● ● ●
Latvia ● ● ● ●
Source: OECD (2014), Survey on the Governance of Water regulators.1 2 http://dx.doi.org/10.1787/888933248997
GOVERNMENT AT A GLANCE 2015 © OECD 2015 133

GOVERNMENT AT A GLANCE 2015 © OEC
9. PUBLIC PROCUREMENT
Size of public procurement
Strategic public procurement
E-procurement
Central purchasing bodies
D 2015 135

9. PUBLIC PROCUREMENT
Size of public procurement
Public procurement refers to the purchase by governmentsand state-owned enterprises of goods, services and worksand represents a significant amount of government expendi-ture. In 2013, governments spent, on average, 29% of the totalgeneral government expenditure on public procurementcompared to an average level of 30% in 2009. As public pro-curement accounts for a substantial portion of the taxpayers’money, governments are expected to carry it out efficientlyand with high standards of conduct in order to ensure highquality of service delivery and safeguard the public interest.
The size of public procurement varies across OECD coun-tries, ranging from less than 20% of the general governmentexpenditure in Greece and Portugal to more than 35% incountries such as Estonia, Korea and Japan. In terms of GDP,OECD countries reported an average share of 12.1% spent onpublic procurement in 2013; however, some countries suchas Ireland and Switzerland spent less than 10% of their GDPon public procurement whereas in countries such asFinland, France, Japan, the Netherlands and Sweden the fig-ure was higher than 15% of their GDP. Allocating govern-ment expenditures efficiently and strategically could help togenerate fiscal space, which in turn could enable the realiza-tion of fiscal savings or reallocation of resources.
Public procurement at the state and local levels accountson average for 63% of total procurement spending acrossOECD countries. In general, federal states report high levelof sub-central government spending on procurement, asevidenced by Canada (87%) and Belgium (84%). Nonethe-less, unitary states should also direct their efforts toincrease efficiency in public procurement at thesub-central government levels as high levels of sub-centralgovernment spending on procurement are observed incountries such as Italy (78%), Finland (70%) and Japan (68%).
Further reading
OECD (2015), Recommendation of the Council on Public Procure-ment, OECD, Paris.
OECD (2014), Going Green: Best Practices for Green Procurement,OECD, Paris.
OECD (2013), “Implementing the OECD Principles for Integ-rity in Public Procurement: Progress since 2008”, OECDPublic Governance Reviews, OECD, http://dx.doi.org/10.1787/9789264201385-en.
Figure notes
9.1: Data for Chile and Turkey are not available. Data for Colombia andRussia are for 2012 rather than 2013
9.2: Data for Australia, Chile and Turkey are not available. Local govern-ment is included in state government for the United States. Socialsecurity funds are included in central government in Ireland,New Zealand, Norway, the United Kingdom and the United States.Data for Colombia are for 2012 rather than 2013.
Information on data for Israel: http://dx.doi.org/10.1787/88932315602.
Methodology and definitions
The size of general government procurement spend-ing is estimated using data from the OECD NationalAccounts Statistics (database), based on the Systemof National Accounts (SNA). General government pro-curement is defined as the sum of intermediate con-sumption (goods and services purchased bygovernments for their own use, such as accounting orinformation technology services), gross fixed capitalformation (acquisition of capital excluding sales of
fixed assets, such as building new roads) and socialtransfers in kind via market producers (purchases bygeneral government of goods and services producedby market producers and supplied to households).
Government procurement here includes the values ofprocurement for central, state and local governments.The sub-central component refers to state and localgovernments. Social security funds have beenexcluded in this analysis, unless otherwise stated inthe notes (however Figure 9.3, Government procure-ment as a share of total government expenditures,2007, 2009 and 2013 and Figure 9.4 Government pro-curement by levels of government including socialsecurity funds, 2013 are available online at http://dx.doi.org/10.1787/888933249035 and http://dx.doi.org/10.1787/888933249047 respectively). State govern-ment is only applicable to the nine OECD federalstates: Australia, Austria, Belgium, Canada, Germany,Mexico, Spain (considered a quasi-federal country),Switzerland and United States. Public corporationswere also excluded in the estimation of procurementspending.
GOVERNMENT AT A GLANCE 2015 © OECD 2015136
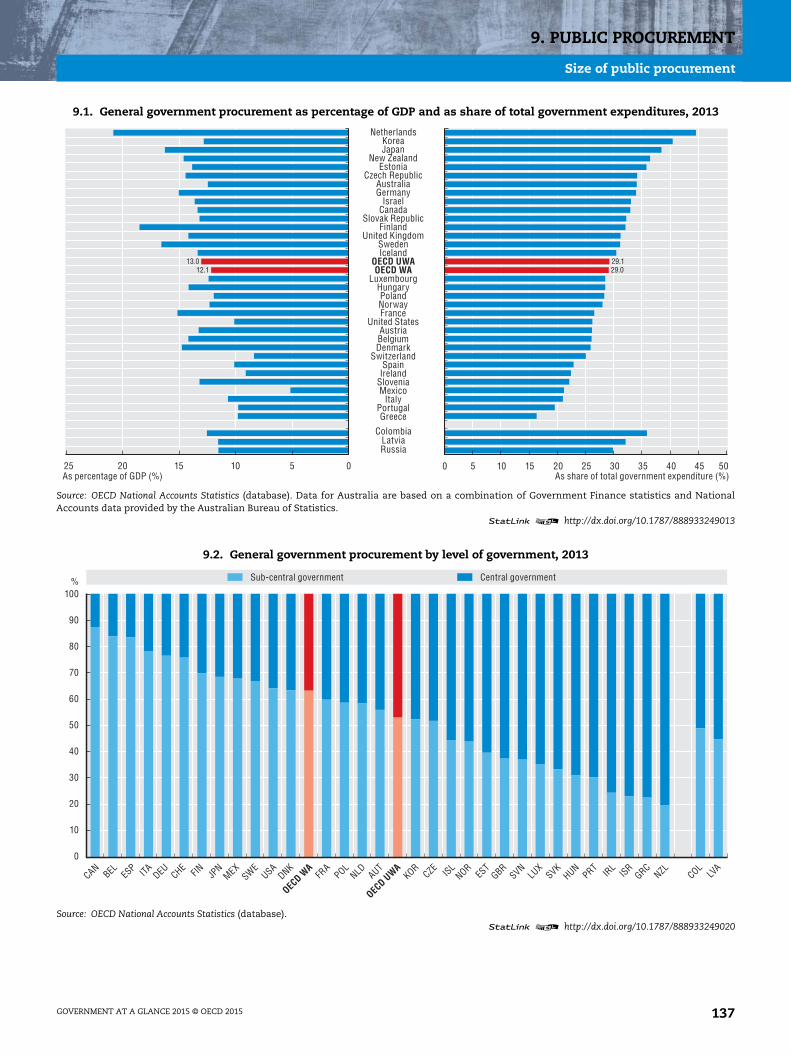
9. PUBLIC PROCUREMENT
Size of public procurement
9.1. General government procurement as percentage of GDP and as share of total government expenditures, 2013
Source: OECD National Accounts Statistics (database). Data for Australia are based on a combination of Government Finance statistics and NationalAccounts data provided by the Australian Bureau of Statistics.
1 2 http://dx.doi.org/10.1787/888933249013
9.2. General government procurement by level of government, 2013
Source: OECD National Accounts Statistics (database).1 2 http://dx.doi.org/10.1787/888933249020
0 5 10 15 20 25 30 35 40 45 500510152025
29.029.1
12.113.0
As share of total government expenditure (%)As percentage of GDP (%)
Russia
ColombiaLatvia
Netherlands
MexicoItaly
PortugalGreece
Slovenia
Poland
OECD UWA
NorwayFrance
United States
BelgiumAustria
DenmarkSwitzerland
SpainIreland
Luxembourg
Iceland
Czech RepublicAustraliaGermany
New Zealand
CanadaIsrael
Slovak RepublicFinland
United KingdomSweden
OECD WA
Hungary
Estonia
KoreaJapan
0
10
20
30
40
50
60
70
80
90
100% Sub-central government Central government
CANBEL ES
P ITA DEU CHE FIN JPN
MEXSWE
USADNK
OECD W
AFR
APOL
NLD AUT
OECD U
WAKOR
CZENORISL
EST
GBRSVN
LUX
SVKHUN
PRTIR
LISR
GRCNZL COL
LVA
GOVERNMENT AT A GLANCE 2015 © OECD 2015 137

9. PUBLIC PROCUREMENT
Strategic public procurement
While efficiency and cost effectiveness are among the pri-mary objectives of public procurement, governments arealso increasingly using it to pursue additional secondarypolicy objectives. Secondary policy objectives could includepromoting sustainable green growth, the development ofsmall and medium-sized enterprises, innovation, stan-dards for responsible business conduct or broader indus-trial policy objectives, through their procurement policies.
The vast majority of OECD countries surveyed use public pro-curement as a tool to implement policies or strategies to fos-ter secondary policy objectives. In fact, 30 of them (94%),including Chile, Germany and Japan, have developed strate-gies or policies to support green public procurement, SMEsand/or innovative goods and services. Only twoOECD countries – Estonia and the Slovak Republic – havenever developed a public procurement strategy or a policy toaddress secondary policy objectives at the central level.
In sharp contrast, the number of OECD countries thatreport measuring the results of their strategies or policiesto promote environmental or socio-economic objectives issignificantly lower and exhibits differences between thepolicy objectives. Among the OECD countries surveyed whohave a strategy or policy developed at the central level or byprocuring entities (line ministries), 20 OECD countries (69%)including Belgium, Portugal, Sweden and the United Statesmeasure the results of their strategy or policy to supportgreen public procurement. 18 OECD countries (62%), in par-ticular, Australia, Poland, and Slovenia, measure the resultsof their strategy or policy to support SMEs. Only 11 OECDcountries (39%) including Canada, Korea and theUnited Kingdom measure the impact of their policy orstrategy to foster innovative goods and services.
For those countries that are not measuring the results oftheir strategies, the main challenges include the lack ofdata, as mentioned by, among others, Greece and Germany.Other countries such as Chile mentioned the lack of anappropriate methodology to measure the impact of theirpolicies supporting green public procurement and SMEs.Furthermore, insufficient incentives to measure the effectof policies and the lack of financial resources were men-tioned as constraints. In this context, the absence of a legalrequirement was also signalled as a factor hinderingthe measurement of green procurement and support forinnovative goods and services policies. For instance, Mex-ico and Norway acknowledged the absence of legal require-ment as the factors constraining the pursuit of thesemeasurements.
Further reading
OECD (2015), Recommendation of the Council on Public Procure-ment, OECD, Paris.
OECD (2013), “Implementing the OECD Principles for Integ-rity in Public Procurement: Progress since 2008”, OECDPublic Governance Reviews, OECD, Paris, http://dx.doi.org/10.1787/9789264201385-en.
OECD (2014), “Procurement – Green Procurement”,www.oecd.org/corruption/ethics/procurement-green-procurement.htm.
Figure notes
9.5: Data unavailable for the Czech Republic and Israel. InNovember 2014, the Norwegian Parliament decided that green publicprocurement will once again be under the responsibility of theAgency for Public Management and eGovernment (Difi).
9.6: Data unavailable for the Czech Republic and Israel. Estonia, Norwayand the Slovak Republic are not included for the figure on support forgreen public procurement since policies or strategies for strategicpublic procurement have not been developed or have beenrescinded. For the same reason, Estonia, Iceland and the SlovakRepublic are not included for support for SMEs and Estonia, Greece,Iceland and Slovak Republic for support for innovative goods andservices.
Methodology and definitions
Data were collected through 2014 OECD Survey onPublic Procurement. 32 OECD countries responded tothe survey, as well as Brazil, Colombia and Russia,accession countries.
Respondents to the survey were country delegatesresponsible for procurement policies at the centralgovernment level and senior officials in central pur-chasing bodies.
Secondary policy objective refers to any of a variety ofenvironmental and socio-economic objectives suchas green growth, the development of small andmedium-sized enterprises, innovation or standardsfor responsible business conduct achieved throughthe use of public procurement. Governments increas-ingly use procurement as a policy lever to supportsuch objectives, in addition to the primary objectivesof public procurement: delivering goods and servicesnecessary to accomplish government mission in atimely, economical and efficient manner.
Green public procurement is defined by the EuropeanCommission as “a process whereby public authoritiesseek to procure goods, services and works with areduced environmental impact throughout their lifecycle when compared to goods, services and workswith the same primary function that would otherwisebe procured.”
Innovative (goods/services) are those characterized bya new or significantly improved product or process.For an innovation to be considered as such, it needs tohave been implemented, which is interpreted as hav-ing been introduced on the market.
GOVERNMENT AT A GLANCE 2015 © OECD 2015138

9. PUBLIC PROCUREMENT
Strategic public procurement
9.5. Development of strategic public procurementby objective, 2014
Green publicprocurement
Support to SMEsSupport to innovativegoods and services
Australia ● ● ●
Austria ● ✦ ●
Belgium ✦● ● ●
Canada ✦● ● ●
Chile ✦● ✦● ●
Denmark ● ● ●
Estonia ❍ ❍ ❍
Finland ● ✦ ✦
France ✦● ✦● ✦●
Germany ● ● ●
Greece ✦● ● ❍
Hungary ✦ ● ●
Iceland ● ❍ ❍
Ireland ● ● ●
Italy ✦ ✦ ✦
Japan ● ● ●
Korea ● ● ●
Luxembourg ✦● ✦● ✦
Mexico ● ● ●
Netherlands ● ● ●
New Zealand ✦● ✦● ✦●
Norway ✦● ✦●
Poland ● ● ●
Portugal ● ✦ ✦
Slovak Republic ❍ ❍ ❍
Slovenia ✦● ● ●
Spain ✦● ✦● ✦●
Sweden ✦● ● ●
Switzerland ✦● ✦● ✦
Turkey ● ● ●
United Kingdom ● ● ●
United States ● ● ✦●
OECD total
✦ A strategy/policyhas beendeveloped bysome procuringentities
13 11 10
● A strategy/policyhas beendeveloped ata central level
27 25 23
A strategy/policyhas beenrescinded
1 0 0
❍ A strategy/policyhas never beendeveloped
2 3 4
Brazil ✦● ✦● ●
Colombia ✦ ● ●
Russia ❍ ● ❍
Source: OECD (2014) Survey on Public Procurement.1 2 http://dx.doi.org/10.1787/888933249055
9.6. Measuring results of strategic public procurement’spolicies/strategies, 2014
Source: OECD (2014) Survey on Public Procurement.1 2 http://dx.doi.org/10.1787/888933249069
Support for green public procurement
Support for SMEs
Support for innovative goods and services
No31.0%
Yes69.0%
Yes62.1%
No37.9%
Yes39.3%
No60.7%
Aust
riaBe
lgiu
mCa
nada
Denmark
Finland
France
Hungary
Italy
JapanKorea
Poland
NetherlandsPortugal
Slovenia
Spai
n
Swed
en
Switz
erla
nd
Turk
eyUnited Kingdom
United StatesAustraliaChile
Germany
Greece
Iceland
Ireland
Luxembourg
Mexico
New
Zealand
Aust
ralia
Belg
ium
Aust
ria
Franc
e
Hungary
Ireland
Italy
Japan
KoreaMexico
Netherlands
New Zealand
Poland
Slovenia
SpainTurk
ey
Unite
d Ki
ngdo
m
Unite
d Sta
tes
Canad
aChileDenmark
Finland
Germany
Greece
Luxembourg
NorwayPortugal
Sweden
Aust
ria
Belg
ium
Cana
da
France
Italy
Korea
Netherlands
New Zealand
SpainTurkey
United Kingdom
Australia
Chile
Denm
arkGerm
any
Hung
ary
Irelan
dJapanLuxembourg
Mexico
Norway
Poland
Portugal
Slovenia
SwedenSw
itzerlandU
nited States
Finl
and
Switzerland
GOVERNMENT AT A GLANCE 2015 © OECD 2015 139

9. PUBLIC PROCUREMENT
E-procurement
The use of digital technology in the public sector is a driverof efficiency and supports the effectiveness of policies byenabling more open, transparent, innovative, participatoryand trustworthy government. In this light, the use ofe-procurement, defined as the use of information and com-munications technologies in public procurement, not onlyincreases efficiency by facilitating access to public tenders,thereby increasing competition and decreasing administra-tive burdens, but can also improve transparency by holdingpublic authorities more accountable.
All OECD countries that responded to the survey announceprocurement opportunities and provide tender documentsthrough their e-procurement systems. Moreover, 94% ofthem are mandated by law to announce procurementopportunities and 78% to provide tender documentsthrough their e-procurement systems, such as in Belgium,Mexico and Portugal.
Functionalities at the beginning of the procurement cycle, inparticular publishing of procurement plans (84%), electronicsubmission of bids (84%) and e-tendering (84%), are providedin most OECD countries surveyed. In contrast, functionalitiesrelated to the end of the procurement cycle (except for notifi-cation of award (94%)) are provided by a smaller number ofOECD countries. For example, fewer countries, in particularAustria, Denmark and New Zealand, provide e-auctions (ine-tendering) (63%), ordering (66%), electronic submission ofinvoices (56%) and ex post contract management (41%)through their e-procurement systems. Furthermore, themajority of the countries that provide these functionalities intheir e-procurement systems are not obliged to do so by law,with the exception of electronic submission of invoices.
The main challenge faced by both procuring entities andpotential bidders and suppliers to use e-procurement sys-tems are low knowledge and skills of ICT (44%) as men-tioned by Hungary, Poland and the United States, amongother OECD countries who responded to the survey. Lowinnovative organisational culture (41%) and low knowledgeof the economic opportunities raised by e-procurementsystems (34%) were identified as additional challenges forprocuring entities as evidenced in countries includingGreece, and Spain. Related to potential bidders and suppli-ers, 13 OECD countries including Canada, Italy and Sloveniaidentified difficulties to understand or apply the proce-dures and difficulties in the use of the functionalities asadditional challenges (41%).
Further reading
OECD (2015), Recommendation of the Council on Public Procure-ment, OECD, Paris.
OECD (2013), “Implementing the OECD Principles for Integ-rity in Public Procurement: Progress since 2008”, OECDPublic Governance Reviews, OECD, Paris, http://dx.doi.org/10.1787/9789264201385-en.
Figure notes
9.7: Data unavailable for the Czech Republic and Israel. See Statlink forinformation on more functionalities.
9.8: Data unavailable for the Czech Republic and Israel. The challengesfor understanding or applying the procedure and for the use of func-tionalities are faced only by potential bidders/suppliers.
Methodology and definitions
Data were collected through 2014 OECD Survey onPublic Procurement that focused on strategic publicprocurement, e-procurement, central purchasingbodies, and public procurement at regional levels.Some 32 OECD countries responded to the survey, aswell as Brazil, Colombia and Russia. Respondents tothe survey were country delegates responsible forprocurement policies at the central government leveland senior officials in central purchasing bodies.
E-procurement refers to the integration of digitaltechnologies in the replacement or redesign ofpaper-based procedures throughout the procurementcycle.
Public procurement cycle refers to the sequence ofrelated activities, from needs assessment, throughcompetition and award, to payment and contractmanagement, as well as any subsequent monitoringor auditing.
More data on countries providing functionalities ine-procurement systems (Table 9.7) is available onlineat http://dx.doi.org/10.1787/888933249077.
GOVERNMENT AT A GLANCE 2015 © OECD 2015140
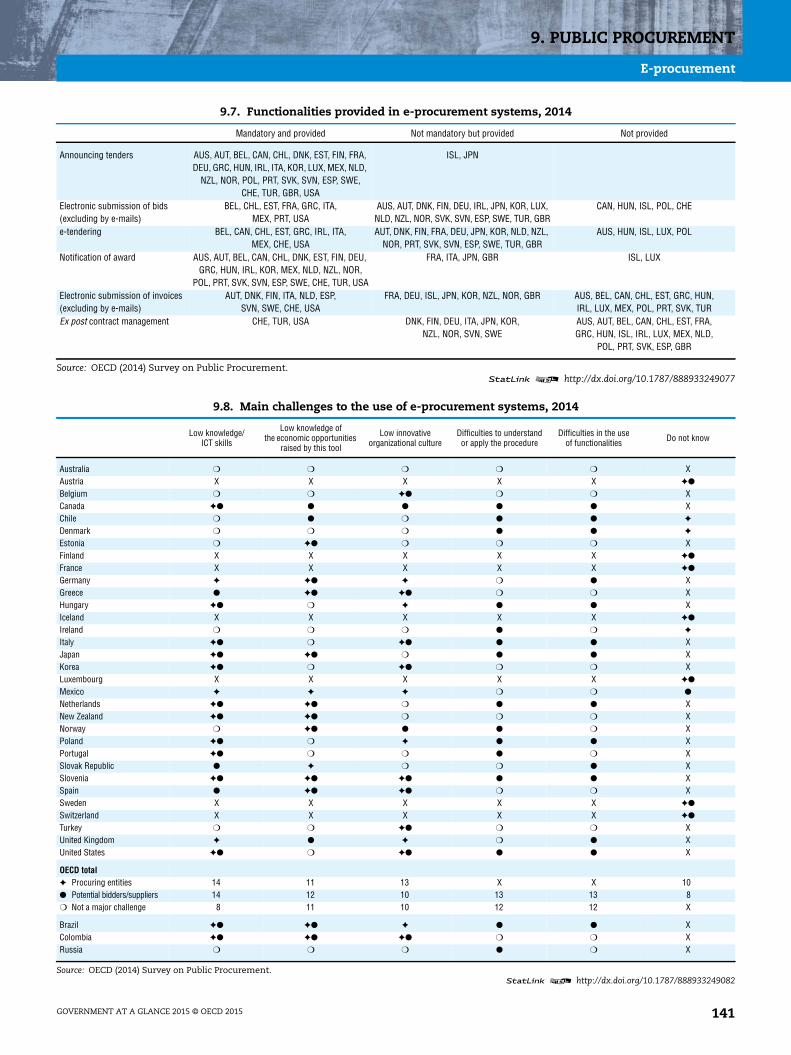
9. PUBLIC PROCUREMENT
E-procurement
9.7. Functionalities provided in e-procurement systems, 2014
Mandatory and provided Not mandatory but provided Not provided
Announcing tenders AUS, AUT, BEL, CAN, CHL, DNK, EST, FIN, FRA,DEU, GRC, HUN, IRL, ITA, KOR, LUX, MEX, NLD,
NZL, NOR, POL, PRT, SVK, SVN, ESP, SWE,CHE, TUR, GBR, USA
ISL, JPN
Electronic submission of bids(excluding by e-mails)
BEL, CHL, EST, FRA, GRC, ITA,MEX, PRT, USA
AUS, AUT, DNK, FIN, DEU, IRL, JPN, KOR, LUX,NLD, NZL, NOR, SVK, SVN, ESP, SWE, TUR, GBR
CAN, HUN, ISL, POL, CHE
e-tendering BEL, CAN, CHL, EST, GRC, IRL, ITA,MEX, CHE, USA
AUT, DNK, FIN, FRA, DEU, JPN, KOR, NLD, NZL,NOR, PRT, SVK, SVN, ESP, SWE, TUR, GBR
AUS, HUN, ISL, LUX, POL
Notification of award AUS, AUT, BEL, CAN, CHL, DNK, EST, FIN, DEU,GRC, HUN, IRL, KOR, MEX, NLD, NZL, NOR,
POL, PRT, SVK, SVN, ESP, SWE, CHE, TUR, USA
FRA, ITA, JPN, GBR ISL, LUX
Electronic submission of invoices(excluding by e-mails)
AUT, DNK, FIN, ITA, NLD, ESP,SVN, SWE, CHE, USA
FRA, DEU, ISL, JPN, KOR, NZL, NOR, GBR AUS, BEL, CAN, CHL, EST, GRC, HUN,IRL, LUX, MEX, POL, PRT, SVK, TUR
Ex post contract management CHE, TUR, USA DNK, FIN, DEU, ITA, JPN, KOR,NZL, NOR, SVN, SWE
AUS, AUT, BEL, CAN, CHL, EST, FRA,GRC, HUN, ISL, IRL, LUX, MEX, NLD,
POL, PRT, SVK, ESP, GBR
Source: OECD (2014) Survey on Public Procurement.1 2 http://dx.doi.org/10.1787/888933249077
9.8. Main challenges to the use of e-procurement systems, 2014
Low knowledge/ICT skills
Low knowledge ofthe economic opportunities
raised by this tool
Low innovativeorganizational culture
Difficulties to understandor apply the procedure
Difficulties in the useof functionalities Do not know
Australia ❍ ❍ ❍ ❍ ❍ XAustria X X X X X ✦●
Belgium ❍ ❍ ✦● ❍ ❍ XCanada ✦● ● ● ● ● XChile ❍ ● ❍ ● ● ✦
Denmark ❍ ❍ ❍ ● ● ✦
Estonia ❍ ✦● ❍ ❍ ❍ XFinland X X X X X ✦●
France X X X X X ✦●
Germany ✦ ✦● ✦ ❍ ● XGreece ● ✦● ✦● ❍ ❍ XHungary ✦● ❍ ✦ ● ● XIceland X X X X X ✦●
Ireland ❍ ❍ ❍ ● ❍ ✦
Italy ✦● ❍ ✦● ● ● XJapan ✦● ✦● ❍ ● ● XKorea ✦● ❍ ✦● ❍ ❍ XLuxembourg X X X X X ✦●
Mexico ✦ ✦ ✦ ❍ ❍ ●
Netherlands ✦● ✦● ❍ ● ● XNew Zealand ✦● ✦● ❍ ❍ ❍ XNorway ❍ ✦● ● ● ❍ XPoland ✦● ❍ ✦ ● ● XPortugal ✦● ❍ ❍ ● ❍ XSlovak Republic ● ✦ ❍ ❍ ● XSlovenia ✦● ✦● ✦● ● ● XSpain ● ✦● ✦● ❍ ❍ XSweden X X X X X ✦●
Switzerland X X X X X ✦●
Turkey ❍ ❍ ✦● ❍ ❍ XUnited Kingdom ✦ ● ✦ ❍ ● XUnited States ✦● ❍ ✦● ● ● X
OECD total✦ Procuring entities 14 11 13 X X 10● Potential bidders/suppliers 14 12 10 13 13 8❍ Not a major challenge 8 11 10 12 12 X
Brazil ✦● ✦● ✦ ● ● XColombia ✦● ✦● ✦● ❍ ❍ XRussia ❍ ❍ ❍ ● ❍ X
Source: OECD (2014) Survey on Public Procurement.1 2 http://dx.doi.org/10.1787/888933249082
GOVERNMENT AT A GLANCE 2015 © OECD 2015 141

9. PUBLIC PROCUREMENT
Central purchasing bodies
A central purchasing body is a contracting authority that:i) acquires goods or services intended for one or more con-tracting authorities; ii) awards public contracts for works,goods or services intended for one or more contractingauthorities; or, iii) concludes framework agreements forworks, goods or services intended for one or more contract-ing authorities. Large procurement volumes could reduceprices by achieving economies of scale as well as increasecompetition. Furthermore, they reduce duplication, trans-action costs, and increase certainty, simplicity and unifor-mity, allowing for more focused delivery of policy goals.
Central Purchasing Bodies (CPBs) have been implementedin an increasing number of the OECD countries asevidenced by the established CPBs for example in Chile,Estonia, and Luxembourg. In fact, with the exception ofAustralia, Japan, Mexico and the Netherlands, all OECDcountries that responded to the survey have establishedCPBs.
CPBs are embedded in the system of public administrationof each country and reflect the specific structures for theprovision of public services. Among the OECD countrieswho responded to have CPBs, almost all of them have aCPB(s) at the central level; while half of them also haveCPB(s) at the regional level. With regard to the legal statusof CPBs, 15.6% of OECD countries reported to have thesebodies which function as state-owned enterprises. This isevidenced by those in Finland, Italy and Turkey. However,the majority of CPBs in the OECD countries either operateunder a line ministry (28.1%) or function as a governmentagency (43.8%). In some countries, as in Ireland, a prelimi-nary discussion on the appropriate degree of independenceof the CPB is taking place.
Among the OECD countries surveyed, 78% of the CPBsundertake the role of acting as a contracting authorityaggregating demand and purchasing and as manager of thesystem for awarding framework agreements or other con-solidated instruments, from which contracting authoritiesthen order. In contrast, in fewer countries’ CPBs co-ordinatetraining for public officials in charge of public procurement(36%) and establish policies for contracting authorities (29%).CPBs in Greece, Ireland, Switzerland, the United Kingdomand the United States exercise all the above-mentionedfunctions whereas CPBs in nine OECD countries (32%) havea single role, e.g. in Estonia, Luxembourg and Poland.
The motivations reported to establish CPBs in OECD coun-tries include better prices of goods and services (100%),lower transaction costs (96%), improved capacity andexpertise (81%), increased legal, technical, economic andcontractual certainty (81%), and greater simplicity andusability (78%). Additionally, CPBs are increasingly playingan important role in the implementation of secondary pol-icy objectives. In fact, 54% of the CPBs in the OECD coun-tries surveyed include environmental consideration as
award criterion in more than half of the cases and smallernumbers of CPBs (25%) include support to SMEs in theirawarding criterion for more than half of the cases while36% do so rarely.
Further reading
OECD (2015), Recommendation of the Council on Public Procure-ment, OECD, Paris.
OECD (2013), “Implementing the OECD Principles for Integ-rity in Public Procurement: Progress since 2008”, OECDPublic Governance Reviews, OECD, Paris, http://dx.doi.org/10.1787/9789264201385-en.
Figure notes
9.9: The figure refers to the CPB at the central level where there existmultiple CPBs. Data are unavailable for the Czech Republic andIsrael. Some countries have several CPBs at the central level, as evi-denced by Germany. The Commonwealth of Australia does not havea CPB but the Department of Finance has established a number ofwhole of government arrangements. Some states and territories inAustralia have CPBs. In Mexico, the Ministry of Public Administrationhas the capacity to carry out certain functions as a CPB.
9.10: Data are unavailable for the Czech Republic and Israel. Australia,Japan, Mexico, the Netherlands and Russia do not have central pur-chasing bodies.
Methodology and definitions
Data were collected through 2014 OECD Survey on Pub-lic Procurement. 32 OECD countries responded to thesurvey, as well as Brazil, Colombia and Russia. Respon-dents to the survey were country delegates responsiblefor procurement policies at the central governmentlevel and senior officials in central purchasing bodies.
The nature of framework agreements varies by coun-try, but generally these are agreements between pro-curing entities and suppliers that establish certainterms and can facilitate the awarding of future con-tracts. Framework agreements are conducted intwo-stages: a first stage selects a supplier (or suppli-ers) or a contractor (or contractors) to be party (orparties) to a framework agreement with the procur-ing entity. In a second stage, a procurement contractis awarded under the framework agreement to a sup-plier or contractor party to the framework agree-ment.
Award of a procurement contract refers to the finalstage of the procurement resulting in the conclusionand entry into force of procurement between the pro-curing entity and selected supplier(s).
GOVERNMENT AT A GLANCE 2015 © OECD 2015142

9. PUBLIC PROCUREMENT
Central purchasing bodies
9.9. Legal status of central purchasing bodies, 2014
Source: OECD (2014) Survey on Public Procurement.1 2 http://dx.doi.org/10.1787/888933249096
Aust
ralia
Japa
nM
exico
Netherl
ands
Belgium
Canada
Greece
IrelandPolandSlovak RepublicSloveniaSpain
SwitzerlandChile
Denmark
EstoniaGer
man
y
Hung
ary
Kore
aLuxe
mbour
g
New Zeala
ndNorwayPortugal
Sweden
United Kingdom
United States
Austria
Finland
FranceItaly
Turkey
Government agency: 43.8%
Under ministry: 28.1%
No CPB: 12.5%State-owned enterprise: 15.6%
Icel
and
9.10. Role of central purchasing bodies, 2014
Contracting authority aggregatingdemand and purchasing
Manager of the national systemawarding framework agreementsor other consolidated instruments
Co-ordinate training for public officialsin charge of public procurement
Establish policiesfor contracting authorities
Austria ● ● ❍ ❍
Belgium ❍ ● ❍ ❍
Canada ● ● ❍ ❍
Chile ❍ ● ● ●
Denmark ❍ ● ❍ ●
Estonia ❍ ● ❍ ❍
Finland ● ● ❍ ❍
France ● ● ● ❍
Germany ● ❍ ❍ ❍
Greece ● ● ● ●
Hungary ● ● ❍ ❍
Iceland ❍ ● ● ❍
Ireland ● ● ● ●
Italy ● ● ❍ ❍
Korea ● ● ● ❍
Luxembourg ● ❍ ❍ ❍
New Zealand ● ● ● ❍
Norway ● ❍ ❍ ❍
Poland ● ❍ ❍ ❍
Portugal ● ● ❍ ❍
Slovak Republic ● ❍ ❍ ❍
Slovenia ● ● ❍ ❍
Spain ● ● ❍ ●
Sweden ❍ ● ❍ ❍
Switzerland ● ● ● ●
Turkey ● ❍ ❍ ❍
United Kingdom ● ● ● ●
United States ● ● ● ●
OECD total● Yes 22 22 10 8❍ No 6 6 18 20
Brazil ● ❍ ● ●
Colombia ❍ ● ● ●
Source: OECD (2014) Survey on Public Procurement.1 2 http://dx.doi.org/10.1787/888933249104
GOVERNMENT AT A GLANCE 2015 © OECD 2015 143


GOVERNMENT AT A GLANCE 2015 © OEC
10. DIGITAL GOVERNMENT
Social media use by governments
Digital government performance
Open government data
Use of e-government services by individuals and businesses
D 2015 145
10. DIGITAL GOVERNMENT
Social media use by governments
Presence and activity on social media is no longer a matterof choice for most governments as these platforms areused by large parts of the population and both formal andinformal interest groups. As of November 2014, the mainoffices of executive institutions (head of state, head of gov-ernment, or government as a whole) operated a Twitteraccount in 28 out of 34 OECD countries and maintained aFacebook page in 21 out of 34 countries. In addition to cen-tral governments, many ministries, agencies, or individualprograms have a social media presence, as do manyregional and local levels of government.
The top executive offices in the United Kingdom(@Number10gov) and Chile (@GobiernodeChile) have man-aged to build a community of Twitter followers thatequates to roughly 4% of the domestic population. Data onre-tweets, replies, favourites, etc. further illustrate thatthere is overall interest in at least some of governments’social media activities.
Nevertheless, the purpose and returns of social media useby government offices are not always clearly identified,which can lead to uncertainty on how to best leveragesocial media for strategic objectives and in day-to-dayoperations. In response, half of national governments inOECD countries have formulated a strategy or overarchingplan. Most governments still view social media as an addi-tional tool to broadcast traditional communication messagesand only a few try to genuinely leverage social media for moreadvanced purposes such as opening up public policy pro-cesses or transforming public service delivery. The success ofthe Spanish national police (@Policia) in these areas hasturned it into a global reference for law enforcement use ofsocial media. Some governments experiment with usingsocial media for internal purposes – e.g. Canada’sBlueprint 2020 engagement exercise, which reached tens ofthousands of civil servants through both public socialmedia platforms and purely internal ones like GCpedia andGCconnex.
Social media have the potential to make policy processesmore inclusive and thereby increase trust between govern-ments and citizens. But there is no “one size fits all”approach as context and demand factors must be consid-ered to be effective. Research shows that social media usevaries across countries, e.g. by levels of education attainedin countries like Greece, Portugal, Turkey and theUnited Kingdom the social media use gap between peoplewith and without high formal education is quite large. Thechoice of social media platform itself is also critical asusage of individual platforms varies by countries, demo-graphic groups, etc.
It is therefore important to create effective measurementand benchmarking frameworks. Only a small minority ofgovernments systematically monitor or measure theimpacts of their social media activity. Some quantifiableinformation can be utilised to measure presence or popu-
larity of an institution on social media. But more qualita-tive information is needed to appraise penetration,perception and purpose-orientation of institutional socialmedia use.
Further reading
Androsoff, R. and Mickoleit, A. (2015), “Measuring govern-ment impact in a social media world”, OECD Insights blog,18 February, http://bit.ly/17giios.
Burson-Marsteller (2014), “Twiplomacy Study 2014”, http://twiplomacy.com.
Mickoleit, A. (2014), “Social Media Use by Governments: APolicy Primer to Discuss Trends, Identify Policy Opportu-nities and Guide Decision Makers”, OECD Working Paperson Public Governance, No. 26, OECD, http://dx.doi.org/10.1787/5jxrcmghmk0s-en.
Methodology and definitions
The figure compares social media popularity ofnational offices of either head of state, head of gov-ernment, or government as a whole. One country canhave a number of central government accounts basedon the system of government or to communicate indifferent languages. For each country only theaccount with most followers is displayed. The figureis based on Burson-Marsteller’s Twiplomacy datasetfrom June 2014 and presents only OECD and selectedpartner countries. To facilitate comparison, the num-ber of Twitter followers of each account are divided bythe size of the domestic population. Though the num-ber of followers may include foreign citizens, organi-zations, etc. this measure provides a baseline of theproportional reach of the account.
Based on the OECD survey on government use of socialmedia, conducted in 2013. Responses were receivedfrom 26 member countries as well as Colombia. Italyand Mexico provided responses in 2015. More detailsin Mickoleit, A. (2014).
Based on the Eurostat survey on “ICT usage by individ-uals”. To differentiate the take-up of social media, thesurvey uses different categories of educational attain-ment based on the International Standard Classifica-tion of Education (ISCED). “High formal education”refers to ISCED levels 5 or 6; “low or no formal educa-tion” refers to ISCED levels 0, 1 or 2. Countries areordered by size of the difference between the two mea-sures. More information: http://ec.europa.eu/eurostat/cache/metadata/EN/isoc_bde15c_esms.htm.
GOVERNMENT AT A GLANCE 2015 © OECD 2015146

10. DIGITAL GOVERNMENT
Social media use by governments
10.1. Central government Twitter followers(most followed offices of either government,head of government or head of state in OECD
and partner countries), 2014
Source: Burson-Marsteller’s Twiplomacy database (2014); and OECDcalculations based on World Bank population data for 2013.
1 2 http://dx.doi.org/10.1787/888933249115
0 1 2 3 4 5%
(GBR) @Number10gov(CHL) @GobiernodeChile
(TUR) @tccankaya(USA) @WhiteHouse
(NLD) @MinPres(NOR) @Kronprinsparet
(ISR) @IsraeliPM(MEX) @PresidenciaMX
(JPN) @Kantei_Saigai(GRC) @PrimeministerGR
(SVN) @vladaRS(PRT) @presidencia
(ESP) @desdelamoncloa(FRA) @Elysee
(LUX) @CourGrandDucale(IRL) @merrionstreet
(KOR) @bluehousekorea(ITA) @Palazzo_Chigi
(POL) @PremierRP(FIN) @valtioneuvosto(DEU) @RegSprecher
(CZE) @strakovka(EST) @StenbockiMaja
(BEL) @MonarchieBe(CHE) @BR_Sprecher(ISL) @forsaetisradun
(CAN) @PMwebupdates(HUN) @kormany_hu
(RUS) @KremlinRussia(LVA) Rigas_pils
(COL) @infopresidencia(ZAF) @PresidencyZA
(IND) PMOIndia(IDN) @IstanaRakyat(BRA) @imprensaPR
10.2. Central government social media strategies,internal use and measurement, 2013
Has a strategyor objectives?
Uses social mediainternally?
Uses metricsor indicators?
Australia + + +
Austria + + -
Belgium + ❍ ❍
Canada + + +
Chile + - +
Czech Republic - - -
Denmark - - -
Estonia - + -
Finland + + -
France + ❍ +
Iceland - - -
Ireland + - -
Italy + + ❍
Japan - - -
Korea + + -
Mexico + + +
Netherlands + + ❍
New Zealand - + ❍
Norway - - -
Poland - + ❍
Portugal - ❍ -
Slovenia - + -
Spain - - -
Sweden - - -
Switzerland - - -
Turkey + - -
OECD Total 13 (50%) 12 (46%) 5 (19%)
Colombia + + +
Note: “+” means “Yes”, “-“means “No”, “❍” means “Don’t know”. Italyand Mexico information is for 2015.Source: Mickoleit, A. (2014), “Social Media Use by Governments: A PolicyPrimer to Discuss Trends, Identify Policy Opportunities and GuideDecision Makers”, OECD Working Papers on Public Governance, No. 26,OECD, http://dx.doi.org/10.1787/5jxrcmghmk0s-en.
1 2 http://dx.doi.org/10.1787/888933249126
10.3. Share of social media users within population groups with different educational attainment levels, 2014
Source: Author’s calculations based on Eurostat survey “ICT usage by individuals” (2014).1 2 http://dx.doi.org/10.1787/888933249139
0
20
40
60
80
100% No or low formal education
TURGRC
PRTGBR
HUNES
P IRL ITA SVN
CZEFR
ABEL AUT
POL FIN SVKSWE
EST
NLD ISLNOR
LUX
DNKCHE
DEU LVA
High formal education
GOVERNMENT AT A GLANCE 2015 © OECD 2015 147

10. DIGITAL GOVERNMENT
Digital government performance
Information and communication technologies (ICT)increasingly underlie all government activities. Govern-ments in OECD countries spend up to 2% of their budgetson IT (OECD, 2013). Although the share might appear small,it includes many large and therefore risky projects.
The 2014 OECD Survey on Digital Government Performancefound that from a sample of only 23 countries there were579 government ICT projects with budgets of over 10 mil-lion USD, and of those, more than half of the countriesresponding (representing approximately 44% of the 579projects identified) had an average project duration of morethan three years. This suggests that many countries aremanaging large, complex ICT projects that have high fail-ure risks but also a greater propensity to exceed their initialbudgets compared to smaller government projects.
The long history of ICT project failures due to technical,organisational and other reasons can greatly underminethe confidence that citizens have in the ability of their gov-ernments to produce value for money. On the other hand,when an ICT system is successfully introduced, govern-ments in OECD countries are still unable to fully measureand report accurately their total financial and non-financial benefits.
The majority of OECD countries are able to report andaccount for no more than 25% of direct financial benefitsrealised through ICT projects. Only Denmark, Korea, andthe United Kingdom estimate that they can report almostall financial benefits realised through ICT projects. WhileICT systems have the potential to deliver better public ser-vices, enable citizens to engage more openly with publicinstitutions and improve government operations, theabsence of measurable benefits (in addition to the high costand risk associated) makes it difficult to build a businesscase for future investments, to get sustainable support andfunding, and to make transparent and evidence-baseddecisions between alternative delivery options.
Countries are addressing these challenges in various ways.Around half of OECD countries have a standardised busi-ness case model in place across central government for ICTinvestments. Its use is mandatory in 22% of countries; andin another 37% of countries it is mandatory if certain crite-ria, such as expenditure thresholds, are met. Governmentsoften link the use of a business case with enhanced reviewsand oversight for high-risk ICT projects. The Danish Coun-cil for ICT Projects for example determines risk factors forany project that surpasses DKK 10 million (approximatelyEUR 2 million) and mandates enhanced project oversightwhere necessary. The 2014 OECD Recommendation on Dig-ital Government Strategies is explicit about the importanceof such governance mechanisms and advocates systematic
structured approach to mitigate risk and monitor closelyICT projects performance for more effective and efficientdigital government reforms.
Further reading
Jones-Parry, R. and A. Robertson (eds.) (2013), “Overspend?Late? Failure? What the Data Says about IT Project Riskin the Public Sector”, in Commonwealth Governance Hand-book: Democracy, Development, and Public Administration,Commonwealth Secretariat, London, pp. 145-147.
OECD (2014), “Recommendation on Digital Government Strat-egies”, OECD, Paris, www.oecd.org/gov/public-innovation/recommendation-on-digital-government-strategies.htm.
OECD (2013), Government at a Glance 2013, OECD, Paris, http://dx.doi.org/10.1787/gov_glance-2013-en.
Figure notes
10.4: Estonia, Iceland, Luxembourg, Slovenia, Colombia and Latviareported no central government ICT projects with a total project valuegreater than USD 10 million. Data for Austria, Belgium, Canada,Germany, Greece, Ireland, Israel, Korea, Portugal, Slovak Republic,Norway, Turkey, and the United States are not available.
Methodology and definitions
Data for the three figures come from the 2014 OECDSurvey on Digital Government Performance. The sur-vey collected responses from 26 OECD countries aswell as Latvia and Colombia. Respondents were pre-dominantly chief information officers or their equiva-lent at central government.
Countries were asked to report on the number of cen-tral government ICT projects with total costs aboveUSD 10 million. Countries were also asked to providethe average planned project length for these large ICTprojects. Respondents who responded “not applica-ble” for average planned project length were notincluded in Figure 10.5.
Data for this figure are based on the responses to thefollowing question from the survey: “In general, whatshare of the full potential direct financial benefits(monetary value) of your current ICT projects do youestimate is actually being measured and followed upupon centrally?”
GOVERNMENT AT A GLANCE 2015 © OECD 2015148

10. DIGITAL GOVERNMENT
Digital government performance
10.4. Central government ICT projects with a total project value greater than USD 10 million, 2014
Source: OECD (2014), Survey on Digital Government Performance.1 2 http://dx.doi.org/10.1787/888933249145
0
20
40
60
80
100
140
120
AUSCHL
CZEDNK
EST FIN FR
AHUN ISL ITA JP
NLU
XMEX
NLD NZL POLSVN
ESP
SWECHE
GBRCOL
LVA
10.5. Average length of central government ICT projectswith a total project value greater than USD 10 million,
2014
Source: OECD (2014), Survey on Digital Government Performance.1 2 http://dx.doi.org/10.1787/888933249154
More then 36 months30-36 months
24-30 months
18-24 months
Mex
ico
Aust
ralia
Czech Republic
Finland
France
Hungary
Denmark
Italy
Nether
lands
New Zealand
Poland
Spain
Switzerland
United Kingdom
10.6. Share of total direct financial benefits from ICTinvestments that OECD governments report,
2014
Source: OECD (2014), Survey on Digital Government Performance.1 2 http://dx.doi.org/10.1787/888933249166
75-100%: 13.0%
50-75%: 17.4%
25-50%: 13.0%
0-25%: 56.5%Au
stra
lia
Aust
riaBelg
iumChile
Czech Republic
Finland
France
Germany
Iceland
Luxembourg
Netherlands
SwedenSw
itzer
land
Hung
aryMex
icoPoland
Estonia
Slovenia
Spain
New Zealand
DenmarkKorea
United Kingdom
GOVERNMENT AT A GLANCE 2015 © OECD 2015 149

10. DIGITAL GOVERNMENT
Open government data
The public sector produces and collects a wealth of data inits day-to-day activities. By making these data available,easily accessible and re-usable by citizens and businesses,governments can improve accountability and transparency,create new business opportunities and better inform bothcitizen engagement and their own decision-making.
The proactive release of Open government data (OGD) istransforming public services in health care, education,transport, security and environment (pollution, wastemanagement) at the national and sub-national levels. Theproliferation of mobile phone applications using geospatialdata is just one example of how data empower citizens andbusinesses by improving access and generating new ser-vices based on public data. In 2013, G8 countries adoptedthe first international instrument to guide the implemen-tation of OGD strategies. The G8 Open Data Charter definesa series of five principles: 1) open data by default; 2) qualityand quantity data; 3) usable by all; 4) releasing data forimproved governance and; 5) releasing data for innovation,as well as three collective actions to guide the implementa-tion of those principles.
The OECD has begun to assist governments in developingand implementing OGD strategies, notably through thedevelopment of a framework and related set of indicatorsto monitor their implementation and impact (Ubaldi, 2013).Out of the 30 OECD countries that responded to the 2014OECD survey on OGD 25 have a dedicated comprehensivestrategy on OGD at the Central/federal level and a vastmajority (29) have developed a national open data portal,with the exception of Turkey.
Moving beyond the adoption of strategies and the creation ofportals, the OECD has created its own set of indicators,based on its methodology and structured around the G8Open Data Charter. As a first step in producing a compre-hensive measure of the level of implementation of the G8Open Data Charter, the OECD pilot Index on Open govern-ment data assesses governments’ efforts to implement opendata in three dimensions: 1. Data availability on the nationalportal (based on principle 1 and collective action 2); 2. Dataaccessibility on the national portal (based on principle 3) and3. Governments’ support to innovative re-use and stake-holder engagement (principle 5). The only principle not cov-ered in this year’s index is Principle 4: Releasing Data forimproved governance value (e.g. transparency) as existingmeasurement efforts have focused primarily on socio eco-nomic value creation. In the future, the OECD will furtherextend this indicator and create other indicators to recog-nise all of the potential benefits of open data, including theeconomic, social and good governance aspects.
Bringing the three dimensions together in a compositeindex, government open data efforts in 2014 were the high-est in Korea, France, the United Kingdom, Australia,Canada and Spain whereas they were lowest in Poland.Some countries like Switzerland, Estonia, the Netherlands,Sweden and Finland are currently undertaking importanttransformations of their OGD central/federal portal whichmay not show up in this 2014 index.
In general, countries which rank the highest on the indexalso report a higher number of re-use and applications cre-ation on their OGD national portal. For instance countrieslike Korea, France, the United Kingdom and Canada reportrespectively 407, 73, 363, and 207 initiatives (apps phone,APIs etc.) re-using public data (OECD Survey on Open Gov-ernment Data, 2014). Many reasons can explain higher lev-els of re-use of public data including for instance thenumber and quality of computer scientists in each country,the greater tendency to promote re-use initiatives of publicdata on the national portal or the existence of a moremature OGD ecosystem.
Further reading
G8 (2013), “Open Data Charter”, Lough Erne, UK, www.gov.uk/government/publications/open-data-charter/g8-open-data-charter-and-technical-annex.
Ubaldi, B. (2013), “Open Government Data: Towards Empiri-cal Analysis of Open Government Data Initiatives”, OECDWorking Papers on Public Governance, No. 22, OECD, Paris,http://dx.doi.org/10.1787/5k46bj4f03s7-en.
Figure notes
10.7: Data for the Czech Republic, Iceland, Israel and Luxembourg arenot available.
10.8: Data for the Czech Republic, Hungary, Iceland, Israel and Luxembourgare not available. This year’s index is a “pilot” version (see Annex Efor full methodology) covering the following dimensions: data acces-sibility and data availability on the national data portal, and govern-ment’s efforts to support data re-use.
Methodology and definitions
The data come from the 2014 OECD Survey on OpenGovernment Data. Survey respondents were predom-inantly chief information officers in OECD countriesand two candidate countries (Colombia and Latvia).Responses represent countries’ own assessments ofcurrent practices and procedures regarding open gov-ernment data. Data refer only to central/federal gov-ernments and exclude open government datapractices at the state/local levels.
The composite index is based on the G8 Open DataCharter principles and on the methodology described inOECD work (Ubaldi, 2013). The OECD pilot index onOpen Government Data contains 19 variables that coverinformation on three dimensions: i) Data availability onthe national portal; ii) Data accessibility on the nationalportal and iii) Government support to innovative re-useof public data and stakeholder engagement. The indexdoes not purport to measure the overall quality of theopen government data approach/strategy in each coun-try. Annex E contains a description of the methodologyused to construct this index.
GOVERNMENT AT A GLANCE 2015 © OECD 2015150
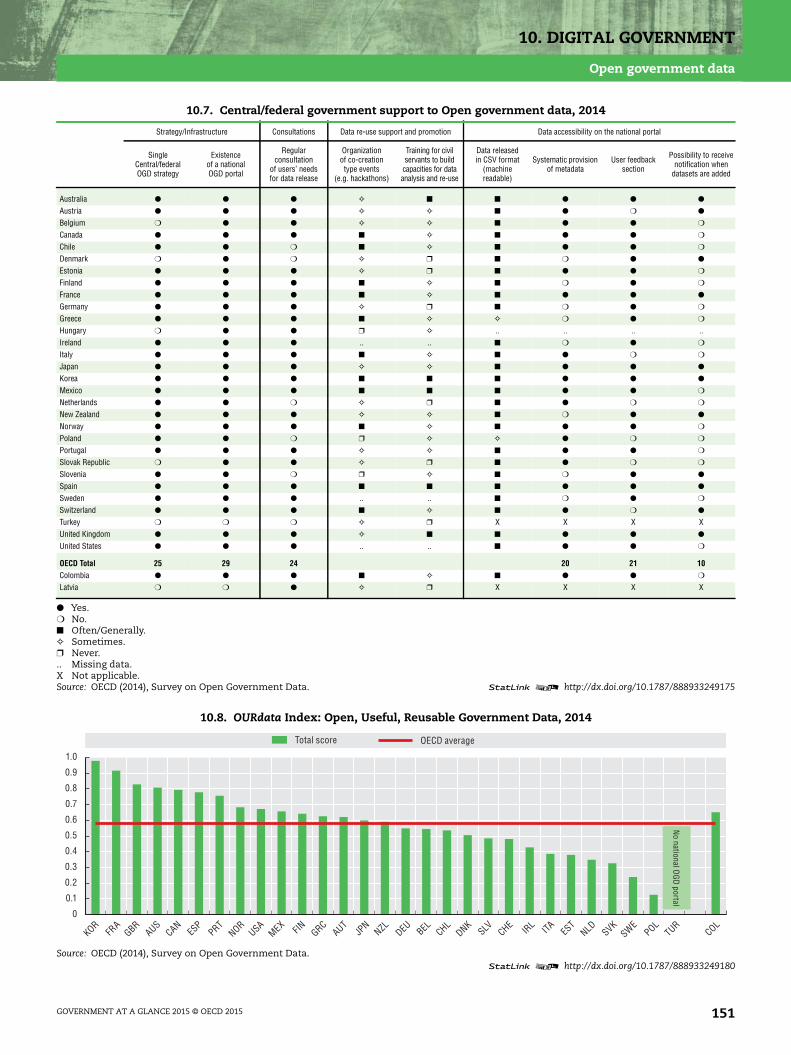
10. DIGITAL GOVERNMENT
Open government data
10.7. Central/federal government support to Open government data, 2014
Strategy/Infrastructure Consultations Data re-use support and promotion Data accessibility on the national portal
SingleCentral/federalOGD strategy
Existenceof a nationalOGD portal
Regularconsultation
of users’ needsfor data release
Organizationof co-creationtype events
(e.g. hackathons)
Training for civilservants to build
capacities for dataanalysis and re-use
Data releasedin CSV format
(machinereadable)
Systematic provisionof metadata
User feedbacksection
Possibility to receivenotification when
datasets are added
Australia ● ● ● ✧ ■ ■ ● ● ●
Austria ● ● ● ✧ ✧ ■ ● ❍ ●
Belgium ❍ ● ● ✧ ✧ ■ ● ● ❍
Canada ● ● ● ■ ✧ ■ ● ● ❍
Chile ● ● ❍ ■ ✧ ■ ● ● ❍
Denmark ❍ ● ❍ ✧ ❒ ■ ❍ ● ●
Estonia ● ● ● ✧ ❒ ■ ● ● ❍
Finland ● ● ● ■ ✧ ■ ❍ ● ❍
France ● ● ● ■ ✧ ■ ● ● ●
Germany ● ● ● ✧ ❒ ■ ❍ ● ❍
Greece ● ● ● ■ ✧ ✧ ❍ ● ❍
Hungary ❍ ● ● ❒ ✧ .. .. .. ..Ireland ● ● ● .. .. ■ ❍ ● ❍
Italy ● ● ● ■ ✧ ■ ● ❍ ❍
Japan ● ● ● ✧ ✧ ■ ● ● ●
Korea ● ● ● ■ ■ ■ ● ● ●
Mexico ● ● ● ■ ■ ■ ● ● ❍
Netherlands ● ● ❍ ✧ ❒ ■ ● ❍ ❍
New Zealand ● ● ● ✧ ✧ ■ ❍ ● ●
Norway ● ● ● ■ ✧ ■ ● ● ❍
Poland ● ● ❍ ❒ ✧ ✧ ● ❍ ❍
Portugal ● ● ● ✧ ✧ ■ ● ● ❍
Slovak Republic ❍ ● ● ✧ ❒ ■ ● ❍ ❍
Slovenia ● ● ❍ ❒ ✧ ■ ❍ ● ●
Spain ● ● ● ■ ■ ■ ● ● ●
Sweden ● ● ● .. .. ■ ❍ ● ❍
Switzerland ● ● ● ■ ✧ ■ ● ❍ ●
Turkey ❍ ❍ ❍ ✧ ❒ X X X XUnited Kingdom ● ● ● ✧ ■ ■ ● ● ●
United States ● ● ● .. .. ■ ● ● ❍
OECD Total 25 29 24 20 21 10Colombia ● ● ● ■ ✧ ■ ● ● ❍
Latvia ❍ ❍ ● ✧ ❒ X X X X
● Yes.❍ No.■ Often/Generally.✧ Sometimes.❒ Never... Missing data.X Not applicable.Source: OECD (2014), Survey on Open Government Data. 1 2 http://dx.doi.org/10.1787/888933249175
10.8. OURdata Index: Open, Useful, Reusable Government Data, 2014
Source: OECD (2014), Survey on Open Government Data.1 2 http://dx.doi.org/10.1787/888933249180
0
0.1
0.2
0.3
0.4
0.5
0.6
0.7
0.8
0.9
1.0
Total score
KORFR
AGBR
AUSCAN
ESP
PRTNOR
USAMEX FIN GRC
AUTJP
NNZL DEU BEL CHL
DNKSLV CHE
IRL ITA ES
TNLD SVK
SWEPOL
TURCOL
OECD average
No national O
GD portal
GOVERNMENT AT A GLANCE 2015 © OECD 2015 151

10. DIGITAL GOVERNMENT
Use of e-government services by individuals and businesses
Government portals that provide a wide range of informa-tion and services like the possibility to fill out and submitadministrative forms electronically (e.g. tax declarations)have considerably transformed the way individuals andbusinesses interact with their government.
In OECD countries in 2014, 49% of individuals used theInternet to obtain information from public authorities and33% have filed administrative forms electronically. Individ-uals in Nordic countries report the highest uptake of e-gov-ernment services whereas the uptake in Chile and Italy andPoland is lower.
The use of e-government services by businesses is higherthan the uptake for individuals. This might reflect the factthat in many countries the use of the digital channel ismandatory for businesses. On average across the OECDin 2013, 83% of businesses reported having used the Inter-net to obtain information/forms from their public authori-ties and 78% have returned a filled form online. Nordiccountries, but also countries like France and Ireland, reporta high level of uptake whereas it is lower in Canada (wheredata on sending filled forms only refer to tax declarations),Switzerland, Germany and Mexico.
A growing number of businesses in OECD European coun-tries also use e-procurement systems. E-procurement facil-itates access to public tenders and increases competition. Itcan also reduce costs to government by reducing adminis-trative burdens, shortening procurement contract cyclesand raising compliance levels. Among OECD Europeancountries in 2013, the percentage of businesses usinge-procurement systems goes from more than 35% inFinland and Slovenia for accessing documents to about 18%in Italy, Spain and Hungary. The use of e-tendering systemsis particularly high in Ireland (30%), Estonia (24%) andPoland (24%).
Greater uptake of e-government services and systems mayindicate a better quality of the overall e-government infra-structure, but not always. The percentage of householdswith Internet connection in the country, the general ten-dency of a population to interact with their authorities andother factors may also influence the level of e-governmentuptake.
Further reading
OECD (2014), Measuring the Digital Economy: A NewPerspective, OECD, Paris, http://dx.doi.org/10.1787/9789264221796-en.
Figure notes
Data for Japan and the United States are not available.
10.9: Data for Mexico are not available. For Australia, data refer to 2012/13(fiscal year ending in June 2013), and to individuals aged 15 and over.Data for Canada refer to 2012 for obtaining information and 2009 forsending filled forms. For New Zealand, data refer to 2012 for bothinteraction and sending filled forms. For Israel, data refer to 2009, andto all individuals aged 20 and over who used the Internet for obtainingservices online from government offices, including downloading orcompleting official forms. Data for Chile and Korea refer to 2012.
10.10: Data for Chile and Israel are not available. For Canada, Korea,Mexico, New Zealand and Switzerland, data for obtaining informa-tion/forms refer to the proportion of businesses interacting onlinewith government organisations for obtaining information/down-loading forms. For Australia, Korea, Mexico and New Zealand, datafor sending filled forms refer to the percentage of businesses inter-acting online with government organisations to complete/submitforms electronically. For Canada, data for returning completed formsrefer to enterprises that completed or submitted taxation formsonline. For Slovenia, outsourcing of contacts with public authoritiesvia accounting enterprises is included. For Australia, data refer to thefiscal year ending 30 June 2012 (2011/12) and the total includes Agri-culture, forestry and fishing. For Mexico, data refer to 2008 and tobusinesses with 20 or more persons employed. For Switzerland, datarefer to 2011 and to businesses with five or more persons employed.Data for Turkey refer to 2012.
10.11: Data for OECD non EU countries are not available.
Information on data for Israel: http://dx/doi/org/10.1787/88932315602.
Methodology and definitions
Data come from Eurostat, Information Society data-base and the OECD ICT database. Public authoritiesrefer to both public services and administration activ-ities (e.g. tax, customs, business registration andsocial security). Data cover the local, regional andnational level.
Three types of online interactions are reported:1) obtaining information; 2) obtaining or downloadingforms (only for businesses); and 3) sending filledforms. Interactions via e-mail are excluded. “Sendingfilled forms” relates to “sending filled forms to publicauthorities or public services over the Internet for pri-vate purposes in the last 12 months” for countries inthe European Statistical System, and to “completing/lodging filled in forms from government organisa-tions’ websites in the last 12 months” for other coun-tries. For Figure 10.9, individuals between 16 and74 years old are covered. For Figure 10.10, simpleinteractions include obtaining information or down-loading forms. When both data were available thehighest value was taken. For Figures 10.10 and 10.11,sector coverage consists of all activities in manufac-turing and non-financial market services. Only enter-prises with 10 or more persons employed areconsidered. For Figure 10.11, e-tendering refers tobusinesses using the Internet for offering goods orservices in e-procurement systems in their country.
GOVERNMENT AT A GLANCE 2015 © OECD 2015152

10. DIGITAL GOVERNMENT
Use of e-government services by individuals and businesses
10.9. Individuals using the Internet to interact with public authorities by type of activity (over the past 12 months), 2014
Source: OECD, ICT Database; and Eurostat, Information Society (database).1 2 http://dx.doi.org/10.1787/888933249196
0
10
20
30
40
50
60
70
80
90
100% Obtaining information Sending filled forms
DNK ISLSWE
NOR FIN CHENLD AUS
CANAUT
SVKDEU SVN
NZLOEC
DFR
AES
THUN
ESP
LUX
BEL IRL
GBRGRC
PRTCZE
ISRTUR
POL ITA CHLKOR
LVA
10.10. Businesses using the Internet to interact with public authorities by type of activity (over the past 12 months), 2013
Source: OECD, ICT Database; and Eurostat, Information Society (database).1 2 http://dx.doi.org/10.1787/888933249202
0
10
20
30
40
50
60
70
80
90
100% Obtaining information/forms Sending filled forms
ISL FIN SWECZE
FRA
DNK IRL
SVNSVK
NORTUR
NZL GBRLU
XAUT
HUNNLD
OECD
EST
PRTPOL
KOR ITA BEL GRCES
PMEX
CHEDEU CAN
AUSLV
A
10.11. Businesses using electronic procurement systems, 2013
Source: Eurostat, Information Society (database).1 2 http://dx.doi.org/10.1787/888933249211
0
5
10
15
20
25
30
35
40
45% Access tender documents and specifications E-tendering (in own country)
IRL
SVNFR
A FIN NORSWE ISL
POLPRT
DNKES
TAUT
SVKCZE
LUX
GBRNLD GRC
BEL DEU HUNES
P ITA LVA
GOVERNMENT AT A GLANCE 2015 © OECD 2015 153


GOVERNMENT AT A GLANCE 2015 © OEC
11. CORE GOVERNMENT RESULTS
Trust in government
Redistribution of income
Rule of law
Public sector efficiency
Public sector cost effectiveness
D 2015 155

11. CORE GOVERNMENT RESULTS
Trust in government
Trust is broadly understood as holding a positive percep-tion about the actions of an individual or an organisation.While trust may be based on actual experience, it is for themost part a subjective phenomenon, reflected in the eyesof the beholder. Trust in government represents the confi-dence of citizens and businesses in the actions of govern-ments to do what is right and perceived as fair. Mostimportantly the legitimacy of governments is built on beingtrusted by their citizens, as trust is mainly an enabler of flu-ent and effective interactions between governments andcitizens.
Existing measures of trust in government are based on per-ception surveys. Data from the Gallup World Poll is usedhere; this is the only survey that collects annual datasince 2005 for OECD countries as well as strategic partners.However, one of the shortcomings of this survey is that itonly asks a single question about whether or not peoplehave confidence in their national government. It does notdifferentiate between politicians and the bureaucracy norallow the identification of government actions that mightcause citizens to trust or distrust their government. As cul-tural factors have a large influence on the differences intrust levels across countries, rather than comparing abso-lute levels, the comparison of changes in trust levels overtime and across countries is presented. The years selectedare 2007 and 2014 (2007 being the last year before the finan-cial and economic crisis that started in 2008).
From 2007 to 2014 on average confidence in national gov-ernments across OECD countries declined 3.3 p.p. from45.2% to 41.8%. During this period the steepest declinestook place in Slovenia (30 p.p.), Finland (29 p.p.), Spain(27 p.p.) and Portugal (22 p.p.). However, some countriesexperienced increases in trust levels for the same period,notably Germany (25 p.p.), Israel (22 p.p.) and Iceland(22 p.p.). Changes in trust levels could be affected by manyfactors, including the economic outlook, political changes(e.g. elections) or other major events, such as disasters ormajor scandals (e.g. corruption cases). Moreover, expecta-tions by citizens could grow at a faster pace than govern-ment responses, challenging the confidence of citizens inthe ability of governments to react to new demands.
Preliminary evidence suggests that citizens’ trust in govern-ment reflects primarily their approval of their country’sleadership. Evidence also shows that trust in government isnegatively correlated with the perceived levels of corruptionin government. Misuse of public resources or inadequatebehaviour by government representatives shape publicopinion on the overall trustworthiness of government.
Restoring trust in governments is essential to reinforce andconsolidate the foundations of modern states. It is also anecessary condition for governments to successfully carryout public sector reforms. Better understanding of the driv-ers and dimensions of trust is required to disentangle itsmultidimensionality. Consequently, a refined measure-ment of trust in government and in public institutions isneeded to enable governments to propose and adjustactions aimed at regaining trust from their citizens.
Figure notes
11.1: Data refers to the percentage who answered “yes” to the question“Do you have confidence in national government” Data for Chile,Hungary and Iceland are 2013 rather than 2014.
11.2: Data for approval of country leadership represent the percentage of“approve” answers to the question: “Do you approve or disapprovethe job performance of the leadership in this country?” Data forCanada, Hungary, Iceland, Ireland, Japan, Korea and Mexico arefor 2013 rather than 2014.
11.3: Data for the perception of government corruption represent thepercentage of “yes” answers to the question “Is corruption wide-spread throughout the government or not?”. Data for Australia,Canada, Hungary, Iceland, Ireland, Japan, Korea and Mexico arefor 2013 rather than 2014.
Information on data for Israel: http://dx.doi.org/10.1787/888932315602.
Methodology and definitions
Data were collected by Gallup World Poll. The WorldPoll uses proportional stratified probability samplingand has a sample of 1000 citizens in each country.There is more information at: www.gallup.com/services/170945/world-poll.aspx.
GOVERNMENT AT A GLANCE 2015 © OECD 2015156

11. CORE GOVERNMENT RESULTS
Trust in government
11.1. Confidence in national government in 2014 and its change since 2007
Source: Gallup World Poll.1 2 http://dx.doi.org/10.1787/888933249225
-40
-20
0
20
40
60
80
100
-40
-20
0
20
40
60
80
100%
USAAUS
MEXAUT
FRA
CHLNLD BEL DNK
LUX IR
LCAN
GRCPRT
ESP FIN SVN
RUSID
NLV
ABRA
IND
COLZAF
DEU ISR ISLSVK
JPN
CHEKOR
HUNCZE
POLGBR
NZL NORTUR
SWEES
TITA
% in 2014 (right axis)
OECD
Percentage pointsPercentage points change since 2007 (left axis)
11.2. Correlation between confidence in national government and perception of government leadership, 2014
Source: World Gallup Poll.1 2 http://dx.doi.org/10.1787/888933249237
0
10
20
30
40
50
60
70
80
90
0 10 20 30 40 50 60 70 80 90 100Confidence in national government
R² = 0.8125
Approval of country leadership
AUTBEL CAN
CHLCZE
DNK
EST
FIN
FRA
DEU
GRC HUN
IRL
ISR
ITA
JPNKOR
LUX
MEX
NLD NZL
NOR
POLPRT
SVK
SVN ESP
SWE
CHE
TURGBR
USAAUS
ISL
OECD
11.3. Correlation between confidence in national government and perception of government corruption, 2014
Source: World Gallup Poll.1 2 http://dx.doi.org/10.1787/888933249244
0
10
20
30
40
50
60
70
80
90
100
0 10 20 30 40 50 60 70 80 90 100
R² = 0.7032
Government corruption
Confidence in national government
AUSAUTBEL
CAN
CHL
CZE
DNK
EST
FIN
FRA
DEU
GRC
HUNISL
ITA
JPN
KOR
LUX
MEX
NLDNZL NOR
POLPRT
SVKSVN
ESP
SWE
CHE
TURGBR
USA
OECD
ISR
IRL
GOVERNMENT AT A GLANCE 2015 © OECD 2015 157

11. CORE GOVERNMENT RESULTS
Redistribution of income
Among the main tasks of governments are guaranteeingthat citizens have equality of opportunity and even accessto basic public services. Governments should also assistthose experiencing poverty by ensuring the attainment of aminimum standard of living. Based on the societal agree-ment, governments could play a more or a less importantrole in income redistribution through taxes and transfers.For many OECD member countries, the gap between therichest and the poorest is at its highest in 30 years(OECD, 2014c). Additionally, recent evidence suggests thatinequality has a negative effect on economic growth(OECD, 2014a). By having fewer resources available peoplefrom disadvantaged social backgrounds underinvest ineducation, lowering social mobility and hampering skillsdevelopment that are crucial for economic growth(OECD, 2014c).
The Gini coefficient is the most commonly used measure ofinequality; it is aimed at representing the income distribu-tion of the population within a given country. It rangesfrom zero where everybody has identical incomes to 1where all the income goes to only one person. The effectsof the income redistribution policy of a government can bemeasured by comparing the Gini coefficient before andafter taxes and transfers. Between 2007 and 2011, on aver-age, income inequality before taxes in OECD countriesincreased by 1 percentage point (p.p.) from 0.46 to 0.47. Fol-lowing government intervention, the after taxes and trans-fers Gini coefficient fell to 0.31 in 2011, compared to 0.30in 2007, a stable decrease of around 16 p.p. for both years.In 2011 the largest reductions that could be attributed togovernment intervention by taxes and transfers took placein Ireland (26 p.p.) and Greece (22 p.p.), both countriesseverely affected by the global financial and economic cri-sis. Chile (2.9 p.p.) and Korea (3.1 p.p.) were the countriesachieving the least income redistribution through govern-ment intervention. However, in the case of Korea the levelof inequality was already low (0.34 before taxes and trans-fers).
Between 2007 and 2011 public transfers increased in all butfour countries; they declined in Greece, Hungary and Italyand remained stable in Sweden (OECD 2014b). On average,between 2007 and 2011, disposable income decreased by anannual average of 0.53%. However, while the averageannual pace of decrease for the top 10% income group was0.78%, the decline pace more than doubled for the bottom10% reaching on average 1.61% per year. Spain (11.4 p.p.)and Greece (3.7 p.p.) countries severely hit by the crisisexperienced the highest gaps in the pace of decreasebetween the incomes of the top 10% and the bottom 10%. InFrance, Austria, the United States, Denmark and Germanythe disposable income of the bottom 10% decreased whileit actually increased for the top 10%. It is possible to con-clude that on average lower income households sufferedmore during the crisis or have benefitted less from therecovery.
Further reading
OECD (2014a), “Focus on Inequality and Growth –December 2014”, OECD, Paris.
OECD (2014b), “Rising Inequality: Youth and Poor Fall Fur-ther Behind – Income Inequality Update – June 2014”,OECD, Paris.
OECD (2014c), “Focus on Top Incomes and Taxation in OECDCountries: Was the Crisis a Game Changer?”, OECD,Paris.
Figure notes
Data for Chile and Japan are 2006 rather than 2007. Data for France,Germany, Israel, Italy, Norway, Sweden and the United States arefor 2008 rather than 2007. Data for Belgium are 2010 ratherthan 2011. Data for Australia and The Netherlands are 2012 ratherthan 2011.
11.4: Data for Hungary and Mexico are not available. Data for Switzerlandand Turkey are not available for 2007.
11.5: Data for Australia and New Zealand are 2007 rather than 2008.Data for Japan are 2009 rather than 2011. Data for Austria are 2011rather than 2010. Data for Finland, Hungary, Korea, Mexico andthe United States are 2012 rather than 2011.There is a break in theseries in 2011 for the United Kingdom, and results are not strictlycomparable. 2011 data for Ireland and the United Kingdom are provi-sional. Data for Switzerland are not available.
Information on data for Israel: http://dx.doi.org/10.1787/888932315602.
Methodology and definitions
Redistribution is measured by comparing Gini coeffi-cient for market income (i.e. gross income notadjusted for public cash transfers and householdtaxes) and for disposable market income (i.e. net oftransfers and taxes). Household disposable income isthe total market income received by all householdmembers; gross earning, self-employment income,capital income plus the current transfers they receiveless the taxes and social security contributions theypay. It is adjusted for differences in the needs ofhouseholds of different sizes with an equivalencescale that divides household income by the squareroot of the household size. It does not take intoaccount in-kind transfers. The data have been drawnfrom the OECD Income Distribution Database (IDD)based on national sources (household surveys andadministrative records) and on common definitions,classifications and data treatments. The method ofdata collection used for the OECD IDD aims to maxi-mise internationally comparability as well as intertemporal consistency of data. This is achieved by acommon set of protocols and statistical conventionsto derive comparable estimates.
GOVERNMENT AT A GLANCE 2015 © OECD 2015158

11. CORE GOVERNMENT RESULTS
Redistribution of income
11.4. Differences in income inequality pre and post-tax and government transfers
Source: OECD Income Distribution Database.1 2 http://dx.doi.org/10.1787/888933249258
0
0.1
0.2
0.3
0.4
0.5
0.6
0
0.1
0.2
0.3
0.4
0.5
0.6
IRL
GRCBEL FIN AUT
SVNDEU LU
XCZE
FRA
PRTGBR ITA DNK
ESP
NORPOL
SWEES
TSVK ISL
NLD AUSNZL CAN
USAISR
CHETUR
KORCHL
IRL
AUT FIN DEU CZEBEL FR
ASVN
LUX ITA SVK
POLGRC
DNKSWE
GBRPRT
NORES
TES
PNZL NLD JP
N ISRCAN
USA ISLKOR
CHL
After taxes and transfers Before taxes and transfers
OECD
OECD
2007 Gini coefficient
2011 Gini coefficient
11.5. Annual percentage changes in household disposable income between 2007 and 2011 by income group
Source: OECD Income Distribution Database.1 2 http://dx.doi.org/10.1787/888933249269
-15
-10
-5
0
5%
Total Top 10% Bottom 10%
GRC ISLIR
LES
PMEX
PRTES
TGBR ITA NLD HUN
JPN
LUX
OECD
NZL SVNCZE
USAFR
ADNK
BEL DEU ISRAUS
CANNOR FIN TUR
KORAUT
SWECHL
POLSVK
GOVERNMENT AT A GLANCE 2015 © OECD 2015 159

11. CORE GOVERNMENT RESULTS
Rule of law
The principle of the rule of law refers to the authority andinfluence of law within a society. According to this princi-ple, the law should govern and no one, including the gov-ernment is above it. The rule of law is implementedthrough the existence of codified or standardised proce-dures and a series of mechanisms guaranteeing access,equality, predictability, reliability and accountability. It con-stitutes a key measure of good governance and it is crucialfor maintaining peace and order, as well as fosteringinvestment and development.
There are several interpretations of the rule of law. We usethe one developed for the World Justice Project’s (WJP) ruleof law index as one of the most comprehensive and sys-tematic approaches. Accordingly, the rule of law encom-passes four universal principles: “a) the government and itsofficials and agents are accountable under the law; b) thelaws are clear, publicised, stable and just; are appliedevenly; and protect fundamental rights, including the secu-rity of persons and property; c) the process by which thelaws are enacted, administered, and enforced is accessible,fair and efficient d) justice is delivered timely by compe-tent, ethical, and independent representatives and neutralswho are of sufficient number, have adequate resources andreflect the makeup of communities they serve.” Based onthese four principles the WJP developed nine key factorsthat form the basis of the rule of law index. From those wehave selected two that touch upon foundational compo-nents of the rule of law: constraint to government powersand the protection of fundamental rights.
Constrained government powers are guaranteed by aneffective system of checks and balances. More specifically,this factor refers to the definition of powers in the constitu-tion; an effective limitation of government powers by thelegislature, the judiciary and independent audit institu-tions; sanctions due to misconduct of justices and prosecu-tors; non-governmental checks; and a transition of powersubjected to law. With an average score of 0.76 OECD coun-tries score higher than other regions of the world in thiscomponent. However, there is some variation even withinOECD countries. The three top ranking countries are Scan-dinavian: Denmark, Finland and Norway demonstrate ahighly balanced distribution of authority within these soci-eties. On the other end government powers are less con-trolled in Mexico and Turkey. Among other major economicsRussia and China, score below the OECD average.
The second component is the protection of fundamentalrights. These rights are established under internationallaw: the right to equal treatment and the absence of dis-crimination; the right to life and security of the person; dueprocess of law and rights of the accused; freedom of opin-
ion and expression; freedom of belief and religion; theabsence of arbitrary interference with privacy; freedom ofassembly and association; and the protection of funda-mental labour rights. On average OECD countries have ascore of 0.78. Similar to the constraint to government pow-ers, Nordic countries perform best on this componentwhile Turkey and Mexico have lower scores. All in all, thereis a strong positive association between the constraint togovernment powers and the protection to fundamentalrights, showing a high degree of consistency in the applica-tion of these aspects of the rule of law in OECD countries.
Further reading
World Justice Project (2014), Rule of Law Index 2014. WJP,Washington. World Justice Project, Washington, DC,http : / /wor ld just i cepro jec t .org/s i tes/defaul t / f i l es/wjp_rule_of_law_index_2014_report.pdf.
Figure notes
Data for Iceland, Ireland, Israel, Luxembourg, the Slovak Republic andSwitzerland are not available. Data for Hungary are not displayed.
Information on data for Israel: http://dx.doi.org/10.1787/888932315602.
Methodology and definitions
Data are collected by the World Justice Project by a setof questionnaires, based on the rule of law index’sconceptual framework. The questionnaires areadministered to representative samples of the gen-eral public and legal experts. For the general public aprobability sample of 1000 respondents in the threelargest cities of each country was selected. In the caseof legal experts on average 24 experts per countrywere surveyed. The services of local polling compa-nies are engaged to administer the survey to the pub-lic. Data are available for 28 OECD countries as well aseight countries that are major economies. All vari-ables used to score each of the composite indicatorsare coded and normalised to range between 0 and 1,where 1 signifies the highest score and 0 the lowest.More detailed information on the selected factors oflimited government powers and fundamental rights isavailable online at: http://worldjusticeproject.org/factors/constraints-government-powers and http://worldjusticepro-ject.org/factors/fundamental-rights.
GOVERNMENT AT A GLANCE 2015 © OECD 2015160

11. CORE GOVERNMENT RESULTS
Rule of law
11.6. Limited government powers, 2015
Source: World Justice Project.1 2 http://dx.doi.org/10.1787/888933249272
0.0
0.1
0.2
0.3
0.4
0.5
0.6
0.7
0.8
0.91.0
FIN DNKNOR
SWEAUT
DEU NLD BEL NZL AUSES
TPRT
CZEGBR
CANFR
AOEC
DES
PPOL
JPN ITA CHL
KORUSA
GRCMEX
TURZAF
UKRBRA
COLIN
DID
NRUS
CHN
Index value
SVN
11.7. Fundamental rights, 2015
Source: World Justice Project.1 2 http://dx.doi.org/10.1787/888933249287
0.00
0.10
0.20
0.30
0.40
0.50
0.60
0.70
0.80
0.901.00
JPN
USAOEC
DCHL
CZEES
P ITA GRCSVN
MEXTUR
IDN
IND
ZAFBRA
COLUKR
CHNRUS
DNK FIN NORSWE
NLD DEU AUTNZL AUS
BEL GBRPRT
EST
KORFR
ACAN
POL
Index value
11.8. Limited government powers versus fundamental rights, 2015
Source: World Justice Project.1 2 http://dx.doi.org/10.1787/888933249294
R² = 0.8694
0.30
0.40
0.50
0.60
0.70
0.80
0.90
1.00
0.30 0.40 0.50 0.60 0.70 0.80 0.90 1.00
AUS
AUT
BEL
BRA
CAN
CHL
CZE
DNKEST
FIN
FRA
DEU
GRCUKR
INDIDN
ITA JPNKOR
MEX
NLDNZL
NOR
POL PRT
RUS
SVN
ZAF
ESP
SWE
CHNTUR
GBR
USA
COL
Limited government powers
Fundamental rights
OECD
GOVERNMENT AT A GLANCE 2015 © OECD 2015 161

11. CORE GOVERNMENT RESULTS
Public sector efficiency
The recent economic crisis has increased pressures on gov-ernments to achieve efficiency gains in delivering publicservices. Based on conventional economic theory, “effi-ciency” is defined as the relationship between one or moreinputs (or factors of production) and one or more outputs.
Efficiency in health care
Average length of stay (ALOS) in hospital is a commonlyused indicator of efficiency in delivering hospital services.All other factors being constant, a shorter stay will reduceresource requirements and the cost per discharge, therebyallowing the treatment of a greater number of patients forgiven inputs. However, shorter stays tend to be more ser-vice-intensive and more costly per day. Too short length ofstays may also cause adverse effects on health outcomes,or reduce the comfort and recovery of the patient.
In 2012, the ALOS in hospitals for all causes of hospitalisa-tion combined was just over seven days on average acrossOECD countries. Mexico and Turkey had the shortest ALOS,with patients spending on average only four days in hospi-tals. Hospital stays were highest in Japan, reaching about18 days, followed by Korea (over sixteen days). Both Japanand Korea have “social admissions” in hospital, that is, asignificant number of hospital beds are devoted tolong-term care with patients staying for very long periods.In most countries, ALOS has fallen over the past decade,from an average of just over eight days in 2002 to just overseven days in 2012. Countries have used different strategiesto reduce ALOS while maintaining or improving the qualityof care. These strategies include reducing the number ofhospital beds alongside the development of early dischargeprogrammes that enable patients to return to their home toreceive follow-up care, and promoting the use of less inva-sive surgical procedures (OECD, 2013).
Efficiency in tax administration
The share of administrative cost is often used to measurethe efficiency in tax collection, comparing the annual costsof administration with the total revenues collected. Areduction of this ratio can be interpreted as evidence of areduction in administrative costs (the numerator) and/oran increase in tax revenues through greater compliance(assuming that there are no other factors that may influ-ence the cost/revenue relationship, such as economicgrowth or changes in tax rates). In most countries,between 2007 and 2010, the share of administrative cost intax collection has increased due to the deterioration in taxrevenues. From 2010 to 2013 the ratio has generallydecreased as the tax revenue bases of countries recoveredand/or taking account of government expenditure reduc-tion efforts.
Comparisons of the efficiency of tax administrations mustbe made with caution. There are various factors that affectone or more elements of the ratio’s computation and whichhinder direct comparability across countries. In general,
differences in tax rates, in the range and structure of taxescollected, in macroeconomic conditions affecting taxreceipts, as well as differences in the institutional arrange-ments for tax collection (e.g. multiple bodies involved inrevenue administration, as in Italy), and/or the conduct ofnon-tax functions (e.g. social contributions) may affect theadministrative cost ratio.
Further reading
OECD (2013), Health at a Glance 2013: OECD, Indicators, OECD,Paris, http://dx.doi.org/10.1787/health_glance-2013-en.
OECD (2015, forthcoming), Tax Administration 2015, OECD,Paris.
Figure notes
11.9: Data for Japan refer to average length of stay for acute care (exclud-ing long-term care beds in hospitals).
Data for Slovenia are for 2004 rather than 2002. Data for Greece arefor 2007 rather than 2012. Data for Iceland are for 2009 ratherthan 2012. Data for Denmark, Norway, Sweden and the United Statesare for 2010 rather than 2012. Data for Australia, Belgium, Canada,Chile and the United Kingdom are for 2011 rather than 2012. Data forKorea are for 2013 rather than 2012.
11.10: Estonia: Ratios for 2005 to 2007 include customs operations butnot for subsequent years. Italy: The computed ratios for these yearssignificantly understate the true ratio as they do not take account ofexpenditure incurred on tax-related work carried out by other agen-cies (e.g. tax fraud work of the Guardia di Finanza and enforced debtcollection undertaken by Equitalia spa) that have not been quanti-fied. United States: Ratios indicated vary from IRS-published ratiosowing to use of “net” and not “gross” revenue collections as thedenominator.
Information on data for Israel: http://dx.doi.org/10.1787/888932315602.
Methodology and definitions
Average length of stay (ALOS) refers to the averagenumber of days that patients spend in hospital. It isgenerally measured by dividing the total number ofdays stayed by all inpatients during a year by thenumber of discharges (for all causes). Day cases areexcluded.
Data on tax administration are provided by surveyedrevenue bodies or extracted from official countryreports. Tax administration expenditures includethree categories: administrative, salary and IT costs.IT expenditure was defined as the total costs of pro-viding IT support for all administrative operations(both tax and non-tax related). For comparison pur-poses, efforts have been made to separately identifythe resources used and the costs of tax and non-taxrelated functions. For more information regarding theunderlying data please consult the OECD TaxAdministration 2015 report.
GOVERNMENT AT A GLANCE 2015 © OECD 2015162

11. CORE GOVERNMENT RESULTS
Public sector efficiency
11.9. Average length of stay in hospital for all conditions, 2002 and 2012
Source: OECD (2014), Health Statistics (database).1 2 http://dx.doi.org/10.1787/888933249301
0
5
10
15
20
25
2002 2012Days
JPN
KOR FIN CZEHUN
DEU PRTCHE
LUX
NZL AUTES
T ITAOEC
DCAN
SVKSVN
POLGRC
GBRBEL ES
PISR
SWEAUS ISL
CHLFR
A IRL
NLD USADNK
NORTUR
MEX
11.10. Ratio of tax administration costs as a share of tax revenues, 2007, 2010 and 2013
Source: OECD (2015), Tax Administration 2015, OECD, Paris.Note: International comparison of cost of collection ratios need to be made with care. There are various factors that hinder direct comparability whichare highlighted in the OECD Tax Administration 2015 publication.
1 2 http://dx.doi.org/10.1787/888933249318
0
0.2
0.4
0.6
0.8
1.0
1.2
1.4
1.6
1.8
2.0
2.2
2.4
2.6
2.8
3.0
3.2
2013 2010 2007
JPN
POLSVK
DEU CZEBEL CAN
HUNFR
A ITA PRTNLD ISR
AUSLU
XOEC
DSVN IR
LNZL FIN KOR
GBRMEX
AUTES
PCHL
TURDNK
USANOR
EST
SWECHE ISL
COLIN
DID
NLV
ARUS
ZAF
GOVERNMENT AT A GLANCE 2015 © OECD 2015 163
11. CORE GOVERNMENT RESULTS
Public sector cost effectiveness
Public sector cost effectiveness can be measured by looking atthe relationship between inputs and broader outcomes ineach sector. Generally speaking, outcomes refer to the effectsof public programmes and services on citizens, in terms ofwelfare gains, health gains, educational/learning gains, andso on. While these outcomes can certainly be affected by thequality of programmes and services provided, they can alsobe affected by other factors, such as the socioeconomic back-ground of the population and individual behavioural factors.
Health care
Measuring the outcomes of health care activities andspending is important not only because this mattersdirectly to patients, but also because, since health expendi-ture represents a significant and growing share of publicspending, there is a need for governments and health careproviders to demonstrate that these expenditures are putto good use. Life expectancy at birth is one of the mostwidely used measures of health outcomes, but it has thedisadvantage of only measuring the length of life and notthe health-related quality of life of people alive. It is alsoaffected by many other factors beyond health care activi-ties and spending (e.g. the living and working conditions ofpeople, the physical environment, behavioural factors suchas smoking alcohol consumption, nutrition, etc.).
There is a positive relationship between total health expendi-ture per capita and life expectancy, suggesting that higherhealth spending tends to be associated with longer lives,although the relationship generally becomes weaker ashealth spending increases. Japan, Iceland, Italy and Spainhave relatively high life expectancy relative to their expendi-ture. On the other hand, Hungary, Mexico, the Slovak Republicand the United States have a lower life expectancy than whatmight be “predicted” given their level of health spending.
Similar results are also found if only public spending onhealth is taken into account rather than total expenditure,which include also private spending. However, the extent towhich Mexico and the United States have a relatively low lifeexpectancy compared to the OECD average is reduced whenonly public spending on health care is taken into account,because a greater share of spending in these two countriescomes from private sources (about half of all spending).
Education
Every three years, the OECD Programme for InternationalStudent Assessment (PISA) measures the performance of15 years-old students in three domains: reading, mathe-matics and science. The comparison between the learningoutcomes of student based on PISA scores and the cumula-tive expenditure per student between 6 and 15 years of ageon education provides an aggregate measure of the costeffectiveness of education systems.
PISA scores in reading and mathematics are positively cor-related to expenditures although the relationship seems tohold particularly for low levels of cumulative expendituresper student. Above a certain threshold (around 80 000 USD
PPP), student performance seems to depend on other fac-tors such as the quality of teachers, the socio-economicbackgrounds of students and school management prac-tices, among others. Countries such as Korea, Canada andNew Zealand spend less than the OECD average per stu-dent, but achieve better performances. On the other hand,Austria, Norway and Luxembourg have higher per studentexpenditures although their scores in reading and mathe-matics tests are below average.
Further reading
OECD (2013), Health at a Glance 2013, OECD, Paris, http://dx.doi.org/10.1787/health_glance-2013-en.
OECD (2014), Education at a Glance 2014, OECD, Paris, http://dx.doi.org/10.1787/eag-2014-en.
OECD (2014), PISA 2012 Results: What Students Know and CanDo – Student Performance in Mathematics, Reading and Sci-ence (Volume I), OECD, Paris, http://dx.doi.org/10.1787/9789264208780-en.
Figure notes
11.11: Data on health expenditure for Belgium, the Netherlands,New Zealand and Portugal excludes investment (current expenditureonly). Data for Australia and New Zealand are for 2011 ratherthan 2012. Data for Chile, Finland, Germany, Iceland, Italy, Korea, theNetherland and Norway are for 2013 rather than 2012. Data on lifeexpectancy for Canada and the United States are for 2011 ratherthan 2012. Data for Mexico are for 2013 rather than 2012.
11.12: Data on cumulative expenditure for Greece are not available.
Information on data for Israel: http://dx.doi.org/10.1787/888932315602.
Methodology and definitions
Life expectancy measures how long on average peo-ple would live based on a given set of age-specificdeath rates. Total expenditure on health measuresthe final consumption of health goods and services(i.e. current expenditure), plus capital investment inhealth care infrastructure. This includes spending byboth public and private sources on medical servicesand goods, public health and prevention pro-grammes, and administration.
Data on expenditures per student refer to the 2011financial year. Spending per student equals the totalexpenditure by education institutions (both public andprivate) divided by the corresponding full-time equiva-lent enrolment and includes both core and ancillary ser-vices. Due to differences across countries in theduration of courses, annual spending per student maynot fully reflect the total spent on a student. Theachievement scores were based on the 2012 PISA assess-ments of 15-year olds in reading and mathematics.
Figure 11.13, Life expectancy at birth and total publicexpenditure on health per capita (2012), is availableon line at http://dx.doi.org/10.1787/888933249340.
GOVERNMENT AT A GLANCE 2015 © OECD 2015164

11. CORE GOVERNMENT RESULTS
Public sector cost effectiveness
11.11. Life expectancy at birth and total expenditure on health per capita, 2012
Source: OECD (2014), Health Statistics (database).1 2 http://dx.doi.org/10.1787/888933249324
72
74
76
78
80
82
84
86
0 1 000 2 000 3 000 4 000 5 000 6 000 7 000 8 000 9 000 10 000
USA
Life expectancy at birth (in years)
Total health expenditure per person (USD PPP)
OECD
AUS
AUTBELCAN
CHLCZE
DNK
EST
FIN
FRADEU
GRC
HUN
ISL
IRL
ISR ITAJPN
KOR
LUX
MEX
NLDNZL
POL
PRT
SVK
SLV
ESPSWE
TUR
GBR NOR
CHE
11.12. Performance in 2012 PISA scores and cumulative expenditure per student between 6 and 15 years oldon education, 2011
Source: OECD (2014), Education at a Glance, 2014, OECD, Paris; PISA 2012 Results: What Students Know and Can Do – Student Performance in Mathematics,Reading and Science (Volume I), OECD, Paris.
1 2 http://dx.doi.org/10.1787/888933249332
400
420
440
460
480
500
520
540
400
420
440
460
480
500
520
540
0 50 000 100 000 150 000 200 000 250 000
0 50 000 100 000 150 000 200 000 250 000
560
560
2011 cumulative expenditure per student (USD PPP)
2012 cumulative expenditure per student
2012 PISA mathematics score
2012 PISA reading score
AUS AUTBEL
CAN
CHL
CZE DNK
EST FIN
FRADEU
HUN ISLIRL
ISR
JPN
MEX
NLD
NZL
NOR
POL
PRTSVKSLVESP SWE
CHE
TUR
GBRUSA
OECD
RUS LUX
ITA
AUS
AUT
BEL
CAN
CHL
CZE DNKEST
FIN
FRADEU
HUN
IRL
ISRITA
JPNKOR
MEX
NLDNZL
NOR
POL
PRT
SVKSLV
ESPSWE
CHE
TUR
USAOECD
BRA
RUSISL
GBR LUX
Mathematics score and spending per student
Reading score and spending per student
KOR
GOVERNMENT AT A GLANCE 2015 © OECD 2015 165


GOVERNMENT AT A GLANCE 2015 © OEC
12. SERVING CITIZENS
The OECD serving citizens’ framework
Citizen satisfaction with public services
Financial and geographic access to health care
Access to education
Access to judicial systems and legal information
Responsiveness of health systems to patient needs
Responsiveness of schools to student needs
Responsiveness of judicial systems to citizen needs
Quality of health care and patient safety
Student performance and equity in education
Effectiveness and fairness of judicial systems
D 2015 167

12. SERVING CITIZENS
The OECD serving citizens’ framework
Governments are responsible for providing a wide range ofpublic services that should meet the expectations of theircitizens in terms of access, responsiveness and reliability/quality. The direct experience of citizens with front-linepublic services in health care, education, transport, justice,employment, tax administration and other services greatlyaffects their satisfaction with these services and morebroadly their trust in public institutions. When citizenscannot afford some essential services, when their geo-graphic or electronic access to services and information isdifficult, when the services provided do not respond totheir needs and are of poor quality, citizens will naturallytend to report lower satisfaction with these services andwith public institutions and governments.
Developed in close collaboration with other OECD director-ates, this chapter presents a set of indicators on public ser-vices in three key areas: health, education and justice.Based on a framework outlined for the first time in Govern-ment at a Glance 2013, this chapter begins by presentingdata on citizens’ overall satisfaction with public services inthese three areas, followed by more specific information on
the level of access, responsiveness and reliability/quality ofthese services, based on administrative and survey data.
In many countries, health and education services aredelivered by a mix of public and private providers, eventhough often a large part of the services provided in pri-vate hospitals or school are publicly funded to ensure acertain level of access. The current availability of data inmany countries does not always clearly separate out pub-lic and private hospitals or schools, thus limiting the pos-sibility for comparative assessment of the performance ofpublic versus private institutions. This is an importantdata and research agenda that will need to be pursued inthe coming years.
Although still incomplete, the set of indicators presentedfor each dimension of the framework is more comprehen-sive than in the previous edition and provides a broaderpicture of the level of access, responsiveness and reliabil-ity/quality of the services delivered to citizens inOECD countries in these three areas.
GOVERNMENT AT A GLANCE 2015 © OECD 2015168

12. SERVING CITIZENS
The OECD serving citizens’ framework
12.1. Framework for measuring public services to citizensIncluding key indicators in the areas of health, education and justice
ACCESS RESPONSIVENESS RELIABILITY/QUALITY
AffordabilityCitizen centred approach
(courtesy, treatment and integrated services)Effective delivery of services
and outcomes
Unmet care needs for financial reasons by income level(health)Out of pocket medical expenditure as a percentage of finalhousehold consumption (health)Share of private expenditure on educational institutions(education)Entry rate in tertiary type education (education)Number of first instance cases granted with legal aid (justice)
Patient experience with ambulatory care (health)Patients reporting having contacted their regulardoctor/practice for medical concern via e-mail (health)Time spent by school principals interacting with parentsor guardians (education)School principals reporting high level co-operationbetween their school and local community (education)Use of ICT in courts for case managementand to communicate with citizens and parties (justice)
Cancer survival rate (health)Mortality rate for cardiovascular diseases (heart attacks)(health)Evolution of PISA mean score (education)Effective enforcement of civil justice
Geographic proximity Match of services to special needs Consistency in service delivery and outcomes
Physician density in urban and rural regions (health) Teachers’ needs for professional development in teachingstudents with special needs (education)Specific arrangements’ mechanisms in courts for vulnerablepeople (e.g. ethnic groups, children, disabled) (justice)
Variance in maths PISA score explained by socio economicbackground (education)Civil justice is free of improper government influence
Accessibility of information Timeliness Security (safety)
Accessibility of legal information on court proceduresfor citizens (justice)
Waiting times for a specialist appointment (health)Waiting times for a doctor and nurse appointment (health)Disposition time in days for litigious civil and commercialfirst instance cases (justice)
Appropriate use of antibiotics (health)People do not resort to violence to redress personalgrievances (justice)Crime is effectively controlled (justice)
GOVERNMENT AT A GLANCE 2015 © OECD 2015 169

12. SERVING CITIZENS
Citizen satisfaction with public services
Data regularly collected through the Gallup World Pollallows some comparative analysis of the satisfaction levelof citizens with a range of public services, notably in theareas of health, education and justice, across OECD andpartner countries.
A vast majority of people in most OECD countries are satis-fied with the availability of quality health services in thearea where they live. On average across OECD countries,71% of people reported being satisfied with their healthcare system in 2014. However, there are wide variationsacross countries. In Austria, Belgium, Luxembourg andSwitzerland, about 9 citizens out of 10 reported being satis-fied with their health care system. This proportion wasmuch lower in Chile and Greece where less than 4 citizensout of 10 reported such satisfaction. In these two countries,the satisfaction with the health care system has decreasedsubstantially since 2007. In Greece, this has coincided withdeep cuts in public spending on health, following the eco-nomic crisis and successive waves of austerity measures toreduce public deficits and debts (OECD, 2014). Public satis-faction with the health care system generally tends to belower in other major economies, notably in Ukraine, Braziland Russia.
A majority of citizens in OECD countries are also satisfiedwith their education system. On average acrossOECD countries, about 67% of citizens reported being satis-fied with their educational system and schools in 2014. Citi-zens in Belgium, Finland, Iceland, Ireland, Norway andSwitzerland reported the highest level of satisfaction withtheir education system and schools at above 80%, whereasless than half of the population in Greece reported being sat-isfied with their education system. The satisfaction levelwith the education system in other major economies wasgenerally higher than for the health care system, although itwas fairly low in Brazil, Colombia, Russia and Ukraine anddeclining in the case of Brazil and Colombia.
The reported level of confidence with the judicial systemand the courts is generally below the satisfaction levelswith health and education systems. On average acrossOECD countries, just over half (54%) of citizens reportedhaving confidence in their country’s judicial system andcourts . There are signif icant dif ferences across
OECD countries, with more than 80% of citizens inDenmark, Norway and Switzerland reporting having confi-dence in their judicial system and courts, whereas lessthan 20% of the population in Chile expressed suchconfidence. Confidence in the judicial system has mainlydecreased in Turkey and Italy since 2007. Among othermajor economies, the level of confidence with the judicialsystem in 2014 was particularly low in Ukraine but also inColombia and Latvia.
Figure notes
Data for Austria, Finland, Ireland, Norway, Portugal, the Slovak Republic,Slovenia and Switzerland are for 2006 rather than 2007. Data forIceland and Luxembourg are for 2008 rather than 2007. Data forAustralia, Canada, Chile, Hungary, Iceland, Japan and Korea are for2013 rather than 2014. Data for China, Latvia and South Africa are for2013 rather than 2014.
12.4: Data for China are not available.
Information on data for Israel: http://dx.doi.org/10.1787/888932315602.
Methodology and definitions
Data were collected by Gallup World Poll, generallybased on a representative sample of 1000 citizens ineach country. More information about this survey isavailable at: www.gallup.com/home.aspx.
Data on the level of satisfaction with health care referto the percentage of people who answered “satisfied”to the question: “In the city or area where you live, areyou satisfied or dissatisfied with the availability ofquality health care?"
For education, data refer to the percentage of peoplewho answered “satisfied” to the question: ”In the cityor area where you live, are you satisfied or dissatisfiedwith the educational system or the schools?"
For justice, data refer to the percentage of people whoanswered “Yes” to the question: “In this country, doyou have confidence in each of the following, or not?How about the judicial system and courts?”.
GOVERNMENT AT A GLANCE 2015 © OECD 2015170
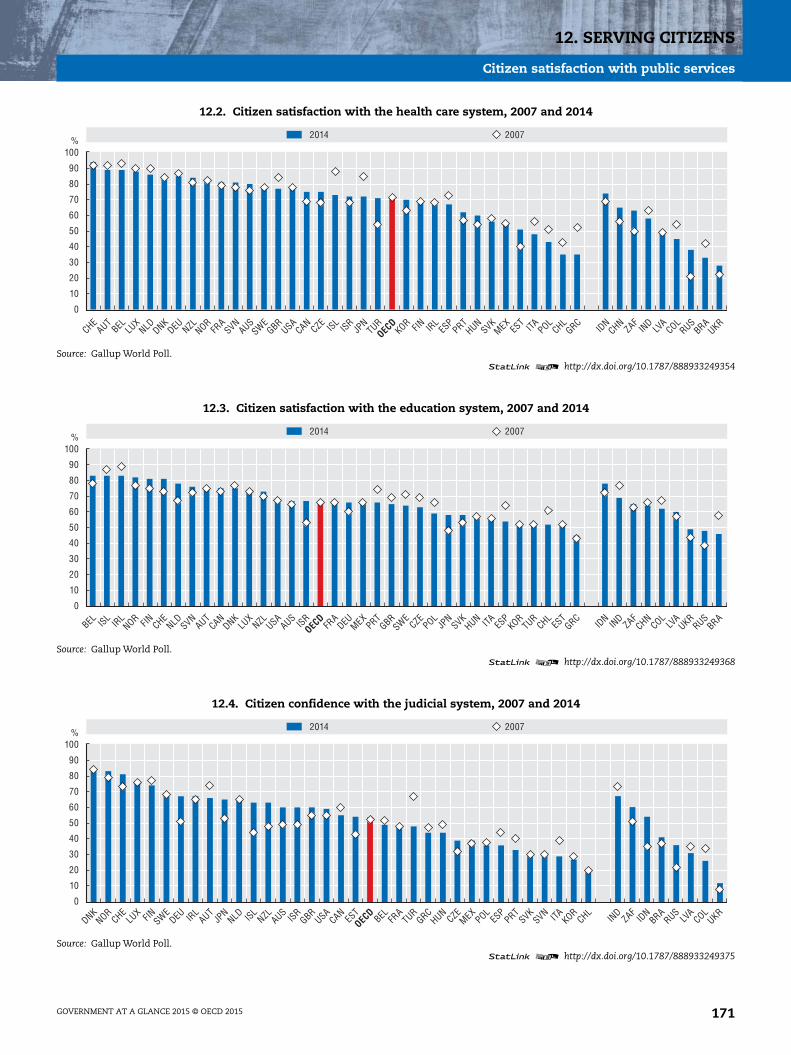
12. SERVING CITIZENS
Citizen satisfaction with public services
12.2. Citizen satisfaction with the health care system, 2007 and 2014
Source: Gallup World Poll.1 2 http://dx.doi.org/10.1787/888933249354
0
10
20
30
40
50
60
70
80
90
100%
2014 2007
CHEAUT
BEL LUX
NLD DNKDEU NZL NOR
FRA
SVNAUS
SWEGBR
USACAN
CZE ISLISR
JPN
TUROEC
DKOR FIN IR
LES
PPRT
HUNSVK
MEXES
T ITA POLCHL
GRCID
NCHN
ZAFIN
DLV
ACOL
RUSBRA
UKR
12.3. Citizen satisfaction with the education system, 2007 and 2014
Source: Gallup World Poll.1 2 http://dx.doi.org/10.1787/888933249368
0
10
20
30
40
50
60
70
80
90
100%
2014 2007
BEL ISLIR
LNOR FIN CHE
NLD SVNAUT
CANDNK
LUX
NZL USAAUS
ISROEC
DFR
ADEU MEX
PRTGBR
SWECZE
POLJP
NSVK
HUN ITA ESP
KORTUR
CHLES
TGRC
IDN
IND
ZAFCHN
COLLV
AUKR
RUSBRA
12.4. Citizen confidence with the judicial system, 2007 and 2014
Source: Gallup World Poll.1 2 http://dx.doi.org/10.1787/888933249375
0
10
20
30
40
50
60
70
80
90
100%
BEL FRA
TURGRC
HUNCZE
MEXPOL
ESP
PRTSVK
SVN ITA KORCHL
IND
ZAFID
NBRA
RUSLV
ACOL
UKRDNK
NORCHE
LUX FIN SWE
DEU IRL
AUTJP
NNLD ISL
NZL AUSISR
GBRUSA
CANES
T
2014 2007
OECD
GOVERNMENT AT A GLANCE 2015 © OECD 2015 171

12. SERVING CITIZENS
Financial and geographic access to health care
Unmet health care needs, as reported in population-basedsurveys, are a good way of assessing any access problemsfor certain population groups. A European-wide survey(EU-SILC), conducted on an annual basis, provides informa-tion on the proportion of people reporting unmet careneeds for medical examination for financial, geographic orother reasons.
In all European countries covered by this survey, low-income people were more likely in 2013 to report unmetcare needs than people with high incomes. The gap wasparticularly large in Hungary, Italy and Greece. The mostcommon reason reported by low-income people for unmetneeds for medical examination is cost while the main rea-sons reported by high-income people are lack of time and awillingness to see if the problem would go away on its own.
In contrast to publicly funded care which in theory is basedon need, direct out-of-pocket (OOP) payments by house-holds rely on people’s ability to pay. If the financing ofhealth care becomes more dependent on OOP payments,the burden shifts, in theory, towards those who uses ser-vices more and possibly from high to low income house-holds that often have greater health care needs.
In 2012, about 3% of total household consumption was ded-icated to medical spending on average in OECD countries.In some countries which have been hit particularly hard bythe crisis and where public coverage for certain health ser-vices and goods has been reduced, the share of OOP spend-ing has increased in recent years (Hungary and Ireland).
Health systems in OECD countries differ in the degree ofcoverage for health services and goods. In most countries,public coverage is higher for hospital care and doctor con-sultations, while direct OOP payments are higher for phar-maceuticals, dental care and eye care (glasses) resulting ina relatively greater proportion of people reporting unmetcare needs for the latter group of health services and goods.
Access to medical care also requires an adequate numberand proper distribution of physicians in all parts of thecountry. Shortages of physicians in certain regions canincrease travel times to access medical care and thereforeresult in greater unmet care needs.
In all OECD countries, the density of physicians is greater inurban regions, reflecting the concentration of specialisedservices such as surgery and physicians’ preferences to prac-tise in urban settings. Differences in the density of doctorsbetween predominantly urban and rural regions in 2011were highest in the Slovak Republic, Czech Republic andGreece. This was driven to a large extent by the strong con-centration of doctors in the national capital region. Thegeographic distribution of physicians was more equal inJapan and Korea.
In many OECD countries, different types of financial incen-tives have been provided to doctors to attract and retainthem in underserved areas, including one-time subsidiesto help them set up their practice and recurrent paymentssuch as income guarantees and bonus payments. In
Germany, the number of practice permits for new ambula-tory care physicians providing services to statutory healthinsurance patients in each region is regulated, based on anational service delivery quota. In France, new multi-disciplinary medical homes were introduced in under-served areas, allowing physicians and other health profes-sionals to work in the same location while remaining self-employed.
Further reading
OECD (2013), Regions at a Glance, OECD, Paris, http://dx.doi.org/10.1787/reg_glance-2013-en.
Figure notes
12.6: Data for Greece, Spain and Turkey are for 2009 rather than 2007.Data for Australia, Canada, Japan, New Zealand, Norway, Portugaland Switzerland are for 2011 rather than 2012. Data for Israel arefor 2010 rather than 2012.
Information on data for Israel: http://dx.doi.org/10.1787/888932315602.
Methodology and definitions
Data on unmet care needs come from EU-SILC. Surveyrespondents are asked whether there was a time in thepast 12 months when they felt they needed a medicalexamination but did not receive it, followed by a ques-tion as to why the need for care was unmet. Data pre-sented here cover unmet care needs for any reason.
OOP payments are borne directly by a patient whereneither public nor private insurance covers the fullcost of the health good or service. They includecost-sharing and other expenditures paid directly byprivate households, and also include estimations ofinformal payments to health care providers in somecountries. Only expenditure for medical spending(i.e. current health spending less expenditure for thehealth part of long-term care) is presented here.
The data for most countries refer to the number ofpractising physicians, defined as the number of phy-sicians who are providing care directly to patients.Countries are ranked based on the difference betweenthe density of physicians in urban and rural areas.The OECD classifies regions in two territorial levels.The higher level (territorial Level 2) consists of largeregions corresponding generally to national adminis-trative regions. These broad regions may contain amixture of urban, intermediate and rural areas. Thelower level (territorial Level 3) is composed of smallerregions that are classified as predominantly urban,intermediate or predominantly rural regions (OECD,2013).
GOVERNMENT AT A GLANCE 2015 © OECD 2015172

12. SERVING CITIZENS
Financial and geographic access to health care
12.5. Unmet care needs for medical examination by income level, 2013
Source: EU Survey on income and living conditions (EU-SILC), 2013.1 2 http://dx.doi.org/10.1787/888933249388
0
5
10
15
20
25
30
35%
SVNAUT
NLD NORCHE
BEL GBR IRL
LUX
CZEPRT
SVKDNK FIN DEU FR
AES
PHUN ISL ITA ES
TGRC
SWEPOL
LVA
National average Low income High income
12.6. Out-of-pocket (OOP) medical expenditure as a share of final household consumption, 2007 and 2012
Source: OECD (2014), Health Statistics.1 2 http://dx.doi.org/10.1787/888933249395
0.0
0.5
1.0
1.5
2.0
2.5
3.0
3.5
4.0
4.5
5.0% 2012 2007
TURGBR
NLD FRA
DEU NZL LUX
SVNES
TJP
NCZE
DNKCAN
POL ITA AUTOEC
DNOR ISR FIN ES
PUSA
AUS ISLSVK IR
LSWE
BEL CHLCHE
GRCMEX
HUNPRT
KOR
12.7. Physician density in predominantly urban and rural regions, 2011
Source: OECD (2013), Regions at a Glance 2013, OECD, Paris.1 2 http://dx.doi.org/10.1787/888933249403
0
1
2
3
4
5
6
7
89
Urban areas Rural areas
SVK CZE GRC NOR PRT HUN CHE FRA FIN SWE BEL EST TUR KOR JPN
Density per 1 000 population
GOVERNMENT AT A GLANCE 2015 © OECD 2015 173

12. SERVING CITIZENS
Access to education
In OECD countries, the education systems generally pro-vide universal access to primary and secondary schools forchildren aged 5-14 years, although some parents maydecide to send their children to private schools for variousreasons. Access to tertiary education depends on the suc-cessful completion of secondary education, the mix of pub-lic and private costs for this higher level of education andother reasons.
In all OECD countries, the public sector pays for the bulk ofprimary and secondary education to ensure universalaccess to basic education. On average, nearly 91% of thefunds for primary, secondary and post-secondarynon-tertiary educational institutions came from publicsources in 2011, with the remaining 9% coming from pri-vate sources (mainly direct household expenditure).
Still, there are important variations across countries. Privateexpenditure on primary, secondary and post-secondary(non-tertiary) educational institutions in Chile (22%), Korea(19%) and Mexico (17%) are relatively higher whereas privateexpenditure represented less than 1% of total spending forthese educational levels in Finland and Estonia. In general,households in Anglo-Saxon countries (Australia,New Zealand, the United Kingdom and the United States)tend to spend more for those educational institutionsbecause more students are enrolled in private schools(around 10% on average), whereas households in Nordiccountries tend to spend less given that very few studentsgo to private schools.
Tertiary institutions and, to a lesser extent, pre-primaryinstitutions obtain the largest proportions of funds fromprivate sources: 31% and 19%, respectively. High privatereturns to tertiary education justify a greater contributionof individuals (or their families) to related costs, but as longas there are ways to ensure that sufficient funding is avail-able to all students to pursue their tertiary educationregardless of their socio-economic background. More than50% of the costs of tertiary education are borne by house-holds or other private sources in several OECD countries,including Chile, Korea, the United Kingdom, Japan andthe United States. By contrast, this share of private fundingremains relatively low in Nordic countries where tuitionfees charged by tertiary institutions are low or negligible.
The proportion of young people entering tertiary type A edu-cation is relatively high in some Nordic countries (Iceland,Norway, Denmark) and in Poland and Slovenia, where privateexpenditures on tertiary education are lower. But entry ratesto tertiary education are also high in other countries likeAustralia and New Zealand where private households bear agreater share of tertiary-level expenditure. In the two lattercountries the share of international students entering uni-versity is much higher than in other OECD countries. Whenexcluding international students, the share of studentsentering tertiary type A education drops from 102% to 76%in Australia and from 78% to 61% in New Zealand (OECD,2014).
On average in OECD countries between 2000 and 2012,there has been a 10 percentage point increase in entry ratesin tertiary type A education (58% in 2012). With the excep-tion of Hungary, New Zealand (where entry rates can dras-tically fluctuate from one year to another due to the highnumber of international students), Sweden and Finland(where entry rates were already very high leaving onlysmall room for expansion) entry rates have increased in allother OECD countries for which trend data are available.The increase was particularly strong in Czech Republic,Germany and Turkey.
Further reading
OECD (2014), Education at a Glance 2014. OECD, Paris, http://dx.doi.org/10.1787/eag-2014-en.
Figure notes
12.8: Some levels of education are included with others for Japan,Canada, the Slovak Republic and Denmark.
12.9: For the United States entry rates for tertiary-type A programmesinclude tertiary-type B programmes. For Germany, there is a break intime series between 2008 and 2009 due to a partial realisation of voca-tional programmes. For Belgium, data refer to 2001 rather than 2000.
Information on data for Israel: http://dx.doi.org/10.1787/888932315602.
Methodology and definitions
Data for both figures come from the Unesco-OECD-Eurostat (UOE) data collection on education statistics.
Private spending includes all direct expenditure oneducational institutions, whether partially covered bypublic subsidies or not. Countries are ranked indescending order of the share of private expenditureon educational institutions for tertiary education. Formore details see: www.oecd.org/edu/eag.html.
Entry rates represent the percentage of an age cohortthat is expected to enter a tertiary programme over alifetime. This estimate is based on the number of newentrants in 2012 and the age distribution of thisgroup. Therefore, the entry rates are based on a syn-thetic cohort assumption, according to which the cur-rent pattern of entry constitutes the best estimate ofthe behaviour of today’s young adults over their life-times. Entry rates are sensitive to changes in the edu-cation system, such as the introduction of newprogrammes or a variation in the number of interna-tional students. Entry rates can be very high, and evengreater than 100% (thus clearly indicating that thesynthetic cohort assumption is implausible), during aperiod when there are unexpected entries. For moredetails see: www.oecd.org/edu/eag.html.
GOVERNMENT AT A GLANCE 2015 © OECD 2015174

12. SERVING CITIZENS
Access to education
12.8. Share of private expenditure on educational institutions, 2011
Source: OECD (2014), Education at a Glance 2014, Indicator B3, OECD, Paris.1 2 http://dx.doi.org/10.1787/888933249415
0
10
20
30
40
50
60
70
80
% Primary, secondary and post-secondary non-tertiary education Tertiary education
CHLKOR
GBRJP
NUSA
AUSISR
CANNZL ITA MEX
PRTOEC
DNLD POL
SVKES
PES
TIR
LFR
ACZE
DEU SVNAUT
SWEBEL ISL
DNK FIN NORTUR
CHELU
XCOL
LVA
RUSID
N
12.9. Entry rates into tertiary-type A education (university), 2000 and 2012
Source: OECD (2014), Education at a Glance 2014, Indicator C3, OECD, Paris.1 2 http://dx.doi.org/10.1787/888933249424
0
20
40
60
80
100
120
% 2000 2012
AUS ISLPOL
NZL NORSVN
DNKUSA
KORGBR FIN NLD PRT
SVKSWE
ISRCZE
OECD IR
LHUN
DEU AUTES
PJP
NCHL ITA CHE
EST
FRA
TURGRC
MEXBEL LU
XLV
ARUS
IDN
CHN
GOVERNMENT AT A GLANCE 2015 © OECD 2015 175

12. SERVING CITIZENS
Access to judicial systems and legal information
Equal access to justice is an essential element of the properfunctioning of the rule of law. Affordability of legal proce-dures for all citizens as well as access to legal informationthat is easily understandable are two key dimensions toassessing the degree of accessibility of judicial systems inOECD countries.
Affordability of legal procedures
Most OECD countries provide some form of legal aid to peo-ple below a certain income threshold and other populationgroups considered to be disadvantaged to guarantee equalaccess to justice. Comparing legal aid provision acrossOECD countries is difficult however, given differences inthe scope and coverage of legal services. Differences in thefunctioning and financing of the justice system also affectthe need for legal aid provision in different countries.
According to the 2014 Evaluation of Judicial Systems carriedout by the European Commission for the Efficiency of Justice(CEPEJ), legal aid was provided in about 9% of all firstinstance cases in the group of European OECD countriesreporting such data. Legal aid is more often provided in Nor-way, the Netherlands, the United Kingdom and France,whereas it is provided in only a very small percentage of firstinstance cases in Denmark (data only refer to non-criminalcases rather than all cases), the Slovak Republic (data onlyrefer to non-criminal cases rather than all cases), Slovenia,Hungary and Austria.
For the reasons noted above, this does not necessarilymean, that there are financial barriers to the legal systemin this latter group of countries. More comprehensiveefforts to reform the justice system may facilitate access tojustice, particularly for individuals who are not grantedlegal aid, by raising the availability of private legal expenseinsurance or through administrative simplification (CEPEJ,2014).
Access and understandability of informationon laws and legal procedures
Ensuring access for layman citizens to legal informationand procedures is crucial to empower them in exercisingtheir legal rights. According to the 2013Eurobarometer, onlyabout one-fifth of people (22%) in OECD-EU countries felthighly informed about judicial procedures. This rangedfrom more than 30% in Slovenia, Finland and Italy to only15% in France and 16% in Hungary, Spain and Estonia. Mostpeople in the countries surveyed felt well informed abouthow to find a lawyer, but less informed on many otheraspects (including what to do if they need to go to court, thecost of legal procedures and their right to legal aid).
People with a higher level of education felt generally betterinformed than those with lower level of education. Simi-
larly, self-employed people are the most likely to feel wellinformed about legal procedures, while manual workersfeel the least well informed (European Commission, 2013).While most OECD countries have developed Internet por-tals to access legal texts, case law of higher courts andother legal documents, there seems to be a persisting needto communicate more about legal proceedings -includingalternatives to court, such as mediation.
Further reading
CEPEJ. (2014), Evaluation of European Judicial Systems,5th Report, Council of Europe Publishing, Strasbourg.
European Commission (2013), Justice in the EU, Flash Euroba-rometer 385, European Commission Publishing, Brussels.
Figure notes
12.10: Data for Denmark and the Slovak Republic only refer to non-criminal cases. Data for OECD non European countries are not avail-able. Data for the United Kingdom refer only to England and Wales.
12.11: Data for OECD non-EU countries are not available.
Information on data for Israel: http://dx.doi.org/10.1787/888932315602.
Methodology and definitions
Data on legal aid come from the European Commissionfor the Efficiency of Justice (CEPEJ) 2014 report. Legal aid,is defined as aid given by the state to persons who donot have sufficient financial means to defend them-selves before a court or to initiate court proceedings.Data refer to the percentage of all first instance casesprovided with legal aid. Data only cover European coun-tries. For more details on the methodology underlyingthe data, please see: www.coe.int/t/dghl/cooperation/cepej/evaluation/default_en.asp.
Data come from the European Commission’s 2013Eurobarometer No. 385 on Justice in the EU. The sur-vey was carried in the 28 states of the European Unionbetween 30 September and 2 October 2013. Some26 581 respondents from different social and demo-graphic groups were interviewed via telephone onbehalf of the European Commission, Directorate-Gen-eral for Justice. The methodology used is that of Euro-barometer surveys. Data refer to the EurobarometerInformation Index, which measures self-reportedlevel of information about the right to legal aid, thealternatives to court (e.g. mediation), what to do ifyou need to go to court, how to find a lawyer and thecosts of proceedings. For more details on the method-ology underlying the data, please see: http://ec.europa.eu/public_opinion/flash/fl_385_en.pdf.
GOVERNMENT AT A GLANCE 2015 © OECD 2015176

12. SERVING CITIZENS
Access to judicial systems and legal information
12.10. Percentage of first instance cases granted with legal aid, 2012
Source: The European Commission for the Efficiency of Justice (CEPEJ) (2014), European judicial systems (database); and OECD calculations.1 2 http://dx.doi.org/10.1787/888933249431
0
5
10
15
20
25
30
35
40
45%
40.9
24.1
21.3
18.9
6.9 6.6 6.1
1.7 1.60.5 0.5 0.4 0.3 0.1
NOR NLD GBREngland
and Wales
FRA DEU PRT FIN TUR ITA AUT HUN SVN SVK DNK
12.11. Percentage of people who feel highly informed about legal procedures, 2013
Source: European Commission (2013), Justice in the EU, Flash Eurobarometer 385, European Commission Publishing, Brussels1 2 http://dx.doi.org/10.1787/888933249447
0
5
10
15
20
25
30
35%
SVN ITA FIN IRL LUX NLD DNK DEU SWE BEL GBR AUT PRT SVK POL CZE GRC EST ESP HUN FRA LVA
GOVERNMENT AT A GLANCE 2015 © OECD 2015 177

12. SERVING CITIZENS
Responsiveness of health systems to patient needs
Responsive and patient-centred health systems involveproviding patients with access to health services withinreasonable waiting times and treating them with respectand dignity.
Waiting times to see a doctor or nurseand to get a specialist appointment
Long waiting times to receive health services is an impor-tant policy issue in many OECD countries. Long waitingtimes can generate dissatisfaction for patients and mayresult in adverse health outcomes when needed care isdelayed. Such waiting times may be due to a shortage ofdoctors or nurses in general or in certain parts of the coun-try, but may also result from poor work organisation torespond to demands for health care (Siciliani et al., 2013).
Among the OECD countries that participated in the 2013Commonwealth Fund International Health Policy Survey,around three-quarters of people in Germany andNew Zealand reported that they were able to get an appoint-ment with a doctor or nurse when they felt they needed careon the same day or the next day. This proportion fell to lessthan half of people in Canada and the United States. InCanada, one-third of the population reported that they had towait six days or more to get a doctor or nurse appointment,while this proportion reached more than a quarter of the pop-ulation in the United States. One consequence of this longerwaiting time is that more people end up using emergencydepartments in hospitals (Commonwealth Fund, 2013). Thissuggests a need to increase the number and improve the geo-graphic distribution of generalist doctors and nurse practitio-ners working outside hospitals in these countries and/or tohave contractual requirements that primary care practicesprovide arrangements for after-hours care.
Waiting times to get an appointment with a specialist doc-tor also vary widely across countries. While 80% of the pop-ulation in Switzerland and the United Kingdom reportedin 2013 that they were able to get an appointment with aspecialist in less than a month, this was the case for lessthan 50% of the population in Canada and Norway. In thesetwo latter countries, over a quarter of the populationreported having to wait more than two months to get anappointment with a specialist. Such waiting times mayresult in delays in establishing clearer diagnosis and begin-ning any needed treatments.
Patient experience with ambulatory care
A major trend in many OECD countries is to promotegreater interactions between doctors and patients, so thatpatients can be more involved in the management of theirhealth problems and in decisions about treatment optionsreflecting their preferences.
Among the OECD countries participating in the 2013 Com-monwealth Fund Survey, patients generally reported posi-tively on the communication and explanations they weregiven by their doctors, and their involvement in care and
treatment decisions. Various health system characteristicsand policies can influence doctors’ behaviour towardspatients and hence have an impact on patient experiences,including the organisation of health care delivery, remu-neration methods, systematic monitoring and reporting ofpatient experiences and the medico-legal policies for pro-tecting patients’ interests.
The use of Internet and e-mail have transformed the waypeople interact with public service providers in many sectorsand could, in theory, be implemented in medical practice toenhance the practitioner-patient relationship. However, theuse of those online means of communication remains limiteddue to legal concerns and other reasons. Among theOECD countries that participated in the 2013 CommonwealthFund Survey, only about 8% of patients reported having com-municated at least one medical concern to their regular doc-tor/practice via e-mail over the past two years.
The uptake is generally higher in countries where regulardoctors/practices inform more their patients about the pos-sibility to raise their concerns via e-mail such as inthe Netherlands and Switzerland. In the Netherlands, gen-eral practitioners have a financial incentive to providee-mail consultations because most of them receive a fixedpayment for each patient registered with them (regardlessof whether they provide them with face-to-face consulta-tions, phone consultations or e-mail consultations), whileothers are paid based on fees for services with email con-sultations being paid about half the rate of face-to-faceconsultations.
Further reading
Commonwealth Fund (2013), “2013 International HealthPolicy Survey in Eleven Countries”, November 2013.
OECD (2013), Health at a Glance 2013: OECD Indicators, OECD,Paris, http://dx.doi.org/10.1787/health_glance-2013-en.
Siciliani, L., M. Borowitz and V. Moran (2013), Waiting TimePolicies in the Health Sector: What Works?, OECD Health Pol-icy Studies, OECD, Paris.
Figure notes
12.12: The question on waiting times for a doctor or nurse appointmentwas asked differently in Switzerland.
Information on data for Israel: http://dx.doi.org/10.1787/888932315602.
Methodology and definitions
Data for the four figures come from the 2013 Com-monwealth Fund International Health Policy Surveyscollecting patient experience data every three yearssince 1998. For Figure 12.15, regular practice includesdoctor’s group, health centre or clinic but excludeshospital emergency departments. More informationis available at: www.commonwealthfund.org.
GOVERNMENT AT A GLANCE 2015 © OECD 2015178
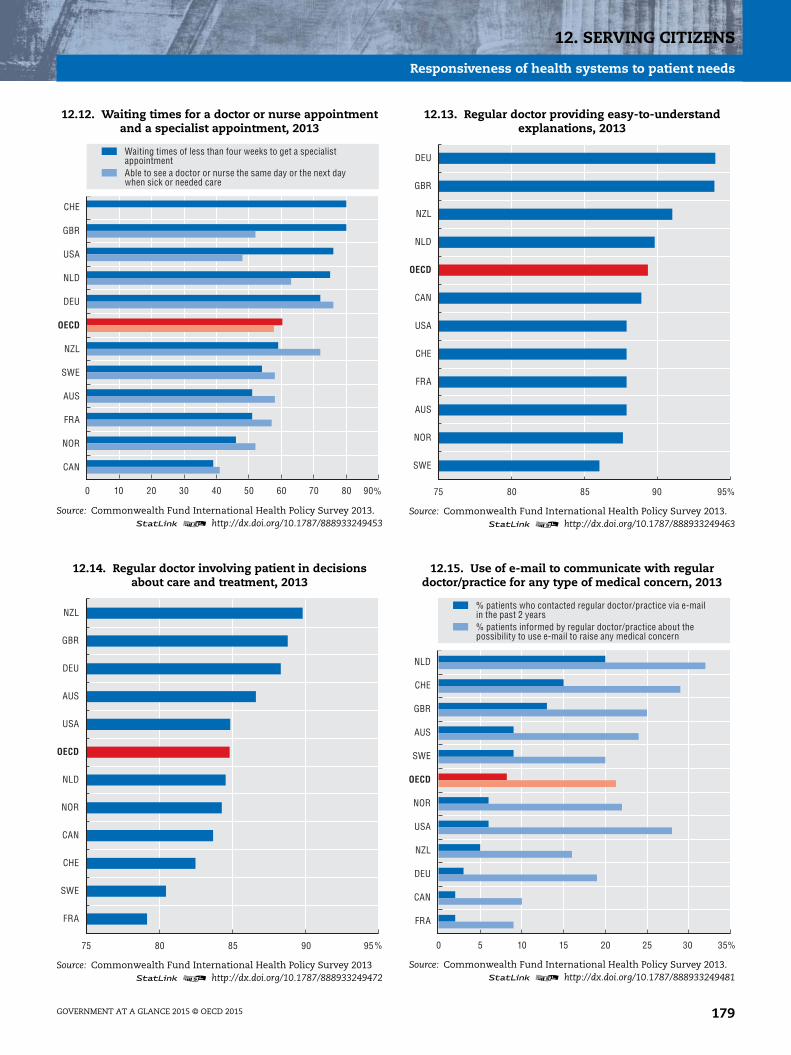
12. SERVING CITIZENS
Responsiveness of health systems to patient needs
12.12. Waiting times for a doctor or nurse appointmentand a specialist appointment, 2013
Source: Commonwealth Fund International Health Policy Survey 2013.1 2 http://dx.doi.org/10.1787/888933249453
%0 10 20 30 40 50 60 70 80 90
Waiting times of less than four weeks to get a specialist appointmentAble to see a doctor or nurse the same day or the next day when sick or needed care
CHE
GBR
USA
NLD
DEU
OECD
NZL
SWE
AUS
FRA
NOR
CAN
12.13. Regular doctor providing easy-to-understandexplanations, 2013
Source: Commonwealth Fund International Health Policy Survey 2013.1 2 http://dx.doi.org/10.1787/888933249463
%75 80 85 90 95
SWE
NOR
AUS
FRA
CHE
USA
CAN
OECD
NLD
NZL
GBR
DEU
12.14. Regular doctor involving patient in decisionsabout care and treatment, 2013
Source: Commonwealth Fund International Health Policy Survey 20131 2 http://dx.doi.org/10.1787/888933249472
%75 80 85 90 95
FRA
SWE
CHE
CAN
NOR
NLD
OECD
USA
AUS
DEU
GBR
NZL
12.15. Use of e-mail to communicate with regulardoctor/practice for any type of medical concern, 2013
Source: Commonwealth Fund International Health Policy Survey 2013.1 2 http://dx.doi.org/10.1787/888933249481
%0 5 10 15 20 25 30 35
% patients who contacted regular doctor/practice via e-mail in the past 2 years% patients informed by regular doctor/practice about the possibility to use e-mail to raise any medical concern
NLD
CHE
GBR
AUS
SWE
OECD
NOR
USA
NZL
DEU
CAN
FRA
GOVERNMENT AT A GLANCE 2015 © OECD 2015 179

12. SERVING CITIZENS
Responsiveness of schools to student needs
Responsiveness in education involves adapting teachingmethods to the needs of different students, but also main-taining good communication with parents (or guardians ofchildren) and interactions with community groups thatmight also provide support to the successful completion ofbasic education for all children.
Teaching students with special needs
Providing more responsive and student-centred educationrequires that teachers not only have the pedagogical skillsto manage their classes generally, but also that they havethe specific competencies to effectively deal with studentswith special needs. This is one of the area where teachersthemselves report the greatest need for further profes-sional development.
In the TALIS survey of 2013, about one in five lower second-ary teachers on average across participating countriesreported that they did not feel fully prepared to respond tothese challenges, compared to about one in ten only report-ing a need for further professional development for manag-ing classes more generally. Teachers in Mexico (47%) andJapan (41%) were more likely to report greater trainingneeds for teaching students with special needs, while thisproportion was lower in the Flanders (Belgium) (5%) and inEngland, (United Kingdom) (6%).
Caution is required in interpreting these data, as a biggerpercentage might reflect, for instance, greater integration ofspecial needs’ students in regular classrooms or relativelyhigher expectations of teachers in terms of quality andadapted education. The definition of a student with specialneeds might also differ from one country to another.
Interactions between schools and parents(or guardians)
Student success can be enhanced when the efforts ofteachers are complemented by strong, ongoing supportfrom parents. School principals often play a critical role inmaintaining proper communications between the schools,students and their parents or guardians.
On average across OECD countries that participated inTALIS in 2013, school principals reported spending 11% oftheir time interacting with parents or guardians of theirstudents. School principals in Italy, Chile and Spain (about14%) reported spending a relatively bigger share of theirtime with parents or guardians, whereas principals inCzech Republic, the Netherlands and Estonia spent lessthan 10% of their time doing so.
On average, among all participating countries to TALIS,about two third of school principals (66%) reported providingparents or guardians with information on students schoolperformance. In countries where school principals reportedlow interactions with parents or guardians, it is possiblethat the responsibility for communicating with parents liesmore with teachers or with other school representatives.
Interaction between schools and the localcommunity
High levels of interactions between schools and groups in thelocal community can also contribute to the reduction of thenumber of early school leavers and improve the transition topost-secondary education or to the labour market. On averageacross OECD countries that participated in the 2013 TALIS,about 71% of teachers worked in schools in which principalsreported high levels of co-operation between their school andthe local community (local businesses, NGOs and other asso-ciations). This percentage is relatively higher in somecountries such as Korea (91%) whereas it is lower (below 50%)in most Nordic countries (Denmark, Norway and Sweden) aswell as in the Netherlands (21%).
Further reading
OECD (2014), TALIS 2013 Results: An International Perspectiveon Teaching and Learning, OECD, Paris, http://dx.doi.org/10.1787/9789264196261-en.
Figure notes
In all three figures, the United States is excluded from the OECD averagebecause it did not meet the international standards for participationrates.
12.17: A translation issue led to the removal of the data for Norway.
Information on data for Israel: http://dx.doi.org/10.1787/888932315602.
Methodology and definitionsData for the three indicators come from the OECD 2013Teaching And Learning International Survey (TALIS).TALIS is an international, large-scale survey thatfocuses on the working conditions of teachers and thelearning environment in schools. There are four subna-tional entities participating in TALIS 2013: Alberta(Canada), Flanders (Belgium), England (United Kingdom)and Abu Dhabi (United Arab Emirates).Data refer to the percentage of lower secondary educa-tion teachers who call for a high level of need for pro-fessional development in teaching students withspecial needs. Special needs students cover those forwhom a special learning need has been formally iden-tified because they are mentally, physically or emo-tionally disadvantaged. Often, special needs studentswill be those for whom additional resources (person-nel, material or financial) have been provided to sup-port their education. Gifted students are notconsidered to have special needs under this definition.Data refer to the average proportion of time lower sec-ondary education school principals report spendingon interactions with parents or guardians (includingboth formal and informal interactions).Data refer to principals reporting that they “agree”and “strongly agree” with the statement “There is ahigh level of co-operation between the school and thelocal community”.
GOVERNMENT AT A GLANCE 2015 © OECD 2015180
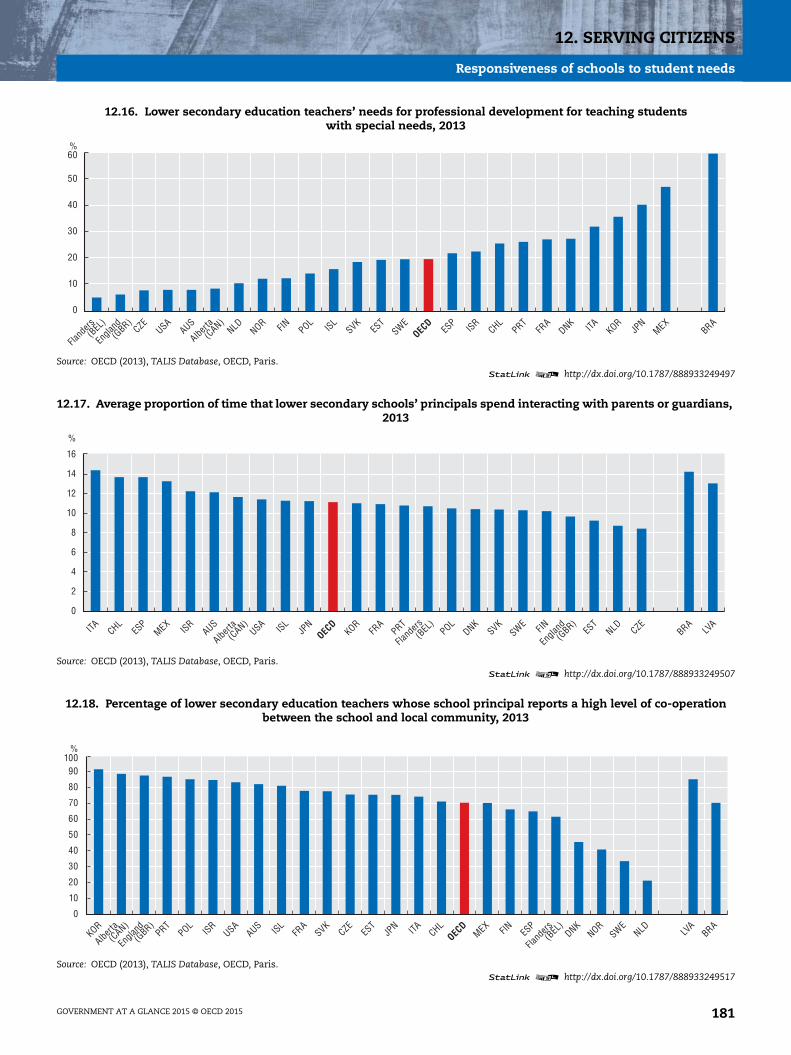
12. SERVING CITIZENS
Responsiveness of schools to student needs
12.16. Lower secondary education teachers’ needs for professional development for teaching studentswith special needs, 2013
Source: OECD (2013), TALIS Database, OECD, Paris.1 2 http://dx.doi.org/10.1787/888933249497
12.17. Average proportion of time that lower secondary schools’ principals spend interacting with parents or guardians,2013
Source: OECD (2013), TALIS Database, OECD, Paris.1 2 http://dx.doi.org/10.1787/888933249507
12.18. Percentage of lower secondary education teachers whose school principal reports a high level of co-operationbetween the school and local community, 2013
Source: OECD (2013), TALIS Database, OECD, Paris.1 2 http://dx.doi.org/10.1787/888933249517
0
10
20
30
40
50
60%
Fland
ers(B
EL)
Engla
nd(G
BR)CZE
USAAUS
Alberta(C
AN)NLD NOR FIN POL
SVKES
TSWE
OECD
ESP
ISRCHL
PRTFR
ADNK ITA KOR
JPN
MEXBRAISL
0
2
4
6
8
10
12
14
16
%
ITA CHLES
PMEX
ISRAUS
(CAN)
USA ISLJP
NOEC
DKOR
FRA
PRT(B
EL)
POLDNK
SVKSWE FIN
(GBR)
Engla
nd EST
NLD CZEBRA
LVA
Alberta
Flanders
0
10
20
30
40
50
60
70
80
90100
%
KOR
Alberta(C
AN)
Engla
nd(G
BR)PRT
POLISR
USAAUS ISL
FRA
SVKCZE
EST
JPN ITA CHL
OECD
MEX FIN ESP
Fland
ers(B
EL)
DNKNOR
SWENLD LV
ABRA
GOVERNMENT AT A GLANCE 2015 © OECD 2015 181

12. SERVING CITIZENS
Responsiveness of judicial systems to citizen needs
Citizens expect judicial procedures to be implementedwithout unreasonable delays. In a study carried out by theOECD economic department in 2013, the authors estimatedthat a 10% increase in the length of trials is associated witharound 2 percentage point decrease in the probability tohave confidence in the justice system (Palumbo et al.,2013).
Timeliness of judicial proceedings
Disposition time (DT) is a commonly used indicator to esti-mate the timeframe of a judicial system for solving a case(CEPEJ, 2014). Starting from the prospective capacity of judi-cial courts of a country to solve a case (measured as thenumber of resolved cases in a year) DT estimates the max-imum number of days necessary for a pending case to besolved by a court in a given jurisdiction. DT offers valuableinformation on the estimated length of proceedings.
The average DT of first instance civil and commercial liti-gious cases among European OECD countries for whichdata are available ranged from 590 days in Italy to less than90 days in Luxembourg for 2013. Countries such as France(311), Finland (325), Portugal (369), Slovenia (405), theRepublic Slovak (437), Greece (469) and Italiy (590) reportedDT above 300 days.
Conclusions should be drawn with caution. DT does notprovide a clear estimate of the time needed to process eachcase. Case level data from functional ICT systems would beneeded to make a full analysis. Also, procedural differencesacross legal systems (including case load) and the organisa-tion of the justice system (including for instance staffingand human resource management policies) can have animpact on DT. It should also be emphasised that very rapidproceedings do not always translate into good justice andcertain expedited procedures (where speed takes priority)may be detrimental to the quality of justice.
To reduce delays in the treatment of cases and better inter-act with parties and citizens, many countries are movingtowards more technology driven judicial systems. Almostall courts in European OECD countries are currently usingelectronic case and court management systems. Somecountries also report that a high proportion of law courtsallow for electronic submission of claims, online follow-upof cases and electronic processing of small claims. The useof ICT by law courts is particularly developed in countrieslike Austria, Estonia, Portugal, Finland and Sweden.
The use of special arrangement mechanismsfor vulnerable persons
In 2012 all European OECD countries reported havingarrangements mechanisms during judicial procedures forat least one category of vulnerable people, which include inthe CEPEJ methodology: victims of rape, terrorism, childrenwitnesses/victims, victims of domestic violence, ethnicminorities, disabled persons and juvenile offenders. Somecountries provide some type of special arrangements
mechanisms to all seven categories of vulnerable groups.Those special arrangements mechanisms correspond tothe existence of special information mechanisms for thosegroups during judicial proceedings (specific telephone hot-lines, Internet portals, leaflets, etc.) and/or specific hear-ings modalities (for instance the use of videoconferencingin courts) to protect and strengthen the rights of those peo-ple.
Further reading
CEPEJ (2014), Evaluation of European Judicial Systems,5th Report, Council of Europe Publishing, Strasbourg.
Palumbo, G., et al. (2013), “Judicial Performance and ItsDeterminants: A Cross-country Perspective”, OECD Eco-nomic Policy Papers, OECD, Paris, http://dx.doi.org/10.1787/5k44x00md5g8-en.
Figure notes
Data for all 3 figures are not available for OECD non-European countries.
Information on data for Israel: http://dx.doi.org/10.1787/888932315602.
Methodology and definitions
Data for the 3 figures come from the 2014 EuropeanCommission for the Efficiency of Justice (CEPEJ) evalu-ation of judicial systems.
Disposition time in days, determines the maximumestimated number of days necessary for a pending civiland commercial litigious case to be solved in a court.For example, if a court is able to resolve 50 cases in365 days and has 10 cases as backlog at the end of theyear (i.e. pending cases) the DT is equal to 20% of these365 days [(10/50) 100] or more simply put the averagetimeframe for solving a pending case can be estimatedbetween 0 and 73 days. The exact formula used is:(Number of unresolved cases at the end of a period/Number of resolved cases in a period) 365.
“All courts” refers to countries that answered that100% of their law courts were equipped with the cor-responding computer facility. “Some courts” refer tocountries who answered more than 50% and less than50% (but more than 10%). “Few courts” refer to coun-tries who answered less than 10%. No courts refer tocountries who answered 0%.
“Special arrangements” category refers to specific andadapted information mechanisms on proceduralsteps for certain groups and to the existence of spe-cial arrangements in court hearings. “Ethnic minori-ties” does not concern foreigners involved in a judicialprocedure. This question does not concern the policeinvestigation phase of the procedure and does notconcern compensation mechanisms for victims ofcriminal offences.
GOVERNMENT AT A GLANCE 2015 © OECD 2015182

12. SERVING CITIZENS
Responsiveness of judicial systems to citizen needs
12.19. Disposition time in days for first instance civiland commercial litigious cases, 2012
Source: The European Commission for the Efficiency of Justice (CEPEJ)(2014), European judicial systems (database).
1 2 http://dx.doi.org/10.1787/888933249522
0 100 200 300 400 500 600Days
LUXHUNCHETURAUTNORDNKESTCZE
SWEDEUPOLESPFRAFIN
PRTSVNSVKGRCITA
RUSLVA
12.20. Proportion of all law courts using computerfacilities for case management and communication
with parties and citizens, 2012
All courts Some courtsFew courts
(less than 10%)No courts
Electronicsubmissionof claims
AUT, CZE, EST,FIN, ISR, LVA,
PRT, SVK, SWE,GBR (England
and Wales)
HUN, ITA, SLV,CHE, TUR, DEU,GBR (Northern
Ireland)
FRA, GRC, IRL,POL, RUS, ESP
BEL, DNK, ISL,LUX, NLD, NOR,GBR (Scotland)
Follow-up ofcases online
AUT, CZE, EST,FIN, DEU, ISR,LVA, NLD, PRT,
RUS, TUR,GBR (Northern
Ireland),GBR (Scotland)
ITA, FRA, IRL,SLV, CHE, GBR(England and
Wales)
GRE, POL, SVK,ESP
BEL, DNK, FIN,HUN, ISL, LUX,
NOR, SWE
Electronicprocessingof smallclaims
AUT, CZE, EST,FIN, ISR, LVA,
PRT, SWE, CHE,GBR (England
and Wales), GBR(NorthernIreland)
IRL, ITA, FRA DEU, GRC, POL BEL, DNK, HUN,ISL, LUX, NLD,
NOR, RUS, SVK,SLV, ESP, TUR,GBR (Scotland)
Source: Adapted from the European Commission for the Efficiency ofJustice (CEPEJ) (2014), European judicial systems (database).
1 2 http://dx.doi.org/10.1787/888933249531
12.21. Special arrangements mechanisms during judicial procedures for vulnerable groups, 2012
Victims of rape Victims of terrorismChildren/Witnesses/
VictimsVictims of domestic
violenceEthnic minorities Disabled persons Juvenile offenders
Austria ● ● ● ● ● ● ●
Belgium ● ❍ ● ● ● ❍ ●
Czech Republic ❍ ❍ ● ❍ ❍ ❍ ●
Denmark ● ❍ ● ● ❍ ● ●
Estonia ● ● ● ● ❍ ● ●
Finland ● ❍ ● ● ● ● ●
France ● ● ● ● ❍ ● ●
Germany ● ● ● ● ❍ ❍ ●
Greece ● ● ● ● ❍ ❍ ●
Hungary ● ❍ ● ● ❍ ● ●
Iceland ● ● ● ● ● ● ●
Ireland ● ❍ ● ● ❍ ● ●
Israel ● ● ● ● ● ● ●
Italy ● ● ● ❍ ● ● ●
Luxembourg ● ❍ ● ❍ ❍ ❍ ●
Netherlands ● ● ● ● ● ● ●
Norway ● ● ● ● ● ● ●
Poland ● ❍ ● ● ❍ ● ❍
Portugal ● ● ● ● ❍ ● ●
Slovak Republic ● ● ● ● ● ● ●
Slovenia ● ● ● ● ❍ ● ●
Spain ● ● ● ● ❍ ● ●
Sweden ● ● ● ● ● ● ●
Switzerland ● ❍ ● ❍ ❍ ● ●
Turkey ● ● ● ❍ ❍ ● ●
GBR-England and Wales ● ● ● ● ● ● ●
GBR-Northern Ireland ● ● ● ● ● ● ●
GBR-Scotland ● ● ● ● ● ● ❍
Latvia ● ❍ ● ❍ ● ● ●
Russia ● ● ● ● ● ● ●
● Yes.❍ No.
Source: The European Commission for the Efficiency of Justice (CEPEJ) (2014), European judicial systems (database).1 2 http://dx.doi.org/10.1787/888933249549
GOVERNMENT AT A GLANCE 2015 © OECD 2015 183

12. SERVING CITIZENS
Quality of health care and patient safety
The measurement and improvement of quality of care hasbecome a crucial element of the governance of health sys-tems in OECD countries, both at the hospital level and inprimary care outside hospital, in response to growing pub-lic expectations for high quality and safe care. Quality ofcare can generally be measured through “process” mea-sures (the appropriate use of interventions for patientswith different health problems) and “outcome” measures(the extent to which health interventions reduce ill-healthand mortality).
Survival from cardiovascular diseases and cancer
In OECD countries, cardiovascular diseases and cancer arethe two leading causes of death. However, substantial prog-ress has been achieved in most OECD countries over thepast decade in reducing mortality for people suffering fromthese life-threatening conditions.
Case-fatality rates for people admitted to hospital followingan acute myocardial infarction (heart attack) have signifi-cantly decreased between 2001 and 2011 across the group ofOECD countries with available data. Between 2006 and 2011,the rate of decline was particularly striking in Denmark,the Slovak Republic, Poland and Canada, where case-fatalityrates fell by more than 30%. These improvements can atleast be partially attributed to better and more reliable pro-cesses of care (OECD, 2013).
Survival rates for different types of cancer have alsoimproved in most countries, reflecting earlier detection(often through organised screening programmes) and moreeffective treatments. Figure 12.23 shows the five year sur-vival rate for cervical cancer, one of the leading causes ofcancer mortality among women. While progress wasachieved in most countries, there remain notable differ-ences across countries. In the most recent period, cervicalcancer survival ranged from over 70% in Korea, Norway andIsrael to less than 60% in Poland and Ireland.
Quality of prescriptions in primary care(appropriateness)
The overuse of antibiotics has become a major global publichealth issue in recent years, as there is a clear correlationbetween the volume of antibiotics prescribed and the prev-alence of resistant bacterial strains (OECD, 2013). Infectionscaused by resistant microorganisms often fail to respond toconventional treatment, resulting in prolonged illness andgreater risk of death as well as higher costs. Whilst an opti-mal level of prescribing is difficult to establish, variations inthe volume of antibiotic prescription are a good indicator ofthe quality of prescriptions.
On average in OECD countries, there has been a slightincrease in antibiotics prescription over the past ten years.The increase has been particularly significant in Greece,Belgium and Italy, which report the highest levels of con-sumption across the OECD in 2012 (despite significantreductions in Greece since 2007). By contrast, antibiotic con-
sumption in Chile and the Netherlands was less than halfthe consumption in these high-prescription countries. It hasalso substantially come down over the past decade in France(which used to have the highest level of consumption),Portugal, the Slovak Republic, Israel and Hungary.
Further reading
OECD (2013), Health at a Glance 2013: OECD Indicators, OECD,Paris, http://dx.doi.org/10.1787/health_glance-2013-en.
Figure notes
12.22: See StatLink for important country-specific notes. 95% confidenceintervals represented by |-|.
12.23: 95% confidence intervals represented by |-|. Data refer to periodanalysis for Ireland, the United Kingdom, Germany, New Zealand,Finland, Slovenia, Belgium, Australia, Israel, Norway and Korea. Datarefer to cohort analysis for Poland, Portugal, the United States, theCzech Republic, Canada, Denmark, the Netherlands, Sweden, Iceland,Austria and Japan. Data refer to three period average for Iceland.
12.24: Data for Chile, France, Greece, Ireland, the Netherlands, Norwayand Poland is for 2011 rather than 2012. Data for Iceland, Italy,Luxembourg, Portugal, the Slovak Republic and Sweden is for 2013rather than 2012. The OECD average excludes Chile, Austria, Canadaand Korea.
Information on data for Israel: http://dx.doi.org/10.1787/888932315602.
Methodology and definitions
Data for the three figures come from the OECD HealthStatistics database and was provided by national rep-resentatives based on administrative records.
The case-fatality rate following AMI is defined as thenumber of people aged 45 and over who die within30 days of being admitted to hospital with an AMI.Rates were age-sex standardised to the 2010 OECDpopulation aged 45+ admitted to hospital for AMI.
Cancer survival calculated through period analysisprovides more up-to-date estimate using more recentincidence and follow-up periods than cohort analysiswhich uses survival information of a completefive-year follow-up period. In the United Kingdom,cohort analysis was used for 2001-06 data while2006-11 data are calculated through period analysis.The reference periods vary slightly across countries.All the survival estimates presented here have beenage-standardised using the International Cancer Sur-vival Standard (ICSS) population.
Defined daily dose (DDD) is the assumed averagemaintenance dose per day for a drug used for its mainindicat ion in adults . For more detai l , see :www.whocc.no/atcddd. Data generally refer to outpa-tient consumption except for Chile, Canada, Greece,Korea, Israel and Iceland where data also include con-sumption in hospitals.
GOVERNMENT AT A GLANCE 2015 © OECD 2015184

12. SERVING CITIZENS
Quality of health care and patient safety
12.22. Reduction in admission-based (same hospital) case-fatality in adults aged 45 and over within 30 daysafter admission for AMI, 2001-11
Source: OECD (2014), Health Statistics (database).1 2 http://dx.doi.org/10.1787/888933249552
12.23. Cervical cancer five-year relative survival, 2001-06 and 2006-11
Source: OECD (2014), Health Statistics (database).1 2 http://dx.doi.org/10.1787/888933249565
12.24. Overall volume of antibiotics prescribed, 2002 and 2012
Source: OECD (2014), Health Statistics (database).1 2 http://dx.doi.org/10.1787/888933249573
0
5
10
15
20
2001 2006 2011Age-sex standardised rates per 100 admissions
DNKNZL NOR
SWEAUS
POLUSA
CAN ISL ITA CHEFR
AOEC
DCZE
IRL
NLD FIN ISRBEL SVK
AUTGBR
PRTES
PLU
XDEU KOR
CHLJP
NHUN
0
25
50
75
100
2001-2006 2006-2011Age-standardised survival (%)
POLIR
LGBR
PRTUSA
DEU NZL CZE FIN SVNBEL CAN
OECD
DNKNLD AUS
SWE ISLAUT
JPN ISR
NORKOR
0
5
10
15
20
25
30
35%
2012 2002
CHLNLD AUT
HUNSVN
EST
DEU ISRSWE
NORCAN
DNKCZE
ESP
GBROEC
DSVK FIN POL
PRT ISLIR
LAUS
LUX
KORFR
A ITA BEL GRC
GOVERNMENT AT A GLANCE 2015 © OECD 2015 185

12. SERVING CITIZENS
Student performance and equity in education
The quality of education and school systems is reflected intheir ability to provide students with the knowledge andskills necessary to achieve their full potential. The PISAsurvey measures once every three years the performance of15-year-old students in reading, mathematics and sciencein more than 60 countries. It allows a comparison not onlyof average national scores but also of the equity of theresults among children and schools within each country(PISA, 2012). The last wave of the PISA survey in 2012focussed particularly on assessing performance inmathematics.
In 2012, among OECD countries, the performance of15 years old students in PISA in mathematics was the high-est in Korea, Japan and Switzerland while students inMexico, Chile and Turkey performed somewhat morepoorly (PISA, 2012).
Between 2003 and 2012, the PISA mathematics scores onaverage across OECD countries have remained relativelystable. However, there have been some remarkableimprovements in countries that started with relatively lowscores in 2003 (e.g. Israel, Turkey, Mexico), which haveclosed to some extent the gaps with other OECD countries.Student performance in mathematics has also increased incountries with average scores like Germany, or below theOECD average like Poland, Italy and Portugal. By contrast,student performance in mathematics has decreased insome countries that started with high scores in 2003(e.g. Sweden and Finland). Student performance in mathe-matics has also declined in Czech Republic, New Zealandand Australia.
PISA also shows how equitably participating countries areproviding education opportunities and achieving educationoutcomes across students from different socio-economicbackground. On average across OECD countries, about 15% ofthe variation in students’ mathematics performance can beexplained by their socio-economic background. The countrieswhere the variation in PISA mathematics performance can beexplained to a larger extent by socio-economic backgroundare the Slovak Republic, Chile, Hungary and France. By con-trast, it is much less the case in Norway, Estonia, Iceland,Finland and Canada.
The performance of students in mathematics and othersubjects is also affected by the school they attend. Whenthere is substantial variation in performance betweenschools and less variation between students within
schools, this means that students tend to be grouped inschools where other students perform at levels similar totheir own. In Nordic countries, the share of the variancebetween schools is about one-tenth of the OECD average.Therefore, parents in these countries can be less concernedabout school choice affecting their children’s performance.By contrast, variation between schools is higher in coun-tries like the Netherlands, Belgium, Hungary, Turkey,the Slovak Republic, Slovenia and Germany.
Further reading
OECD (2014), PISA 2012 Results: What Students Know and CanDo – Student Performance in Mathematics, Reading and Sci-ence, Volume I, OECD, Paris, http://dx.doi.org/10.1787/9789264208780-en.
OECD (2013), PISA 2012 Results: Excellence Through Equity:Giving Every Student the Chance to Succeed, Volume II,OECD, Paris, http://dx.doi.org/10.1787/9789264201132-en.
Figure notes
12.25: Data for Chile, Estonia, Israel, Slovenia and the United Kingdomare based on PISA 2006 rather than PISA 2003.
Information on data for Israel: http://dx.doi.org/10.1787/888932315602.
Methodology and definitions
Data for both figures come from the 2012 Programmefor International Student Assessment (PISA). Itassessed the competencies of 15-year-olds in reading,mathematics and science (with a focus on mathemat-ics) in 65 countries and economies. For more informa-tion on the underlying data see: www.oecd.org/pisa/keyfindings/pisa-2012-results-volume-i.htm.
The PISA index of economic, social and cultural status(ESCS) was derived from the following three indices:highest occupational status of parents, highest edu-cational level of parents and home possessions. Formore information on the underlying data and meth-odology see: www.oecd.org/pisa/keyfindings/pisa-2012-results-volume-II.pdf.
GOVERNMENT AT A GLANCE 2015 © OECD 2015186

12. SERVING CITIZENS
Student performance and equity in education
12.25. Evolution of PISA mean score in mathematics, 2003 and 2012
Source: OECD (2014), PISA What Students Know and Can Do (revised edition), OECD, Paris.1 2 http://dx.doi.org/10.1787/888933249588
300
340
380
420
460
500
540
580
KORJP
NCHE
NLD EST FIN CAN
POLBEL DEU AUT
AUS IRL
SVNDNK
NZL CZEFR
AOEC
DGBR ISL
LUX
NORPRT ITA ES
PSVK
USASWE
HUN ISRGRC
TURCHL
MEXLV
ARUS
BRACOL
IDN
Mean score2012 2003
12.26. Percentage of variance in PISA mathematics score explained by socio-economic background, 2012
Source: OECD (2014), PISA What Students Know and Can Do (revised edition), OECD, Paris.1 2 http://dx.doi.org/10.1787/888933249591
0
5
10
15
20
25%
SVKCHL
HUNFR
APRT
BEL NZL LUX
ISRDEU POL
DNKCZE
AUTES
PSVN
GRCUSA
OECD IR
LTUR
CHEGBR
AUSNLD SWE
MEX ITA KORJP
NCAN FIN ES
T ISLNOR
BRACOL
LVA
RUSID
N
GOVERNMENT AT A GLANCE 2015 © OECD 2015 187

12. SERVING CITIZENS
Effectiveness and fairness of judicial systems
Citizens expect court decisions to be implemented in aneffective and fair manner. Well-functioning civil justicesystems protect the rights of all citizens against infringe-ment of the law by others, including by powerful partiesand governments. An essential component of the rule oflaw is indeed based on effective and fair judicial systems toensure that the laws are respected and appropriate sanc-tions are taken when they are violated. It is, however, verydifficult to isolate the impact of well-functioning judicialsystems on security outcomes and crime control from theinvolvement of other stakeholders such as the police andthe correctional systems. Therefore this constitutes a majorlimitation in making causality links between those two.
Effectiveness and independencein the implementation of civil justice decisions
The independence of civil justice requires a set of detailedrules and procedures to ensure that a dispute will be treatedin a neutral way, without biases in favour of any party.According to data from the World Justice Report, there is, asexpected, a strong correlation between people’s perceptionthat civil justice is effectively implemented and their percep-tion that the system is not affected by external factors such asimproper government influence. Citizens and justice expertsin countries like Norway, the Netherlands, Sweden, Austria,Germany, Denmark, Finland and Australia reported boththat their justice system was generally effective in enforc-ing laws and that there was low interference of their gov-ernments in the civil justice system.
Effectiveness of criminal justice systemsand citizens’ protection against crime
Effective criminal justice systems are capable of investigat-ing and adjudicating criminal offences effectively andimpartially, while ensuring that the rights of suspects andvictims are protected. An assessment of such systems,however, should take into consideration the entire system,including police, lawyers, prosecutors, judges, and prisonofficers (Botero and Ponce, 2012).
In 2014, according to the data from the World JusticeReport, countries where the criminal adjudication system(the act of a court in making an order, judgment, or decree)was perceived as timely and effective (i.e. where perpetra-tors of crimes were effectively prosecuted and punished)tend to report lower propensity of resorting to violence toredress personal grievances (such as personal intimidationand/or mob and riot violence against government). The rel-atively high correlation (R2 = 0.9) between those twosub-dimensions of the WJP Rule of Law Index suggest thateffective and timely criminal justice systems may be a fun-damental element to maintain security and societal cohe-sion at the country level.
In 2014, the extent to which crime was effectively con-trolled was generally high in almost all OECD countriescompared to other major economies with the exception of
Mexico. However, as for the other indicators presented inthis section, this data apply only to the three major urbanareas in each of the countries. They are perception-basedand may be sensitive to very specific events that occurredwhen the data was collected. Further work is needed in thecoming years to establish more clearly the links betweeneffective judicial systems and their impacts on fairness,security and order in OECD and other countries.
Further reading
Botero, J. and A. Ponce (2012), Measuring the Ruleof Law, WJP Working Paper No. 2, World Justice Project,Washington, DC.
World Justice Project (2014), The Rule of Law Index 2014,World Justice Project, Washington, DC.
Figure notes
Data for Iceland, Ireland, Israel, Luxembourg, the Slovak Republic andSwitzerland are not available. Data for Hungary are not displayed.
Information on data for Israel: http://dx.doi.org/10.1787/888932315602.
Methodology and definitions
Data for the three figures come from the World JusticeProject’s Rule of Law Index. The index is based onreplies from a general population survey conductedby leading local polling companies using a represen-tative sample of 1 000 respondents in the three larg-est cities in each country and a survey of qualifiedrespondents completed by practitioners and academ-ics with expertise in civil law. For more informationon the underlying data see: worldjusticeproject.org/rule-of-law-index.
The civil justice sub-indicator reflects perceptions onwhether the civil justice is effectively enforced andfree of improper government influence.
“Criminal adjudication system” measures whetherperpetrators of crimes are prosecuted and punished.It also measures the degree to which criminal judgesand other judicial officers are competent and producespeedy decisions without abuse of pre-trial detention.“People do not resort to violence to redress personalgrievances” measures the degree to which peopleresort to intimidation or violence to resolve civil dis-putes amongst themselves, or to seek redress fromthe government, and the degree to which people arefree from mob/riot violence.
“Crime is effectively controlled” measures the preva-lence of common crimes, including homicide, kidnap-ping, burglary and theft, armed robbery and extortion,as well as people’s general perceptions of safety intheir communities.
GOVERNMENT AT A GLANCE 2015 © OECD 2015188

12. SERVING CITIZENS
Effectiveness and fairness of judicial systems
12.27. Effective enforcement of civil justice and freedom from improper government influence, 2015
Source: World Justice Project.1 2 http://dx.doi.org/10.1787/888933249603
0
0.1
0.2
0.3
0.4
0.5
0.6
0.7
0.8
0.9
1.0
0 0.1 0.2 0.3 0.4 0.5 0.6 0.7 0.8 0.9 1.0
AUS
AUT
BELCAN
CHL
CZE
DNK
EST
FIN
FRA
DEU
GRC
ITA
JPN
MEX
NLD
NZL
NOR
POL
PRT
KOR
SVN
ESP
SWE
TUR
GBR
USAOECD
BRA
CHNCOL
INDIDNRUS
ZAF
UKR
Civil justice is effectively enforced
R2 = 0.8
Civil justice is free of improper government influence
12.28. Effectiveness/timeliness of criminal justice courts adjudication system and the extent of the useof violence to redress personal grievances, 2015
Source: World Justice Project.1 2 http://dx.doi.org/10.1787/888933249613
0
0.1
0.2
0.3
0.4
0.5
0.6
0.7
0.8
0.9
1.0
0 0.1 0.2 0.3 0.4 0.5 0.6 0.7 0.8 0.9 1.0
R²=0.90AUS
AUT
BEL CANCHL
CZE
DNK
EST
FIN
FRADEU
GRCITA
JPN
MEX
NLD
NZLNOR
POL
PRT
KOR
SVN
ESP
SWE
TUR
UKR
GBR
USA
BRA
CHN
COL
IND
IDN RUSZAF
Criminal adjudication system is timely and effective
People do not resort to violence to redress personal grievances
OECD
12.29. Crime is effectively controlled, 2015
Source: World Justice Project.1 2 http://dx.doi.org/10.1787/888933249625
0
0.1
0.2
0.3
0.4
0.5
0.6
0.7
0.8
0.9
1.0
POLDNK
CANJP
NAUT FIN SWE
NORSVN
NLD AUSDEU KOR
GBRNZL TU
RES
TFR
APRT
ESP
OECD
BEL CZE USA ITA GRCCHL
MEX IDN
UKRRUS
CHNIN
DBRA
ZAF
COL
GOVERNMENT AT A GLANCE 2015 © OECD 2015 189


Government at a Glance 2015
© OECD 2015
ANNEX A
Implementation of the 2008 Systemof National Accounts
The System of National Accounts (SNA) consists of a coherent, consistent and integrated
set of macroeconomic accounts, balance sheets and tables based on a set of internationally
agreed concepts, definitions, classifications and accounting rules. The System of National
Accounts 1993 was prepared under the joint responsibility of the United Nations, the
International Monetary Fund, the Commission of the European Communities, the OECD
and the World Bank (OECD Glossary of Statistical Terms). In 2009, it was decided to amend
the 1993 SNA by the 2008 System of National Accounts. The 2008 SNA retains the basic
theoretical framework of its predecessor. However, in line with the mandate of the United
Nations Statistical Commission, the 2008 SNA introduces treatments for new aspects of
economies that have come into prominence, elaborates on aspects that have increasingly
become the focus of analytical attention and clarifies guidance on a wide range of issues.
The changes in the 2008 SNA bring the accounts into line with developments in the
economic environment, advances in methodological research and needs of users.
At the European Union level, the European System of Accounts (ESA), 1995 was made
broadly consistent with the 1993 SNA with respect to the definitions, accounting rules and
classifications. Its update called European System of Accounts, 2010, which has been recently
finalised, covers the recommendations and clarifications agreed at the international level
for the 2008 SNA.
The implementation of the 2008 SNA, and the ESA 2010, by the countries has followed
a gradual process and at the end of 2014 most of OECD countries adopted the revised
international standards. Such changes had, to a certain extent, an impact on the selected
indicators presented in this publication as compared to the previous versions.
The Table A.1 illustrates the current status for the implementation of the 2008 SNA or
ESA 2010 done by the countries in the two sets of government accounts.
191

A. IMPLEMENTATION OF THE 2008 SYSTEM OF NATIONAL ACCOUNTS
Table A.1. Reporting system of the countries
Non-financial government accounts Financial government accounts
OECD member countries
Australia SNA2008 SNA2008
Austria ESA2010 ESA2010
Belgium ESA2010 ESA2010
Canada SNA2008 SNA2008
Chile SNA1993 SNA1993
Czech Republic ESA2010 ESA2010*
Denmark ESA2010 ESA2010*
Estonia ESA2010 ESA2010*
Finland ESA2010 ESA2010*
France ESA2010 ESA2010*
Germany ESA2010 ESA2010*
Greece ESA2010 ESA2010*
Hungary ESA2010 ESA2010
Iceland SNA1993 SNA2008
Ireland ESA2010 ESA2010*
Israel SNA2008 SNA2008
Italy ESA2010 ESA2010*
Japan SNA1993 SNA1993
Korea SNA2008 SNA1993
Luxembourg ESA2010 ESA2010*
Mexico SNA2008 SNA1993
Netherlands ESA2010 ESA2010*
New Zealand SNA2008 -
Norway SNA2008 SNA2008
Poland ESA2010 ESA2010*
Portugal ESA2010 ESA2010
Slovak Republic ESA2010 ESA2010*
Slovenia ESA2010 ESA2010*
Spain ESA2010 ESA2010*
Sweden ESA2010 ESA2010
Switzerland SNA2008 SNA2008
Turkey SNA1993 SNA1993
United Kingdom ESA2010 ESA2010
United States SNA2008 SNA2008
OECD accession countries
Colombia SNA1993 SNA1993
Latvia ESA2010 ESA2010*
Russia SNA1993 SNA1993 (GFSM2001)
* The source for the financial government accounts for these countries refers to the Eurostat government financestatistics (database) as it reflects the latest updated data (which are transmitted on a quarterly basis). For the othercountries of the same domain the latest updated data are drawn from the OECD National Accounts Statistics(database).
GOVERNMENT AT A GLANCE 2015 © OECD 2015192
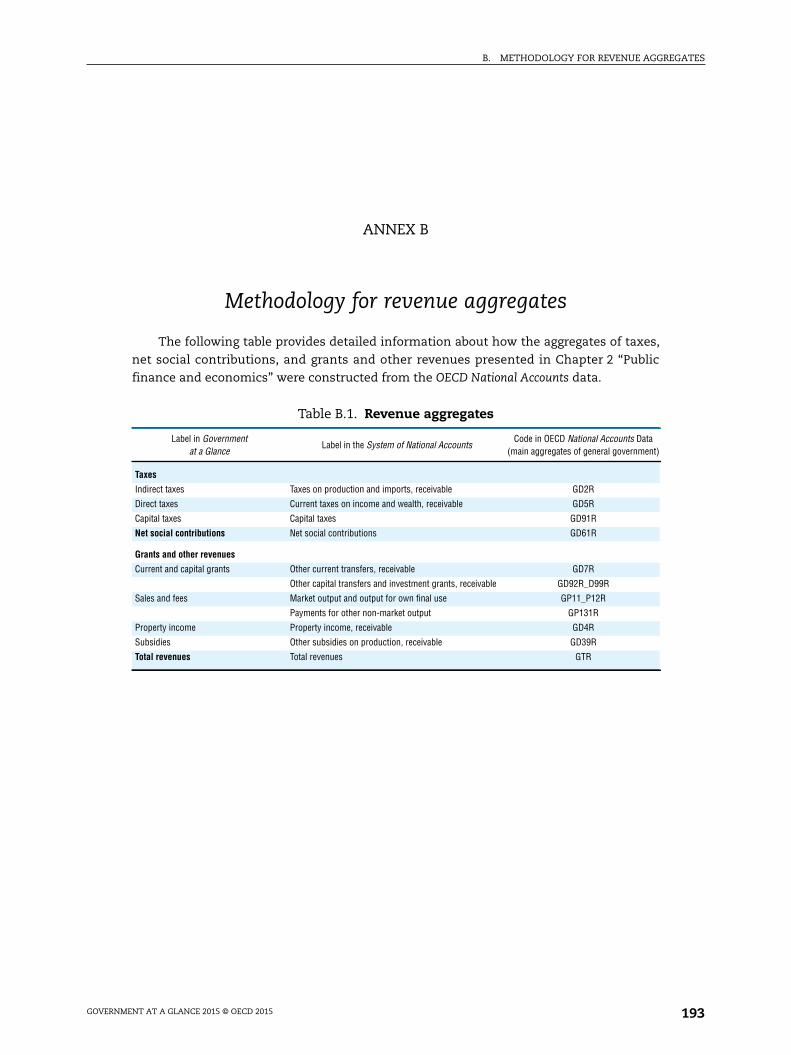
B. METHODOLOGY FOR REVENUE AGGREGATES
ANNEX B
Methodology for revenue aggregates
The following table provides detailed information about how the aggregates of taxes,
net social contributions, and grants and other revenues presented in Chapter 2 “Public
finance and economics” were constructed from the OECD National Accounts data.
Table B.1. Revenue aggregates
Label in Governmentat a Glance
Label in the System of National AccountsCode in OECD National Accounts Data
(main aggregates of general government)
Taxes
Indirect taxes Taxes on production and imports, receivable GD2R
Direct taxes Current taxes on income and wealth, receivable GD5R
Capital taxes Capital taxes GD91R
Net social contributions Net social contributions GD61R
Grants and other revenues
Current and capital grants Other current transfers, receivable GD7R
Other capital transfers and investment grants, receivable GD92R_D99R
Sales and fees Market output and output for own final use GP11_P12R
Payments for other non-market output GP131R
Property income Property income, receivable GD4R
Subsidies Other subsidies on production, receivable GD39R
Total revenues Total revenues GTR
GOVERNMENT AT A GLANCE 2015 © OECD 2015 193

C. CLASSIFICATION OF THE FUNCTIONS OF GOVERNMENT (COFOG)
ANNEX C
Classification of the Functions of Government (COFOG)
Developed by the OECD, the Classification of the Functions of Government (COFOG)
classifies government expenditure data from the System of National Accounts by the purpose
for which the funds are used. As Table C.1 illustrates, first-level COFOG splits expenditure
data into ten “functional” groups or sub-sectors of expenditures (such as economic affairs,
education and social protection), and second-level COFOG further splits each first-level
group into up to nine sub-groups. While first-level COFOG data are available for 32 out of
the 34 OECD member countries (according to time-series availability), second-level COFOG
data are currently only available for 21 OECD European member countries plus Japan.*
Table C.1. First- and second-level COFOG
First-level Second-level
General public services ● Executive and legislative organs, financial and fiscal affairs, external affairs● Foreign economic aid● General services● Basic research● R&D general public services● General public services n.e.c.● Public debt transactions● Transfers of a general character between different levels of government
Defence ● Military defence● Civil defence● Foreign military aid● R&D defence● Defence n.e.c.
Public order and safety ● Police services● Fire-protection services● Law courts● Prisons● R&D public order and safety● Public order and safety n.e.c.
* First-level COFOG expenditures data are not available for Chile and Mexico. Until recently, secondlevel COFOG data were available in some national statistical offices, but were not collected byinternational organisations. Moreover, the second-level COFOG data were not comparable amongcountries because the SNA/UN guide and the International Monetary Fund Manual on GovernmentFinance Statistics do not provide much practical information on the application of COFOG concepts.However, in 2005, Eurostat established a task force to develop a manual on the application of COFOGto national account expenditure data and to discuss the collection of second-level COFOG data forEuropean countries. Second-level COFOG data are not available for Turkey and all non-Europeanmember countries of the OECD (except Japan): Australia, Canada, Chile, Israel, Korea, Mexico, NewZealand and the United States. In addition, these data are available only for selected COFOGdivisions in some members of the EU. Efforts are underway to reach agreement with these countriesabout the submission of these data to the OECD.
GOVERNMENT AT A GLANCE 2015 © OECD 2015194
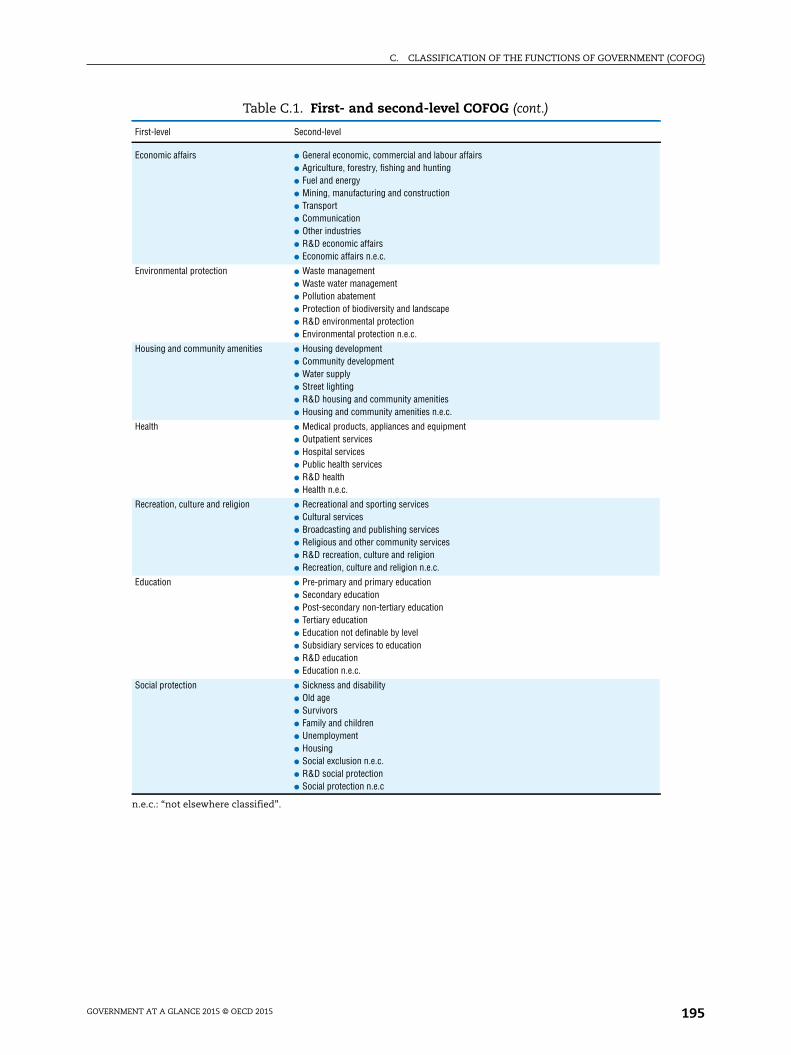
C. CLASSIFICATION OF THE FUNCTIONS OF GOVERNMENT (COFOG)
Economic affairs ● General economic, commercial and labour affairs● Agriculture, forestry, fishing and hunting● Fuel and energy● Mining, manufacturing and construction● Transport● Communication● Other industries● R&D economic affairs● Economic affairs n.e.c.
Environmental protection ● Waste management● Waste water management● Pollution abatement● Protection of biodiversity and landscape● R&D environmental protection● Environmental protection n.e.c.
Housing and community amenities ● Housing development● Community development● Water supply● Street lighting● R&D housing and community amenities● Housing and community amenities n.e.c.
Health ● Medical products, appliances and equipment● Outpatient services● Hospital services● Public health services● R&D health● Health n.e.c.
Recreation, culture and religion ● Recreational and sporting services● Cultural services● Broadcasting and publishing services● Religious and other community services● R&D recreation, culture and religion● Recreation, culture and religion n.e.c.
Education ● Pre-primary and primary education● Secondary education● Post-secondary non-tertiary education● Tertiary education● Education not definable by level● Subsidiary services to education● R&D education● Education n.e.c.
Social protection ● Sickness and disability● Old age● Survivors● Family and children● Unemployment● Housing● Social exclusion n.e.c.● R&D social protection● Social protection n.e.c
n.e.c.: “not elsewhere classified”.
Table C.1. First- and second-level COFOG (cont.)
First-level Second-level
GOVERNMENT AT A GLANCE 2015 © OECD 2015 195

D. DETAILED DATA ON CONFLICT OF INTEREST DISCLOSURE
ANNEX D
Detailed data on conflict of interest disclosure
This annex provides data for each responding country on the types of private interests
that they require central government decision makers to disclose as well as the level of
transparency of these disclosures. The data underlie the summary of data presented in
Figures 7.3 and 7.4.
When calculating an aggregate of the country specific data provided on the private
interest disclosure in three branches of government and its level of public availability, all
private interests and all positions were deemed equally important and were therefore
assigned the same weights. To translate the country responses into a point system, the
categories “Prohibited” and “Information is disclosed and publicly available online or print”
were awarded with 100 points, the highest available. “Information is disclosed and publicly
available upon request” was awarded with the second highest point, 67, and “Information
is disclosed and not publicly available” was awarded with the third highest point, 33. No
points were awarded to the category “Disclosure is not required”. All private interests
examined were weighted equally.
Notes of Table D.1In Australia, data regarding tax and customs officials refer to tax officials. Data
regarding financial authorities refer to employees of the Australian Prudential Regulation
Authority (APRA) and board members of the Australian Securities and Investments
Commission (ASIC). In Austria, the disclosure requirement of private interests for political
advisors depends on their previous employment. The information in the table reflects
those who were civil servants before their engagement as political advisors. For those who
worked in the private sector prior their function as political advisors, the disclosure
requirement would depend on individual contracts. In Estonia, regular civil servants, tax
officials, prosecutors, and procurement officials are generally not obliged to declare their
private interests. Exceptions are possible if the head of their institutions has considered
the obligation necessary (in case there are certain requirements fulfilled: no other means
to prevent corruption, etc.). In case a post referred earlier is obliged to disclose their private
interest, the disclosure requirements are the same with senior civil servants. In Finland,
data regarding judges exclude lay judges. Political advisors/appointees and tax and
Customs officials have the same requirements as civil servants/senior civil servants. In
France, different rules on public availability of the declared information apply according to
the positions and the declared information, the detailed rules of which are specified in law
n. 2013-97 on transparency in public life. In Germany, the rules for political appointees
depend on their legal status. Gifts above a certain amount need to be approved or are
prohibited and the thresholds differ depending on the officials' position. Previous
GOVERNMENT AT A GLANCE 2015 © OECD 2015196

D. DETAILED DATA ON CONFLICT OF INTEREST DISCLOSURE
employment, assets and liabilities (declaration of sound financial circumstance) of tax
customs officers have to be disclosed before taking office. In Hungary, the act prescribes
asset disclosure obligations for civil servants who have drafting, decision-making and
control competences or occupies higher position. In Israel, political advisors fill out a
conflict of interest form, including questions on substantial assets and liabilities as well as
outside positions and occupations. Where there is a possibility of conflict of interest they
are required to sign an agreement to ensure that conflict of interest situations are avoided
and such agreements are made publicly available upon request. Mexico’s data for
legislative and judicial branches are from 2012 Survey on Managing Conflict of Interest.
Prosecutors are not under judicial branch in New Zealand and the United States. Norway’sdata regarding judges exclude lay judges and judges in conciliation boards. In Slovenia,
civil servants who participate in procurement procedures have higher disclosure
requirements than civil servants in general. In the United Kingdom, relevant previous
employment of Ministers and senior civil servants are declared and may be made public
where relevant to their current post.
GOVERNMENT AT A GLANCE 2015 © OECD 2015 197

D.
DET
AILED
DA
TA
ON
CO
NFLIC
TO
FIN
TER
ESTD
ISCLO
SUR
E
GO
VER
NM
ENT
AT
AG
LAN
CE
2015©
OEC
D2015
198 mation by country (2014)
VK SVN ESP SWE CHE TUR GBR USA BRA COL LVA RUS
✦ ✕ ✕ ✕ ● ✕ ● ✦ ✦ ● ●
✦ ✕ ✕ ✕ ● ✕ ● ✦ ✦ ● ✦
❍ ✕ ✕ ✕ ● ✕ ● ✦ ✦ ● ●
❍ ✕ ✕ ✕ ● ✕ ● ✦ ✦ ● ●
✦ ✕ ✕ ✕ P ✕ ● ✦ ✦ ● ✦
✦ ✕ ✕ ✕ ● ✕ ● ✦ ✦ ● ✦
◗ ✕ ✕ ✕ P ✕ ● ❍ ❍ ● P✦ ✕ ✕ ✕ ● ✕ ● ✦ ● ❍ ✦
✦ ● ◗ ❍ ✦ ● ✕ ✕ ✕ ● ●
✦ ● ◗ ❍ ✦ ● ✕ ✕ ✕ ● ✦
❍ ✦ ◗ ❍ ✦ ● ✕ ✕ ✕ ● ●
❍ ✦ ◗ ❍ ✦ ● ✕ ✕ ✕ ● ●
✦ ◗ P P P ● ✕ ✕ ✕ ● ✦
✦ ◗ P P ✦ ● ✕ ✕ ✕ ● ✦
◗ ✦ P ❍ P ● ✕ ✕ ✕ ● P✦ ◗ ❍ ❍ ✦ ❍ ✕ ✕ ✕ ❍ ✦
✦ ● ◗ ❍ ✦ ● ◗ ✦ ✦ ● ●
✦ ● ◗ ❍ ✦ ● ◗ ✦ ✦ ● ✦
❍ ✦ ◗ ❍ ✦ ● ◗ ✦ ✦ ● ●
❍ ✦ ◗ ❍ ✦ ● ◗ ✦ ✦ ● ●
✦ ◗ P P P ● ◗ ✦ ✦ ● ✦
✦ ◗ P P ✦ ● ◗ ✦ ✦ ● ✦
◗ ✦ P ❍ P ● ◗ P ❍ ● P✦ ◗ ❍ ❍ ✦ ✦ ◗ ✦ ● ❍ ✦
❍ ❍ ◗ ❍ ✦ ✦ ◗ ✦ ✦ ● ●
❍ ❍ ◗ ❍ ✦ ✦ ◗ ✦ ✦ ● ✦
❍ ❍ ❍ ❍ ✦ ✦ ◗ ✦ ✦ ● ●
❍ ❍ ◗ ❍ ✦ ✦ ◗ ✦ ✦ ● ●
✦ ❍ ❍ ● P ✦ ◗ ✦ ✦ ● ✦
✦ ❍ ❍ ● ✦ ✦ ◗ ✦ ✦ ● ✦
◗ ❍ P ❍ P ● ◗ P ❍ ● P❍ ❍ ❍ ❍ ✦ ✦ ◗ ✦ ● ❍ ✦
✦ ● ◗ ❍ ✦ ✦ ◗ ✦ ✦ ● ●
✦ ● ◗ ❍ ✦ ✦ ◗ ✦ ✦ ● ✦
❍ ✦ ❍ ❍ ✦ ✦ ◗ ✦ ✦ ● ●
❍ ✦ ◗ ❍ ✦ ✦ ◗ ✦ ✦ ● ●
✦ ◗ ❍ ✦ P ✦ ◗ ✦ ✦ ● ✦
✦ ◗ ❍ ✦ ✦ ✦ ◗ ✦ ✦ ● ✦
◗ ✦ P ◗ P ● ◗ P ❍ ● P✦ ◗ ❍ ✦ ✦ ✦ ◗ ✦ ● ❍ ✦
Table D.1. Disclosure of selected private interests and public availability of disclosed infor
AUS AUT BEL CAN CHL CZE EST FIN FRA DEU GRC HUN ISL IRL ISR ITA JPN KOR MEX NLD NZL NOR POL PRT S
EXEC
UTIV
EBR
ANCH
Pres
iden
t
Assets ✕ ❍ ✕ ✕ ● ❍ ● ❍ ● ❍ ❍ ◗ ❍ ❍ ✕ ✕ ✕ ● ✦ ✕ ✕ ✕ ✦ ● ●
Liabilities ✕ ❍ ✕ ✕ ● ❍ ● ❍ ● ❍ ❍ ● ❍ ❍ ✕ ✕ ✕ ● ✦ ✕ ✕ ✕ ✦ ● ●
Income sources ✕ ❍ ✕ ✕ ❍ ❍ ● ❍ ● ❍ ❍ ● ❍ ❍ ✕ ✕ ✕ ● ✦ ✕ ✕ ✕ ✦ ● ●
Income Amount ✕ ❍ ✕ ✕ ❍ ❍ ✦ ❍ ● ❍ ❍ ● ❍ ❍ ✕ ✕ ✕ ● ✦ ✕ ✕ ✕ ✦ ● ●
Outside position: Paid ✕ P ✕ ✕ ● ❍ ● ❍ ❍ P ❍ P ❍ ❍ ✕ ✕ ✕ ◗ ✦ ✕ ✕ ✕ ✦ P ●
Outside position:Non-Paid ✕ P ✕ ✕ ● ❍ ❍ ❍ ❍ ❍ ❍ P ❍ ❍ ✕ ✕ ✕ ◗ ✦ ✕ ✕ ✕ ✦ P ●
Gifts ✕ P ✕ ✕ ❍ ❍ ● ❍ ❍ ❍ ❍ ● ❍ ❍ ✕ ✕ ✕ ● P ✕ ✕ ✕ ❍ ● ❍
Previous Employment ✕ ❍ ✕ ✕ ❍ ❍ ● ❍ ❍ ❍ ❍ ❍ ❍ ❍ ✕ ✕ ✕ ● ✦ ✕ ✕ ✕ ❍ ● ●
Prim
eM
inis
ter
Assets ● ✦ ✦ ● ✕ ◗ ● ● ● ❍ ● ● ● ● ✦ ● ◗ ● ✕ ✦ ● ◗ ● ● ●
Liabilities ● ✦ ❍ ● ✕ ◗ ● ● ● ❍ ❍ ● ❍ ❍ ✦ ❍ ◗ ● ✕ ✦ ● ❍ ● ● ●
Income sources ● ❍ ❍ ✦ ✕ ◗ ● ● ● ❍ ● ● ● ● ✦ ❍ ◗ ● ✕ ✦ ● ◗ ● ● ●
Income Amount ❍ ❍ ❍ ✦ ✕ ◗ ✦ ● ● ❍ ● ● ❍ ❍ ✦ ● ◗ ● ✕ ✦ ● ◗ ● ● ●
Outside position: Paid ● P ● P ✕ ◗ ● ● ● P ● P ● P P P P ◗ ✕ P ● ● ● P ●
Outside position:Non-Paid ● ✦ ● ● ✕ ◗ ❍ ● ❍ ❍ ● P ● P ❍ P ❍ ◗ ✕ P ● ● ● P ●
Gifts ● P P ● ✕ ◗ ● ● ❍ ✦ ✦ ● ● ● P ❍ ◗ ◗ ✕ ● ● ● ● ● ❍
Previous Employment ❍ ❍ ❍ ✦ ✕ ❍ ● ❍ ● ❍ ● ❍ ● ❍ ◗ ❍ ❍ ◗ ✕ ◗ ❍ ● ❍ ● ●
Min
iste
rsor
Mem
bers
ofca
bine
t
Assets ● ✦ ✦ ● ● ◗ ● ● ● ❍ ● ● ● ● ✦ ● ◗ ● ✦ ✦ ● ◗ ● ● ●
Liabilities ● ✦ ❍ ● ● ◗ ● ● ● ❍ ❍ ● ❍ ❍ ✦ ❍ ◗ ● ✦ ✦ ● ❍ ● ● ●
Income sources ● ❍ ❍ ✦ ❍ ◗ ● ● ● ❍ ● ● ● ● ✦ ❍ ❍ ● ✦ ✦ ● ◗ ● ● ●
Income Amount ❍ ❍ ❍ ✦ ❍ ◗ ✦ ● ● ❍ ● ● ❍ ✦ ✦ ● ❍ ● ✦ ✦ ● ◗ ● ● ●
Outside position: Paid ● P ● P ● ◗ ● ● ● P ● P ● P P P P ◗ ✦ P ● ● ● P ●
Outside position:Non-Paid ● ✦ ● ● ● ◗ ❍ ● ❍ ❍ ● P ● P ❍ P ❍ ◗ ✦ P ● ● ● P ●
Gifts ● P P ● ● ◗ ● ● ❍ ✦ ✦ ● ● ● P ❍ ❍ ◗ P ● ● ● ● ● ❍
Previous Employment ❍ ❍ ❍ ✦ ❍ ❍ ● ❍ ● ❍ ● ❍ ● ❍ ◗ ❍ ❍ ◗ ✦ ◗ ❍ ● ❍ ● ●
Polit
ical
advi
sors
/ap
poin
tees
Assets ❍ ❍ ✦ ● ❍ ❍ ❍ ✕ ● ✕ ✦ ✦ ❍ ● ✦ ✦ ❍ ● ✦ ❍ ❍ ◗ .. ❍ ●
Liabilities ❍ ❍ ❍ ● ❍ ❍ ❍ ✕ ● ✕ ❍ ✦ ❍ ❍ ✦ ❍ ❍ ● ✦ ❍ ❍ ❍ .. ❍ ●
Income sources ❍ ❍ ❍ ✦ ❍ ❍ ❍ ✕ ● ✕ ✦ ✦ ❍ ● ✦ ✦ ❍ ● ✦ ❍ ❍ ◗ .. ❍ ●
Income Amount ❍ ✦ ❍ ✦ ❍ ❍ ❍ ✕ ● ✕ ✦ ✦ ❍ ✦ ✦ ✦ ❍ ● ✦ ❍ ❍ ◗ .. ❍ ●
Outside position: Paid ✦ ✦ ● P ❍ ❍ ❍ ✕ ● ✕ ✦ P ❍ P ◗ ✦ ❍ ◗ ✦ ✦ ✦ ◗ .. ✦ ●
Outside position:Non-Paid ✦ ✦ ● ● ❍ ❍ ❍ ✕ ❍ ✕ ✦ ❍ ❍ ✦ ◗ ✦ ❍ ◗ ✦ ✦ ❍ ◗ .. ✦ ●
Gifts ❍ P P ● ❍ ❍ ❍ ✕ ❍ ✕ ❍ P ❍ ● P ✦ ❍ ◗ P ✦ ◗ ◗ .. ❍ ❍
Previous Employment ❍ ❍ ❍ ✦ ❍ ❍ ❍ ✕ ● ✕ ✦ ❍ ❍ ❍ ✦ ❍ ❍ ◗ ✦ ✦ ✦ ◗ .. ❍ ●
Seni
orCi
vilS
erva
nts
Assets ✦ ❍ ✦ ● ● ◗ ● ✦ ● ❍ ✦ ✦ ❍ ✦ ✦ ✦ ❍ ● ✦ ✦ ❍ ◗ ✦ ❍ ✦
Liabilities ✦ ❍ ❍ ● ● ◗ ● ✦ ● ❍ ❍ ✦ ❍ ❍ ✦ ❍ ❍ ● ✦ ✦ ❍ ❍ ✦ ❍ ❍
Income sources ✦ ❍ ❍ ✦ ❍ ◗ ● ✦ ● ✦ ✦ ✦ ❍ ✦ ✦ ✦ ✦ ● ✦ ❍ ❍ ◗ ❍ ❍ ❍
Income Amount ✦ ✦ ❍ ✦ ❍ ◗ ✦ ✦ ● ✦ ✦ ✦ ❍ ✦ ✦ ✦ ✦ ● ✦ ❍ ● ◗ ❍ ❍ ❍
Outside position: Paid ✦ ✦ ● P ● ◗ ✦ ◗ ● ✦ ✦ P ❍ P ◗ ✦ ✦ ◗ ✦ ✦ ✦ ◗ ◗ ✦ ❍
Outside position:Non-Paid ✦ ✦ ● ● ● ◗ ❍ ❍ ❍ ✦ ✦ ❍ ❍ ✦ ◗ ✦ ✦ ◗ ✦ ✦ ❍ ◗ ❍ ✦ ❍
Gifts ✦ P P ● ● ◗ ● ❍ ❍ ✦ ❍ P ❍ ✦ P ✦ ◗ ◗ P ✦ ● ◗ ❍ ❍ ❍
Previous Employment ❍ ❍ ❍ ✦ ❍ ❍ ● ❍ ● ✦ ✦ ❍ ❍ ❍ ❍ ❍ ❍ ◗ ✦ ✦ ✦ ◗ ❍ ❍ ❍

GO
VER
NM
ENT
AT
AG
LAN
CE
2015©
OEC
D2015
199
D.
DET
AILED
DA
TA
ON
CO
NFLIC
TO
FIN
TER
ESTD
ISCLO
SUR
E
mation by country (2014)
VK SVN ESP SWE CHE TUR GBR USA BRA COL LVA RUS
❍ ❍ ◗ ❍ ✦ ✦ ❍ ❍ ✦ ● ●
❍ ❍ ◗ ❍ ✦ ✦ ❍ ❍ ✦ ● ✦
❍ ❍ ❍ ❍ ✦ ✦ ❍ ❍ ✦ ● ●
❍ ❍ ◗ ❍ ✦ ✦ ❍ ❍ ✦ ● ●
✦ ❍ ❍ ✦ P ✦ ❍ ❍ ✦ ● ✦
✦ ❍ ❍ ✦ ✦ ✦ ❍ ❍ ✦ ● ✦
◗ ❍ P ◗ P ✦ ❍ ❍ ❍ ● P❍ ❍ ❍ ✦ ✦ ✦ ❍ ❍ ● ❍ ✦
❍ ✦✕
❍✕
● ● ◗ ✦✕
●
❍ ✦ ✕ ❍ ✕ ❍ ● ◗ ✦ ✕ ✦
❍ ✦ ✕ ❍ ✕ ● ● ◗ ✦ ✕ ●
❍ ✦ ✕ ❍ ✕ ● ● ◗ ✦ ✕ ●
❍ ● ✕ ● ✕ ● ● ◗ ✦ ✕ ✦
❍ ● ✕ ● ✕ ● ● ◗ ✦ ✕ ✦
◗ ❍ ✕ ❍ ✕ ● ● ❍ ❍ ✕ P❍ ● ✕ ❍ ✕ ❍ ● ◗ ● ✕ ✦
✦ ✦ ◗ ❍ ✦ ● ● ✦ ✦ ● ●
✦ ✦ ❍ ❍ ✦ ● ● ✦ ✦ ● ✦
❍ ✦ ❍ ❍ ✦ ● ● ✦ ✦ ● ●
❍ ✦ ◗ ❍ ✦ ● ● ✦ ✦ ● ●
✦ ● ◗ ● P ● ● ✦ ✦ ● ✦
✦ ● ◗ ● ✦ ❍ ● ✦ ✦ ● ✦
◗ ❍ P ❍ P ● ● ❍ ❍ ● P✦ ● ◗ ❍ ✦ ❍ ● ✦ ● ❍ ✦
✦ ❍ ◗ ❍ ✦ ❍ ◗ ✦ ✦ ● ●
✦ ❍ ❍ ❍ ✦ ❍ ◗ ✦ ✦ ● ✦
❍ ❍ ❍ ❍ ✦ ❍ ◗ ✦ ✦ ● ●
❍ ❍ ◗ ❍ ✦ ❍ ◗ ✦ ✦ ● ●
✦ ✦ ❍ ✦ P P ◗ P ✦ ● ✦
✦ ✦ ❍ ✦ ✦ ❍ ◗ P ✦ ● ✦
◗ ❍ P ❍ P ❍ ◗ ❍ ❍ ● P✦ ❍ ❍ ❍ ✦ ❍ ◗ ✦ ● ❍ ✦
✦ ❍ ◗ ❍ ✦ ❍ ✕ ✦ ✦ ● ●
✦ ❍ ❍ ❍ ✦ ❍ ✕ ✦ ✦ ● ✦
❍ ❍ ❍ ❍ ✦ ❍ ✕ ✦ ✦ ● ●
❍ ❍ ◗ ❍ ✦ ❍ ✕ ✦ ✦ ● ●
✦ ✦ ❍ ✦ P P ✕ ✦ ✦ ● ✦
✦ ✦ ❍ ✦ ✦ ❍ ✕ ✦ ✦ ● ✦
◗ ❍ P ✦ P ❍ ✕ ❍ ❍ ● P✦ ❍ ❍ ❍ ✦ ❍ ✕ ✦ ● ❍ ✦
Table D.1. Disclosure of selected private interests and public availability of disclosed infor
AUS AUT BEL CAN CHL CZE EST FIN FRA DEU GRC HUN ISL IRL ISR ITA JPN KOR MEX NLD NZL NOR POL PRT S
EXEC
UTIV
EBR
ANCH
Civi
lSer
vant
s
Assets ❍ ❍ ❍ ✦ ❍ ❍ ❍ ❍ ❍ ❍ ✦ ❍ ❍ ✦ ❍ ❍ ❍ ◗ ✦ ❍ ❍ ◗ ✦ ❍ ✦
Liabilities ❍ ❍ ❍ ✦ ❍ ❍ ❍ ❍ ❍ ❍ ❍ ❍ ❍ ❍ ❍ ❍ ❍ ◗ ✦ ❍ ❍ ❍ ✦ ❍ ❍
Income sources ✦ ❍ ❍ ✦ ❍ ❍ ❍ ❍ ❍ ✦ ✦ ❍ ❍ ❍ ❍ ❍ ❍ ◗ ✦ ❍ ❍ ◗ ❍ ❍ ❍
Income Amount ❍ ✦ ❍ ✦ ❍ ❍ ✦ ❍ ❍ ✦ ✦ ❍ ❍ ❍ ❍ ❍ ❍ ◗ ✦ ❍ ❍ ◗ ❍ ❍ ❍
Outside position: Paid ❍ ✦ ✦ ✦ ❍ ❍ ✦ ◗ ❍ ✦ ✦ ❍ ❍ ✦ ✦ ✦ ✦ ◗ ✦ ✦ ✦ ◗ ◗ ✦ ❍
Outside position:Non-Paid ❍ ✦ ✦ ✦ ❍ ❍ ❍ ❍ ❍ ✦ ✦ ❍ ❍ ❍ ◗ ✦ ✦ ◗ ✦ ✦ ❍ ◗ ❍ ✦ ❍
Gifts ❍ P P ✦ ❍ ❍ ❍ ❍ ❍ ✦ ❍ P ❍ ✦ P ✦ ✦◗ ◗ P ✦ ◗ ◗ ❍ ❍ ❍
Previous Employment ❍ ❍ ❍ ✦ ❍ ❍ ❍ ❍ ❍ ✦ ✦ ❍ ❍ ❍ ✦ ❍ ❍ ◗ ✦ ✦ ✦ ◗ ❍ ❍ ❍
LEGI
SLAT
IVE
BRAN
CH
Uppe
rHou
seLe
gisl
ator
s Assets ● ❍ ✦ ◗ ● ◗✕ ✕
◗✕ ✕ ✕ ✕
●✕
◗ ◗✕
✦ ❍✕ ✕
●✕ ✕
Liabilities ● ❍ ❍ ◗ ● ◗ ✕ ✕ ◗ ✕ ✕ ✕ ✕ ❍ ✕ ◗ ◗ ✕ ✦ ❍ ✕ ✕ ● ✕ ✕
Income sources ● ● ❍ ◗ ❍ ◗ ✕ ✕ ◗ ✕ ✕ ✕ ✕ ● ✕ ◗ ◗ ✕ ✦ ❍ ✕ ✕ ● ✕ ✕
Income Amount ❍ ● ❍ ✦ ❍ ◗ ✕ ✕ ◗ ✕ ✕ ✕ ✕ ● ✕ ◗ ◗ ✕ ✦ ❍ ✕ ✕ ● ✕ ✕
Outside position: Paid ● ● ● ◗ ● ◗ ✕ ✕ ● ✕ ✕ ✕ ✕ ● ✕ ◗ ◗ ✕ ✦ ● ✕ ✕ ● ✕ ✕
Outside position:Non-Paid ● ✦ ● ◗ ● ◗ ✕ ✕ ● ✕ ✕ ✕ ✕ ❍ ✕ ◗ ❍ ✕ ✦ ● ✕ ✕ ● ✕ ✕
Gifts ● P P ◗ ● ◗ ✕ ✕ ❍ ✕ ✕ ✕ ✕ ● ✕ P ◗ ✕ P ● ✕ ✕ ● ✕ ✕
Previous Employment ❍ ❍ ❍ ◗ ❍ ❍ ✕ ✕ ● ✕ ✕ ✕ ✕ ❍ ✕ ◗ ❍ ✕ ✦ ❍ ✕ ✕ ❍ ✕ ✕
Low
erHo
use
Legi
slat
ors
Assets ● ❍ ✦ ● ● ◗ ● ❍ ◗ ❍ ● ● ● ● ✦ ◗ ◗ ● ✦ ❍ ● ◗ ● ● ●
Liabilities ● ❍ ❍ ● ● ◗ ● ❍ ◗ ❍ ❍ ● ❍ ❍ ✦ ◗ ◗ ● ✦ ❍ ● ❍ ● ● ●
Income sources ● ● ❍ ● ❍ ◗ ● ❍ ◗ ● ● ● ● ● ✦ ◗ ◗ ● ✦ ● ● ◗ ● ● ●
Income Amount ❍ ● ❍ ✦ ❍ ◗ ✦ ❍ ◗ ● ● ● ❍ ● ✦ ◗ ◗ ● ✦ ● ● ❍ ● ● ●
Outside position: Paid ● ● ● ● ● ◗ ● ❍ ● ● ● P ● ● P ◗ ◗ ◗ ✦ ● ● ◗ ● ● ●
Outside position:Non-Paid ● ✦ ● ❍ ● ◗ ❍ ❍ ● ● ● P ● ❍ P ◗ ❍ ◗ ✦ ● ● ◗ ● ● ●
Gifts ● P P ● ● ◗ ● ❍ ❍ ✦ ✦ ● ● ● P P ◗ ◗ P ● ● ◗ ● ● ❍
Previous Employment ❍ ❍ ❍ ● ❍ ❍ ● ❍ ● ● ● ❍ ● ❍ ❍ ◗ ❍ ● ✦ ❍ ❍ ◗ ❍ ● ●
JUDI
CIAL
BRAN
CH
Judg
es
Assets ❍ ❍ .. ❍ ● ❍ ● ✦ ● ❍ ✦ ✦ ❍ ❍ ✦ ◗ ❍ ● ✦ ❍ ❍ ❍ ✦ ❍ ●
Liabilities ✦ ❍ .. ❍ ● ❍ ● ✦ ● ❍ ✦ ✦ ❍ ❍ ✦ ◗ ❍ ● ✦ ❍ ❍ ❍ ✦ ❍ ●
Income sources ❍ ❍ .. ❍ ❍ ❍ ● ❍ ● ❍ ✦ ✦ ✦ ❍ ✦ ◗ ✦ ● ✦ ❍ ❍ ◗ ✦ ❍ ●
Income Amount ❍ ✦ .. ❍ ❍ ❍ ✦ ❍ ● ❍ ✦ ✦ ❍ ❍ ✦ ◗ ✦ ● ✦ ● ❍ ❍ ✦ ❍ ●
Outside position: Paid ✦ ✦ .. ❍ ● ❍ ● ◗ ● ✦ ✦ P ✦ ❍ P ◗ ✦ ◗ ✦ ● ❍ ◗ ✦ P ●
Outside position:Non-Paid ✦ ✦ .. ❍ ● ❍ ❍ ◗ ❍ ✦ ✦ P ❍ ❍ ✦ ◗ ✦ ◗ ✦ ● ❍ ◗ ✦ P ❍
Gifts ❍ P .. ❍ ❍ ❍ ● ❍ ❍ P P ✦ ❍ ❍ ✦ P ❍ ◗ P P ❍ P ❍ P ❍
Previous Employment ✦ ✦ .. ❍ ❍ ❍ ✦ ❍ ● ✦ ✦ ❍ ❍ ❍ ✦ ◗ ✦ ◗ ✦ ❍ ❍ ◗ ❍ ❍ ❍
Pros
ecut
ors
Assets ❍ ❍ .. ✦ ● ❍ ❍ ◗ ● ❍ ✦ ✦ ❍ ✦ ✦ ◗ ❍ ● ✦ ❍ ✕ ❍ ✦ ❍ ●
Liabilities ❍ ❍ .. ✦ ● ❍ ❍ ❍ ● ❍ ✦ ✦ ❍ ❍ ✦ ◗ ❍ ● ✦ ❍ ✕ ❍ ✦ ❍ ❍
Income sources ❍ ❍ .. ❍ ❍ ❍ ❍ ❍ ● ❍ ✦ ✦ ✦ ❍ ✦ ◗ ✦ ● ✦ ❍ ✕ ❍ ✦ ❍ ❍
Income Amount ❍ ✦ .. ❍ ❍ ❍ ❍ ● ● ❍ ✦ ✦ ❍ ❍ ✦ ◗ ✦ ● ✦ ❍ ✕ ❍ ✦ ❍ ❍
Outside position: Paid ✦ ✦ .. ✦ ● ❍ ✦ ◗ ● ✦ ✦ P ✦ ✦ P ◗ ✦ ◗ ✦ ● ✕ ✦ ✦ P ✦
Outside position:Non-Paid ✦ ✦ .. ✦ ● ❍ ✦ ❍ ❍ ✦ ✦ P ❍ ❍ ❍ ◗ ✦ ◗ ✦ ● ✕ ✦ ✦ P ❍
Gifts ✦ P .. ✦ ● ❍ ❍ ❍ ❍ P P ✦ ❍ ✦ P P ◗ ◗ P ✦ ✕ P ❍ P ❍
Previous Employment ❍ ✦ .. ❍ ❍ ❍ ❍ ❍ ● ✦ ✦ ❍ ❍ ❍ ✦ ◗ ❍ ◗ ✦ ● ✕ ◗ ❍ ❍ ❍

D.
DET
AILED
DA
TA
ON
CO
NFLIC
TO
FIN
TER
ESTD
ISCLO
SUR
E
GO
VER
NM
ENT
AT
AG
LAN
CE
2015©
OEC
D2015
200 mation by country (2014)
VK SVN ESP SWE CHE TUR GBR USA BRA COL LVA RUS
❍ ❍ ✦ ❍ ✦ ❍ ✦ ✦ ✦ ● ●
❍ ❍ ❍ ❍ ✦ ❍ ✦ ✦ ✦ ● ✦
❍ ❍ ❍ ✦ ✦ ❍ ✦ ✦ ✦ ● ●
❍ ❍ ✦ ✦ ✦ ❍ ❍ ✦ ✦ ● ●
✦ ✦ ❍ ✦ P P ✦ ❍ ✦ ● ✦
✦ ✦ ❍ ❍ ✦ ❍ ✦ ❍ ✦ ● ✦
◗ ❍ P ✦ P ❍ ✦ ❍ ❍ ● P❍ ❍ ❍ ❍ ✦ ❍ ✦ ❍ ● ❍ ✦
❍ ❍ ✕ ❍ ✦ ❍ ✦ ✦ ✦ ● ●
❍ ❍ ✕ ❍ ✦ ❍ ✦ ✦ ✦ ● ✦
❍ ❍ ✕ ✦ ✦ ❍ ✦ ✦ ✦ ● ●
❍ ❍ ✕ ✦ ✦ ❍ ❍ ✦ ✦ ● ●
❍ ✦ ✕ ✦ P P ✦ ✦ ✦ ● ✦
❍ ✦ ✕ ❍ ✦ ❍ ✦ ✦ ✦ ● ✦
❍ ❍ ✕ ✦ P ❍ ✦ ❍ ❍ ● P❍ ❍ ✕ ❍ ✦ ❍ ✦ ✦ ● ❍ ✦
❍ ❍ ✦ ❍ ✦ ◗ ✦ ✦ ✦ ● ●
❍ ❍ ✦ ❍ ✦ ❍ ✦ ✦ ✦ ● ✦
❍ ❍ ❍ ❍ ✦ ❍ ✦ ✦ ✦ ● ●
❍ ❍ ✦ ❍ ✦ ❍ ❍ ✦ ✦ ● ●
✦ ✦ ❍ ✦ P ● ✦ P ✦ ● ✦
✦ ✦ ❍ ✦ ✦ ● ✦ ❍ ✦ ● ✦
◗ ❍ P P P ● ✦ P ❍ ● P❍ ❍ ❍ ✦ ✦ ● ✦ ❍ ● ❍ ✦
P●
◗
✦
❍
✕
..Fo
2 http://dx.doi.org/10.1787/888933249637
Table D.1. Disclosure of selected private interests and public availability of disclosed infor
AUS AUT BEL CAN CHL CZE EST FIN FRA DEU GRC HUN ISL IRL ISR ITA JPN KOR MEX NLD NZL NOR POL PRT S
AT-R
ISK
AREA
SOF
FICI
ALS
Tax
and
Cust
oms
Offic
ials Assets ✦ ❍ ❍ ✦ ❍ ◗ ❍ ❍ ❍ ✦ ✦ ✦ ❍ ✦ ✦ ❍ ❍ ● ✦ .. ❍ ❍ ● ❍ ✦
Liabilities ✦ ❍ ❍ ✦ ❍ ◗ ❍ ❍ ❍ ✦ ❍ ✦ ❍ ❍ ✦ ❍ ❍ ● ✦ .. ❍ ❍ ● ❍ ❍
Income sources ✦ ❍ ❍ ❍ ❍ ◗ ❍ ❍ ❍ ✦ ✦ ✦ ❍ ❍ ✦ ◗ ✦ ● ✦ .. ❍ ❍ ● ❍ ❍
Income Amount ✦ ❍ ❍ ❍ ❍ ◗ ❍ ❍ ❍ ✦ ✦ ✦ ❍ ❍ ✦ ◗ ✦ ● ✦ .. ❍ ❍ ● ❍ ❍
Outside position: Paid ✦ ✦ ✦ ✦ ● ◗ ✦ ◗ ❍ ✦ ✦ P ❍ ✦ P ● ✦ ◗ ✦ .. ✦ ✦ ● ✦ ✦
Outside position:Non-Paid ✦ ✦ ✦ ✦ ● ◗ ✦ ❍ ❍ ✦ ✦ ❍ ❍ ❍ ❍ ● ✦ ◗ ✦ .. ❍ ✦ ❍ ✦ ❍
Gifts ✦ P P ✦ ❍ ◗ ❍ ❍ ❍ ✦ P P ❍ ✦ P P ◗ ◗ P .. ◗ ✦ ❍ P ❍
Previous Employment ❍ ❍ ❍ ❍ ❍ ❍ ❍ ❍ ❍ ✦ ✦ ❍ ❍ ❍ ✦ ● ❍ ◗ ✦ .. ✦ ✦ ❍ ❍ ❍
Proc
urem
entA
gent
s
Assets ✕ ❍ ❍ ✦ ❍ ◗ ❍ ✕ ❍ ❍ ✦ ✦ ❍ ✦ ✦ ✦ ❍ ● ✦ .. ❍ ❍ ❍ ❍ ✦
Liabilities ✕ ❍ ❍ ✦ ❍ ◗ ❍ ✕ ❍ ❍ ❍ ✦ ❍ ❍ ✦ ❍ ❍ ● ✦ .. ❍ ❍ ❍ ❍ ❍
Income sources ✕ ❍ ❍ ❍ ❍ ◗ ❍ ✕ ❍ ✦ ✦ ✦ ❍ ❍ ✦ ✦ ✦ ● ✦ .. ❍ ❍ ❍ ❍ ❍
Income Amount ✕ ❍ ❍ ❍ ❍ ◗ ❍ ✕ ❍ ✦ ✦ ✦ ❍ ❍ ✦ ✦ ✦ ● ✦ .. ❍ ❍ ❍ ❍ ❍
Outside position: Paid ✕ ✦ ✦ ✦ ❍ ◗ ✦ ✕ ❍ ✦ ✦ P ❍ ✦ P ✦ ✦ ◗ ✦ .. ✦ ❍ ❍ ✦ ✦
Outside position:Non-Paid ✕ ✦ ✦ ✦ ❍ ◗ ✦ ✕ ❍ ✦ ✦ ❍ ❍ ❍ ❍ ✦ ✦ ◗ ✦ .. ❍ ❍ ❍ ✦ ❍
Gifts ✕ P P ✦ ❍ ◗ ❍ ✕ ❍ P ❍ P ❍ ✦ P ✦ ◗ ◗ P .. ◗ ❍ ❍ P ❍
Previous Employment ✕ ❍ ❍ ❍ ❍ ❍ ❍ ✕ ❍ ❍ ✦ ❍ ❍ ❍ ✦ ❍ ❍ ◗ ✦ .. ✦ ❍ ❍ ❍ ❍
Fina
ncia
lAut
horit
ies
Assets ✦ ❍ ❍ ✦ ● ◗ ✦ ✦ ✦ ❍ ✦ ✦ ✦ ✦ ✦ ✦ ❍ ● ✦ .. ❍ ✦ ❍ ❍ ✦
Liabilities ✦ ❍ ❍ ✦ ● ◗ ✦ ✦ ❍ ❍ ❍ ✦ ✦ ❍ ✦ ✦ ❍ ● ✦ .. ❍ ✦ ❍ ❍ ❍
Income sources ❍ ❍ ❍ ❍ ❍ ◗ ❍ ✦ ❍ ✦ ✦ ✦ ✦ ❍ ✦ ✦ ✦ ● ✦ .. ❍ ✦ ❍ ❍ ❍
Income Amount ❍ ❍ ❍ ❍ ❍ ◗ ❍ ✦ ❍ ✦ ✦ ✦ ❍ ❍ ✦ ✦ ✦ ● ✦ .. ● ✦ ❍ ❍ ❍
Outside position: Paid ✦ ✦ ✦ ✦ ● ◗ ❍ ◗ ✦ ✦ ✦ P ❍ ✦ P ✦ ✦ ◗ ✦ .. ✦ ✦ ❍ ✦ ✦
Outside position:Non-Paid ✦ ✦ ✦ ✦ ● ◗ ❍ .. ✦ P ✦ ❍ ❍ ❍ ❍ ❍ ✦ ◗ ✦ .. ❍ ❍ ❍ ✦ ❍
Gifts ✦ P P ✦ ● ◗ ✦ ❍ ✦ P P P ❍ ✦ P P ◗ ◗ P .. ◗ P ❍ P ❍
Previous Employment ❍ ❍ ❍ ❍ ❍ ❍ ✦ ❍ ✦ ❍ ✦ ❍ ❍ ❍ ✦ ✦ ❍ ◗ ✦ .. ✦ ✦ ❍ ❍ ❍
Prohibited.Information is disclosed and publicly available online or print.Information is disclosed and publicly available upon request.Information is disclosed and not publicly available.Disclosure is not required.Not applicable (e.g. The country does not have such positions).Data are missing.
r country-specific notes see Statlink.1

E. OUR DATA INDEX: OPEN, USEFUL, REUSABLE GOVERNMENT DATA
ANNEX E
OUR Data Index:Open, Useful, Reusable Government Data
This annex provides data for each responding country on the efforts made by
government to proactively disclose and support re-use of Open Government Data. The data
underlie the summary of data presented in Figure 10.8.
Data used for the construction of the composite are derived from the 2014 OECD
Survey on Open Government Data. Survey respondents were predominantly Chief Data
Officers (CIO) in the Central/Federal government.
The narrowly defined composite indexes presented in Government at a Glance represent
the best way of summarising discrete, qualitative information on key aspects of Open
Government Data. “Composite indexes are much easier to interpret than trying to find a
common trend in many separate indicators” (Nardo et al., 2004). However, their
development and use can be controversial. These indexes are easily and often
misinterpreted by users due to a lack of transparency as to how they are generated and the
resulting difficulty to truly unpack what they are actually measuring.
The OECD has taken several steps to avoid or address common problems associated
with composite indexes. The composites presented in this publication adhere to the steps
identified in the Handbook on Constructing Composite Indicators (Nardo et al., 2008) that
are necessary for the meaningful construction of composite or synthetic indexes.
Each composite index is based on a theoretical framework representing an agreed
upon concept in the area it covers. For this index, the only international agreement
available – the G8 Open data Charter – was used as the main theoretical ground in
combination to Working Papers produced by the Secretariat and approved by country
delegates from the Public Governance Committee. The variables comprising the indexes
were selected based on their relevance to the concept by a group of experts within the
OECD. Further consultations with country delegates and relevant working parties will
allow to further expand and improve the relevance of the index in future years.
In addition:
Various statistical tools, such as factor analysis, were employed to establish that the
variables comprising each index are correlated and represent the same underlying
concept.
Different methods for imputing missing values have been explored.
All sub-indicators and variables were normalised for comparability.
To build the composites, all sub-indicators were aggregated using a linear method
according to the accepted methodology.
GOVERNMENT AT A GLANCE 2015 © OECD 2015 201

E. OUR DATA INDEX: OPEN, USEFUL, REUSABLE GOVERNMENT DATA
Sensitivity analysis using Monte Carlo simulations was carried out to establish the
robustness of the indicators to different weighting options. Considering that this index is a
pilot version equal weighting was provided for each variables and pillars.
The composite indexes presented in Government at a Glance are descriptive in nature,
and have been given titles to reflect this. The survey questions used to create the indexes
are the same across countries, ensuring that the indexes are comparable.
The OGD index does not purport to measure the overall quality of Open Government
Data results in each country (to do so would require a much stronger conceptual
foundation and normative assumptions) but rather the level of government efforts to
implement some of the good principles internationally agreed in terms of data availability,
accessibility and re-use support. The impact dimension is for instance not captured at all
in the index.
While the composite index was based on best practices and/or theory developed in
co-operation with member countries, the variables comprising the composites and their
weights are offered for debate and, consequently, may evolve over time.
The composites were built according to the following methodology: From the G8 Open
Data Charter and OECD Working Paper on Open Government Data (Ubaldi, 2013), three core
dimensions of good Open Data practices were identified:
1. Data availability: Providing a wide range of data produced by the public sector in open
format.
2. Data accessibility: Providing those data in a user-friendly way which includes the
provision of metadata and machine readable format (e.g. CSV).
3. Pro-active support from the government to foster innovative re-use of the data and
stakeholder’s engagement.
To narrow-down the universe the focus for the 2 first pillars (availability and
accessibility) is only on the Central/Federal Open Data Portal. Equal weights were given to the
three dimensions as well as to the underlying variables. Principal Component Factor analysis
was carried out to examine how a set of underlying variables (survey questions) are
associated and whether they are correlated with each other in order to select those which
capture the most of the underlying concept . Some variables were also kept based on experts’
judgement. Some estimation was made on the missing values for Norway, Sweden, Spain,
Ireland, the United States and Greece; All sub dimensions are weighted at 1/3 (33.3%). All
variables constructing the sub-dimensions are equally weighted. Source: 2014 OECD Survey
on Open Government Data Cronbach Alpha testing was done to ensure high correlation
among underlying variables in each dimension: Overall Cronbach Alpha = 0.81.
GOVERNMENT AT A GLANCE 2015 © OECD 2015202

GO
VER
NM
ENT
AT
AG
LAN
CE
2015©
OEC
D2015
203
E.O
UR
DA
TA
IND
EX:O
PEN,U
SEFUL,R
EUSA
BLE
GO
VER
NM
ENT
DA
TA
R POL PRT SVK SVN ESP SWE CHE GBR USA COL
N ❍ ● ❍ ❍ ● ❍ ● ❍ ● ❍
N ❍ ● ❍ ● ● ❍ ❍ ● ● ●
L ❍ ● ❍ ● ● ❍ ❍ ● ● ❍
T ❍ ● ❍ ❍ ❍ ❍ ❍ ● ● ●
A ❍ ● ❍ ● ● ❍ ● ● ❍ ●
●
❍
.. 2 http://dx.doi.org/10.1787/888933249643
R POL PRT SVK SVN ESP SWE CHE GBR USA COL
Ug
◗ ● ● ● ● ● ● ● ● ●
S ● ● ● ❍ ● ❍ ● ● ● ●
F ❍ ● ● ● ❍ ❍ ● ● ● ❍
R ❍ ● ● ● ● ❍ ❍ ● ● ●
V ❍ ● ❍ ❍ ● ❍ ❍ ● ❍ ●
R ❍ ❍ ❍ ● ● ❍ ● ● ❍ ❍
●
❍
.. 2 http://dx.doi.org/10.1787/888933249656
agement
R POL PRT SVK SVN ESP SWE CHE GBR USA COL
R ❍ ● ● ❍ ● ● ● ● ● ●
S ❍ ❍ ◗ ❍ .. ❍ ◗ .. ●
In ◗ ◗ ◗ ◗ ● .. ❍ ◗ .. ◗
Rp
❍ ❍ ❍ ❍ .. .. ❍ ◗ .. ●
O ❍ ◗ ◗ ❍ ● .. ● ◗ .. ●
D ❍ ◗ ❍ ◗ .. .. ◗ ◗ .. ◗
D ❍ ◗ ❍ ❍ .. .. ❍ ● .. ❍
T ◗ ◗ ❍ ◗ .. .. ◗ ● .. ◗
●
◗
❍
.. 2 http://dx.doi.org/10.1787/888933249660
Table E.1. Data availability on the national portal
AUS AUT BEL CAN CHL DNK EST FIN FRA DEU GRC IRL ITA JPN KOR MEX NLD NZL NO
ational elections results ● ● ● ● ❍ ● ❍ ● ● ● ● ❍ ❍ ● ● ❍ ● ● ●
ational public expenditures ● ❍ ● ● ● ● ❍ ● ● ● ● ● ❍ ● ● ● ❍ ● ❍
ocal public expenditures ❍ ● ❍ ❍ ❍ ❍ ❍ ● ● ● ● ❍ ❍ ❍ ● ❍ ● ● ●
he most recent national census ● ● ● ● ● ● ❍ ● ● ● ● ● ❍ ● ● ❍ ❍ ● ●
pplications re-using public data ● ● ● ● ❍ ❍ ● ❍ ● ● ● ❍ ● ● ● ❍ ❍ ● ●
Yes.No.Missing answer. 1
Table E.2. Data accessibility on the national portal
AUS AUT BEL CAN CHL DNK EST FIN FRA DEU GRC IRL ITA JPN KOR MEX NLD NZL NO
se of CSV format (machine readable) never (❍), rarely (◗),enerally (●)
● ● ● ● ● ● ● ● ● ● ◗ ● ● ● ● ● ● ● ●
ystematic provision of metadata ● ● ● ● ● ❍ ● ❍ ● ❍ ❍ ❍ ● ● ● ● ● ❍ ●
eatures available: Geospatial tools ● ❍ ❍ ● ● ❍ ● ● ● ❍ ❍ ● ❍ ❍ ● ● ❍ ❍ ●
anking of most popular datasets ● ❍ ❍ ● ● ● ❍ ● ● ❍ ❍ ❍ ❍ ❍ ● ● ❍ ❍ ❍
oting button for visitors ● ❍ ❍ ● ● ● ❍ ❍ ● ● ❍ ❍ ❍ ❍ ● ● ❍ ❍ ❍
eceive notifications when datasets are added ● ● ❍ ❍ ❍ ● ❍ ❍ ● ❍ ❍ ❍ ❍ ● ● ❍ ❍ ● ❍
Yes.No.Missing answer. 1
Table E.3. Government support to the reuse of data and stakeholders’ eng
AUS AUT BEL CAN CHL DNK EST FIN FRA DEU GRC IRL ITA JPN KOR MEX NLD NZL NO
egular consultations for the types of data released ● ● ● ● ❍ ❍ ● ● ● ● ● ● ● ● ● ● ❍ ● ●
oftware development contests/prize (e.g. for apps, widgets, etc.) ◗ ● ◗ ● ◗ ◗ ◗ ● ● ◗ ● .. ◗ ◗ ● ● ◗ ❍ ●
fo sessions for citizens and businesses ◗ ◗ ◗ ● ◗ ◗ ◗ ◗ ◗ ◗ ● .. ● ◗ ● ● ◗ ◗ ◗
elease of data and implementation of OGD policies consideredart of performance indicators of organisations
◗ ◗ ❍ ● ❍ ❍ ● ◗ ◗ ❍ .. .. ◗ ◗ ● ● ❍ ❍ ◗
rganisation of co-creation type events (e.g. hackathons) ◗ ◗ ◗ ● ● ◗ ◗ ● ● ◗ ● .. ● ◗ ● ● ◗ ◗ ●
ata promotion to journalists ◗ ◗ ◗ ◗ ◗ ❍ ❍ ◗ ◗ ❍ ◗ .. ◗ ◗ ● ◗ ◗ ◗ ●
ata analytics teams in government ◗ ❍ ◗ ❍ ❍ ◗ ❍ ❍ ● ❍ ● .. ❍ ❍ ◗ ● ◗ ◗ ◗
raining for civil servants to build capacities ● ◗ ◗ ◗ ◗ ❍ ❍ ◗ ◗ ❍ ◗ .. ◗ ◗ ● ● ❍ ◗ ◗
Often.Sometimes.Never.Missing answer. 1

F. MEMBERS OF THE STEERING GROUP
204
ANNEX F
Members of the Steering Group
Name Title/position Ministry
Austria Mr Michael Kallinger Director General Federal Chancellery, Public Service andInnovative Administrative Development
Belgium Mr Jacques Druart Head of International Co-ordination Federal Chancellery, Public Service Personneland Organization
Canada Ms Patricia Mosher Senior Advisor Priorities and Planning Treasury Board of Canada, Secretariat
Chile Ms Consuelo Herrera Legal Counsellor Permanent Delegation of Chile to the OECD
Finland Ms Katju Holkeri Head of Government Policy Unit Ministry of Finance
France Mr Daniel Aunay Senior Advisor for European and InternationalAffairs
Secretariat-General for GovernmentModernization/Office of the Prime Minister
Hungary Mr László Jobbágy Head of Department/ Department for PublicAdministration Development
Prime Minister’s Office
Italy Mr Stefano Pizzicannella Director International Relations Department for Public Administration
Japan Mr Irie Akifumi First Secretary Permanent Delegation of Japan to the OECD
Korea Mr Yong Bum Choi Minister-Counsellor Delegation of Korea to the OECD
Mexico Mr Adrian Franco Barrios General Director/ Governance and PublicSecurity Statistics
Governance and Public Security Statistics/National Statistics Office
Netherlands Mr Dick Hagoort Head of the Department on Analysis/LabourMarket and Macro Economic Counselling
Ministry of interior and Kingdom Relations
Norway Ms Tone Smith-Meyer Advisor Norwegian Ministry of Public Administration
Slovenia Ms Klaudija Korazija Under-Secretary /European Affairs andInternational Cooperation Office
Ministry of the Interior
Sweden Ms Susanne Johansson Advisor Swedish Agency for Public Management
United Kingdom Ms Liz McKeown Deputy Director, Analysis and Insight Cabinet Office
GOVERNMENT AT A GLANCE 2015 © OECD 2015

F. GLOSSARY
GOVERN
Glossary
Term Use in Government at a Glance
Budget A comprehensive statement of Government financial plans which
include expenditures, revenues, deficit or surplus and debt. The
budget is the Government’s main economic policy document,
demonstrating how the Government plans to use public resources
to meet policy goals and to some extent indicating where its policy
priorities
Cash transfers Benefits provided to eligible individuals by governments that are not
required to be spent on a specific good or service. Examples of cash
transfers include pensions, unemployment benefits and development
aid.
Central BudgetAuthority (CBA)
The Central Budget Authority (CBA) is a public entity, or several co-
ordinated entities, located at the central/national/federal level of
government, which is responsible for the custody and management
of the national/federal budget. In many countries, the CBA is often
part of the Ministry of Finance. Specific responsibilities vary by
country, but generally, the CBA is responsible for formulating budget
proposals, conducting budget negotiations, allocating or
reallocating funds, ensuring compliance with the budget laws and
conducting performance evaluations and/or efficiency reviews. This
Authority regulates budget execution but does not necessarily
undertake the treasury function of disbursing public funds. Lastly, a
very important role of the Central Budget Authority is monitoring
and maintaining aggregate/national fiscal discipline and enforcing
the effective control of budgetary expenditure.
Centre ofGovernment (CoG)
The Centre of Government refers to the administrative structure
that serves the Executive (President or Prime Minister, and the
Cabinet collectively). The Centre of Government has a great variety
of names across countries, such as General Secretariat, Cabinet
Office, Chancellery, Office/Ministry of the Presidency, Council of
Ministers Office, etc. In many countries the CoG is made up of more
than one unit, fulfilling different functions. The role of the Centre of
Government is closely linked to the role of the executive branch
itself, i.e. to direct the resources of the State (financial, legal,
regulatory, even military) to achieve a mission that reflects a
political vision and responds to a mandate from citizens.
MENT AT A GLANCE 2015 © OECD 2015 205

F. GLOSSARY
206
Citizen’s budget A cit izens ’ guide to the budget is def ined here as an
easy-to-understand summary of the main features of the annual
budget as presented to the legislature. It should be a self-contained
document that explains what is in the annual budget proposals and
what their effects are expected to be. While containing links or
references to more detailed documents, the guide should not
require readers to refer to them, or to know their contents, in order
to understand the guide.
Civil servant An employee of the state, either permanent or on a long-term
contract, who would remain a state employee if the government
changes. In addition, civil servants are employees covered under a
specific public legal framework or other specific provisions.
Collective goodsand services
Goods and services that benefit the community at large. Examples
include government expenditures on defence, and public safety and
order.
Composite index An indicator formed by compiling individual indicators into a single
index on the basis of an underlying model (Nardo et al., 2005).
Dataset A set of indicators or variables concerning a single topic (e.g. regulatory
quality).
Efficiency Achieving maximum output from a given level of resources used to
carry out an activity (OECD Glossary of Statistical Terms).
Effectiveness The extent to which the activities stated objectives have been met
(OECD Glossary of Statistical Terms).
European Systemof NationalAccounts
An internationally compatible accounting framework used by
members of the European Union for a systematic and detailed
description of a total economy (that is a region, country or group of
countries), its components and its relations with other total
economies (OECD Glossary of Statistical Terms). It is fully consistent
with System of National Accounts (SNA).
Federal state A country that has a constitutionally delineated division of political
authority between one central and several regional or state
autonomous governments.
Fiscal Rule For purposes of this book, the OECD utilises a similar definition as the
European Commission. A numerical fiscal rule refers to a permanent
constraint on fiscal policy aggregates (e.g. in-year rules are excluded).
Full-timeequivalent (FTE)
The number of full-time equivalent jobs, defined as total hours
worked divided by average annual hours worked in full-time jobs
(OECD Glossary of Statistical Terms).
Gender Socially constructed and socially learned behaviours and expectations
associated with females and males. All cultures interpret and
elaborate the biological differences between women and men into a
set of social expectations about what behaviours and activities are
appropriate and what rights, resources, and power women and men
possess. Like race, ethnicity, and class, gender is a social category
that largely establishes one’s life chances. It shapes one’s
participation in society and in the economy.
GOVERNMENT AT A GLANCE 2015 © OECD 2015

GOVERN
F. GLOSSARY
GeneralEmploymentFramework inthe public service
It usually concerns the employment conditions of most government
employees, and certainly concerns most statutory employees.
Casual employees, by this definition, are not employed under the
General Employment Framework for government employees. Please
note that in a number of countries, all employees, including those
employed on a short term basis, are employed under the General
Employment framework, with a few exceptions (few casual
employees in those cases, if any).
Generalgovernment
The general government sector consists of the following groups of
resident institutional units: a) All units of central, state or local
government; b) All non-market NPIs that are controlled by
government units. c) The sector also includes social security funds,
either as separate institutional units or as part of any or all of
central, state or local government.
The sector does not include public corporations, even when all the
equity of such corporations is owned by government units. Nor does
it include quasi-corporations that are owned and controlled by
government units. However, unincorporated enterprises owned by
government units that are not quasi-corporations remain integral
parts of those units and, therefore, must be included in the general
government sector (2008 System of National Accounts).
Governance The exercise of political, economic and administrative authority.
Gross domesticproduct (GDP)
The standard measure of the value of the goods and services
produced by a country during a period. Specifically, it is equal to the
sum of the gross values added of all resident institutional units
engaged in production (plus any taxes, and minus any subsidies, on
products not included in the value of their outputs). The sum of the
final uses of goods and services (all uses except intermediate
consumption) measured in purchasers’ prices, less the value of
imports of goods and services, or the sum of primary incomes
distributed by resident producer units (OECD Glossary of Statistical
Terms).
IndependentFiscal Institution(IFI)
A publicly funded, independent body under the statutory authority
of the executive or the legislature which provides non-partisan
oversight and analysis of, and in some cases advice on, fiscal policy
and performance. IFIs have a forward-looking ex ante diagnostic task
(in contrast to public audit institutions which perform an equally
indispensable ex post task).
Indicator “… quantitative or qualitative measure derived from a series of
observed facts that can reveal relative positions (e.g. of a country) in
a given area. When evaluated at regular intervals, an indicator can
point out the direction of change across different units and through
time.” (Nardo et al., 2005).
Individual goodsand services
Goods and services that mainly benefit individuals. Examples
include education, health and social insurance programmes.
MENT AT A GLANCE 2015 © OECD 2015 207

F. GLOSSARY
208
Input Units of labour, capital, goods and services used in the production of
goods and services.
“Taking the health service as an example, input is defined as the
time of medical and non-medical staff, the drugs, the electricity and
other inputs purchased, and the capital services from the
equipment and buildings used.” (Lequiller, 2005).
Labour force The labour force, or currently active population, comprises all
persons who fulfil the requirements for inclusion among the
employed or the unemployed during a specified brief reference
period (OECD Glossary of Statistical Terms).
Open GovernmentData centralizedportal
The Central/federal Open Government Data central portal (or “one
stop shop” portal) corresponds to a single entry point to access
government’s data. Access to the data can be provided either
directly on the portal or indirectly (redirected to the place where the
data is located e.g.: to a ministry’s website).
Outcome Refers to what is ultimately achieved by an activity. Outcomes
reflect the intended or unintended results of government actions,
but other factors outside of government actions are also implicated
(OECD Glossary of Statistical Terms).
Output In performance assessment in government, outputs are defined as
the goods or services produced by government agencies
(e.g. teaching hours delivered, welfare benefits assessed and paid)
(OECD Glossary of Statistical Terms).
PerformanceInformation
Performance information can be generated by both government and
nongovernmental organizations, and can be both qualitative and
quantitative. Performance information refers to metrics/indicators/
general information on the inputs, processes, outputs and
outcomes of government policies/programmes/organizations, and
can be ultimately used to assess the effectiveness, cost effectiveness
and efficiency of the same. Performance information can be found
in statistics; the financial and/or operational accounts of
government organisations; performance reports generated by
government organizations; evaluations of policies, programmes or
organizations; or Spending Reviews, for instance.
Productivity Productivity is commonly defined as a ratio of a volume measure of
output to a volume measure of input use (OECD Statistical Glossary).
Economists distinguish between total productivity, namely total
output divided by change in (weighted) input(s) and marginal
productivity, namely change in output divided by change in
(weighted) input(s) (Coelli et al., 1999).
Public sector The public sector includes general government and public
corporations. Quasi-corporations owned by government units are
grouped with corporations in the nonfinancial or financial corporate
sectors, thus part of public corporations (2008 System of National
Accounts).
GOVERNMENT AT A GLANCE 2015 © OECD 2015

GOVERN
F. GLOSSARY
Public sectorprocess
Structures, procedures and management arrangements with a
broad application within the public sector.
Public services Services that are performed for the benefit of the public or its
institutions. Public services are provided by government to its
citizens, either directly (through the public sector) or by financing
private provision of services. The term is associated with a social
consensus that certain services should be available to all, regardless
of income. Even where public services are neither publicly provided
nor publicly financed, for social and political reasons they are
usually subject to regulation going beyond that applying to most
economic sectors.
System ofNational Accounts
The System of National Accounts (SNA) consists of a coherent,
consistent and integrated set of macroeconomic accounts; balance
sheets and tables based on a set of internationally agreed concepts,
definitions, classifications and accounting rules. In 2009, the United
Nations Statistical Commission endorsed a revised set of
international standards for the compilation of national accounts:
the 2008 System of National Accounts, replacing the 1993 version of
the SNA.
Please refer to Annex A for more details regarding the recent
revision of the SNA framework and its implementation made by the
countries.
Trust Trust is broadly understood as holding a positive perception about
the actions of an individual or an organization. Trust gives us
confidence that others will act as we might expect in a particular
circumstances. While trust may be based on actual experience, in
most cases trust is a subjective phenomenon, reflected in the eyes
of the beholder
Unitary states Countries that do not have a constitutionally delineated division of
political authority between one central and several regional or state
autonomous governments. However, unitary states may have
administrative divisions that include local and provincial or regional
levels of government.
Variable A characteristic of a unit being observed that may assume more
than one of a set of values to which a numerical measure or a category
from a classification can be assigned (e.g. income, age, weight, etc., and
“occupation”, “industry”, “disease”, etc.) (OECD Glossary of Statistical
Terms).
MENT AT A GLANCE 2015 © OECD 2015 209


ORGANISATION FOR ECONOMIC CO-OPERATIONAND DEVELOPMENT
The OECD is a unique forum where governments work together to address the economic, social and
environmental challenges of globalisation. The OECD is also at the forefront of efforts to understand and
to help governments respond to new developments and concerns, such as corporate governance, the
information economy and the challenges of an ageing population. The Organisation provides a setting
where governments can compare policy experiences, seek answers to common problems, identify good
practice and work to co-ordinate domestic and international policies.
The OECD member countries are: Australia, Austria, Belgium, Canada, Chile, the Czech Republic,
Denmark, Estonia, Finland, France, Germany, Greece, Hungary, Iceland, Ireland, Israel, Italy, Japan, Korea,
Luxembourg, Mexico, the Netherlands, New Zealand, Norway, Poland, Portugal, the Slovak Republic,
Slovenia, Spain, Sweden, Switzerland, Turkey, the United Kingdom and the United States. The European
Union takes part in the work of the OECD.
OECD Publishing disseminates widely the results of the Organisation’s statistics gathering and
research on economic, social and environmental issues, as well as the conventions, guidelines and
standards agreed by its members.
OECD PUBLISHING, 2, rue André-Pascal, 75775 PARIS CEDEX 16
(42 2015 08 1) ISBN 978-92-64-23346-1 – 2015

Consult this publication on line at http://dx.doi.org/10.1787/gov_glance-2015-en.
This work is published on the OECD iLibrary, which gathers all OECD books, periodicals and statistical databases.Visit www.oecd-ilibrary.org for more information.
Government at a Glance 2015Government at a Glance 2015 provides the latest available data on public administrations in OECD countries. Where possible, it also reports data for Brazil, China, Colombia, India, Indonesia, Latvia, the Russian Federation, South Africa and Ukraine. This edition contains new indicators on public sector integrity, regulatory governance, the role of centres of government, digital government, budget practices and procedures, open government data, and a more comprehensive set of data on the level of access, responsiveness and quality of services to citizens. This edition also includes a special section on the impact of budget constraints on employment and compensation reforms in governments since 2009.
Each indicator in the publication is presented in a user-friendly format, consisting of graphs and/or charts illustrating variations across countries and over time, brief descriptive analyses highlighting the major findings conveyed by the data, and a methodological section on the definition of the indicator and any limitations in data comparability. For the first time, a database containing qualitative and quantitative indicators on government is available on line. It will be updated twice a year as new data are released. The database, countries fact sheets and other online supplements can be found at www.oecd.org/gov/govataglance.htm.
Contents
Chapter 1. Inclusive governments for a more inclusive society
Chapter 2. Public finance and economics
Chapter 3. Public employment
Chapter 4. Institutions
Chapter 5. Budgeting practices and procedures
Chapter 6. Human resource management
Chapter 7. Public sector integrity
Chapter 8. Regulatory governance
Chapter 9. Public procurement
Chapter 10. Digital government
Chapter 11. Core government results
Chapter 12. Serving citizens
isbn 978-92-64-23346-1 42 2015 08 1 P
Govern
ment at a G
lance 2015
Government at a Glance 2015


