Purdue University Purdue e-Pubs Purdue CIBER Working Papers Krannert Graduate School of Management 1-1-2007 Government Control of Privatized Firms Bernardo Bortoloi Università di Torino Mara Faccio Purdue University Follow this and additional works at: hp://docs.lib.purdue.edu/ciberwp is document has been made available through Purdue e-Pubs, a service of the Purdue University Libraries. Please contact [email protected] for additional information. Bortoloi, Bernardo and Faccio, Mara, "Government Control of Privatized Firms" (2007). Purdue CIBER Working Papers. Paper 52. hp://docs.lib.purdue.edu/ciberwp/52
Transcript
Purdue UniversityPurdue e-Pubs
Purdue CIBER Working Papers Krannert Graduate School of Management
1-1-2007
Government Control of Privatized FirmsBernardo BortolottiUniversità di Torino
Mara FaccioPurdue University
Follow this and additional works at: http://docs.lib.purdue.edu/ciberwp
This document has been made available through Purdue e-Pubs, a service of the Purdue University Libraries. Please contact [email protected] foradditional information.
Bortolotti, Bernardo and Faccio, Mara, "Government Control of Privatized Firms" (2007). Purdue CIBER Working Papers. Paper 52.http://docs.lib.purdue.edu/ciberwp/52
We study the change in government control of privatized firms in OECD countries. Results indicate that governments typically transfer ownership rights without relinquishing proportional control. Control is commonly retained by leveraging state investments through pyramids, dualclass shares, and golden shares. Indeed, at the end of 2000, after the largest privatization wave in history, governments retain control of 62.4% of privatized firms. In civil law countries, governments tend to retain large ownership positions, whereas in common law countries they typically use golden shares. However, when we combine these two mechanisms, we find no association between a country’s legal tradition and the extent of government control. Rather, we document more prevalent government influence over privatized firms in countries with proportional electoral rules and with a centralized system of political authority.
1 Università di Torino and FEEM, Department of Economics and Finance, Corso Unione Sovietica, 218 bis, Torino 10134, Italy; Phone: (+39) 02 52036968; Fax: (+39) 02 52036946; email: [email protected]. 2 Vanderbilt University, Owen Graduate School of Management, 401 21st Avenue South, Nashville, TN 37203, U.S.A.; Phone: (+1) 615 3224075; Fax: (+1) 615 3437177; email: [email protected].
Utpal Bhattacharya played an important role in the start of this project, and we gratefully acknowledge his contribution. We thank the Athens Stock Exchange, Australian Stock Exchange, Banque Bruxelles Lambert, Bolsa de Valores de Lisboa, Bundesaufsichtsamt für den Wertpapierhandel, Commerzbank, Hugin, the Istanbul Stock Exchange, and the Wiener Börse for generously providing us with their data sets. Thanks also to Roberto Barontini, George Benston, Utpal Bhattacharya, Bernie Black, Lorenzo Caprio, Stjin Claessens, JeanClaude Cosset, François Degeorge, Andrea Goldstein, Nandini Gupta, Satoshi Kawanishi, Masaharu Hanazaki, Tim Loughran, Ron Masulis, Bill Megginson, Dusan Mramor, Giovanna Nicodano, David Parsley, Enrico Perotti, Paolo Pinotti, Charu Raheja, Mike Weisbach (the Editor), an anonymous referee, and seminar participants at the Development Bank of Japan, Emory University, London Business School, Ohio State University, Shanghai University, Università Statale (Milano), University of Michigan, University of Notre Dame, University of Texas at Austin, Vanderbilt University, the World Bank, the 2005 European Finance Association meeting, the 2006 American Finance Association, and the 2006 Corporate Finance MiniConference at University of Waterloo & Wilfrid Laurier University for providing useful comments. We also thank Yoser Gadhoum for providing us with the 1996 ultimate ownership data for Canada and the US, and Lehman Brothers, Merrill Lynch, Morgan Stanley, and Nomura Securities for generously providing privatization prospectuses. Luca Farinola, Ettore Panetti and Valentina Milella provided excellent research assistance. This project has been funded by Fondazione IRI, Rome and by the European Commission (contract n. CIT5CT2005028647). We thank Antonio Pedone for his support and cooperation. Mara Faccio also acknowledges support from the Hirtle Callaghan Research Scholar Award.
The wave of privatizations that began in the United Kingdom in the 1980s, and spread
across the globe during the 1990s, produced what is arguably the greatest transfer of ownership in
the history of the corporation. Governments all over the world have sold, or are selling, large
blocks of their ownership positions to the private sector. In terms of flows, privatization
transactions, including share issue privatization (SIP) and private placements, raised US$1,230
billion globally during the 19772003 period, about one fifth of the total value of issues floated on
public equity markets. Yet stories in the popular press suggest that the rollback of state control
has been incomplete. Governments have often separated ownership and control in privatized
companies by means of devices that leverage the voting power associated with their investments,
such as pyramids, and by means of special powers, such as the power to veto acquisitions,
granted to the state. 1
The tendency for states to retain control after privatization is illustrated by the Italian
government’s power in its stateowned enterprises (SOEs). The Italian government launched its
first large scale privatization program after the 1992 general elections, when the country was
facing one of the most acute economic and political crises of the postwar period. Since 1993,
major privatization deals have raised more than US$100 billion, making Italy third in total value
of privatizations worldwide (Securities Data Corporation). Despite this apparently remarkable
result, the Italian government is still an influential shareholder in many privatized firms. For
example it holds direct and indirect stakes, through Cassa Depositi e Prestiti, in Eni (the largest
oil and gas company), Enel (the electricity giant), Alitalia (the flagship carrier), and
Finmeccanica (the aerospace, defense and IT group). It also can veto strategic decisions and
acquisitions in fully privatized companies such as Telecom Italia, the former state
1 For example, Julian Ellison and Duncan Reed, Getting tough on golden shares, Financial Times, June 6, 2003.
3
telecommunication monopoly. These preliminary observations suggest that, despite the large
value of total privatizations, some governments retain substantial power in SOEs.
In this paper, we evaluate whether government control of privatized companies is
significant, and how widespread this control is. We also analyze country, industry, and firm
attributes that tend to be associated with government influence over privatized firms.
We show that many privatizations are characterized by the sale of equity without a
proportional transfer of control. There are two types of mechanism that are commonly used to
achieve this. First, the government can leverage the voting power associated with its investment
through pyramiding, dual class shares, etc. With these ownership leveraging devices, it can
remain the largest ultimate shareholder of a company even though it no longer directly owns
100% of the stock. Second, it may hold golden shares, permitting the government to make
important decisions in the company, such as to veto proposed acquisitions, or alternatively, to
impose constraints on other investors, such as caps on their share of voting rights. 2 We document
the government’s overall control in privatized firms by evaluating both ultimate control and
golden shares.
For our analysis, we construct a sample of 141 companies from developed economies that
were privatized (and became publicly traded) prior to the end of 1996. Just considering ultimate
government voting rights, we find that the most common privatization outcome is that the state
remains the largest ultimate owner. This is true for about one third of socalled “privatized” firms.
The notion of ultimate control is relatively new. A few studies employ this concept in
settings unrelated to privatization; these studies report the widespread presence of governments as
ultimate owners of banks (La Porta, LopezdeSilanes and Shleifer, 2002), and as owners of a
wider range of firms (e.g., La Porta et al., 1999, Claessens et al., 2000, and Faccio and Lang,
2002). To our knowledge, however, with the exception of Tian’s (2000) study of Chinese
privatizations, all other analyses of privatizations have taken only direct ownership into account.
2 See Section III.B for a more precise definition of golden shares.
4
In a recent paper, Boubakri, Cosset and Guedhami (2005) study direct ownership and conclude
that governments relinquish control over time. We show that the picture looks totally different
when ownership leveraging devices are accounted for. Thus, had we not considered these
mechanisms, we would have substantially understated the power of the state in privatized firms. 3
Consistent with earlier findings by Jones, Megginson, Netter and Nash (1999), our results
indicate widespread use of golden shares. Additionally, we show that golden shares are
particularly common amongst privatized companies in which the government is not the largest
shareholder. This combination of evidence allows us to conclude that through either direct
ownership, or leveraging devices or golden shares, governments maintain control of almost two
thirds of privatized firms. This result is quite surprising, given the conventional wisdom that the
massive privatization wave of the 1990s was spurred by a drastic rethinking of the role of state
ownership.
Interestingly, we show that the devices favored for retaining government control differ
somewhat across countries. In common law countries, governments tend to retain control by
using golden shares, and they are unlikely to retain large ownership positions, whereas in civil
law countries, governments tend to retain large ownership positions. When we look at the
combined effect of ultimate ownership and golden shares, we find no relation between the
percentage of privatized firms in which the government has significant overall control and a
country’s legal tradition. The evidence indicates that governments tend to retain control through
ownership in countries dominated by left wing majorities; in democracies with proportional
electoral systems; and in countries with centralized fiscal authority. Results also indicate that
some of these factors are significantly related to the frequency with which governments retain
overall control of privatized firms. We conclude that in the more politically fragmented
environments, privatization tends to be incomplete. On the contrary, the delegation of substantial
authority to subnational governments fosters full privatization.
3 We will show that, as of 2000, in privatized firms in which a government is the largest owner, governments directly controlled an average of 37.14% of voting rights, while their ultimate control stake was on average
5
The rest of the paper is organized as follows. In section II, we describe the sample and data
employed in the study. In section III, we discuss the structure of control in privatized and
matching firms. Section IV presents our analysis of the relation between the use of the two
control mechanisms, ultimate voting rights and golden shares, and various characteristics
associated with countries, industries, and firms. Section V summarizes the conclusions to be
drawn from our study.
II. Data
A. The samples of privatized and control companies
The Global New Issues Database of Securities Data Corporation (SDC) provided the
complete list of privatization transactions in public equity markets in OECD economies before
1/1/1997. Privatization transactions are defined as primary or secondary issues of shares on
public equity markets, by companies in which central or local governments are shareholders. We
retrieve 299 privatization transactions, 44% of which are IPOs from the SDC database. It has
been widely documented that the large size of SOEs has often forced divesting governments to
offer a series of tranches. In fact, the privatizations reported by SDC include 205 companies, each
of which offered an average of 1.4 issues. We cross checked our privatization sample with
information from various sources. All the companies in our list are also reported in the
Privatization International (PI) dataset and appear in Megginson’s Appendix. 4 We also compare
the SDC data with information from selected official sources, such as the Italian Ministry of the
Economy and Finance, the British HM Treasury, and Spanish SEPI, and other privatization
agencies. Using data from these other sources, we conclude that our initial sample includes 98%
of companies privatized in the public equity markets in OECD countries prior to 1997.
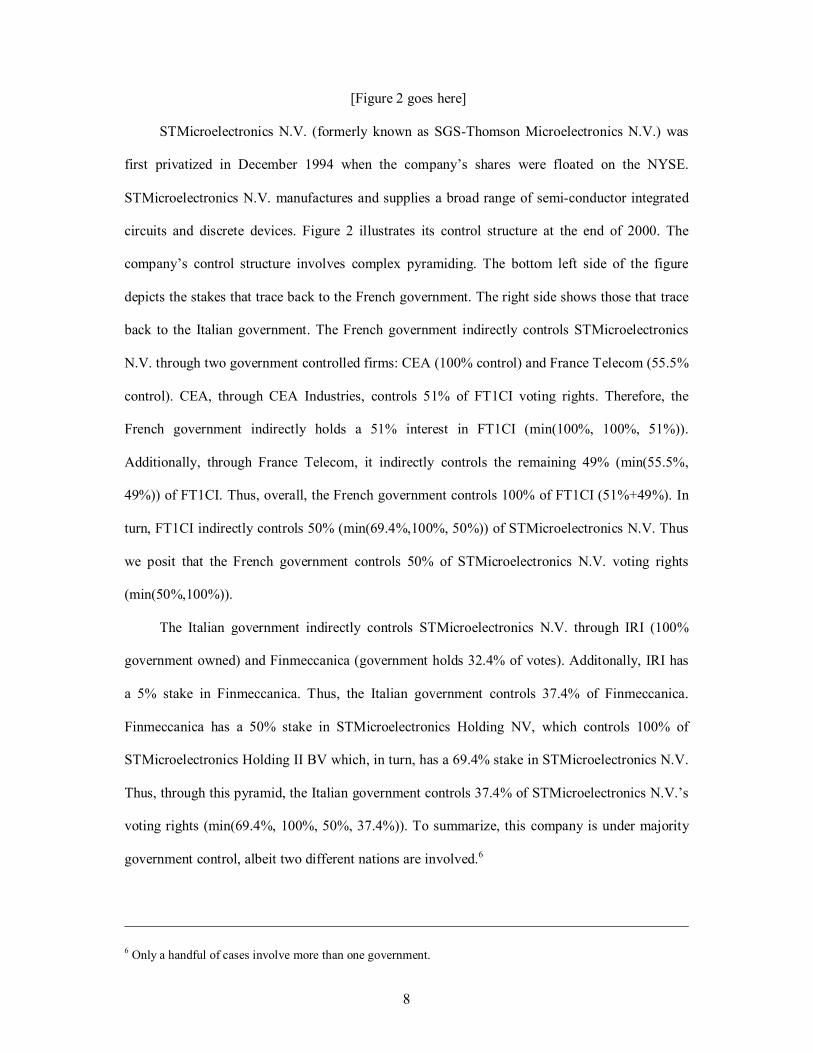
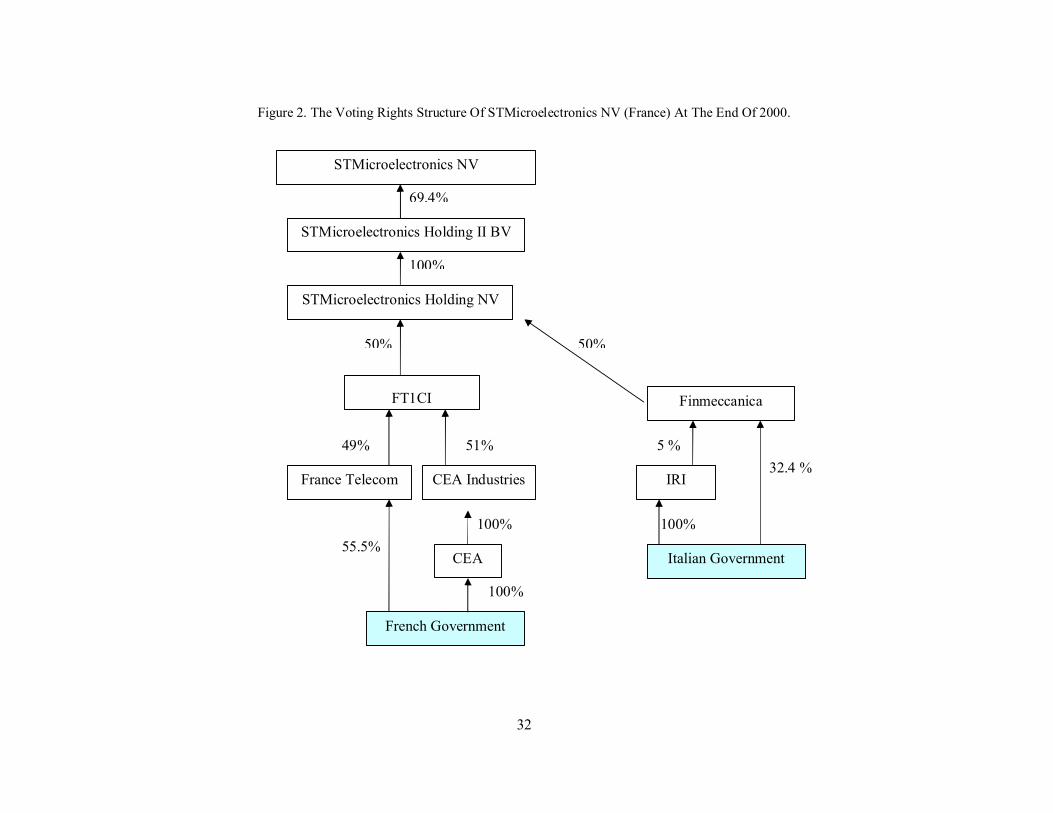
we posit that the French government controls 50% of STMicroelectronics N.V. voting rights
(min(50%,100%)).
The Italian government indirectly controls STMicroelectronics N.V. through IRI (100%
government owned) and Finmeccanica (government holds 32.4% of votes). Additonally, IRI has
a 5% stake in Finmeccanica. Thus, the Italian government controls 37.4% of Finmeccanica.
Finmeccanica has a 50% stake in STMicroelectronics Holding NV, which controls 100% of
STMicroelectronics Holding II BV which, in turn, has a 69.4% stake in STMicroelectronics N.V.
Thus, through this pyramid, the Italian government controls 37.4% of STMicroelectronics N.V.’s
voting rights (min(69.4%, 100%, 50%, 37.4%)). To summarize, this company is under majority
government control, albeit two different nations are involved. 6
6 Only a handful of cases involve more than one government.
9
III. The ultimate control structure of privatized and matching firms
A. Distribution of voting rights in privatized companies
Following previous research (La Porta et al., 1999, Claessens et al., 2000, and Faccio and
Lang, 2002), we categorize the largest ultimate owner of each firm into the following six types:
State: A national government, a local authority (county, municipality, etc.), or a government
agency;
Family: A family or a firm that is unlisted on any stock exchange;
Widely held corporation: A nonfinancial firm, defined as widely held (that is, no shareholder
controls 10% or more of the votes);
Widely held financial institution: A financial firm (SIC 60006999) that is widely held;
Miscellaneous: Charities, voting trusts, employees, cooperatives, foundations, or minority
foreign investors;
Crossholdings: The largest ultimate owner of Firm X is another firm, Y, of which the largest
owner is, in turn, firm X, or alternatively, firm X is the largest direct owner of its own stock.
If the largest ultimate owner of a corporation is an unlisted firm, we trace its owners using all
available data sources. Companies that do not have a shareholder controlling at least 10% of
votes are classified as widely held.
[Table I goes here]
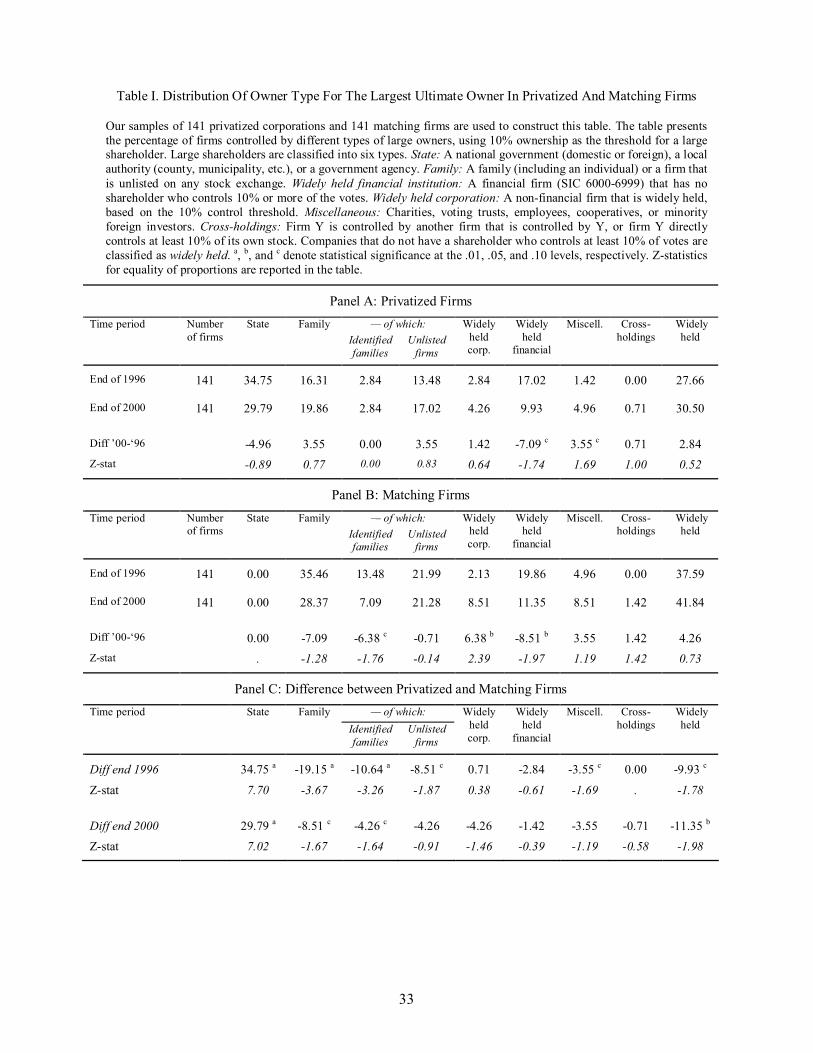
Table I presents the percentages of firms having ultimate owners belonging to each of the
six categories. All percentages reported in this paper are computed with year end data. Panel A
shows the distribution of ownership types for privatized firms. The largest ultimate owner of
privatized firms is most frequently the state, both at the end of 1996 (34.75% of cases) and at the
end of 2000 (29.79%).
Thus, even after privatization, the government is the largest ultimate owner of almost one
third of firms. A large percentage of privatized companies do not have a large shareholder under
the 10 percent rule, and therefore, those firms are categorized as widely held. The percentage of
10
widely held companies increases (insignificantly) through time (27.66% in 1996, and 30.50% in
2000). Amongst privatized firms, the next most frequent type of ultimate owner is families and
unlisted companies. Families control 16.31% of firms in 1996, and 19.86% in 2000. Widely held
financial institutions are also frequently large shareholders; they are the largest shareholder in
17.02% of firms in 1996 and in 9.93% of firms in 2000.
The ownership of matching firms exhibits a different pattern (see Table I, Panel B). By
construction, the government is never the largest shareholder in the matching sample. Most
frequently, matching companies are widely held (37.59% of firms in 1996 and 41.84% in 2000).
Second most frequently, the largest shareholder of matching firms is a family; they constitute
35.46% of largest owners in 1996, and 28.37% in 2000. The largest owner is also frequently a
widely held financial institution (19.86% of matching firms in 1996, and 11.35% in 2000).
Widely held corporations, miscellaneous investors, and crossholdings play a minor role.
A comparison of privatized and matching firms (Panel C) shows some convergence in their
control structures. From 1996 to 2000, the differences in the percentage of firms with families as
the largest shareholder, widely held financial institutions and miscellaneous shareholders declined
or became insignificant. However, the differences in the percentage of firms with widely held
corporations as the largest shareholder, as well as the differences in the percentage of widely held
firms, increase.
[Table II goes here]
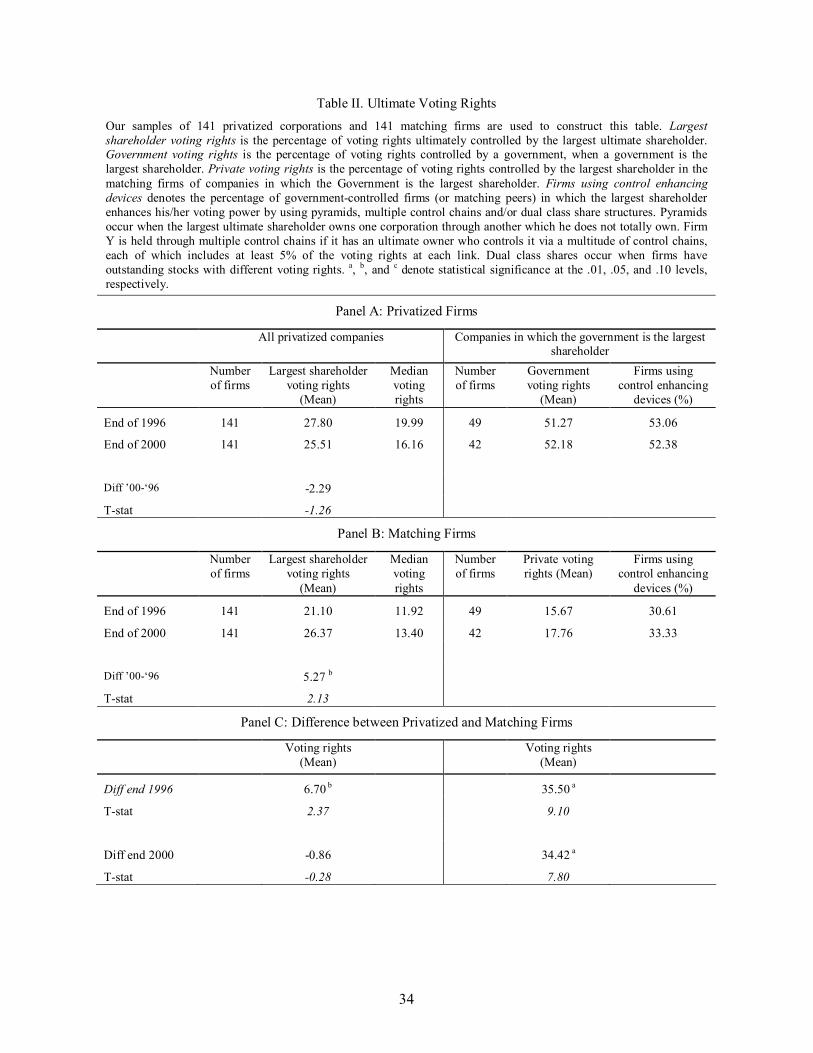
Table II shows that, on average, we observe a convergence in the concentration of voting
power for privatized and matching firms. The average percentage of voting rights held by the
largest ultimate shareholder for the privatized firms declines marginally from 27.80% at the end
of 1996 to 25.51% at the end of 2000 (Panel A), and the percentage for the control sample rises
substantially from 21.10% in 1996 to 26.37% in 2000 (Panel B). The difference between
privatized and matching firms is significant in 1996, whereas it is insignificant in 2000 (Panel C).
11
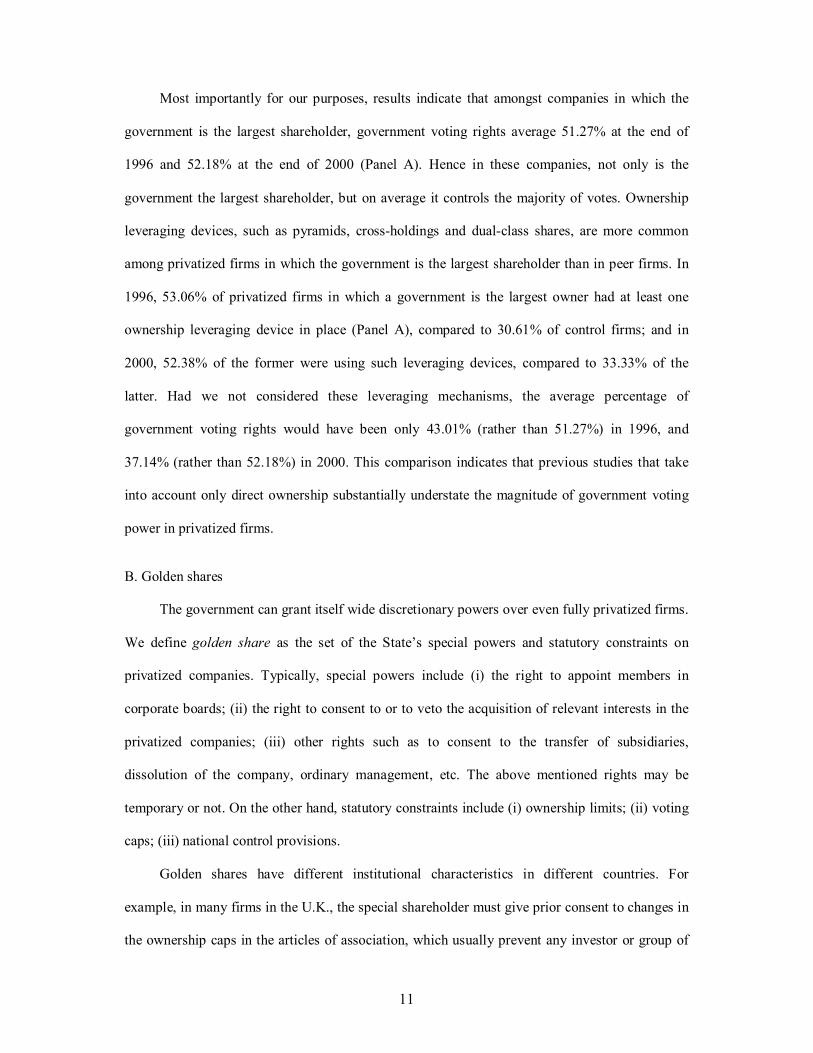
Most importantly for our purposes, results indicate that amongst companies in which the
government is the largest shareholder, government voting rights average 51.27% at the end of
1996 and 52.18% at the end of 2000 (Panel A). Hence in these companies, not only is the
government the largest shareholder, but on average it controls the majority of votes. Ownership
leveraging devices, such as pyramids, crossholdings and dualclass shares, are more common
among privatized firms in which the government is the largest shareholder than in peer firms. In
1996, 53.06% of privatized firms in which a government is the largest owner had at least one
ownership leveraging device in place (Panel A), compared to 30.61% of control firms; and in
2000, 52.38% of the former were using such leveraging devices, compared to 33.33% of the
latter. Had we not considered these leveraging mechanisms, the average percentage of
government voting rights would have been only 43.01% (rather than 51.27%) in 1996, and
37.14% (rather than 52.18%) in 2000. This comparison indicates that previous studies that take
into account only direct ownership substantially understate the magnitude of government voting
power in privatized firms.
B. Golden shares
The government can grant itself wide discretionary powers over even fully privatized firms.
We define golden share as the set of the State’s special powers and statutory constraints on
privatized companies. Typically, special powers include (i) the right to appoint members in
corporate boards; (ii) the right to consent to or to veto the acquisition of relevant interests in the
privatized companies; (iii) other rights such as to consent to the transfer of subsidiaries,
dissolution of the company, ordinary management, etc. The above mentioned rights may be
temporary or not. On the other hand, statutory constraints include (i) ownership limits; (ii) voting
caps; (iii) national control provisions.
Golden shares have different institutional characteristics in different countries. For
example, in many firms in the U.K., the special shareholder must give prior consent to changes in
the ownership caps in the articles of association, which usually prevent any investor or group of
12
investors from holding 15% or more of the firm’s voting rights. Further, in the UK, the articles
defining rights attached to the special share cannot be altered or removed. The special shares do
not permit the state to vote at general meetings, but they do entitle the holder to attend and speak
at such meetings. This set of basic special share provisions are present in the articles of
association of British Aerospace (now BAE Systems), British Energy, Southern Electric and
National Grid Group Plc. The rights attached to the special share are wider in only a few cases, in
which a national strategic interest can be identified. The French action spécifique gives the state
extensive powers. In general, the relevant Minister’s prior approval is required for any investor to
hold more than a certain percentage of the capital or voting rights (10% for Elf Aquitaine (now
Total), Havas and ThomsonCSF (now Thales)). Usually a representative of the French
government is appointed to the board of directors to act on behalf of the Minister. In some cases
he has specific veto powers (e.g., for Elf Aquitaine, to block the sale of certain strategic assets),
while in others he can veto any board resolution (ThomsonCSF). In Turkey, in some cases,
special powers are so extensive that they involve the government in everyday management.
We collected prospectuses for our firms, because information regarding golden share
provisions must be fully disclosed in the prospectuses of listed companies. The prospectuses were
provided by the individual companies themselves, investment banks, security exchange
commissions, and privatization agencies. We obtained prospectuses for, and identified the
presence or absence of golden shares in 104 of the 141 companies in our sample of privatized
firms. 7
[Table III goes here]
Table III documents the distribution of golden shares amongst privatized firms. We find
that 62.5% of these firms have outstanding golden shares at the end of 1996. Special powers are
quite common, occurring in 39.42% of privatized companies. In a number of cases, privatized
companies’ charter provisions set upper limits on the ownership or voting rights that can be
7 Detailed institutional information about golden shares can be found on various official web sites such as: the HM Treasury in the United Kingdom, www.hmtreasury.gov.uk; the Spanish Sociedad Estatal de
acquired by other investors without government approval. In some cases, these limitations apply
only to foreign investors. It is common for articles of incorporation to require that the
headquarters be located in the country of incorporation or to require that the board members be
citizens of the country of incorporation.
Golden shares are less common amongst companies in which the government is the largest
ultimate shareholder. As reported in Table III, at the end of 1996, of the 39 companies in which
the government was the largest shareholder, 56.41% had golden shares compared to 66.15% of
the remaining 65 firms. Similarly, at the end of 2000, 57.58% of companies in which the
government was the largest shareholder had golden shares, compared to 64.79% of the other
privatized companies.
The government holds large voting rights or golden shares in 65.2% of privatized firms at
the end of 1996, and 62.4% of privatized firms at the end of 2000. 8 This evidence clearly
indicates that, in the majority of cases, the privatization process is incomplete; indeed, the state
relinquished limited power to private investors
The presence of government officials on boards of directors provides further evidence of
government influence in privatized firms. For example, Belgian Justice Minister Tony Van Parys
served as Chairman of Dexia Belgium SA during our sample period; Belgian Senator Philippe
Bodson served as Executive Director of Distrigaz SA; Canadian MP, the Hon. W. David Angus,
was director of Air Canada; and Swedish MP Lennart Nilsson served as Chairman of Celsius AB.
In the UK, where it appears that the government has divested itself of considerable voting rights,
we identified several cases in which prominent members of the House of Lords sat on the boards
of privatized firms; these include AEA Technology PLC, BG PLC, BP Amoco PLC, British
Airways PLC, RollsRoyce PLC, and Scottish and Southern Energy PLC. Most of these firms
have golden shares outstanding.
Participaciones Industriales, www.sepi.es; and the Austrian Holding and Privatisation Agency, www.oiag.at. 8 In computing these percentages, we make the conservative assumption that companies for which we could not obtain the privatization prospectus do not have golden shares.
14
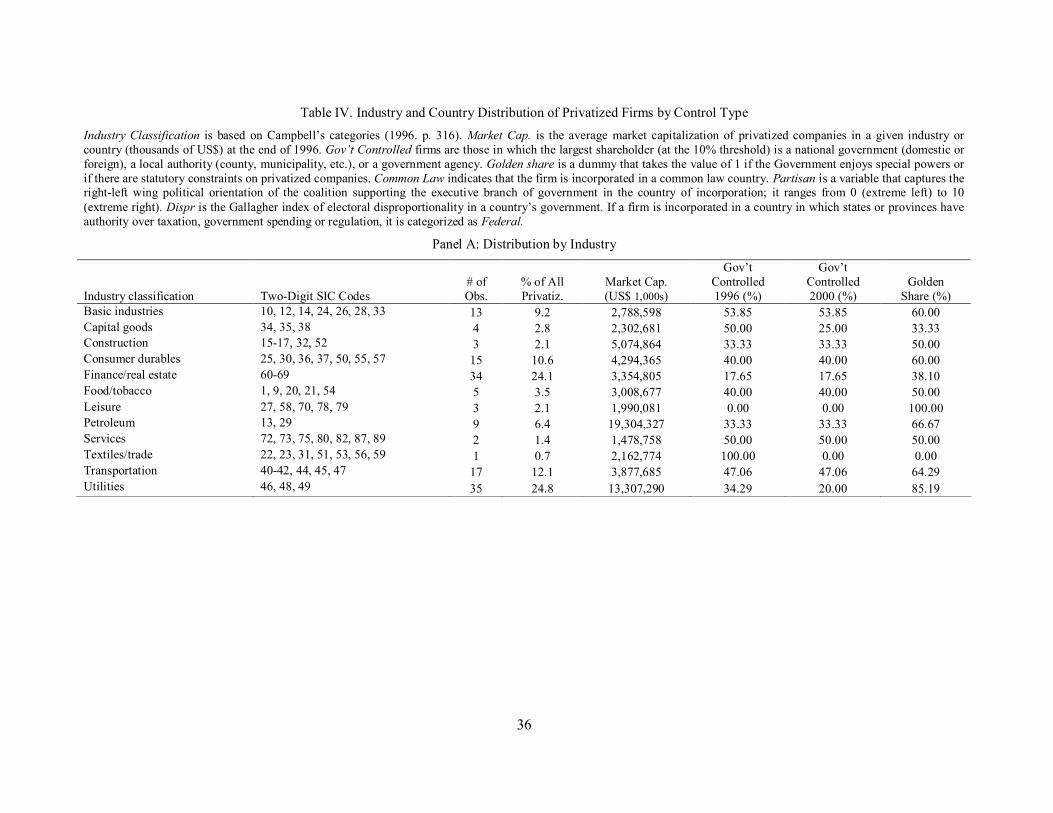
C. Government influence across different industries and countries.
Table IV, Panel A shows that at the end of 2000, large government ownership positions and
the use of golden shares in privatized firms varies considerably across industries. In two sectors,
basic industries, and services, the government is the largest shareholder in the majority of
privatized companies (year end 2000). Other industries in which governments are frequently the
largest owner are consumer durables, food/tobacco, and transportation. On the other hand,
governments are infrequently the largest owners in finance/real estate, leisure and textiles/trade.
Additionally, golden shares exist in more than half of the firms operating in the following sectors:
basic industries, consumer durables, leisure, petroleum, transportation, and utilities. On the other
hand, golden shares are relatively uncommon in the capital goods, finance/real estate, and
textiles/trade sectors.
[Table IV goes here]
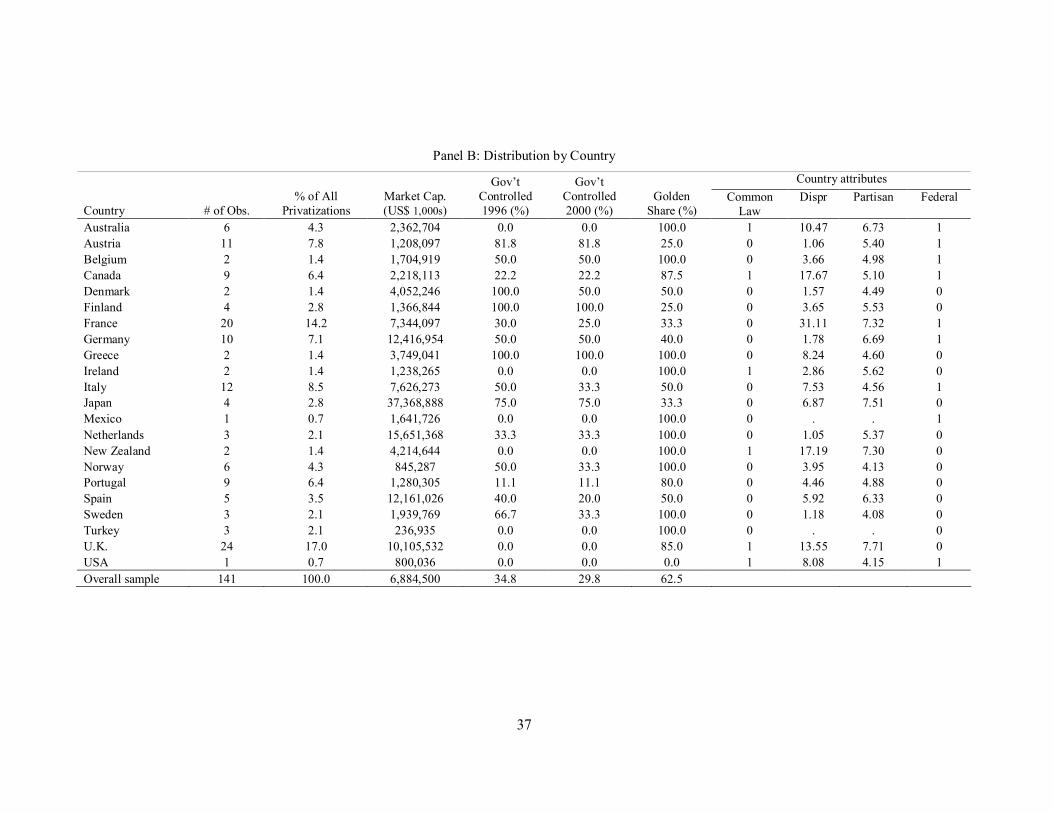
Panel B of Table IV shows the variation in government control of privatized firms by
country. At the end of 2000, the government was still the largest shareholder in all former SOEs
in Finland and Greece. On the other hand, the privatization process appears to have been more
complete in Australia, Ireland, Mexico, New Zealand, Turkey, the UK, and the US. These
figures, however, reflect only the identity of the largest blockholder, and they reveal nothing
about golden shares. In fact, all firms have outstanding golden shares in Australia, Belgium,
Greece, Ireland, Mexico, the Netherlands, New Zealand, Norway, Sweden and Turkey. In the
UK, although the government held less than 10% of voting rights in all privatized firms, it held
golden shares in 85% of privatized companies.
Panel C shows the effect of four country characteristics on the extent of government control
of privatized companies. The first characteristic is the legal tradition of the firm’s country. Past
research has shown that in civil law countries, the state is typically a more influential blockholder
than it is in common law countries (La Porta, LopezdeSilanes, Shleifer, 1999). Researchers
have observed that large government ownership positions in banks are pervasive in civil law
15
countries (La Porta, LopezdeSilanes, Shleifer, 2002). Legal tradition also affects investor
protection and financial development, and thus it may affect indirectly the government’s
incentives to relinquish control of SOEs (La Porta et al., 1997, 1998). We test the role of legal
tradition by identifying countries with a Common Law tradition.
Our results are consistent with prior evidence regarding the effect of legal tradition on
voting rights (La Porta, LopezdeSilanes, and Shleifer (1999, 2002)). Governments are
substantially more likely to be the largest blockholder in civil law, as opposed to common law,
countries: 48.5% of firms in civil law countries compared to 4.6% in common law countries.
However, we find the opposite result for golden shares. In common law countries, 86.5% of firms
have outstanding golden shares, compared to only 49.2% of companies in civil law countries.
Governments in common law countries are clearly using alternative instruments to retain
influence. This suggests that earlier studies overstate the difference between firms in countries
with the two legal traditions.
We also consider two political characteristics that may affect government control of
privatized firms: the political incentives shaped by electoral rules, and whether the incumbent
government is oriented to the right or left of the political spectrum. A higher electoral
disproportionality is a key feature of majoritarian political systems, displaying on average a lower
number of parties, more stable cabinets, and a lower degree of political fragmentation (Persson
and Tabellini, 2003). Previous research has established that majoritarian countries privatize
sooner a larger fraction of their SOE sector. On the contrary, in proportional political systems
privatization is delayed by the conflict among the several parties with veto power (Bortolotti and
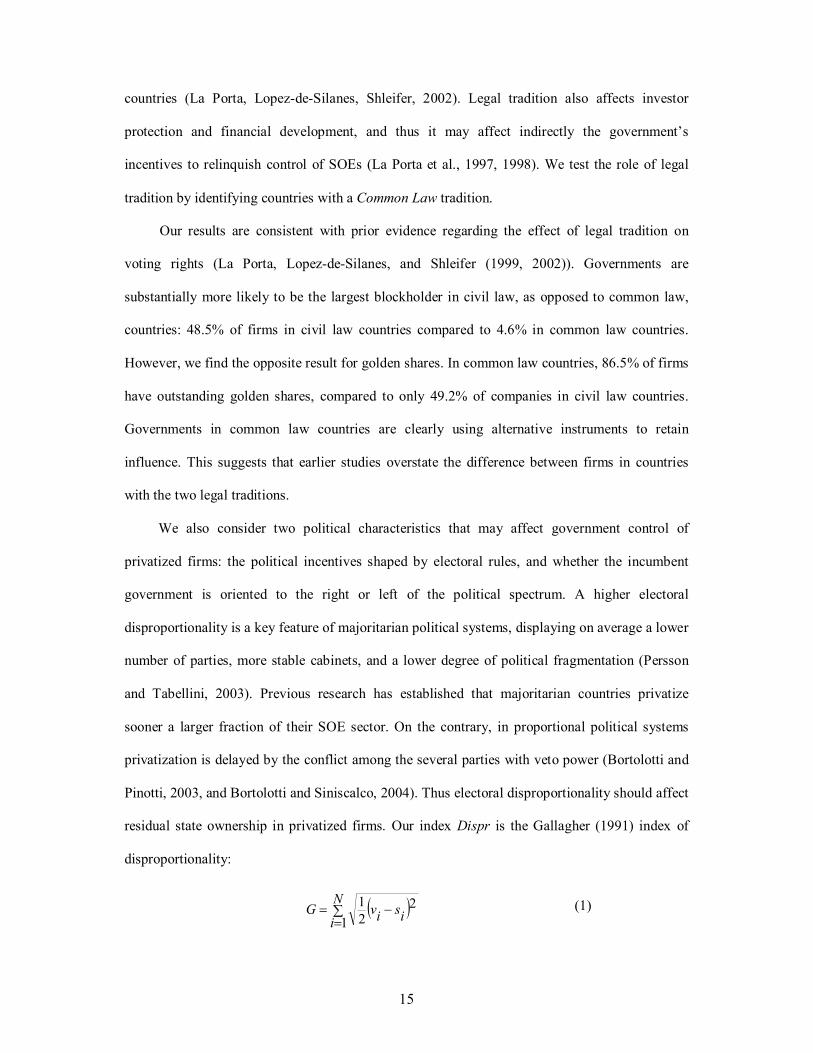
Pinotti, 2003, and Bortolotti and Siniscalco, 2004). Thus electoral disproportionality should affect
residual state ownership in privatized firms. Our index Dispr is the Gallagher (1991) index of
disproportionality:
( ) ∑ =
− = N
i i s i v G 1
2 2 1 (1)
16
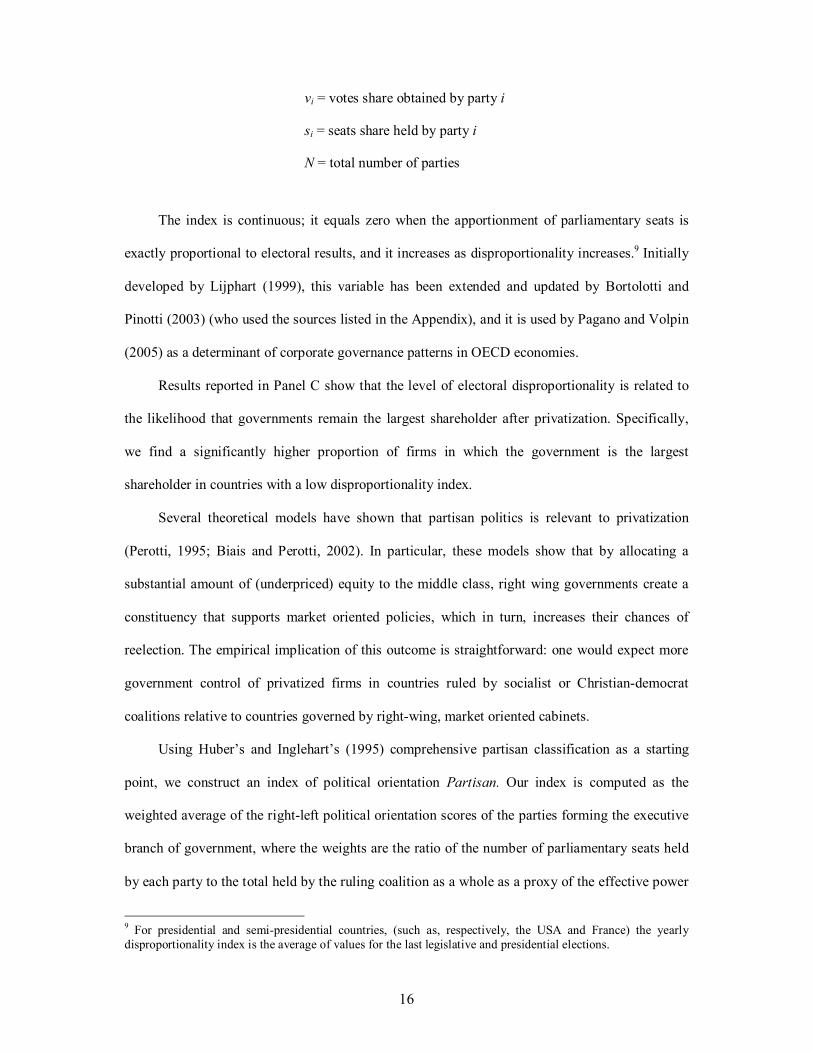
vi = votes share obtained by party i
si = seats share held by party i
N = total number of parties
The index is continuous; it equals zero when the apportionment of parliamentary seats is
exactly proportional to electoral results, and it increases as disproportionality increases. 9 Initially
developed by Lijphart (1999), this variable has been extended and updated by Bortolotti and
Pinotti (2003) (who used the sources listed in the Appendix), and it is used by Pagano and Volpin
(2005) as a determinant of corporate governance patterns in OECD economies.
Results reported in Panel C show that the level of electoral disproportionality is related to
the likelihood that governments remain the largest shareholder after privatization. Specifically,
we find a significantly higher proportion of firms in which the government is the largest
shareholder in countries with a low disproportionality index.
Several theoretical models have shown that partisan politics is relevant to privatization
(Perotti, 1995; Biais and Perotti, 2002). In particular, these models show that by allocating a
substantial amount of (underpriced) equity to the middle class, right wing governments create a
constituency that supports market oriented policies, which in turn, increases their chances of
reelection. The empirical implication of this outcome is straightforward: one would expect more
government control of privatized firms in countries ruled by socialist or Christiandemocrat
coalitions relative to countries governed by rightwing, market oriented cabinets.
Using Huber’s and Inglehart’s (1995) comprehensive partisan classification as a starting
point, we construct an index of political orientation Partisan. Our index is computed as the
weighted average of the rightleft political orientation scores of the parties forming the executive
branch of government, where the weights are the ratio of the number of parliamentary seats held
by each party to the total held by the ruling coalition as a whole as a proxy of the effective power
9 For presidential and semipresidential countries, (such as, respectively, the USA and France) the yearly disproportionality index is the average of values for the last legislative and presidential elections.
17
enjoyed by each party within the government coalition. The partisan data are counted
immediately after the last election. The leftright political orientation score is high (low) for right
wing (leftwing) parties. This index survived extensive crosschecking with other independent
sources. We expect that when our index is used to explain the timing of privatization in OECD
countries, large scale privatization will occur later (be more incomplete at any given time) in
countries ruled by coalitions that lean to the left of the political spectrum (Bortolotti and Pinotti,
2003). Consistent with our predictions, we find more government control of privatized firms in
countries ruled by leftwing governments (e.g., low partisan index).
According to the commitment view, governments are forced to establish SOEs when they
lack the necessary institutions to support private investment in sociallyvaluable projects due to
the risk of expropriation (see Esfahani and Ardakani, 2005). Weingast (1995) points out that
fiscal federalism combining local governments’ regulatory responsibility over the economy with
a hard budget constraint provides a suitable governance structure to credibly commit the state to
preserve markets and support private investment.
To test Weingast’s theory, we use a dummy variable that equals one in countries where
state/provinces have authority over taxing, spending, or legislating, and zero otherwise (Federal).
The data for this variable are from the Beck, Clarke, Groff, Keefer, and Walsh’s (2001) Database
of Political Institutions. This indicator broadly identifies countries implementing fiscal
federalism, an institutional setting where the central government delegates fundamental powers to
federal states or lower level governments (see Oates, 1999). If markets can thrive under fiscal
federalism, our dummy should be negatively associated with government influence in firms. Our
results are inconsistent with this prediction. In Table IV, Panel C, the reported values indicate that
there is not a significant difference between federal and nonfederal countries in the percentage of
firms in which the government is the largest shareholder. However, we find that a larger
percentage of firms in countries with fiscal federalism have golden shares. We show in the next
18
section that this result is driven by country characteristics that are not controlled for in this
univariate setting.
IV. Multivariate analysis of government control of privatized firms
Our descriptive analysis suggests that government control of privatized firms is pervasive
across developed economies. Yet the breakdown by country and industry reveals some intriguing
crosssectional variation. In this section, we investigate the question of which country factors and
firm characteristics are associated with more government control of privatized firms. In order to
identify the associated characteristics, we perform a multivariate analysis of ultimate government
voting rights and golden shares.
Before proceeding with the analysis, additional data was collected. First, we must have the
data required track changes in governments’ direct and indirect ownership in our privatized firms.
Changes in direct ownership may be due to additional sales of stock to other investors, to primary
stock issues, or to acquisitions of the company’s shares by the government or other public
entities.
When governments use pyramiding in their control positions, changes in the control
structure must be identified along the entire chain. This additional data allows us to construct the
variable State voting rights, percentage ultimate voting rights held by the government in the
privatized company, for each year in the 19962000 period. Second, we collect data to construct a
set of economic and financial variables to control for firmspecific time varying effects.
Our test includes three regression models. First, we estimate State voting rights. Second,
we estimate the probability of observing golden shares. We use a dummy variable Golden, which
equals 1 if at least one of the provisions that we described in our discussion of golden shares
(section III.B) is present in firm i in year t, and 0 otherwise. Finally, we evaluate the combination
of power held by governments through voting rights and golden shares by estimating the
probability that the government is the largest shareholder and/or that the firm has golden share
19
provisions. This probability is captured by two dummy variables, GoldOwn10 and GoldOwn20,
which equal 1 when Golden is equal to one and/or when residual government voting rights
exceed 10 or 20 percent, respectively, and which equal 0 otherwise. We now turn to the
explanatory variables.
A. Country specific explanatory variables
We consider a variety of country characteristics, including legal, institutional, political, and
economic conditions that may affect the level of governmental power in privatized firms. In all
regressions, we control for the legal tradition of the country, the degree of electoral
disproportionality, the partisan orientation of the government, and the level of political
decentralization. These variables were described in Section III.C.
In addition, we consider a variable related to the country’s financial situation. Indeed,
financially distressed governments have frequently divested their SOEs and have used the sale
proceeds to reduce public debt or to help finance the budget. Furthermore, in some developed
countries, notably in Italy and France, bailouts of SOEs have been a drain on the government’s
budget. In this situation, privatization might improve the public budget directly by reducing
government transfers to these companies. Our measure of a government’s financial condition is
the ratio of total government debt (domestic and foreign) to GDP in a given year (Debt Ratio).
Fiscal deficits could be used an alternative measure, but it seems more suitable to use a stock
variable, rather than a flow variable, to explain our dependent variables. Furthermore, debt series
are typically more stable over business cycles.
B. Firm specific explanatory variables
We control for several firm characteristics that potentially affect government voting rights
after privatization. First, we consider whether the firm is in a politically sensitive industry. Some
privatized firms in the energy, transportation, telecommunication, and utility industries are
strategically important for the national economy, and they are often shielded from competition.
20
Furthermore, they may enjoy favourable treatment by the state with respect to regulation,
guaranteed business, contracts, etc. If companies operating in these sectors are more important to
the state, it is plausible that the government will keep a larger stake in these firms. Governments
may also derive significant benefits from ownership of banks, which can be used to control the
selection of projects to be financed. We control for this effect with industry dummy variables,
based on twodigit SIC codes, for more politically sensitive sectors (Petroleum, Transportation,
Utilities, Finance).
We also control for the firm’s value, profitability, size and leverage; financial data for these
variables was collected from Worldscope. These variables are tested using two variable types: the
variable levels for a privatized firm and the differences between the privatized firm and its
matching peer. In the first case, we assume that the government decision to retain control depends
on the characteristics of the privatized company. In the second case, we assume that the
government decision depends on the relative performance of the privatized firm compared to its
benchmark firm. Since these two types of variables are labelled with the same names, the types
are explicitly specified in the notes to the tables and in the discussions. We use standard variables
for these firm characteristics; we measure value with markettobook (MB), profitability with
return on equity (ROE), size with the (log of) total assets (Size), and leverage with the debtto
equity ratio (Leverage). 10
Government residual voting rights may also depend on the nonpecuniary private benefits
of control. Since they reflect the benefits a shareholder may extract from the firm, they should be
correlated with the firm’s control structure. In particular, we expect to should observe a higher
subsequent concentration of government control in industries in which shareholders are able to
extract larger nonpecuniary benefits. The problem is, of course, to find a way of isolating non
pecuniary benefits. For this purpose, we follow Gompers, Ishii and Metrick (2006) in
10 The MB ratio is [Market value of (Ordinary + Preferred Equity)] / [Book value of (Ordinary + Preferred Equity)]. ROE is computed as (Net Income before Preferred Dividends Preferred Dividend Requirement) / Last Year's Common Equity. SIZE is the total assets of the company converted to U.S. dollars, using the fiscal
21
constructing our variable Benefit; this variable is the percentage of firms in each 2digit SIC
industry (within each country) having a firm name that includes the name of any of its top
officers (CEO, chairman of the board, president, a vicepresident, or secretary of the board), as
reported in Worldscope at the beginning of the sample period. 11
C. The testing strategy
The nature of our dependent variables determines the econometric tools used in our
analysis. For example, the variable State voting rights is left (right) censored for all the firmyears
in which ultimate government voting rights are zero (one), which includes a significant
percentage of our sample. In this case, conventional regression methods fail to account for the
qualitative difference between truncated (zero/one) and continuous variables. Tobit analysis,
instead, is based on a new random variable that infers the missing tail in the distribution of the
observed variable, allowing for estimation by conventional maximum likelihood methods
(Amemiya, 1985). Additionally, the probabilities of control via golden shares are estimated using
conventional Probit models. All the econometric models presented estimate the parameters by
maximizing a loglikelihood function.
Our dataset makes it possible to use panel estimation techniques, which deal both with the
heterogeneity over time and across units (i.e. firms, in our case). Equations have been estimated
by using random effects models. 12
We are also aware that our estimates may be affected by endogeneity problems, especially
when firm characteristics are included as regressors. As a partial solution, all the time varying
covariates are lagged one year. Obviously, the lagged variables are predetermined but not strictly
year end exchange rate. Leverage is computed as (Long Term Debt + Short Term Debt + Current Portion of Long Term Debt) / Common Equity. 11 Our variable is slightly different from the one used in Gompers et al. (2006). Our changes are driven mostly by data constraints. 12 It is well known that fixed effects nonlinear models produce inconsistent estimates, and that inconsistency is particularly severe for the probit model (Greene, 2004). The problem is that the estimator of each fixed effect uses only information from the corresponding group and the alternative of sweeping out intercepts by taking withingroup averages is not possible in nonlinear models. When a small number of observations is available for each group (as it happens in our sample) the variance of the estimator of the fixed effect does not asymptotically converge to 0; as a consequence, the estimator of the slope coefficient is also biased.
22
exogenous. Thus, we are estimating conditional expectations, and we caution the reader not to
infer causality when interpreting our reported coefficients.
D. Empirical results
We do not have a theoretical basis for predicting a different effect of any of our
explanatory variables on ultimate government voting rights or on golden shares provisions. No
clear relation is visible between these two channels, even though some provisions (particularly
special powers, ownership limits and voting caps imposed on foreign shareholders) appear to be
negatively correlated with ultimate government voting rights. For the sake of consistency, we run
exactly the same models for all dependent variables described at the beginning of section IV.
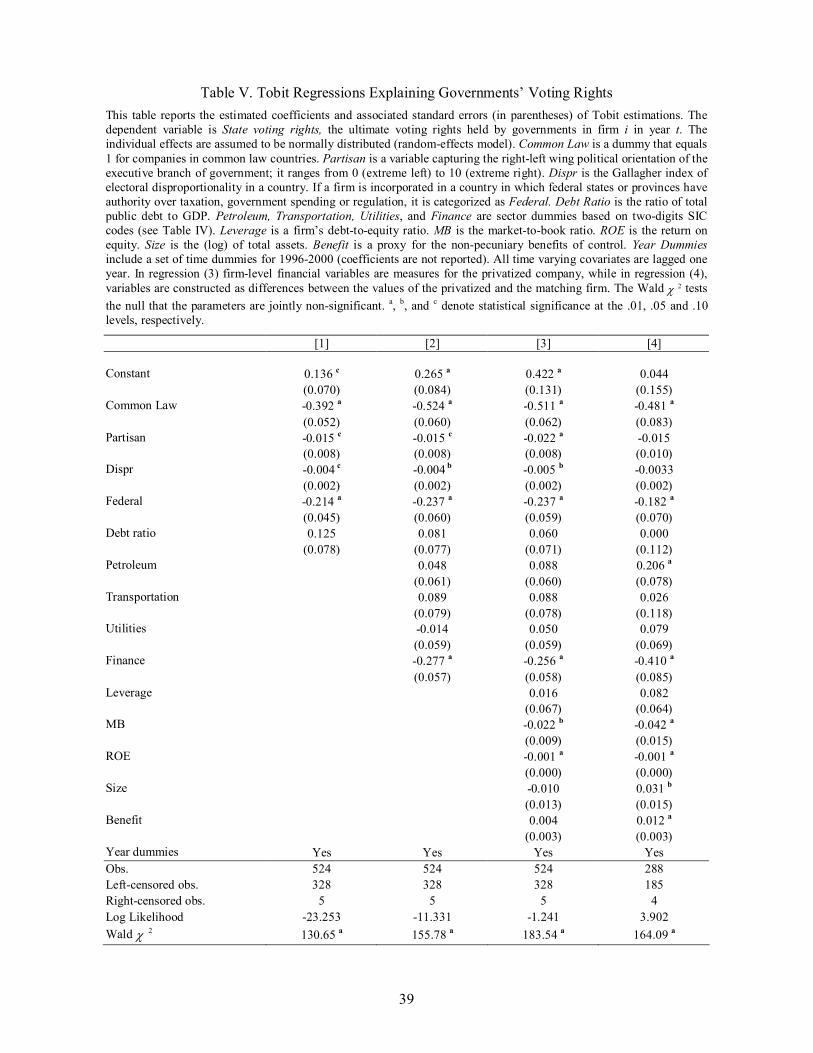
Table V presents the estimated coefficients for Tobit regressions when State voting rights is
the dependent variable. Column (1) presents the baseline model, Column (2) includes sector
dummies, and Columns (3) and (4) include both the sector dummies and firm specific
characteristics. The model in Column (3) uses the variable levels for the privatized firms’ levels
and the model in Column (4) uses the differences between the privatized company and its peer. 13
[Table V goes here]
The results reported in Table V confirm that our legal, institutional and political factors are
relevant in explaining government control in privatized firms. Consistent with previously
reported results, privatized firms in common law countries have a lower level of government
voting rights than those in civil law countries; the difference is significant at the .01 level. Thus,
in terms of voting rights, privatization is more complete in common law countries. A result that is
perhaps more surprising is that fiscal federalism has a considerable effect on the extent of
privatization. Across all specifications, the dummy Federal is always negative and highly
statistically significant. It is important to note that this effect holds for all privatized firms, not
just for those controlled by a local government. This result suggests that, as predicted, the
13 We use parsimonious specifications since the number of observations shrinks rapidly when additional control variables are included. We report the estimated coefficients of the set of control variables that yields the most interesting results.
23
distribution of fiscal authority to states/provinces provides an institutional setting in which
governments are more likely to have a strong commitment to privatization. The government’s
political orientation also appears to have an effect on residual government voting rights, although
the difference is not statistically significant in the model that uses peeradjusted performance
measures (Column 4). 14 Overall, the estimated coefficients of the variable Partisan suggest a
negative relation between the presence of a rightwing government and the extent of government
voting rights. This result is completely consistent with previous findings (Jones et al., 1999,
Bortolotti et al, 2003).
Interestingly, the electoral system also has a considerable effect on the control structure of
privatized firms. We find a strong and negative relation between the disproportionality index,
Dispr, and residual government voting rights. This evidence is consistent with the political
economy literature, which continues to find links between electoral rules and a broad range of
fiscal policy choices. On average, majority rule countries, which display higher disproportionality
between the percentage mix of officials’ parties and the percentage mix of the electorate’s votes,
are associated with smaller governments, less welfare spending and balanced budgets (Milesi
Ferretti et al., 2002; Persson and Tabellini, 2003). Our results are consistent with these
associations. In our sample, the majority rule governments retain a lower percentage of voting
rights in privatized firms than do more proportional governments; this is certainly consistent with
smaller government. Majority rule might also make it easier to make the decision to privatize
completely, since there are fewer veto players involved in the privatization decision compared to
more proportional governments.
The firm’s industry does not generally seem to impact the level of residual control.
Surprisingly, government stakes in banks and financial institutions are significantly lower than
those in nonfinancial firms. In their analysis of 1995 data, La Porta, LopezdeSilanes, and
Shleifer (2002) find the opposite; they conclude that government ownership of privatized banks
14 It is important to note that the number of observations is substantially lower in the model that uses differences (Column 4).
24
remained very large even after the wave of privatization in the 1980s. Our finding suggests that
after the largewave of the 1990s, government ownership in banks declined considerably relative
to other sectors.
Columns (3) and (4) in Table V report the estimated coefficients for firm characteristics.
Interestingly, we find that more valuable and more profitable firms tend to be privatized more
completely than other firms. Markettobook (MB) and Return on equity (ROE) have highly
statistically significant negative coefficients, both in the model that uses firm levels (Column (3))
and in the one that uses differences between privatized firms and their matched peers (Column
(4)). These findings appear consistent with a “bestfootforward” privatization policy, in which
governments sell stronger companies first (see Gupta, Ham, Svejnar, 2005). Finally, in the model
based on peer adjusted data, both firm size and the nonpecuniary private benefits associated with
control are positively associated with more residual government control. Government debt ratios
and firm leverage do not appear to be associated with residual voting rights.
[Table VI goes here]
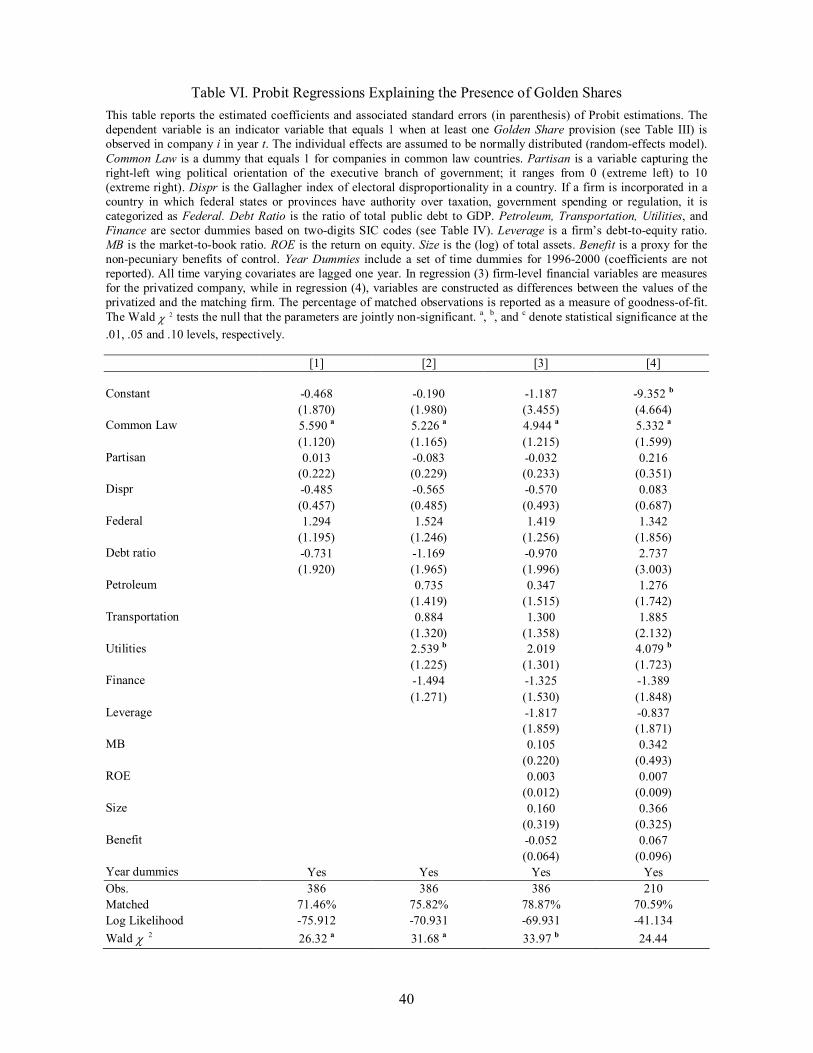
Table VI presents the results of the probit analysis of the set of golden shares. Only two
independent variables are associated with the presence of golden shares, the legal tradition
variable Common Law and the Utility sector indicator variable. First, the coefficient of Common
Law indicates that golden shares are more likely in common law countries; it is highly
statistically significant and remarkably stable across the four regressions. This result is consistent
with the highly significant association found between legal tradition and the presence of golden
shares in the descriptive analysis reported earlier. This evidence shows that golden shares, which
were initially developed in the United Kingdom to encourage the transfer of ownership rights in
strategic industries, found a more favourable environment in countries belonging to the same
legal tradition.
Second, firms in the utility sector are more likely to have golden shares. This result is not
surprising because golden share provisions have been specifically designed by governments to
25
maintain control in politically sensitive sectors. Utilities include electricity, gas, and
telecommunications companies, which provide essential public services that are often regulated
because of their importance to the nation.
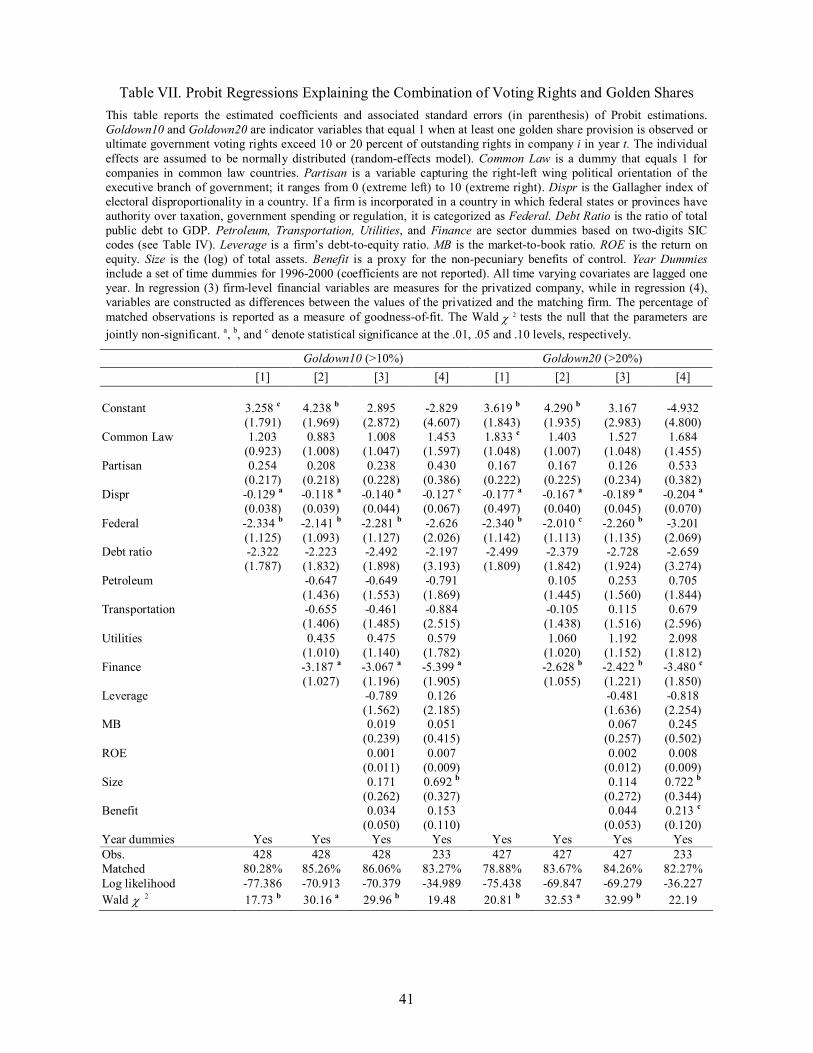
Finally, we estimate the overall residual government control of privatized firms maintained
through the combination of voting rights and golden shares. Table VII presents the probit analysis
results. The analysis uses two dummy dependent variables that equal 1 when the firm has at least
one golden share or when ultimate government voting rights exceed 10 or 20 percent of
outstanding rights in company i in year t (GoldOwn10 and GoldOwn20, respectively). These
variables reflect governments’ unwillingness to completely relinquish control in privatized firms.
[Table VII goes here]
Three factors which were highly significant in the analysis of State voting rights are also
significant here: disproportional representation in the electoral system, fiscal federalism, and
industry. Across specifications and control thresholds, we find a negative and highly statistically
significant relation between government control and disproportionality of the electoral system. In
majority rule systems (disproportional), governments relinquish more control during privatization
compared to those in more proportional systems.
Fiscal federalism is again important in explaining residual power in privatized firms. The
coefficient on Federal is negative and statistically significant in all eight models, albeit less so for
the smaller sample used in the two variations of model [4], which use differences in the financial
variables between privatized and matched firms. Overall these findings suggest that countries in
which substantial fiscal authority are delegated to subnational governments have institutions that
are favourable for more complete privatization.
Finally, in view of earlier research findings, it is striking that at the end of 2000 firms, firms
in the financial industry are likely to be more completely privatized than other firms. The highly
statistically significant negative coefficient for the finance sector variable suggests that in
developed economies banks are less important in financing politically motivated projects than
26
they used to be. Overall, government control of privatized firms appears to be relatively
unaffected by other sector or by individual firm characteristics.
V. Conclusions
Our study yields important new findings concerning government control over firms after
privatization. First, results indicate that across our sample of firms from OECD countries,
privatization is less complete than it appears at first glance. By combining information on
ultimate voting rights, which is a relatively new concept, with data on special powers granted to
state, we show that at the end of 2000, governments are either the largest shareholders or have
substantial powers in almost two thirds of our sample of privatized firms. This outcome is in
sharp contrast to the standard definitions of privatization in the literature. For example, Shleifer
and Vishny (1997) argue that “[i]n most cases, privatization replaces political control with private
control by outside investors.” Similarly, according to the White House, 15 “[p]rivatization is the
process of changing a public entity or enterprise to private control and ownership.”
Our results also indicate that a country’s legal and government systems impact the degree
to which the government relinquishes control in privatized firms. We show that in common law
countries, golden shares are frequently used by governments to retain control after privatization.
The presence of politicians on the boards of privatized companies in common law countries
provides additional evidence of government control. On the other hand, in civil law countries,
governments tend to retain large ownership positions, both directly, and indirectly by pyramiding
and with dual class shares. Surprisingly, when we ignore which particular mechanism is used, we
find no association between a country’s legal tradition and the extent of government control over
privatized companies. However, overall government control appears to be related to other
characteristics of the political system; governments tend to retain more control after privatization
in countries with proportional electoral rules and with centralized political authority.
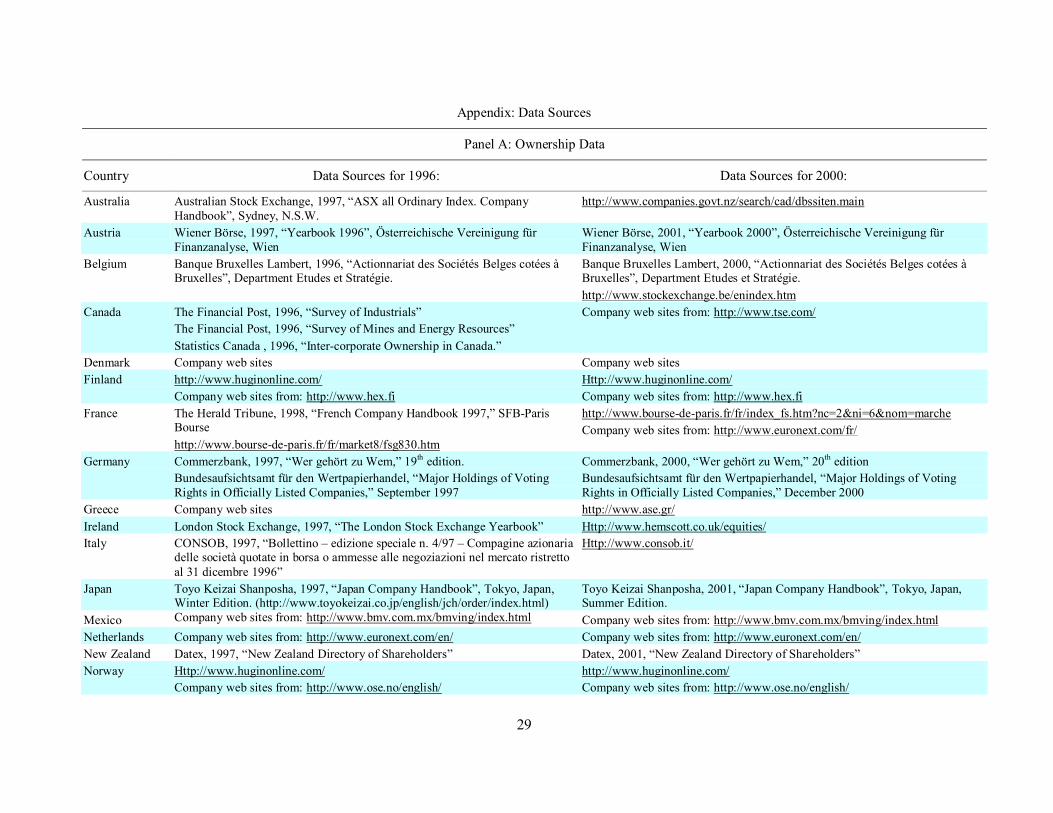
Austria Wiener Börse, 1997, “Yearbook 1996”, Österreichische Vereinigung für Finanzanalyse, Wien
Wiener Börse, 2001, “Yearbook 2000”, Österreichische Vereinigung für Finanzanalyse, Wien
Belgium Banque Bruxelles Lambert, 1996, “Actionnariat des Sociétés Belges cotées à Bruxelles”, Department Etudes et Stratégie.
Banque Bruxelles Lambert, 2000, “Actionnariat des Sociétés Belges cotées à Bruxelles”, Department Etudes et Stratégie. http://www.stockexchange.be/enindex.htm
Canada The Financial Post, 1996, “Survey of Industrials” The Financial Post, 1996, “Survey of Mines and Energy Resources” Statistics Canada , 1996, “Intercorporate Ownership in Canada.”
Company web sites from: http://www.tse.com/
Denmark Company web sites Company web sites Finland http://www.huginonline.com/
Company web sites from: http://www.hex.fi Http://www.huginonline.com/ Company web sites from: http://www.hex.fi
France The Herald Tribune, 1998, “French Company Handbook 1997,” SFBParis Bourse http://www.boursedeparis.fr/fr/market8/fsg830.htm
http://www.boursedeparis.fr/fr/index_fs.htm?nc=2&ni=6&nom=marche Company web sites from: http://www.euronext.com/fr/
Germany Commerzbank, 1997, “Wer gehört zu Wem,” 19 th edition. Bundesaufsichtsamt für den Wertpapierhandel, “Major Holdings of Voting Rights in Officially Listed Companies,” September 1997
Commerzbank, 2000, “Wer gehört zu Wem,” 20 th edition Bundesaufsichtsamt für den Wertpapierhandel, “Major Holdings of Voting Rights in Officially Listed Companies,” December 2000
Greece Company web sites http://www.ase.gr/ Ireland London Stock Exchange, 1997, “The London Stock Exchange Yearbook” Http://www.hemscott.co.uk/equities/ Italy CONSOB, 1997, “Bollettino – edizione speciale n. 4/97 – Compagine azionaria
delle società quotate in borsa o ammesse alle negoziazioni nel mercato ristretto al 31 dicembre 1996”
Http://www.consob.it/
Japan Toyo Keizai Shanposha, 1997, “Japan Company Handbook”, Tokyo, Japan, Winter Edition. (http://www.toyokeizai.co.jp/english/jch/order/index.html)
Toyo Keizai Shanposha, 2001, “Japan Company Handbook”, Tokyo, Japan, Summer Edition.
Mexico Company web sites from: http://www.bmv.com.mx/bmving/index.html Company web sites from: http://www.bmv.com.mx/bmving/index.html Netherlands Company web sites from: http://www.euronext.com/en/ Company web sites from: http://www.euronext.com/en/ New Zealand Datex, 1997, “New Zealand Directory of Shareholders” Datex, 2001, “New Zealand Directory of Shareholders” Norway Http://www.huginonline.com/
Company web sites from: http://www.ose.no/english/ http://www.huginonline.com/ Company web sites from: http://www.ose.no/english/
Portugal Bolsa de Valores de Lisboa, 1997, “Sociedades Cotadas 1996” Bolsa de Valores de Lisboa e Porto, 2000, “Sociedades Cotadas 1999”, CDrom Spain Comision Nacional del Mercado de Valores, 1996 and 1997, “Participaciones
significativas en sociedades cotizadas” http://www.cnmv.es/english/cnmve.htm
Sweden Http://www.huginonline.com/ http://www.huginonline.com/ Turkey Company web sites. The Istanbul Stock Exchange, 2001, “Yearbook of Companies”, available at:
http://www.ise.org UK London Stock Exchange, 1997, “The London Stock Exchange Yearbook” http://www.hemscott.co.uk/equities/ USA http://www.sec.gov/cgibin/srchedgar http://www.sec.gov/cgibin/srchedgar Ownership information is supplemented with the various companies’ privatization prospectuses, Bankscope, the Economist Intelligence Unit country reports (for Government ownership), Extel Financial, Faccio and Lang (2002), Fortune (www.fortune.com), LexisNexis, and Worldscope.
Panel B: Additional Data
Accounting and stock market data: 1. Worldscope; Datastream 2. Company privatization prospectuses and accounts
Datasets used to track companies (i.e., to identify name changes, M&As, etc .): 1. Thomson Financial Securities Data, SDC Platinum™, Worldwide Mergers & Acquisitions Database 2. Extel Financial 3. Sources listed in Panel A
Political data: 1. Electoral Studies, various years 2. Banks, A.S., T.C. Day and W.R. Muller (2002), Political Handbook of the World 20002002 CSA publications, State University of New York. 3. Zarate’s World Political Leaders since 1945 (www.terra.es/personal2/monolith) 4. Library of Congress Country Studies (http://lcweb2.loc.gov/frd/cs/cshome.html), 5. Administration and Cost of Elections (www.aceproject.org) 6. Elections Around the World (www.electionworld.org) 7. Parties and Elections in Europe (www.partiesandelections.de/indexe.html) 8. Political Reference Almanac (http://www.polisci.com/almanac/nations.htm)
Figure 1. The Voting Rights Structure Of Deutsche Lufthansa (Germany) At The End Of 1996
Deutsche Lufthansa AG
Deutsche Postbank AG
Deutsche Bahn AG
KfW State of North RhineWestphalia
MGL 1.03% 0.4% 37.45% 1.77% 10.05%
Dresdner Bank AG
Bayerische Landesbank Girozentrale
44.5% 44.5%
Association of Bavarian Saving Banks
State of Bavaria
Allianz AG
22.0% 50% 50%
Federal Republic
100% 100% 80%
32
Figure 2. The Voting Rights Structure Of STMicroelectronics NV (France) At The End Of 2000.
STMicroelectronics NV
STMicroelectronics Holding II BV
STMicroelectronics Holding NV
FT1CI
CEA Industries France Telecom IRI
Italian Government CEA
French Government
69.4%
100%
50% 50%
100%
Finmeccanica
5 %
100%
100%
51% 32.4 %
55.5%
49%
33
Table I. Distribution Of Owner Type For The Largest Ultimate Owner In Privatized And Matching Firms
Our samples of 141 privatized corporations and 141 matching firms are used to construct this table. The table presents the percentage of firms controlled by different types of large owners, using 10% ownership as the threshold for a large shareholder. Large shareholders are classified into six types. State: A national government (domestic or foreign), a local authority (county, municipality, etc.), or a government agency. Family: A family (including an individual) or a firm that is unlisted on any stock exchange. Widely held financial institution: A financial firm (SIC 60006999) that has no shareholder who controls 10% or more of the votes. Widely held corporation: A nonfinancial firm that is widely held, based on the 10% control threshold. Miscellaneous: Charities, voting trusts, employees, cooperatives, or minority foreign investors. Crossholdings: Firm Y is controlled by another firm that is controlled by Y, or firm Y directly controls at least 10% of its own stock. Companies that do not have a shareholder who controls at least 10% of votes are classified as widely held. a , b , and c denote statistical significance at the .01, .05, and .10 levels, respectively. Zstatistics for equality of proportions are reported in the table.
Panel A: Privatized Firms — of which: Time period Number
of firms State Family
Identified families
Unlisted firms
Widely held corp.
Widely held
financial
Miscell. Cross holdings
Widely held
End of 1996 141 34.75 16.31 2.84 13.48 2.84 17.02 1.42 0.00 27.66
End of 2000 141 29.79 19.86 2.84 17.02 4.26 9.93 4.96 0.71 30.50
Table II. Ultimate Voting Rights Our samples of 141 privatized corporations and 141 matching firms are used to construct this table. Largest shareholder voting rights is the percentage of voting rights ultimately controlled by the largest ultimate shareholder. Government voting rights is the percentage of voting rights controlled by a government, when a government is the largest shareholder. Private voting rights is the percentage of voting rights controlled by the largest shareholder in the matching firms of companies in which the Government is the largest shareholder. Firms using control enhancing devices denotes the percentage of governmentcontrolled firms (or matching peers) in which the largest shareholder enhances his/her voting power by using pyramids, multiple control chains and/or dual class share structures. Pyramids occur when the largest ultimate shareholder owns one corporation through another which he does not totally own. Firm Y is held through multiple control chains if it has an ultimate owner who controls it via a multitude of control chains, each of which includes at least 5% of the voting rights at each link. Dual class shares occur when firms have outstanding stocks with different voting rights. a , b , and c denote statistical significance at the .01, .05, and .10 levels, respectively.
Panel A: Privatized Firms
All privatized companies Companies in which the government is the largest shareholder
Number of firms
Largest shareholder voting rights (Mean)
Median voting rights
Number of firms
Government voting rights (Mean)
Firms using control enhancing
devices (%)
End of 1996 141 27.80 19.99 49 51.27 53.06
End of 2000 141 25.51 16.16 42 52.18 52.38
Diff ’00‘96 2.29
Tstat 1.26
Panel B: Matching Firms
Number of firms
Largest shareholder voting rights (Mean)
Median voting rights
Number of firms
Private voting rights (Mean)
Firms using control enhancing
devices (%)
End of 1996 141 21.10 11.92 49 15.67 30.61
End of 2000 141 26.37 13.40 42 17.76 33.33
Diff ’00‘96 5.27 b
Tstat 2.13
Panel C: Difference between Privatized and Matching Firms
Voting rights (Mean)
Voting rights (Mean)
Diff end 1996 6.70 b 35.50 a
Tstat 2.37 9.10
Diff end 2000 0.86 34.42 a
Tstat 0.28 7.80
35
Table III. Use of “Golden Share” Provisions In Privatized Firms The table reports the percentages of firms in each category using each device. Golden shares exist when the government enjoys special powers or if there are other statutory constraints in a privatized company. Special powers include (i) the right to appoint board members; (ii) the right to consent to or to veto the acquisition of interests in the privatized company; (iii) other rights such as to consent to the transfer of subsidiaries, dissolution of the company, or even everyday management decisions. Statutory constraints include (i) ownership limits; (ii) voting caps; (iii) provisions limiting the nationality of those having an interest in the firm. A firm has an Ownership limit if its charter limits ownership rights that can be acquired without Government consent. A firm has a Voting Cap if its charter limits the votes that any shareholder may cast at general meetings. A firm has a Foreign Ownership Limit if its charter establishes an upper limit on the ownership rights that can be acquired by a foreign investor without Government consent. A firm has a Foreign Voting Cap if the firm’s charter establishes an upper limit on the votes that any foreign shareholder may cast at general meetings. If a firm’s charter prohibits nonresidents from acquiring a controlling interest in the privatized company, it is characterized by National Control. If a firm’s charter requires that the corporate headquarters be located in the country of incorporation or that the board members be citizens of the country of incorporation, this firm has limits on Location/Directors’ Nationality. Gov’t Controlled firms are those in which the largest shareholder (at the 10% threshold) is a national government (domestic or foreign), a local authority (county, municipality, etc.), or a government agency. All other firms are classified as NonGov’t Controlled.
All Privatized Firms Gov’t Controlled NonGov’t Controlled Gov’t Controlled NonGov’t Controlled (as of end ’96) (as of end ’96) (as of end ’00) N (%) N (%) N (%) N (%) N (%)
Table IV. Industry and Country Distribution of Privatized Firms by Control Type Industry Classification is based on Campbell’s categories (1996. p. 316). Market Cap. is the average market capitalization of privatized companies in a given industry or country (thousands of US$) at the end of 1996. Gov’t Controlled firms are those in which the largest shareholder (at the 10% threshold) is a national government (domestic or foreign), a local authority (county, municipality, etc.), or a government agency. Golden share is a dummy that takes the value of 1 if the Government enjoys special powers or if there are statutory constraints on privatized companies. Common Law indicates that the firm is incorporated in a common law country. Partisan is a variable that captures the rightleft wing political orientation of the coalition supporting the executive branch of government in the country of incorporation; it ranges from 0 (extreme left) to 10 (extreme right). Dispr is the Gallagher index of electoral disproportionality in a country’s government. If a firm is incorporated in a country in which states or provinces have authority over taxation, government spending or regulation, it is categorized as Federal.
Panel A: Distribution by Industry
Industry classification TwoDigit SIC Codes # of Obs.
Panel C: Country Attributes and Government Control of Privatized Firms
Country Attributes # of Obs. Market Cap. (US$ 1,000s)
Gov’t Controlled 1996 (%)
Gov’t Controlled 2000 (%)
Golden Share (%)
Common Law 44 6,554,042 4.6 4.6 86.5 Not Common Law 97 7,034,399 48.5 41.2 49.2
Difference 480,357 43.9 a 36.6 a 37.3 a
Dispr > median 76 6,997,324 21.1 17.1 66.7 Dispr < median 61 7,156,810 54.1 47.6 52.6
Difference 159,486 33.0 a 30.5 a 14.1
Partisan > median 71 10,513,670 22.5 19.7 62.3 Partisan < median 66 3,361,994 a 50.0 42.4 60.4
Difference 7,151,676 27.5 a 22.7 a 1.9
Federal 65 7,604,881 29.2 24.6 77.3 Not Federal 76 6,268,386 39.5 34.2 51.7
Difference 1,336,495 10.2 9.6 25.6 a
a , b , and c denote significance in the difference between the two groups (e.g., Common Law = 1 and Common Law = 0) at the .01, .05 and .10 levels, respectively.
39
Table V. Tobit Regressions Explaining Governments’ Voting Rights This table reports the estimated coefficients and associated standard errors (in parentheses) of Tobit estimations. The dependent variable is State voting rights, the ultimate voting rights held by governments in firm i in year t. The individual effects are assumed to be normally distributed (randomeffects model). Common Law is a dummy that equals 1 for companies in common law countries. Partisan is a variable capturing the rightleft wing political orientation of the executive branch of government; it ranges from 0 (extreme left) to 10 (extreme right). Dispr is the Gallagher index of electoral disproportionality in a country. If a firm is incorporated in a country in which federal states or provinces have authority over taxation, government spending or regulation, it is categorized as Federal. Debt Ratio is the ratio of total public debt to GDP. Petroleum, Transportation, Utilities, and Finance are sector dummies based on twodigits SIC codes (see Table IV). Leverage is a firm’s debttoequity ratio. MB is the markettobook ratio. ROE is the return on equity. Size is the (log) of total assets. Benefit is a proxy for the nonpecuniary benefits of control. Year Dummies include a set of time dummies for 19962000 (coefficients are not reported). All time varying covariates are lagged one year. In regression (3) firmlevel financial variables are measures for the privatized company, while in regression (4), variables are constructed as differences between the values of the privatized and the matching firm. The Wald 2 χ tests the null that the parameters are jointly nonsignificant. a , b , and c denote statistical significance at the .01, .05 and .10 levels, respectively.
[1] [2] [3] [4]
0.136 c 0.265 a 0.422 a 0.044 Constant (0.070) (0.084) (0.131) (0.155) 0.392 a 0.524 a 0.511 a 0.481 a Common Law (0.052) (0.060) (0.062) (0.083) 0.015 c 0.015 c 0.022 a 0.015 Partisan (0.008) (0.008) (0.008) (0.010) 0.004 c 0.004 b 0.005 b 0.0033 Dispr (0.002) (0.002) (0.002) (0.002) 0.214 a 0.237 a 0.237 a 0.182 a Federal (0.045) (0.060) (0.059) (0.070) 0.125 0.081 0.060 0.000 Debt ratio (0.078) (0.077) (0.071) (0.112)
0.048 0.088 0.206 a Petroleum (0.061) (0.060) (0.078) 0.089 0.088 0.026 Transportation (0.079) (0.078) (0.118) 0.014 0.050 0.079 Utilities (0.059) (0.059) (0.069) 0.277 a 0.256 a 0.410 a Finance (0.057) (0.058) (0.085)
0.016 0.082 Leverage (0.067) (0.064) 0.022 b 0.042 a MB (0.009) (0.015) 0.001 a 0.001 a ROE (0.000) (0.000) 0.010 0.031 b Size (0.013) (0.015) 0.004 0.012 a Benefit (0.003) (0.003)
Year dummies Yes Yes Yes Yes Obs. 524 524 524 288 Leftcensored obs. 328 328 328 185 Rightcensored obs. 5 5 5 4 Log Likelihood 23.253 11.331 1.241 3.902 Wald 2 χ 130.65 a 155.78 a 183.54 a 164.09 a
40
Table VI. Probit Regressions Explaining the Presence of Golden Shares This table reports the estimated coefficients and associated standard errors (in parenthesis) of Probit estimations. The dependent variable is an indicator variable that equals 1 when at least one Golden Share provision (see Table III) is observed in company i in year t. The individual effects are assumed to be normally distributed (randomeffects model). Common Law is a dummy that equals 1 for companies in common law countries. Partisan is a variable capturing the rightleft wing political orientation of the executive branch of government; it ranges from 0 (extreme left) to 10 (extreme right). Dispr is the Gallagher index of electoral disproportionality in a country. If a firm is incorporated in a country in which federal states or provinces have authority over taxation, government spending or regulation, it is categorized as Federal. Debt Ratio is the ratio of total public debt to GDP. Petroleum, Transportation, Utilities, and Finance are sector dummies based on twodigits SIC codes (see Table IV). Leverage is a firm’s debttoequity ratio. MB is the markettobook ratio. ROE is the return on equity. Size is the (log) of total assets. Benefit is a proxy for the nonpecuniary benefits of control. Year Dummies include a set of time dummies for 19962000 (coefficients are not reported). All time varying covariates are lagged one year. In regression (3) firmlevel financial variables are measures for the privatized company, while in regression (4), variables are constructed as differences between the values of the privatized and the matching firm. The percentage of matched observations is reported as a measure of goodnessoffit. The Wald 2 χ tests the null that the parameters are jointly nonsignificant. a , b , and c denote statistical significance at the .01, .05 and .10 levels, respectively.
[1] [2] [3] [4]
0.468 0.190 1.187 9.352 b Constant (1.870) (1.980) (3.455) (4.664) 5.590 a 5.226 a 4.944 a 5.332 a Common Law (1.120) (1.165) (1.215) (1.599) 0.013 0.083 0.032 0.216 Partisan (0.222) (0.229) (0.233) (0.351) 0.485 0.565 0.570 0.083 Dispr (0.457) (0.485) (0.493) (0.687) 1.294 1.524 1.419 1.342 Federal (1.195) (1.246) (1.256) (1.856) 0.731 1.169 0.970 2.737 Debt ratio (1.920) (1.965) (1.996) (3.003)
Year dummies Yes Yes Yes Yes Obs. 386 386 386 210 Matched 71.46% 75.82% 78.87% 70.59% Log Likelihood 75.912 70.931 69.931 41.134 Wald 2 χ 26.32 a 31.68 a 33.97 b 24.44
41
Table VII. Probit Regressions Explaining the Combination of Voting Rights and Golden Shares This table reports the estimated coefficients and associated standard errors (in parenthesis) of Probit estimations. Goldown10 and Goldown20 are indicator variables that equal 1 when at least one golden share provision is observed or ultimate government voting rights exceed 10 or 20 percent of outstanding rights in company i in year t. The individual effects are assumed to be normally distributed (randomeffects model). Common Law is a dummy that equals 1 for companies in common law countries. Partisan is a variable capturing the rightleft wing political orientation of the executive branch of government; it ranges from 0 (extreme left) to 10 (extreme right). Dispr is the Gallagher index of electoral disproportionality in a country. If a firm is incorporated in a country in which federal states or provinces have authority over taxation, government spending or regulation, it is categorized as Federal. Debt Ratio is the ratio of total public debt to GDP. Petroleum, Transportation, Utilities, and Finance are sector dummies based on twodigits SIC codes (see Table IV). Leverage is a firm’s debttoequity ratio. MB is the markettobook ratio. ROE is the return on equity. Size is the (log) of total assets. Benefit is a proxy for the nonpecuniary benefits of control. Year Dummies include a set of time dummies for 19962000 (coefficients are not reported). All time varying covariates are lagged one year. In regression (3) firmlevel financial variables are measures for the privatized company, while in regression (4), variables are constructed as differences between the values of the privatized and the matching firm. The percentage of matched observations is reported as a measure of goodnessoffit. The Wald 2 χ tests the null that the parameters are jointly nonsignificant. a , b , and c denote statistical significance at the .01, .05 and .10 levels, respectively.