27
ADBI Working Paper Series GOVERNMENT DECENTRALIZATION PROGRAM IN INDONESIA Anwar Nasution No. 601 October 2016 Asian Development Bank Institute
ADBI Working Paper Series
GOVERNMENT DECENTRALIZATION PROGRAM IN INDONESIA
Anwar Nasution
No. 601 October 2016
Asian Development Bank Institute

The Working Paper series is a continuation of the formerly named Discussion Paper series; the numbering of the papers continued without interruption or change. ADBI’s working papers reflect initial ideas on a topic and are posted online for discussion. ADBI encourages readers to post their comments on the main page for each working paper (given in the citation below). Some working papers may develop into other forms of publication.
Suggested citation:
Nasution, A. 2016. Government Decentralization Program in Indonesia. ADBI Working Paper 601. Tokyo: Asian Development Bank Institute. Available: https://www.adb.org/publications/government-decentralization-program-indonesia/ Please contact the author for information about this paper.
E-mail: [email protected]
Anwar Nasution is a professor of economics at the University of Indonesia, Jakarta. The views expressed in this paper are the views of the author and do not necessarily reflect the views or policies of ADBI, ADB, its Board of Directors, or the governments they represent. ADBI does not guarantee the accuracy of the data included in this paper and accepts no responsibility for any consequences of their use. Terminology used may not necessarily be consistent with ADB official terms. Working papers are subject to formal revision and correction before they are finalized and considered published.
Asian Development Bank Institute Kasumigaseki Building 8F 3-2-5 Kasumigaseki, Chiyoda-ku Tokyo 100-6008, Japan Tel: +81-3-3593-5500 Fax: +81-3-3593-5571 URL: www.adbi.org E-mail: [email protected] © 2016 Asian Development Bank Institute

ADBI Working Paper 601 A. Nasution
Abstract Without much preparation, Indonesia, in 2000, at a stroke replaced the previous system of centralized government and development planning with a wide range of decentralization programs. The reforms gave greater authority, political power, and financial resources directly to regencies and municipalities, bypassing the provinces. The powers transferred include those of executing a wide range of responsibilities in the areas of health, primary and middle-level education, public works, environment, communication, transport, agriculture, manufacturing, and other economic sectors. At the same time, the government replaced the antiquated cash-based, single-entry system of public finance with a modern double-entry accounting system that uses a single treasury account; is performance based; and has transparent management of the public treasury, tight expenditure and financial controls with performance indicators, computerized reporting, and a tightly scheduled auditing system. On the positive side, unlike in many developing and transition countries, the decentralization program in Indonesia has not caused major political or economic problems. However, the decentralization program was ill prepared and not carried out in a logical order for two reasons. First, the capacity of subnational governments to produce public and private goods, increase productivity and employment, and promote economic growth in their jurisdictions, was not increased. Because of the long tradition of centralization, local government never built the capacity to carry out economic planning and undertake initiatives to promote local economic growth. Before the reform, the local governments had mainly functioned as implementing agencies of national policies and programs. Second, the number of good financial managers, as required by the new laws of public treasury and auditing, was also limited and needed to be trained. The rising revenues of local governments do not follow their increasing government functions to promote economic development that could potentially cause fiscal imbalances. JEL Classification: H70, H72, H74, H77

ADBI Working Paper 601 A. Nasution
Contents
1. INTRODUCTION ....................................................................................................... 1
2. INSTITUTIONAL SETTING ....................................................................................... 2
2.1 Division of Responsibilities between Levels of Government ........................... 2 2.2 Government Finance ..................................................................................... 5 2.3 Fiscal Reforms ............................................................................................... 7 2.4 Debt Financing ............................................................................................... 9 2.5 State-owned Enterprises ................................................................................ 9 2.6 Administration of Public Sector’s Funds ....................................................... 10
3. FINANCING SUBNATIONAL GOVERNMENTS ...................................................... 12
3.1 Revenues of Local Governments ................................................................. 12 3.2 Expenditure Needs of Local Governments ................................................... 15 3.3 Horizontal Imbalances of Regional Government .......................................... 15 3.4 Equalization Transfer ................................................................................... 17 3.5 Budget Realization ....................................................................................... 17
4. CONCLUSIONS ...................................................................................................... 19
REFERENCES ................................................................................................................... 21
ADBI Working Paper 601 A. Nasution
1. INTRODUCTION Indonesia adopted a wide range of social reforms (reformasi) after the fall in February 1998 of President Suharto, who had been in power for 32 years from 1966 to 1998. First, the reform ended the authoritarian military-led political system and replaced it with an expensive democratic multiparty system. The political role of the military ended with the abolishment of its dual function or direct role in politics. Second, the reform ended the dominant role of the government in the economy and started a move toward a market-based economic system and a globalized open economy. A third aspect of the reform was a “big bang” approach to wide-ranging decentralization by giving both greater political power and budgets to local governments. It is a uniform system under which all subnational governments in Indonesia operate. This democratic and autonomous system replaced the previous system of centralized government and development planning. Fourth, the government in 2003–2004 introduced a package of three modern laws on state finance covering state treasury and auditing management and accountability. The new system replaced the antiquated cash-based, single-entry system with a modern double-entry accounting system and uses a single treasury account, transparent management of the public treasury, expenditure and financial control with performance indicators and computerized reporting, and a tightly scheduled auditing system. Without much preparation, through Laws No. 22/1999 and No. 25/1999, the central government abruptly transferred political authorities and financial resources to the third level of government of Indonesia. These two laws decentralized political and economic powers away from the central government after decades of highly centralized and autocratic rule. Bypassing the provincial government, the laws provide districts (kabupaten) and municipalities (kota) at the subprovincial level, with greater involvement in the management of their day-to-day affairs and in the provision of public goods to satisfy regional interests, and it was hoped this would result in better local service delivery. Laws No. 22/1999 and No. 32/2004 give authority to local governments to execute a wide range of responsibilities in areas such as health, education, public works, environment, communication, transport, agriculture, manufacturing industry and trade, capital investment, land, cooperatives, labor force, and infrastructure services. Law No. 23/2014 and revised Law No. 32/2004 itemize the responsibilities of the subnational governments. The decentralization of government functions, however, was not followed up with equipping subnational governments with the capacity to produce public goods, increase productivity and employment, and promote economic growth in their jurisdictions. Before the reform, subnational governments had mainly functioned as implementing agencies of national policies and programs. The number of good financial managers, as required by the new laws of public treasury and auditing, was also limited. Because of long periods of centralization, local governments never built the necessary capacity for economic planning or to take initiatives to promote economic growth in their jurisdictions. The rising revenues of local governments do not follow their increasing government functions to promote economic development that could potentially cause fiscal imbalances. On the other hand, the central government lacks the capability to monitor the implementation of the government functions transferred to the subnational level, to monitor subnational governments’ spending patterns and efforts.
1
ADBI Working Paper 601 A. Nasution
Unlike in many developing and transitioning countries, the decentralization program in Indonesia did not cause major political or economic problems. Only the former Province of East Timor seceded to establish the Democratic Republic of Timor-Leste in 1989. Supported by the West during the Cold War, Indonesia had absorbed Timor-Leste in 1976 after a coup d’état led by the communist-leaning military in Portugal. The region was not part of the original Indonesia as it had been a colony of Portugal until 1976. To preserve the unity of the country and end the sporadic rebellious independent movements, Aceh and Papua were granted more autonomous powers in local decision making in four areas: (i) religious affairs, (ii) local customs and institutions, (iii) education and (iv) local development policy. Law No. 4/2001 splits Papua into two provinces, namely, Papua and West Papua. Under the Helsinki Accord, peace agreement was signed with the Aceh Free Movement (Gerakan Aceh Merdeka [GAM]) on 15 August 2015. Law No. 11/2006 establishes the province Aceh Nangru Darussalam (NAD) that uses Islamic shariah law. The rest of this paper is divided into three parts. Section 2 describes the institutional setting: division of responsibilities between the central and local governments, government financing, and administration of public funds and state-owned enterprises. Section 3 discusses revenues of local governments and fiscal transfer from the central government to address horizontal imbalances of local government. Section 4 summarizes the findings.
2. INSTITUTIONAL SETTING
2.1 Division of Responsibilities between Levels of Government
Indonesia is a unitary republic and is divided into five layers of government: central, provinces, kabupaten (districts) and kota (municipalities), kecamatan (subdistricts), and kelurahan/desa (villages). Prior to the present reform, there had only been very little implementation of effective devolution of authority and financial resources to lower tiers of government. The central government appointed local officials, carried out central planning, and directly provided financing to local governments for the production of public goods and the financing of the general administration. To assure political loyalty to the regime, most of the appointed heads of local governments, from the provinces down to kelurahan, were from the military services (mainly the army) and police force. The regional heads were also assigned to eradicate communism from the village level and the rural sector. The rapid proliferation of local governments since 1998 has increased fragmentation and instability because of local interracial, interethnic, and interreligious conflicts and violence as well as the unstable presidential and multiparty system. The present decentralization and political democracy makes the decision-making process more difficult as the decision makers must accommodate the interests of conflicting political parties and districts. As noted earlier, Aceh and Papua were granted special authority in dealing with local customs, education, religion, and local development policy. In theory, the accountability system should have been improved as it is now basically organized around a triangular relationship between the heads of districts/mayors, the local parliaments, and the community (voters). The heads of the local governments and the members of local parliaments are supposed to be accountable to the community through regular elections. In reality, they are mainly accountable to the parties and not to the public. A potential candidate has to pay the political parties to get nominated in
2
ADBI Working Paper 601 A. Nasution
the local election. The positions of heads of kabupaten and kota are often handed down to their wives and family members. During the past authoritarian military regime, the governors, and mayors and heads of districts were appointed by the central government. Most of the heads of local governments, from governors of provinces to village heads, were active or retired military or police officers. As they were appointed by the central government, the appointed officers faced strong political and fiscal incentives to be accountable to superiors at higher levels of government rather than to local communities. The highly centralized fiscal structure further reduced accountability, adversely affected the rates of return on public sector projects, and constrained development of local institutions. At that time, Golkar was the dominant party, supported by both the military and the civil servants. Under the dual function system, the military was directly involved in politics. Under this system, 10% of the seats in the central and local parliaments were reserved for the military and police, and party candidates received the rest based on their rank on the party list. At present, the technical capabilities of the local bureaucracies, Parliament, and political parties at the regional level are insufficient to meet the rising demand for business planning, managing state funds, and implementing development programs. Prior to 1999, provincial government had a small office, the Provincial Development Board or BAPPEDA (Badan Perencanaan Pembangunan Daerah), responsible for planning how to use the small provincial budget. Local capability was limited to encouraging economic growth and creating jobs by promoting private investment and exports. Decentralization has created new oligarchs at the local levels. Corruption, collusion, and nepotism are now widespread in local governments. Most of the districts did not have the technical staff to implement the newly obtained powers. Because of these institutional weaknesses, the decentralization program has not been very successful at bringing local policies and local public goods closer to the people. With the reforms, the number of provinces increased by seven, from 27 in 1980 to 34 in 2013 (Table 1). Timor-Leste seceded from Indonesia to become an independent country in 1999. As it was not part of the Dutch colony, Timor-Leste was not part of the original Republic of Indonesia. Afraid of communist revolution in Portugal, Indonesia absorbed the region in 1975 with the approval of the Western countries. During the same period, the number of districts (kabupaten) increased from 246 to 413 and the number of municipalities (kota) from 54 to 98. At the same time, the number of subdistricts (kecamatan) increased from 3,349 to 9,982 and the number of villages (desa) rose from 65,372 to 80,414. The top five provinces with the highest populations in 2013 were West Java, East Java, Central Java, North Sumatra, and Banten. All the populous provinces, except North Sumatra, are on Java Island. The top five provinces with the largest areas are Papua and West Papua on Papua Island; and North Kalimantan, East Kalimantan, and Central Kalimantan on Kalimantan Island. The capital city of Jakarta is the smallest province in terms of area, and North Kalimantan has the smallest population.
3

ADBI Working Paper 601 A. Nasution
Table 1: Units of Administrative Government in Indonesia, 1980–2013 Administrative Level 1980 1985 1990 1995 2000 2005 2010 2013
Province (provinsi) 27 27 27 27 26 33 33 34 District (kabupaten) 246 246 241 243 268 349 399 413 Municipality (kota) 54 55 55 62 73 91 98 98 Subdistrict (kecamatan) 3,349 3,539 3,625 3,844 4,049 5,277 6,699 9,982 Village (desa) 65,372 67,534 67,033 65,852 69,050 69,868 77,548 80,414 Sources: Biro Pusat Statistik (Statistical Bureau), Sixty Years of Indonesian Independence (Statistik 60 Tahun Indonesia Merdeka, Statistics to celebrate 60 years of independence of the Republic of Indonesia) and Statistical Yearbook on Indonesia 2014.
The central government retains five functions that affect the nation and devolved 11 obligatory functions to local governments, districts, and municipalities. At present, the power of central government is limited to six broad areas—finance, foreign affairs, defense, security, religion, and state administration and justice. These functions include international policies and implementation of treaties with foreign countries, citizenship and immigration, judicature, external trade, national monetary and fiscal policy, national planning, macroeconomic national development control, currency, banking and insurance, financial balance fund, state administration and state economic institutional systems, human resources development, natural resources utilization, strategic high technology, conservation, and national standardization. To pacify sporadic armed secessionist movements in Aceh and Papua, the central government granted these two regions greater autonomy to deal with local affairs and more revenue sharing in 2000. Aceh was allowed to adopt an Islamic Syariah legal system in parallel to the national one. A Syariah Council was established to ensure that the local governor and Parliament are in line with Islamic teachings. Each province in Papua has a Papua Council to give advice to local governors and the House of Representatives. The two provinces also have their own provincial flag and anthem. In contrast to most of the countries that give autonomy to provincial and state levels of government, Laws No. 22/1999 and No. 25/1999 of Indonesia give autonomy directly to the regencies and municipalities at the subprovincial level. The laws give local governments responsibilities and authority to determine the size and structure of budget expenditure. Compared with local governments, provinces have only limited responsibilities. The provincial governments have double roles as autonomous regional governments and as regional representatives of the national government. They are responsible for supervisory functions and are supposed to intervene in matters that require cross-jurisdictional cooperation. As the regional representatives of the central government, the provincial governments are expected to oversee and closely supervise, making decentralization work more effectively. The present structure of the government administration in Indonesia was designed to unleash centrifugal tendencies and prevent secessionist movements by allowing central government to mediate differences between districts, municipalities, and provinces. During the colonial era, the Dutch deliberately made the provinces weak to make it easier to colonialize the country. Strong centralized government policies were continuously adopted to safeguard the unitary state against secessionist movements and rebellions after independence. The provinces have no hierarchical authority over subordinate governments and perform largely coordinating tasks. In the transition period, provinces may undertake tasks that specific districts may not be in a position to perform except in education, health, and infrastructure.
4
ADBI Working Paper 601 A. Nasution
2.2 Government Finance
At present, local governments are given significant control over expenditure, which reduces the control exerted by the central government. On the other hand, the power of local governments to collect tax and borrow remains very limited. The central government collects major taxes and can borrow from domestic and international financial markets. To keep inflation low, the central government stopped inflationary financing in 1996 to finance the budget deficit through borrowing directly from Bank Indonesia, the central bank. Under the administration of President Suharto, nearly all of government revenue from natural resources; tax and nontax, including land and property taxes; foreign aid; and loans were collected and received by the central government. The central government also tightly controlled both the size and structure of budget expenditure of local governments. Only minor taxes were assigned to the local governments. The rates of these taxes were set by the central government within ranges specified in the law. Major taxes were collected by the Directorate General of Taxation at the Ministry of Finance. Until recently, the central government had collected tax on land and buildings. After the reform, the originating provinces and districts received part of the tax revenue generated from natural resources. Prior to the introduction of Law No. 17/2003, only the central government was allowed to borrow from both domestic and foreign financial markets. As soon as it consolidated its power in 1966, the New Order Government of President Suharto ended inflationary financing to finance the budget deficit. Prior to that, the government had financed its budget deficit through printing money and by selling government bonds in the primary market, directly to Bank Indonesia. The end of monetary financing rapidly reduced inflation, from over 650% in 1966 to slightly below 10% in 1969. This allowed the New Order government to start the first Five Year Plan on 1 April 1969. After that, the strategy for financing the budget deficit was shifted to financing of the central government budget deficit through foreign aid and loans from official sources (Official Development Assistance [ODA]) with long-term maturity and concessionary rates. A consortium of Western creditors, the Inter Government Group on Indonesia/Consultative Group on Indonesia, was established in 1966 to finance the entire budget deficit of President Suharto’s administration for 32 years. Over that long period, both the governments and the parliaments of the donor countries approved their budget allocations to help finance the budget deficits of Indonesia. At that time, Indonesia met the conditionality requirements imposed by its diverse foreign creditors. The ODA financing of the public debt ended after the fall of President Suharto in May 1998 Since then, Indonesia has issued sovereign bonds floated both in domestic and international markets to finance the budget deficits and has recapitalized its financially ailing banks. Law No. 23/1999 on Bank Indonesia continues the policy of prohibiting money printing for financing the budget deficit. At present, local governments neither issue government debt nor use public–private partnership to finance their long-term expenditure, such as for building infrastructure. To solve their short-term liquidity problems, local governments usually borrow from commercial banks, particularly from their own regional development banks (bank pembangunan daerah [BPD]), while waiting for disbursements of transfers from the central government. Every province, and subprovincial government, has a BPD that acts as a cashier for its owners. During the era of President Suharto, central government re-lent some of its foreign aid, and loans were distributed to subnational governments. In 1988, the central
5
ADBI Working Paper 601 A. Nasution
government established a Regional Development Account (RDA) as the main source of domestic loans to finance both local governments and local enterprises. Foreign and domestic loans were used by subnational governments for local investment projects such as village improvement projects, urban drinking water supply projects, and market facilities/small shopping centers. Central government injected sovereign bonds to recapitalize the financially distressed Regional Development Banks during the 1997–98 Asian financial crisis. The authority of the central government under the administration of President Suharto was strengthened as it centralized development planning and distributed development projects and funds to the lower levels of government through a plethora of Presidential Instructions (Instruksi Presiden [Inpres]). International donors, including the World Bank, the Asian Development Bank, and the United States Agency for International Development, funded some of the Inpres programs such as urban and rural development projects, reforestation, and regreening. The Central Planning Agency (Badan Perencanaan dan Pembangunan Nasional [BAPPENAS]) mainly determined the total size and allocation of the general and specific Inpres programs. Aside from setting designs and standards for public services, the line ministries or technical departments also played a role in the cases of specific grants. There were eight Inpres programs—Village Development Grant (Inpres Desa), District Development Grant (Inpres Dati II), Provincial Development Grant (Inpres Dati I), Primary School Grant (Inpres Sekolah Dasar [SD]), Health Grant (Inpres Kesehatan), Regreening/Reforestation Grant (Inpres Penghijauan/Reboisasi), Road Grant for Municipalities and Districts (Inpres Jalan Dati II), and Road Grant for Provinces (Inpres Jalan Provinsi). The Village Development Grant was given as a subsidy for villages, where the District Development Grant was awarded based on population size. The Primary School Grant was used for operational costs, rehabilitation, new construction, additional classrooms, and books. The Health Grant was provided to cover medicine, health centers, health sub-centers, mobile health centers, and to pay for salaries of doctors and paramedics, health centers rehabilitation, and basic medicines as well as clean water. Regreening and reforestation grants were used to cover expenses for regreening, reforestation, and field staff. Road Grants for Dati I and Dati II were awarded based on the length, condition, or density of roads, and the per unit price of their maintenance. The central government also tightly supervises the regions through unified auditing of all public sector finances, including state-owned enterprises and enterprises owned by regional governments, centralized at the Supreme Audit Board (Badan Pemeriksa Keuangan [BPK]). The BPK is the external auditor of the government that annually audits financial reports of the entire public sector from the central to the kabupaten and kota levels. During the authoritarian regime of Orde Baru, the BPK was practically controlled by the government as it controlled its staff, budget, and auditing methods. To assure the transparency and accountability of government finances, Law No. 15/2004 on Auditing Management and Accountability of State Finance restored the independence and autonomy of the BPK. The new law expands the type of audit from financial audit to include compliance and performance audit. To carry out its audit function, the BPK established its representative offices in all capital cities of the provinces. The audit reports of the BPK are presented to the Parliament of central government and to the Parliaments of both provincial and kabupaten and kota governments, and the reports are made available to the general public through the BPK website.
6
ADBI Working Paper 601 A. Nasution
In addition to BPK, the government has three layers of internal control (Badan Pemeriksa Keuangan Pemerintah [BPKP]), and Inspector Generals of the line ministries and provincial governments. Originally, BPKP was under the Ministry of Finance, but it moved to the office of the Vice President and subsequently shifted to The Ministry for Supervision of the State Apparatus (Kementerian Pengawasan Apparatur Negara [Menpan]). Both the external and internal auditors review the sizes of the budget of regional governments, the sources of the revenue, and their expenditure.
2.3 Fiscal Reforms
The allocation of financial resources to each level of government is important for two main reasons. First, it would enable each level of government to exercise constitutionally assigned legislative and executive responsibilities. Second, taxing powers and expenditure are important policy instruments for the three objectives of macroeconomic policy—maintaining economic stability, pursuing high economic growth, and equity. The stabilization function is normally assigned to the central government to maintain internal and external economic stability. The budget constraint of the subnational governments, both at the provincial and kabupaten and kota levels, can be written as:
G – (T + P) = A + ΔD + TRA (1)
where, G is government expenditure; T is own-source revenue or government tax and nontax revenue; P is profit from enterprises owned by local government, privatization, and rent from leasing of assets of the local government; A is revenue from sale of assets, including privatization of state-owned enterprises and rent from leasing of state assets; D is government debt. At present, the subnational governments can only borrow from domestic sources: (i) central government, (ii) other subnational governments, and (iii) domestic banks and non-bank financial institutions. Floating bonds in the domestic market requires permission from the Ministry of Finance. Subnational governments cannot directly receive grants or borrow from overseas; TRA is the central government transfer to local governments, provinces, kabupaten, and kota—also known as Equalization Funds or Transfer (Dana Perimbangan); and Δ is change or difference operator. Decentralization in Indonesia only gives autonomy to the local government to determine the size and structure of their budget expenditure. Taxing power remains with the central government, while local governments are only given the right to collect minor taxes such as taxes on land and building, motor vehicles, hotels, restaurants, entertainment, base metal and mineral extraction, and water. Local governments do not have the power to impose and collect customs and excise, corporate tax, personal income tax, and sales tax. Until recently, collecting land and property taxes had been in the hands of the central authorities even though the country was rapidly urbanizing, with 49.4% of its population in 2011 living in big cities. This means that wealth is increasingly vested and locked up in land and property. The low municipal revenue-to-gross domestic product (GDP) ratio, at 1%, indicates that urban and property taxes are still untapped. Local governments also have no right to modify tax
7
ADBI Working Paper 601 A. Nasution
rates according to their needs. Both assessment and tax rates are uniform for the whole country, and local governments do not have control over the rate structure for their major sources of revenue. Many affluent local governments, particularly in the urban sectors, sell or lease their land to private developers for commercial uses. Some public parks, playgrounds, and sport fields have been converted into shopping malls and hotels, and other commercial buildings. Those in rural areas can raise funds from issuing licenses for opening up virgin forest for small operators of commercial logging, plantation, and mining that could damage the environment. Since the introduction of Law No. 17/2003, local governments have been allowed to borrow from both domestic and foreign markets. Local governments, however, require permission from the Ministry of Finance for issuing local debts. The law adopts the fiscal and debt rules of the European Union by limiting the budget deficits of central and local governments to 3% of their respective annual GDP or regional GDP. The ratio of debt to GDP or regional GDP is set at a maximum of 60%. So far, nearly 40% of central government expenditure has been transferred to the regional governments. The high transfer to subnational governments does not cause fiscal strain in the national public sector or deficits that pose a major threat to macroeconomic stability. At present, the budget deficit of the central government is below the limit of 3% of annual GDP and the ratio of public debt is about 27%, much lower than the maximum limit of 60%. There are three main sources of revenue for local governments:
(i) local governments’ own source of revenue (Pendapatan Asli Daerah), which includes local retribution and small amounts of revenue from profits of public enterprises owned by local governments, and revenue from their privatization and lease;
(ii) tax and revenue sharing from income, corporate tax, and tax on natural resources; and
(iii) transfers from the central government. As noted earlier, the grant from the central government to the local governments has two components. The first component is a minimum allocation known as the General Allocation Fund (Dana Alokasi Umum [DAU]). DAU is a lump sum given to all local governments regardless of their fiscal gap and is mainly intended to cover the salaries of civil servants. The second portion of DAU is a fiscal gap component, which is the difference between own fiscal capacity and fiscal needs. Most local government financing comes from DAU, which accounted for more than 60% of their total revenue. This indicates the high dependency of local government budgets on grants from the central government to finance local service provision. Law No. 22/1999 establishes a floor of 25.5% of domestic revenue (including oil and gas revenue) for transfer to subnational levels through DAU or a general block grant that equalizes regional needs and revenue capacities. Equalization Grant (Dana Bagi Hasil [DBH]) is the second transfer from central to subnational governments. This DBH is the revenue sharing or tax sharing from the general tax revenue and revenue from the exploitation of natural resources, including mining, oil, and gas revenue. This exacerbates horizontal imbalances between provinces and districts. Some areas receive revenue sharing for reforestation. The third transfer is the Special Allocation Funds (Dana Alokasi Khusus [DAK]) provided to finance central government initiatives implemented by the region,
8
ADBI Working Paper 601 A. Nasution
particularly in remote and less developed areas. This is a special purpose grant similar to a capital-financing program. As it is given to all local governments, there is competition between the recipients for effective implementation of the programs. Also, there is neither a bonus scheme nor an incentive scheme to encourage local governments to compete for improvements in the implementation of the programs. At the provincial level, the DAK grants are used for provincial road improvements, development of regional art and culture, and rural extension services. At the district level, the DAK grants are used for basic education and preventive health care, district road development, basic infrastructure, district markets, and small-scale industry development. The block grant can only be used for development purposes, primarily infrastructure. On top of these, the central government provides emergency financing to cover budget deficits of subnational governments due to natural disasters, and to restore their solvability.
2.4 Debt Financing
At present, none of the subnational government in Indonesia has floated local currency bonds to diversify funding and attract the financing required for investment in infrastructure. In general, debt financing is only available for wealthy subnational governments in countries with mature financial markets with good rule of law that provides transparent information, protects property rights, and enforces contracts. In the case of Indonesia, accounting standard or practices, disclosure requirements and corporate governance of the issuers, and bankruptcy law and procedures need to be improved. Debts are to be repaid from the revenue generated by investment in production activities. Indonesia does not have cash-rich domestic institutional investors such as insurance companies, pension and mutual funds, or a shadow banking system to absorb the bonds. Unlike in some European countries and Japan, Indonesia does not have a rich Postal Savings Bank (Cargill and Yoshino 2003). Until now, in terms of assets and branch networks, the commercial banking industry has been the core of the financial system in Indonesia. Financial intermediation primarily takes the form of bank lending rather that the issuing of bonds or equity in the capital market. Much of the credit is collateralized against land. Bank operations are mainly concentrated on traditional deposit taking and lending, and less focused on the capital and bond market. This is because of the long period of financial repression during President Suharto’s administration from 1966 to 1998. The availability of low-cost and low-risk credit from state-owned banks reduces the needs of the business sector to float bonds or issue equity shares.
2.5 State-owned Enterprises
Indonesia has a mixed economy. In addition to the provision of public goods, the public sector at all levels has state-owned enterprises (SOEs) producing private goods that operate in many sectors of the economy, including oil and mining; plantations; electricity; sea, air, and land transport; hotels; and shops. The government also has land and productive forest. Some of the SOEs originated from the former Dutch companies nationalized during the conflict over the present Papua in the mid-1950s. Some former British companies were nationalized during the military confrontation when Malaysia and Singapore gained independence from England. Companies owned by communist suspects and those that were regarded as being close to President Sukarno and PKI (Partai Komunis Indonesia) or the Indonesian Communist Party were
9
ADBI Working Paper 601 A. Nasution
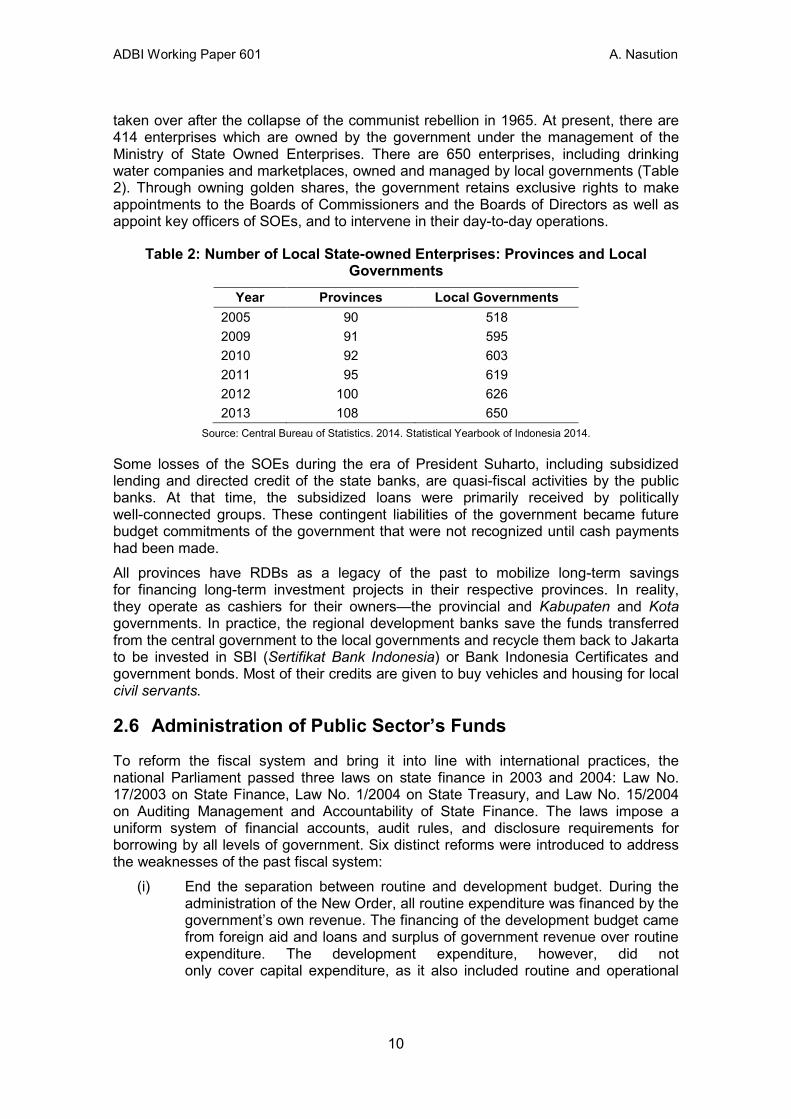
taken over after the collapse of the communist rebellion in 1965. At present, there are 414 enterprises which are owned by the government under the management of the Ministry of State Owned Enterprises. There are 650 enterprises, including drinking water companies and marketplaces, owned and managed by local governments (Table 2). Through owning golden shares, the government retains exclusive rights to make appointments to the Boards of Commissioners and the Boards of Directors as well as appoint key officers of SOEs, and to intervene in their day-to-day operations.
Table 2: Number of Local State-owned Enterprises: Provinces and Local Governments
Year Provinces Local Governments 2005 90 518 2009 91 595 2010 92 603 2011 95 619 2012 100 626 2013 108 650
Source: Central Bureau of Statistics. 2014. Statistical Yearbook of Indonesia 2014.
Some losses of the SOEs during the era of President Suharto, including subsidized lending and directed credit of the state banks, are quasi-fiscal activities by the public banks. At that time, the subsidized loans were primarily received by politically well-connected groups. These contingent liabilities of the government became future budget commitments of the government that were not recognized until cash payments had been made. All provinces have RDBs as a legacy of the past to mobilize long-term savings for financing long-term investment projects in their respective provinces. In reality, they operate as cashiers for their owners—the provincial and Kabupaten and Kota governments. In practice, the regional development banks save the funds transferred from the central government to the local governments and recycle them back to Jakarta to be invested in SBI (Sertifikat Bank Indonesia) or Bank Indonesia Certificates and government bonds. Most of their credits are given to buy vehicles and housing for local civil servants.
2.6 Administration of Public Sector’s Funds
To reform the fiscal system and bring it into line with international practices, the national Parliament passed three laws on state finance in 2003 and 2004: Law No. 17/2003 on State Finance, Law No. 1/2004 on State Treasury, and Law No. 15/2004 on Auditing Management and Accountability of State Finance. The laws impose a uniform system of financial accounts, audit rules, and disclosure requirements for borrowing by all levels of government. Six distinct reforms were introduced to address the weaknesses of the past fiscal system:
(i) End the separation between routine and development budget. During the administration of the New Order, all routine expenditure was financed by the government’s own revenue. The financing of the development budget came from foreign aid and loans and surplus of government revenue over routine expenditure. The development expenditure, however, did not only cover capital expenditure, as it also included routine and operational
10
ADBI Working Paper 601 A. Nasution
expenditure such as travel expenses and honorarium received by those directly involved in development activities
(ii) Replace the antiquated cash-based, single-entry bookkeeping of the Indonesian Treasury Law (Indische Comtabilitetwet), Statute Book No 443 of 1925, inherited from the colonial past with a double entry, accrual accounting system, and performance-related multiyear budgets.
(iii) Apply an integrated and computerized accounting system. (iv) Decentralize the accounting implementation in a hierarchical manner to
each accounting unit both at the central and regional levels. (v) Gradually adopt a single treasury account. In the past, accounts were
divided into many accounts, including the personal accounts of government officials.
(vi) Use a tight time framework for the accountability report. The new system is therefore required to establish standard budgeting, auditing, and reporting procedures for all local budgets; and mechanisms to monitor the sharing of natural resources revenue and transfers. The new system demands the establishment of an independent treasury and payment systems. The old system, by contrast, did not need an independent treasury as most financing was done through special purpose grants administered by centrally appointed officials. As mentioned earlier, in addition to the financial audit, the BPK will also carry out a performance and compliance audit.
As noted above, the new audit law expanded the traditional financial audit to include a performance and compliance audit. The financial audit includes financial statements, accounting, receipts, and related financial matters. The objective of this audit is to assess the internal control system to ensure the quality of accounting information and financial reporting. The compliance audit evaluates how well the organization complies with and adheres to relevant policies, laws, directions, plans, and procedures. The objective of a performance audit is to evaluate and review the effectiveness, efficiency, and economic results of the government activities (Baltaci and Yilmaz 2007). For various reasons, the shift toward the new fiscal system occurred very slowly. The first reason is because the standardized types, format, and structure of the government finance and state financial reports are still in the making. Second, measurable standard performance indicators for government applicable to the whole country need to be set up by the central government. With this data, the central government is able to monitor the financial transactions of subnational governments. Third, it takes time to adopt the single treasury account. Fourth, implementation of a double-entry accounting, accrual, and performance-based system and a multiyear budget is very slow. This is because the single accounting system for all local government and public entities is not yet available. Moreover, these new changes demand highly educated and well-trained accounting personnel, which are not yet available at government agencies and public entities. Fifth, non-budgetary funds and quasi-fiscal activities have not yet been incorporated into the state budget. Many government agencies have their own business entities and extra budgetary funds, which they inherited from the past. Sixth, the roles and responsibilities of state institutions have not yet been clarified at all levels. Seventh, the legal status of many of the state assets is not clear yet. Until now, there have been no comprehensive centralized accounting records of the government’s physical assets such as land holdings, infrastructure, buildings, plants and equipment, and capital stocks and stores.
11
ADBI Working Paper 601 A. Nasution
3. FINANCING SUBNATIONAL GOVERNMENTS The districts and municipalities are given more financial resources to carry out their greater responsibilities. This is because the main thrust of the decentralization program has been to devolve expenditure responsibilities. The subnational governments have limited freedom to set tax rates such as land and building tax and motor vehicle tax and their transfer tax. Borrowing powers of subnational governments are strictly controlled. Central government controls wage and salary rates for local government employees.
3.1 Revenues of Local Governments
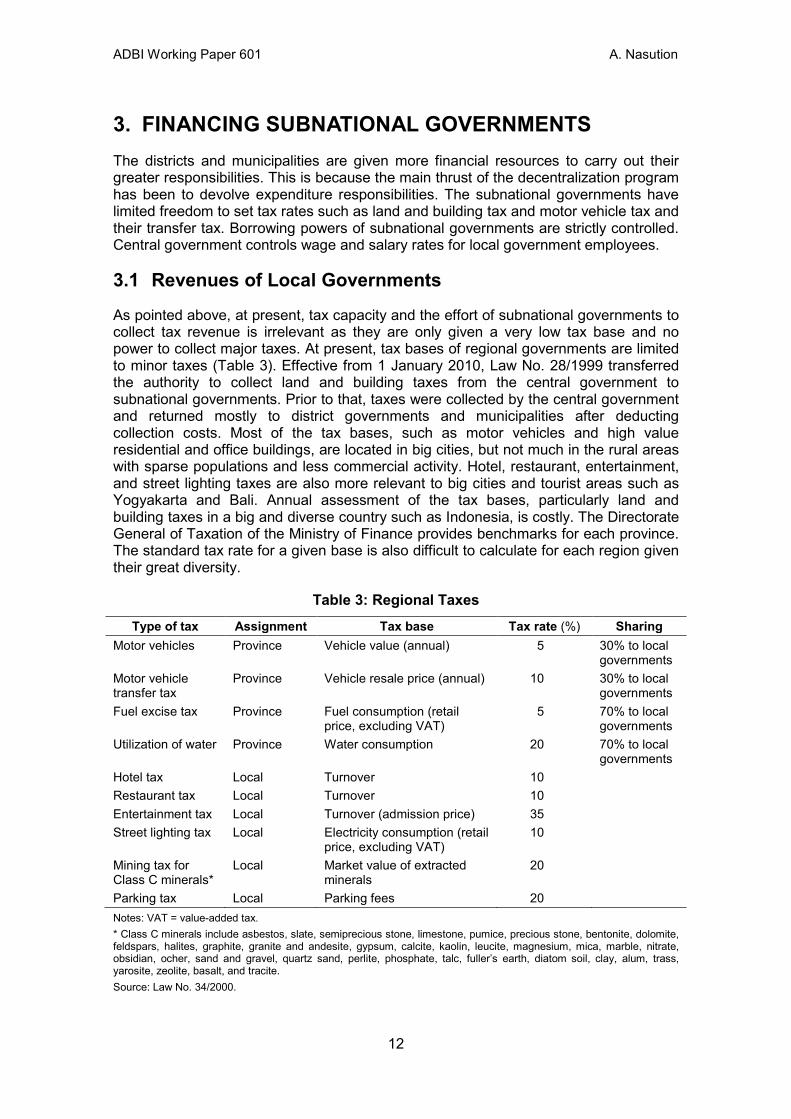
As pointed above, at present, tax capacity and the effort of subnational governments to collect tax revenue is irrelevant as they are only given a very low tax base and no power to collect major taxes. At present, tax bases of regional governments are limited to minor taxes (Table 3). Effective from 1 January 2010, Law No. 28/1999 transferred the authority to collect land and building taxes from the central government to subnational governments. Prior to that, taxes were collected by the central government and returned mostly to district governments and municipalities after deducting collection costs. Most of the tax bases, such as motor vehicles and high value residential and office buildings, are located in big cities, but not much in the rural areas with sparse populations and less commercial activity. Hotel, restaurant, entertainment, and street lighting taxes are also more relevant to big cities and tourist areas such as Yogyakarta and Bali. Annual assessment of the tax bases, particularly land and building taxes in a big and diverse country such as Indonesia, is costly. The Directorate General of Taxation of the Ministry of Finance provides benchmarks for each province. The standard tax rate for a given base is also difficult to calculate for each region given their great diversity.
Table 3: Regional Taxes Type of tax Assignment Tax base Tax rate (%) Sharing
Motor vehicles Province Vehicle value (annual) 5 30% to local governments
Motor vehicle transfer tax
Province Vehicle resale price (annual) 10 30% to local governments
Fuel excise tax Province Fuel consumption (retail price, excluding VAT)
5 70% to local governments
Utilization of water Province Water consumption 20 70% to local governments
Hotel tax Local Turnover 10 Restaurant tax Local Turnover 10 Entertainment tax Local Turnover (admission price) 35 Street lighting tax Local Electricity consumption (retail
price, excluding VAT) 10
Mining tax for Class C minerals*
Local Market value of extracted minerals
20
Parking tax Local Parking fees 20 Notes: VAT = value-added tax. * Class C minerals include asbestos, slate, semiprecious stone, limestone, pumice, precious stone, bentonite, dolomite, feldspars, halites, graphite, granite and andesite, gypsum, calcite, kaolin, leucite, magnesium, mica, marble, nitrate, obsidian, ocher, sand and gravel, quartz sand, perlite, phosphate, talc, fuller’s earth, diatom soil, clay, alum, trass, yarosite, zeolite, basalt, and tracite. Source: Law No. 34/2000.
12

ADBI Working Paper 601 A. Nasution
The motor vehicle tax is an annual tax on the value of the vehicle. Motor vehicle transfer tax, the largest source of provincial tax revenue in major provinces such as Jakarta and other big cities on Java, Medan, and Makassar, is levied at the time of resale of a motor vehicle. At present, the tax rate is 1.5%. For both taxes, the determination of the value is set periodically by the Ministry of Home Affairs (MOHA) and made available to provincial governments who then collect the tax. The provincial government collects fuel tax at 5%, and the revenue is shared with district governments. Law No. 34/2000 gives rights to local governments to impose local taxes as long as those taxes do not impose high costs on the economy or restrict mobility of factors of production as well as goods and services across regions and constrain international trade. Specifically, the new taxes should meet the following eight criteria: (i) they are taxes and not user charges, (ii) the tax base is located locally in the region and is immobile, (iii) the taxes do not conflict with public interest, (iv) the tax base is not subject to provincial and national taxation, (v) the revenue potential is adequate, (vi) the taxes do not exert economic distortions, (vii) equity concerns are taken into account, and (viii) environmental sustainability is taken into account. The local governments also raise revenue from license fees from small operators of mines and plantations operating in their jurisdictions. The laws on mining and plantation give the districts power to issue such licenses. Licenses for big operators are issued by the central government, and the subnational governments receive royalties from them. Fiscal Balance Law No. 25/1999 introduced special revenue sharing for oil and gas. This law creates further imbalances between regions due to concentration of the production of oil and gas in a few producing provinces and kabupaten. The main oil-producing provinces are Riau, East Kalimantan, Ambon, West Papua, Aceh, and East Java. The law assigns 15% of nontax revenue from onshore oil to local governments, 3% of which goes to the producing province, 6% to the producing district, and 6% is to be shared by nonproducing districts in the producing region. For onshore gas, 30% of the nontax revenue is to be shared, 6% goes to the producing province, 12% to the producing district, and 12% to nonproducing districts in the producing province.1 This formulation is quite opaque, further complicated by the inclusion of offshore oil within 12 miles. The nonproducing provinces may also need to be compensated by an “equalization” transfer system that reduces the interregional disparities created by the oil- and gas-sharing formula. The revenue-sharing arrangement has become more complicated with the volatility in international prices of oil and gas that rapidly changed the realized revenue or the tax base for oil sharing. To redress the grievances of the resource-rich regions, Law No. 33/2004 gives some portions of the personal income taxes and taxes on natural resources to the originating provinces and districts (Table 4). The DBH (Dana Bagi Hasil) or revenue or tax sharing from the general tax resources and revenue from extraction of natural endowments include mining, oil and gas, forestry, fishery, and geothermal. To end the secessionist armed rebellions in the provinces of Aceh and Papua, the government gave them more political autonomy, special local treatment, special intergovernmental transfer treatment, and higher rates of revenue sharing from natural resources (Table 5). They are allowed to establish local political parties. Aceh has been allowed to adopt Islamic Syariah law, a council of Moslem scholars, and Islamic courts. Papua receives special additional allocations of funds amounting to 2% of DAU for producing public services.
1 The Law does not specify the method for distributing the 6% oil revenue and 12% gas revenue to nonproducing districts.
13

ADBI Working Paper 601 A. Nasution
Table 4: Arrangements for Tax and Revenue Sharing
Revenue Source Central
Government
Originating Provincial
Government
Originating Local
Government
All Local Goverments
in Originating
Province
All Local Goverments (equal share)
Personal income tax 80.0 8.0 12.0 n.a. n.a. Property tax 9.0 16.2 64.8 n.a. 10.0 Property transfer tax n.a. 16.0 64.0 n.a. 20.0 Mining land rent 20.0 16.0 64.0 n.a. n.a. Mining royalty 20.0 16.0 32.0 32.0 n.a. Forestry license 20.0 16.0 64.0 n.a. n.a. Forestry royalty 20.0 16.0 32.0 32.0 n.a. Fishery royalty 20.0 n.a. n.a. n.a. 80.0 Geothermal mining 20.0 16.0 32.0 32.0 n.a. Oil Base rate 84.5 3.0 6.0 6.0 n.a. Conditional rate (education)
0.1 0.2 0.2 n.a.
Natural gas Base rate 69.5 6.0 12.0 12.0 n.a. Conditional rate (education)
n.a. 0.1 0.2 0.2 n.a.
n.a. = not applicable. Sources: World Bank 2003; article 6, Law No. 22/1999; article 31, Law No. 17/2000; and Law No. 33/2004.
Table 5: The Proportion of Revenue Sharing for Aceh and Papua
Revenue Type Special Autonomy Laws (%)
Aceh Papua Oil 70 70 Gas 70 70 Land rent 80 80 Royalty 80 80 Fishery 80 80 Forestry Right to Operate Levy (IHPH) 80 80 Forestry Resources Commission (PSDH) 80 80 Reforestation Fund 40 40 Notes: IHPH – Iuran Hak Pengusahaan Hutan PSDH – Provisi Sumber Daya Hutan Source: Directorate General for Fiscal Balance, Ministry of Finance.
14
ADBI Working Paper 601 A. Nasution
3.2 Expenditure Needs of Local Governments
The expenditure needs of local governments are estimated by using the most important needs of a regional government. Each regional government has five main categories of expenditure needs: (i) education; (ii) health and social welfare; (iii) government administration; (iv) infrastructure and public works; and (v) economic development, including transport, agriculture, industry and trade, capital investment, land, cooperatives, labor force, and environment. The expenditure needs for education are estimated by the number of school-age children and average years of education. At present, it is compulsory for children to finish 9 years of schooling. Expenditure for health and social welfare is calculated by using information on population numbers, the proportion of the old-age population, average life expectancy, and infant mortality. The government provides free medical services and contraception for its birth control program to control population growth. The needs of the general government administration are estimated from population numbers and the percentage of urban population. The expenses for infrastructure are estimated using the length of local roads, the share of poor roads in the total length of local roads, and population density. The expenditure needs for economic development, including for agriculture, trade, industry, and telecommunications are calculated based on population numbers, per capita GDP, and a poverty head count ratio. Under the centralized system of the past, the minimum standards for the public services were set by the central government. Local government workers, such as teachers, medical workers, workers building and maintaining infrastructure, and agriculture extension services workers, were assigned by the central government to the region. In a large and diverse country like Indonesia, the cost of producing public services greatly varies from one region to another. Because of the transfer of civil servants to the jurisdiction of local governments, local budgets are heavily skewed toward operating expenditure, particularly to cover personnel expenses including salaries of teachers, and personnel in health care and public works. This reduces the budget for maintenance and rehabilitation of infrastructure, school buildings, and medical equipment. Under the local autonomy program, public services must be provided by staff employed by local governments. It is not easy to transfer the civil servants of the central government to lower-level administrations. There are many reasons for this, including the reluctance of civil servants to move to other districts with different ethnic backgrounds, with which they have few ties, and with fewer amenities. Because of these problems, the central government continues to finance all civil servants’ expenditure even if they work for local governments. The quality of spending is limited by the inadequacy of qualified teachers, health workers, and technicians to produce the public goods and financial managers to manage the state funds.
3.3 Horizontal Imbalances of Regional Government
As noted above, there are vast differences in the geographic and socioeconomic characteristics of local governments. About two-thirds of the population of Indonesia lives on Java, one of the most populous islands on earth. Provinces with big populations (West Java, East Java, Central Java, and Banten) are located on Java. Java was strongly controlled by the Dutch and British colonialists. They built vast transportation networks for military and trading purposes. They developed modern commercial agricultural plantations and mining on Java. Sumatra has the second- biggest population, and most modern commercial plantations are located in North
15
ADBI Working Paper 601 A. Nasution
Sumatra. Oil and gas are extracted in Aceh, Riau, and South Sumatra. Tin bauxite mines are developed in Bangka Belitung along the strategic Malacca Straits. Makassar, at the southern tip of Sulawesi, is strategically located to control the spice trade from the Eastern part of Indonesia and strategic Sulawesi Straits to East Asia. West Papua is the biggest island in Indonesia, followed by Kalimantan, but they are sparsely populated and relatively less developed in terms of transportation. These two islands are rich in natural resources: minerals and metals, as well as forest products. Indonesia also has widely diverging levels of Regional Gross Development Product (RGDP), and diverse economic structure, natural resource endowment, and stages of industrialization. The regions have diverse capacities to raise revenues from their own sources and revenue-sharing arrangements. The regional GDP per capita of the richest oil- and gas-producing region among the districts is $334,759 (in Bontang), which is more than 16,230 times higher than that of the poorest in district Nusa Tenggara Timur ($208) with poor natural resources. The provinces on Java are the centers for the manufacturing industries as well as labor-intensive handicrafts and small and medium-sized enterprises with very low marginal productivity of labor. Java and South Sulawesi are rice-producing areas. Papua, Kalimantan, Sulawesi, and Sumatra are the centers of mining, forestry, and agricultural industries dominated by large companies and subject to cyclical shocks. PT Freeport Indonesia, which has mined copper and gold in the rugged Estberg area since 1966, contributed over 50% of Papua’s economy and 90% of its total exports. Over 42% of West Papua’s GDP is contributed by the LPG project in Bintuni area operated by BP Indonesia. East Kalimantan’s economy is dependent on the LNG Project in Bontang, coal mining, and forestry. Meanwhile, Sumatra, Java and Kalimantan are home to modern commercial plantations. The benefits of mining and plantation businesses for local communities in terms of value-added are, however, relatively small as they are either capital-intensive or knowledge-based industries that directly export unprocessed raw materials. Skilled technical workers are imported from either Java or overseas. There are also large disparities in living conditions. Indonesia’s economy, particularly on Java, Madura, and Bali Island, is a labor surplus economy with very low marginal productivity because of low levels of education and minimal skills. The poverty rate ranges from about 7% in the industrial district of Bekasi, close to Jakarta the capital city, to more than 40% in West Sumba in West Nusa Tenggara. The illiteracy rate in Sampang, Madura Island in East Java is more than 21% though it has fallen to 9% for Indonesia as a whole. Being devout Moslems, the Maduranese are well versed in the Arabic alphabet. Secondary school gross enrollment in the poorest districts is only nine students as compared with 125 students in richer areas. Life expectancy in the poorest district is 57.5 years, which is far below the national average of 66.3 years, and 73.7 years for the richest areas. About 98% of people in Tanjung Jabung, Jambi, have access to primary health care, but only about 21% do in Sintang, West Kalimantan. In 2013, the highest unemployment rate was registered in Aceh (10.30%), followed by Banten (9.90%), the Moluccas (9.75%), West Java (9.22%), and Jakarta (9.02%). The lowest unemployment rates during that year were registered in Bali (1.79%), West Sulawesi (2.33%), and Yogyakarta (3.34%). The disparity in public service also indicates disparity in both the cost of tax collection and the cost of public sector service delivery. Some cities and districts in big provinces have large jurisdictions but sparse populations, such as the City of Sabang at the northern tip of Sumatra with a population of almost 4 million. For this reason, it cannot meet the threshold for economies of scale to deliver services efficiently. But some local
16
ADBI Working Paper 601 A. Nasution
governments are too large in relation to their populations, such as the cities of Jakarta, Bandung, and Surabaya.
3.4 Equalization Transfer
In principle, the equalization transfer (Dana Perimbangan [TRA]) is made available to supplement own revenue and to finance local service provision (as defined by the central government) that does not affect neighboring jurisdictions. At present, there are three grant arrangements for subnational governments in Indonesia that replace the Inpres programs of the past: General Revenue Grants (Dana Alokasi Umum [DAU]), Equalization Grants (Dana Bagi Hasil [DBH]), and Special Purpose Grants (Dana Alokasi Khusus [DAK]).The general grants should be made available to cover the recurrent needs of the subnational governments and their working capital requirements. At present, there are no transfers to address regional inequalities or economic growth in less developed regions. Eckardt and Shah (2006) identified five main reasons for grants from the central government to lower levels of government:
(i) correct for inefficiencies arising from inter-jurisdictional spillovers;2
(ii) address fiscal gaps or imbalances arising from a mismatch between the revenue and expenditure of local governments;
(iii) ensure common minimum service standards for all regions; (iv) narrow the difference in tax base as well as the cost of delivery of public
service between regions; and (v) stabilize the economy by increasing grants in periods of slack economic
activity and contain expenditure during upswings in the economic cycle. For a number of reasons, the real allocation of grants can deviate from the Equalization Transfer formula. The reasons include political considerations and lobbying by local government associations. The provinces of Aceh and Papua are given special treatment because of the combination of strong secessionist movements and their backwardness, and higher costs of service delivery. In addition, the Transfer Equalization formula has not been fully implemented partly because the central government continues to finance all civil service expenditures that should be totally transferred to the subnational governments. The distribution of teachers, health workers, and public sector workers, who build and maintain infrastructure and other publicly produced goods, is uneven between regions. The production cost of public services also varies greatly between regions.
3.5 Budget Realization
Table 6 shows the realization of budgets of provincial and local governments between 2001 and 2013. In 2013, 74.44% of the budget of local governments belonged to districts and municipalities and only 25.56% was owned by the provinces. Transfers from the central government are the main source of revenue for provinces as well as districts and municipalities. Extraction of financial transfers from the central government is one of the motives for the creation of new government units by provinces, districts, municipalities, sub-districts, or villages. In 2001, transfers from the central government
2 Spillovers occur because benefits of locally provided goods or services (such as pollution control) spill beyond the local jurisdiction to benefit those not contributing to the costs.
17

ADBI Working Paper 601 A. Nasution
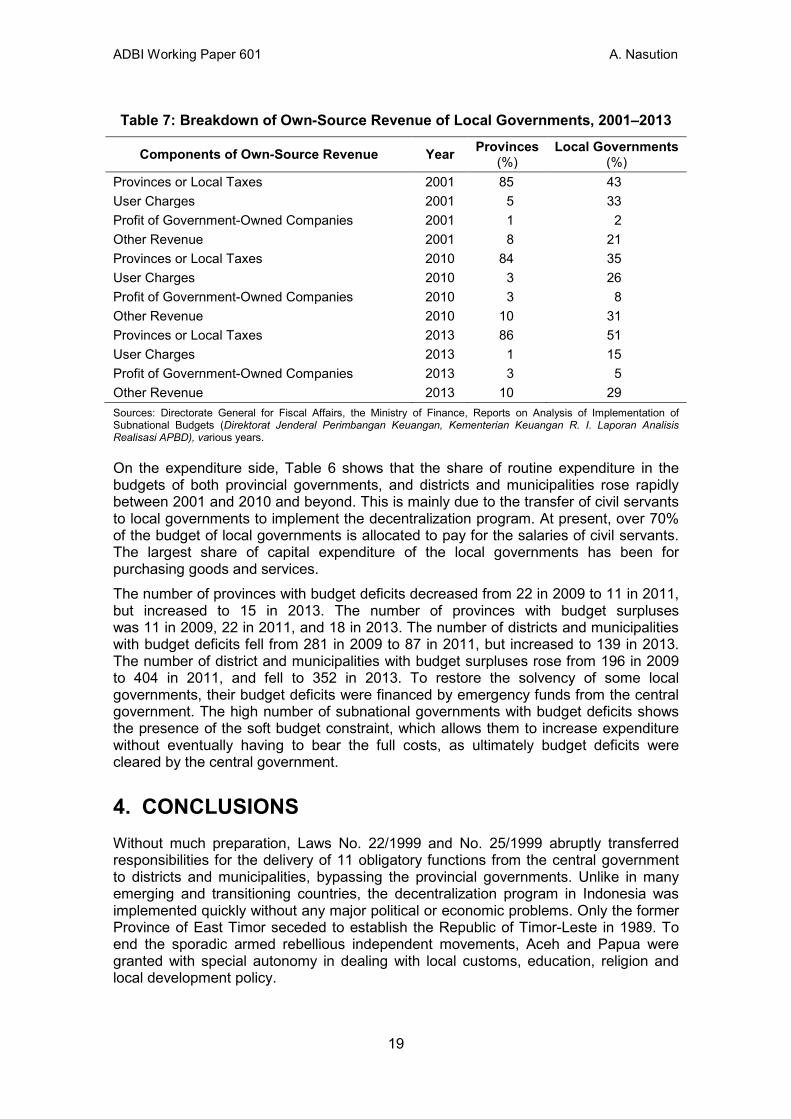
accounted for 57% of revenue of provincial governments and 90% of revenue of districts and municipalities. The share of own revenue in total revenue for provincial governments, as well as districts and municipalities, rose significantly after the introduction of tax and revenue sharing in 2004. Table 7 shows the breakdown of own source of revenue for provinces and districts and municipalities. User charges, profits of government-owned enterprises, and other revenue are more relevant for districts and municipalities than for provinces.
Table 6: Sources of Revenue and Expenditure of Provincial Government and District/Municipality, 2001–2013
Year
Provinces (%)
Local Governments
(%) % of Total Revenue
Own-Source Revenue- 2001 39 7 Intergovernmental Transfer (Dana Perimbangan) 2001 57 90 Adjustment and Special Autonomy Fund 2001 1 0 Other Revenue 2001 3 3 % of Total Expenditure
Routine Expenditure 2001 64 69 Capital Expenditure 2001 36 31 % of Total Revenue
Own-Source Revenue 2010 49 7 Intergovernmental Transfer (Dana Perimbangan) 2010 42 77 Adjustment and Special Autonomy Fund 2010 9 7 Other Revenue 2010 1 8 % of Total Expenditure
Routine Expenditure 2010 73 79 Capital Expenditure 2010 27 21 % of Total Revenue
Own-Source Revenue 2013 50 11 Intergovernmental Transfer (Dana Perimbangan) 2013 31 72 Adjustment and Special Autonomy Fund 2013 18 9 Other Revenue 2013 1 8 % of Total Expenditure
Routine Expenditure 2013 79 72 Capital Expenditure 2013 20 28 Sources: Directorate General for Fiscal Balances, The Ministry of Finance. Reports on Subnational Budgets (Laporan Analisis Realisasi APBD), various issues.
18
ADBI Working Paper 601 A. Nasution
Table 7: Breakdown of Own-Source Revenue of Local Governments, 2001–2013
Components of Own-Source Revenue Year Provinces (%)
Local Governments (%)
Provinces or Local Taxes 2001 85 43 User Charges 2001 5 33 Profit of Government-Owned Companies 2001 1 2 Other Revenue 2001 8 21 Provinces or Local Taxes 2010 84 35 User Charges 2010 3 26 Profit of Government-Owned Companies 2010 3 8 Other Revenue 2010 10 31 Provinces or Local Taxes 2013 86 51 User Charges 2013 1 15 Profit of Government-Owned Companies 2013 3 5 Other Revenue 2013 10 29 Sources: Directorate General for Fiscal Affairs, the Ministry of Finance, Reports on Analysis of Implementation of Subnational Budgets (Direktorat Jenderal Perimbangan Keuangan, Kementerian Keuangan R. I. Laporan Analisis Realisasi APBD), various years.
On the expenditure side, Table 6 shows that the share of routine expenditure in the budgets of both provincial governments, and districts and municipalities rose rapidly between 2001 and 2010 and beyond. This is mainly due to the transfer of civil servants to local governments to implement the decentralization program. At present, over 70% of the budget of local governments is allocated to pay for the salaries of civil servants. The largest share of capital expenditure of the local governments has been for purchasing goods and services. The number of provinces with budget deficits decreased from 22 in 2009 to 11 in 2011, but increased to 15 in 2013. The number of provinces with budget surpluses was 11 in 2009, 22 in 2011, and 18 in 2013. The number of districts and municipalities with budget deficits fell from 281 in 2009 to 87 in 2011, but increased to 139 in 2013. The number of district and municipalities with budget surpluses rose from 196 in 2009 to 404 in 2011, and fell to 352 in 2013. To restore the solvency of some local governments, their budget deficits were financed by emergency funds from the central government. The high number of subnational governments with budget deficits shows the presence of the soft budget constraint, which allows them to increase expenditure without eventually having to bear the full costs, as ultimately budget deficits were cleared by the central government.
4. CONCLUSIONS Without much preparation, Laws No. 22/1999 and No. 25/1999 abruptly transferred responsibilities for the delivery of 11 obligatory functions from the central government to districts and municipalities, bypassing the provincial governments. Unlike in many emerging and transitioning countries, the decentralization program in Indonesia was implemented quickly without any major political or economic problems. Only the former Province of East Timor seceded to establish the Republic of Timor-Leste in 1989. To end the sporadic armed rebellious independent movements, Aceh and Papua were granted with special autonomy in dealing with local customs, education, religion and local development policy.
19

ADBI Working Paper 601 A. Nasution
The rapid rise in the expenditure of subnational governments that came with decentralization did not carry serious fiscal risks at the national level nor a breakdown in public sector delivery. Neither has the growth of subnational spending on public services and capital investments (in health, education, basic infrastructure, and other obligatory functions) so far posed a major threat to macroeconomic stability. At present, no subnational government has floated bonds to diversify their funding needs or to attract the financing required for investment in infrastructure. However, after over 15 years of reform, institutions have yet to be built to allow both the provincial and sub-provincial governments to implement the newly acquired responsibilities. Subnational governments have different capabilities to deliver public services in education, health care, infrastructure, and other areas. They also have different capabilities in managing their finances and raising revenue, and different tax bases. The central government can supervise the subnational governments through setting national standards for public services applicable throughout the country. The central government can also supervise the subnational governments through a unified system of financial accounts, audit rules, disclosure requirements, and financial auditing. The combination of the absence of unified public service standards and the lack of knowledge in the new administration of public funds has led to corruption and delays in the disbursement of government budget expenditure. The political system needs to be improved to make the elected governors, mayors, and heads of districts accountable to the community through regular elections, and not to their political parties. The central government remains substantially in control of local governments through controlling their budgets, through auditing local governments (compliance, financial, and performance audit), and rotation of civil servants and senior officials between provinces and sub-provinces. Taxing capacities and expenditure decisions of local governments also remain very weak. At present, none of the subnational governments has floated local currency bonds to diversify funding and attract the financing required for long-term investment in infrastructure. The responsibility for taxing and expenditure decisions should lie with the authority that is in the best position to evaluate the alternatives available. Subnational governments should have the information that will enable them to balance needs as reflected in expenditure proposals against the sacrifices that must be made to satisfy those needs. The capabilities of local governments also need to be upgraded in the planning of economic development to promote economic growth and to address regional inequalities by promoting private sector investment and exports. The reform has given larger financial resources to subnational governments and greater freedom on budget expenditure. So far, over 40% of government expenditure of the central government has been transferred to subnational governments. However, the basic issues in fiscal federalism have not been answered. Who should do what to make expenditure assignment more specific? The revenue assignment should answer the question of who should levy tax. How to resolve vertical imbalance to resolve the imbalance between revenue and expenditure of districts and municipalities? How to address the horizontal imbalance or equalization due to the difference in needs as well as the capacity of districts and municipalities to raise revenue and produce the same standards of service? How to maintain fiscal discipline to avoid overspending by the subnational governments? How to regulate internal and external borrowing of subnational governments for financing their budgets?
20
ADBI Working Paper 601 A. Nasution
REFERENCES Adrison, V., J. Martinez–Vazquez, and E. Nurhalim. 2012. The Reform of Expenditure
Assignment at the Local Level in Indonesia. Paper presented at the DSF Closing: International Conference—Alternative Visions for Decentralization in Indonesia. 12 March.
Ahmad, E., J. Ma, B. Searle, and S. Piperno. 2002. Intergovernmental Grants Systems and Management: Applications of a General Framework to Indonesia. IMF Working Paper. WP/02/128. August. Washington, DC: International Monetary Fund.
Ahmad, E., and A. Mansoor. 2002. Indonesia: Managing Decentralization. IMF Working Paper. WP/02/136. Washington, DC: International Monetary Fund.
Asosiasi Pemerintah Kabupaten Seluruh Indonesia (APKASI) [Association of District Governments of Indonesia). 2004. Undang-Undang No. 32 Tahun 2004 Tentang Pemerintah Daerah [Law No. 32/2004 on Local Governments]. December.
_____. 2004. Undang-Undang No. 33 Tahun 2004 Tentang Perimbangan Keuangan Antara Pemerintah Pusat dan Pemerintah Daerah [Law No. 33/2004 on Fiscal Relations between Central and Subnational Governments]. December.
Bahl, R. 1999. Implementation Rules for Fiscal Decentralization. Paper presented at the International Seminar on Land Policy and Economic Development, Land Reform Training Institute, 17 November 1998. Atlanta, GA: International Studies Program, School of Policy Studies, Georgia University.
Baltaci, M., and S. Yilmaz. 2007. Internal Control and Audit at Local Levels. In Local Public Management: Public Sector Governance and Accountability Series. Edited by A. Shah. Washington, DC: The World Bank.
Bardhan, P., and D. Mookherjee. 1999. Relative Capture of Local and Central Governments: An Essay in the Political Economy of Decentralization. IED Discussion Paper Series. 97. Boston, MA: Institute for Economic Development (IED), Boston University.
Bird, R. M., and F. Vaillancourt, eds. 2006. Perspectives on Fiscal Federalism. Washington, DC: World Bank Institute.
Bulir, A., and T. Lane. 2002. Aid and Fiscal Management. IMF Working Paper. WP/02/112. Washington, DC: International Monetary Fund.
Cargill, T. F., and N. Yoshino. 2003. Postal Savings & Fiscal Investment in Japan. The PPS and the FILP. Oxford, UK: Oxford University Press.
Eckardt, S. and A. Shah. 2006. Local Government Organization and Finance in Indonesia. In Local Governance in Developing Countries. Public Sector Governance and Accountability Series, edited by A. Shah. Washington, D.C.: the World Bank.
Government Regulation No. 55/2005 on Equalization Transfer (Peraturan Pemerintah R.I. No. 55 Tahun 2005 Tentang Dana Perimbangan.) 9 December 2005.
Government Regulation No. 38/2007 on Division of Public Sector Responsibilities between Central Government, Provincial Governments and District Governments and Municipalities (Peraturan Pemerintah R.I No. 38 Tahun 2007
21
ADBI Working Paper 601 A. Nasution
tentang Pembagian Urusan Pemerintahan Antara Pemerintah, Pemerintahan Daerah Provinsi, Dan Pemerintahan Daerah Kabupaten/Kota). 9 July 2007.
Hofman, B., Kadjatmiko, K. Kaiser, and B. S. Sjahrir. 2006. Evaluating Fiscal Equalization in Indonesia. World Bank Policy Research Paper. No. 3911. Washington, DC: The World Bank.
Kementerian Keuangan R.I. [Ministry of Finance of the Republic of Indonesia]. 2012 Tinjauan Tahunan Keuangan Daerah dan Kinerja Pelayanan Publik [Local Government Finance and Public Service Performance Annual Review].
Kementerian Keuangan R.I. [Ministry of Finance of the Republic of Indonesia]. Nota Keuangan Beserta Rancangan Anggaran Pendapatan Dan Belanja Negara Tahun Anggaran 2016. Buku II [Budget Statement and Draft State Budget Fiscal Year 2016. Book II].
Law No. 22/1999. 1999. On Subnational Government. Law No. 24/1999. 1999. On Fiscal Balance Between Central and Local Governments. Law No. 32/2004. 2004. On Subnational Government. Law No. 33/2004. 2004. On Fiscal Balance between Central and Local Governments. Mahi, R., and R. M. Qibthiyyah. 2015. Intergovernmental Transfers: Effectiveness and
Response on Government. In Macroeconomic Policies in Indonesia: Indonesia Economy since the Asian Financial Crisis of 1997, edited by A. Nasution. Oxford, United Kingdom and New York, NY: Routledge.
Mathews, R. L., ed. 1974. Fiscal Equalisation in a Federal System. Research Monograph. No. 4. Canberra: Center for Research on Federal Financial Relations, The Australian National University.
Miller, G. J., and W. Bartley Hildreth. 2007. Local Debt Management. In Local Public Management: Public Sector Governance And Accountability Series. Edited by A. Shah. Washington, DC: The World Bank.
Nasution, A. 2014. Monetary Policy Under Volatile Capital Inflows: The Case of Indonesia since 1997. Paper presented at the Shanghai Forum, Fudan University, Shanghai, 24–26 May.
———. 2015. Towards a Market-based Monetary Policy. In Macroeconomic Policies in Indonesia: Indonesia Economy since the Asian Financial Crisis of 1997, edited by A. Nasution. Oxford, United Kingdom and New York, NY: Routledge.
Qibthiyyah, R. M. 2008. Essays on Political and Fiscal Decentralization. Economics Dissertation. No. 8-22-2208, Department of Economics, Georgia State University. ScholarWorks@Georgia State University. August.
Rider, M. 2002. Expanding Regional Taxation in Indonesia. Mimeo. Jakarta: World Bank Office.
Rodden, J. A., G. S. Eskeland, and J. Litvak. 2000. Fiscal Decentralization and the Challenge of Hard Budget Constraints. Cambridge, MA: The MIT Press.
Suhendra, M., and H. Amir. 2006. Fiscal Decentralization in Indonesia: Current Status and Future Challenges. Jurnal Keuangan [Journal of Finance]. September.
Ter–Minassian, T. 1997. Fiscal Federalization in Theory and Practice. Washington, DC: International Monetary Fund.
22
ADBI Working Paper 601 A. Nasution
Watts, R. L. 1999. Comparing Federal Systems. Second edition. Kingston, ON, Canada: Institute of Intergovernmental Relations, Queen’s University.
Wihardja, M. M. 2015. Indonesia’s Democracy and Decentralization in the Post-1997 Era. In Macroeconomic Policies in Indonesia: Indonesia Economy since the Asian Financial Crisis of 1997, edited by A. Nasution. Oxford, United Kingdom and New York, NY: Routledge.
Woo, W. T., B. Glassburner, and A. Nasution. 1994. Macroeconomic Policies, Crises, and Long-Term Growth in Indonesia, 1965–90. World Bank Comparative Macroeconomic Studies. Washington, DC: The World Bank.
The World Bank, East Asia Poverty Reduction and Economic Management Unit. 2003. Decentralizing Indonesia. A Regional Public Expenditure Review. Overview Report. June. Washington, DC: The World Bank.
The World Bank. 2009. Poverty Reduction and Economic Management, Jakarta. Spending for Development in Papua, Social, Economic and Fiscal Trends. Presentation for the Tangguh Independent Advisory Panel (TIAP). April. Washington, DC: The World Bank.
Yoshitomi, M., and S. Shirai. 2001. Designing a Financial Market Structure in Post-Crisis Asia. ADBI Working Paper. 15. Tokyo: Asian Development Bank Institute.
23


